
Large-Depth Ground-Penetrating Radar for Investigating Active Faults: The Case of the 2017 Casamicciola Fault System, Ischia Island (Italy)

 ,
,  , and
, and 
Abstract
:1. Introduction

2. Survey and Data Analysis
3. Results
4. Conclusive Remarks
Author Contributions
Funding
Institutional Review Board Statement
Informed Consent Statement
Data Availability Statement
Acknowledgments
Conflicts of Interest
References
- Nappi, R.; Paoletti, V.; D’Antonio, D.; Soldovieri, F.; Capozzoli, L.; Ludeno, G.; Porfido, S.; Michetti, A.M. Joint Interpretation of Geophysical Results and Geological Observations for Detecting Buried Active Faults: The Case of the “Il Lago” Plain (Pettoranello del Molise, Italy). Remote Sens. 2021, 13, 1555. [Google Scholar] [CrossRef]
- Kopeikin, V.V.; Morozov, P.A.; Edemskiy, F.D.; Edemskiy, D.E.; Pavloskii, B.R.; Sungurov, Y.A. Experience of GPR Application in Oil-and-Gas Industry. In Proceedings of the 14th International Conference on Ground Penetrating Radar (GPR), Shanghai, China, 4–8 June 2012. [Google Scholar]
- Nappi, R.; Alessio, G.; Gaudiosi, G.; Nave, R.; Marotta, E.; Siniscalchi, V.; Civico, R.; Pizzimenti, L.; Peluso, R.; Belviso, P.; et al. The 21 August 2017 Md 4.0 Casamicciola Earthquake: First Evidence of Coseismic Normal Surface Faulting at the Ischia Volcanic Island. Seismol. Res. Lett. 2018, 89, 1323–1334. [Google Scholar] [CrossRef]
- Nappi, R.; Nave, R.; Gaudiosi, G.; Alessio, G.; Siniscalchi, V.; Marotta, E.; Civico, R.; Pizzimenti, L.; Peluso, R.; Belviso, P.; et al. 959 Coseismic Evidence of Surface Faulting at the Ischia Volcanic Island after the 21 August 2017 Md 4.0 Casamicciola Earthquake. PANGAEA 2020. [Google Scholar] [CrossRef]
- Nappi, R.; Porfido, S.; Paganini, E.; Vezzoli, L.; Ferrario, M.F.; Gaudiosi, G.; Alessio, G.; Michetti, A.M. The 2017, Md=4.0, Casamicciola earthquake: Esi-07 scale evaluation and implications for the source model. Geosciences 2021, 11, 44. [Google Scholar] [CrossRef]
- Alessio, G.; Ferranti, L.; Mastrolorenzo, G.; Porfido, S. Correlazione tra sismicita′ ed elementi strutturale nell’Isola d’Ischia. Ital. J. Quat. Sci. 1996, 9, 303–308. [Google Scholar]
- Cubellis, E.; Luongo, G. Il Terremoto del 28 luglio 1883 a Casamicciola nell’isola di Ischia. Il Contesto Fisico. In AA.VV. Presidenza Consiglio dei Ministri, Servizio Sismico Nazionale; Poligrafico e Zecca dello Stato: Roma, Italy, 1998; pp. 49–123. [Google Scholar]
- Cubellis, E.; Luongo, G. History of Ischian Earthquakes; Bibliopolis: Naples, Italy, 2018. [Google Scholar]
- De Natale, G.; Petrazzuoli, S.; Romanelli, F.; Troise, C.; Vaccari, F.; Somma, R.; Peresan, A.; Panza, G.F. Seismic risk mitigation at Ischia island (Naples, Southern Italy): An innovative approach to mitigate catastrophic scenarios. Eng. Geol. 2019, 261, 105285. [Google Scholar] [CrossRef]
- Vezzoli, L. Island of Ischia, in Quaderni de la Ricerca Scientifica; Vezzoli, L., Ed.; Consiglio Nazionale delle Ricerche: Roma, Italy, 1988; pp. 1–122. [Google Scholar]
- Tibaldi, A.; Vezzoli, L. The space problem of caldera resurgence; an example from Ischia Island, Italy. Geol. Rundsch. 1998, 87, 53–66. [Google Scholar] [CrossRef]
- GOSSIP Banca Dati Sismologica INGV, sezione di Napoli Osservatorio Vesuviano. Available online: https://terremoti.ov.ingv.it/gossip/ischia/2017/index.html (accessed on 4 July 2024).
- Selva, J.; Azzaro, R.; Taroni, M.; Tramelli, A.; Alessio, G.; Castellano, M.; Ciuccarelli, C.; Cubellis, E.; Lo Bascio, D.; Porfido, S.; et al. The Seismicity of Ischia Island, Italy: An Integrated Earthquake Catalogue From 8th Century BC to 946 2019 and Its Statistical Properties. Front. Earth Sci. 2021, 9, 629736. [Google Scholar] [CrossRef]
- Rittman, A. Geologie der Insel Ischia; Erganzung Band: Berlin, Germany, 1930; Volume 6, p. 268. [Google Scholar]
- Sbrana, A.; Marianelli, P.; Pasquini, G. Volcanology of Ischia (Italy). J. Maps 2018, 14, 494–503. [Google Scholar] [CrossRef]
- Braun, T.; Famiani, D.; Cesca, S. Seismological constraints on the source mechanism of the damaging seismic event of 21 August 2017 on Ischia Island (Southern Italy). Seismol. Res. Lett. 2018, 89, 1741–1749. [Google Scholar] [CrossRef]
- De Novellis, V.; Carlino, S.; Castaldo, R.; Tramelli, A.; De Luca, C.; Pino, N.A.; Pepe, S.; Convertito, V.; Zinno, I. The 21st of August 2017 Ischia (Italy) earthquake source model inferred from seismological, GPS and DInSAR measurements. Geophys. Res. Lett. 2018, 45, 2193–2202. [Google Scholar] [CrossRef]
- Devoti, R.; De Martino, P.; Pietrantonio, G.; Dolce, M. Coseismic displacements on Ischia Island, real-time GPS positioning constraints on earthquake source location. Ann. Geophys. 2018, 61, SE337. [Google Scholar] [CrossRef]
- Albano, M.; Saroli, M.; Montuori, A.; Bignami, C.; Tolomei, C.; Polcari, M.; Pezzo, G.; Moro, M.; Atzori, S.; Stramondo, S.; et al. 967 The Relationship between InSAR Coseismic Deformation and Earthquake-Induced Landslides Associated with the 2017 Mw 968 3.9 Ischia (Italy). Earthq. Geosci. 2018, 8, 303. [Google Scholar] [CrossRef]
- Montuori, A.; Albano, M.; Polcari, M.; Atzori, S.; Bignami, C.; Tolomei, C.; Salvi, S. Using Multi-Frequency InSAR Data to Constrain Ground Deformation of Ischia Earthquake. In Proceedings of the IGARSS 2018 IEEE International Geoscience and Remote Sensing Symposium, Valencia, Spain, 22–27 July 2018; pp. 541–544. [Google Scholar]
- Trasatti, E.; Acocella, V.; Di Vito, M.A.; Del Gaudio, C.; Weber, G.; Aquino, I.; Caliro, S.; Chiodini, G.; de Vita, S.; Ricco, C.; et al. Magma degassing as a source of long term seismicity at volcanoes: The Ischia island (Italy) case. Geophys. Res. Let. 2019, 46, 14421–14429. [Google Scholar] [CrossRef]
- Carlino, S.; Sbrana, A.; Pino, N.A.; Marianelli, P.; Pasquini, G.; De Martino, P.; De Novellis, V. The Volcano-Tectonics of the 975 Northern Sector of Ischia Island Caldera (Southern Italy): Resurgence, Subsidence and Earthquakes. Front. Earth Sci. 2022, 10, 976. [Google Scholar] [CrossRef]
- Capuano, P.; De Matteis, R.; Russo, G. The structural setting of the Ischia Island Caldera (Italy): First evidence from seismic and gravity data. Bull. Volcanol. 2015, 77, 79. [Google Scholar] [CrossRef]
- Paoletti, V.; Di Maio, R.; Cella, F.; Florio, G.; Motschka, K.; Roberti, N.; Secomandi, M.; Supper, R.; Fedi, M.; Rapolla, A. The Ischia volcanic island (southern Italy), Interferences from potential field. J. Volcanol. Geotherm. Res. 2009, 179, 69–86. [Google Scholar] [CrossRef]
- Paoletti, V.; D’Antonio, M.; Rapolla, A. The Structural Setting of the Ischia Island within the Neapolitan Volcanic Area: Inferences from Geophysics and Geochemistry. J. Volcanol. Geotherm. Res. 2013, 249, 155–173. [Google Scholar] [CrossRef]
- Paoletti, V.; Fedi, M.; Florio, G. The structure of the Ischia Volcanic Island from magnetic and gravity data. Ann. Geophys. 2017, 60, GM674. [Google Scholar] [CrossRef]
- Di Giuseppe, M.G.; Troiano, A.; Carlino, S. Magnetotelluric imaging of the resurgent caldera on the island of Ischia (southern Italy): Inferences for its structure and activity. Bull. Volcanol. 2017, 79, 85. [Google Scholar] [CrossRef]
- Di Napoli, R.; Martorana, R.; Orsi, G.; Aiuppa, A.; Camarda, M.; De Gregorio, S.; Gagliano Candela, E.; Luzio, D.; Messina, N.; Pecoraino, G.; et al. The structure of a hydrothermal system from an integrated geochemical, geophysical, and geological approach: The Ischia Island case study. Geochem. Geophys. Geosystems 2011, 12, Q07017. [Google Scholar] [CrossRef]
- Nardone, L.; Vassallo, M.; Cultrera, G.; Sapia, V.; Petrosino, S.; Pischiutta, M.; Di Vito, M.; de Vita, S.; Galluzzo, D.; Milana, G.; et al. A geophysical multidisciplinary approach to investigate the shallow subsoil structures in volcanic environment: The case of Ischia Island. J. Volcan. Geoth. Res. 2023, 438, 107820. [Google Scholar] [CrossRef]
- Ercoli, M.; Pauselli, C.; Frigeri, A.; Forte, E.; Federico, C. 3-D GPR data analysis for high-resolution imaging of shallow subsurface faults: The Mt Vettore case study (Central Apennines, Italy). Geophys. J. Int. 2014, 198, 609–621. [Google Scholar] [CrossRef]
- McClymont, A.F.; Green, A.G.; Villamor, P.; Horstmeyer, H.; Grass, C.; Nobes, D.C. Characterization of the shallow structures of active fault zones using 3-D ground-penetrating radar data. J. Geophys. Res. 2008, 113, B10315. [Google Scholar] [CrossRef]
- Di Maio, R.; Fais, S.; Ligas, P.; Piegari, E.; Raga, R.; Cossu, R. 3D geophysical imaging for site-specific characterization plan of an old landfill. Waste Manag. 2018, 76, 629–642. [Google Scholar] [CrossRef] [PubMed]
- De Donno, G.; Melegari, D.; Paoletti, V.; Piegari, E. Electrical and Electromagnetic Prospecting for the Characterization of Municipal Waste Landfills: A Review. In Technical Landfills and Waste Management; Anouzla, A., Souabi, S., Eds.; Springer Water: Cham, Switzerland, 2014. [Google Scholar] [CrossRef]
- Srigutomo, W.; Kagiyama, T.; Kanda, W.; Munekane, H.; Hashimoto, T.; Tanaka, Y.; Utada, H.; Utsugi, M. Resistivity structure of Unzen Volcano derived from time domain electromagnetic (TDEM) survey. J. Volc. Geoth. Res. 2008, 175, 231–240. [Google Scholar] [CrossRef]
- Trota, A.; Martinez-Moreno, F.J.; Monjardino, P.; Monteiro Santos, F.A.; Bernardo, I.; Raposo, P.; Ekstrom, M.; Goncalves, S.; Cabral, J. Investigating perched aquifers in volcanic terrains using TDEM geophysical exploration technique. In Proceedings of the 2019 International Conference in Engineering Applications (ICEA), Sao Miguel, Portugal, 8–11 July 2019; ISBN 978-1-7281-2962-4/192017. [Google Scholar]
- Amato, F.; Pace, F.; Vergnano, A.; Comina, C. TDEM prospections for inland groundwater exploration in semiarid climate, Island of Fogo, Cape Verde. J. Appl. Geophys. 2021, 184, 104242. [Google Scholar] [CrossRef]
- Reynolds, J.M. An Introduction to Applied and Environmental Geophysics. Preview 2011, 2011, 33–40. [Google Scholar] [CrossRef]
- Russell, J.K.; Stasiuk, M.V. Characterization of volcanic deposits with ground-penetrating radar. Bull. Volcanol. 1997, 58, 515–527. [Google Scholar] [CrossRef]
- Buzin, V.; Edemsky, D.; Gudoshnikov, S.; Kopeikin, V.; Morozov, P.; Popov, A.; Prokopovich, I.; Skomarovsky, V.; Melnik, N.; Berkut, A.; et al. Search for Chelyabinsk Meteorite Fragments in Chebarkul Lake Bottom (GPR and Magnetic Data). J. Telecommun. Inf. Technol. 2017, 3, 69–78. [Google Scholar] [CrossRef]
- Linford, N. The application of geophysical methods to archaeological prospection. Rep. Prog. Phys. 2006, 69, 2205. [Google Scholar] [CrossRef]
- Capozzoli, L.; De Martino, G.; Polemio, M.; Rizzo, E. Geophysical techniques for monitoring settlement phenomena occurring in reinforced concrete buildings. Surv. Geophys. 2020, 41, 575–604. [Google Scholar] [CrossRef]
- Mancini, M.; Chiara Caciolli, M.; Gaudiosi, I.; Andrea Alleanza, G.; Cavuoto, G.; Coltella, M.; Cosentino, G.; Di Fiore, V.; d’Onofrio, A.; Gargiulo, F.; et al. Seismic microzonation in a complex volcano-tectonic setting: The case of northern and western Ischia Island (southern Italy), Ital. J. Geosci. 2021, 140, 382–408. [Google Scholar] [CrossRef]
- Silva Fragoso, A.; Norini, G.; Nappi, R.; Groppelli, G.; Michetti, A.M. Improving the accuracy of DTMs using drone-based LiDAR for 2 morpho-structural analysis of active calderas: The case of Ischia 3 Island, Italy. Remote Sens 2024, 16, 1899. [Google Scholar] [CrossRef]


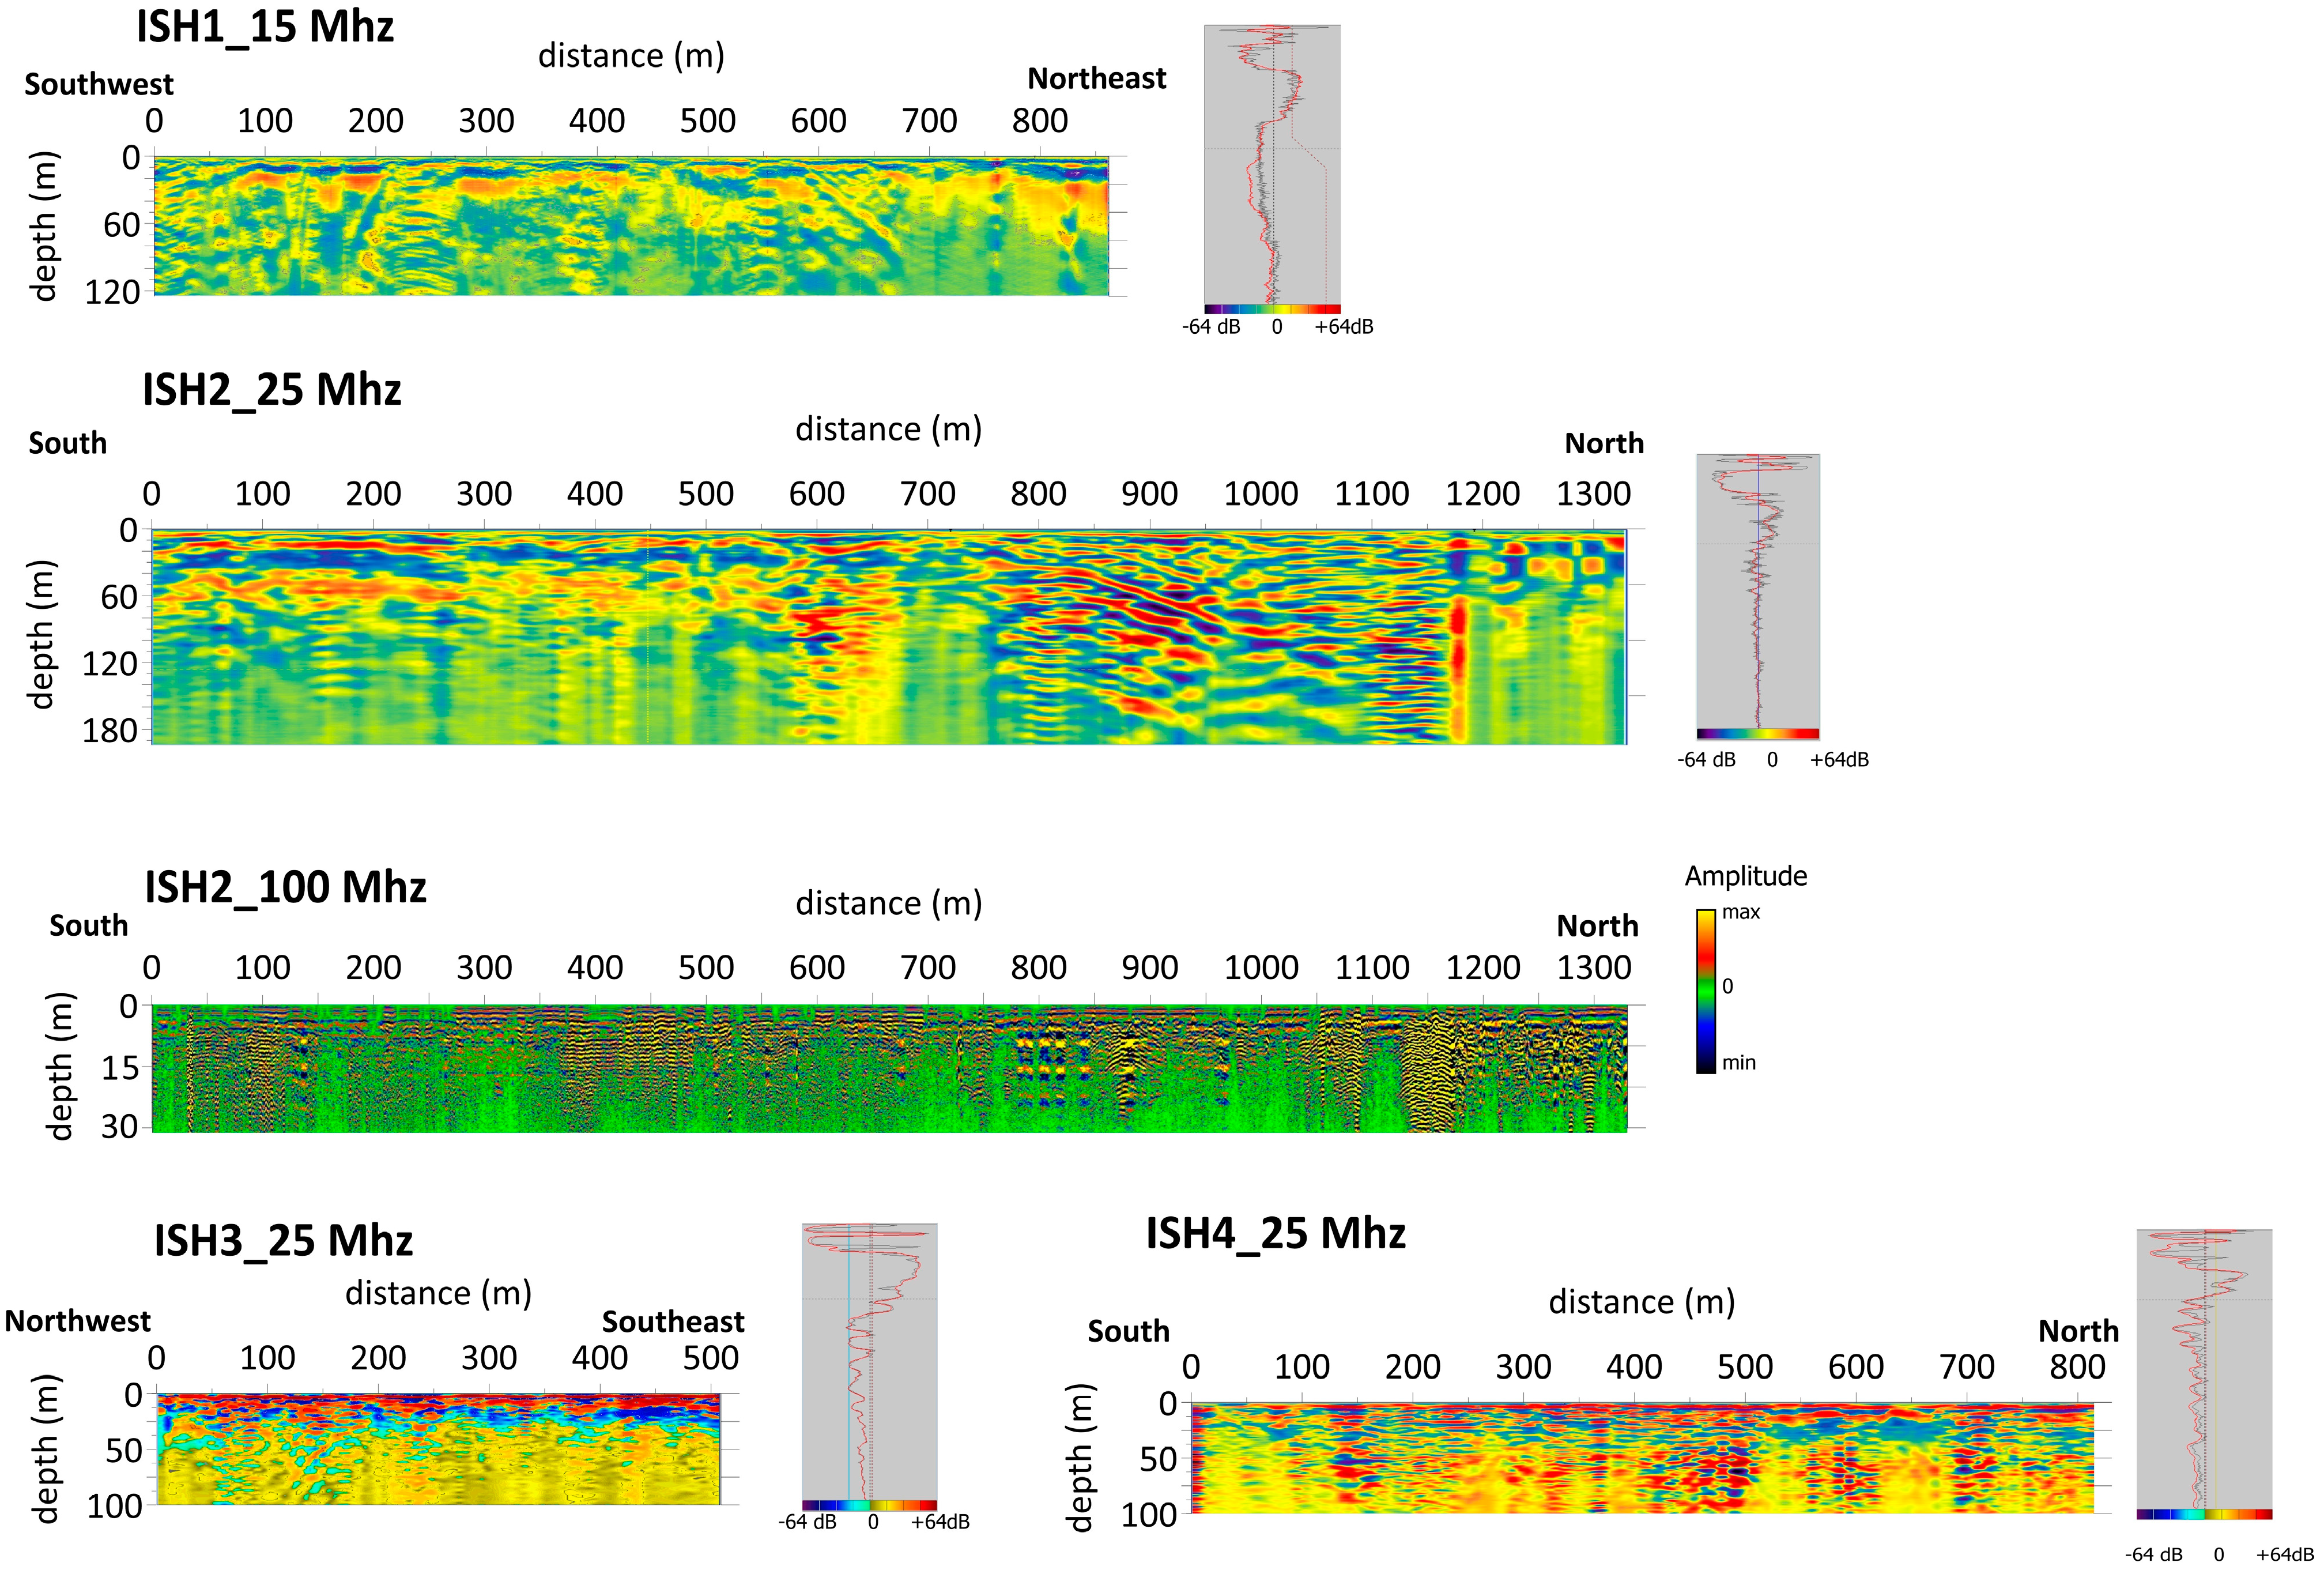
| ID Data | Length (m) | Spatial Step (m) | Frequency (MHz) | Dielectric Permittivity Average | Max. Estimated Depth of Signal (m) | Easting Start (UTM—m) | Northing Start (UTM—m) | Easting End (UTM—m) | Northing End (UTM—m) |
|---|---|---|---|---|---|---|---|---|---|
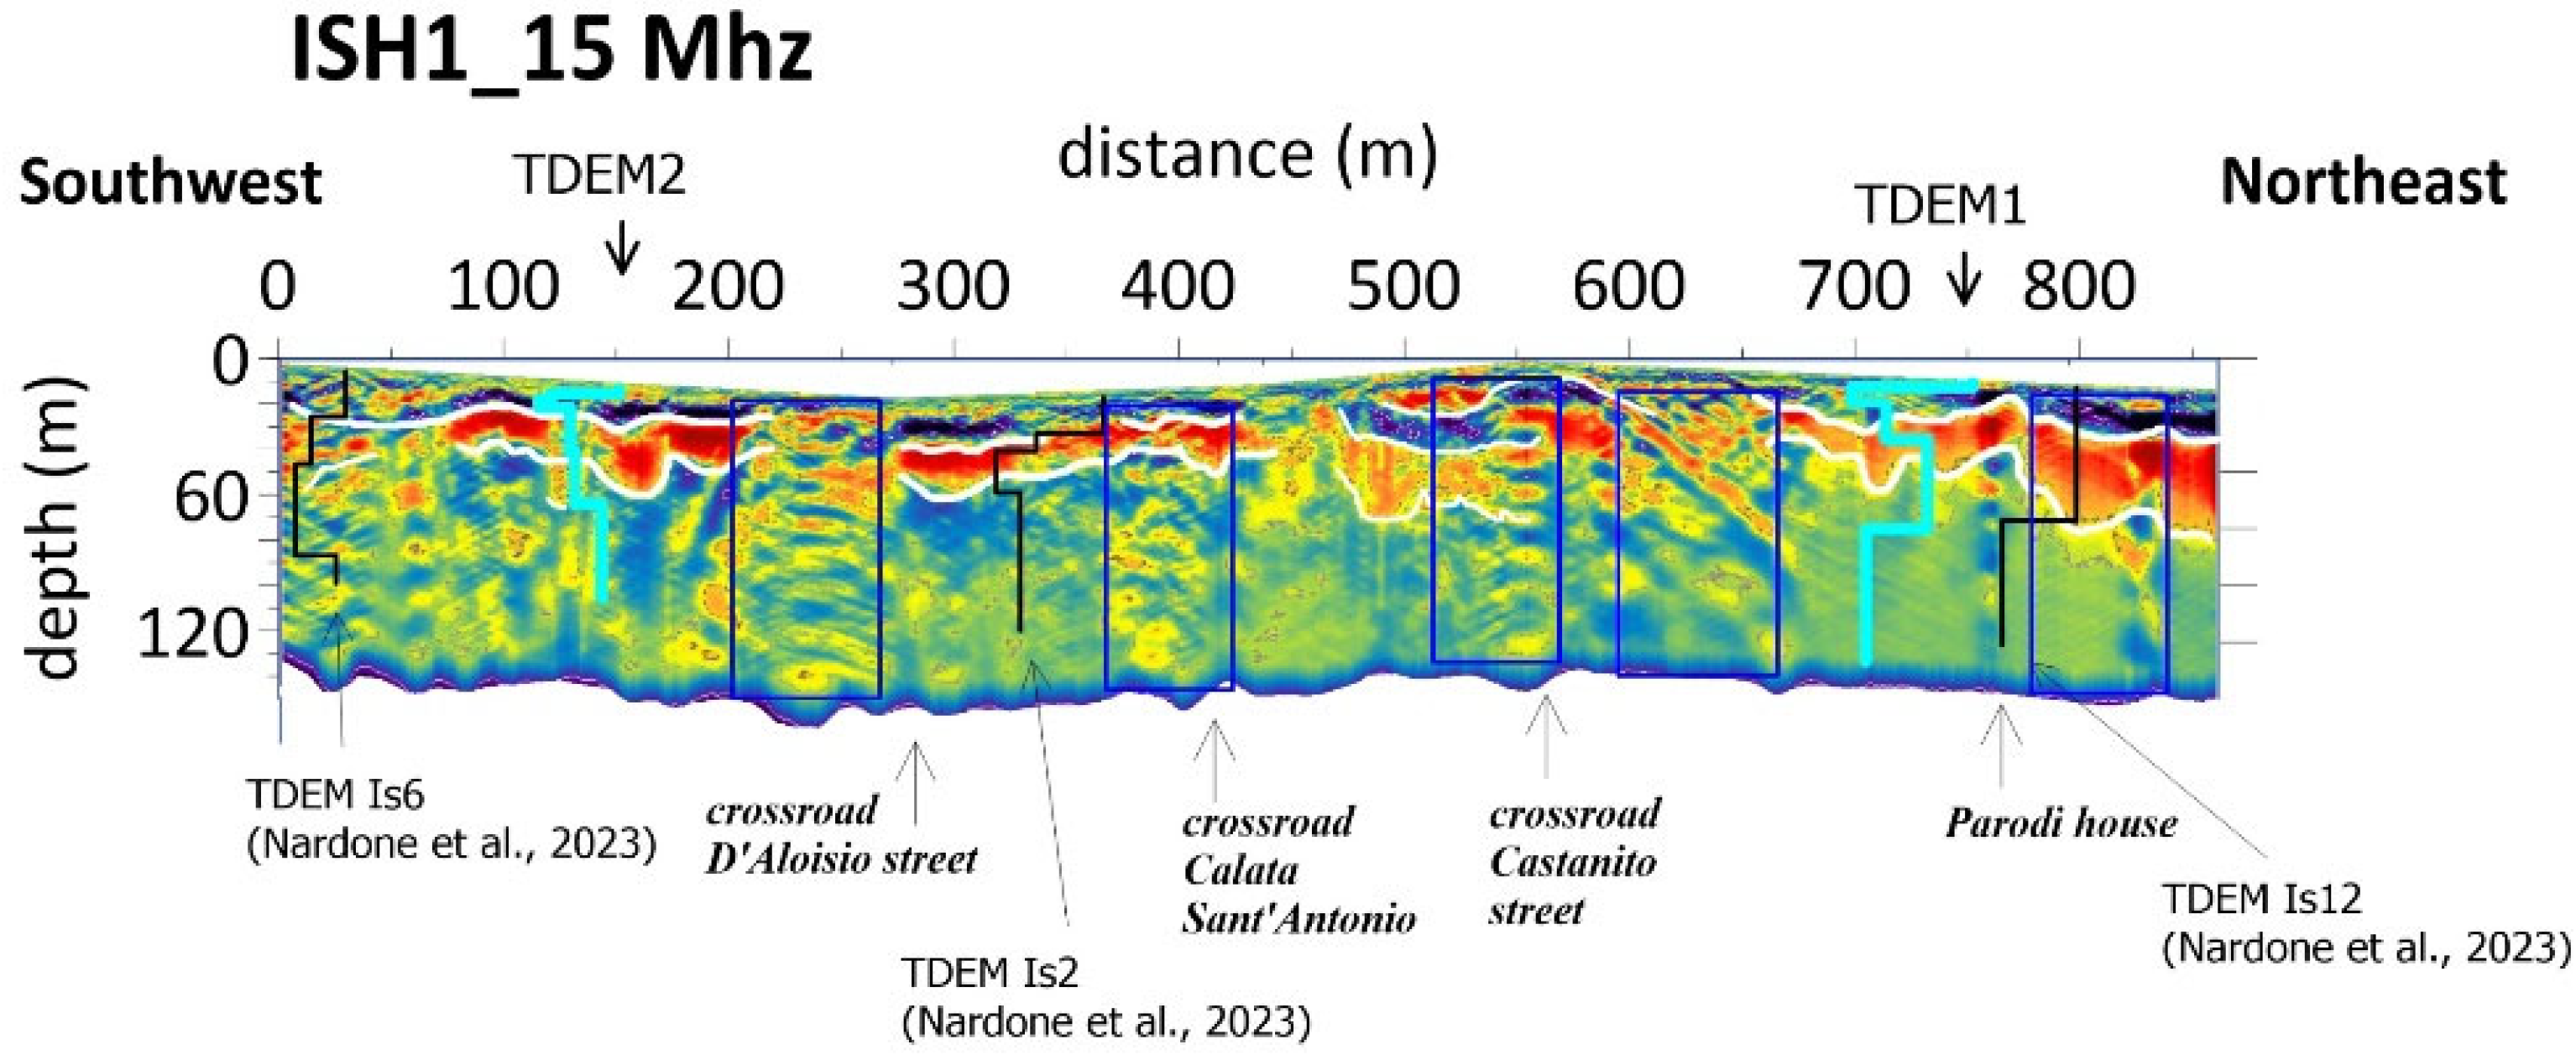
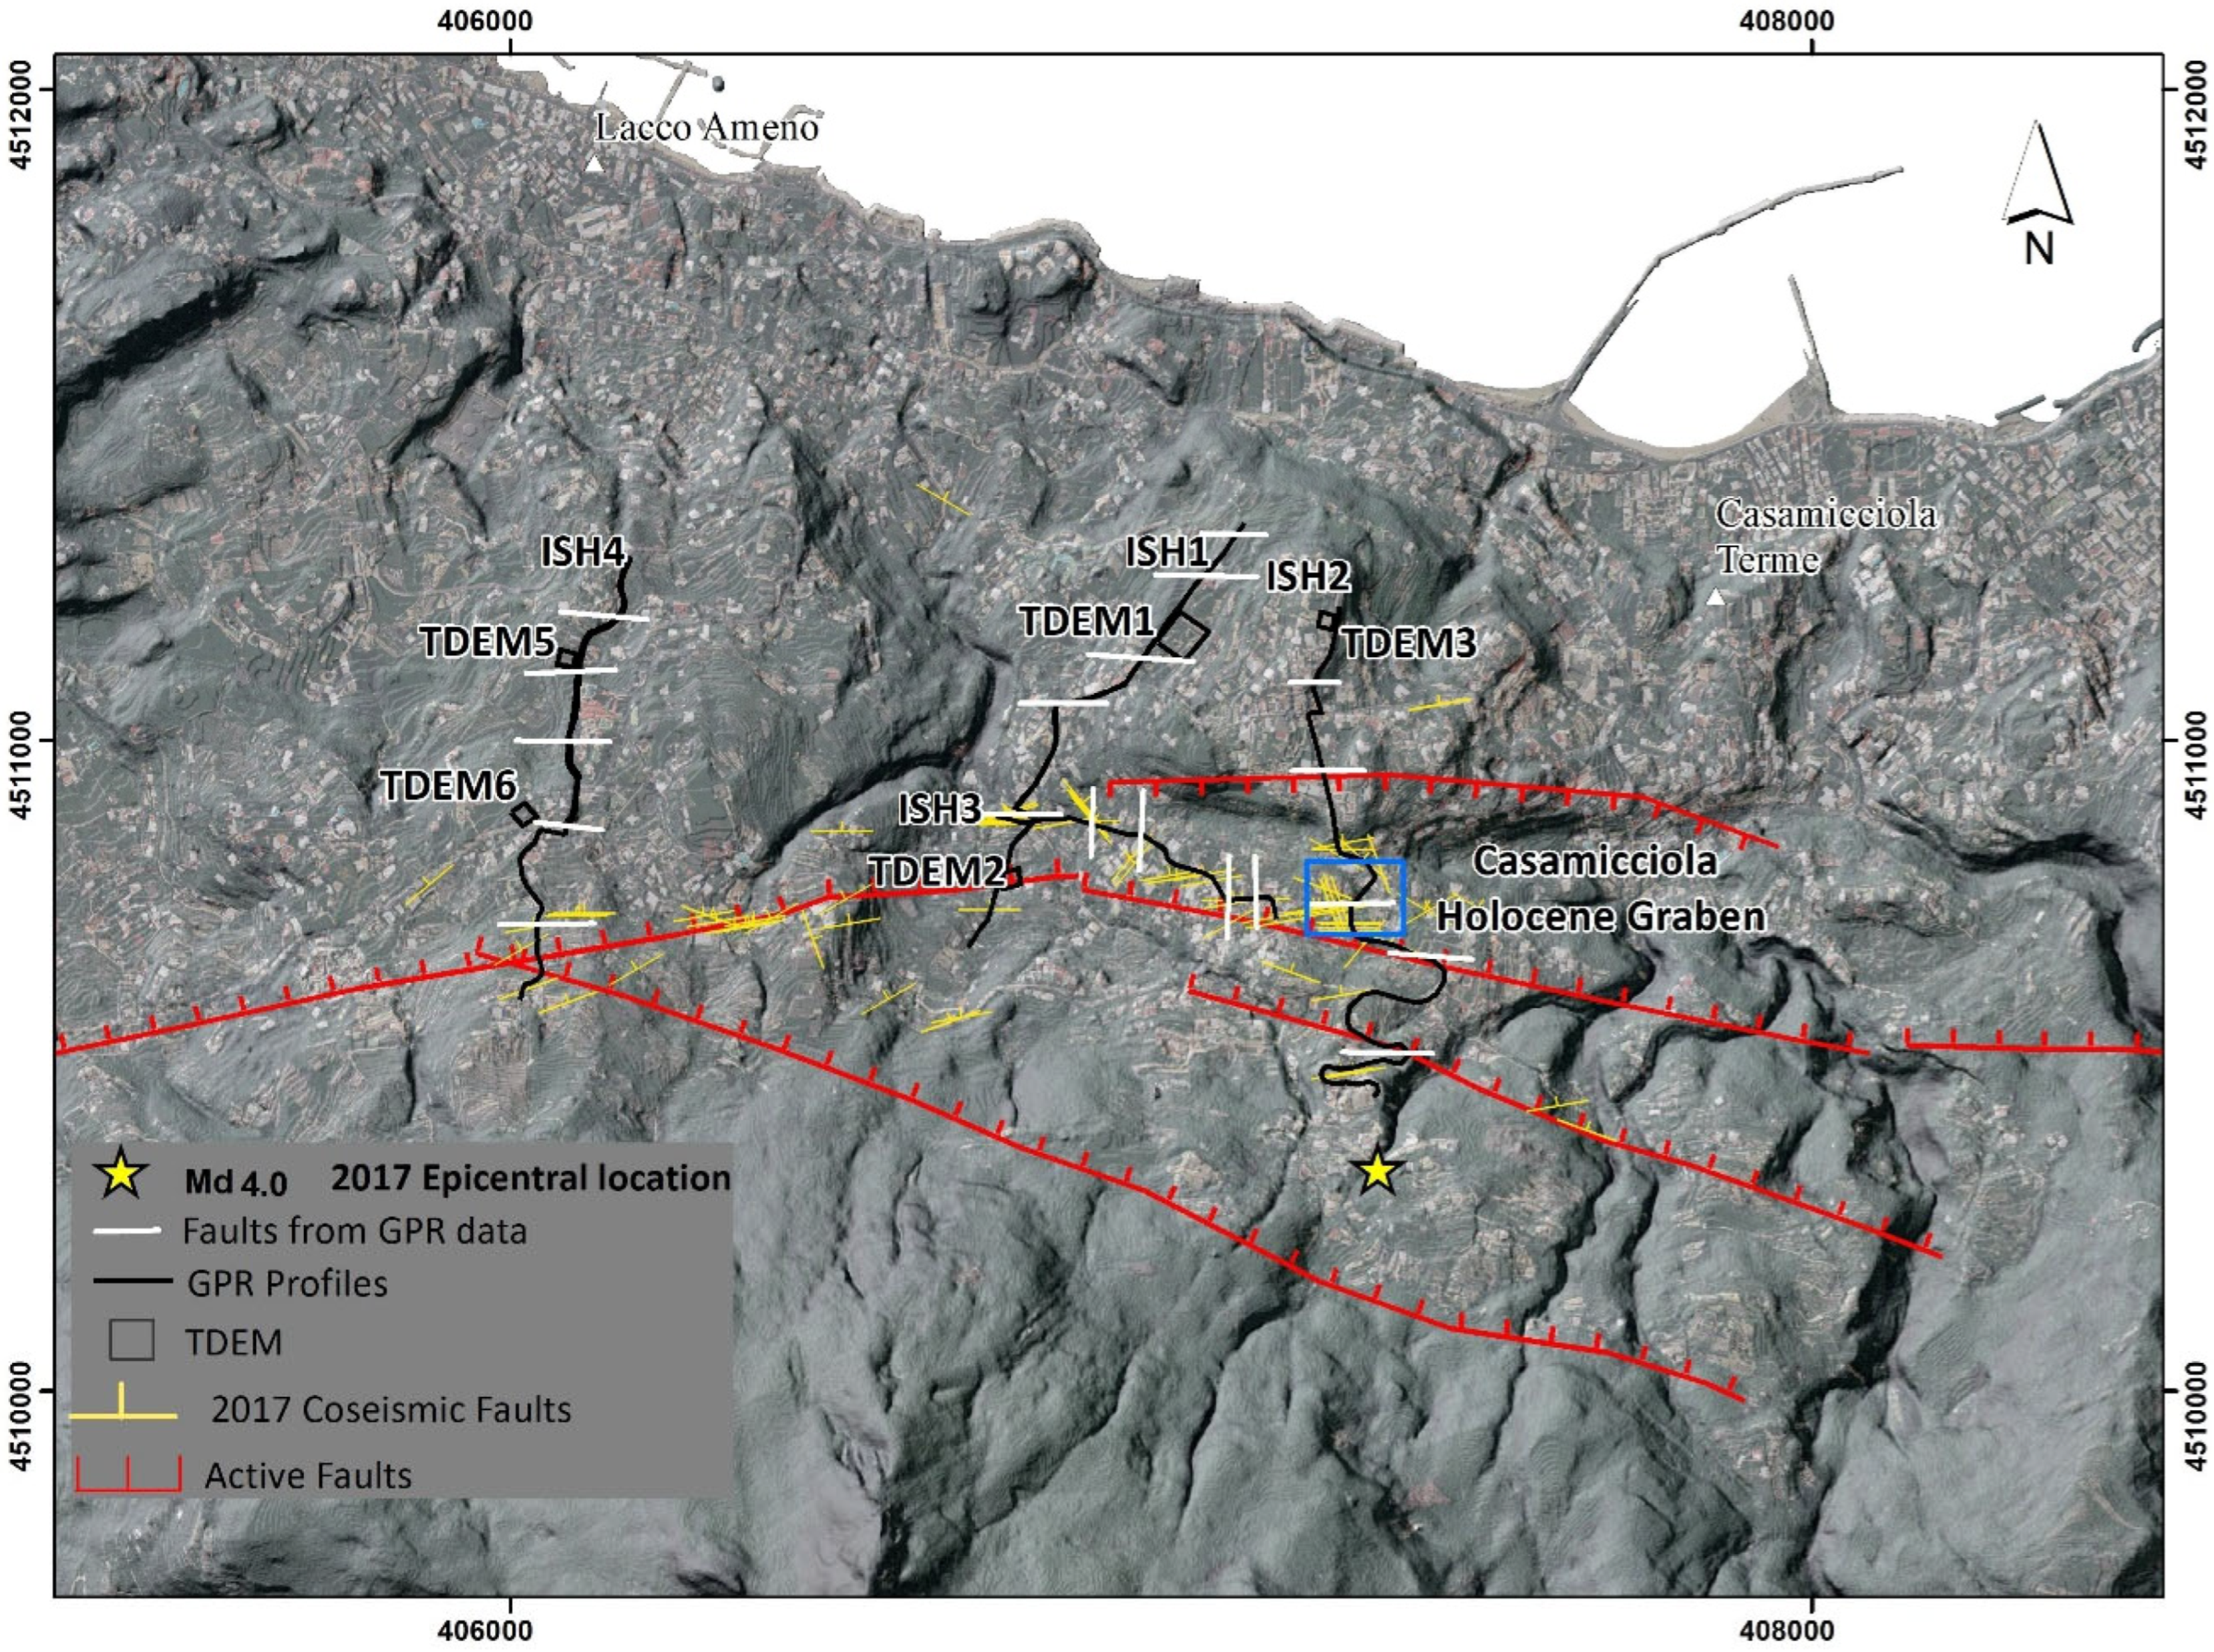
| ISH1 | 862 | 0.9 | 15 | 6 | 125 | 406,698 | 4,510,675 | 407,103 | 4,511,304 |
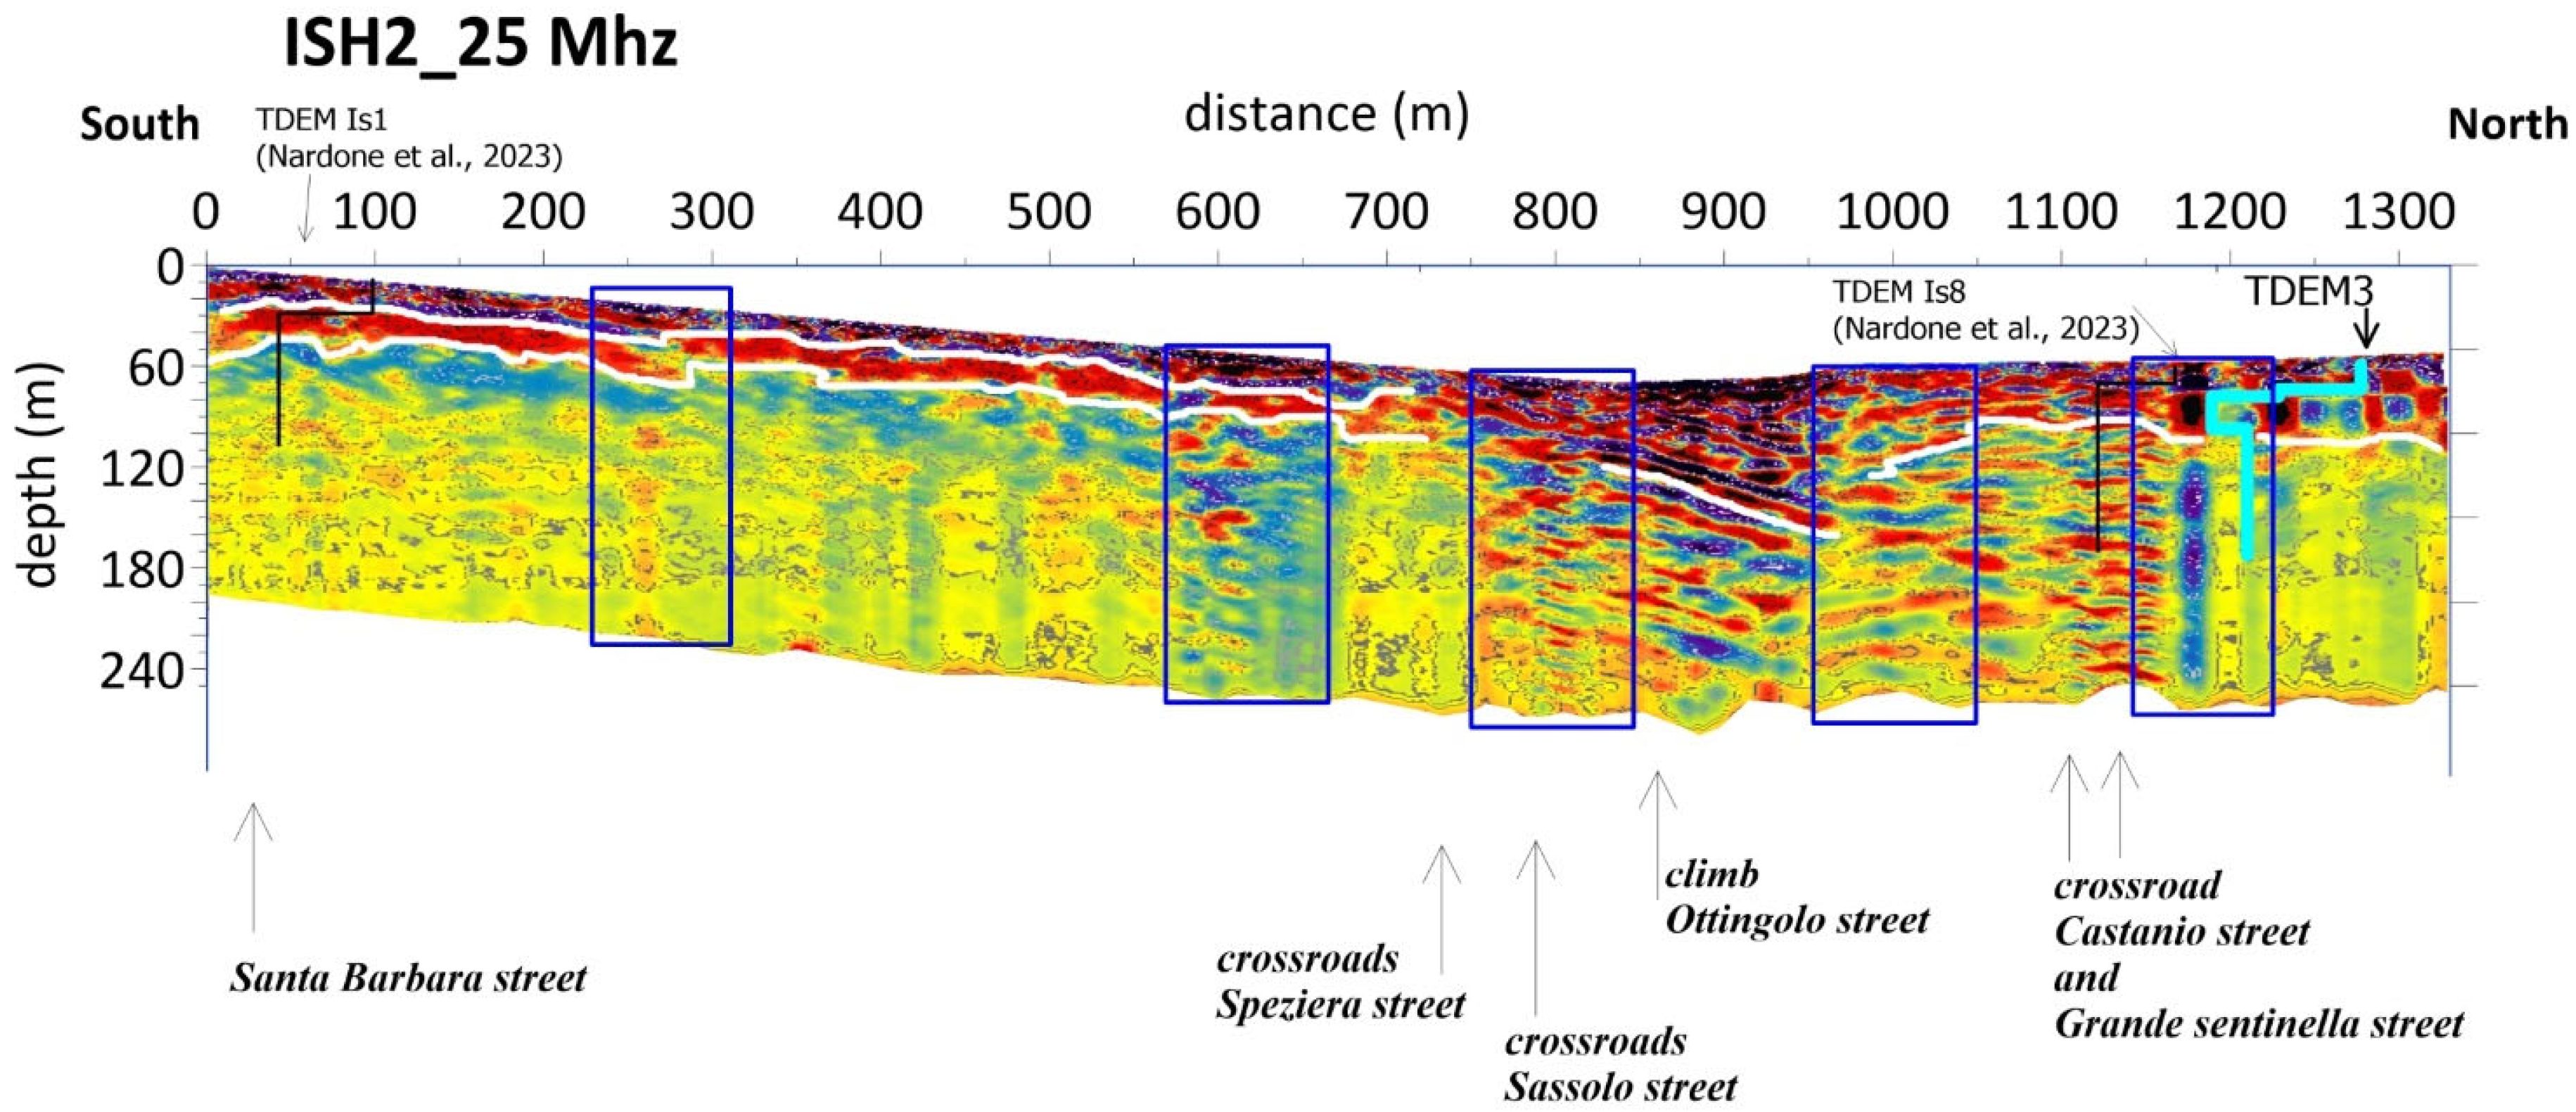
| ISH2 | 1330 | 1.5 | 100, 25 | 13, 5 | 190 | 407,324 | 4,510,451 | 407,273 | 4,511,211 |
| ISH3 | 509 | 0.9 | 25 | 5 | 95 | 407,177 | 4,510,726 | 406,757 | 4,510,879 |
| ISH4 | 814 | 0.8 | 25 | 5 | 180 | 406,015 | 4,510,572 | 406,182 | 4,511,279 |
Disclaimer/Publisher’s Note: The statements, opinions and data contained in all publications are solely those of the individual author(s) and contributor(s) and not of MDPI and/or the editor(s). MDPI and/or the editor(s) disclaim responsibility for any injury to people or property resulting from any ideas, methods, instructions or products referred to in the content. |
© 2024 by the authors. Licensee MDPI, Basel, Switzerland. This article is an open access article distributed under the terms and conditions of the Creative Commons Attribution (CC BY) license (https://creativecommons.org/licenses/by/4.0/).
Share and Cite
Paoletti, V.; D’Antonio, D.; De Natale, G.; Troise, C.; Nappi, R. Large-Depth Ground-Penetrating Radar for Investigating Active Faults: The Case of the 2017 Casamicciola Fault System, Ischia Island (Italy). Appl. Sci. 2024, 14, 6460. https://doi.org/10.3390/app14156460
Paoletti V, D’Antonio D, De Natale G, Troise C, Nappi R. Large-Depth Ground-Penetrating Radar for Investigating Active Faults: The Case of the 2017 Casamicciola Fault System, Ischia Island (Italy). Applied Sciences. 2024; 14(15):6460. https://doi.org/10.3390/app14156460
Chicago/Turabian StylePaoletti, Valeria, Donato D’Antonio, Giuseppe De Natale, Claudia Troise, and Rosa Nappi. 2024. "Large-Depth Ground-Penetrating Radar for Investigating Active Faults: The Case of the 2017 Casamicciola Fault System, Ischia Island (Italy)" Applied Sciences 14, no. 15: 6460. https://doi.org/10.3390/app14156460