Abstract
Crosswalks play a fundamental role in road safety. However, over time, many suffer wear and tear that makes them difficult to see. This project presents a solution based on the use of computer vision techniques for identifying and classifying the level of wear on crosswalks. The proposed system uses a convolutional neural network (CNN) to analyze images of crosswalks, determining their wear status. The design includes a prototype system mounted on a vehicle, equipped with cameras and processing units to collect and analyze data in real time as the vehicle traverses traffic routes. The collected data are then transmitted to a web application for further analysis and reporting. The prototype was validated through extensive tests in a real urban environment, comparing its assessments with manual inspections conducted by experts. Results from these tests showed that the system could accurately classify crosswalk wear with a high degree of accuracy, demonstrating its potential for aiding maintenance authorities in efficiently prioritizing interventions.
1. Introduction
Crosswalks play a crucial role in urban safety and mobility, providing a safe environment for pedestrians to cross public roads and contributing to the reduction in traffic accidents. In Portugal, between January and November of 2023, 33,721 road accidents were recorded, of which 13.01% resulted in pedestrians being run over [1]. Even more alarming is the fact that 11.1% of the victims of these accidents were fatalities. These 2023 statistics serve to highlight the vulnerability of pedestrians on urban roads and underline the urgent need for measures to ensure their safety.
As with other urban infrastructures, crosswalks are subject to several factors that can lead to their degradation over time. These include continuous exposure to natural elements and wear and tear caused by constant traffic. These crossings face challenges that compromise their functionality and safety. Given this scenario, it is crucial to explore technological solutions that help detect and classify the state of degradation of crosswalks. The utilization of computer vision techniques enables the development of systems that are capable of not only identifying the presence of crosswalks but also assessing their level of conservation. These systems facilitate the collection and provision of crucial information to the authorities responsible for maintaining this equipment. The continuous analysis of the state of these crossings, through these systems, can play a crucial role in improving urban infrastructure, contributing to safety and quality of life in cities.
The principal objective of this project is to develop a prototype capable of detecting and classifying the deterioration of crosswalks. This prototype will generate data that can be accessed via a web platform designed for relevant authorities, thereby enabling them to ascertain the condition of various crosswalks and their respective states of disrepair.
This paper is organized into five sections. Section 1 presents the context of this work and its objectives. Section 2 presents the computer vision techniques used to classify the state of degradation of pedestrian crossings. Two different approaches are considered, and the results obtained by each are evaluated. Section 3 presents the construction details of a functional prototype to detect and classify the state of degradation of pedestrian crossings. Section 4 presents the validation tests of the proposed prototype. Finally, Section 5 concludes this work and identifies potential future research developments.
2. Classification of the State of Degradation of Pedestrian Crossings with Computer Vision Techniques
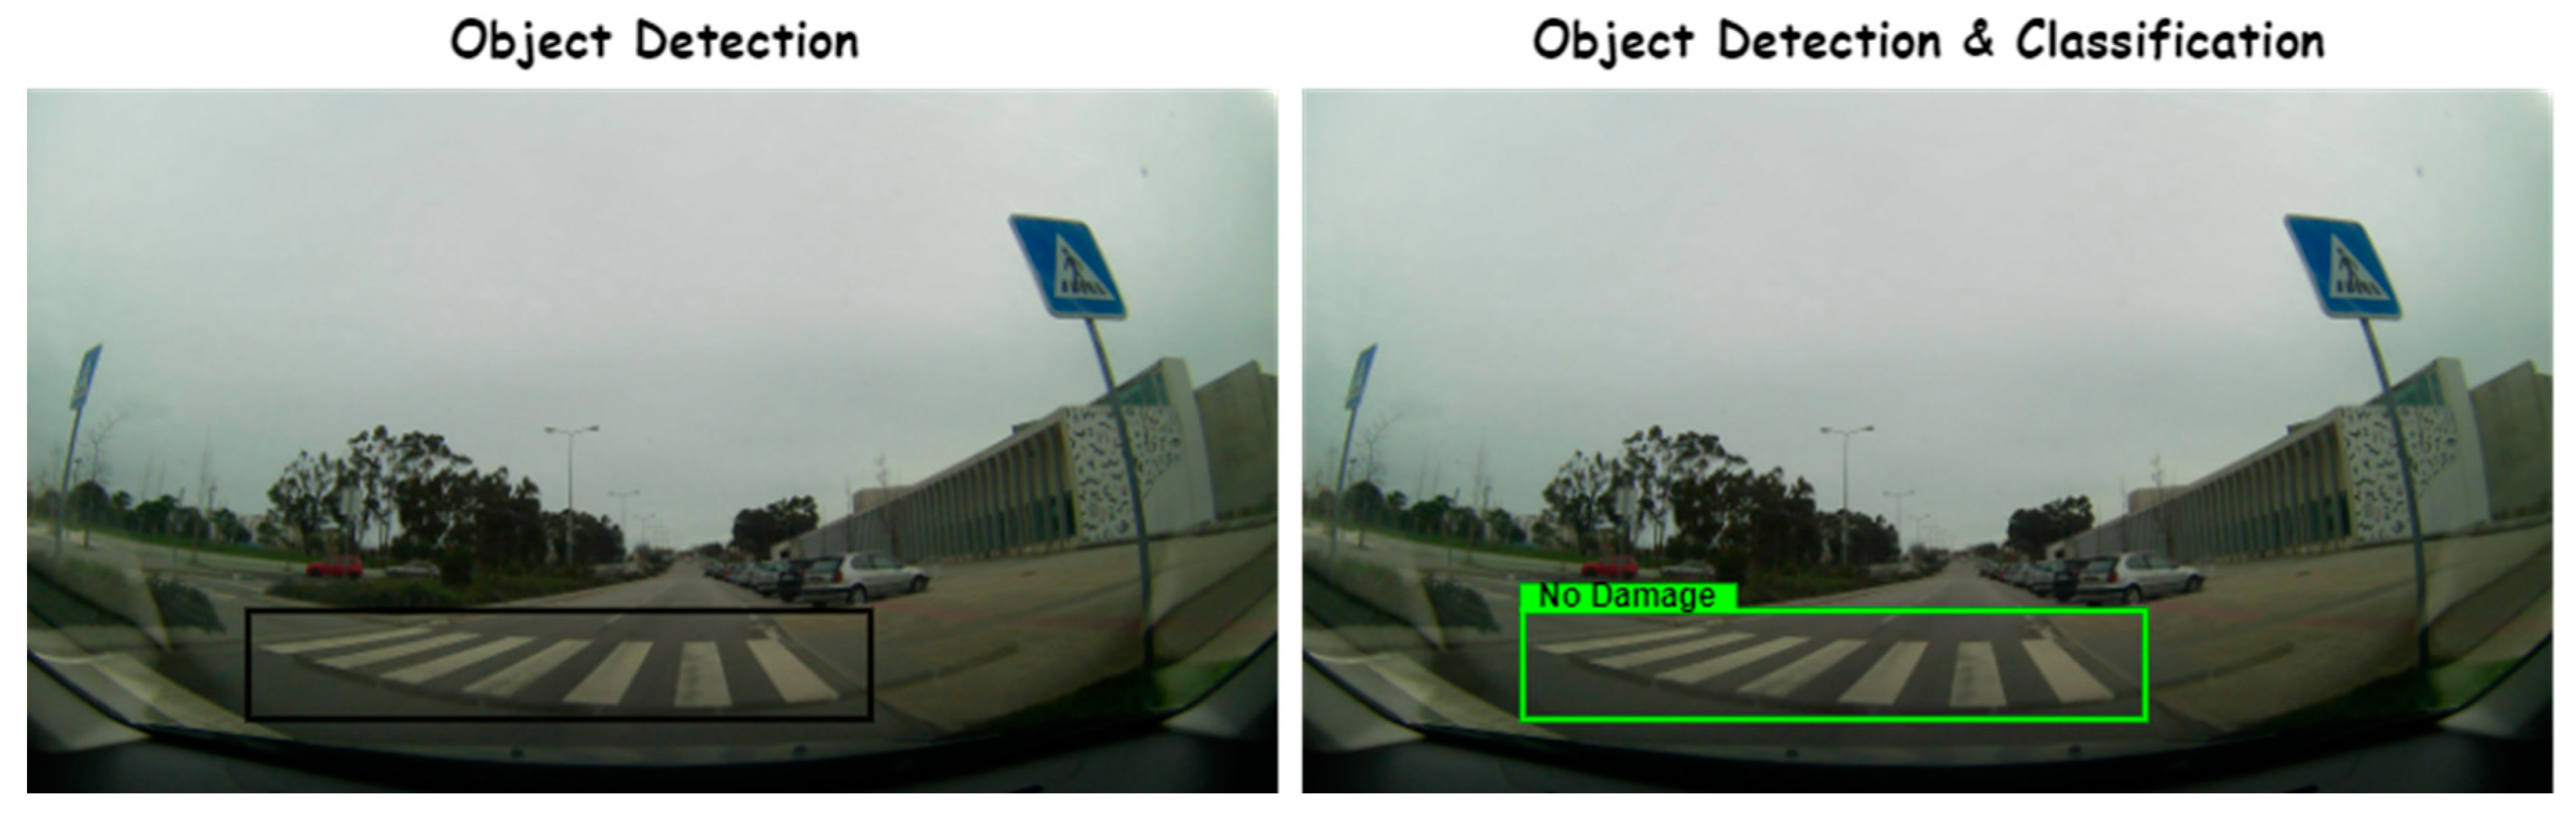
To achieve the main objective of the proposed work, the system developed should be able to detect and classify the state of degradation of crosswalks based on computer vision techniques. Computer vision is a field of study that focuses on the ability of computing machines to interpret images, videos, and other visual data. This information is used for a variety of purposes, including object detection and classification. Detection is related to identifying the location of the object, while classification is related to assigning a class to this object [2]. These concepts are illustrated in Figure 1.
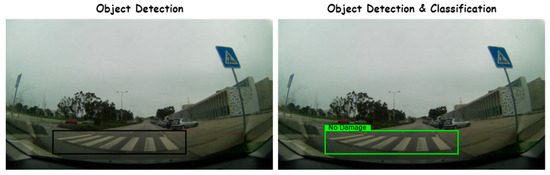
Figure 1.
Illustration of the concepts of detection and classification.
Cameras are typically the primary source of data for this purpose. It is therefore crucial to have a large data set to ensure accurate detection of the desired object. In addition, the implementation of algorithms is essential to allow the model to learn autonomously, without human intervention. This technology has applications in various fields, including machine learning [3] and deep learning [4]. These areas instruct computers to think like the human brain, enabling them to recognize complex patterns in images, texts, sounds, and other forms of data [5]. These patterns can be identified using convolutional neural networks (CNNs), which are a set of interconnected layers. The main purpose of these layers is to simulate the neurons of a human being. Figure 2 depicts the architectural framework of a convolutional neural network (CNN), which receives an image containing an object as input and returns one or more classes to classify the object’s category.
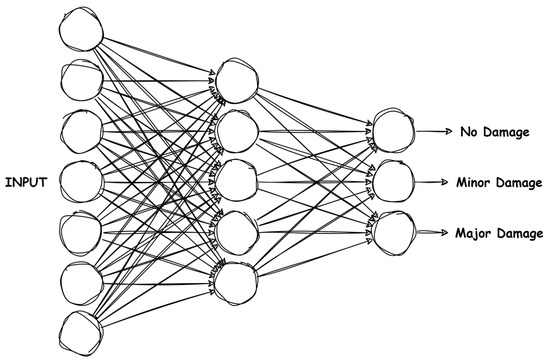
Figure 2.
Illustration of the architecture of a CNN.
This section will present, discuss, and analyze the computer vision techniques used to achieve the proposed objective of detecting and classifying the state of degradation of crosswalks. Firstly, the Adaptive Threshold technique and its application for classifying the state of degradation of crosswalks will be presented. The limitations of this technique and the configurations required for its application will be discussed. This approach, although initially showing promising results, has revealed some limitations under certain conditions. To improve these limitations, the following section presents a second approach utilizing the YOLOv4-tiny model, with an enhanced and modified dataset, for a more effective classification of crosswalk wear levels. Finally, a comparative performance analysis of the two approaches is conducted, describing the benchmark scenario and the metrics used to evaluate the results obtained.
2.1. Adaptive Threshold Classification
Adaptive Thresholding [6] is a technique employed in image processing to distinguish between the foreground and background of an image. To achieve this, a threshold value is selected, whereby all pixels with an intensity above this threshold are considered to belong to one class, which is represented by the color white. In contrast, pixels with an intensity below the threshold are categorized in another class, which is often represented by the color black.
In contrast to the application of a single threshold value to the entire image in global thresholding, adaptive thresholding employs the calculation of specific threshold values for different regions of the image. In this method, the threshold value for each pixel is determined based on the characteristics of its neighborhood.
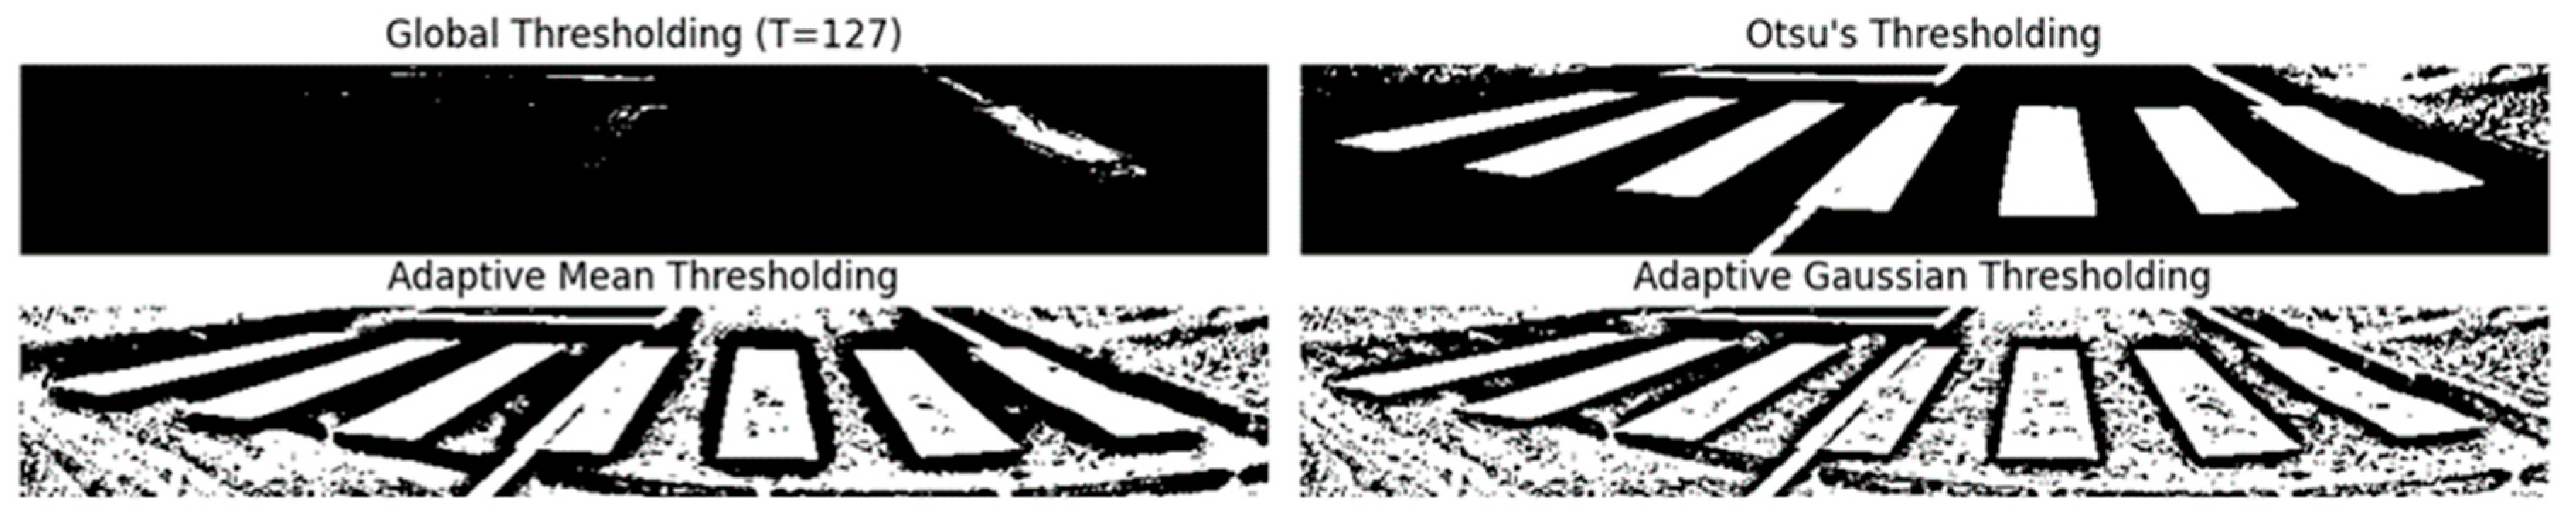
Several different types of thresholding are employed in image processing, as illustrated in Figure 3.
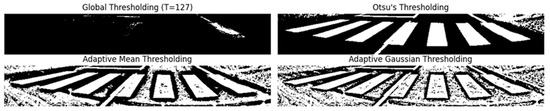
Figure 3.
Comparison of threshold methods.
- Global Thresholding: This applies a single threshold value to the entire image.
- Otsu’s Thresholding: This automatically determines the optimal threshold value based on the image histogram.
- Adaptive Mean Thresholding: This calculates a threshold value for each region of the image based on the average of the intensity values of the pixels in that region.
- Adaptive Gaussian Thresholding: This is like Adaptive Mean Thresholding but calculates the threshold value using a weighted average based on the Gaussian distribution.
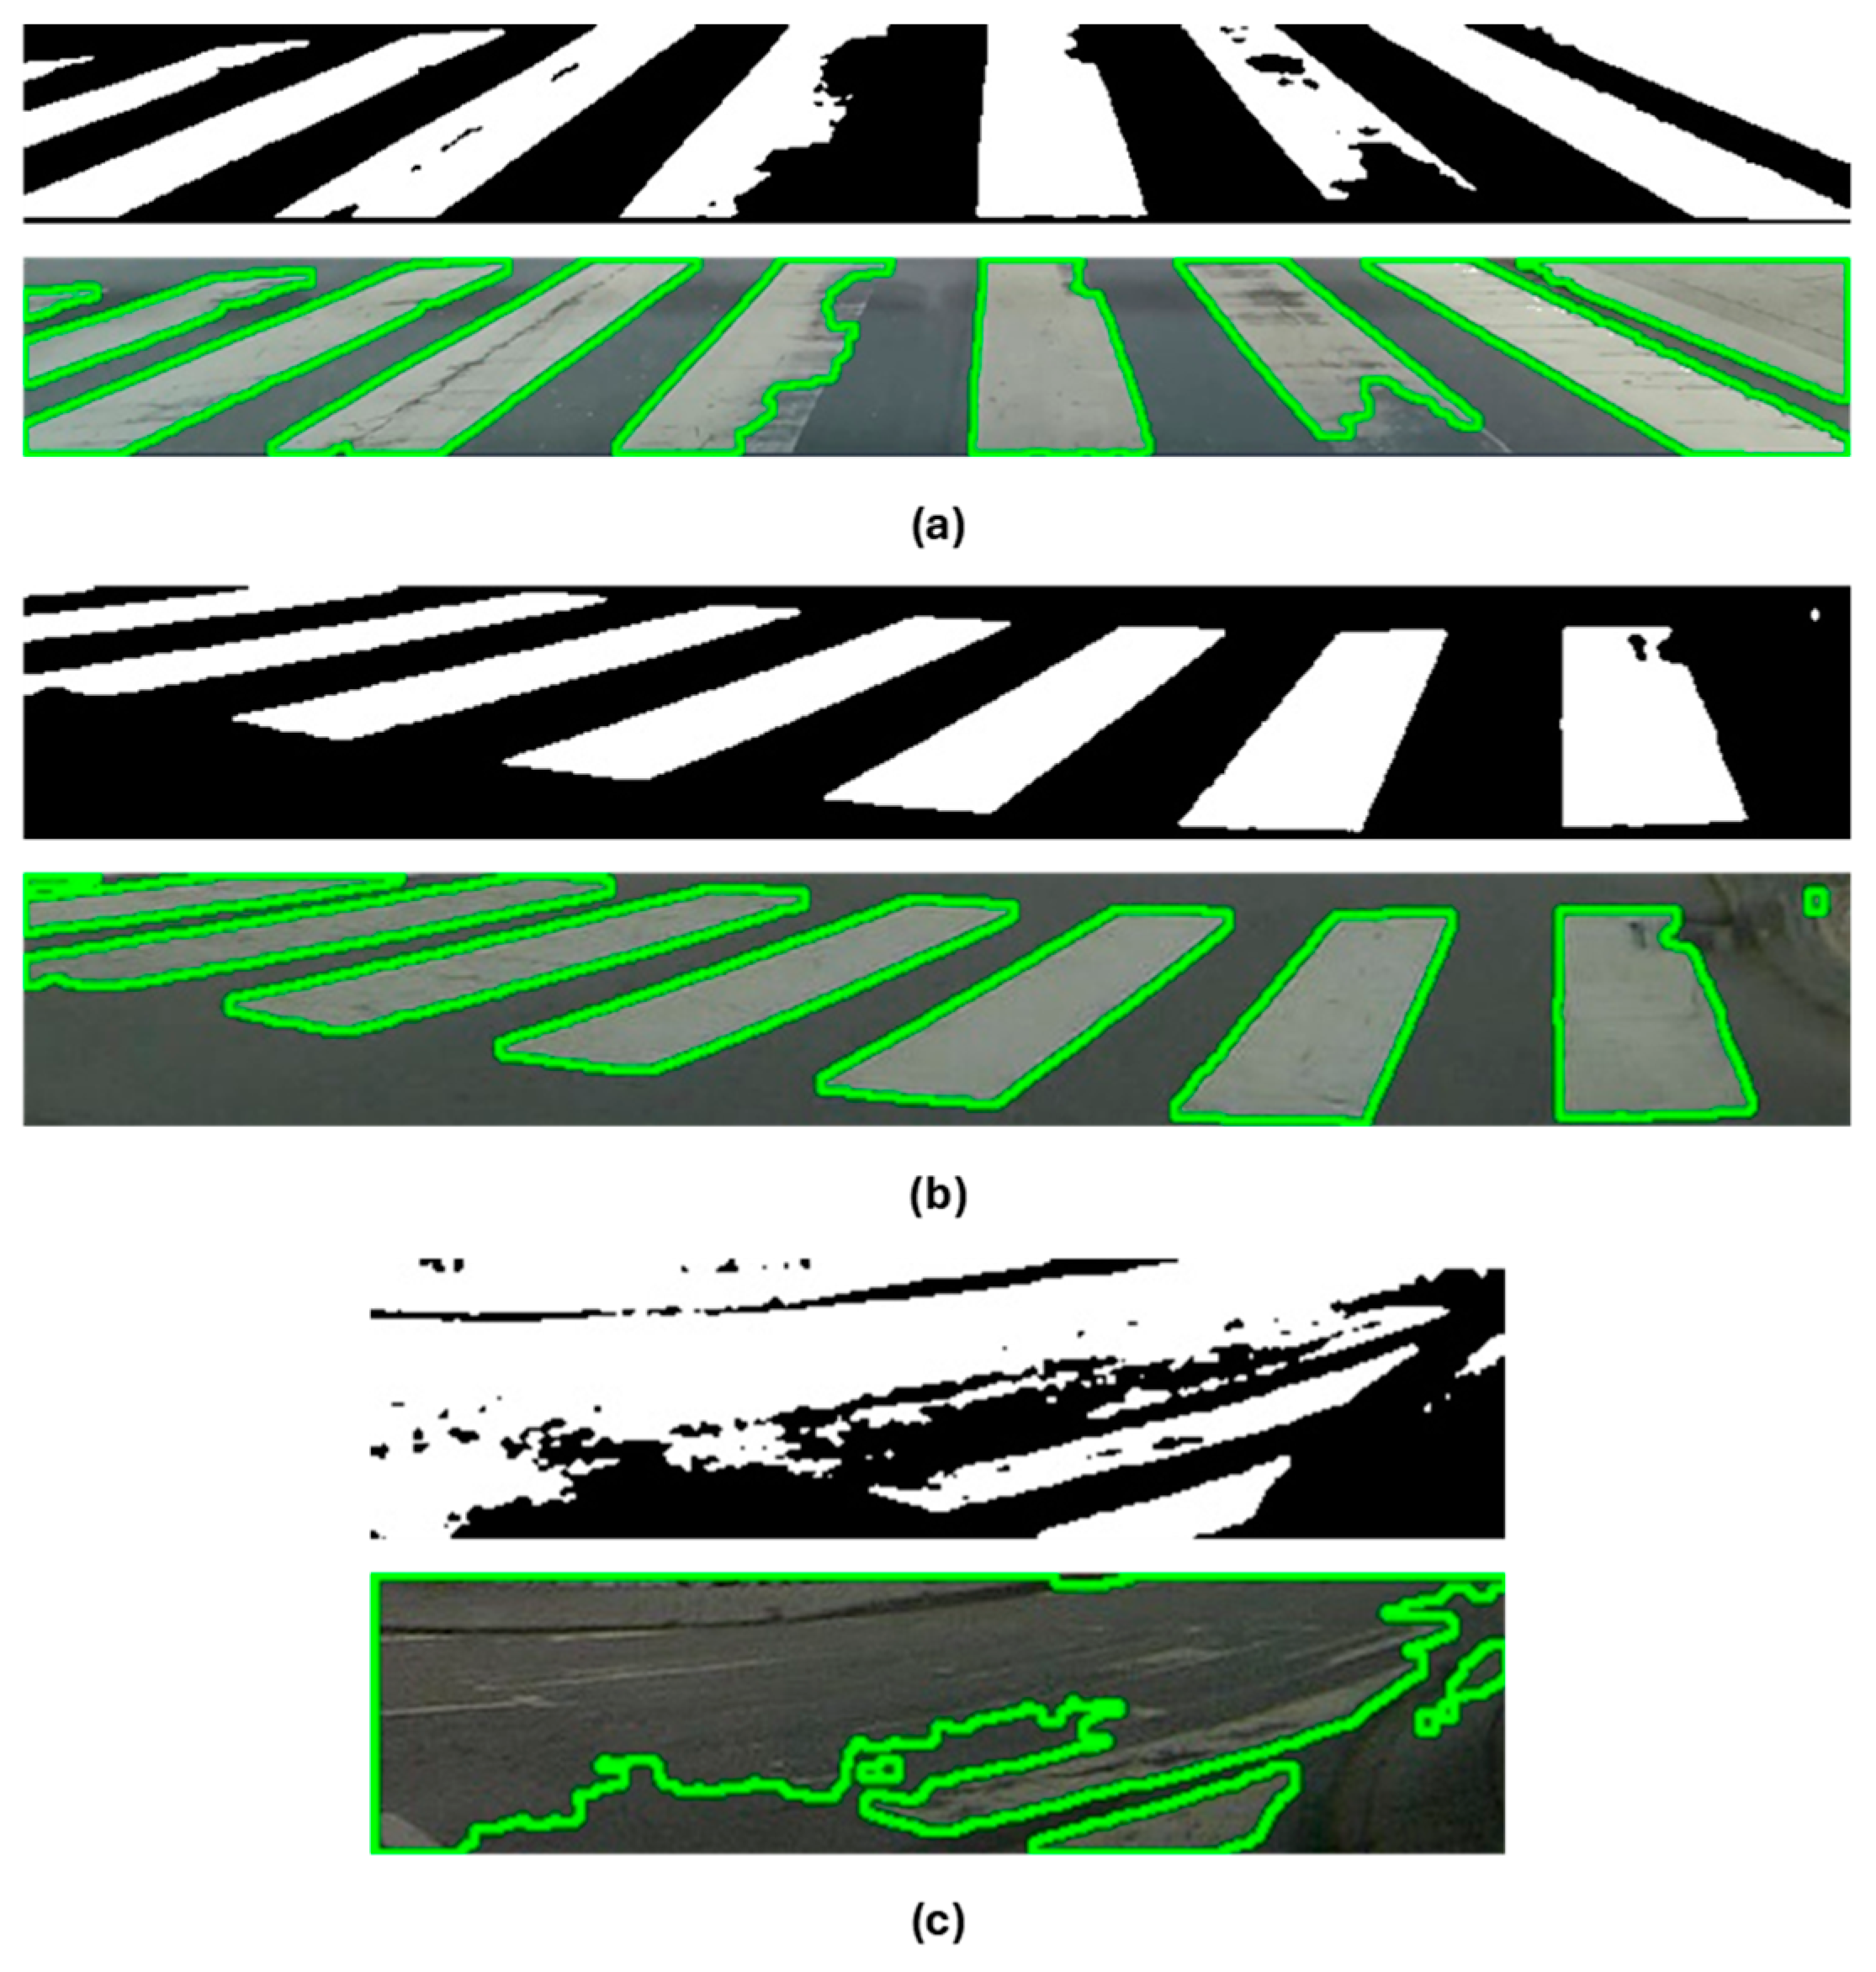
The potential for combining different thresholding methods can assist in the detection of wear and tear on crosswalks. This approach is particularly beneficial in environments where lighting conditions are variable. By leveraging the strengths of each technique, it is possible to obtain more reliable and accurate results in identifying worn areas of crosswalks, which is a crucial objective of this project. Figure 4 illustrates some examples of the application of Adaptive Thresholding in identifying wear and tear on crosswalks. Figure 4a illustrates the outcome of applying the method to a crosswalk exhibiting signs of wear. Figure 4b depicts the result obtained for a crosswalk devoid of such indications, while Figure 4c displays the outcome for a crosswalk exhibiting a considerable degree of wear. As can be observed, this technique yields highly satisfactory results in fulfilling the intended purpose.
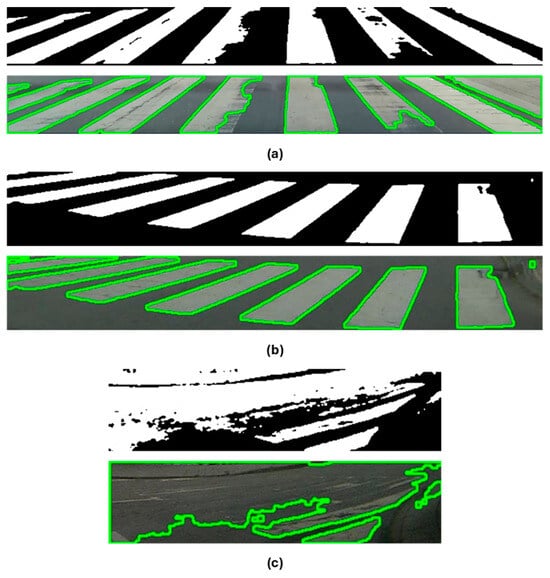
Figure 4.
Use of Adaptive Threshold to determine degradation status: (a) Outcome for a crosswalk exhibiting signs of wear; (b) Outcome for a crosswalk without signs of wear; (c) Outcome for a crosswalk exhibiting a considerable degree of wear.
Threshold Values
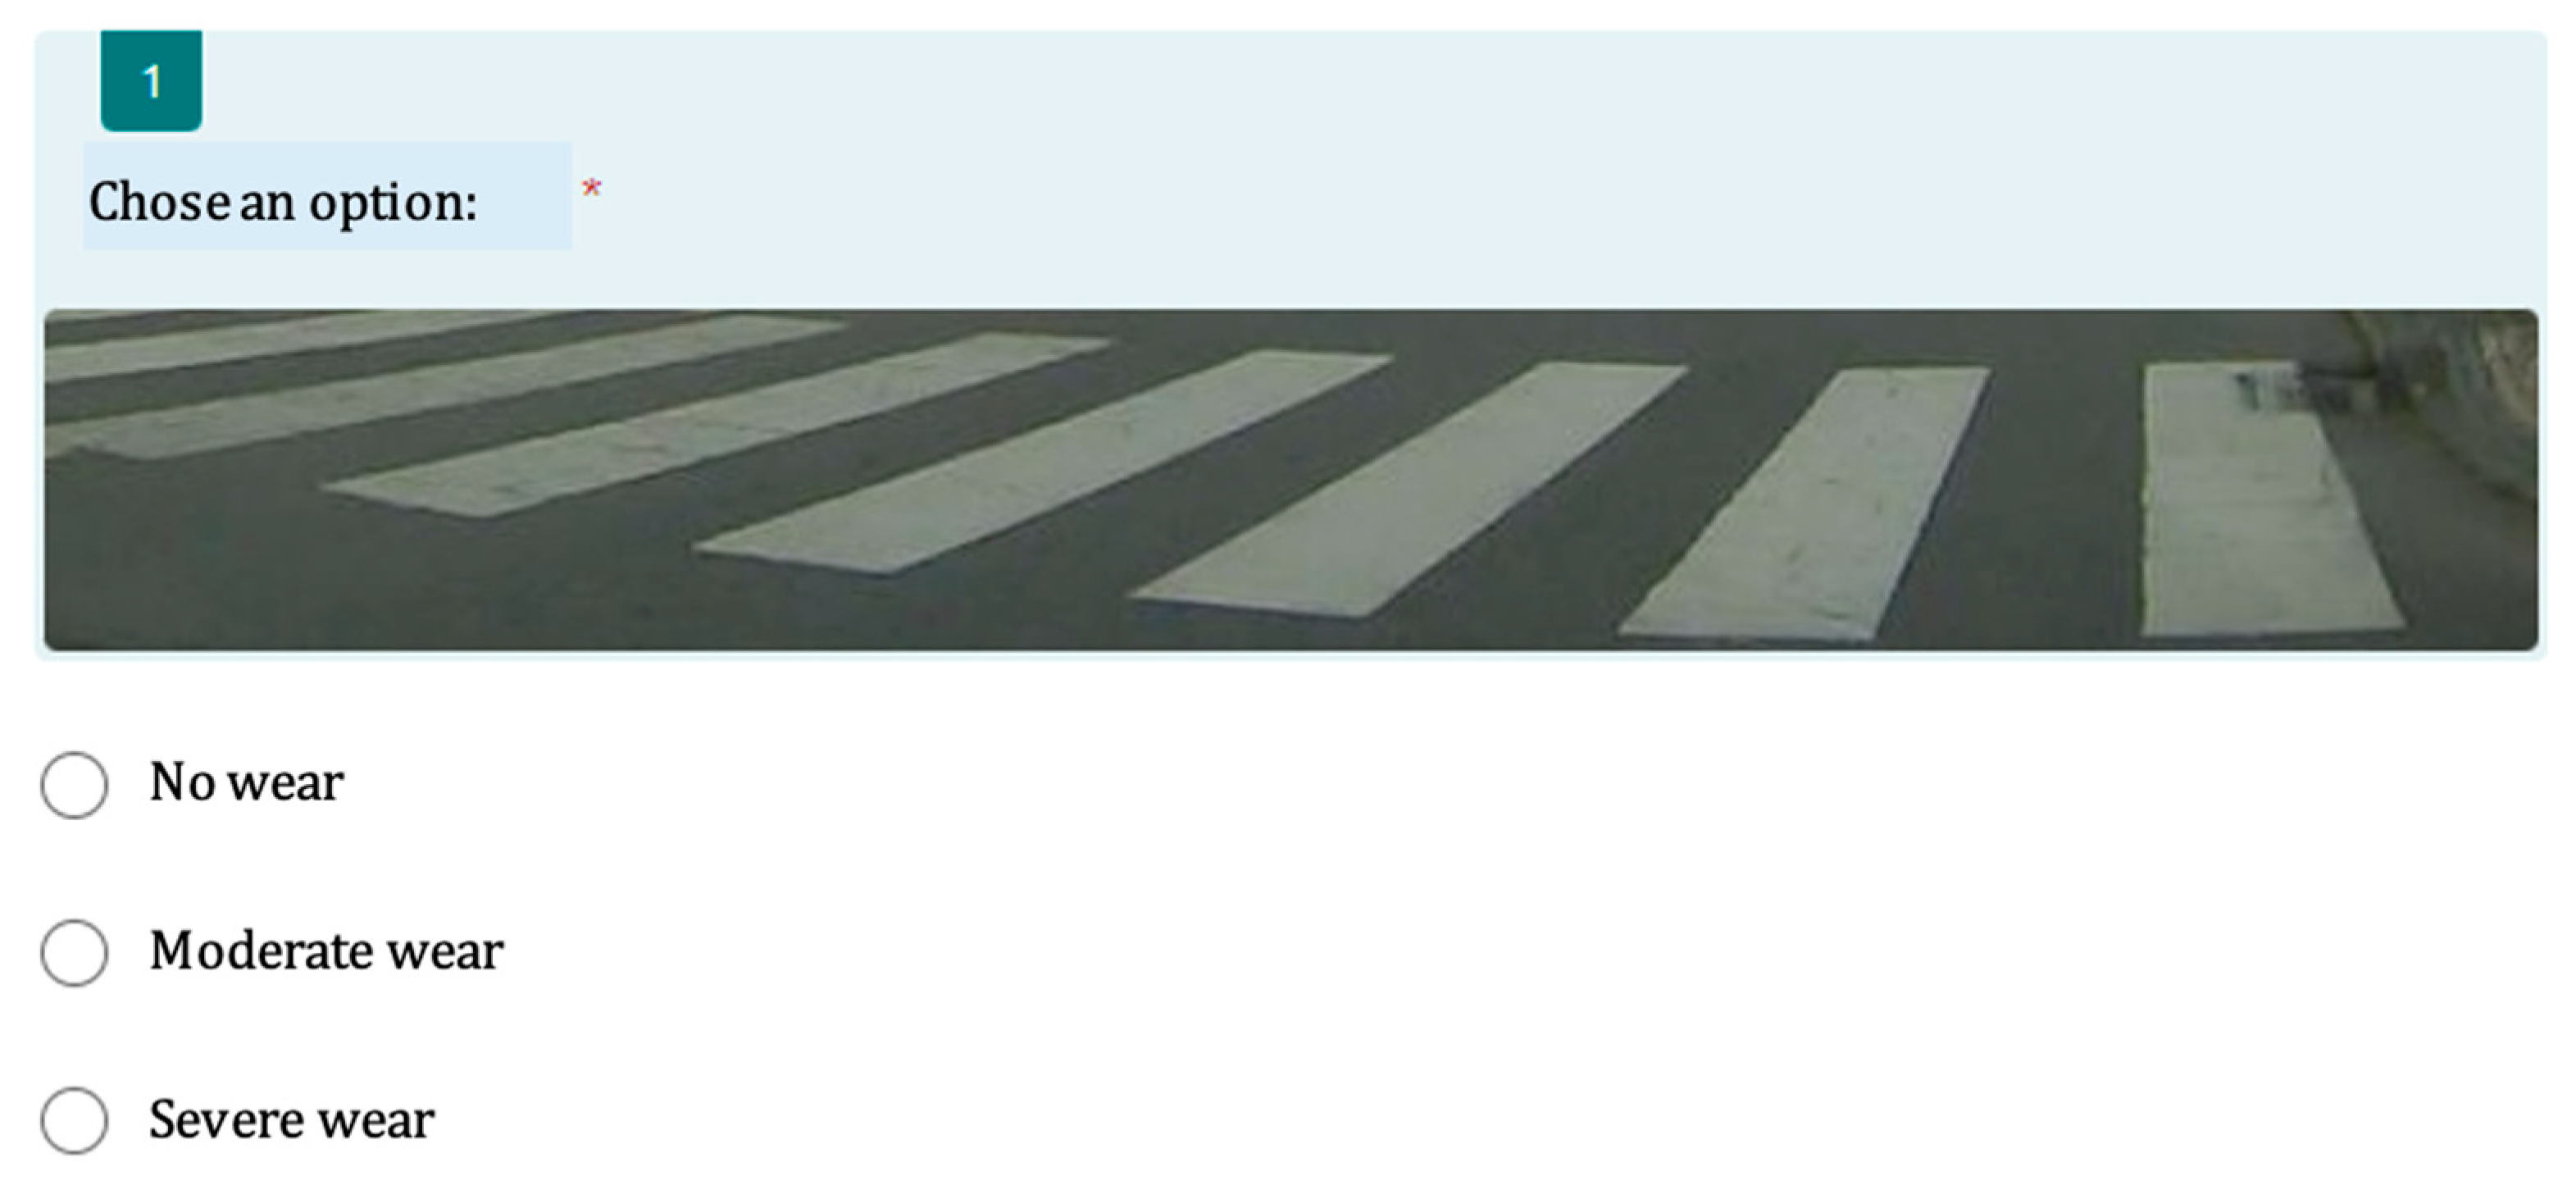
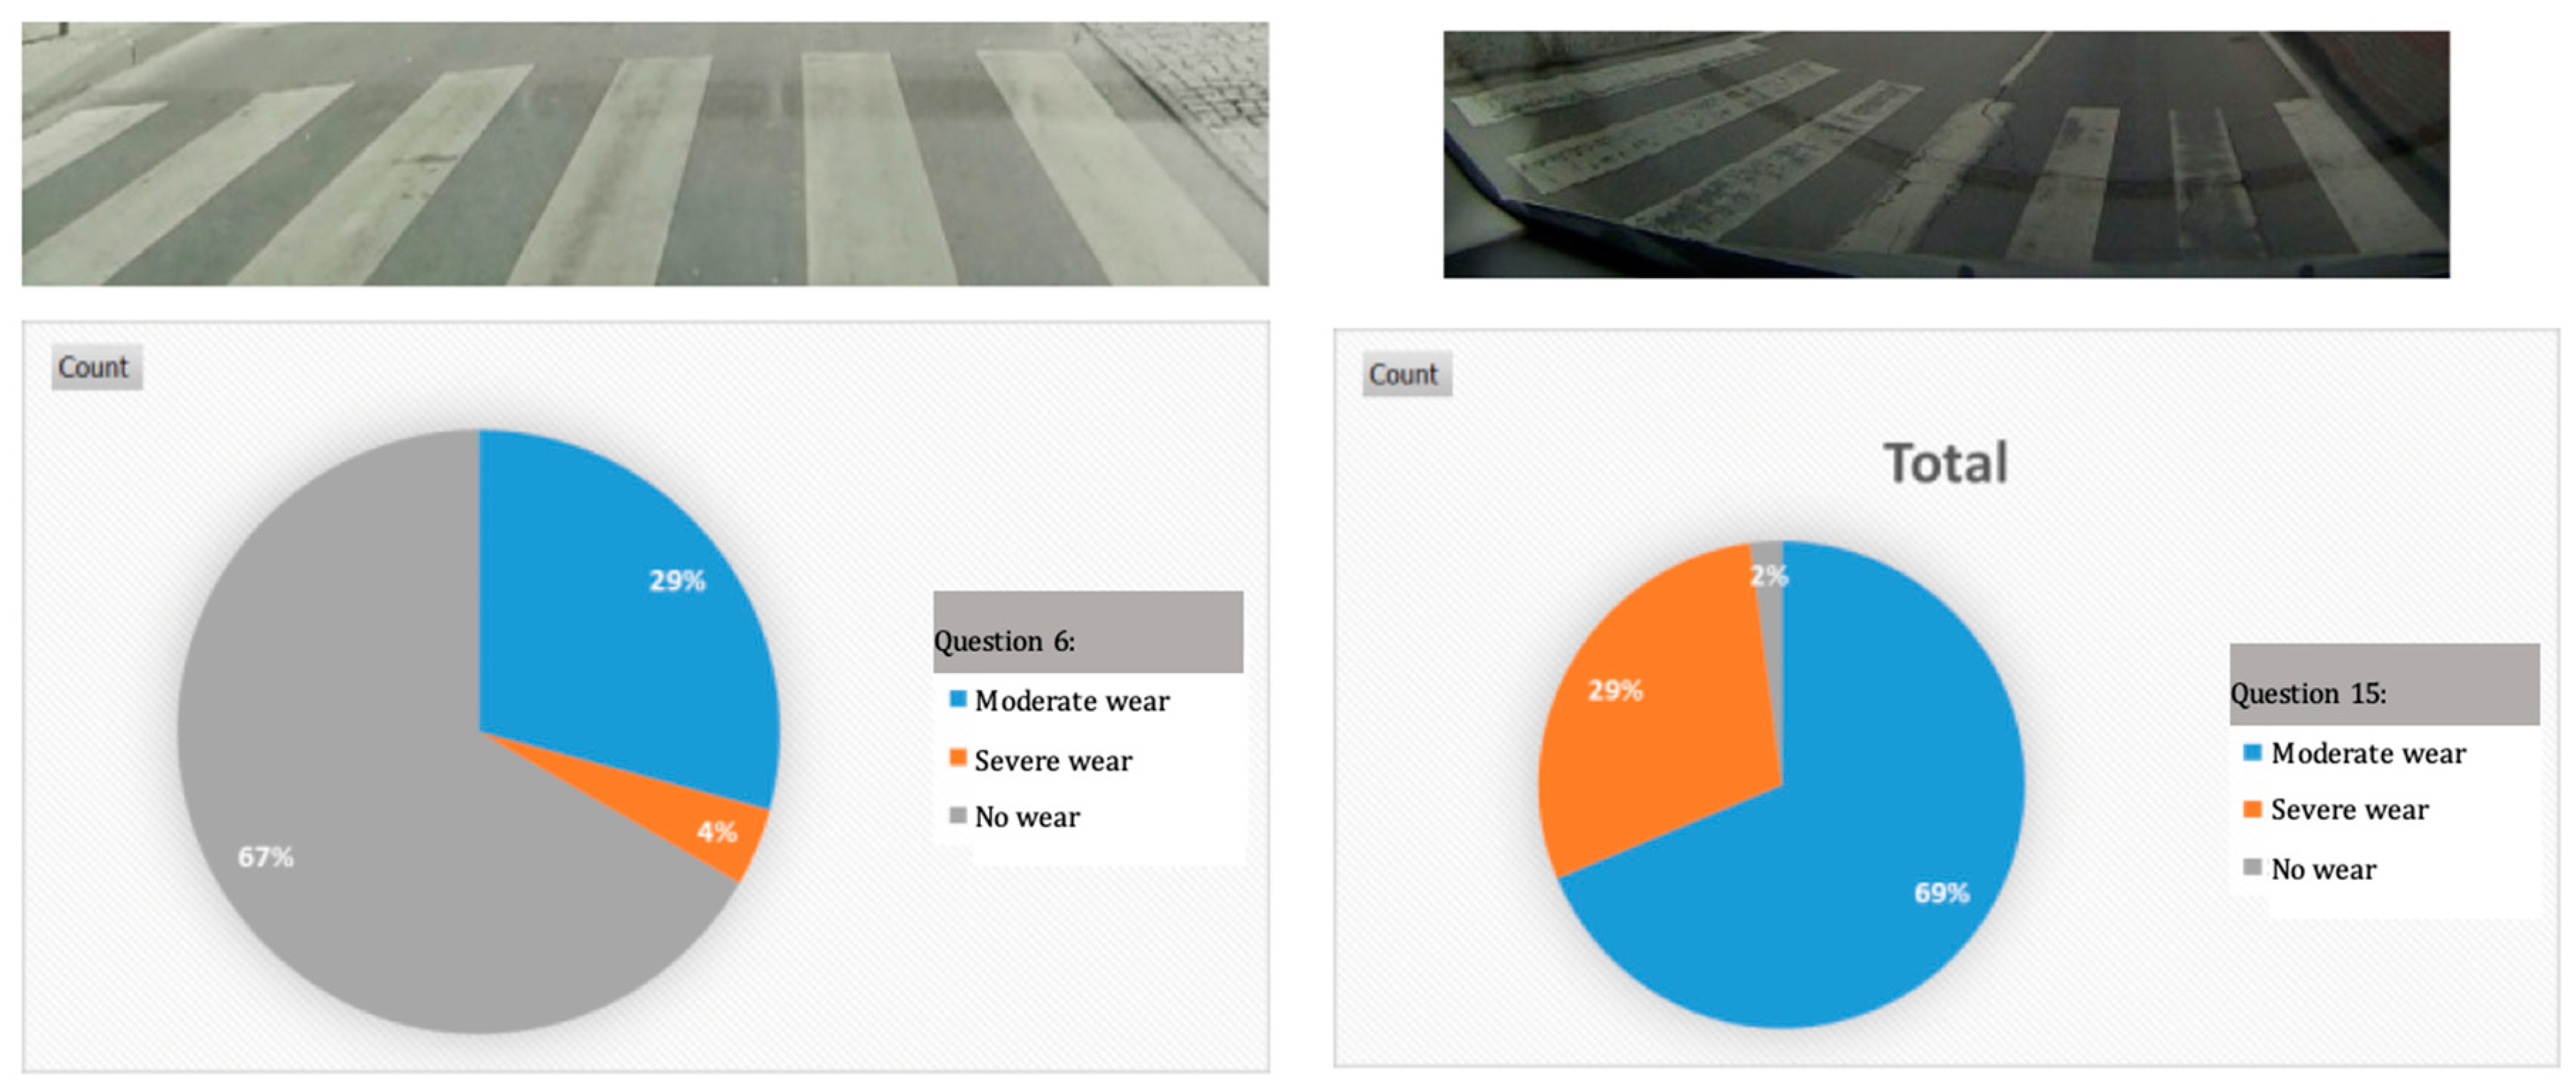
As previously stated, it is crucial to determine appropriate threshold values to achieve the desired outcomes. In this way, 15 images were randomly selected from the dataset and included in a questionnaire. The objective of this task was to have several participants rate the condition of each of the crosswalks according to their sensitivity. This step was essential in overcoming a difficulty encountered in identifying a pattern that would allow the condition of a crosswalk to be classified. The data collected were instrumental in defining a pattern that was subsequently applied to the other images in the dataset. Figure 5 illustrates an example of one of the questions included in the questionnaire. To date, the questionnaire has been answered by 48 participants, and some of the results are shown in Figure 6.

Figure 5.
Example of a question asked on the form.

Figure 6.
Example of the results obtained in the questionnaire.
As previously stated, the process of classifying the state of degradation of crosswalks involved identifying patterns in images containing exclusively crosswalks. The use of Adaptive Threshold methods [7] enabled the calculation of the white area corresponding to the crosswalk stripes, which is essential for extracting the patterns needed to determine the state of degradation of crosswalks in other images. These patterns are detailed in Table 1 and can be used to determine the state of degradation of crosswalks.

Table 1.
Wear interval calculated using Adaptive Threshold.
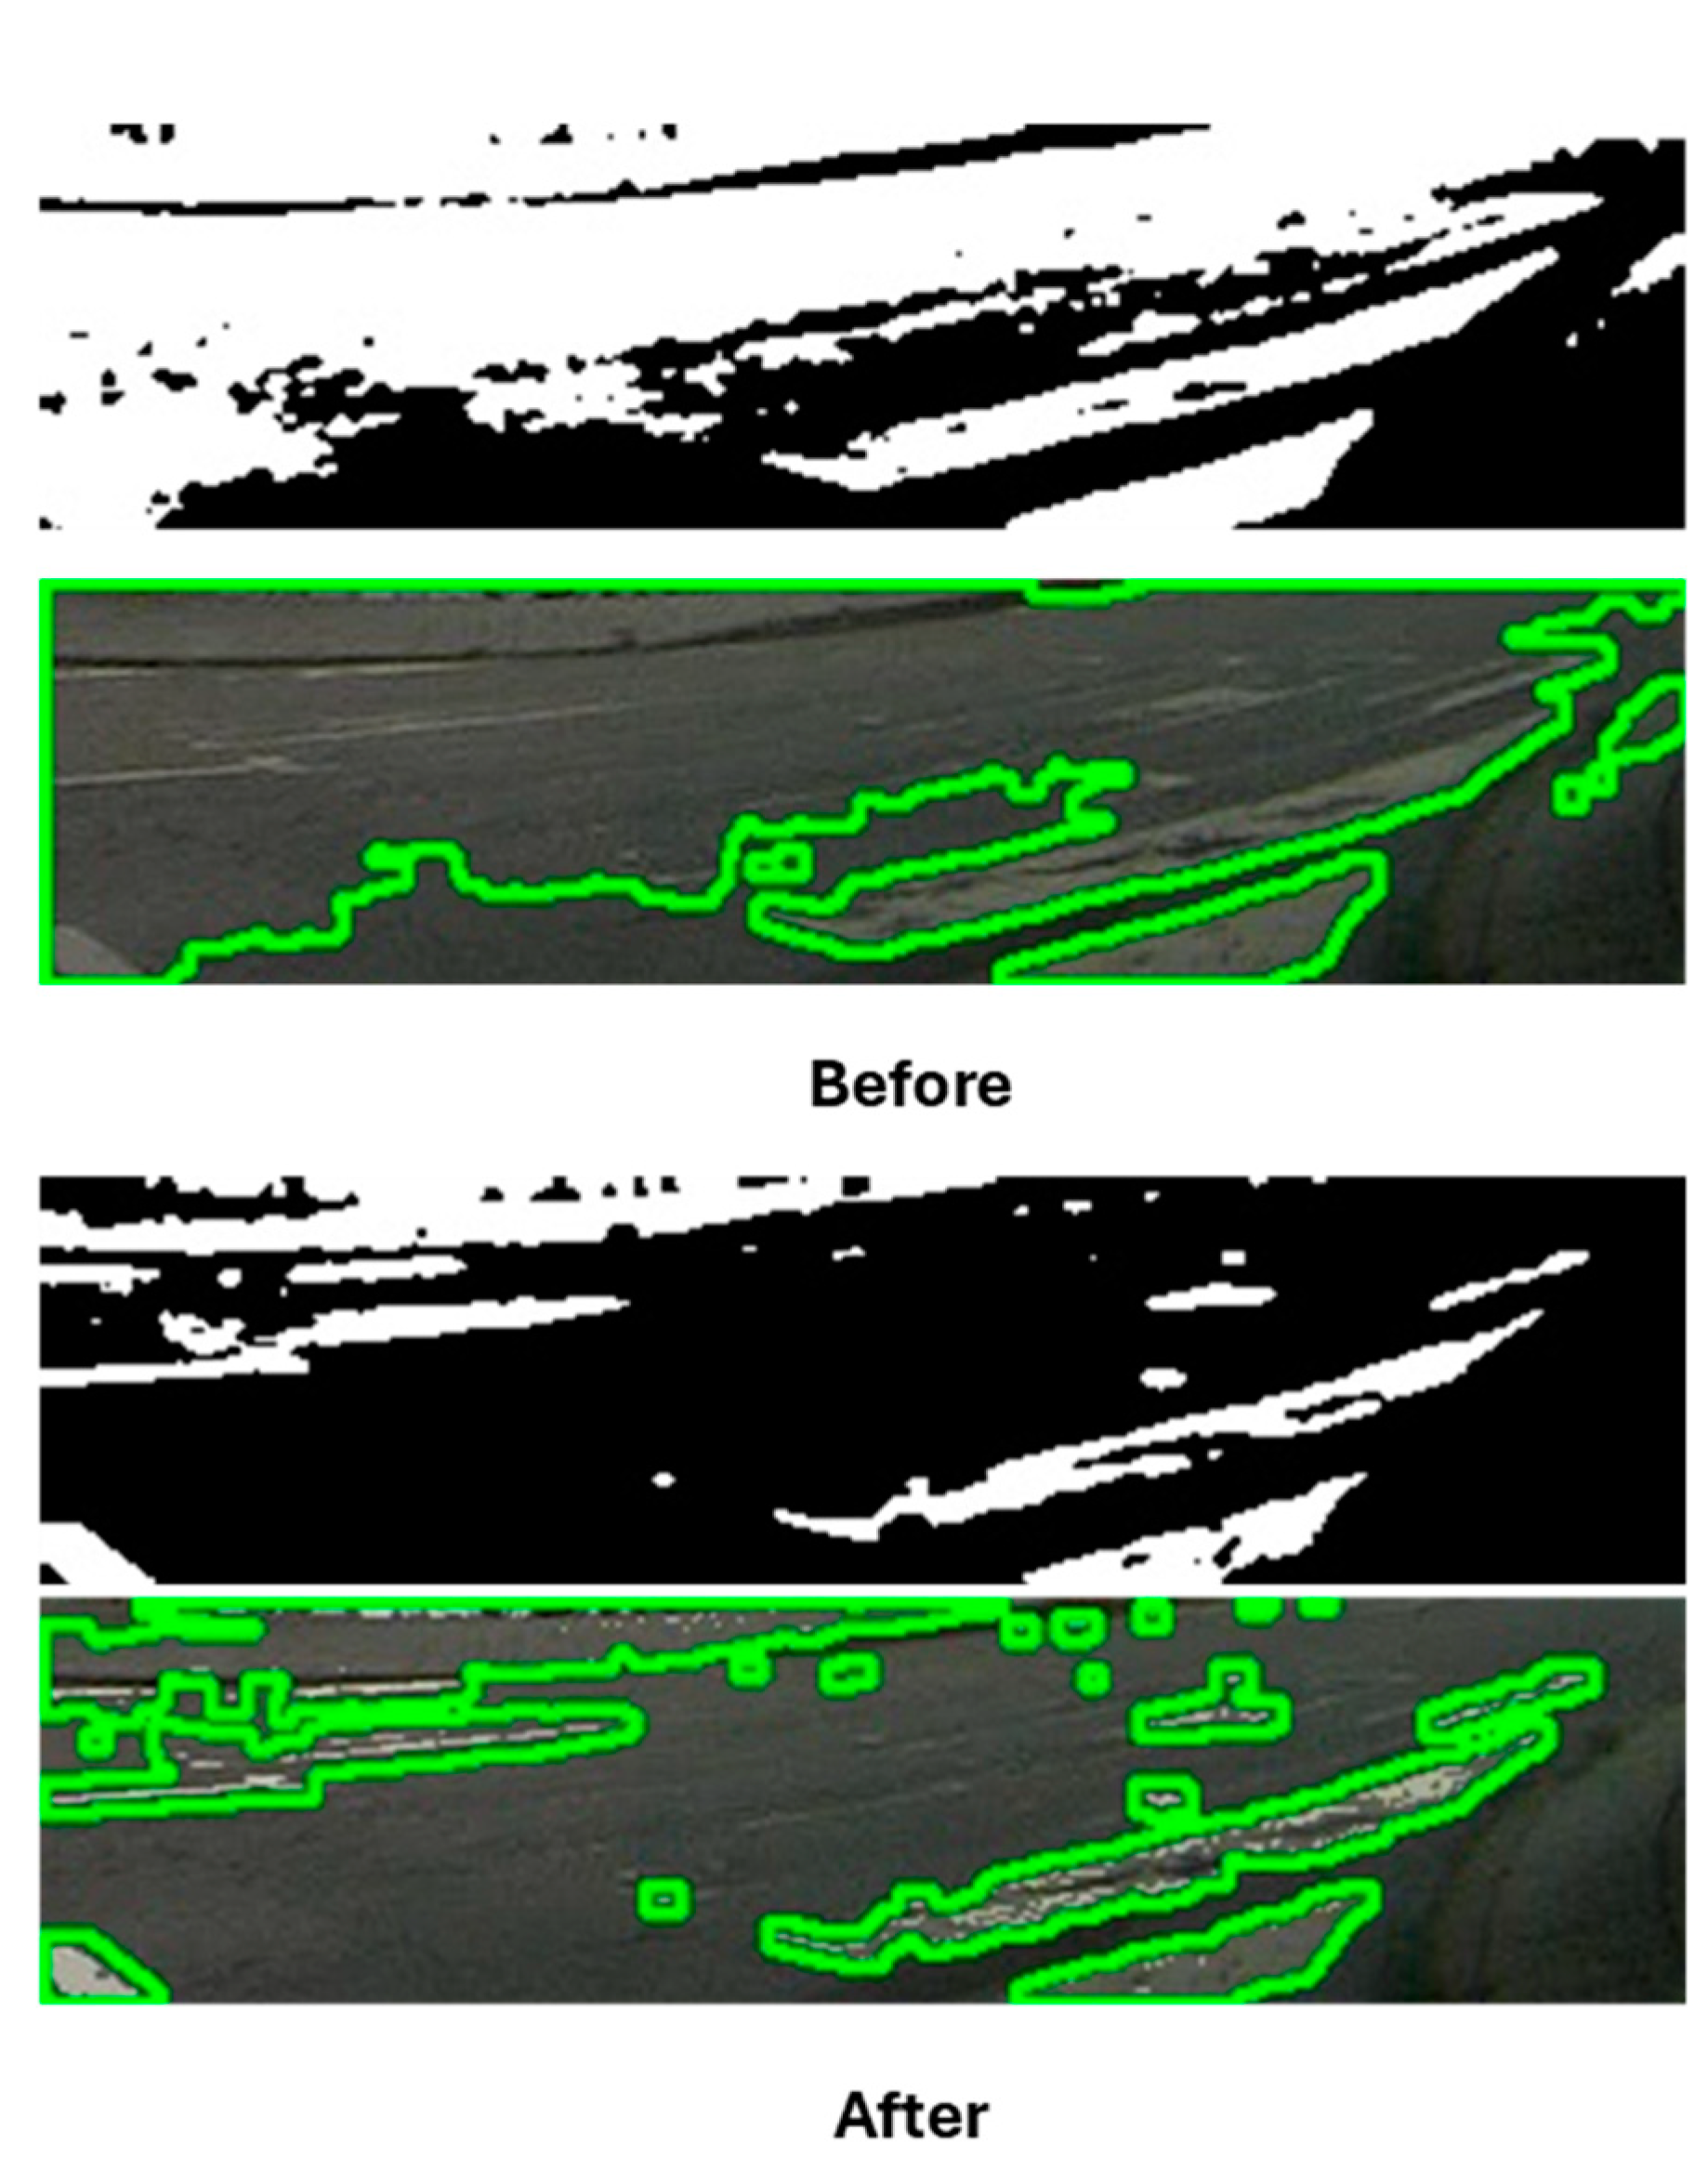
The initial approach to detecting and classifying the wear and tear of crosswalks was to utilize a YOLOv4-tiny model to identify crosswalks. Subsequently, adaptive thresholding methods were employed to ascertain the state of degradation of the crosswalks identified. During the implementation of this approach, certain issues were identified, particularly when the crosswalk exhibited a high degree of wear. This made it challenging to discern the boundaries of the stripes. One potential solution to this issue is to enhance the intensity of the white pixels in the image, thereby rendering them more conspicuous and facilitating their utilization in the area calculation. This approach is illustrated in Figure 7.
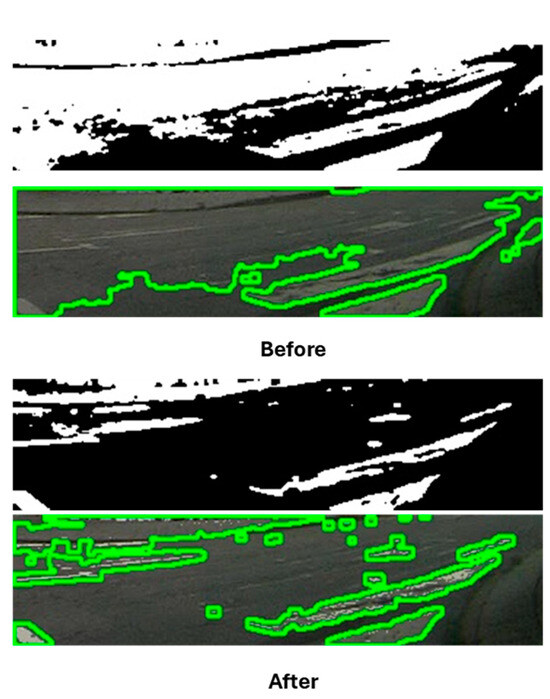
Figure 7.
Example of how the increase in pixels can influence the results.
Although this solution marginally enhanced the outcome, it did not attain the desired level of satisfaction. Conversely, as will be demonstrated in the performance evaluation in Section 2.3, the impact of shadows cast on the crosswalks impeded the ability to accurately identify and categorize them. Given these constraints and the distinctive application of the Adaptive Threshold technique in classifying the state of deterioration of crosswalks, a second approach was implemented, utilizing the YOLOv4-tiny model. The following section will describe the techniques used in this second approach, as well as the approach itself.
2.2. Classification with YOLOv4-Tiny
A previous study by the same authors [8] showed that among the different CNN models tested, the one best suited to the objective was the YOLOv4-tiny model. Therefore, this model was chosen for the detection of crosswalks, since its architecture allowed it to perform well on devices with limited computational resources.
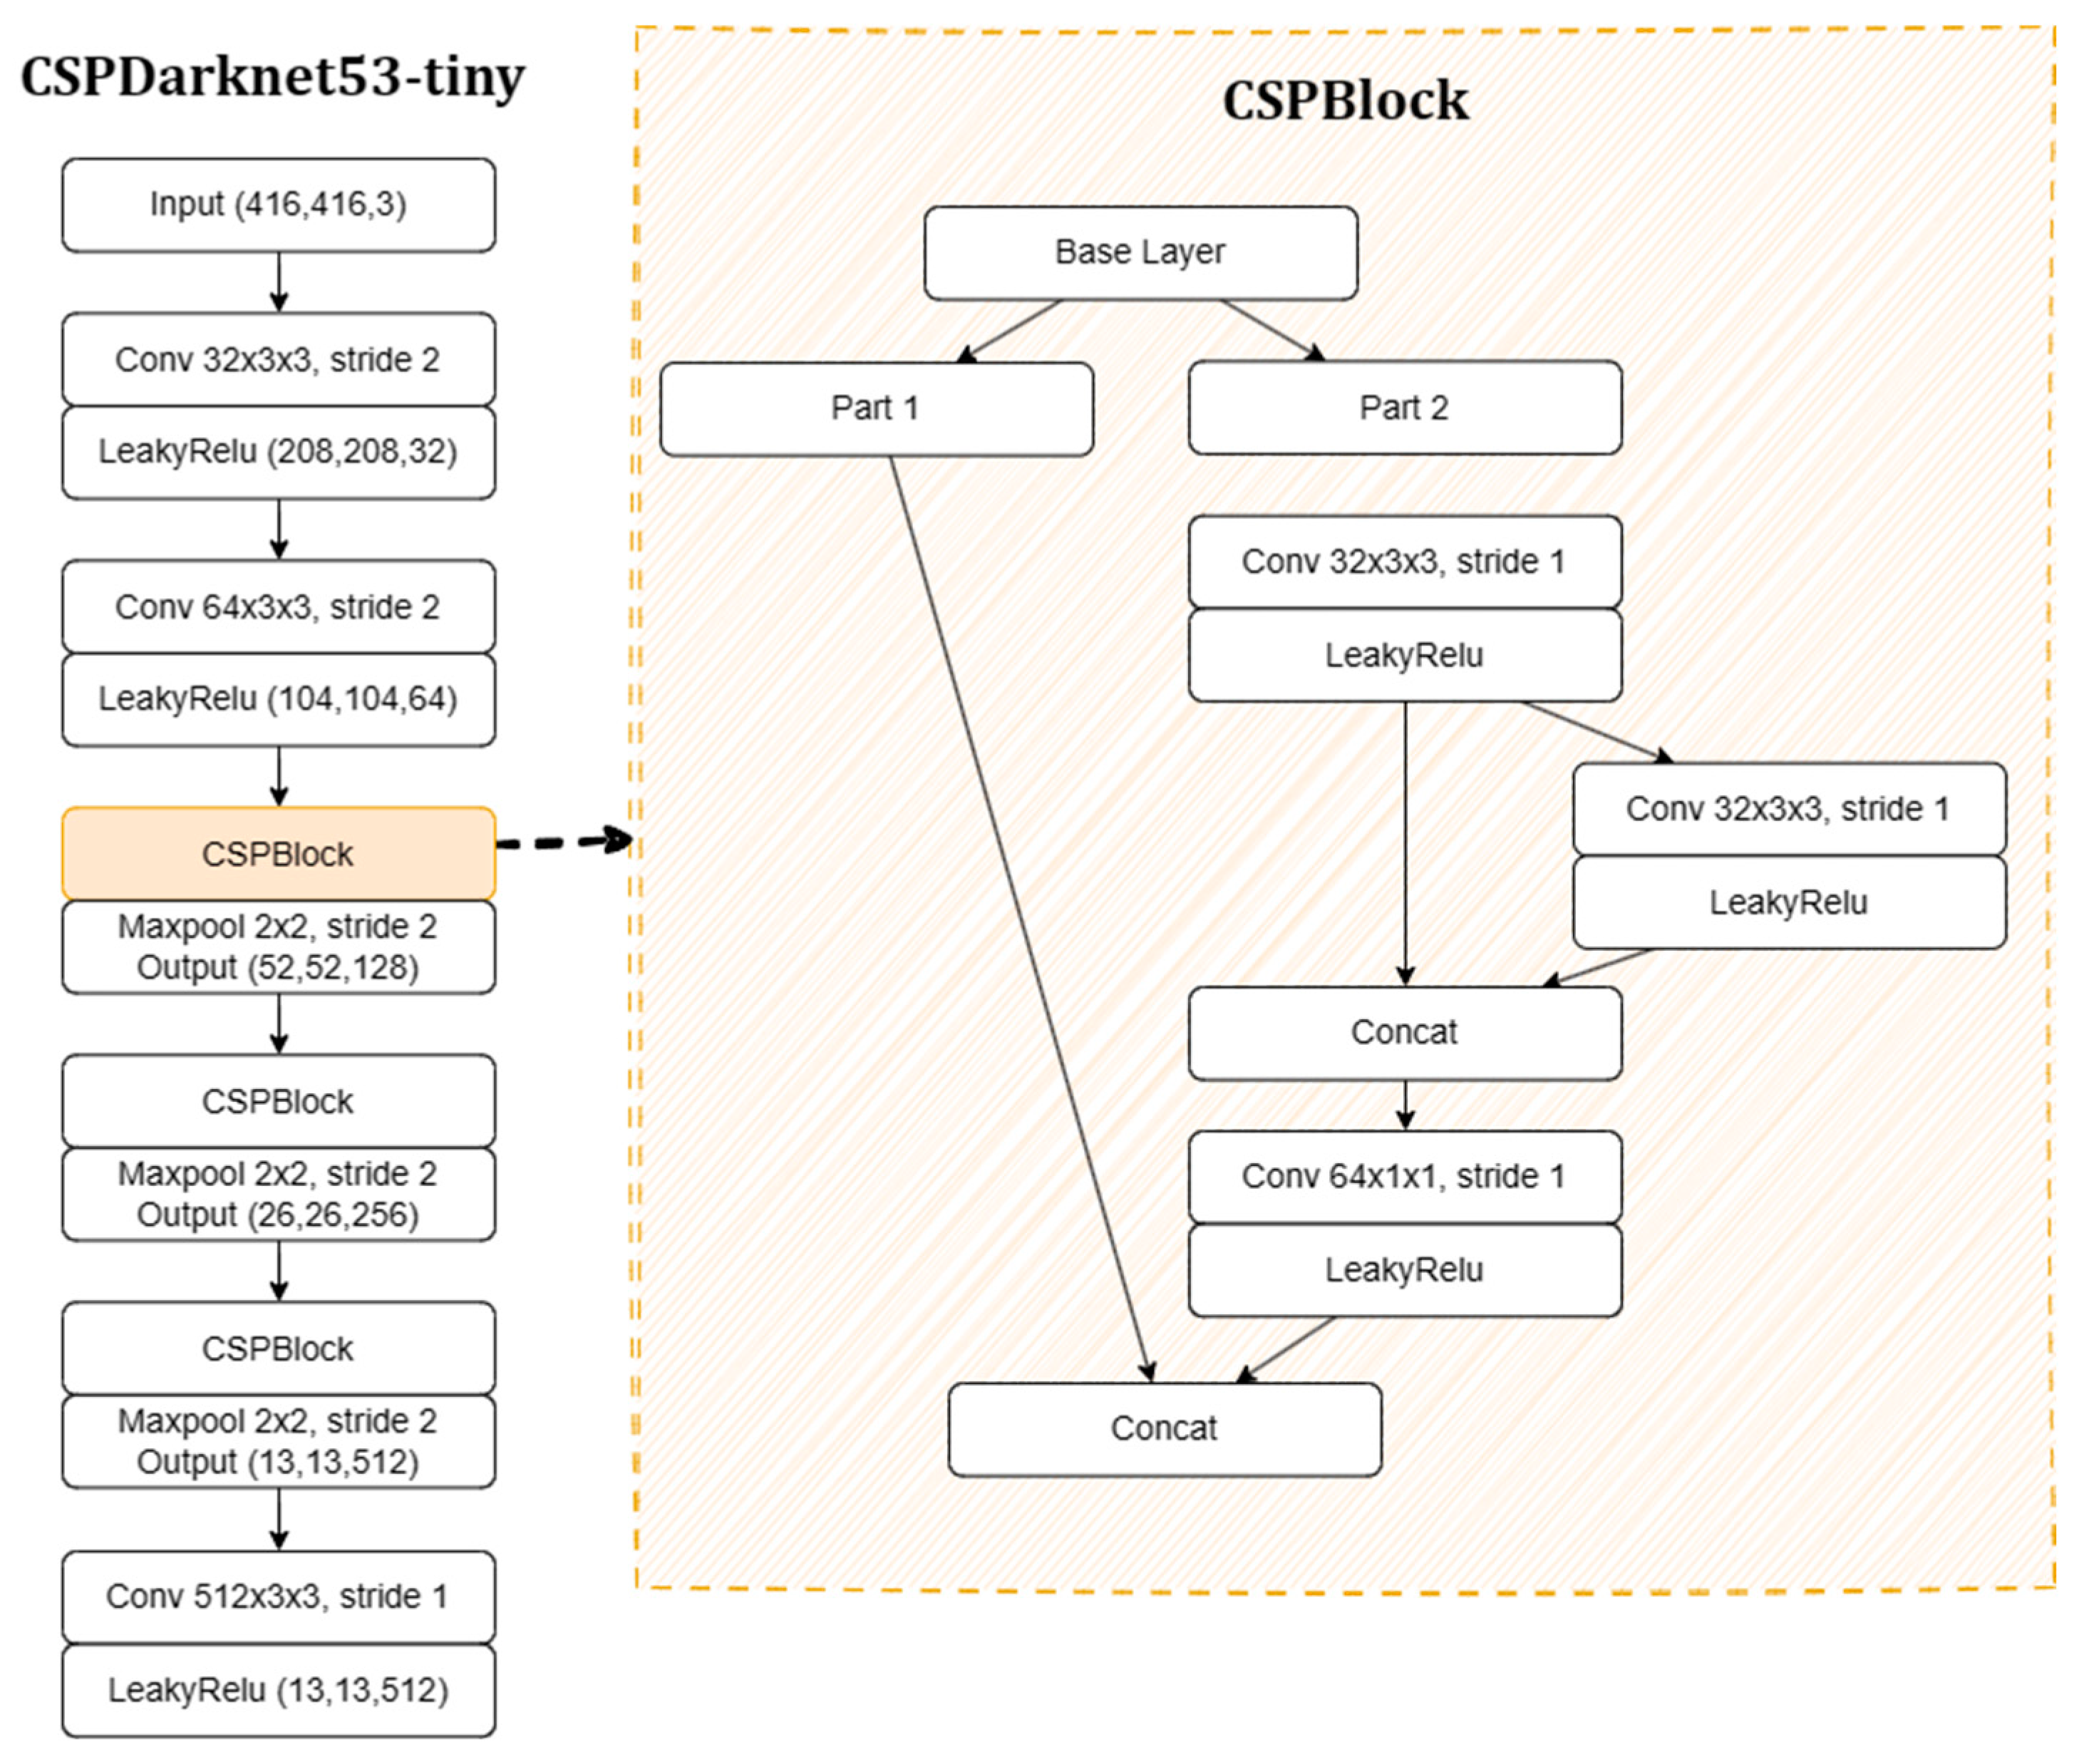
The YOLO (You Only Look Once) model divides the image into a grid and determines the object’s bounding box, confidence levels, and class. The result is a combination of bounding boxes of a given class with an associated confidence level. The tiny version of this model is based on the CSPDarknet53-tiny CNN [9], which consists of three convolutional layers and three CSPBlock modules. CSPDarknet53-tiny is a simplified version of CSPDarknet53 that uses the CSPBlock module instead of the ResBlock module. The CSPBlock module improves the learning capability of the CNN compared to the ResBlock module.
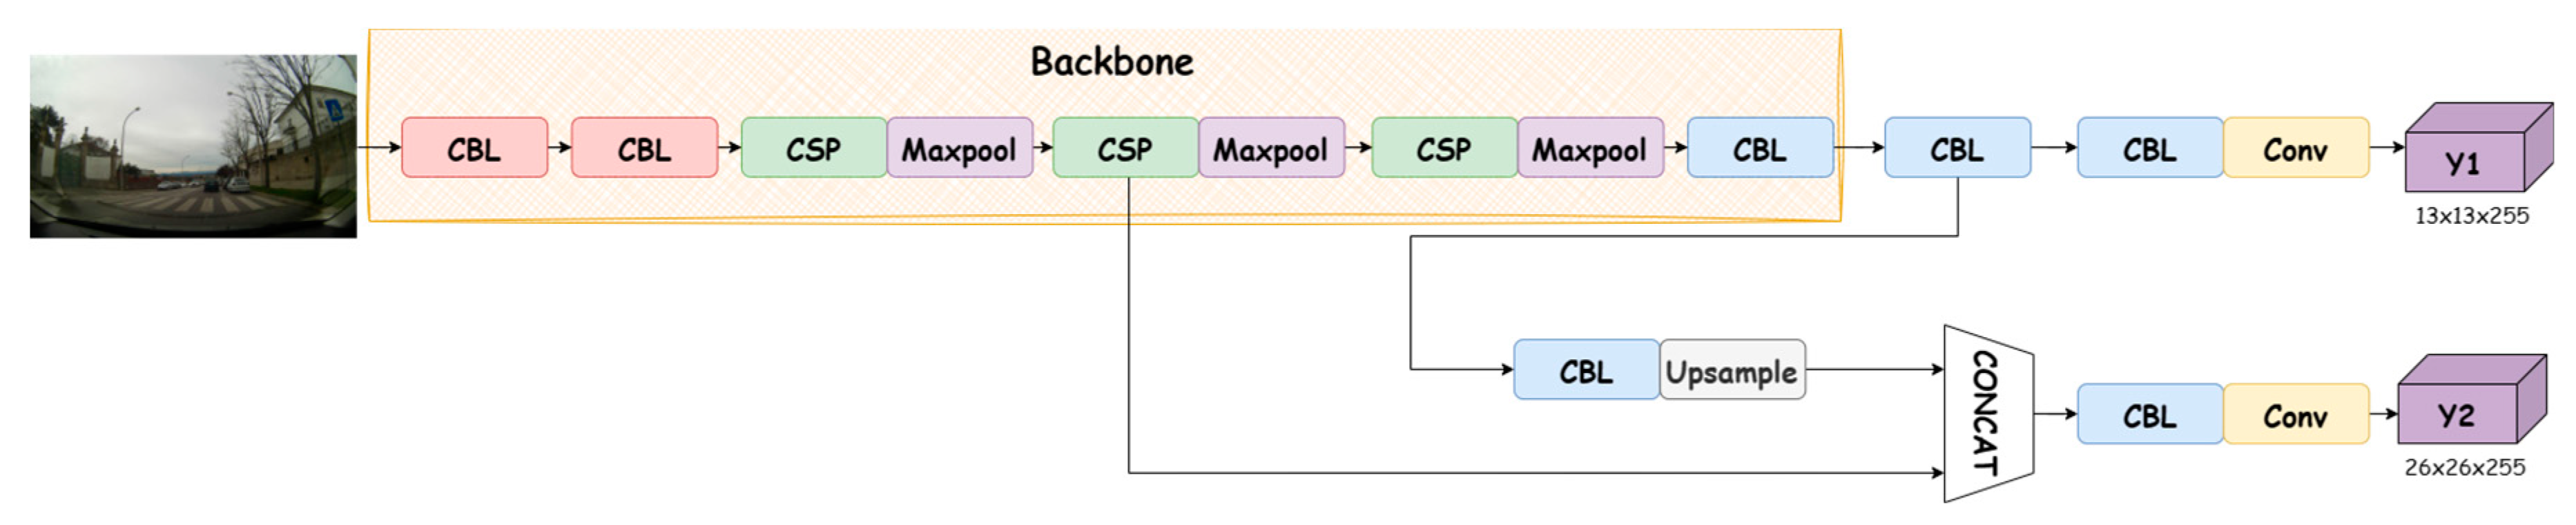
The CSPDarknet53-tiny CNN contains three convolutional layers and three CSPBlock modules. The first two convolutional layers include a convolutional layer and a LeakyReLU layer with a kernel size of 3 and a stride of 2, respectively. The last convolutional layer has a kernel size of 3 and a stride of 1, as shown in Figure 8. CSPDarknet53-tiny also uses the LeakyReLU function as the activation function instead of the Mish activation function, which simplifies the computational process [10]. This architecture is illustrated in Figure 9.
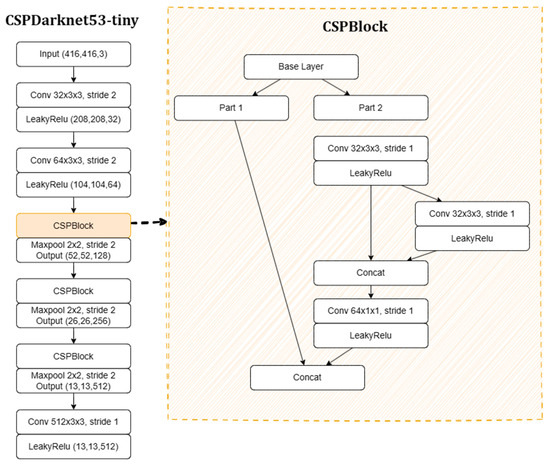
Figure 8.
Illustration from CNN CSPDarknet53-tiny. Adapted from [9].

Figure 9.
Architecture of the YOLOv4-tiny model. Adapted from [11].
YOLOv4-tiny uses two feature maps, each with dimensions of 13 × 13 and 26 × 26, to predict the detection results. At the same time, each feature map uses three anchor boxes of different sizes to predict three bounding boxes.
As mentioned in the previous section, the first approach used to classify the degradation state of crosswalks had some limitations under certain conditions. To improve the results, a second approach was used. This consisted of constructing a new dataset that included the three classes of crosswalk degradation mentioned above. These degradation states were defined using adaptive thresholding methods. To implement this new approach, it was necessary to modify the dataset previously created by the same authors [12], resulting in a new dataset. The following section describes all the actions performed on this new dataset.
Dataset
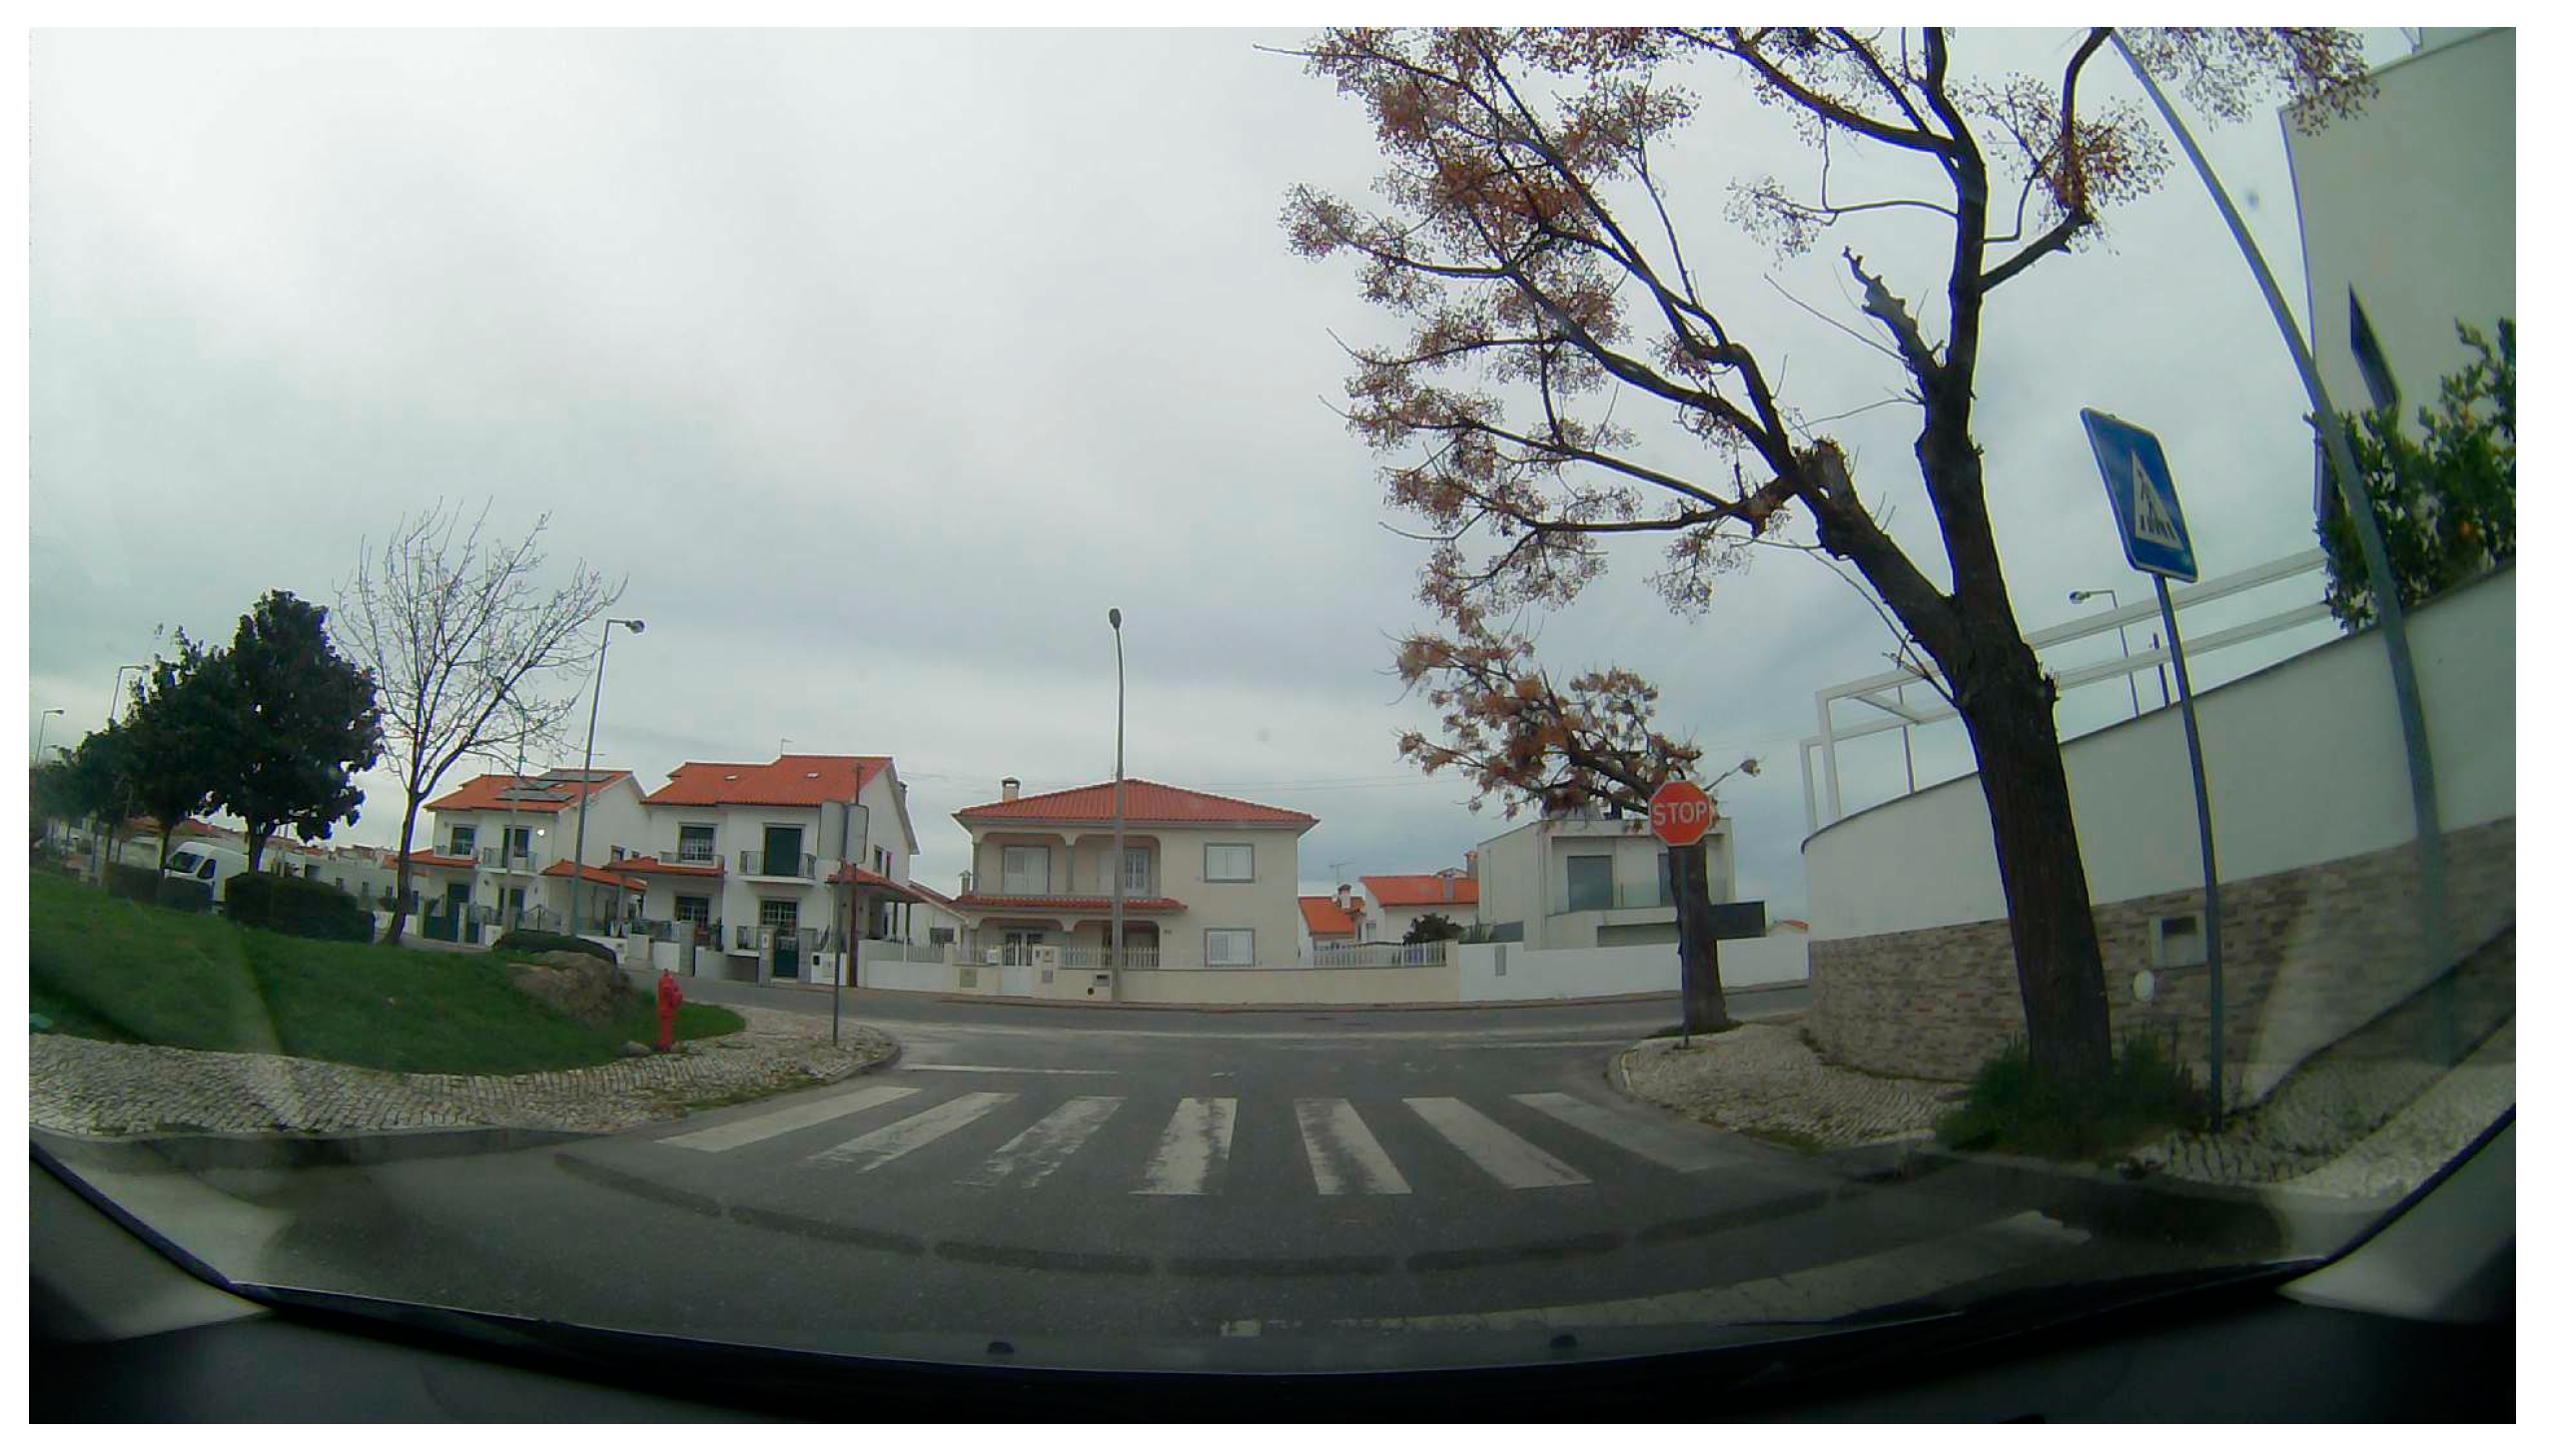
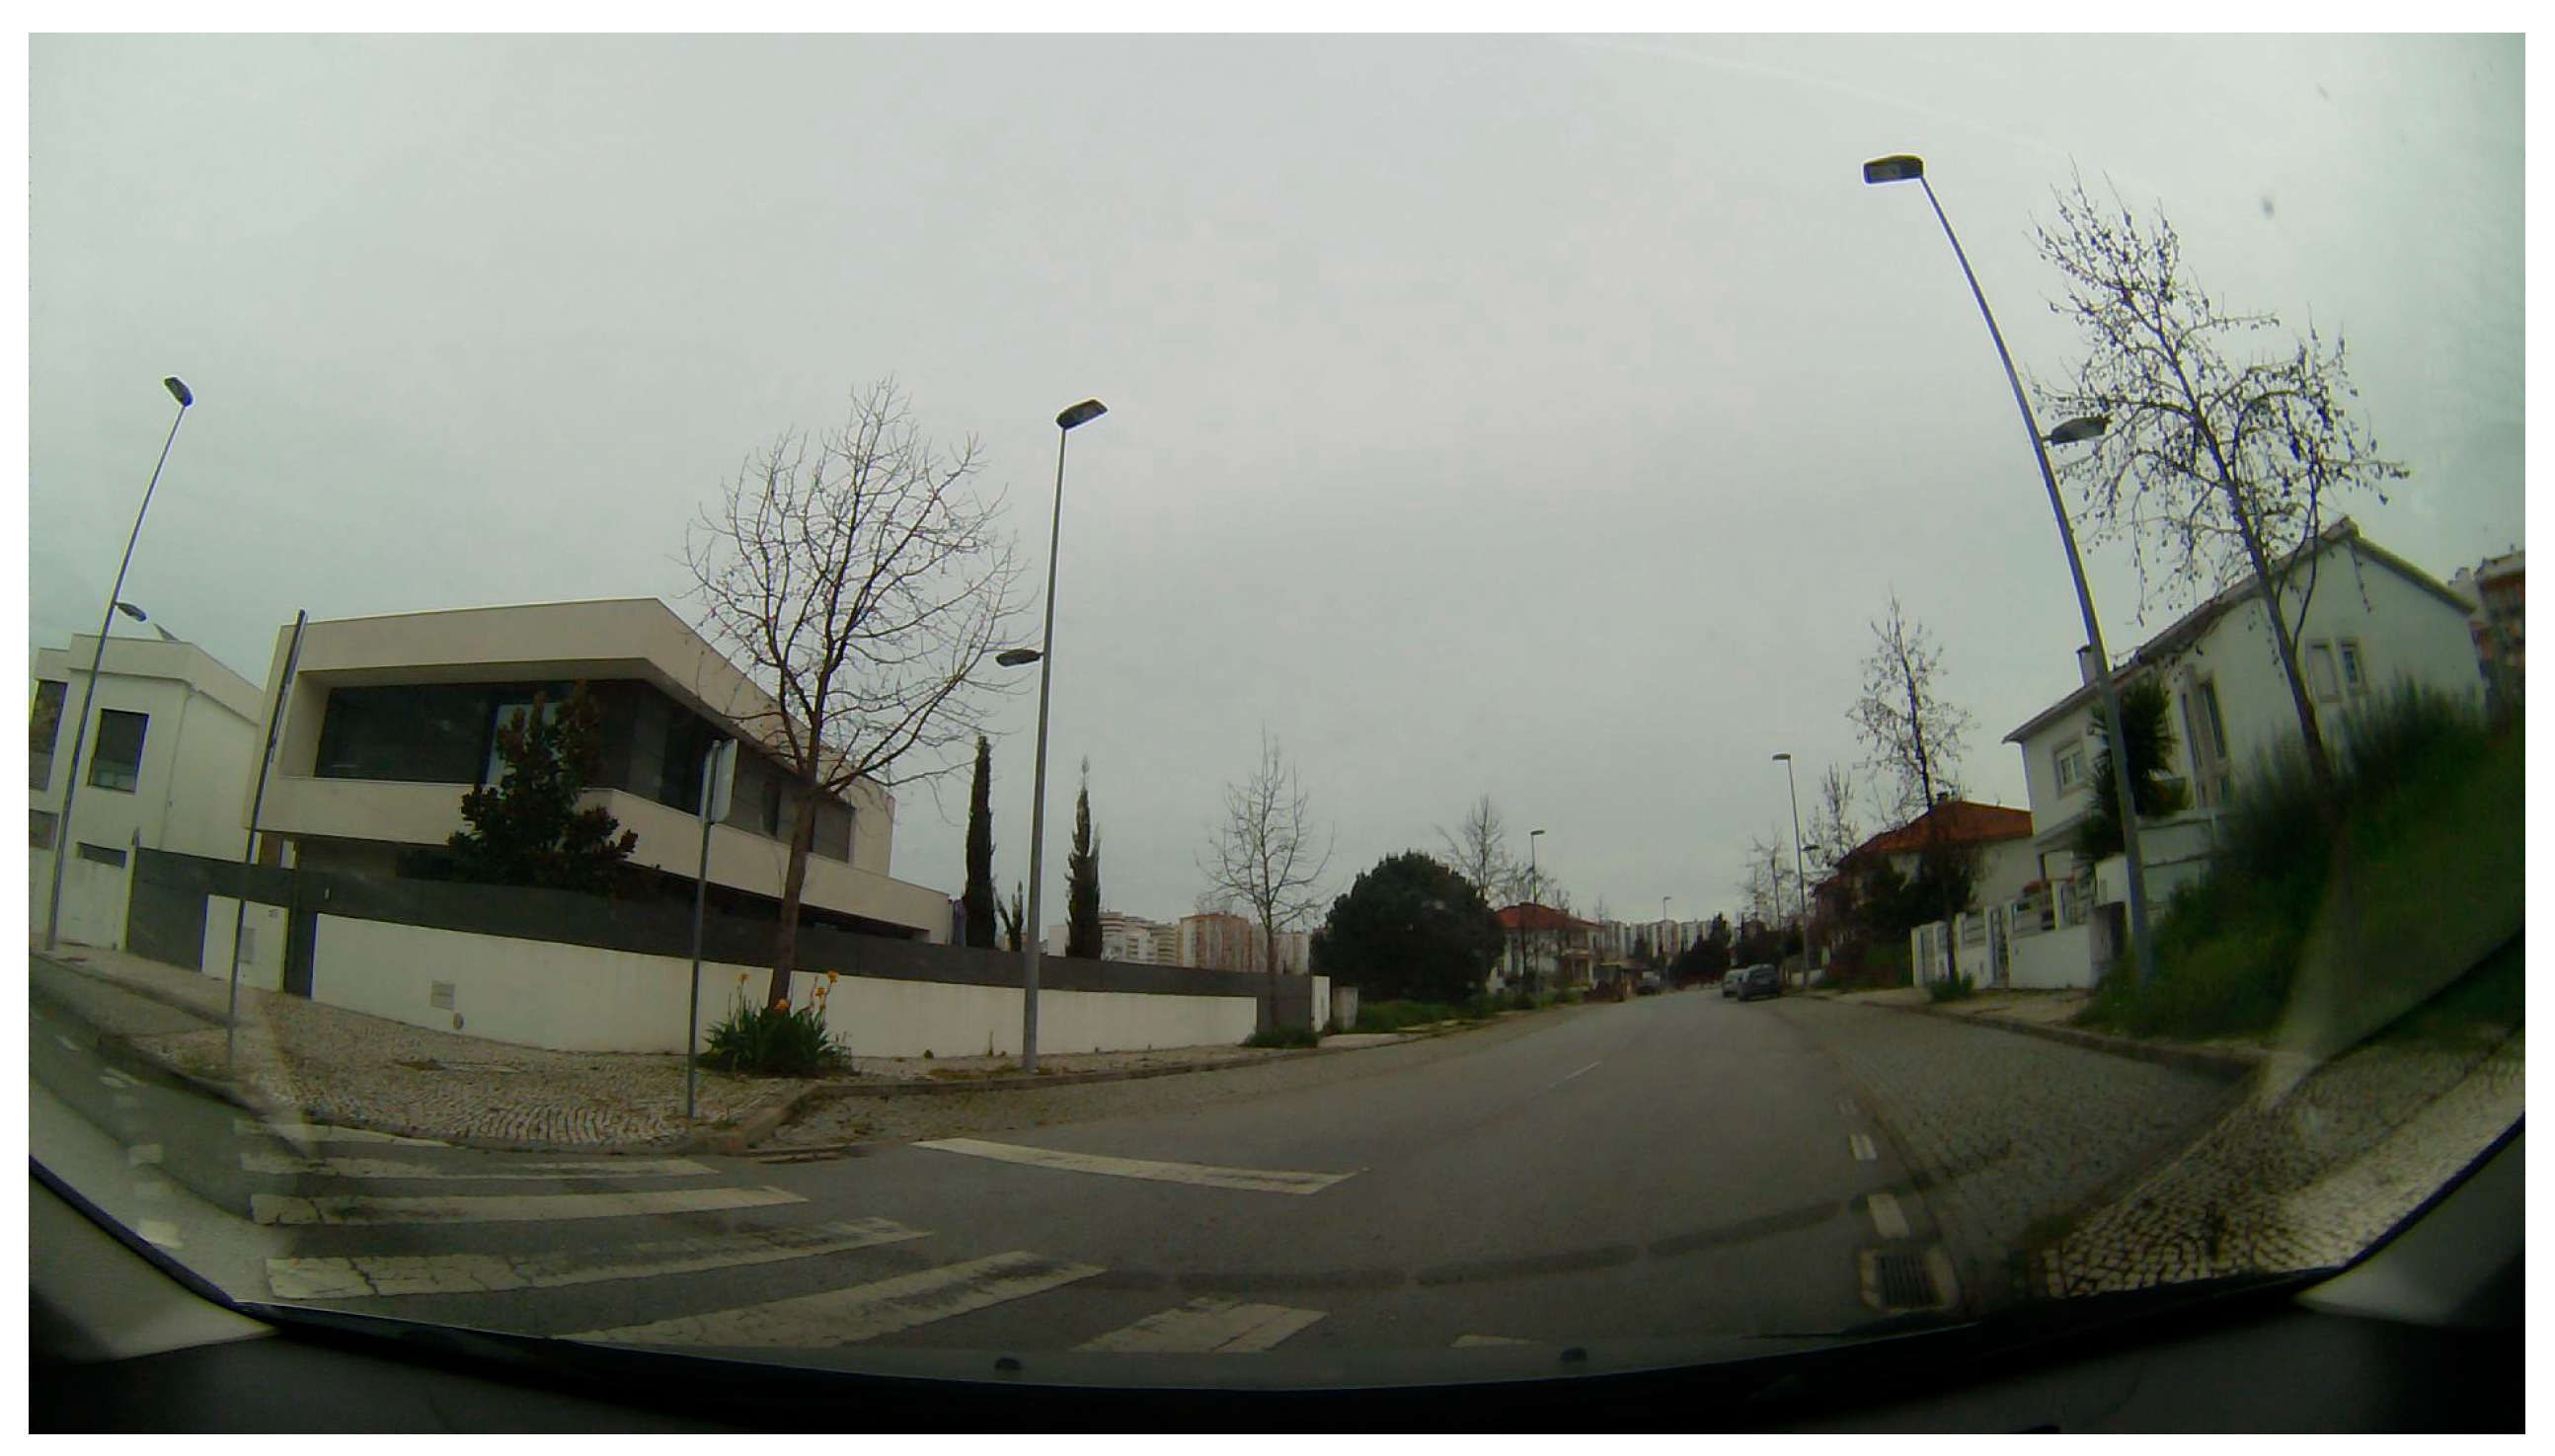
To improve the existing dataset [12], new images of pedestrian crossings have been added, increasing the total number of images from 642 to 1182. This new dataset is available at [13]. The images were taken with a camera with a 160° field of view, as shown in Figure 10. They were taken during the day, but during a period of cloudy skies, which made it possible to diversify the set of images and obtain more information about the crosswalks.
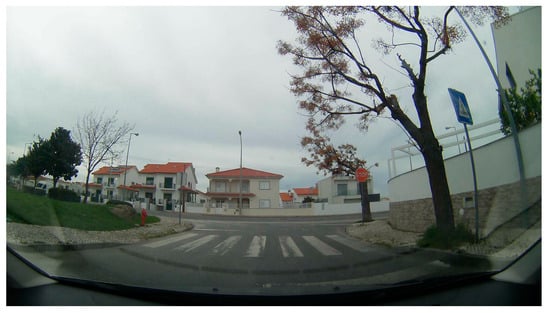
Figure 10.
Example of a captured image.
An Arducam 1080 P Low Light WDR USB Camera Module was used to capture these images. It has a metal mount that allows it to be easily attached to a cell phone holder. This camera has a 160° super ultra-wide viewing angle. This makes it easier to capture details that might be hidden in cameras with normal angles, such as 90°, as shown in Figure 11.
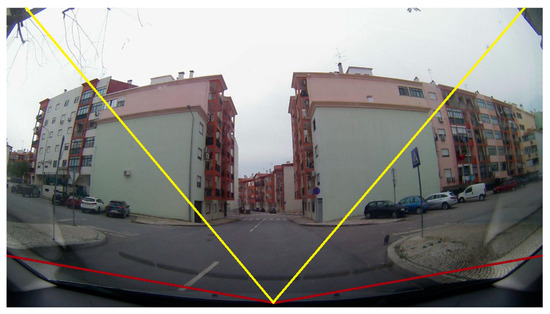
Figure 11.
Illustration of objects captured by a 90° camera vs. a 160° camera.
Figure 11 shows a comparison of the angular aperture of a conventional 90° camera (in yellow) and the 160° camera used in this project (in red). As can be seen, the crosswalks to the left and right of the image would not be captured by the 90° cameras.
To determine the degradation state of the crosswalks and subsequently classify the images in the dataset [14], all images in the dataset were labeled using the method presented in Section 2.1. In other words, the Adaptive Threshold method was applied to each image to determine which degradation state it would best fit into. After that, the labels in the dataset were changed from a dataset containing only one class to three classes. Thus, the dataset now consists of 413 labels referring to crosswalks classified as Moderate Wear, 471 as Severe Wear, and 555 as No Wear, for a total of 1440 images without the use of data augmentation. Table 2 summarizes the current composition of the generated dataset. The next section presents a comparative performance evaluation of the use of the two approaches described in the detection and classification of the state of degradation of crosswalks.
Table 2.
Total number of labels per class.
2.3. Performance Evaluation
This section describes the comparative performance evaluation using the two previously discussed methods for detecting and classifying crosswalk wear. The benchmark scenario, performance metrics, and results of the tests performed are discussed.
2.3.1. Benchmark Scenario
The presented YOLOv4-tiny model was trained and tested on the Google Colab platform [15]. An Intel(R) Xeon(R) CPU @ 2.00 GHz, 12 GB RAM, and a Tesla T4 GPU were used to perform the training on the Google Colab platform. This model was then tested on a Raspberry PI 5 with a Broadcom BCM2712 2.4 GHz quad-core CPU with a VideoCore VII GPU and 8 GB of RAM.
2.3.2. Performance Metrics
As mentioned in [16], the recommended number of iterations for the YOLOv4-tiny model is 12,000, which is especially advisable for data sets with 3 classes. The number of epochs can be determined using Equation (1).
Equation (2), which allows the calculation of the Mean Average Precision commonly used in the evaluation of CNN models for object detection, calculates the Mean Average Precision (mAP), which represents the overall effectiveness. This sums the Average Precision (AP) of all classes, providing a comprehensive indicator of the model’s ability to identify objects.
2.3.3. Results and Discussion
As mentioned above, the use of the Adaptive Threshold method made it possible to determine the degradation state of crosswalks in images. However, to use this technique more effectively to classify wear, an image with an identified and isolated crosswalk should be used. To obtain these images, the YOLOv4-tiny model presented in the previous phase of this project was used but, in this case, retrained with the improved dataset containing more images. Table 3 shows the results obtained previously and using the new dataset.
Table 3.
Comparison of the results obtained between the model presented in [8] and the one trained for this project (*).
Based on the results given in Table 3, the model used in this project improved the mAP by approximately three percentage points. The use of this model ensures that only crosswalks are fed to the thresholding method, which then determines their state of degradation. This process is shown in Figure 12, which illustrates this mechanism.
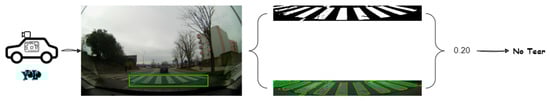
Figure 12.
Diagram of how the first approach works.
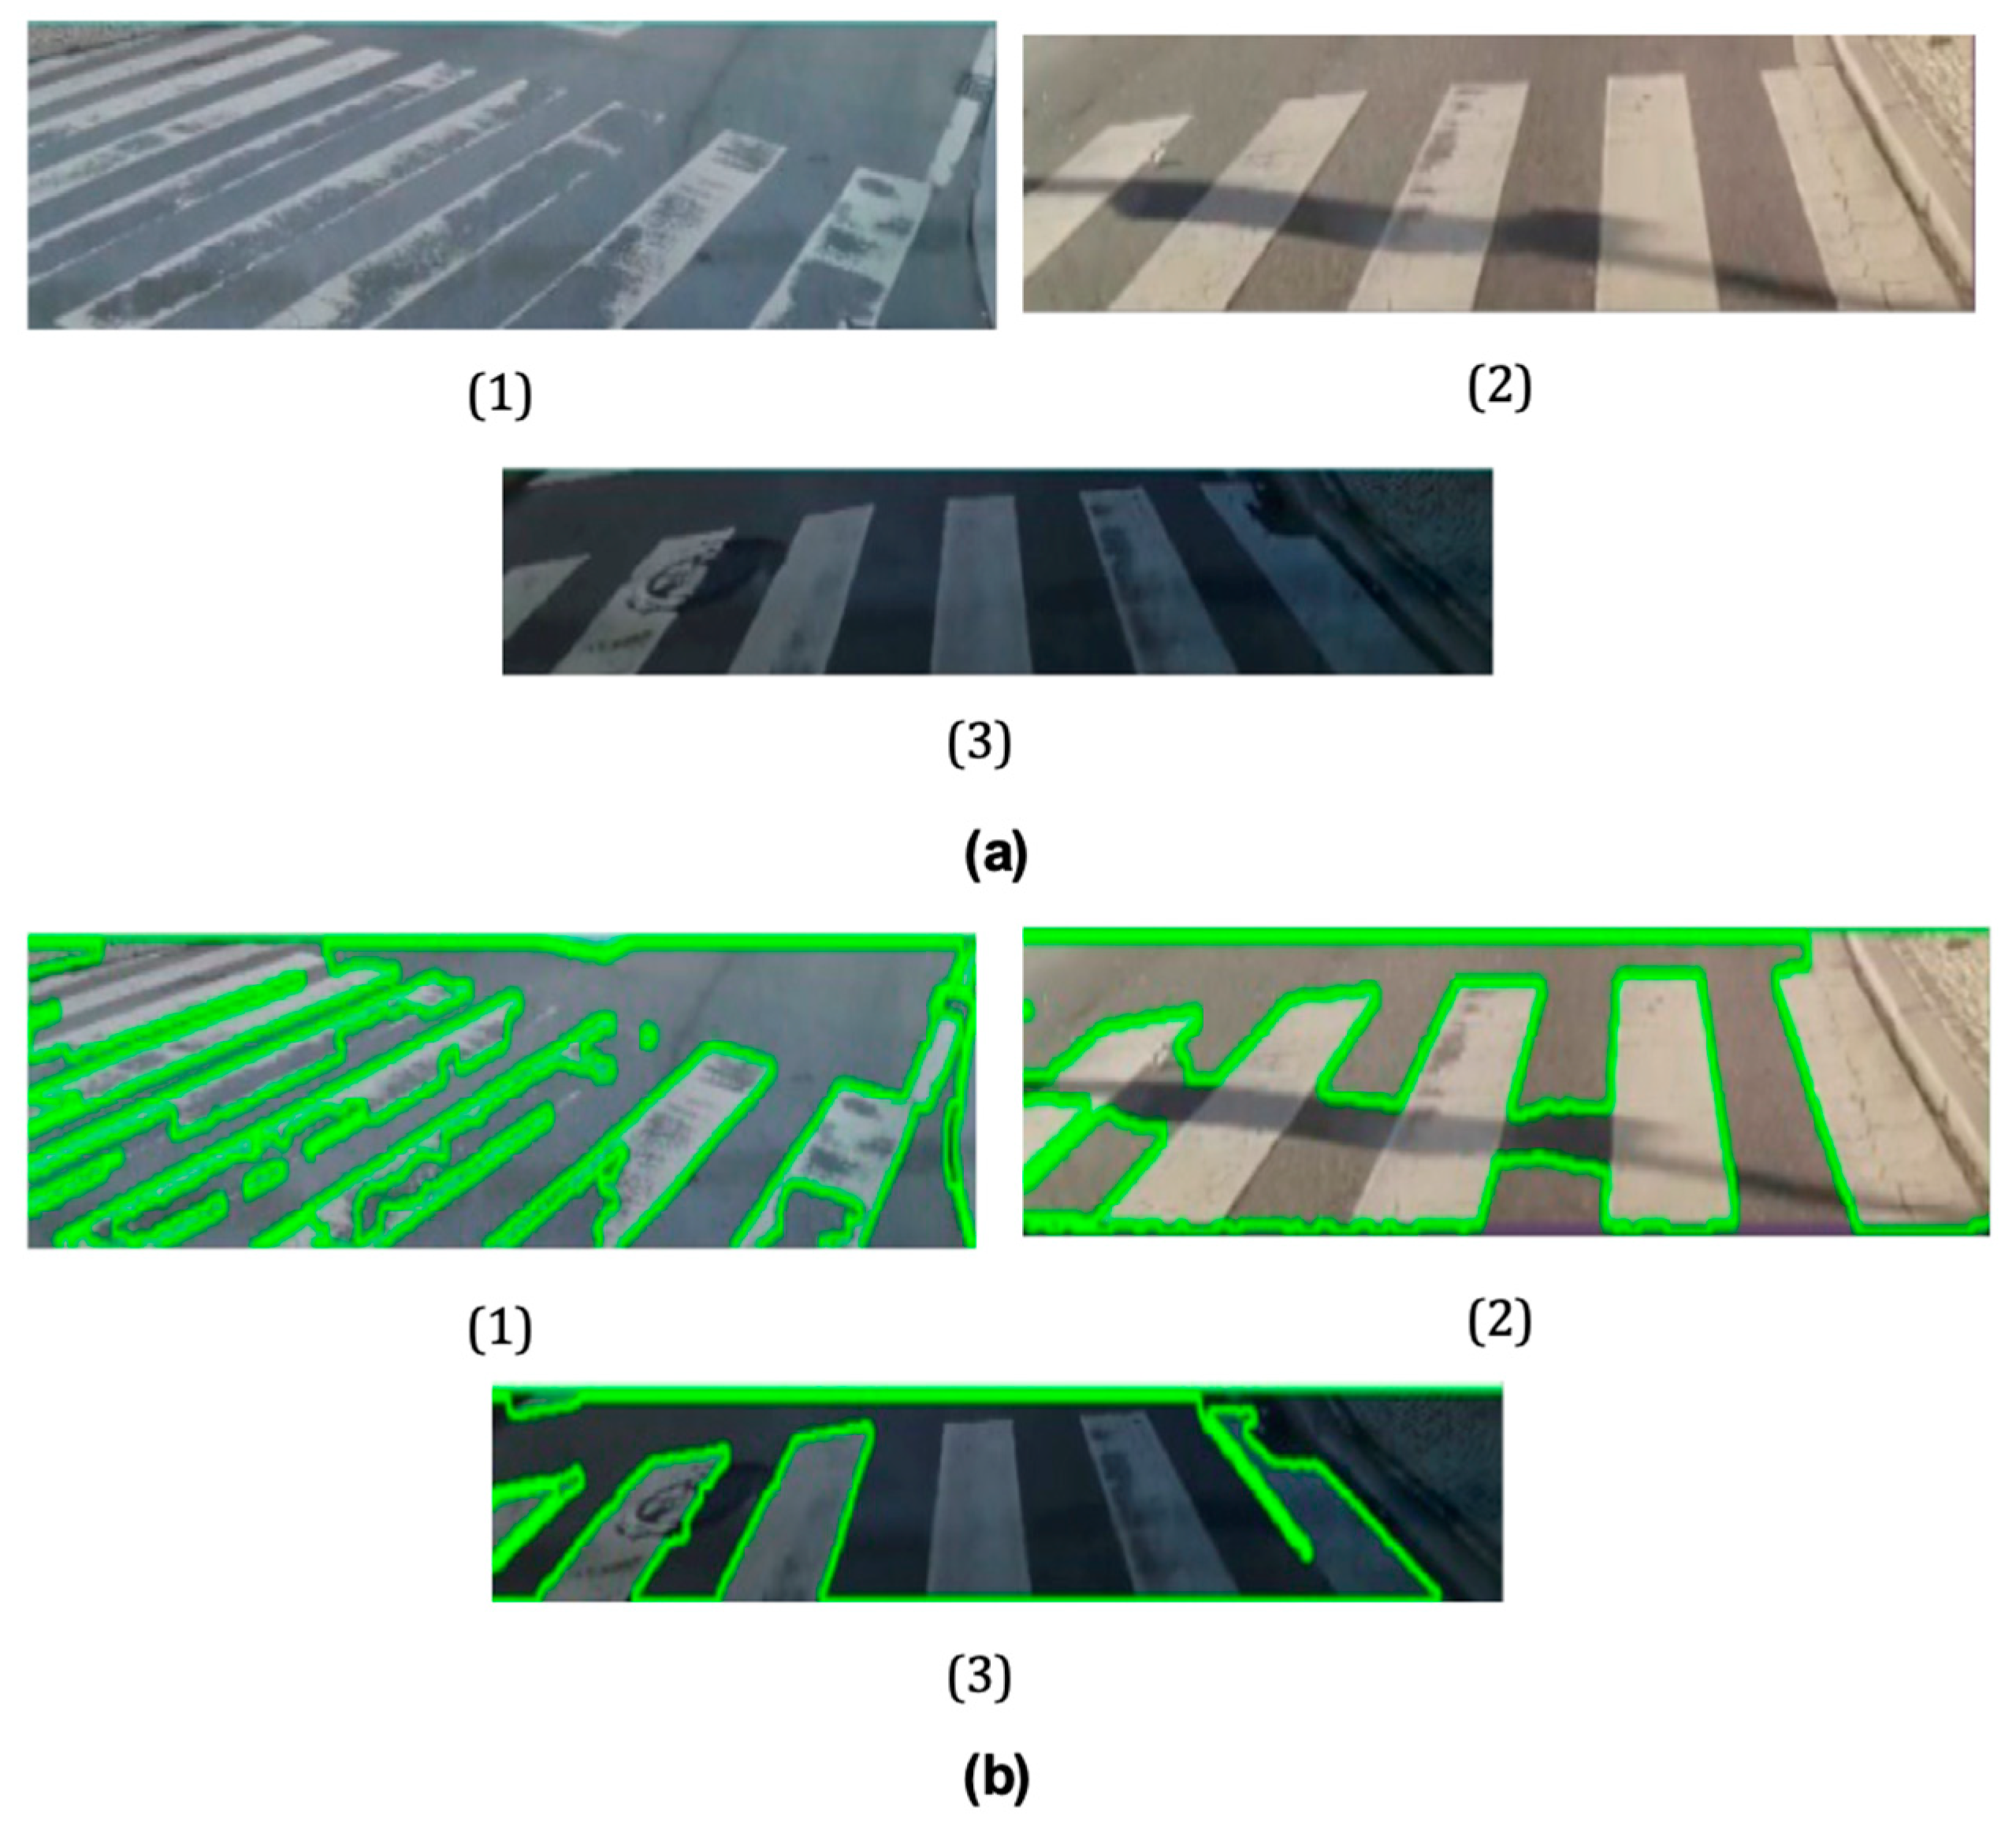
Although the results obtained so far with this approach show that it can be an effective solution when applied in a real-life scenario, there were some difficulties in identifying the state of disrepair of some crosswalks. Although this difficulty may be partly related to the quality of the camera used, the excessive brightness of the environment and even the interference of shadows from different elements projected onto the crosswalks proved to be the main problem with this approach. Figure 13 shows some situations that illustrate the problems encountered. Figure 13a(1–3) show the bounding boxes of different crosswalks detected by the YOLOv4-tiny model. Figure 13b(1–3) show the result of using the Adaptive Threshold method to determine the degradation state of each of them.
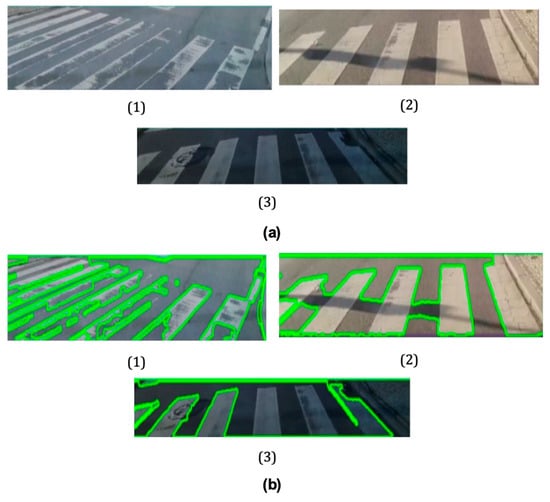
Figure 13.
Examples of Adaptive Threshold detection: (a) Bounding boxes of three crosswalks (1)–(3) detected by the YOLOv4-tiny model; (b) Result of using the Adaptive Threshold method to determine the degradation state of the three crosswalks (1)–(3).
Note that in Figure 13b(1), contour detection produced the expected output, indicating the locations of the degraded areas. In the case of Figure 13b(2,3), the result was not as expected. In these figures, it is possible to see places where the technique fails to delineate the crosswalk in a way that makes it possible to calculate its degree of degradation. For example, in Figure 13b(2), the shadow cast on the pavement has influenced the definition of the boundaries of its elements, thus affecting the result obtained. In the case of Figure 13b(3), the application of the technique failed to detect some of the pedestrian crossings. To study the influence of shadows on the previous results, this approach was tested during the day when the shadows of possible trees, buildings, or other urban elements were not directly on the crosswalks. Some of the results are shown in Figure 14.

Figure 14.
Examples of Adaptive Threshold detection in scenes without shadows: (a) Example 1: detection (1), identification (2), and classification (3) process; (b) Example 2: detection (1), identification (2), and classification (3) process.
For the YOLOv4 tiny model approach presented in Section 2.2, training has been performed on the data set containing three classes of intersections. The results are given in Table 4. Although the overall mAP value is not close to that of the YOLOv4-tiny model, which was trained only to detect crosswalks and not to classify them, as shown above, there is potential for improvement with the acquisition of more images. The number of images in the “Moderate Wear” class, which totals 413, negatively affected the mAP result, highlighting the need to acquire more images of crosswalks for this class.
Table 4.
Results of the YOLOv4-tiny model for the 3-class dataset.
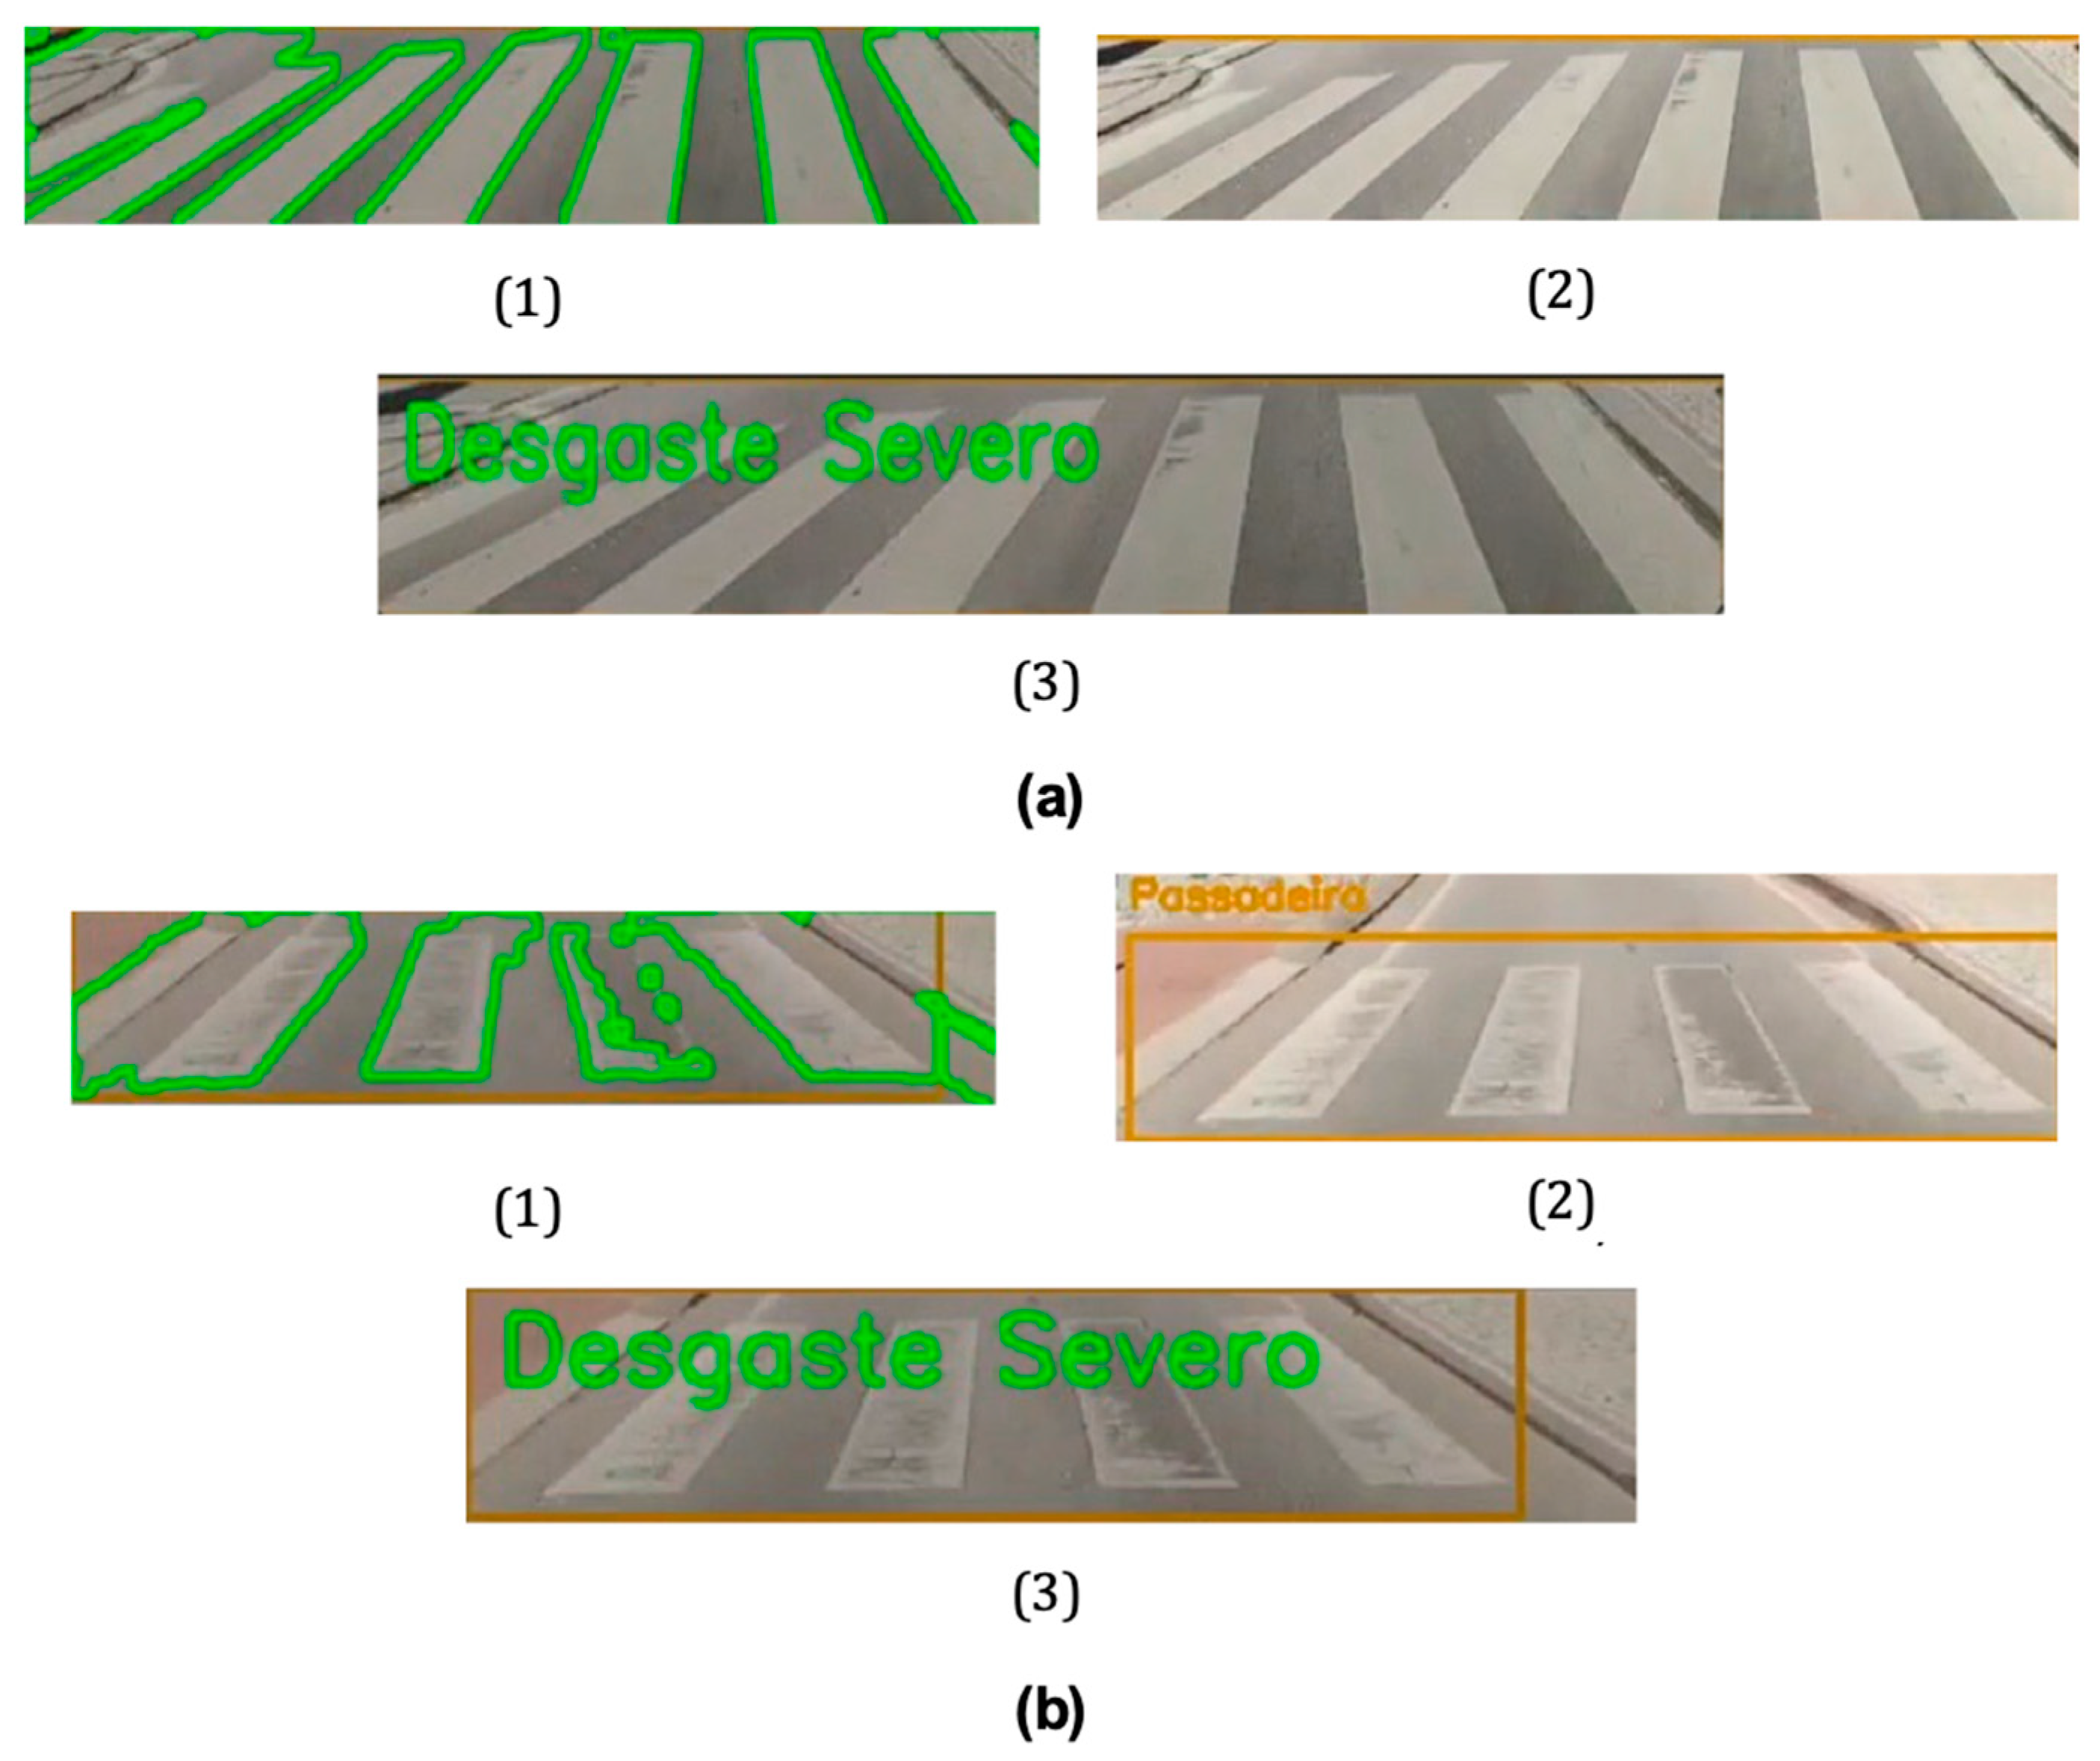
Comparing the two approaches, the use of an already classified dataset with the appropriate degradation states gives better results. These results are evidenced by the fact that this approach does not have difficulties in determining the degradation state of the crosswalks, even when the images submitted for classification have regions with shadows or excessive brightness. Figure 15 shows some comparisons between the two approaches. It is important to note that both were applied in the same context and on the same crosswalks to ensure the same evaluation conditions. Figure 15a(1,2) shows the detection using the first approach considered—YOLOv4-tiny and Adaptive Threshold. In this case, the crosswalk is classified with moderate wear due to the presence of shadows. Figure 15a(3) shows the result obtained under the same conditions but using the second approach—YOLOv4-tiny with three classes. In this case, the classification obtained corresponds to the true state of wear of this walkway, i.e., no wear. In Figure 15b, both techniques show the same classification.
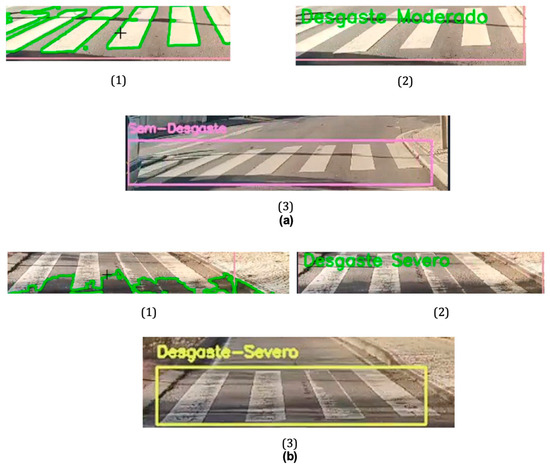
Figure 15.
Comparison between the two approaches in two different examples: Example (a): (1) and (2) shows the detection using the first approach considered—YOLOv4-tiny and Adaptive Threshold. (3) shows the result obtained under the same conditions but using the second approach—YOLOv4-tiny with three classes. Example (b): (1) and (2) shows the detection using the first approach considered—YOLOv4-tiny and Adaptive Threshold. (3) shows the result obtained under the same conditions but using the second approach—YOLOv4-tiny with three classes.
Upon examination of the outcomes, it is proposed that the second approach, as detailed in the subsequent section, be employed for the development of the prototype. This approach entails the classification of a dataset into three distinct wear classes. As evidence, this approach demonstrates efficacy in a multitude of conditions, including those with varying lighting and the presence of shadow projections on crosswalks.
3. Prototype
This section discusses developing the prototype for identifying and classifying wear and tear on crosswalks. From the outset, it is important to stress that this project represents a proof of concept and not a final product. The main aim of this section is to detail the steps involved in designing and implementing the prototype, offering a comprehensive understanding of its architecture, hardware, and software components used. Over the next few sections, the main components of the prototype and the methods used to collect and visualize the data will be discussed.
3.1. Architecture
The prototype architecture has been developed to offer an intelligent and effective solution for controlling the status of crosswalks in real time, thereby contributing to pedestrian safety and efficient urban traffic management. The core concept involves integrating Internet of Things (IoT) modules into municipal vehicles, such as garbage trucks or council cars, which regularly drive through the city’s streets. These IoT modules are equipped with cameras and Global Positioning System (GPS) devices. The data collected are transmitted to servers, where they are processed and stored in a NoSQL database, in this case, Firebase [17]. In addition, an Application Programming Interface (API) hosted on the Render platform [18] is used to facilitate communication between the IoT devices and the web application. This architecture allows for continuous, real-time collection of information on the state of the crosswalks, providing a comprehensive view of the situation throughout the city where this prototype is applied.
Figure 16 illustrates the architecture of the prototype developed, with its various components and the interconnection between them. It shows the presence of Internet of Things (IoT) devices in the vehicles, which are responsible for capturing and transmitting data on the status of crosswalks. This data transmission is carried out using data in JSON format [19]. The use of an Application Programming Interface (API) facilitates communication between the IoT device and the web application. It is also important to note that the IoT device requires an API key [20] to communicate with it, ensuring that only authorized devices can send information. The web application developed provides an accessible and interactive interface for viewing and analyzing the data collected, which is useful in a smart city context [21]. The following sections will detail the development of the various components present in the architecture presented.
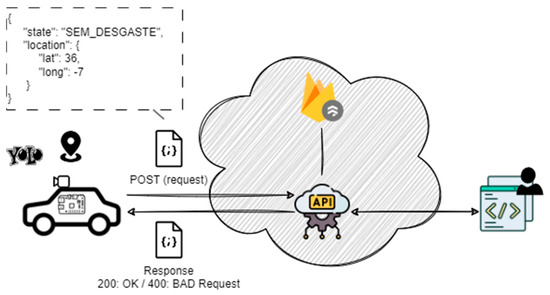
Figure 16.
The architecture of the prototype was developed.
3.2. Hardware Components
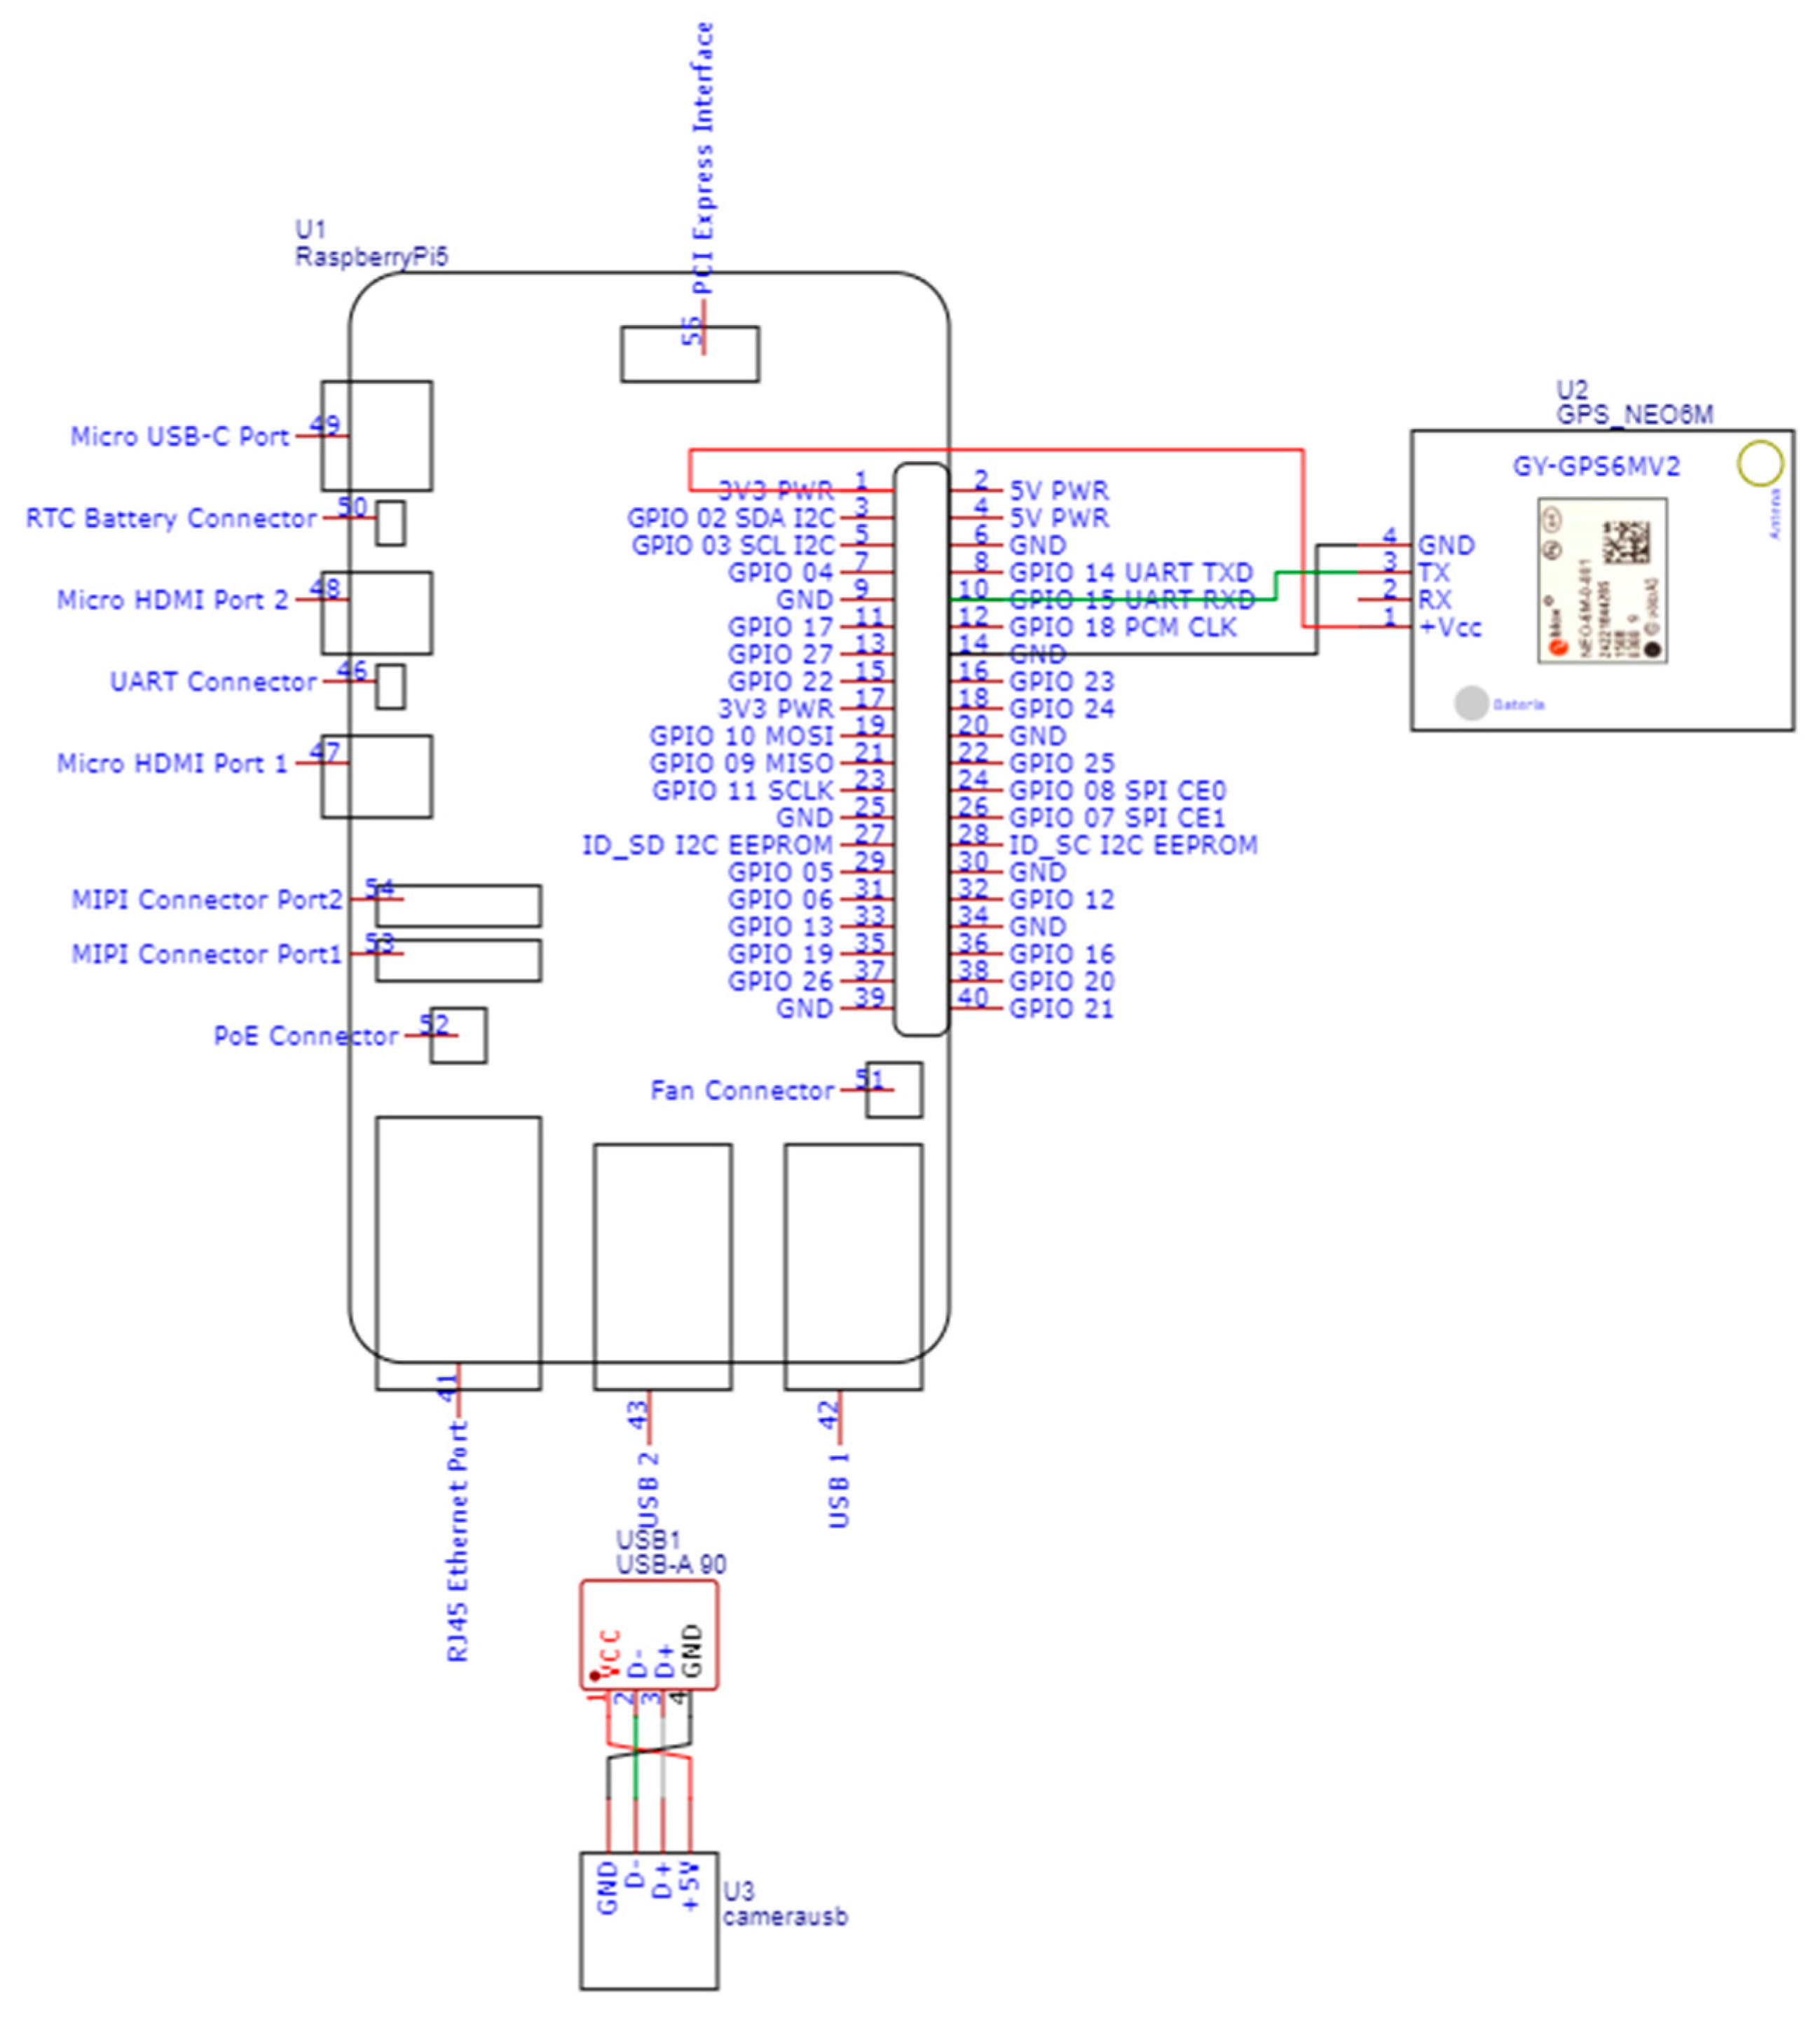
A Raspberry PI was utilized to construct the IoT device for integration into the vehicles. A Raspberry PI 5 with 8 GB RAM was employed to assess the performance of the final device [22]. Additionally, it was essential to equip the system with a GPS device, with the NEO-6M GPS model [23] being utilized in this instance. Finally, for image acquisition, it was necessary to integrate a camera, in this case, a Wide-Angle 1080 p UVC-Compliant USB Camera Module with a Metal Case [24]. To interconnect all these components, an electrical circuit was designed using the EasyEDA online tool [25]. Figure 17 shows the schematic of this electrical circuit, which includes all the components described.
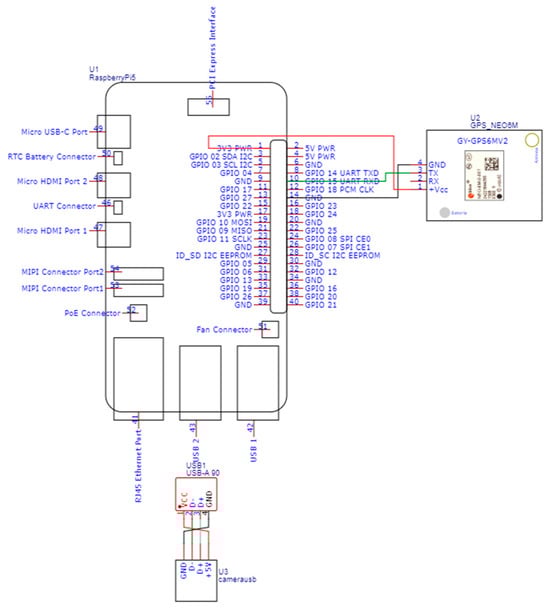
Figure 17.
Schematic of the electrical circuit of the various hardware components.
- Raspberry PI (U1)
- GPS NEO-6M (U2)
- Wide-angle 1080 p UVC-Compliant USB Camera Module with Metal Case (U3)
As previously stated, the Raspberry Pi serves as the processing core, executing the YOLOv4-tiny model to detect wear and tear on crosswalks. The GPS device is tasked with providing the precise geographical coordinates of the location of the crosswalks. The camera is responsible for capturing high-quality images of the crosswalks. The camera’s wide viewing angle allows the YOLOv4-tiny model to obtain detailed images of the surface of crosswalks, which facilitates the identification of signs of wear.
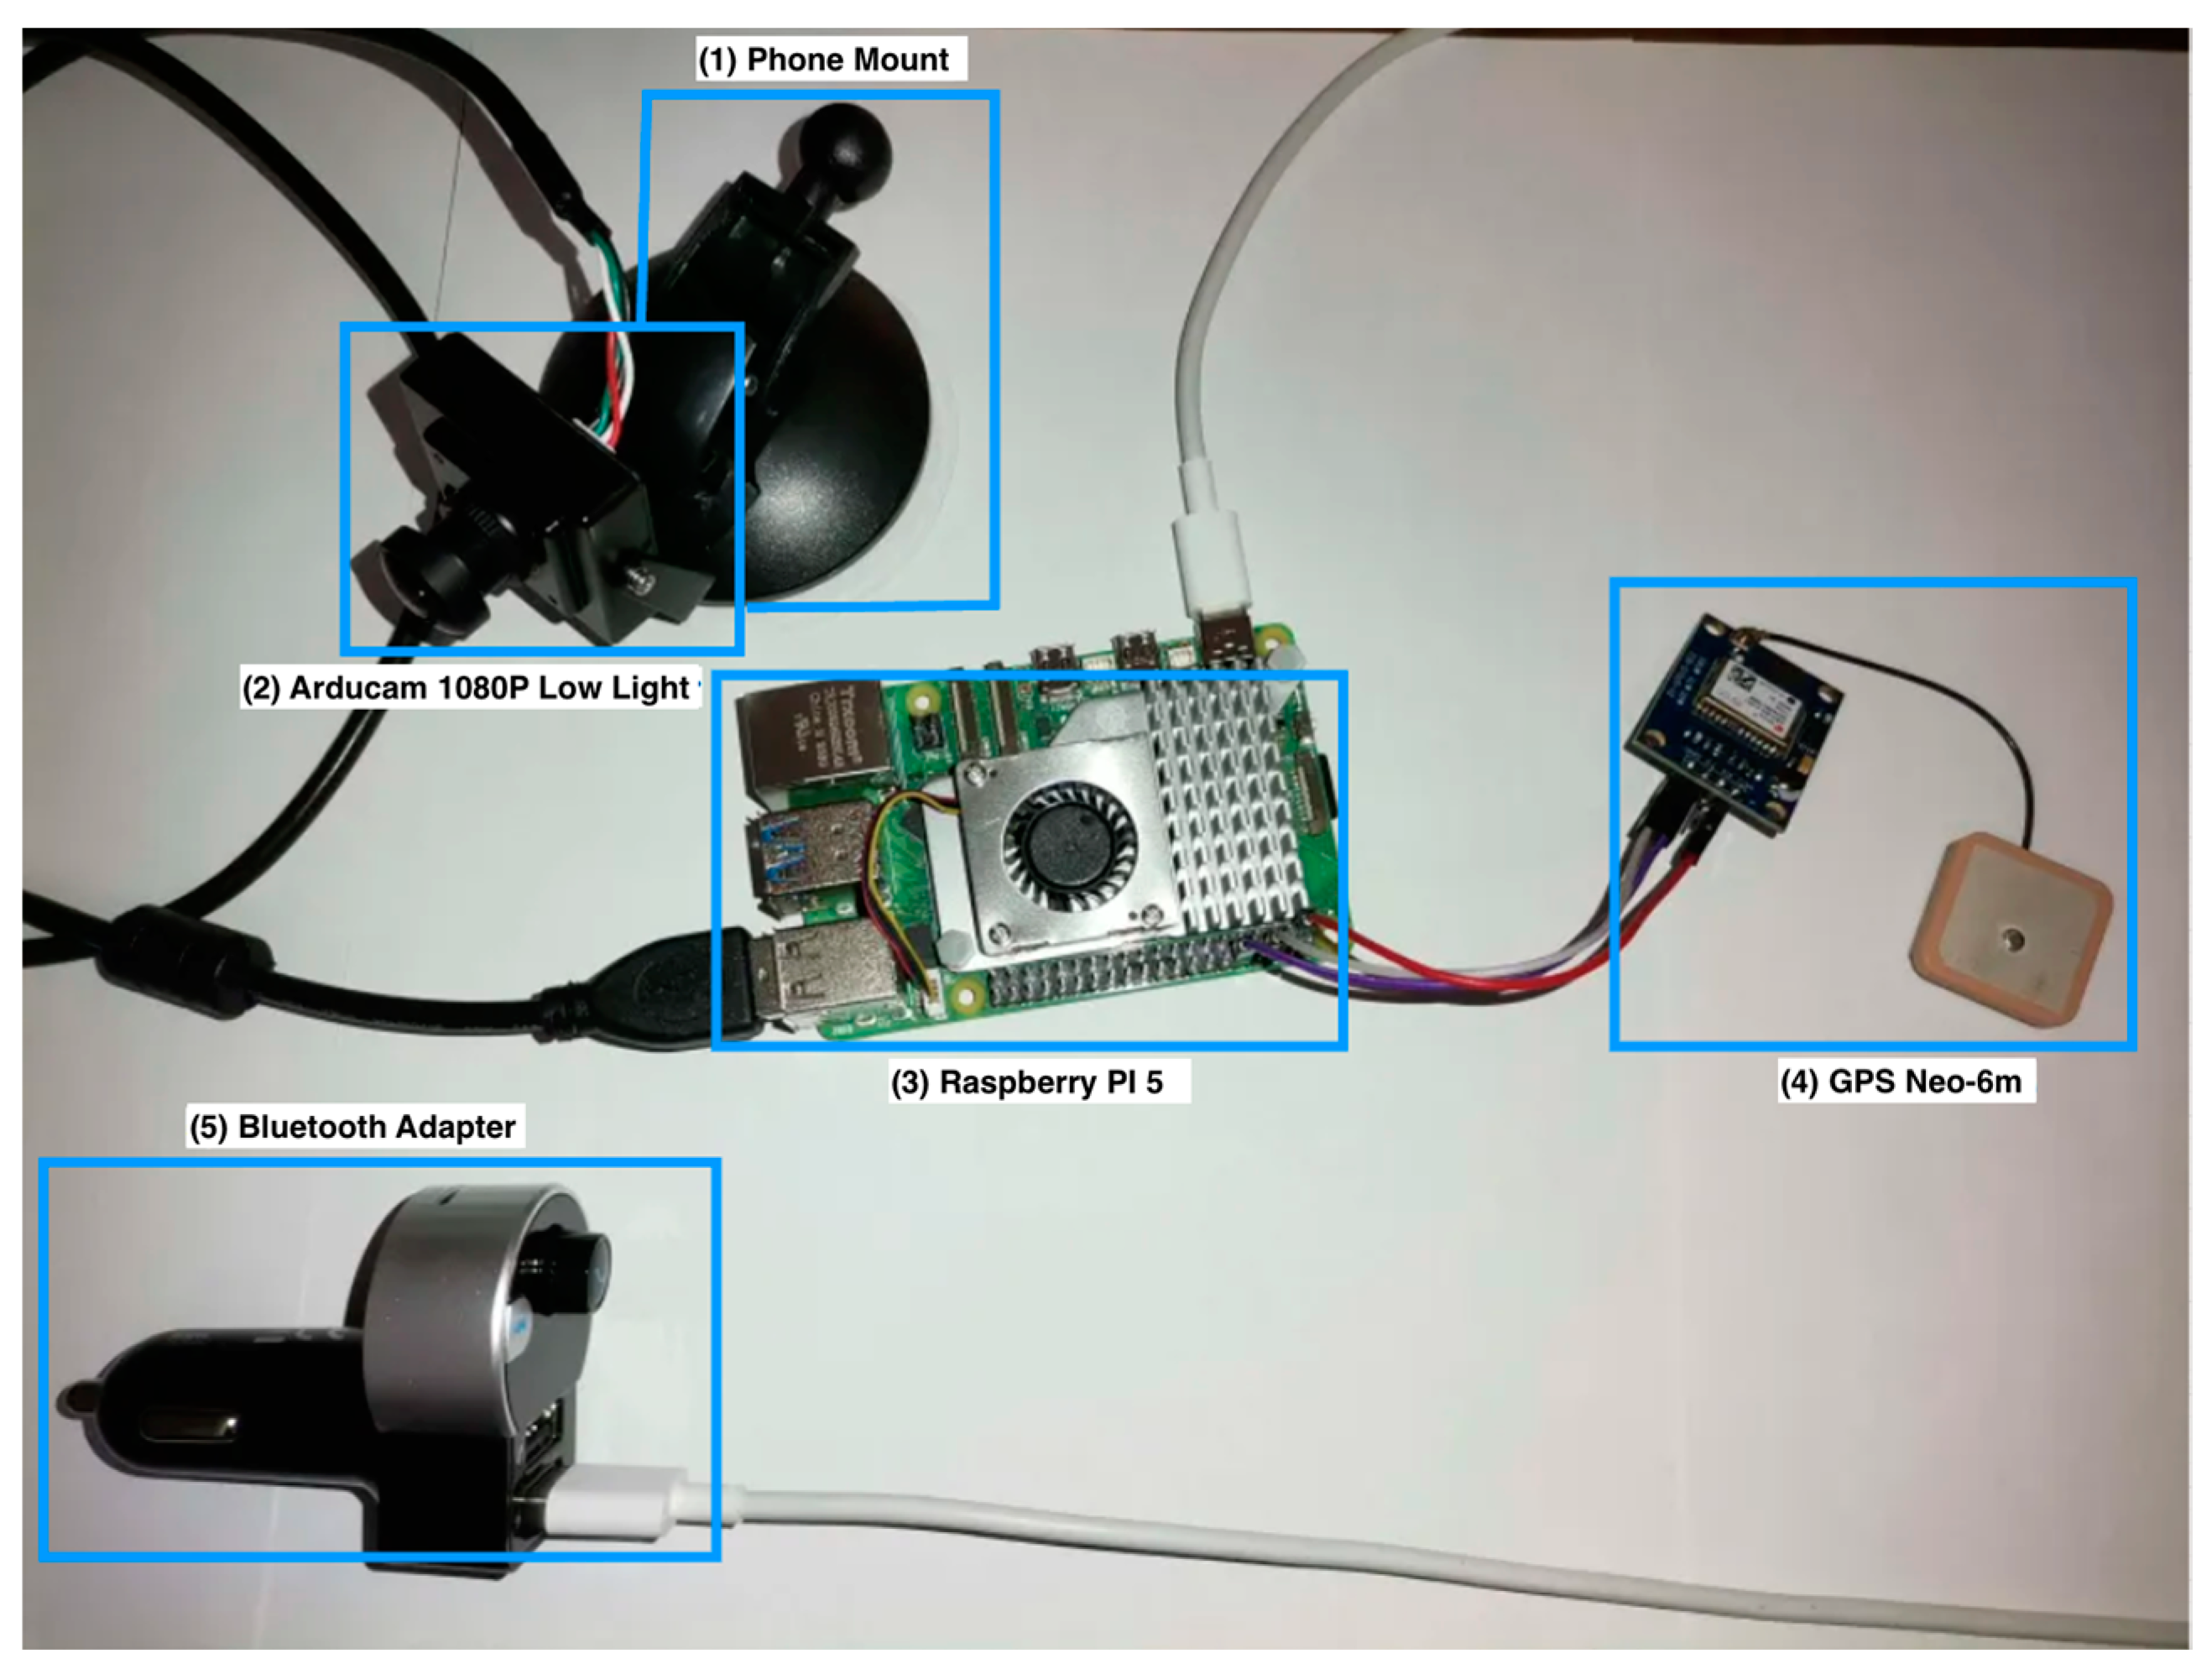
A detailed examination of Figure 17 reveals that the connection between the Raspberry Pi and the camera is established via a Universal Serial Bus (USB) port. Regarding the link between this device and the GPS module, a serial connection is employed via the Raspberry Pi’s RX and TX pins. This connection is powered by the 3.3 V and ground connections on the Raspberry Pi. Figure 18 illustrates the various hardware components developed based on the electrical circuit shown in Figure 17. This circuit employs a cell phone holder, designated as the “Phone Mount”(Figure 18 (1)), which is adapted to support the camera. Additionally, it utilizes the Arducam 1080 P Low Light (Figure 18 (2)). This is connected via a USB 2.0 port to the Raspberry PI 5 (Figure 18 (3)); the GPS module is also used, GPS Neo-6m (Figure 18 (4)), via the Raspberry PI’s RX serial port, which is connected to the GPS module’s TX port. Finally, the power supply employs a Bluetooth adapter (Figure 18 (5)), which, in addition to containing Bluetooth technology, also contains two USB ports. This is plugged into the cigarette lighter socket in the car and then connected to the Raspberry Pi via a USB-C cable. The subsequent section will describe the software solutions developed to operate this hardware.

Figure 18.
Hardware components of the prototype developed.
3.3. Software Components
This section will examine the evolution of the integrated platform, encompassing the web application, the API responsible for receiving data from the Raspberry Pi, and the database. The primary objective of this platform is to create a digital space where authorities can monitor the location of crosswalks and assess their condition.
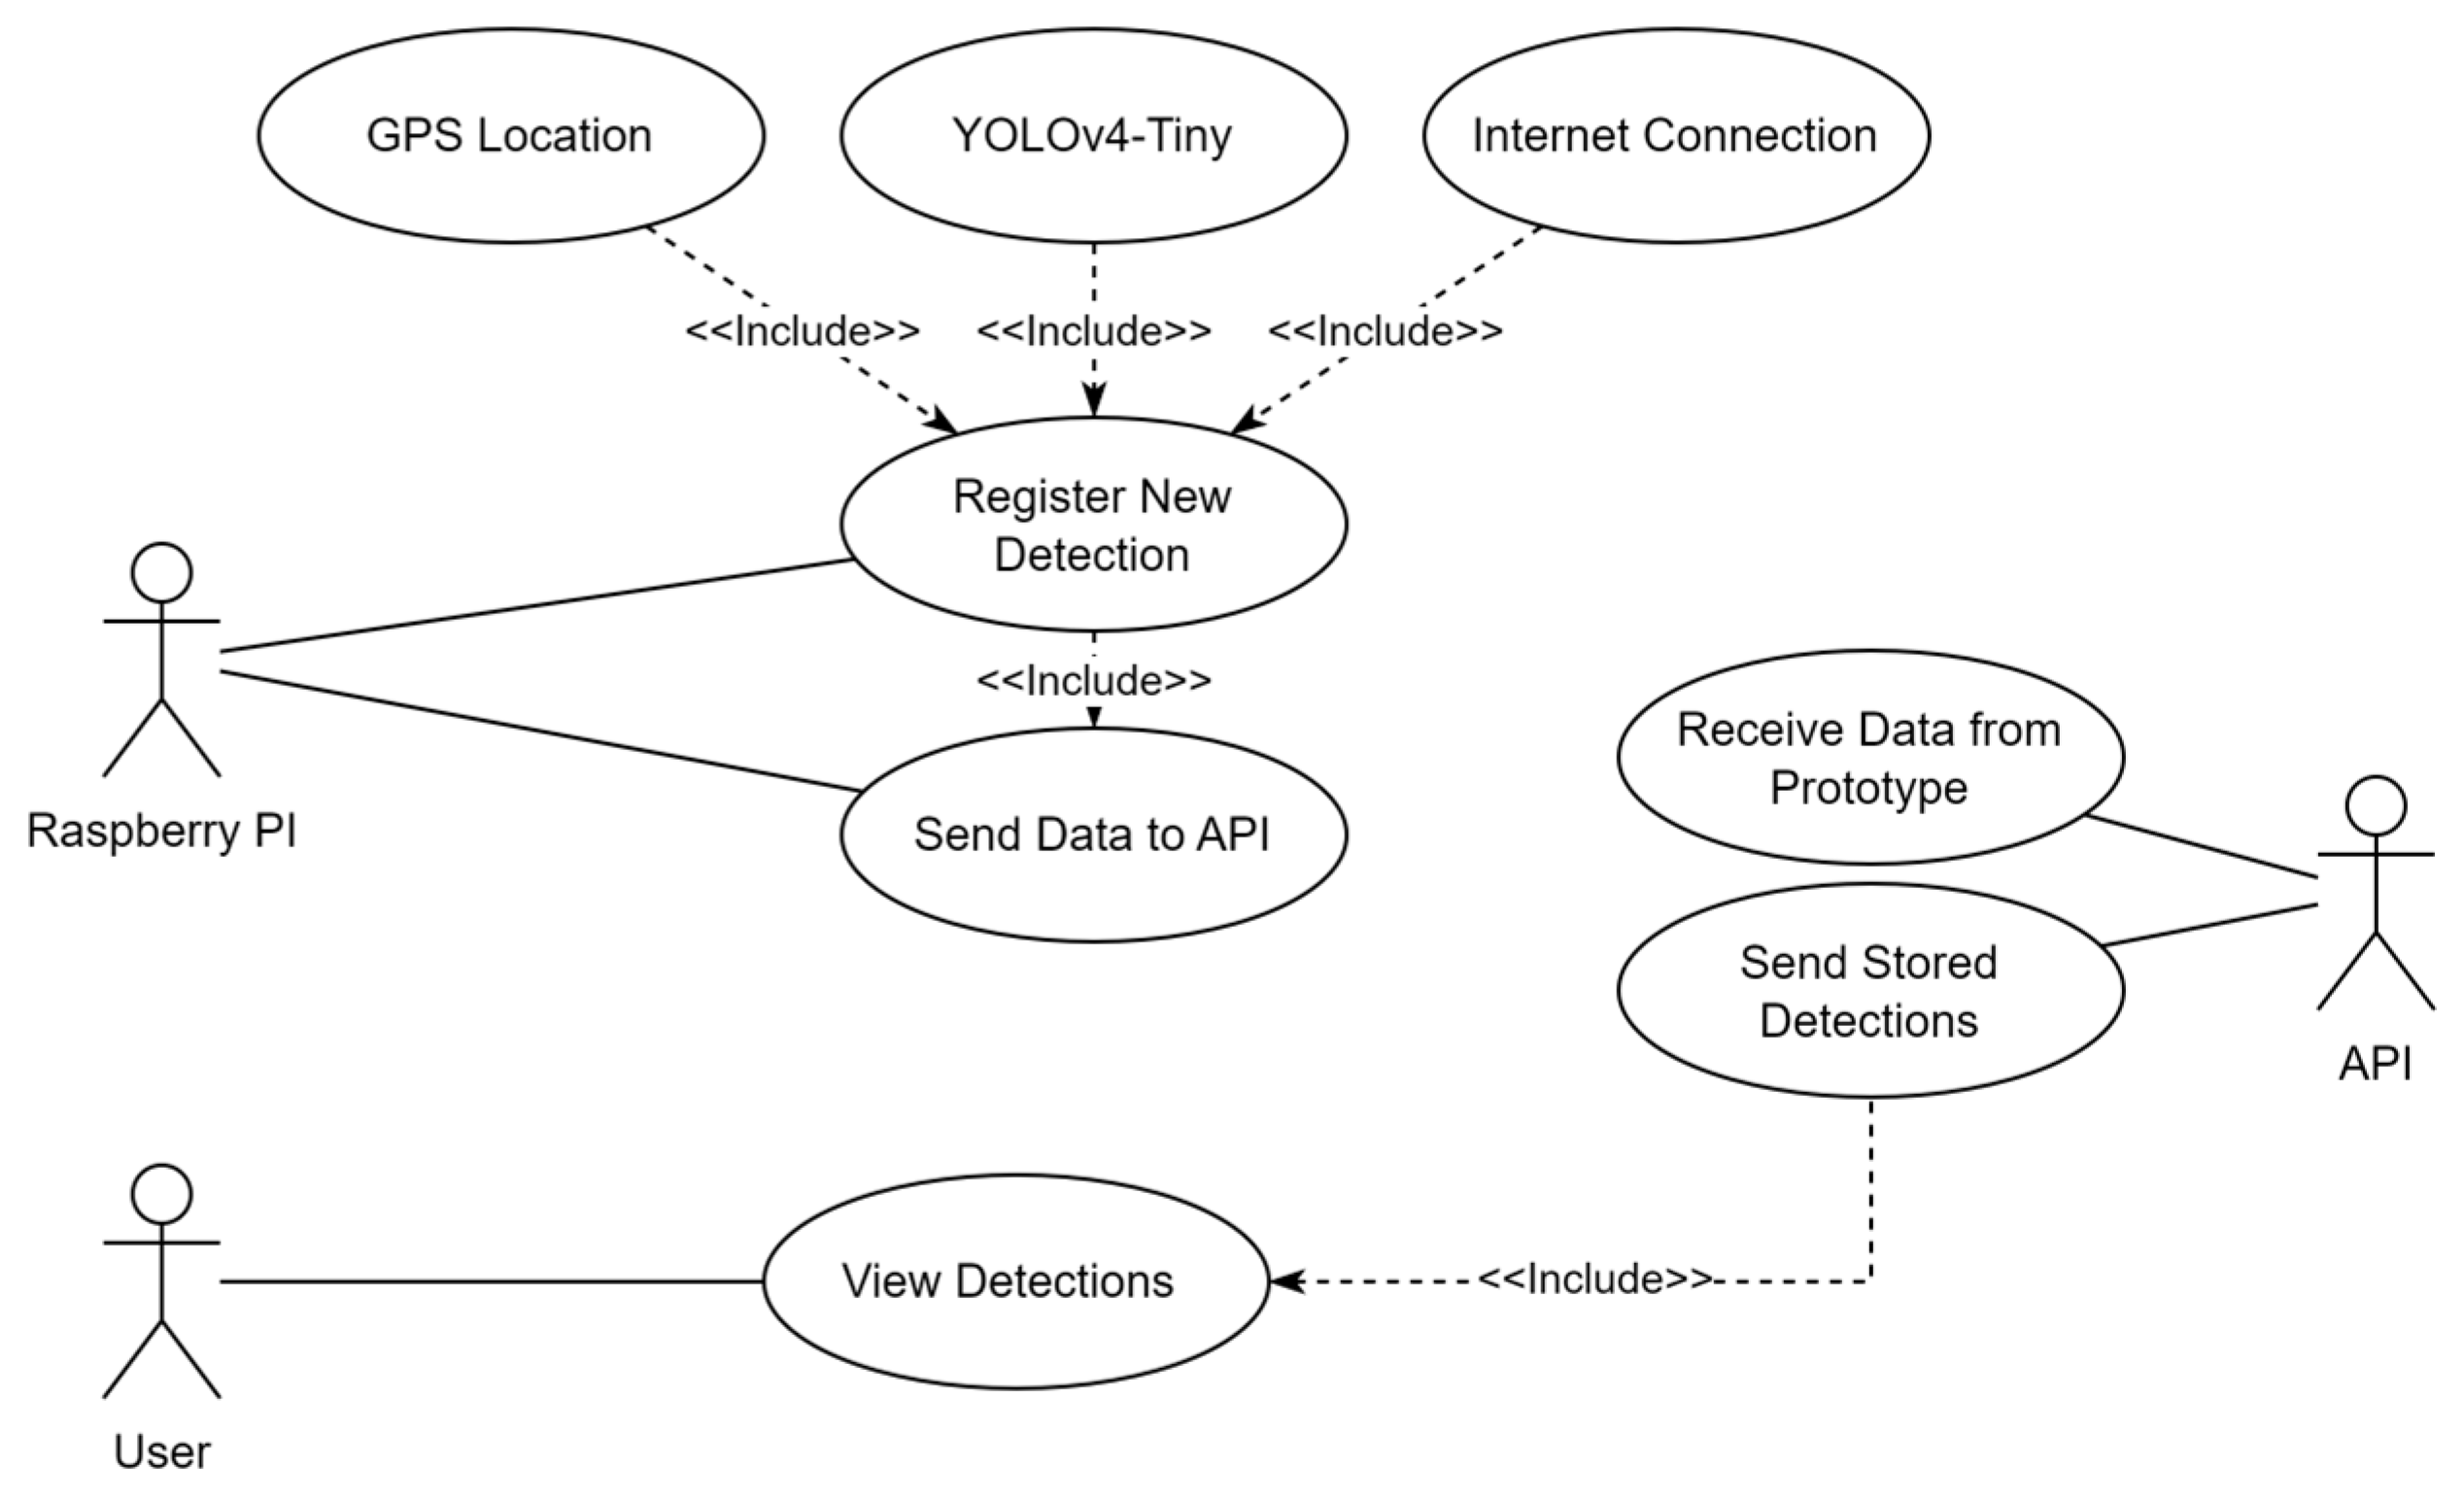
The initial section of this section delineates the necessities of the forthcoming solution. The necessities sought by the end-user on occasion delineate the characteristics and cycles present in an application [26]. These necessities can be separated into two categories: functional and non-functional. Functional necessities pertain to product characteristics that developers must implement to enable users to achieve their objectives. It is, however, of the utmost importance that they are implemented in a well-designed and clear manner so that users and even developers can comprehend the system [27]. Regarding non-functional requirements, these are related to the foundations of the system, in other words, related to the speed of the system, security, and even data integrity [28]. To understand the requirements needed to develop this application, a use case diagram was drawn, as shown in Figure 19, which was built using the Unified Modeling Language (UML) [29]. The fundamental objective of a use case is to illustrate the way a user or system can interact with another system [30].

Figure 19.
Use case diagram.
The subsequent step is to identify the functional requirements that must be fulfilled by the platform for it to be developed. For each of these requirements, the name of the interaction, its description, the preconditions, and its output must be identified.
- Register New Crosswalk Detection, which has as a precondition the current GPS location, the execution of the YOLOv4-tiny model, and an internet connection. As an output, this detection will be saved by the API, if there is internet access, otherwise it will be saved locally.
- Send Data to API, initially requires a crosswalk to be detected, and then verification of the existence of locally stored data to be sent. As an output, the information is stored in the database via the endpoint provided by the API.
- Receive Data from Prototype, for this requirement to work, a Hypertext Transfer Protocol (HTTP) request of the POST type must be made by the Raspberry PI. The output will be the information stored in the database.
- Send Stored Data requires an HTTP GET request. All the detections stored in the database will be returned.
- View Detections requires the user to be on the web application’s dashboard page. The output will show all the crosswalks registered to date and their state of disrepair.
The non-functional requirements included specifications related to the performance of the application, the construction of user-friendly and intuitive interfaces for users, and feedback on actions/errors that occurred while using the application. In terms of performance, the objective was to create a responsive, fast application capable of dealing with high loads of HTTP requests, thus preventing it from becoming unavailable for new crosswalk detections that needed to be saved.
Another requisite inherent in the solution to be developed is related to the necessity of storing the data collected. In this case, a non-relational database was utilized to store said data, yet simultaneously, its documents were required to adhere to a specific structure. This requirement ensured that the data collected could be presented correctly in the application’s user interface (UI), which was of the essence for its maintenance and efficiency. Finally, it was necessary to ensure that certain actions in the CrosSafe application could generate error messages or useful information for the user, thus facilitating their understanding of the reasons for any errors or the inability to complete a particular action.
The following sections present the implementation of the various software components of the solution, considering all the requirements described.
3.3.1. Internet of Things Device
Regarding the IoT device (Raspberry Pi), all software utilized in its operation was developed using the Python language. This is because it already offers a plethora of user-friendly libraries for incorporating object detection algorithms, such as OpenCV [31] and CVLib [32]. The entirety of this device’s operation is depicted in the flowchart in Figure 20. The sequence of actions is as follows: The YOLOv4-tiny model is loaded, followed by the GPS and camera modules, which are fundamental to the system’s operation. The device then enters a waiting loop, waiting for the model to detect a crosswalk and its wear and tear. As soon as this process takes place, the current coordinates are read via the /dev/ttyAMA0 serial port connected to the GPS module. Once the coordinates have been read, they are converted to UTF-8 encoding using the pynmea2 library [33]. The data are formatted in JSON, as expected by the API (detailed in the next section), and finally sent. It is important to note that an internet connection is essential for sending the data relating to crosswalk wear signs. In this sense, if the device loses connectivity during use and data needs to be sent, it will be stored locally.
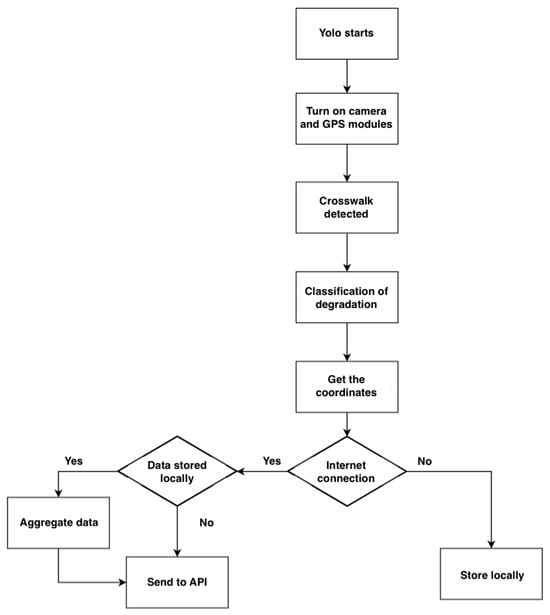
Figure 20.
Flowchart of how the Raspberry Pi works.
After each crosswalk detection, the system will ascertain the availability of local data, which will be transmitted in conjunction with the newly identified crosswalks.
3.3.2. Application Programming Interface and Database (Back-End)
The API was meticulously developed using the NodeJS language [34] in conjunction with the Fastify framework [35]. The selection of NodeJS offers considerable advantages, including its capacity to process a substantial volume of requests in an efficient manner and its scalability.
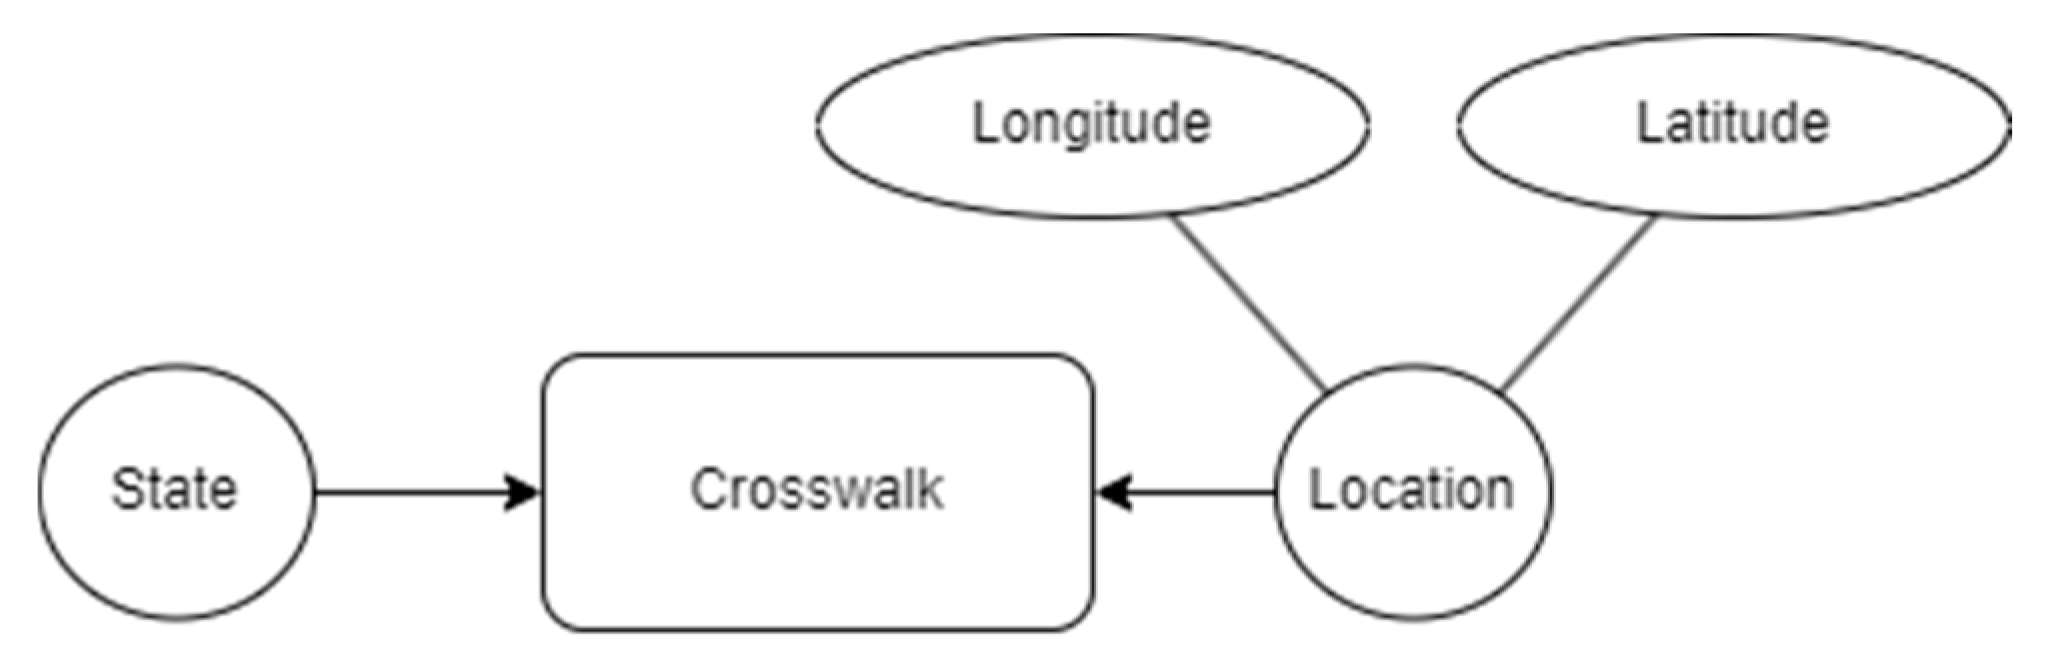
For information storage, we opted to utilize Firestore, a NoSQL database provided by Firebase [36]. This database offers a flexible and scalable structure for storing and querying data in real time. Initially, a Structured Query Language (SQL) database was employed, specifically PostgreSQL via PrismaDB [37]. This offered Object Relational Mapping (ORM), facilitating the creation of tables using Typescript for various types of databases. However, as the project progressed, it was replaced by Firebase due to its straightforward integration and the fact that this solution is relatively simple and does not necessitate complex configurations. All the endpoints were implemented based on [38,39]. The Postman platform [40] was used to test all the endpoints locally. Figure 21 illustrates the document structure required to register a new crosswalk detection. These documents contain a state field, which indicates the level of degradation of the crosswalk, along with the location field, which includes the longitude and latitude of the captured GPS coordinates.

Figure 21.
Structure required in documents.
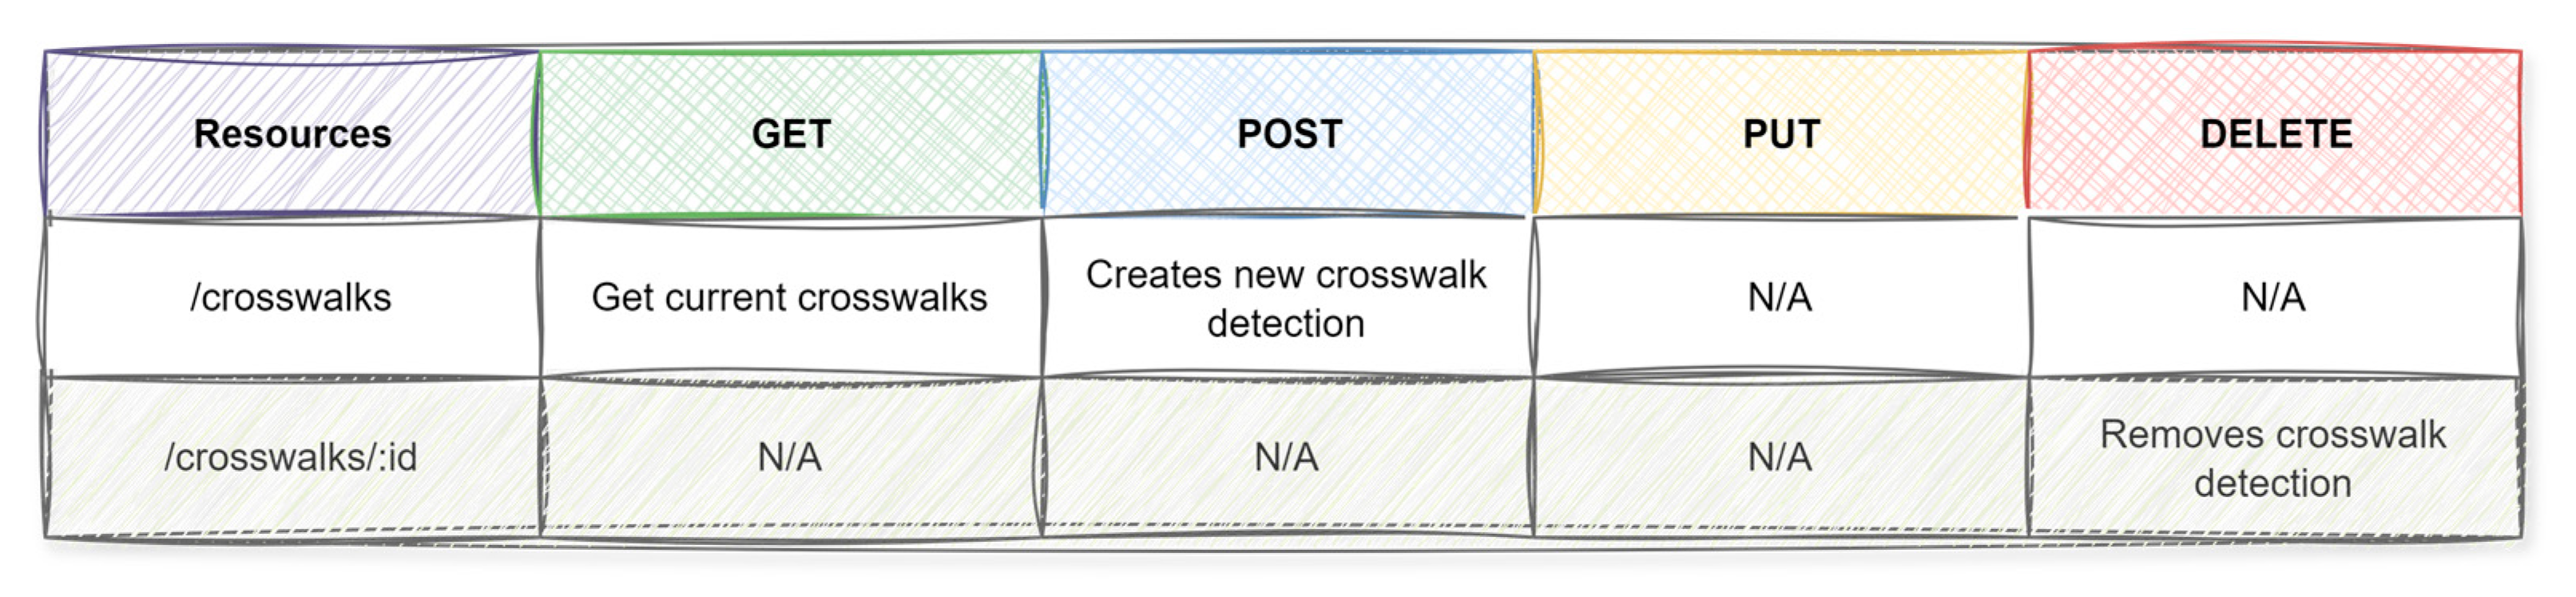
The endpoints configured in this API are shown in Figure 22, which illustrates that only three HTTP methods are utilized: GET, POST, and DELETE. The /crosswalks endpoint is employed to both retrieve all crosswalk detections and to register a new one. The /crosswalks/:id endpoint enables the removal of specific detection.
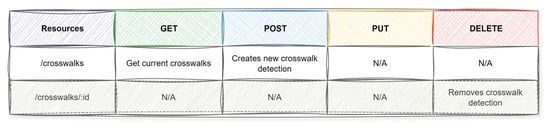
Figure 22.
Endpoints on the API.
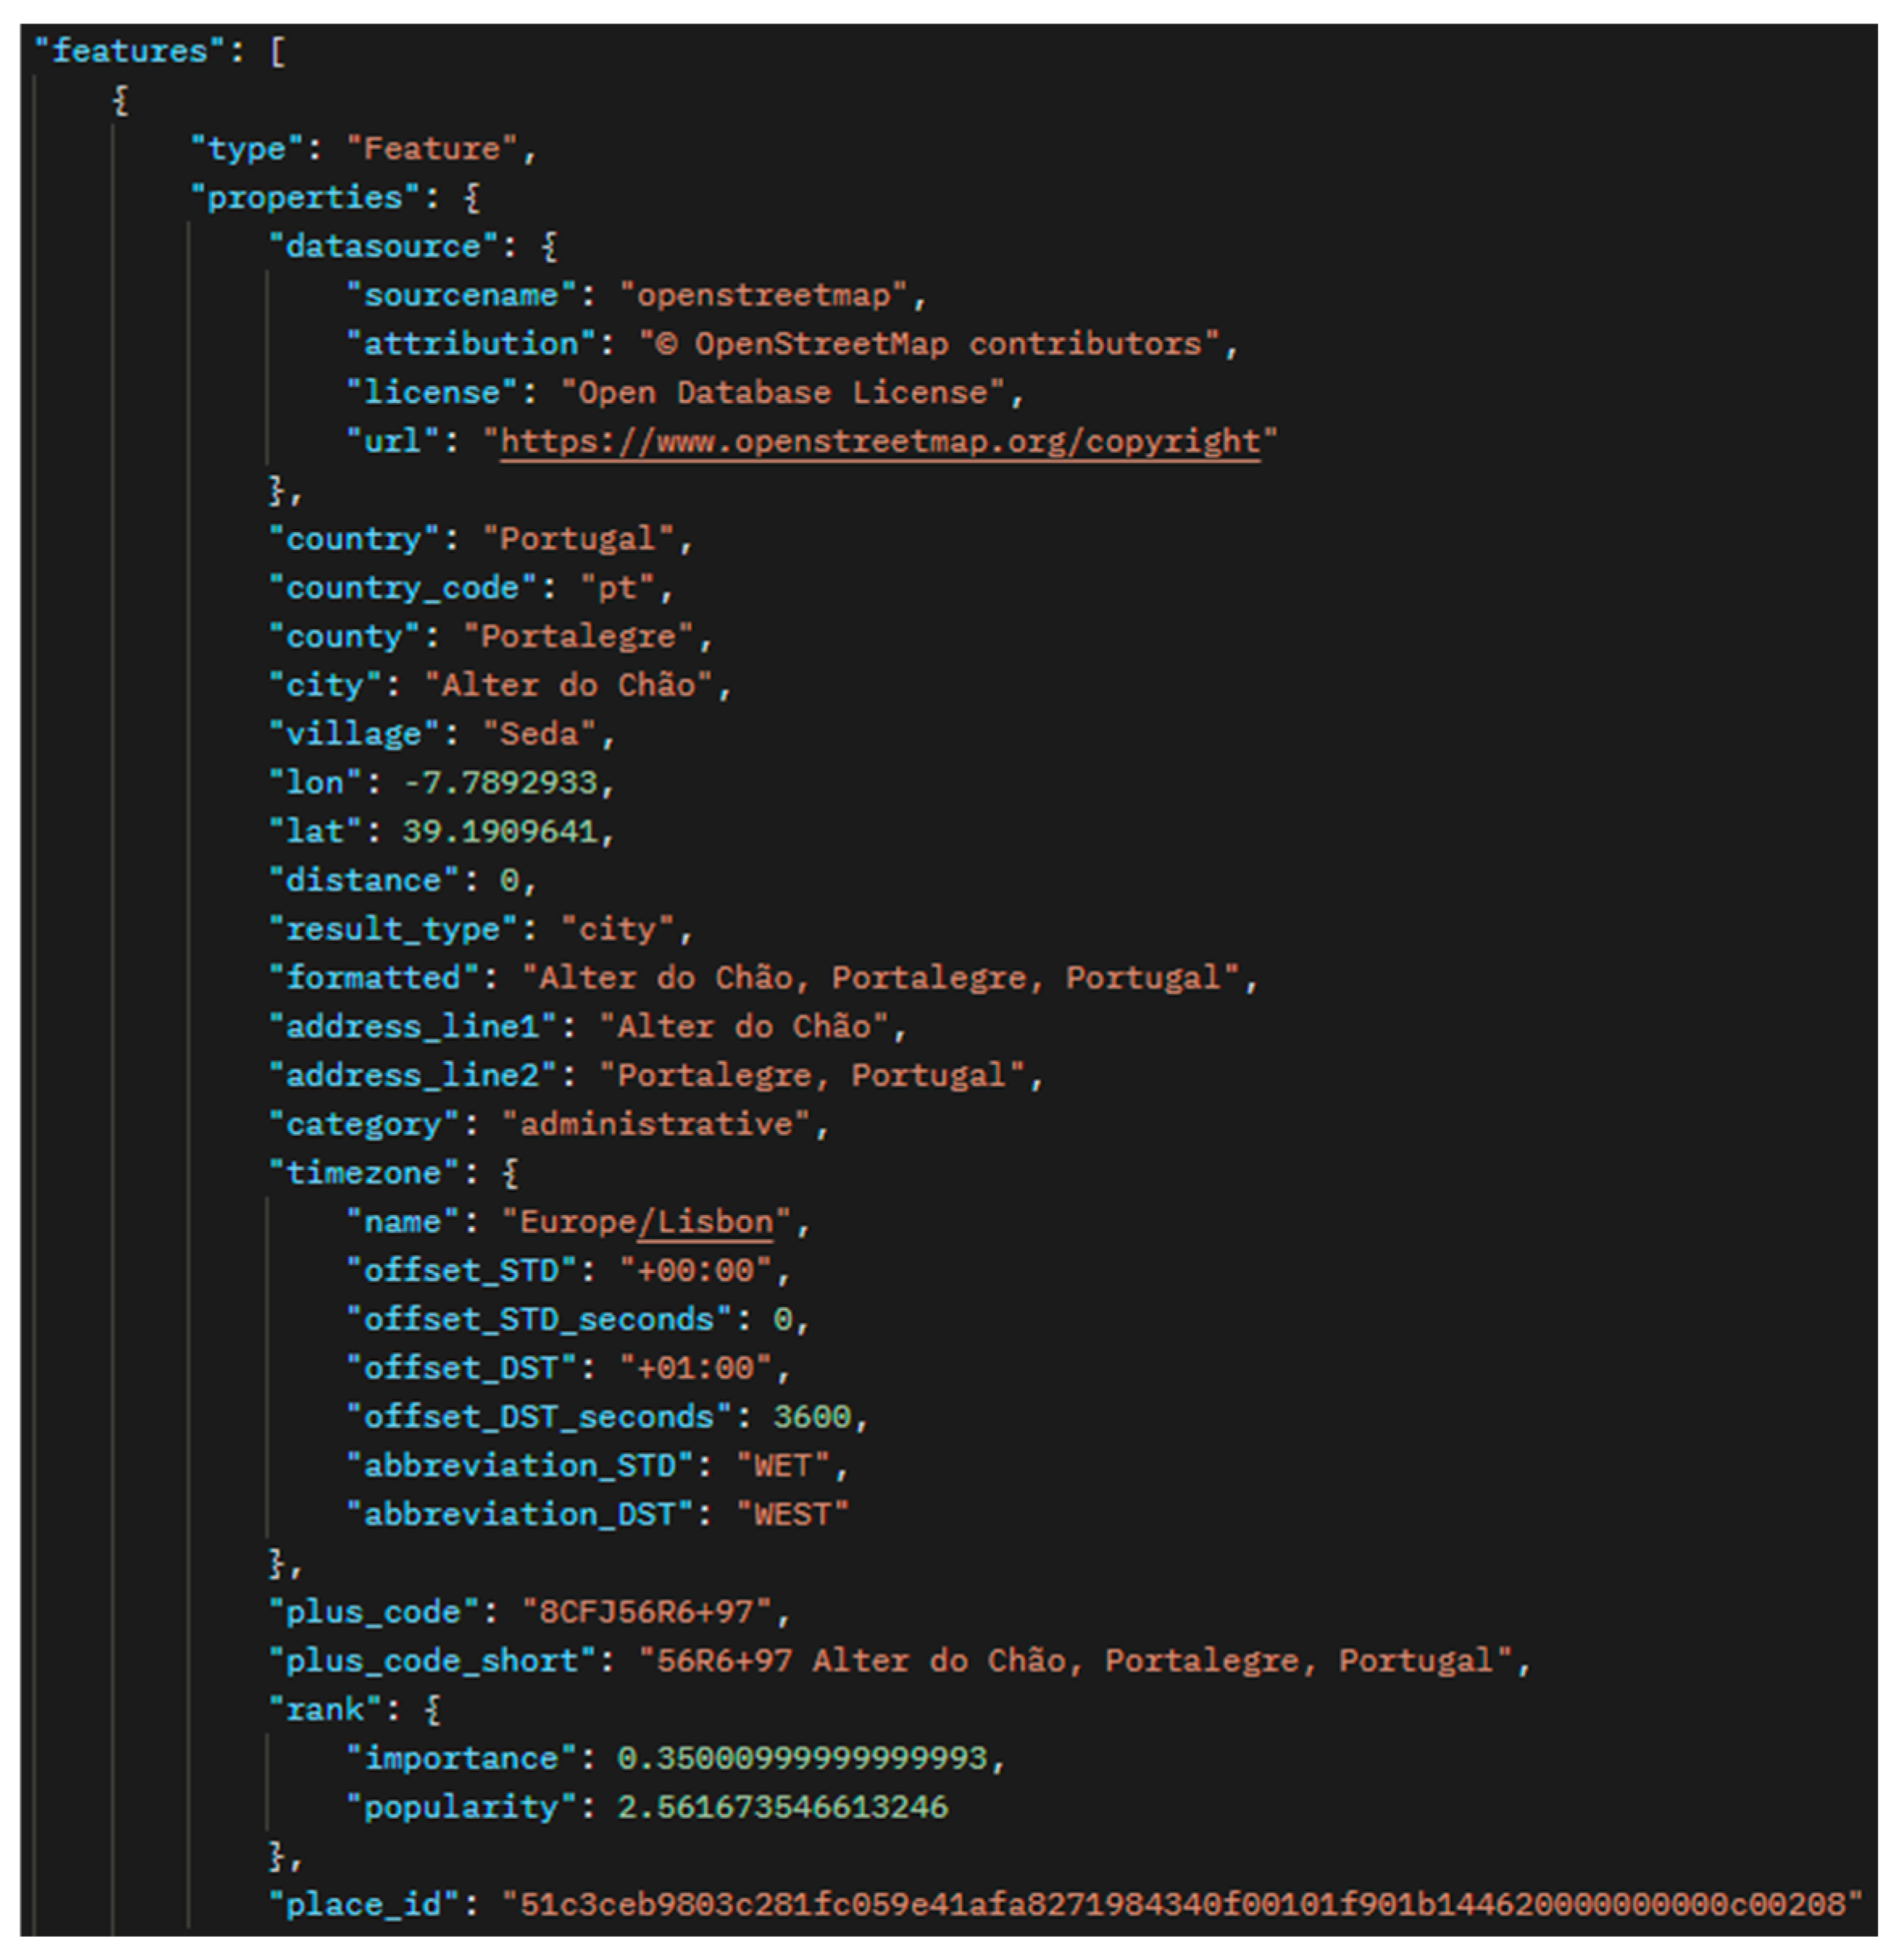
During the development of the API, it was discovered that the location field, which contains the coordinates of the location where a crosswalk was detected, could be utilized to obtain the name of the city. This information facilitated the user’s ability to identify the location of the crosswalk. To achieve this, the Geoapify API [41] was employed through its reverse geocode endpoint, which returned the name of the city using the coordinates. Figure 23 illustrates an exemplary response from this API.
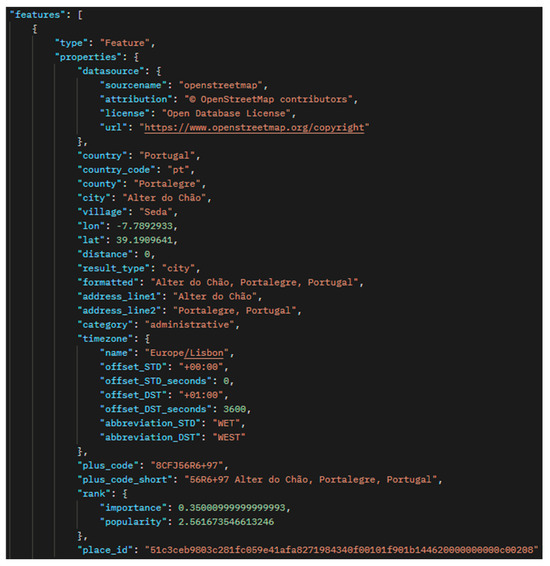
Figure 23.
Example of a response from the Geoapify API.
Figure 24 illustrates the sequence diagram between the various components of this application, from detection by the IoT device to registration in the Firebase non-relational database. An IoT device, such as a Raspberry PI, detects and classifies a crosswalk, collecting the GPS coordinates. These data are then sent to the API via the /crosswalks endpoint. The API then processes the received data and uses a reverse geocode API to transform the GPS coordinates into location information, such as the name of the city, the name of the street, and so forth.
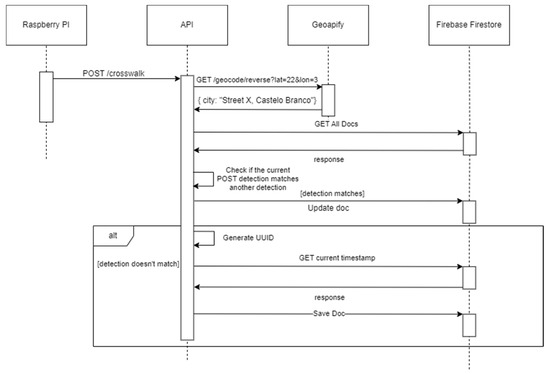
Figure 24.
Sequence diagram between API and Raspberry PI.
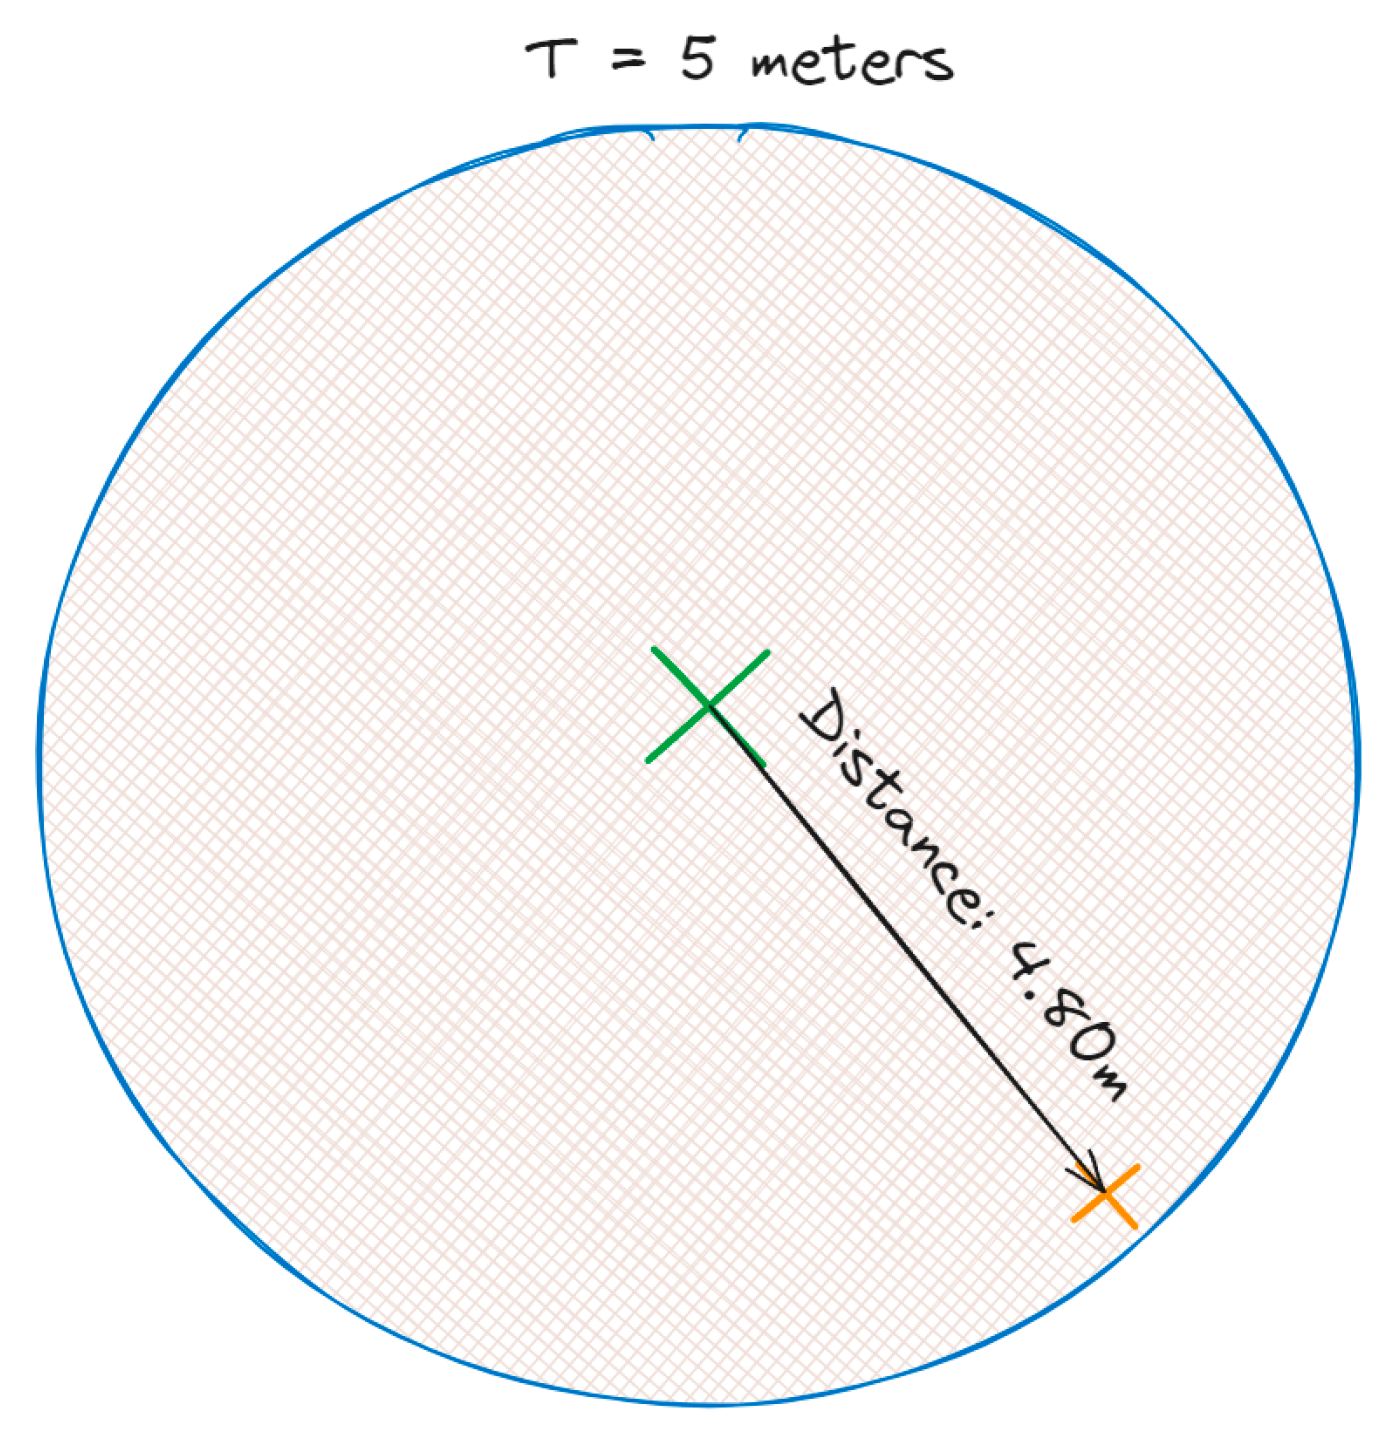
Subsequently, the API determines whether this detection is new or whether there is already a similar one in the database. To do this, it compares the new detection with the existing ones, calculating the distance between the coordinates. If the distance between the new detection and one already registered is less than a specified threshold value, the existing database entry is updated with the new information. Conversely, if the distance is greater than this threshold, the new detection is added as a separate entry in the database. This mechanism is illustrated in Figure 25, in which the threshold value set was 5 m.
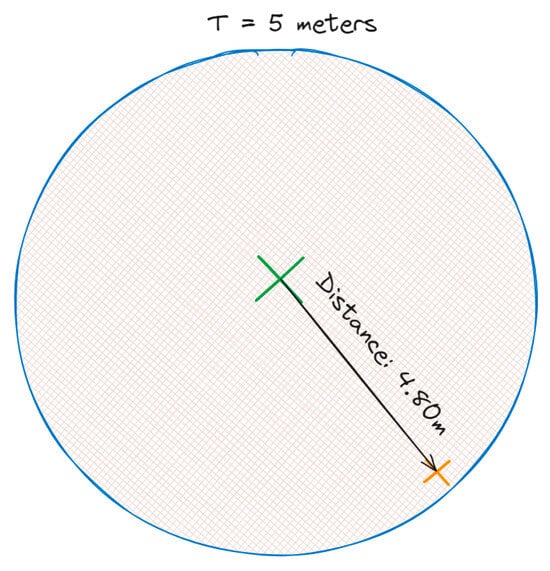
Figure 25.
Illustration of the mechanism for identifying the distance between coordinates.
The prototype thus serves to guarantee the accuracy and up-to-date status of information regarding crosswalks, thereby precluding the necessity for unnecessary repetition and maintaining the database in a state of optimal organization.
Once the API had been developed, it was necessary to deploy it. The Render platform [18] was employed for this purpose. It offers a range of services for deploying different applications. In this instance, we selected the Web Service option [42] for NodeJS.
3.3.3. Web Application (Front-End)
The “CrosSafe” web application was developed using the ReactJS framework [43] with the TypeScript variant [44] to ensure a solid basis for the development and maintenance of the code. This offers the advantage of allowing static types to be defined for variables, properties, and functions, which makes error detection easier and helps to improve the quality of the code developed. Furthermore, to optimize the development flow and ensure efficient construction of the application, it was decided to integrate Vite [45] as the build tool. This tool is distinguished by its ability to provide an extremely fast development server and an optimized build pipeline. It also takes full advantage of the capabilities of modern browsers, importing ES modules directly, which results in a more agile development time and a more fluid creation experience.
About the styling of pages and components, a modern and efficient approach was adopted, combining Tailwind CSS [46] with the Shadcn UI component library [47]. Tailwind CSS provides a methodology based on utility classes, making it easier to style elements quickly and consistently. In turn, the Shadcn UI component library offers a wide variety of pre-designed and styled-components, speeding up the development process and ensuring a visually cohesive experience throughout the application.
The communication between the API and the CrosSafe application can be observed in the sequence diagram in Figure 26. This communication employs two API endpoints: the /crosswalks endpoint, which retrieves all the documents recorded in the database to date, and the /crosswalks:id endpoint, which allows a crosswalk to be marked as repaired and subsequently removed from the database.
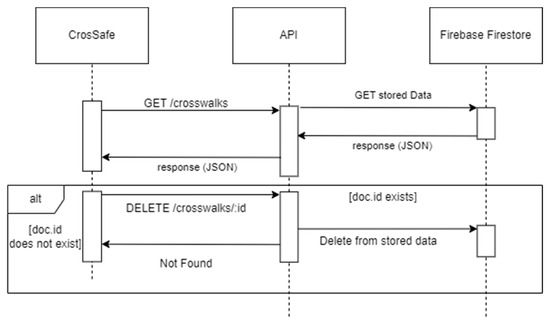
Figure 26.
Sequence diagram of communication between the API and the CrosSafe application.
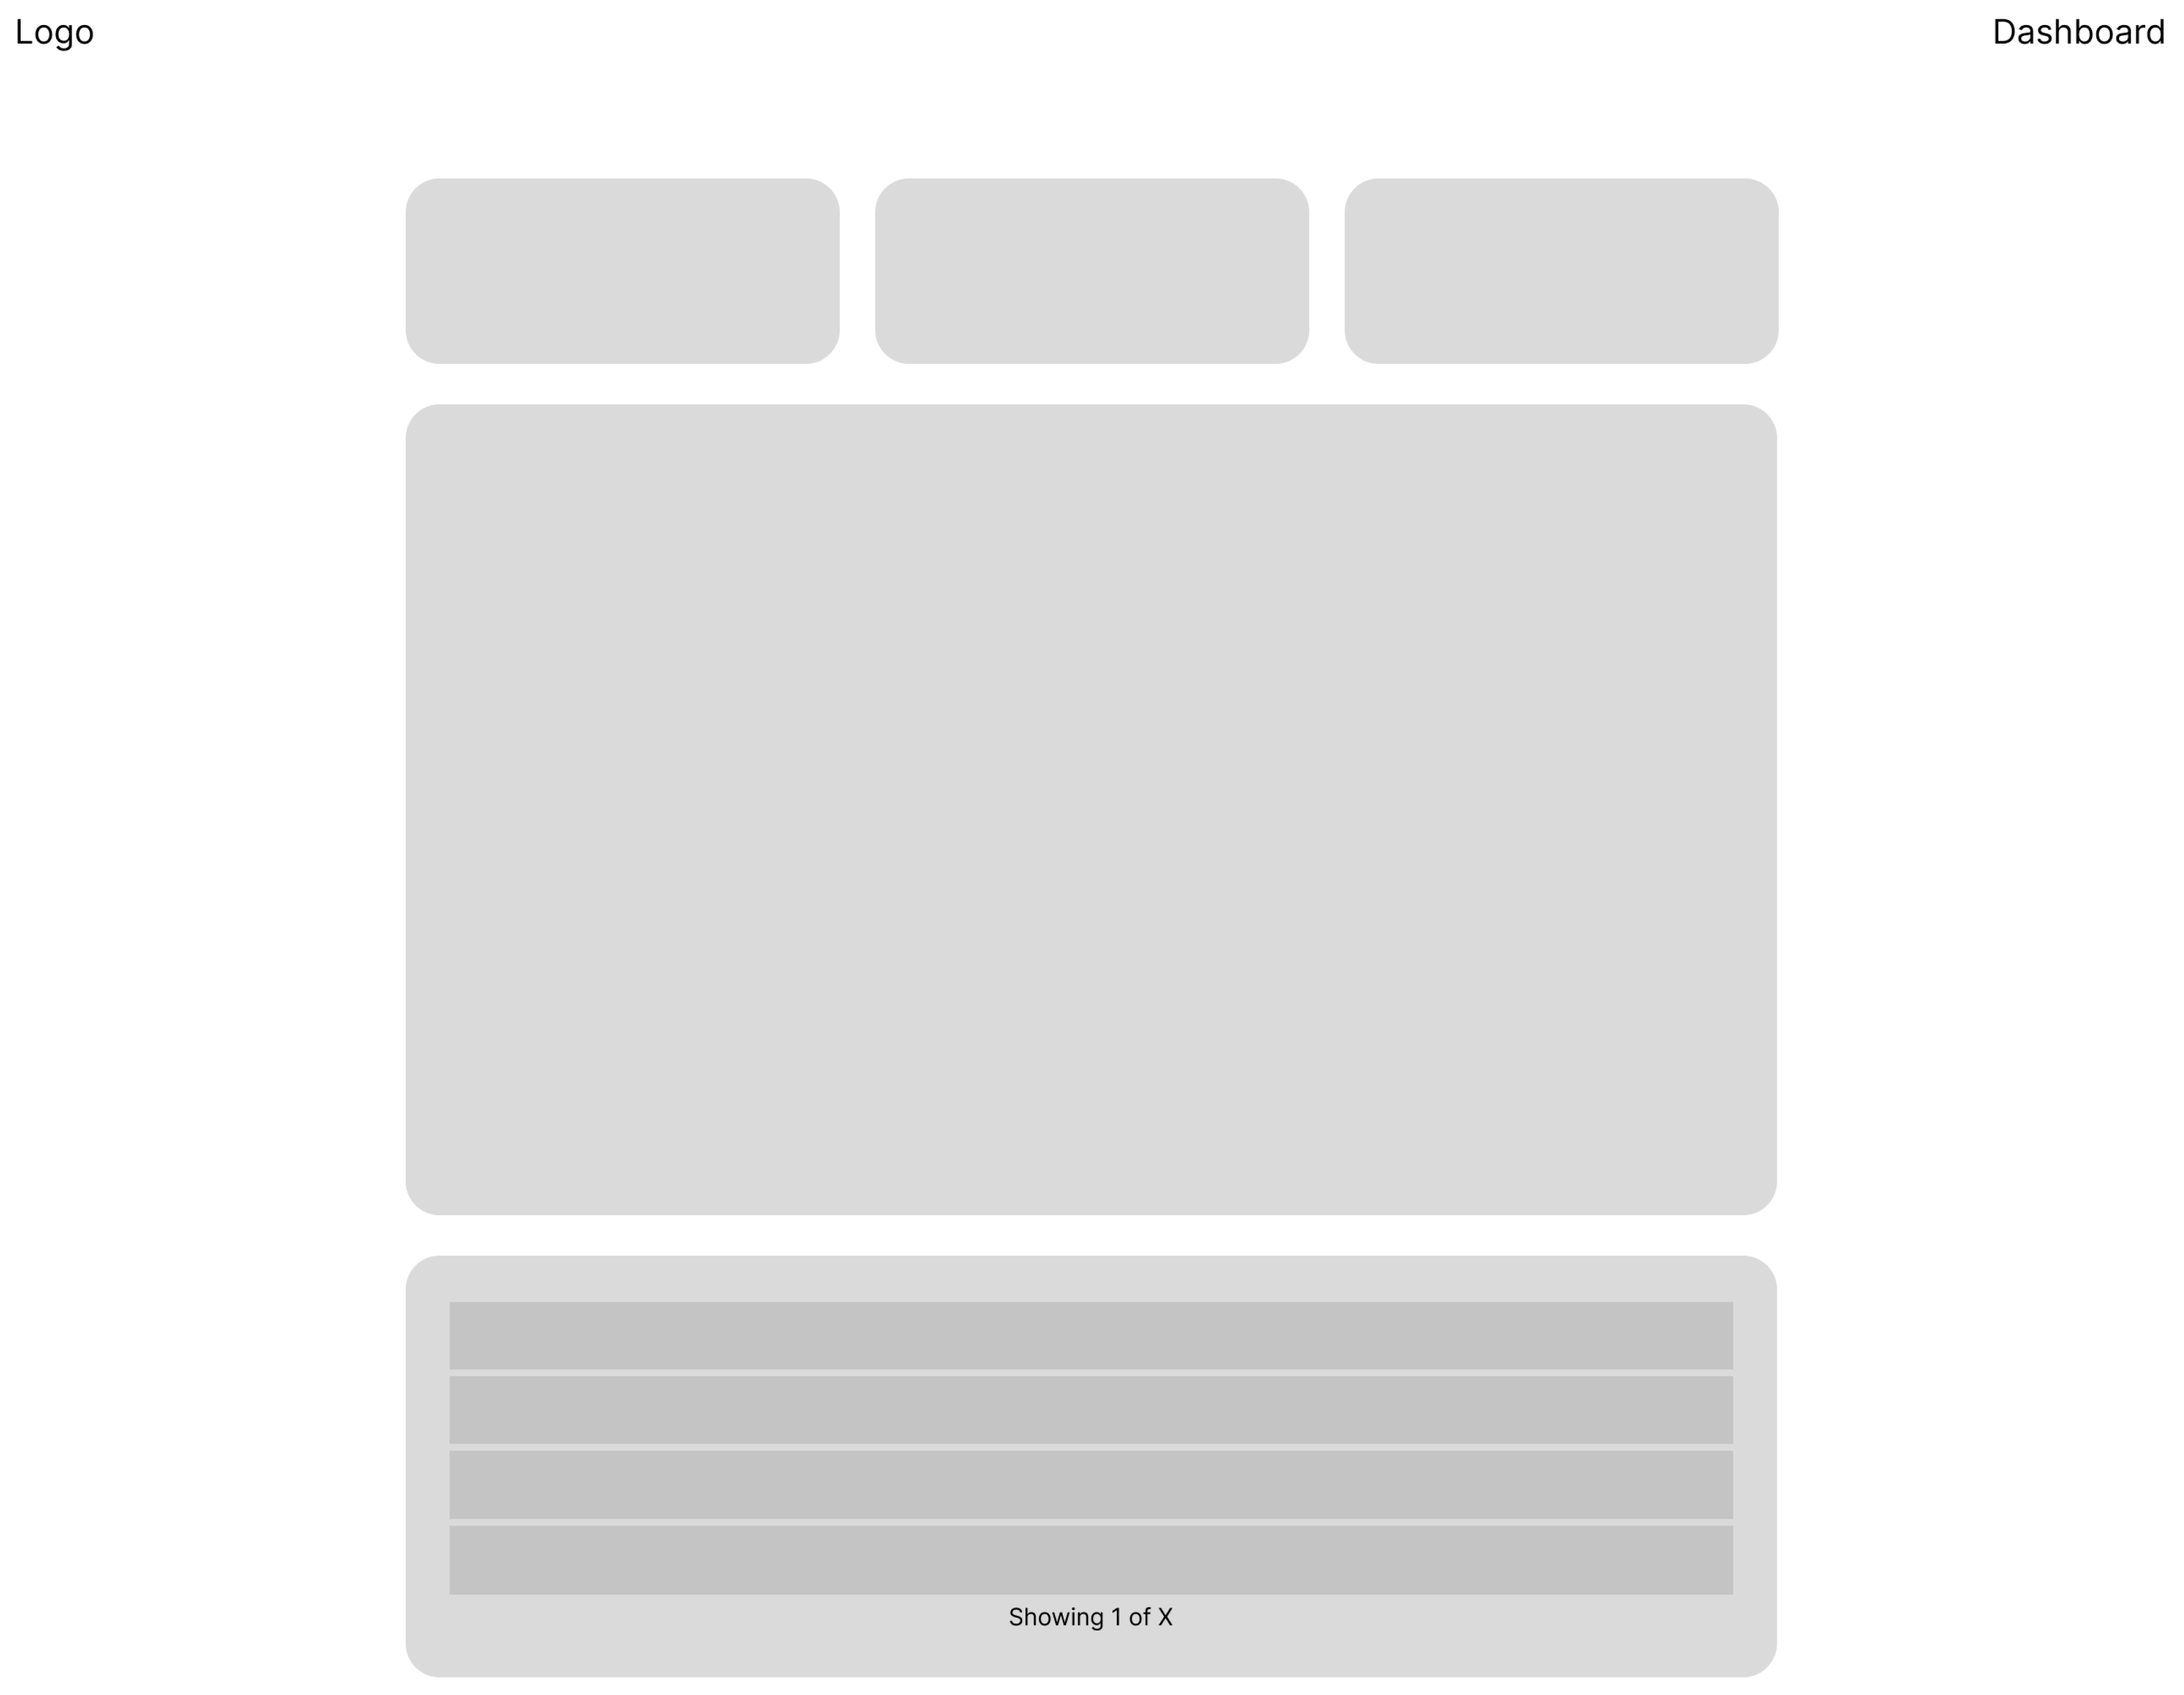
The stored data can then be viewed in the CrosSafe web application. This application contains two pages: the home page and the dashboard page. The mockups of these two pages are shown in Figure 27 and Figure 28, respectively.

Figure 27.
Mockup Home page.
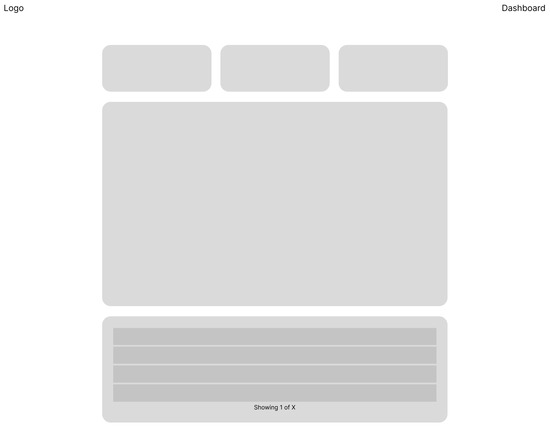
Figure 28.
Mockup Dashboard page.
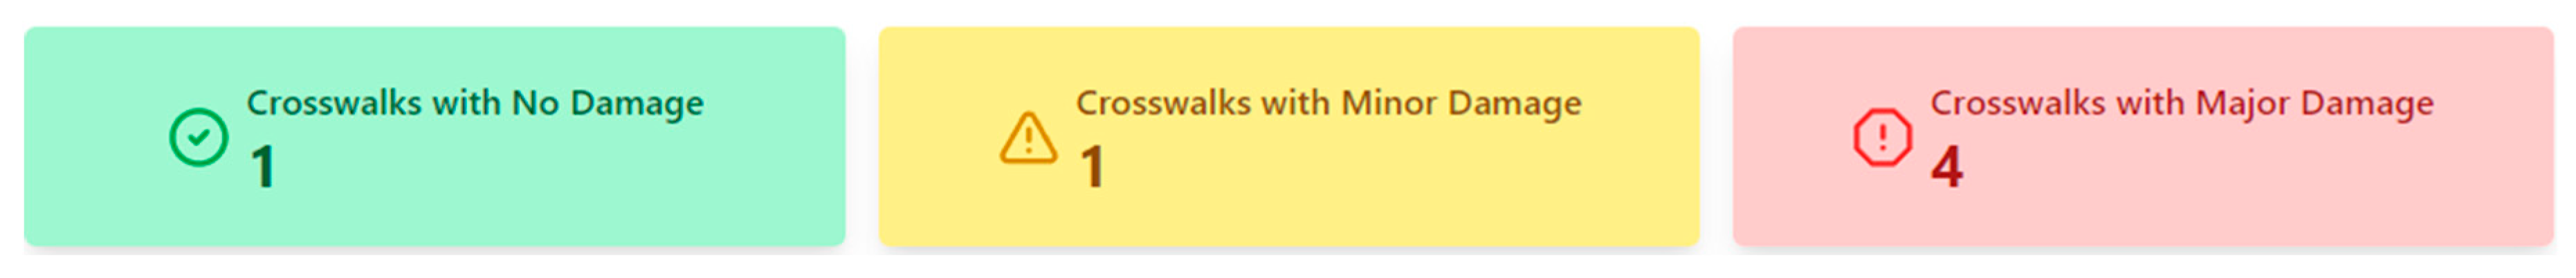
The dashboard page shows all the detections in the database to date. This page consists of three components:
- Count of crosswalks by state of degradation (Figure 29);
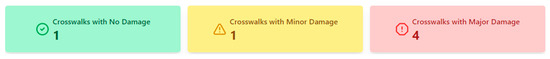 Figure 29. Crosswalk counting component by state of degradation.
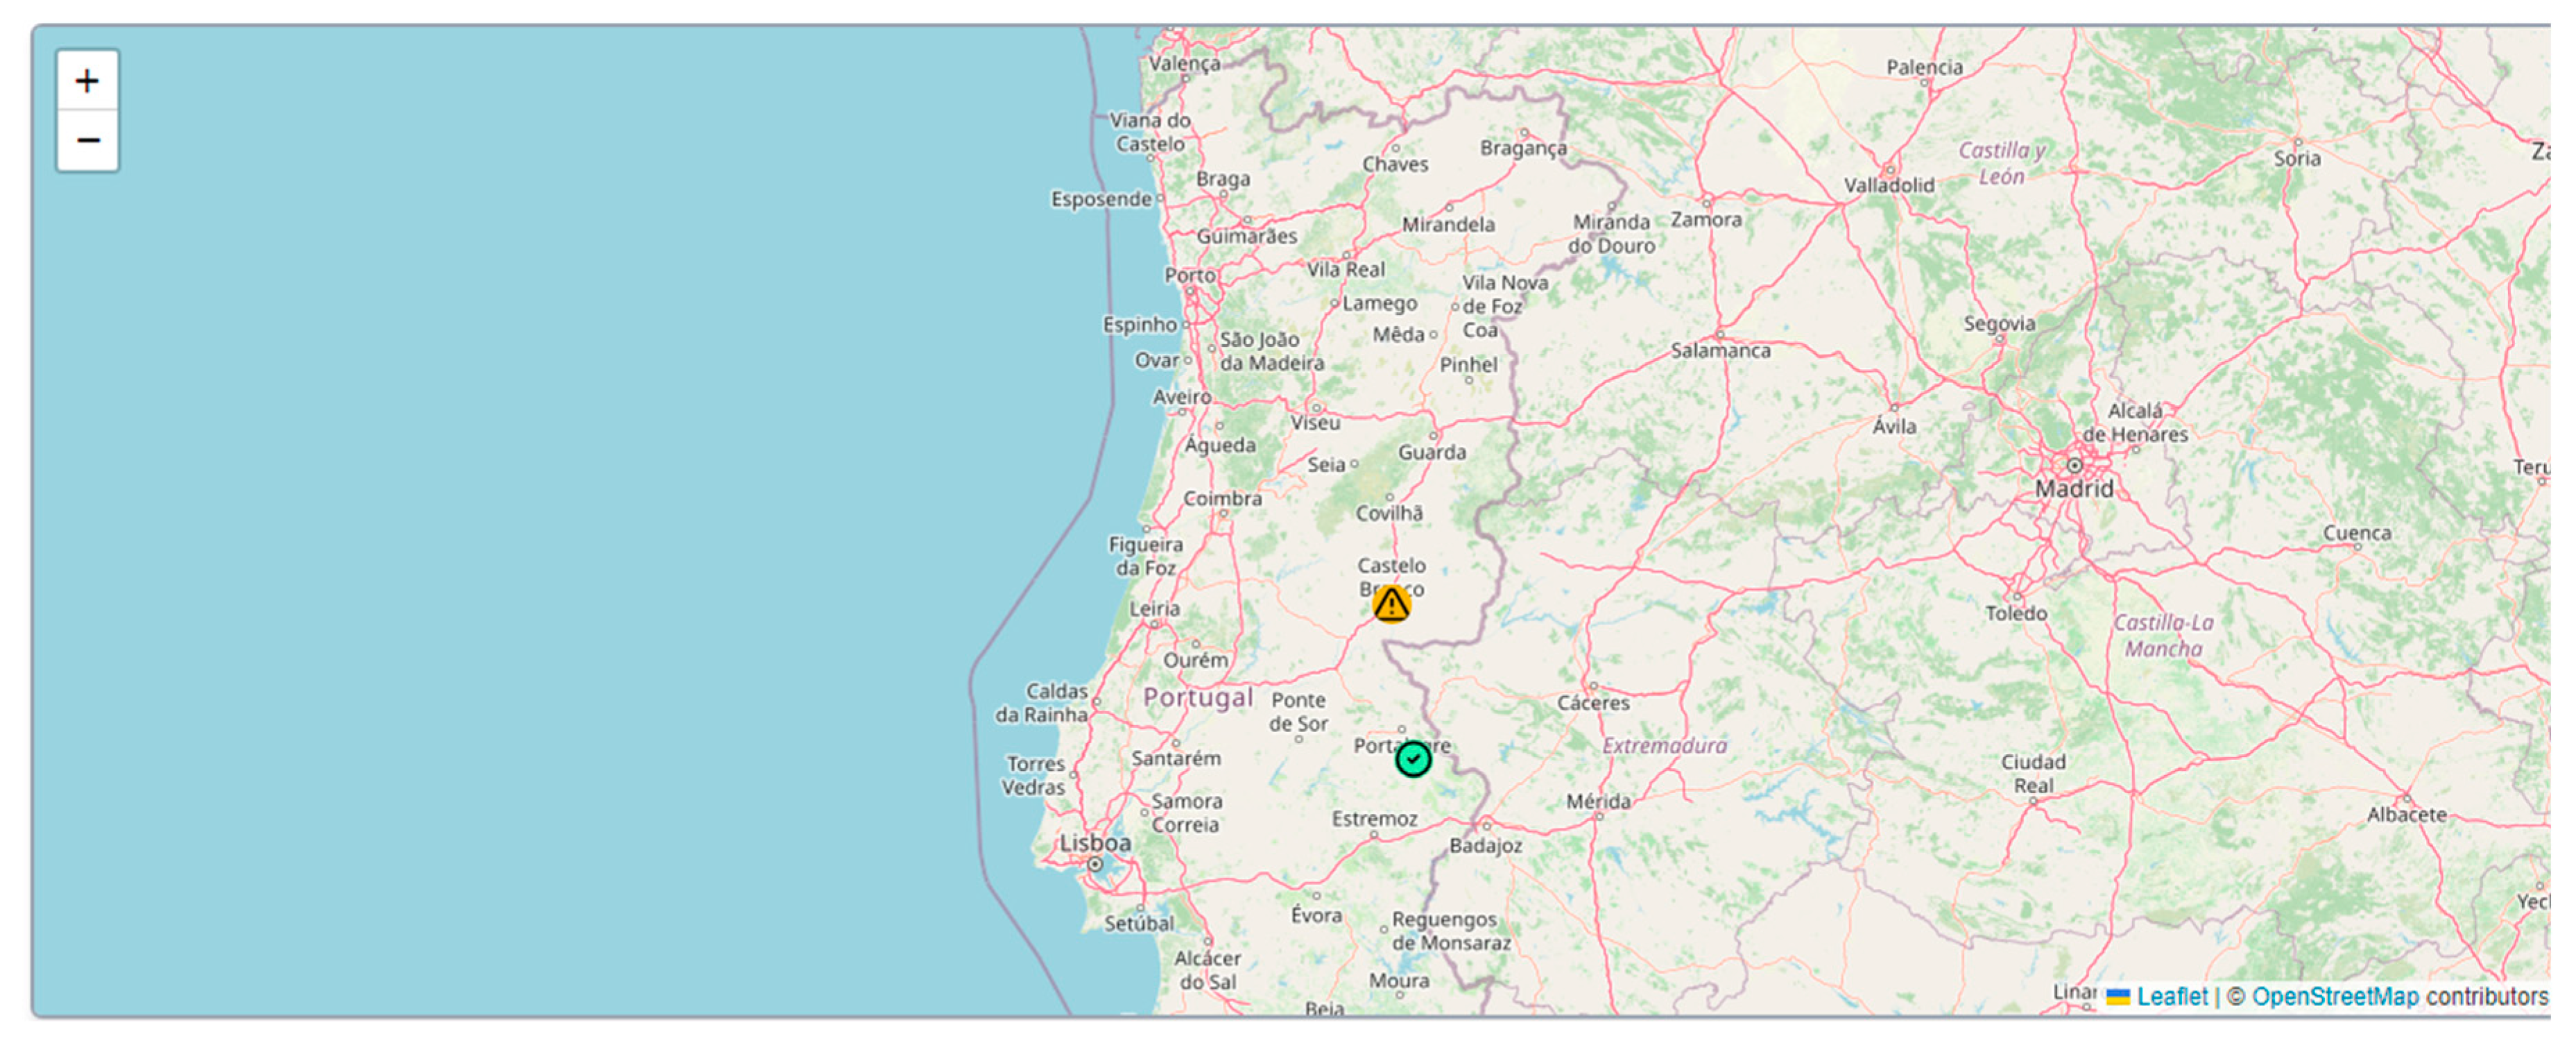
 - Map showing the location of the detections (Figure 30);
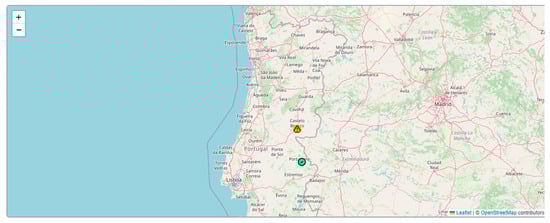 Figure 30. Interactive map in the application.
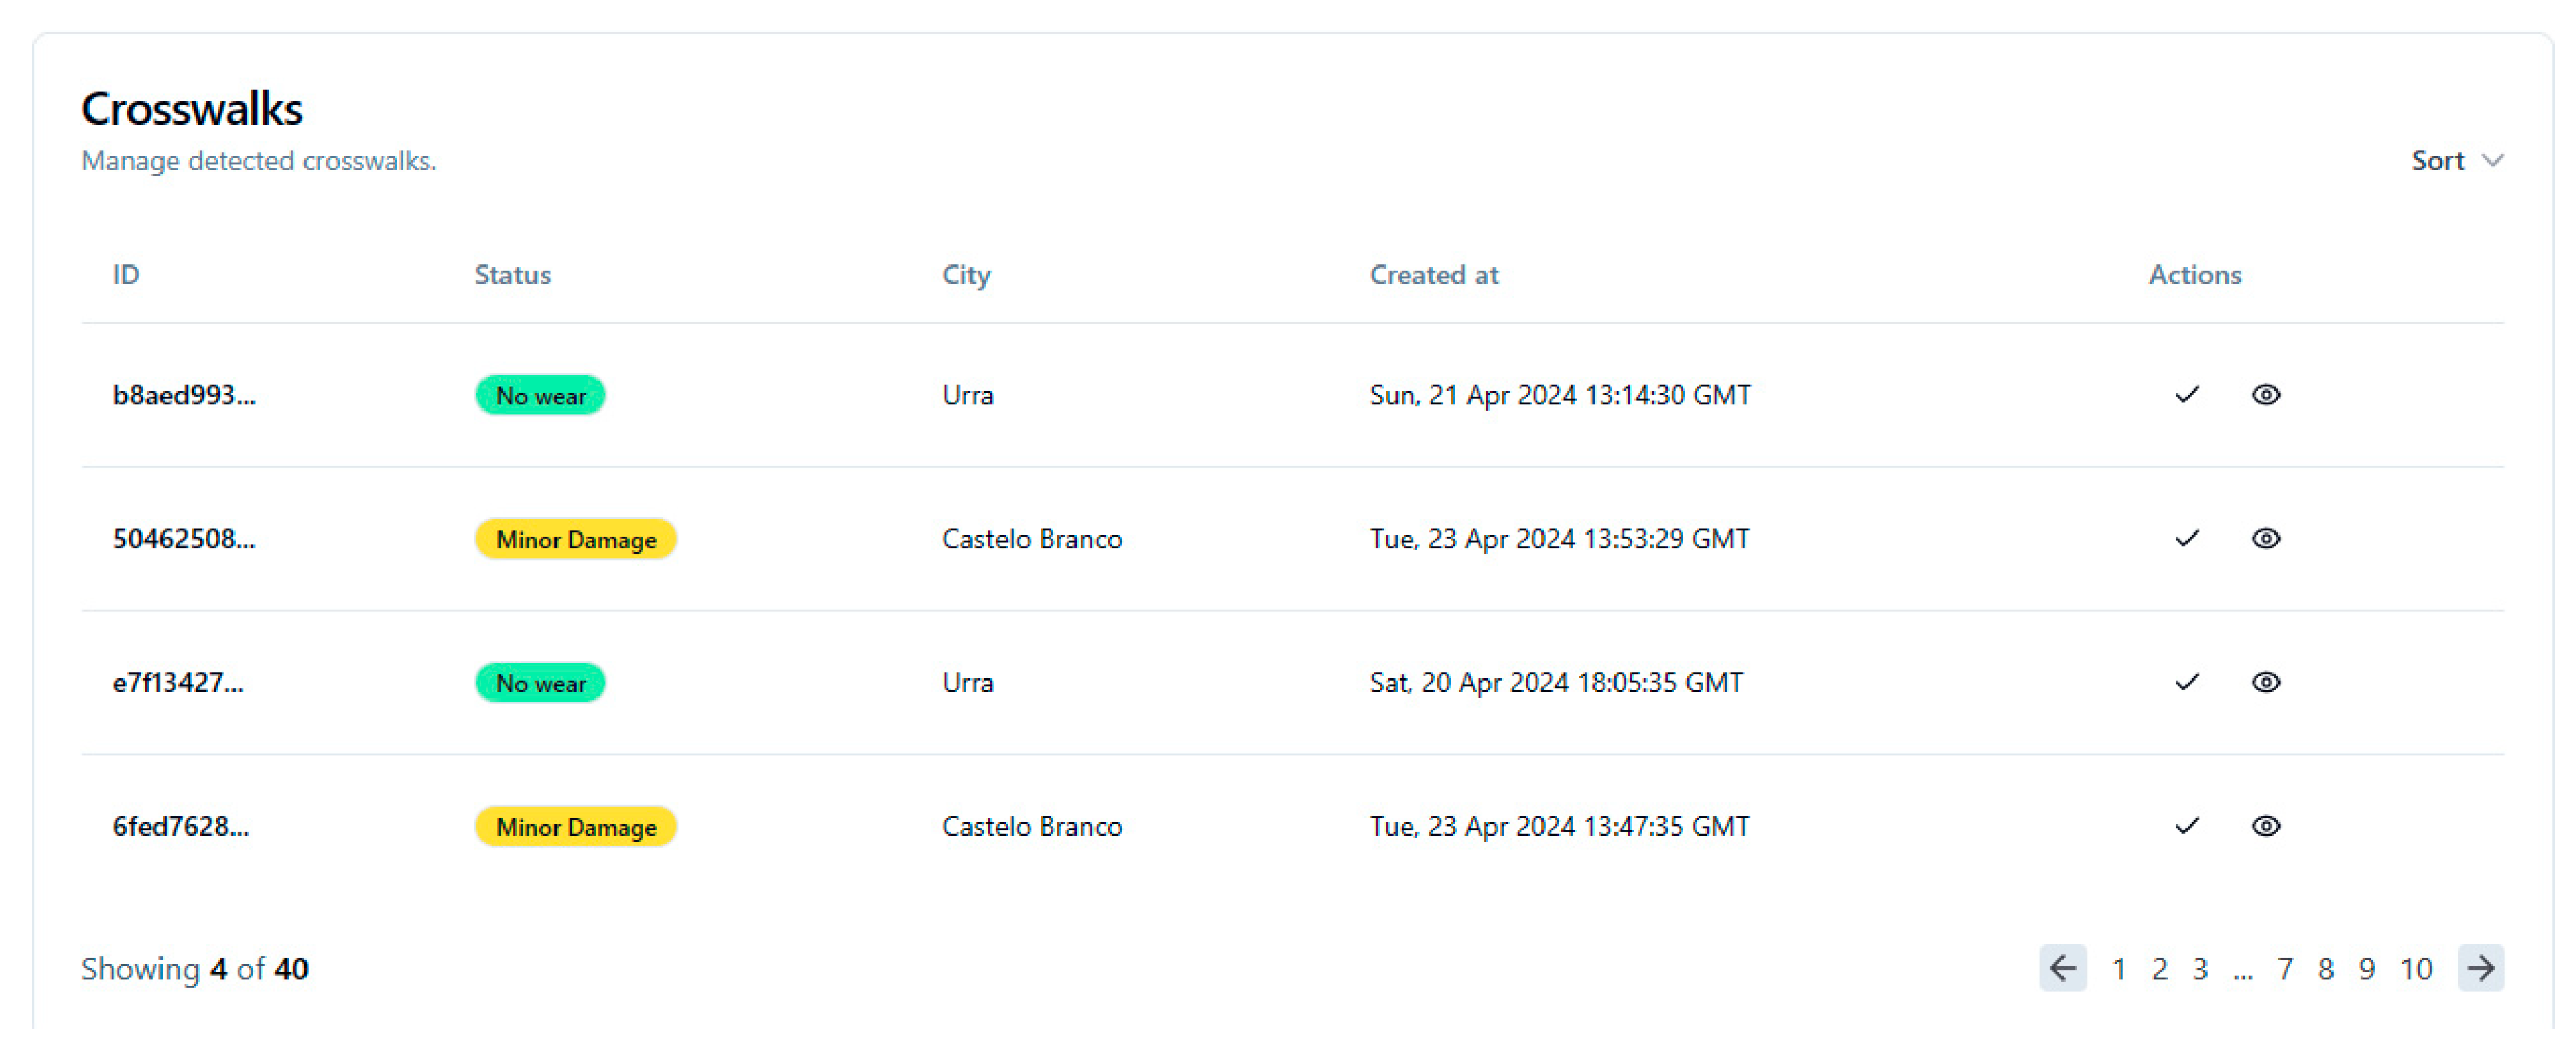
 - Table with additional information on the crosswalks detected (Figure 31).
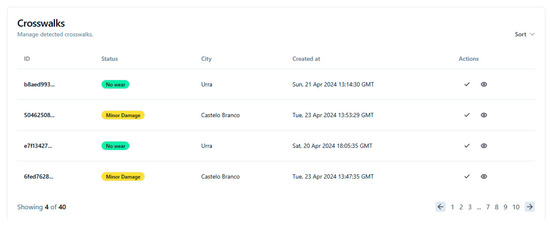 Figure 31. Table with additional information on crosswalks detected using the pagination method.
Figure 29 illustrates the initial component of this page, which presents a comprehensive overview of the crosswalks, categorized according to their respective states of disrepair. This component serves to consolidate the information presented in the subsequent components.
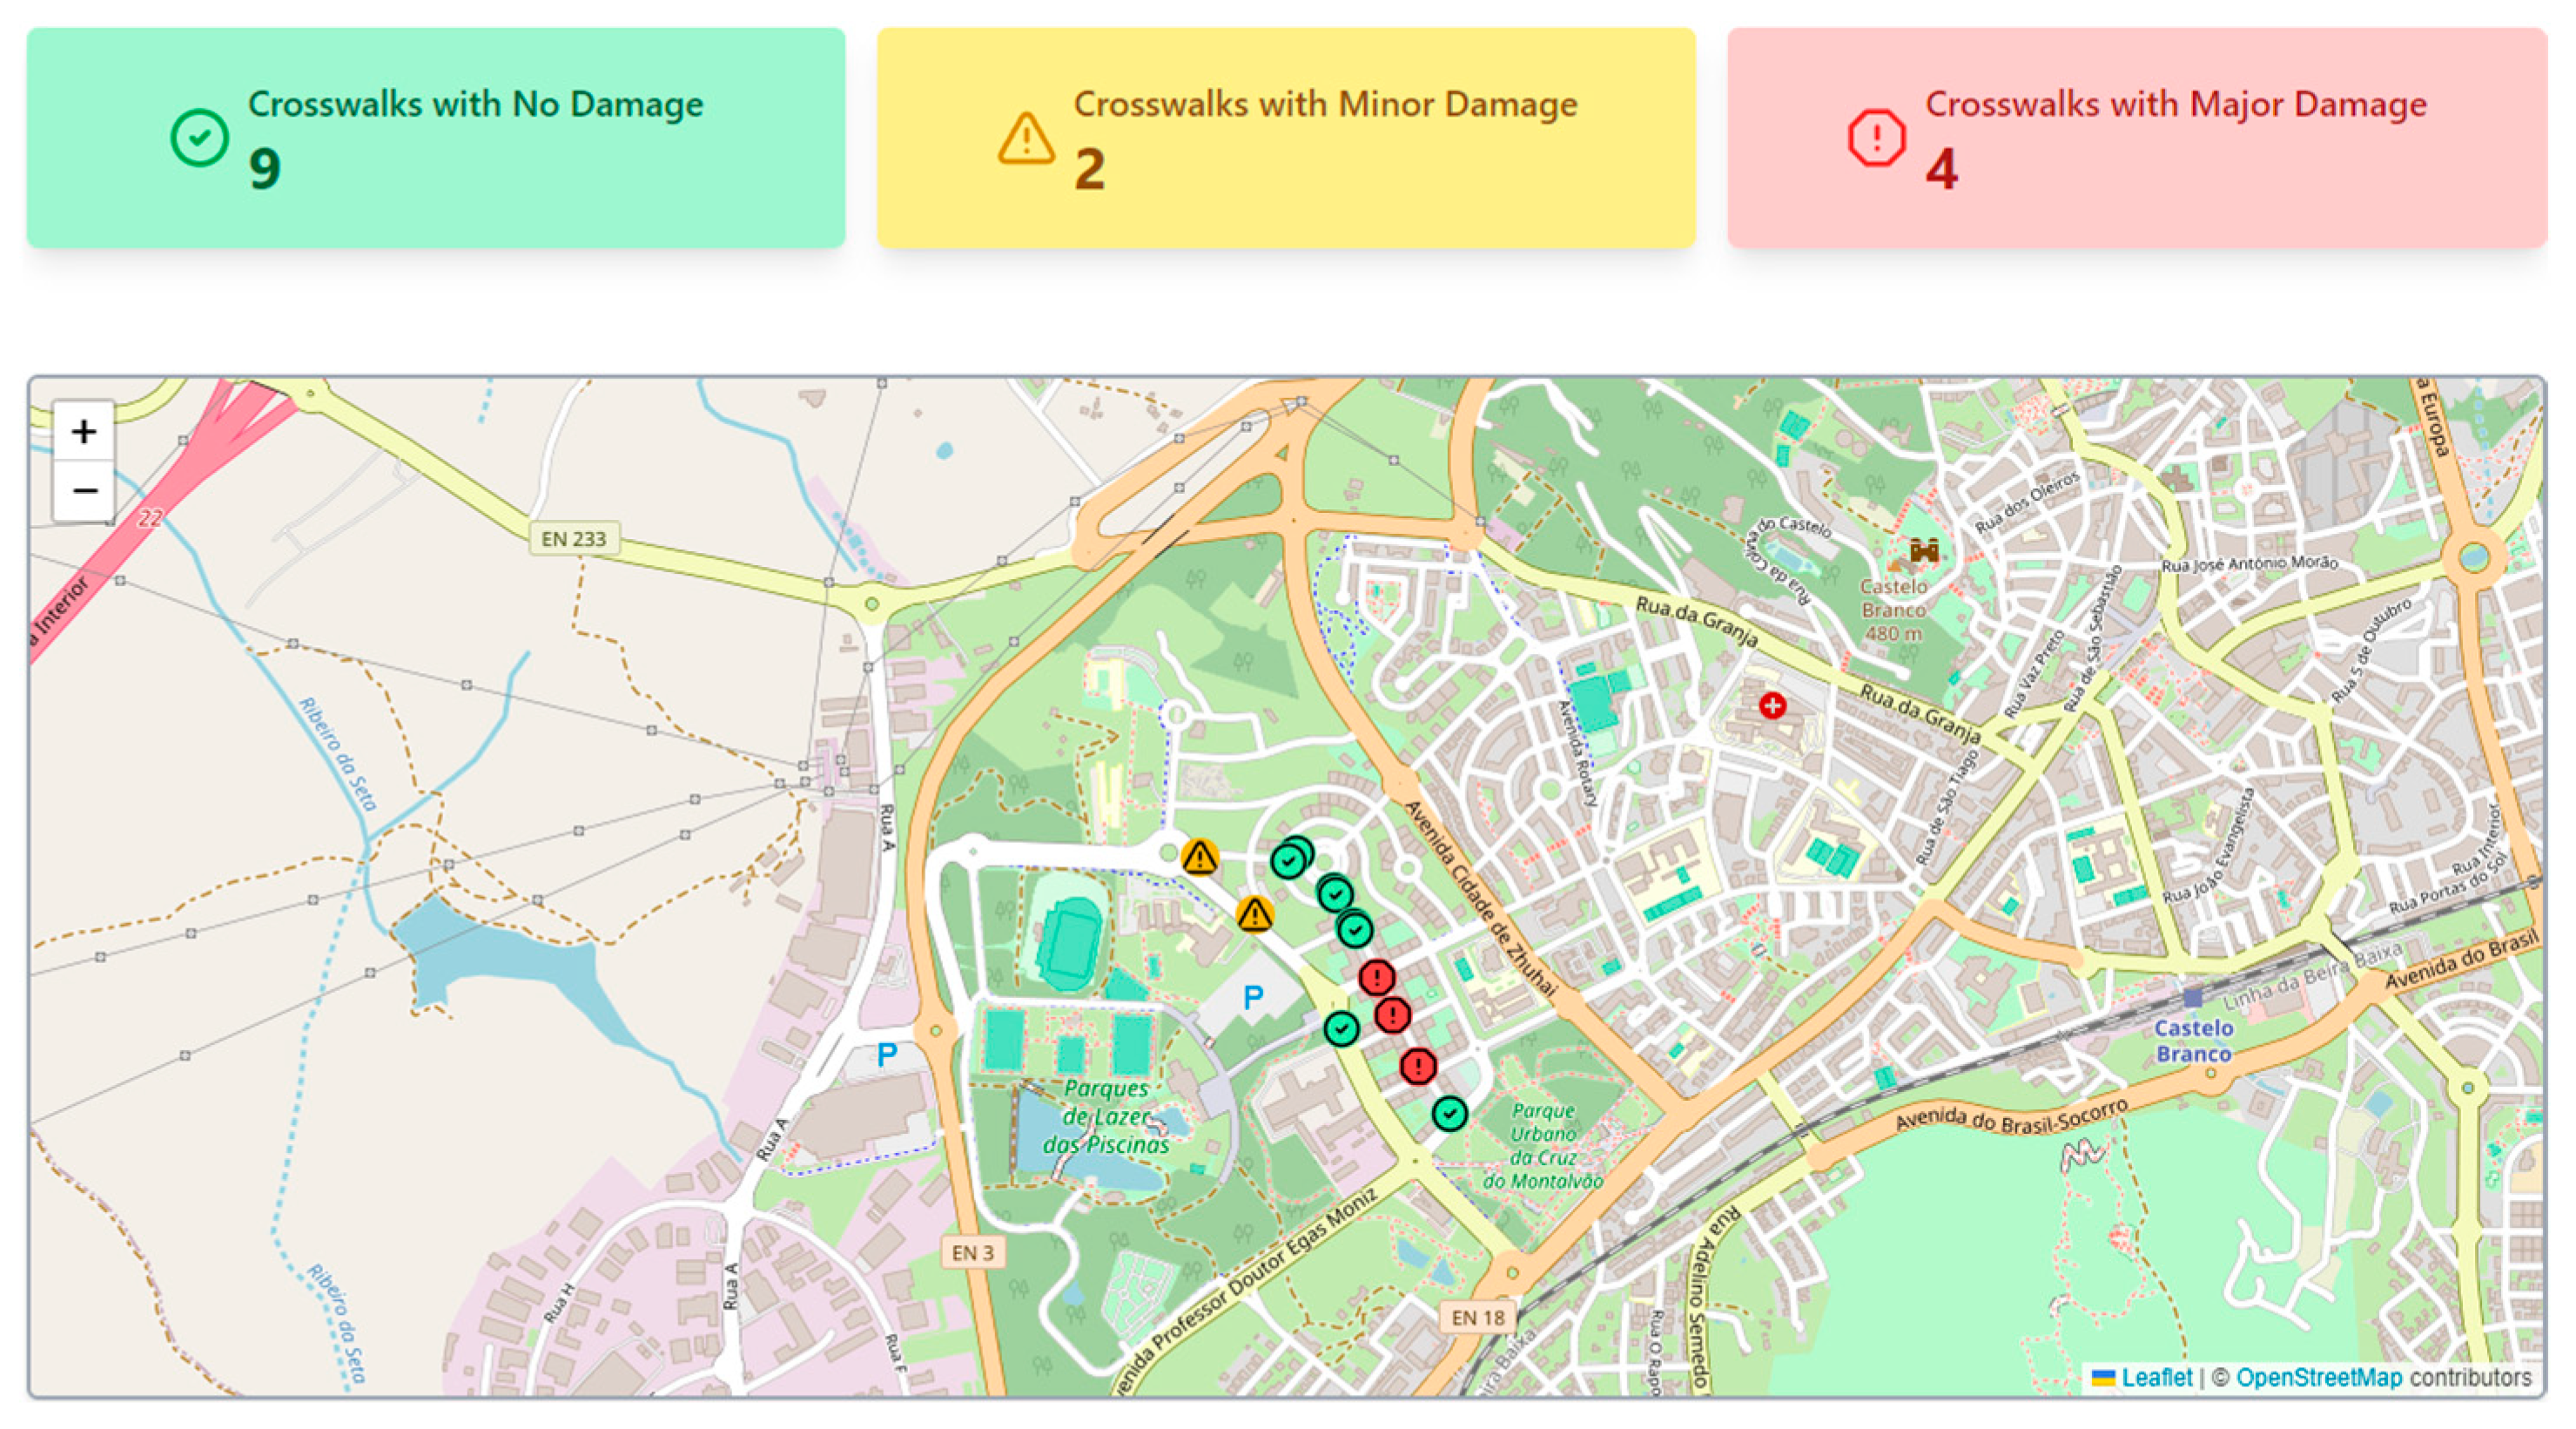
Regarding the map component, the Leaflet library [48] was employed. This library provides a robust framework for developing interactive maps in JavaScript, facilitating the seamless integration of an interactive map and the precise display of the underlying data. Figure 30 illustrates this component in greater detail. The map displays the location of the crosswalks and their state of disrepair. The states are indicated by three different colors: green for crossings with no wear, yellow for moderate wear, and red for severe wear.
In the context of ReactJS applications, there are various approaches to rendering large numbers of data lists [49]. One such approach is the use of pagination, which allows for the control of the number of items displayed within the application. This method divides the items into several “pages” if the number of elements in the list exceeds a defined threshold.
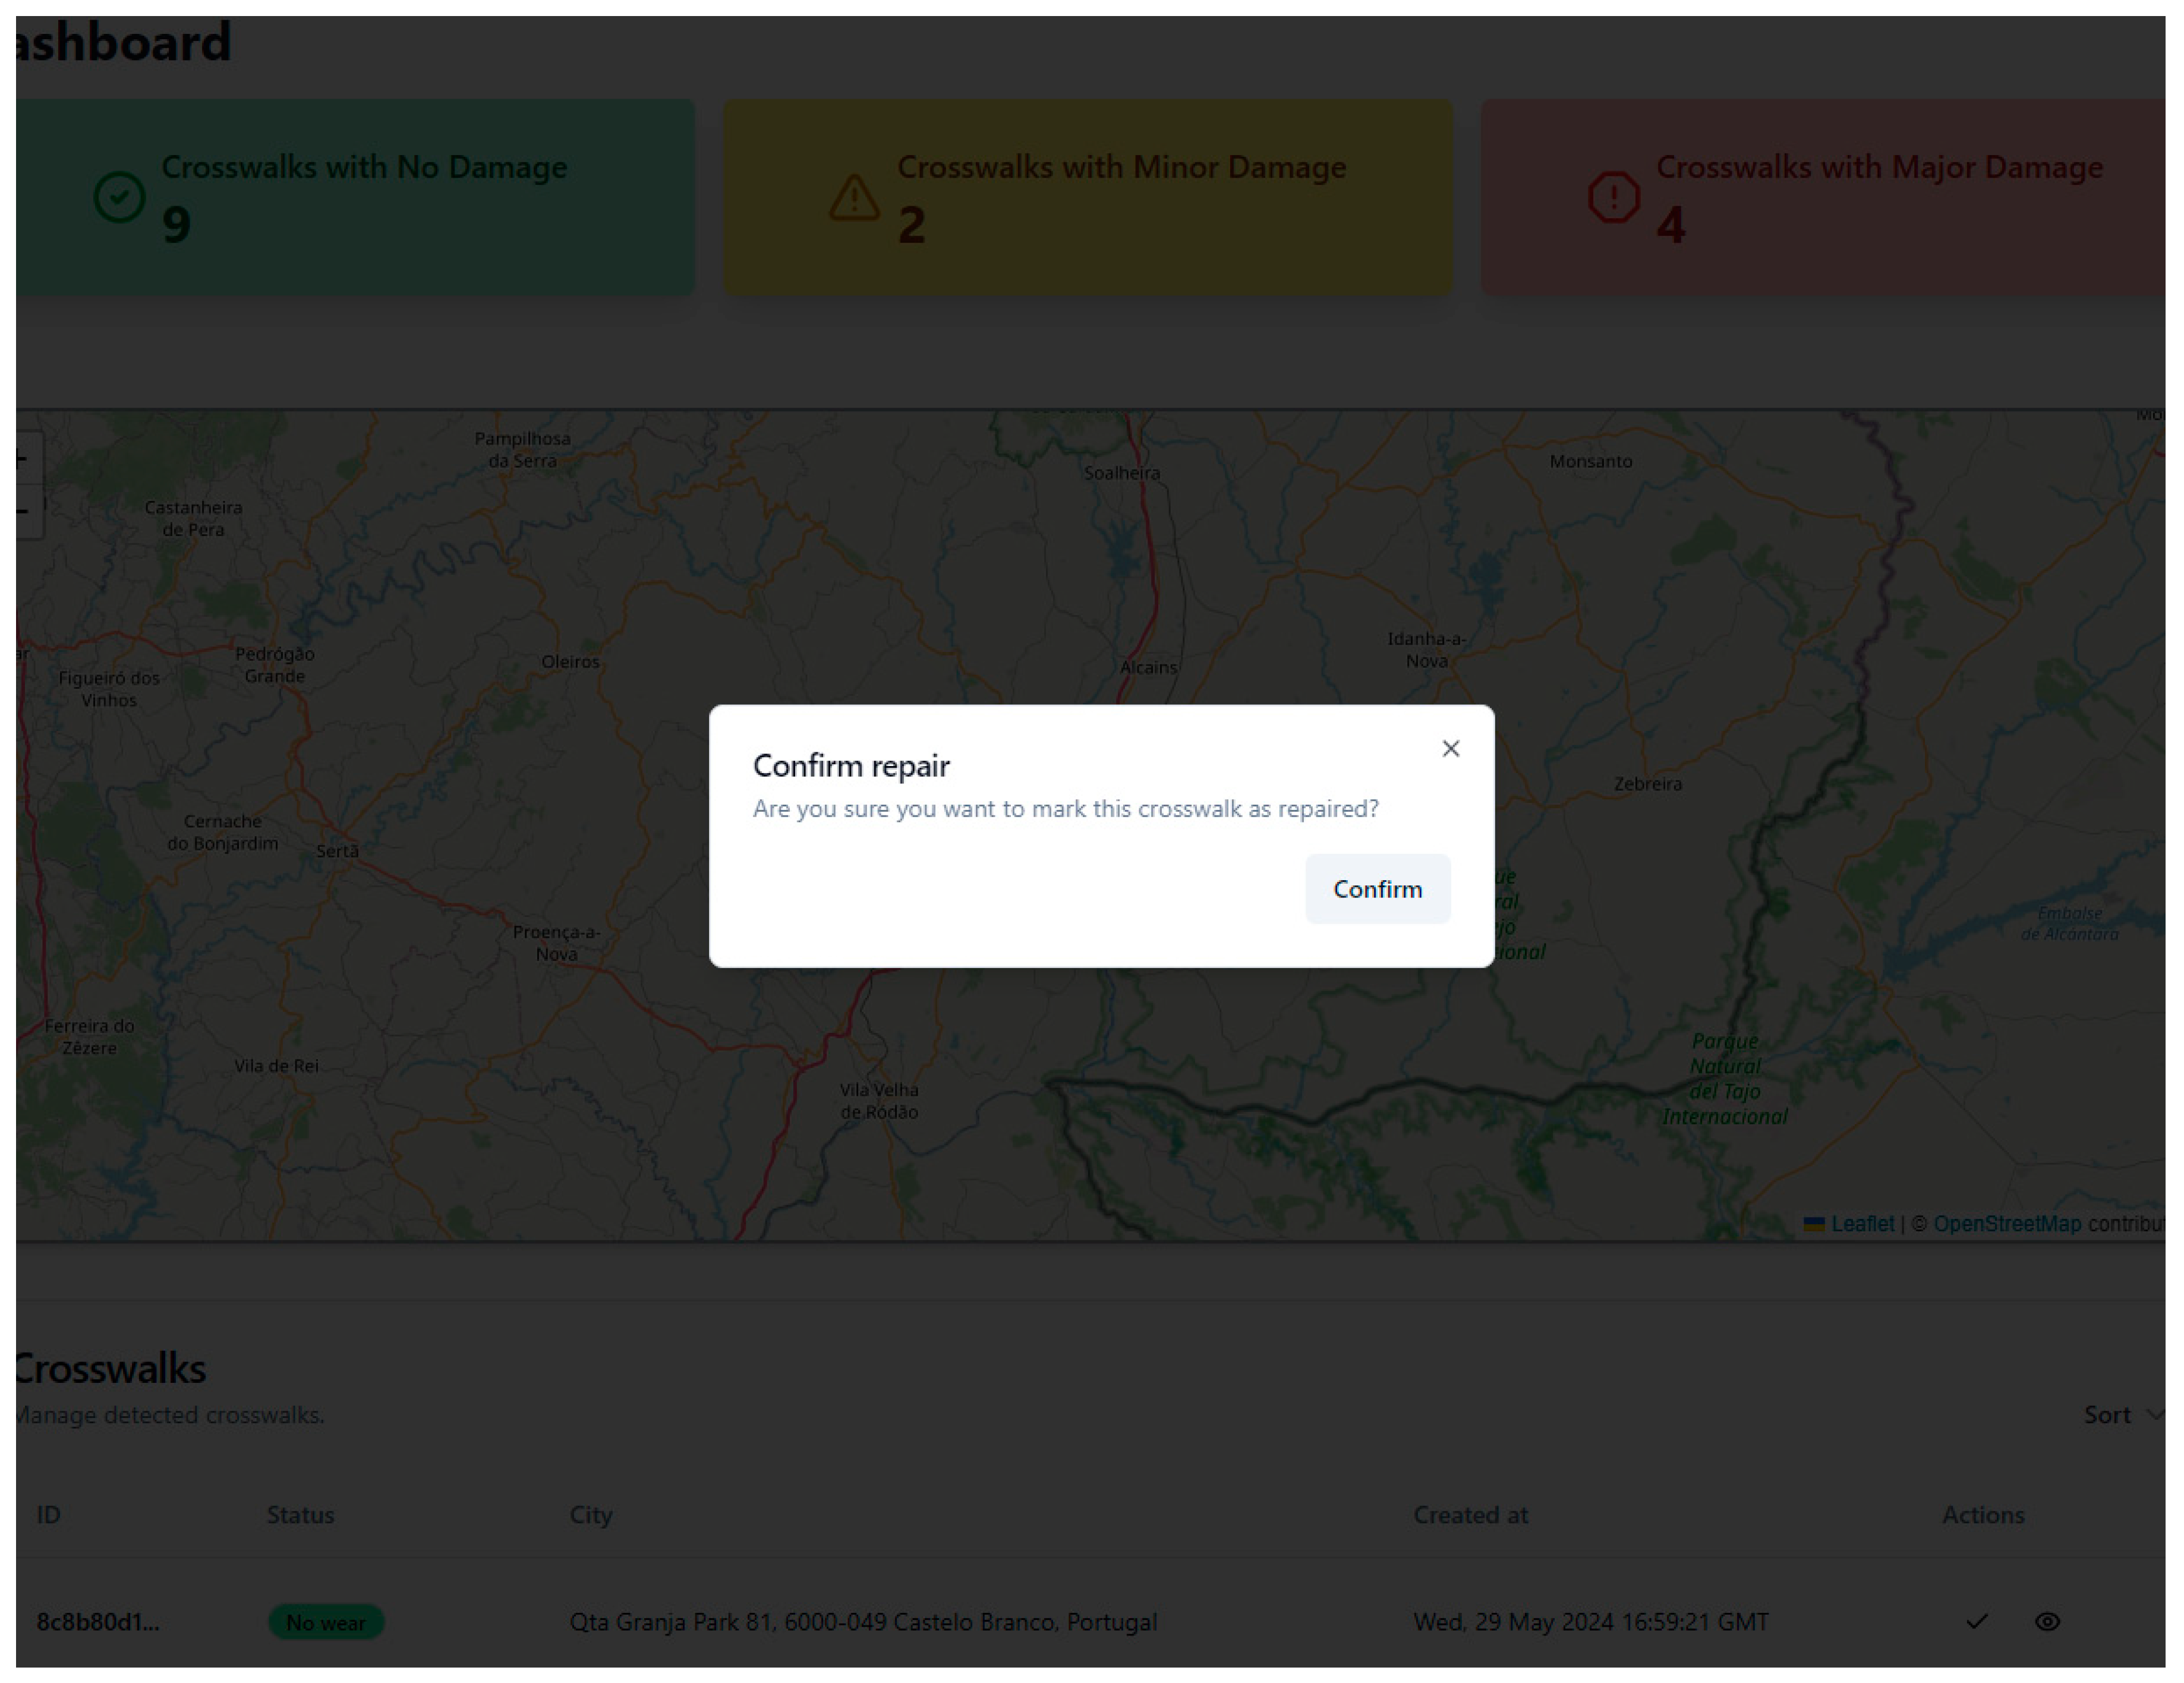
Figure 31 depicts the implementation of the table component of the dashboard page using the pagination method. This table presents a variety of data, including the status, which reflects the state of degradation of the crosswalk, the city where it was detected, and the day and time it was detected. Additionally, the table contains an action column, which enables users to mark the record of the crosswalk detection as repaired. Clicking on this button will display a confirmation pop-up, allowing the user to verify their intention to proceed with the action. It is important to note that marking a crosswalk as repaired will result in the removal of this entry from the database. Figure 32 illustrates this procedure. Once the user has confirmed, a success message will be displayed in the bottom right-hand corner, as shown in Figure 33.
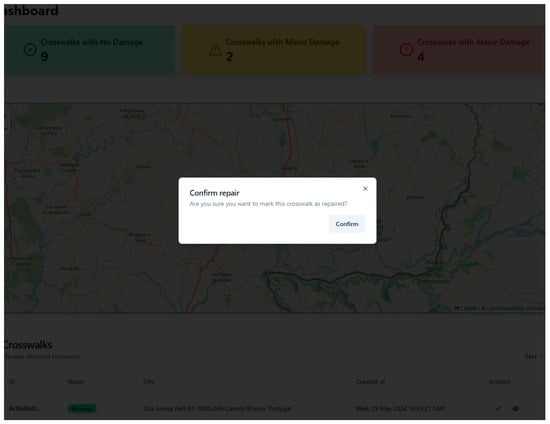
Figure 32.
Popup for confirmation of crosswalk repair.
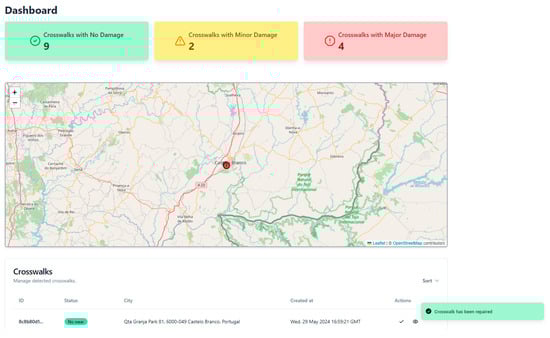
Figure 33.
Example of a success message following confirmation of a crosswalk repair.
4. Testing and Validation
This section outlines validating the prototype developed for identifying and classifying wear and tear on crosswalks. The main focus of this section is the description of the steps involved in validating the prototype, from the initial detection of a crosswalk and its classification to the visualization of the data in the web application.
During the tests carried out, an additional amount of current was consumed when using a Powerbank as a power supply for the Raspberry PI. This additional current was due to the necessity of supporting the use of the cooling apparatus utilized to cool the Raspberry Pi. Otherwise, the device would cease functioning without warning. Table 5 illustrates the consumption identified with all the components assembled.
Table 5.
Raspberry Pi consumption.
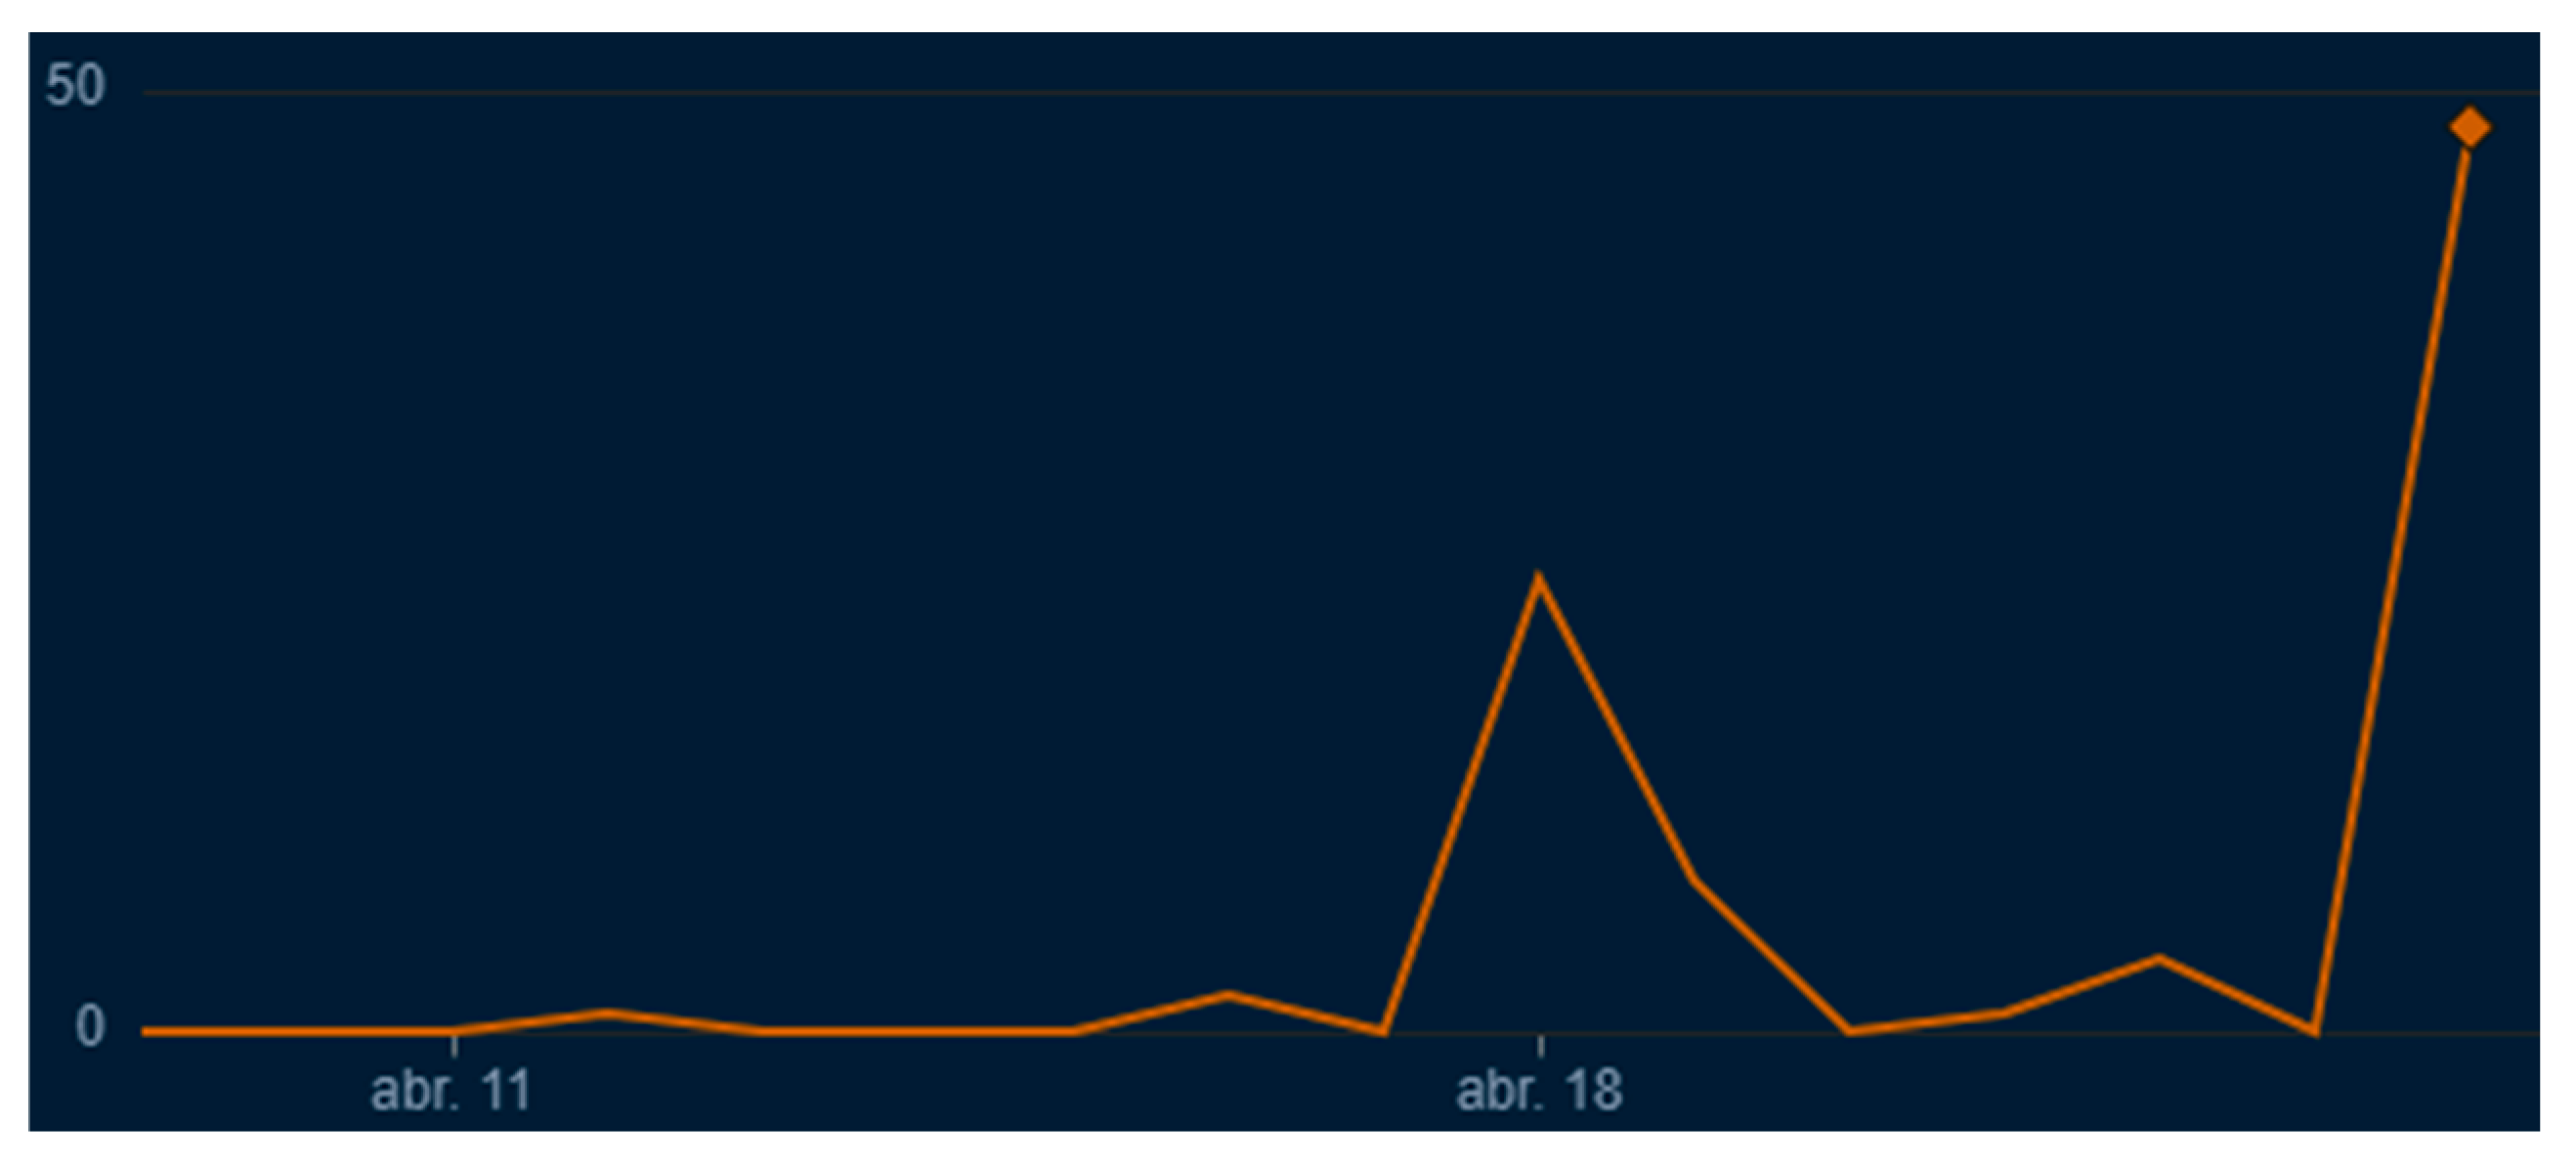
The process of detecting wear and tear on crosswalks begins with the identification of a crosswalk and the classification of its state of degradation by the IoT device. Figure 34 illustrates the result of this stage. The IoT device then transmits the data from this detection to the integrated platform via the developed API. These data, once received, are stored in Firebase’s Firestore database. Figure 35 presents a graph illustrating the quantity of data received by the database over a specified period.
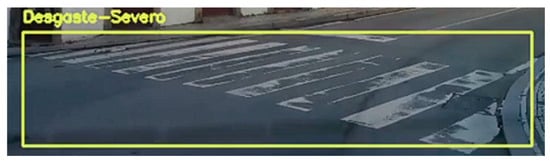
Figure 34.
An example of a crosswalk classified as severely worn.

Figure 35.
Example of the number of documents received by Firestore.
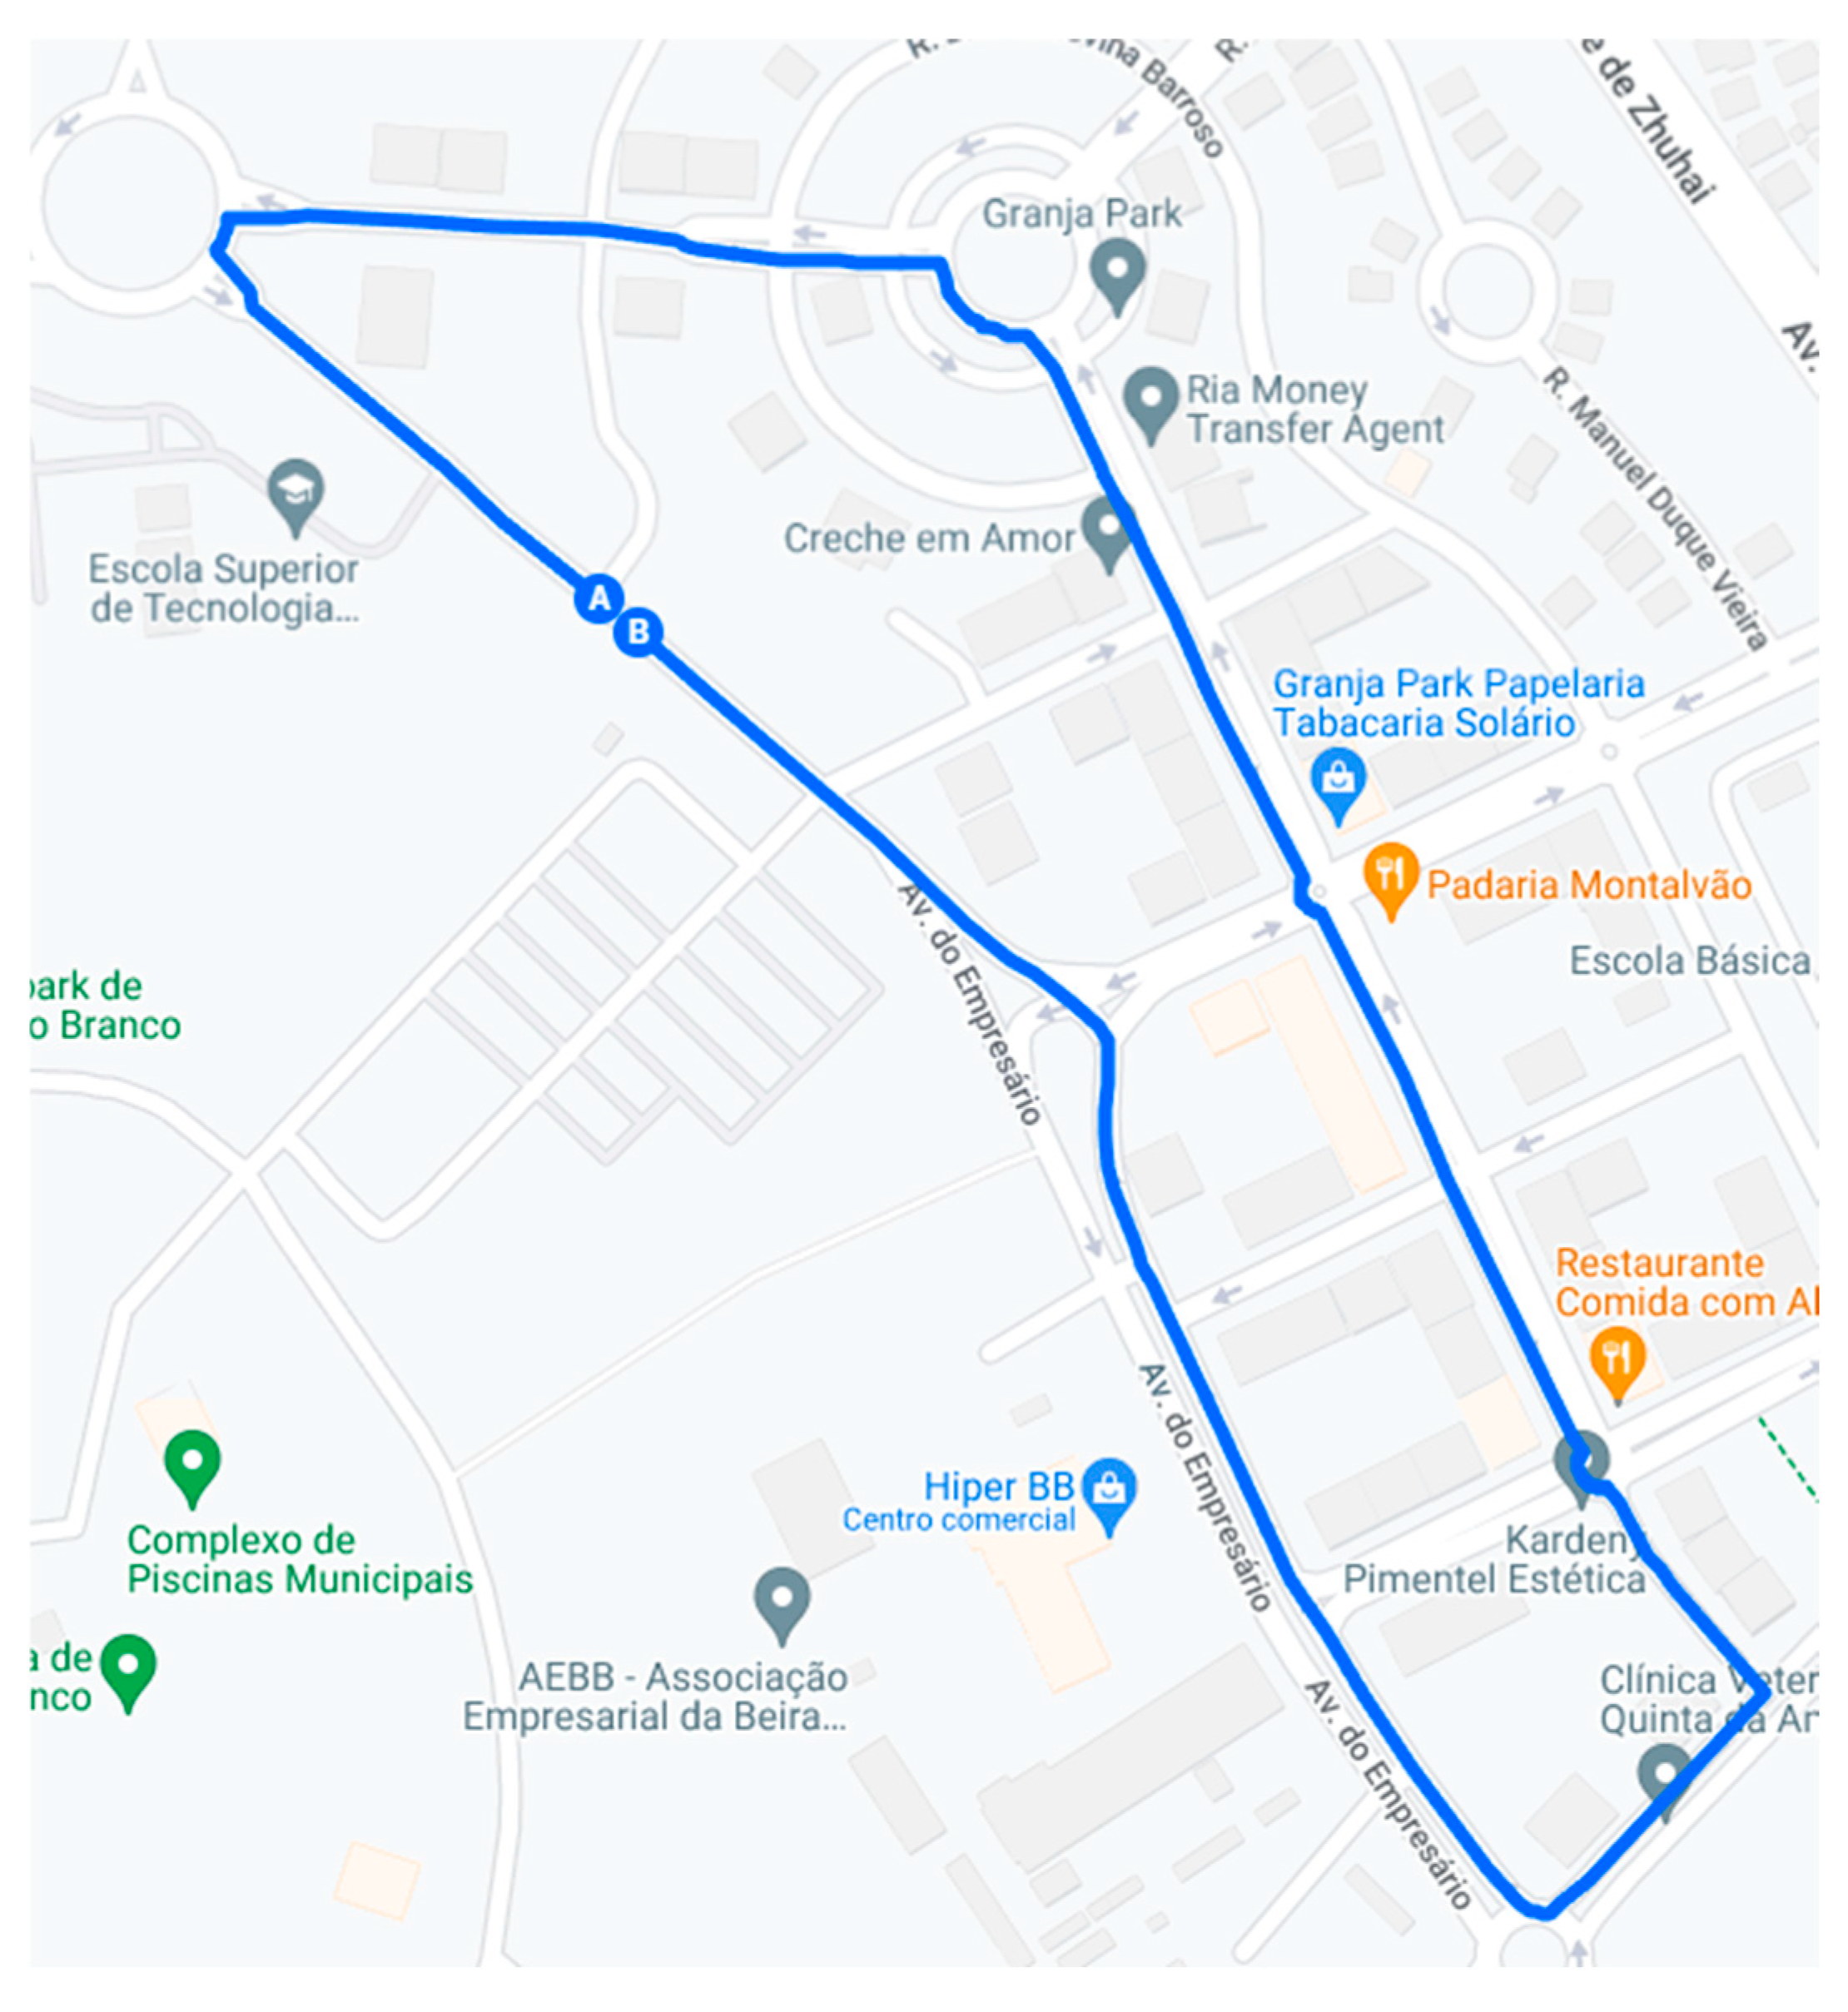
To ascertain the efficacy of the prototype, a route was traversed through the city of Castelo Branco. This route is depicted in Figure 36. A route was selected with crosswalks exhibiting varying degrees of deterioration, during the day when the sun was relatively low. This time of day posed a challenge for the YOLOv4-tiny model in detecting and classifying the state of degradation of crosswalks due to the presence of shadows and excess light. A total of 17 crosswalks were identified along the route. Of these, nine were in good condition, three exhibited moderate wear, and five displayed severe wear.
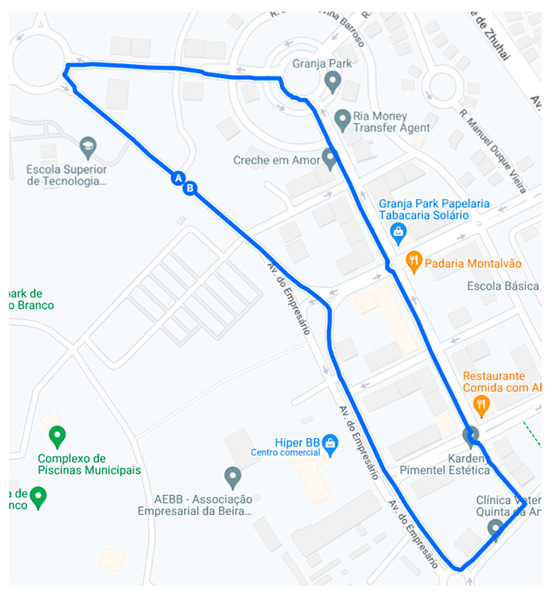
Figure 36.
Illustration of the route taken.
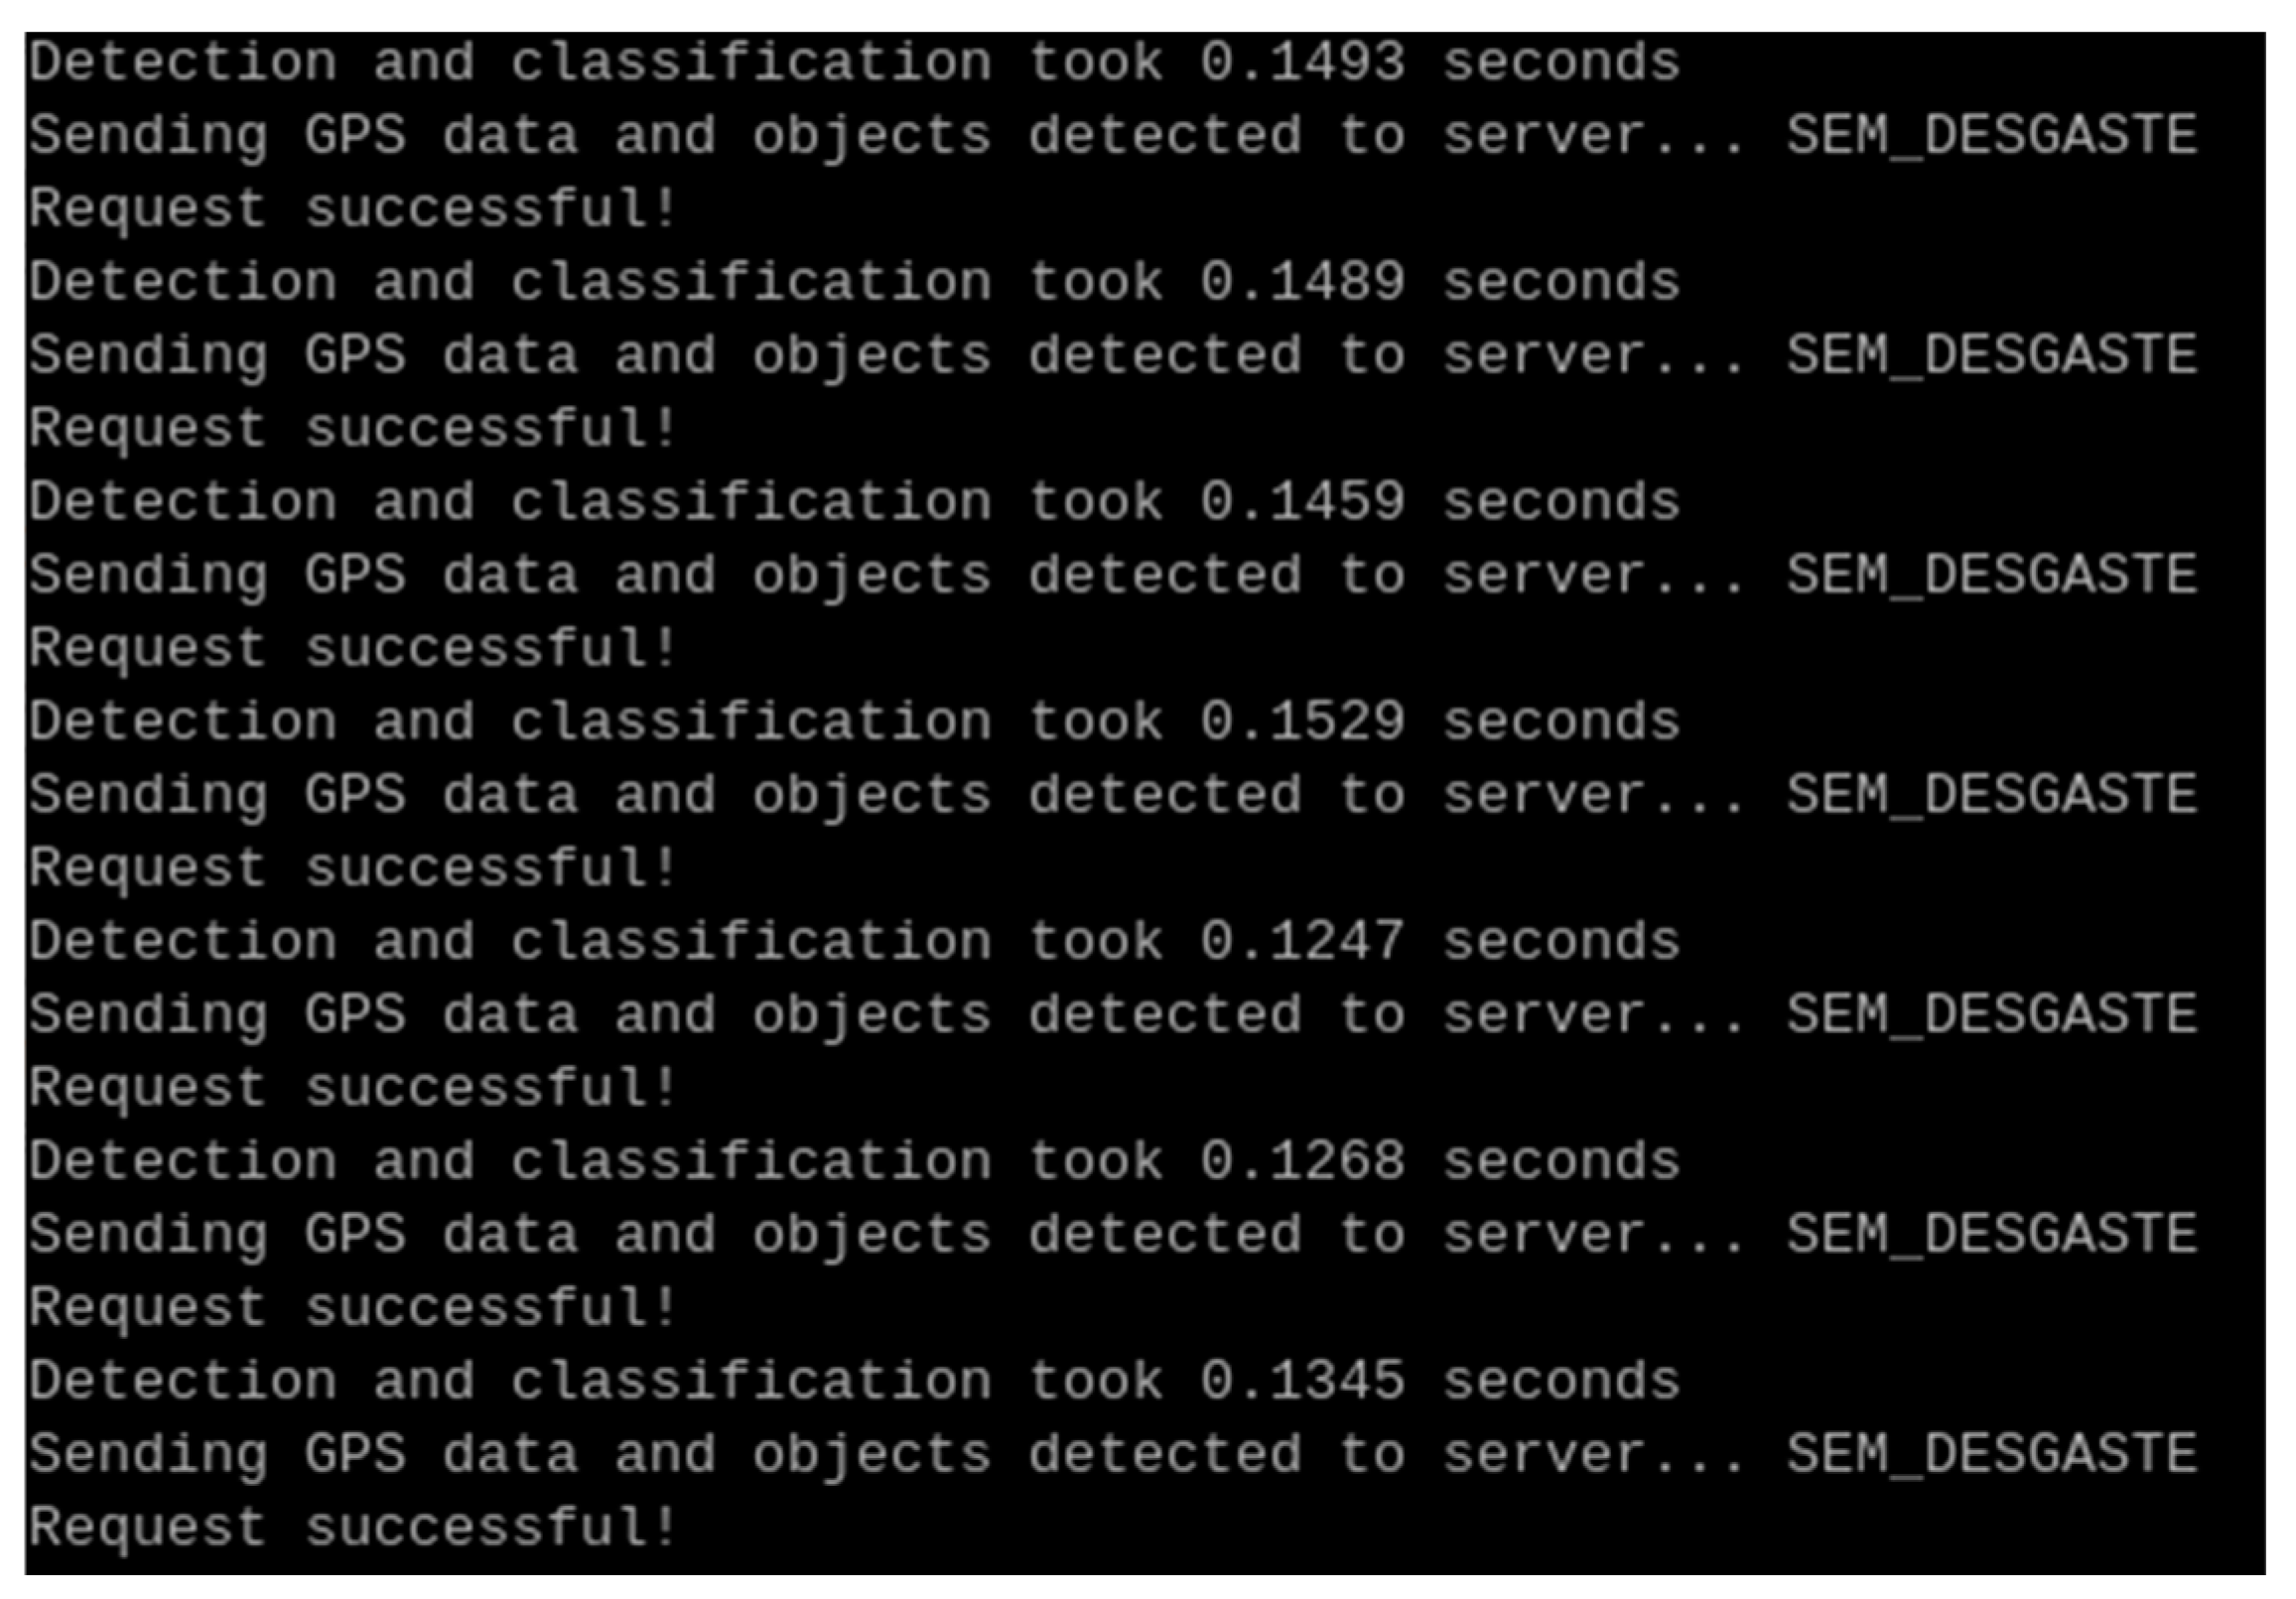
The Raspberry PI 5, in conjunction with the YOLOv4-tiny model, was able to identify the state of degradation of the crosswalks in an average time of 130 ms, as illustrated in Figure 37. About the detections made, the device was able to identify 15 of the 17 crosswalks on the route. This information is summarized in Table 6.
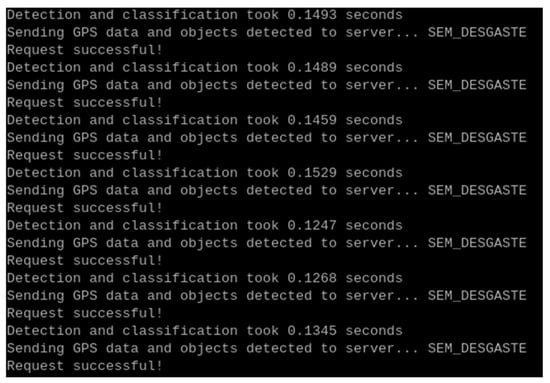
Figure 37.
Detection and classification time required.
Table 6.
Comparison of real classifications with those made by the YOLOv4-tiny model.
One of the issues identified was the challenge of discerning diagonal crosswalks. An illustrative example of this issue can be observed in Figure 38. Consequently, it is imperative to gather a greater number of images to enhance the precision of this solution.
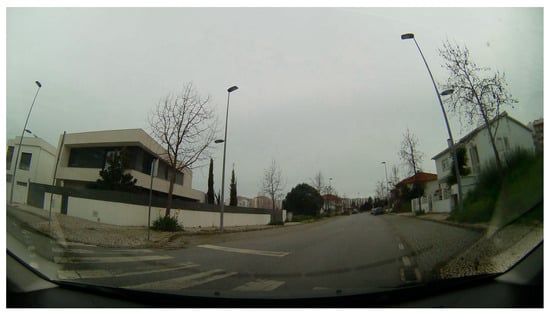
Figure 38.
An image containing a crosswalk slightly diagonally.
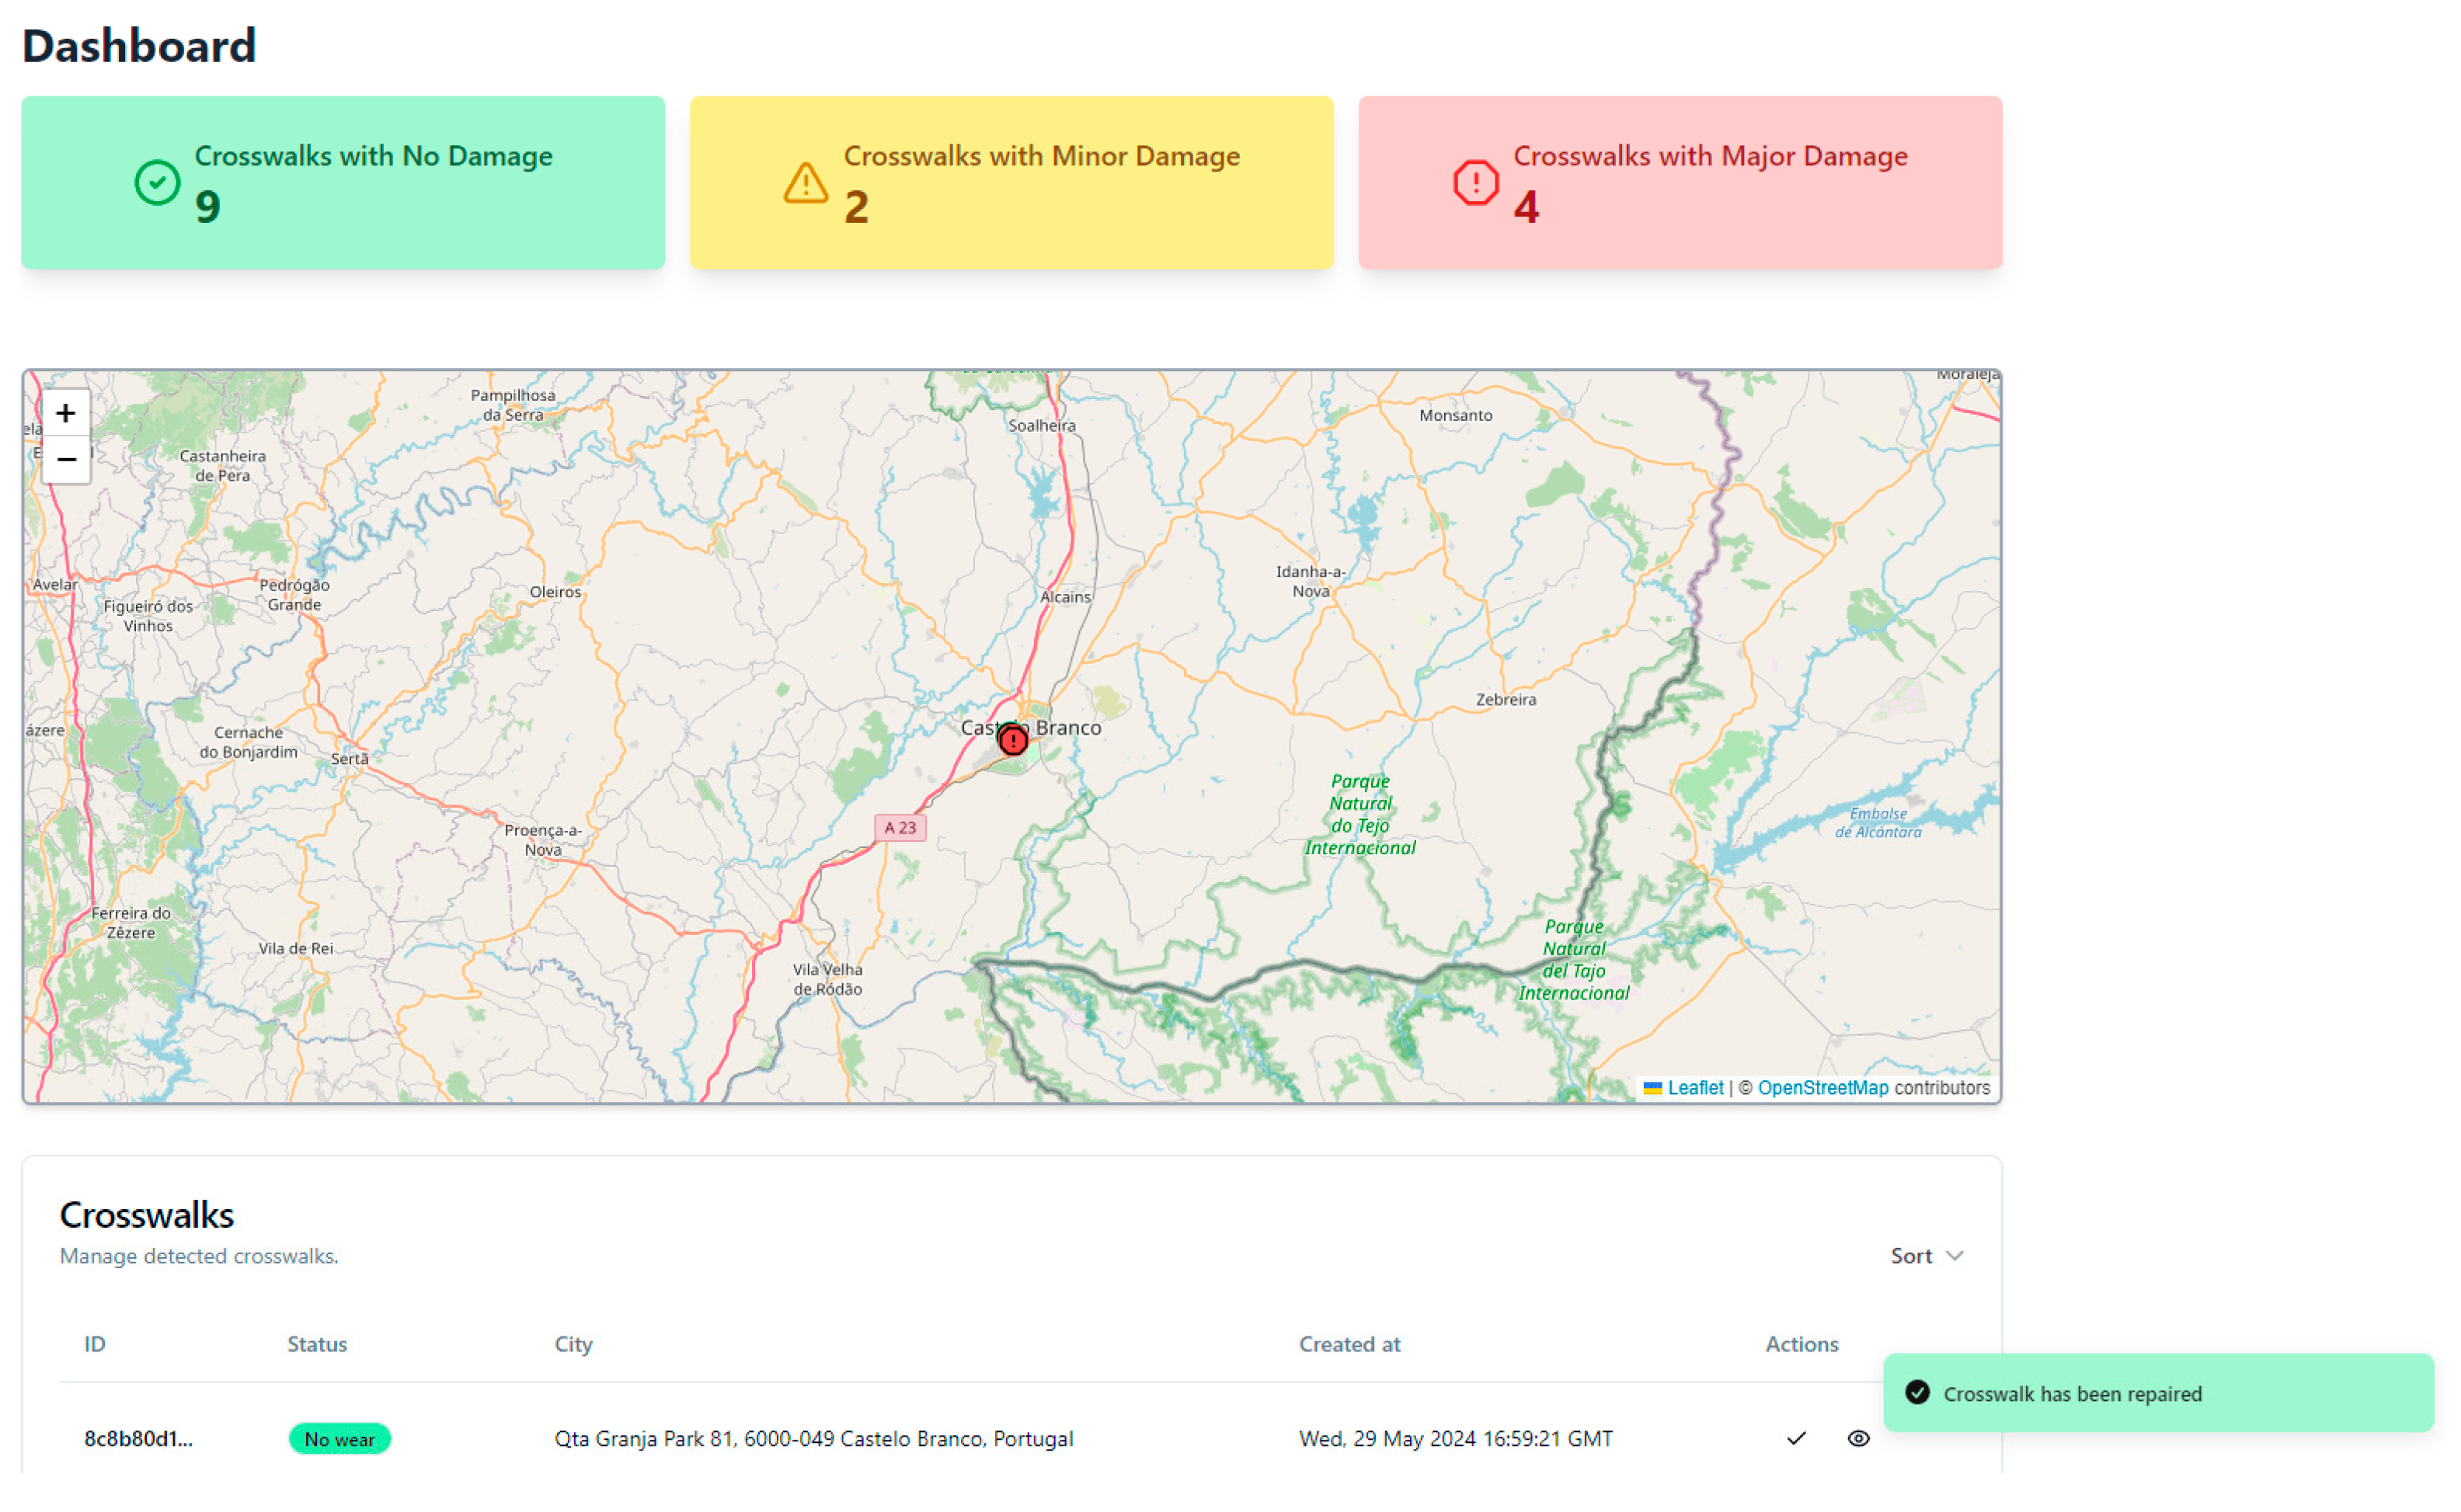
The data transmitted by the Raspberry PI can be viewed on the web platform, as illustrated in Figure 39. This allows for the precise location of the crosswalks and their condition to be observed. This detailed visualization facilitates the monitoring and maintenance of pedestrian infrastructures, thereby contributing to pedestrian safety and convenience.

Figure 39.
Visualization of the data transmitted by the Raspberry PI in the CrosSafe web application.
The results of the conducted tests indicated the necessity to augment the number of images in the dataset. This enhancement is crucial for enhancing the accuracy of the classification of the deterioration of crosswalks. The expansion of this dataset will permit more robust training of the classification models, resulting in more precise and dependable assessments of the condition of crosswalks, which will contribute to more effective and secure crosswalk maintenance.
5. Conclusions
The significance of preserving and maintaining crosswalks cannot be overstated. They not only guarantee pedestrian safety but also play a pivotal role in regulating urban traffic. Maintained crosswalks are essential for preventing accidents and ensuring that individuals of all ages can cross streets safely. However, this urban heritage is at risk due to natural wear and tear and the continuous impact of human activity and climatic conditions. Therefore, effective intervention is necessary to ensure its conservation. The work conducted as part of this project contributes to the maintenance effort. It presents the development of a prototype that employs computer vision techniques and an integrated platform to monitor the deterioration of crosswalks. This platform could be utilized by any entity responsible for maintaining road infrastructures, enabling them to oversee and validate the repairs they require, thereby protecting their citizens from potential accidents and thus contributing to a reduction in the mortality rate due to road accidents.
Several future work research topics remain open, including (1) the creation of a dataset with the capacity to accommodate a significant number of crosswalks in a variety of weather conditions, accompanied by a substantial number of images for each type of deterioration; (2) the continuation of the process of validating the web application with a diverse range of users; (3) utilizing feedback from actual users to incorporate enhancements to the user interface that enhance its usability and functionality; (4) conducting tests and evaluations of alternative CNN models; (5) conducting tests and evaluations of hardware with greater computing resources than those tested in this project.
Author Contributions
Conceptualization, G.J.M.R. and J.M.S.A.; methodology, G.J.M.R. and J.M.S.A.; validation, P.D.G., J.M.L.P.C. and V.N.G.J.S.; formal analysis, P.D.G., J.M.L.P.C. and V.N.G.J.S.; investigation, G.J.M.R. and J.M.S.A.; writing—original draft preparation, G.J.M.R. and J.M.S.A.; writing—review and editing, P.D.G., J.M.L.P.C. and V.N.G.J.S.; supervision, J.M.L.P.C. and V.N.G.J.S.; funding acquisition, J.M.L.P.C. and V.N.G.J.S. All authors have read and agreed to the published version of the manuscript.
Funding
J.M.L.P.C. and V.N.G.J.S. acknowledge that this work was supported by FCT—Fundação para a Ciência e Tecnologia, I.P. by project reference UIDB/50008/2020, and DOI identifier https://doi.org/10.54499/UIDB/50008/2020. P.D.G. thanks the support provided by the Center for Mechanical and Aero-space Science and Technologies (C-MAST) under the project UIDB/00151/2020.
Data Availability Statement
Data is contained within the article.
Conflicts of Interest
The authors declare no conflicts of interest.
References
- Técnica, C. Relatório Novembro 2023; Barcarena: Lisboa, Portugal, 2024. [Google Scholar]
- Song, Z.; Chen, Q.; Huang, Z.; Hua, Y.; Yan, S. Contextualizing Object Detection and Classification. In Proceedings of the IEEE Computer Society Conference on Computer Vision and Pattern Recognition, Colorado Springs, CO, USA, 20–25 June 2011; pp. 1585–1592. [Google Scholar] [CrossRef]
- IBM. What Is Computer Vision? Available online: https://www.ibm.com/topics/computer-vision (accessed on 8 December 2023).
- Sarker, I.H. Deep Learning: A Comprehensive Overview on Techniques, Taxonomy, Applications and Research Directions. SN Comput. Sci. 2021, 2, 420. [Google Scholar] [CrossRef] [PubMed]
- AWS. What Is Deep Learning? Deep Learning Explained. Available online: https://aws.amazon.com/what-is/deep-learning/ (accessed on 12 January 2024).
- Huo, Y.-K.; Wei, G.; Zhang, Y.-D.; Wu, L.-N. An Adaptive Threshold for the Canny Operator of Edge Detection. In Proceedings of the 2010 International Conference on Image Analysis and Signal Processing, Xiamen, China, 9–11 April 2010. [Google Scholar]
- Roy, P.; Dutta, S.; Dey, N.; Dey, G.; Chakraborty, S.; Ray, R. Adaptive Thresholding: A Comparative Study. In Proceedings of the 2014 International Conference on Control, Instrumentation, Communication and Computational Technologies, ICCICCT 2014, Kanyakumari, India, 10–11 July 2014; pp. 1182–1186. [Google Scholar] [CrossRef]
- Rosa, G.J.M.; Afonso, J.M.S.; Gaspar, P.D.; Soares, V.N.G.J.; Caldeira, J.M.L.P. Detecting Wear and Tear in Pedestrian Crossings Using Computer Vision Techniques: Approaches, Challenges, and Opportunities. Information 2024, 15, 169. [Google Scholar] [CrossRef]
- Xu, P.; Li, Q.; Zhang, B.; Wu, F.; Zhao, K.; Du, X.; Yang, C.; Zhong, R. On-Board Real-Time Ship Detection in HISEA-1 SAR Images Based on CFAR and Lightweight Deep Learning. Remote Sens. 2021, 13, 1995. [Google Scholar] [CrossRef]
- Misra, D. Mish: A Self Regularized Non-Monotonic Activation Function. In Proceedings of the 31st British Machine Vision (BMVC 2020), Virtual, 7–10 September 2020. [Google Scholar]
- Bochkovskiy, A.; Wang, C.-Y.; Liao, H.-Y.M. YOLOv4: Optimal Speed and Accuracy of Object Detection. arXiv 2020, arXiv:2004.10934v1. [Google Scholar]
- Roboflow. Crosswalks Dataset > Overview. Available online: https://universe.roboflow.com/projeto-5fy5m/crosswalks-zbjgg (accessed on 5 December 2023).
- Roboflow. Project Overview. Available online: https://universe.roboflow.com/passadeiras/crosswalks-one-class (accessed on 18 April 2024).
- Roboflow. Crosswalks Dataset > Overview. Available online: https://universe.roboflow.com/passadeiras/crosswalks-uo9bq (accessed on 18 April 2024).
- Google Colab. Available online: https://colab.research.google.com/ (accessed on 20 April 2024).
- GitHub-AlexeyAB/Darknet: YOLOv4/Scaled-YOLOv4/YOLO-Neural Networks for Object Detection (Windows and Linux Version of Darknet). Available online: https://github.com/AlexeyAB/darknet (accessed on 22 April 2024).
- Firebase|Google’s Mobile and Web App Development Platform. Available online: https://firebase.google.com/?hl=pt (accessed on 2 April 2024).
- Render. Cloud Application Hosting for Developers|Render. Available online: https://render.com/ (accessed on 2 April 2024).
- JSON. Available online: https://www.json.org/json-en.html (accessed on 7 May 2024).
- AWS. O Que é Uma Chave de API?—Explicação Sobre Chaves e Tokens de API. Available online: https://aws.amazon.com/pt/what-is/api-key/ (accessed on 21 April 2024).
- Chuantao, Y.; Zhang, X.; Hui, C.; Jingyuan, W.; Daven, C.; Bertrand, D. A Literature Survey on Smart Cities. Sci. China Inf. Sci. 2015, 58, 100102. [Google Scholar] [CrossRef]
- Raspberrypi. Buy a Raspberry Pi 5–Raspberry Pi. Available online: https://www.raspberrypi.com/products/raspberry-pi-5/ (accessed on 16 May 2024).
- Botnroll. Módulo Gps Neo-6m-Uart C/ Antena Cerâmica. Available online: https://www.botnroll.com/pt/gps-gnss/4548-m-dulo-gps-neo-6m-uart-c-antena-cer-mica.html (accessed on 16 May 2024).
- Arducam. Arducam 1080P Low Light WDR USB Camera Module with Metal Case. Available online: https://www.arducam.com/product/b020201-arducam-1080p-low-light-wdr-usb-camera-module-with-metal-case-2mp-1-2-8-cmos-imx291-160-degree-ultra-wide-angle-mini-uvc-webcam-board-with-microphones/ (accessed on 16 May 2024).
- EasyEDA-PCB Design & Simulação de Circuitos Online. Available online: https://easyeda.com/pt (accessed on 4 April 2024).
- Maguire, M.; Bevan, N. User Requirements Analysis; Springer: Boston, MA, USA, 2002; pp. 133–148. [Google Scholar] [CrossRef]
- Jama Software. Functional Requirements Examples and Templates. Available online: https://www.jamasoftware.com/requirements-management-guide/writing-requirements/functional-requirements-examples-and-templates (accessed on 16 April 2024).
- Altexsoft. Nonfunctional Requirements: Examples, Types and Approaches. Available online: https://www.altexsoft.com/blog/non-functional-requirements/ (accessed on 16 April 2024).
- Booch, G.; Rumbaugh, J.; Jacobson, I. The Unified Modeling Language for Object-Oriented Development Documentation Set Version 0.9a Addendum; Rational Software Corporation: San Jose, CA, USA, 1996. [Google Scholar]
- UML. Use Case Diagram Tutorial|Lucidchart. Available online: https://www.lucidchart.com/pages/uml-use-case-diagram (accessed on 16 April 2024).
- OpenCV.Open Computer Vision Library. Available online: https://opencv.org/ (accessed on 4 April 2024).
- GitHub. Arunponnusamy/Cvlib: A Simple, High Level, Easy to Use, Open Source Computer Vision Library for Python. Available online: https://github.com/arunponnusamy/cvlib (accessed on 4 April 2024).
- GitHub. Knio/Pynmea2: Python Library for Parsing the NMEA 0183 Protocol (GPS). Available online: https://github.com/Knio/pynmea2 (accessed on 8 May 2024).
- Available online: https://nodejs.org/en (accessed on 2 April 2024).
- Fastify. Fast and Low Overhead Web Framework, for Node.Js. Available online: https://fastify.dev/ (accessed on 2 April 2024).
- Firestore. Firebase. Available online: https://firebase.google.com/docs/firestore (accessed on 16 May 2024).
- Prisma. Simplify Working and Interacting with Databases. Available online: https://www.prisma.io/ (accessed on 21 April 2024).
- Microsoft Learn. Web API Design Best Practices-Azure Architecture Center. Available online: https://learn.microsoft.com/en-us/azure/architecture/best-practices/api-design (accessed on 21 April 2024).
- Bloch, J. How to Design a Good API and Why It Matters. In Proceedings of the OOPSLA ′06: Companion to the 21st ACM SIGPLAN Symposium on Object-Oriented Programming Systems, Languages, and Applications, Portland, OR, USA, 22–26 October 2006. [Google Scholar]
- Postman. Postman API Platform Sign Up for Free. Available online: https://www.postman.com/ (accessed on 18 April 2024).
- Geoapify. Reverse Geocoding API Lat/Lon to Address. Available online: https://www.geoapify.com/reverse-geocoding-api (accessed on 18 April 2024).
- Render Docs. Web Services. Available online: https://docs.render.com/web-services (accessed on 8 April 2024).
- React. Available online: https://react.dev/ (accessed on 2 April 2024).
- Typescrip. TypeScript: JavaScript with Syntax for Types. Available online: https://www.typescriptlang.org/ (accessed on 21 April 2024).
- Vite. Next Generation Frontend Tooling. Available online: https://vitejs.dev/ (accessed on 2 April 2024).
- Tailwind CSS. Available online: https://tailwindcss.com/ (accessed on 31 March 2024).
- Shadcn/Ui. Available online: https://ui.shadcn.com/ (accessed on 21 April 2024).
- Leaflet. A JavaScript Library for Interactive Maps. Available online: https://leafletjs.com/ (accessed on 18 April 2024).
- Logrocket. Rendering Large Lists in React: 5 Methods with Examples-LogRocket Blog. Available online: https://blog.logrocket.com/render-large-lists-react-5-methods-examples/ (accessed on 19 April 2024).


Disclaimer/Publisher’s Note: The statements, opinions and data contained in all publications are solely those of the individual author(s) and contributor(s) and not of MDPI and/or the editor(s). MDPI and/or the editor(s) disclaim responsibility for any injury to people or property resulting from any ideas, methods, instructions or products referred to in the content. |
© 2024 by the authors. Licensee MDPI, Basel, Switzerland. This article is an open access article distributed under the terms and conditions of the Creative Commons Attribution (CC BY) license (https://creativecommons.org/licenses/by/4.0/).