


Historic Socio-Hydromorphology Co-Evolution in the Delta of Neretva
Faculty of Civil Engineering, Architecture and Geodesy, University of Split, Matice Hrvatske 15, 21000 Split, Croatia
Appl. Sci. 2024, 14(15), 6477; https://doi.org/10.3390/app14156477
Submission received: 25 May 2024
/
Revised: 21 June 2024
/
Accepted: 10 July 2024
/
Published: 25 July 2024
(This article belongs to the Special Issue Topical Advisory Panel Members’ Collection Series: Environmental Hydrology)
Abstract
:This study presents the historical sequence of the inter-relationship between climate, sea-level change, hydromorphology, and the society in the “Delta of Neretva”, Croatia. This study aims to support future-oriented planning, since the cumulative impact of climate and mean sea-level changes on the delta hydromorphology and socio-economy is very uncertain and difficult to predict. In particular, the sustainability development of the Delta of Neretva requires a long-range strategy that is complicated to outline. In the proposed approach, hydromorphology is used as a sustainability indicator since it considers both the physical character and water content of the delta and looks at how nature and human activities influence the biophysical system and economy. The direction of delta progression and persistence of socio-hydromorphology are evaluated with the assessment of system entropy generation considering the simple system state function. Such a method overcomes the difficulties posed by top–down and bottom–up approaches, making future scenarios and cumulative impacts visible and understandable to stakeholders. The historical co-evolution results indicate that the delta in the future could become a submerged estuary (rias), that is, a sea bay as a result of the subsequent delta progradation caused by an MSL rise, similar to the progradation during the Holocene, and decreasing sediment deposition due to anthropologic processes in their watershed. Technology (policy) assessment suggests that adaptation measures that gradually support environmental security and sustainable livelihoods, i.e., increase natural order at a society-acceptable cost, are preferable.
1. Introduction
The issue of the sustainability of the Delta of Neretva is complex, and the results are uncertain because the historical state of the hydromorphology continuously feeds back into the human system, and vice versa, as shown in Figure 1. Changes occur cyclically in accordance with historical cycles of climate and mean sea-level (MSL) changes and historic changes in the socio-economy and hydromorphology. This is why sustainability assessments should include the historical study of the interplay between hydromorphological and social processes and a comparative analysis of the co-evolution and self-organization of human and hydromorphological systems. It is a scientific field of historic socio-hydromorphology and an assessment that progressively moves from an understanding of past processes and trends, through an explication of present conditions and trends, and finally to, a projection of probable future state. This is a broader research area than socio-hydrology [1,2]. An approach, in addition to water, includes the basin sediment system as a part of the land–water coupling system influenced by historic climate change and human activities in the river system. Therefore, such a study is a very suitable supplement to the development of integrated water resource management plans for the River Neretva [3,4].
Sustainability includes the resources of water, energy, and food (WEF) that assess the links between ecology and the physical habitat, including concerns about the implications of human-induced modifications. Hydromorphology is a factor that ensures essential resources for the biosphere and humans, as it considers the physical characteristics and water content of water bodies [5]. This is why the historic socio-hydromorphology scientific field is relevant for the study of coupled human–water resource system sustainability. It is a new approach that fully assesses the processes, conditions, and risks in the river system, because the river basin sediment system operates over a very long timescale, and the consequences cannot be observed within the lifetime of the water projects. Climate and the sediment system create, throughout their length, the morphology upon which the other functions of the system depend and, ultimately, determine the sustainability of the system.
A wide range of quantitative and qualitative tools and methods have been applied to overcome challenges dealing with the complex natural–human system and historical development issues (bottom-up strategies) and with the uncertainty of the results (top-down strategies) [6]. Socio-hydrological systems like river basins and phenomena that involve emergent patterns in the time domain are mostly analyzed [7,8,9]. For this reason, it is necessary, in the river system or its specific part, to assess the co-evolution and self-organization of the social–hydrological system driven by interactions and feedback using a simple expletory model [10]. This includes analyses, hydrological processes, ecological processes, and socio-economic processes, which are coupled together via water consumption activities and water allocation policies with the water balance equation for hydrological process and logistic growth equations for the evolution of vegetation, irrigation, and the population. Such studies focus on the modeling framework, feedback network, and positive and negative feedback loops, which make the socio-hydrological system sustainable. It turns out that in most studies, the history of climate change and MSL change impacts are not the subject of research. However, the historical socio-hydrological method has been applied, where climate change has been considered in the assessment of the co-evolution of humans and water in the Tarim River Basin, but the historical aspects of hydromorphology have not been considered [10].
The proposed historical socio-hydromorphological assessment is based on qualitative assessment by the application of thermodynamic-based principles, which approaches the river basin as an energy system or ecosystem [11]. With this approach to hydromorphology and system sustainability assessment, the historical entropy change of the natural system serves as the basis for the co-evaluation and sustainability assessment of the socio-economic system. Such thermodynamic-based principles have been used to avoid biasing the model to predict the social behaviors that we think should occur. The modeling is based on collecting knowledge of a system’s history and using logic or rules, including thermodynamic-based principles, to make conclusions. Such heuristic modeling is simple and based on system theory, with an establishment of the system boundaries, subsystems, and internal and external processes, and a simple gathering of knowledge of historical system input–output behavior to determine the environmental and social trends of change. It is important to understand system processes well enough that logic can be used to determine possible future outcomes. It is a practical approach useful to overcome the difficulties posed by top–down and bottom–up approaches. Such an approach emphasizes the historical aspects of climate and MSL changes as external impacts and river/delta morphology development, which is at the same time the main internal factor of change, and impacts socio-hydromorphological processes and the sustainability of both natural and human systems.
Thermodynamic assessment mostly uses statistical entropy, thermodynamic entropy, or both together—known as physical entropy, i.e., an approach based on long time series of research subject data, in order to maximize the information base or assess the uncertainty and/or randomness of series [12,13,14]. Since historical time series on the hydromorphology of the Delta of Neretva are not available, an approach based on a qualitative interpretation of the thermodynamics of the River Neretva system is used. The river system or delta is treated as an open natural system through which energy and matter flow and have been mobilized in cycles providing dynamic closure and stability of the system, i.e., sustaining the system. Internal and external cycles are linked together and are repeated according to changes in external (climate) and internal water energy, impacted by man-made water structures and management operations. This is the key issue which drives the functions of the delta biophysical system and its sustainability. The purpose of the study is to assess the sustainability of the Delta of Neretva biophysical environment and economy and analyze possible mitigation and adaptation strategies to climate change on the global scale (policy and technology), based on local results obtained from an analysis of the historical socio-hydromorphological co-evolution.
2. Materials and Methods
2.1. Study Area
The Neretva River Basin is located in Bosnia–Herzegovina (B&H), with its delta and mouth in Croatia (Figure 1). The Neretva River is of great socioeconomic and environmental importance to B&H and Croatia. More than 350,000 inhabitants live in the watershed. The river water mainly flows through karst areas and exhibits typical karst hydrological characteristics [4,12]. The length of the river is approximately 240 km, and the basin size is approximately 10,100 km2. The river has more than 30 permanent and occasional tributaries. The average height of the basin is 250 m above sea level (ASL), and springs are located at a height of 1095 m ASL [15]. The climate is Mediterranean in the lowland area close to the sea, whereas the middle part has a continental climate, and the higher area has a mountainous climate. Temperatures range between −29° C and 43° C, and the annual evapotranspiration is 500–900 mm. The average rainfall is 1650 mm. Most of the precipitation occurs in winter (November), while summer (July) is often without precipitation. The average discharge is 269 m3/s, with a minimum of 44 m3/s (probability: 0.05) and a maximum of 2179 m3/s (probability: 0.1) [15]. The mean annual runoff coefficient is high, at approximately 0.65.
The river has three characteristic functional zones—namely, a steep upstream zone that forms the productive zone, a milder lowland zone with a small drop at the bottom of the bed that forms the transit zone, and a delta zone with an extremely small drop that forms the accumulation zone. Nine hydroelectric power plants have been built in the upper stream, and several more are planned [4]. In the middle course, from Čapljina to Metković, the river flows through alluvial valleys (4–6 m ASL). Owing to its fertile soil, abundant water, and favorable climate, the valley is used for agricultural production. The river valley narrows significantly near the village of Gabela, where a bottleneck effect occurs, and then widens again into a valley and delta situated in Croatia. This is called the Neretva Delta or just the delta (Figure 1). In 1887, the river was regulated from Metković to the sea for navigability and flood protection, and the delta was reclaimed for agricultural and urban areas [16].
The delta covers an area of 156 km2, and the river is 19 km long. The entire area is relatively low, from 1 to 6 m ASL. In the past, most of the area was flooded, forming a land delta system built from fluvial sediments in a standing body of water. The delta is a major source of WEF resources. Many coastal and underwater karst springs at the edge of the karst valley recharge the surface water in the delta [4]. The area is ecologically significant and, together with the upland area in B&H, forms important coastal marsh areas in the Mediterranean. Since 1992, the peripheral parts of the delta along the karst massifs have been an ichthyological and ornithological reserve under the protection of UNESCO; in B&H, it is Hutovo Blato (since 2001). In the ornithological reserve, the local species “Blue Eye and Lake Desne,” “Ušće Neretva,” and “Kuti” are protected.
The Neretva Delta has the highest production of citrus fruits in Croatia, as well as winter and early spring crops. The plain has more than 70,000 inhabitants living in several settlements, the largest being Metković and Ploče, the second-largest sea harbor in Croatia. Water management is technically and politically complex because numerous settlements and socioeconomic assets have developed in the delta area, which are increasingly threatened by climate change and the rise in the MSL.
2.2. Methodology
Sustainable development assessments require a long-term approach and strategy because technology continuously shifts the boundaries of the human ability to manipulate nature. However, nature itself does not shift its boundaries. Therefore, sustainable development must consider the constraints imposed by nature, which can be recognized in historical biophysical environment evolution. Historical long-range cumulative impacts (CIs) have been documented in historical documents, maps, and research. They present the totality of interactive impacts over time—that is, the sum of incremental synergic effects caused by climate change and MSL rise, as well as all human actions and technology over time and space.
Long-range assessment aims to overlap climate, geomorphology, hydrology, hydromorphology, oceanography, and ecological development and management circles aimed at the better social control of technology and the strategic management of alternative options. The hypothesis of a coupled system can be adapted or updated by reconciling it with historical and comparative socio-hydromorphology in an iterative manner. When cyclically iterated over time, the proposed pathways will enable the generation of knowledge that may explain the diversity of phenomena occurring under different climate, socio-hydromorphological, and technological (policy) conditions in terms of common or similar mechanisms. This is of high value for assessing future processes and their impacts. In such an approach, future technological implications for the system’s hydromorphological state must be recognized because the basin’s sediment system is its fundamental structural system and has a long memory (a property of its huge storage capacity). Therefore, any changes in balance are corrected extremely slowly. The steps of the scientific inquiry are as follows:
- Historical climate, sea-level rise, and hydromorphological documentation to understand the coupled processes related to climate and MSL change over time and between the climate and hydromorphology of the river system and delta from its distant past.
- Historical hydromorphological and social coupled evidence to understand their historic interactions, impacts, and mutual consequences.
- Historical socio-hydromorphology and contemporary setting to understand the hypothesis about the nature of observed social and hydromorphological processes—that is, two-way feedback, which contributes to the dynamics of the coupled human–water resource management system, security of WEF resources, and sustainability.
This methodology allows us to build hypotheses regarding how the human–hydromorphological system may be dynamically interconnected in a wide range of uncertain future development scenarios. The hypotheses on the sustainability of a social and hydromorphological coupled system are adapted or updated by reconciling them with historical and comparative socio-hydromorphology iteratively: hypotheses → data evidence → updated hypotheses.
The sustainability of a river delta system is assessed using thermodynamic criteria because the river system is characterized by the flow of matter and energy in the system and between the system and its environment [17]. Stream power quantifies the amount of work that can be performed by a stream in a biophysical environment, such as moving sediment and nutrients that support environmental processes and sustainability. The amount of energy and matter dissipated by these processes generates entropy owing to heat and mass transfers. Therefore, the potential energy drop in the river or delta system is equal to the work done to the bed and banks forming channels and networks and achieving minimal total energy dissipation in the system that passes through a continuous sequence of equilibrium states to be quasi-static—that is, sustainable. Thus, energy dissipation defines the level of imbalance or disorder in the system or system entropy resulting from climate change, MSL changes, and human impacts. It is also significant that the entropy change can be determined without detailed information on the process because entropy is a state function defined from the equilibrium state. Therefore, entropy change is a useful indicator for assessing the sustainability of complex natural systems, such as deltas [18].
The delta thermodynamic system is complex because it integrates river flow and marine energy composed of thermal, kinetic (waves and currents), and chemical (mixing of waters of different salinity gradients) energy. Therefore, assessing the self-organized delta distributions of water, sediment, and nutrients is difficult.
The entropy change of the open natural system, dSsystem, is composed of the entropy exchange with the environment, dSe, and the internal entropy change, dSi:
dSsystem = dSe + dSi.
Differentiating this equation with respect to time gives the speed of change in the system entropy, dS/dt, which is equal to the speed of change in entropy between the system and the environment plus the system, and the speed of entropy production inside the system:
dSsystem/dt = dSe/dt + dSi/dt.
The entropy exchange with the environment, dSe/dt, which considers the process of energy exchange with the environment, can be positive or negative; however, dSi/dt can only be positive. This implies that the general entropy of a natural system can increase or decrease. However, the entropy of an open system decreases at the expense of the associated processes that produce positive entropy in other parts of the environment. In the open system study flow condition, the entropy change of a system is theoretically zero, and the system is sustainable, ΔSsystem = 0. However, a characteristic of natural systems and organisms is that the system is in near-perfect order or a quasi-static state, and the system entropy has a minimal positive value.
The minimization of entropy generation in man-made systems can be accomplished by designing the operating conditions. In a natural system, it occurs by capturing energy and matter from the environment to overcome the internal entropy increase. Therefore, the value of entropy corresponds to the entropies of the real system at a certain time and can be determined only by the set of local variables characterizing the state of the system. Climate and sea-level change affect the potential energy and entropy or sustainability of river systems—that is, their vulnerability—because entropy (uncertainty, disorder) and vulnerability are interrelated. The more disordered the system and the higher the entropy, the less energy is available for the system to work. Disorder—that is, the system equilibrium change—is transferred to the river’s hydromorphology and ecosystems and changes the availability of WEF resources such that the system or delta gradually produces a new, less efficient biophysical environment. This reduces the availability of WEF resources for ecosystems and human society and endangers the biophysical economy and sustainable livelihoods.
The effects of changes in energy and sediment supply in river basins, MSL rise, and seawater energy on deltas are multifaceted and complicated when it comes to simulations and future projections under variable climatic regimes. However, the equilibrium states of delta hydromorphology can be approximated using the following equation [18]:
where Qriver (m3/yr) is the fluvial sediment supply by the river that is retained at the delta (fr between 0 and 1), R (m/yr) is the rate of MSL rise, and A (m2) is the surface area of the delta as the sum of the delta topset area Atopset (m2) and foreset area Aforeset (m2). As Equation (4) characterizes the state of the system as defined by local variables, it can be used to determine the entropy of the system. Therefore, the state of equilibrium at the beginning and end of the period is determined, not the inner processes, because entropy is a property of the system. When Equation (3) is balanced, the delta study aggrades vertically with the MSL rise, no horizontal shoreline movement occurs, and the system is in a stationary state. The disorder in the system and entropy generation are low. System deviations from this balance result in delta regression (progradation) or transgression (retrogradation). Inner processes occur and bring the system back to a stationary state. Therefore, any deviation from the stationary state increases the speed of entropy production.
Qriver · fr = R · Adelta,
In the case of an MSL rise, delta submergence results in additional space for sediment to be disposed of on the topset (storage increase), which enhances sediment aggregation and reduces shoreline regression. If the sediment supply is low, the available space on the delta plain generated by the MSL rise cannot be filled, and the delta will be transgressive (Qriver · fr < R · Adelta) to sustain the dynamic cycles necessary for activities to be coupled. If the sediment supply is sufficient, the delta can maintain its size and equilibrium (Qriver · fr = R · Adelta) or prograde seaward (Qriver · fr > R · Adelta). Rises that change the delta area can be explored based on the deviation from the equilibrium (Equation (3)) and used for sustainability assessment, assuming that the entropy or disorder (Sdelta) is the absolute difference between the sediment supply and the effects of MSL rise on the delta’s natural system.
Sdelta = |Qriver · fr − R · Adelta|.
This is a state function, imbalance, or risk that arises because of disturbances caused by global and local human activities or natural causes. Theoretically, Sdelta can be expressed as follows:
0 < Sdelta < ∞.
When the value of Sdelta approaches 0, the system is in near-perfect order, its processes are in a stationary state, and the inner irreversible changes maintain the stability of the equilibrium state. As the deviation or disorder increases, the speed of entropy production and the value of Sdelta increase, and the entropy in the system increases. Therefore, any deviation from the stationary or equilibrium state causes entropy generation, which reduces sustainability. Finally, it can theoretically approach a large value (maximum disorder), which indicates that the delta dry land area increases when the amount of sediment load in the delta is constantly high, or the sea area or bay increases when the sediment supply reaches very low values. In both cases, the sum of entropy changes in the system is always positive. The speed and duration of the process determine the outcome or level of change.
The entropy change for a delta system during a process in a certain period is as follows:
DSdelta = Sdelta, final − Sdelta, initial.
Therefore, when the entropy change of a delta system has a minimal positive value or equals zero if the state of the system does not change during the process (study conditions), the delta hydromorphology is sustainable, and the system maintains its organization. However, when it is positive, the delta system is unsustainable and changes the biophysical system.
In the proposed approach, only (historic) qualitative assessment is applied because it is only possible to assess the direction of change (transgressive or regressive) and not the speed of change. The direction of change can be assessed by assuming an equilibrium change between the sediment supply and the rate of MSL increase (Equation (3)). The delta will never return to its previous hydromorphological state because it has moved and reshaped itself in the period until the reestablishment of the equilibrium state—that is, it is seemingly static. Hence, we can recognize the direction of changes but not the details of the inner process that created the new delta environment, and the entropy value corresponds to the entropy of the real system at a certain time (Equation (5)). However, the flow of energy (water) may increase locally, whereas the overall order decreases.
In this study, the sequence of changes in climate, MSL, and socio-hydromorphological features in the delta area were considered in historical periods—namely, the Prehistoric Era (3200–1100 BC), Classical Era (1100 BC–AD 476), Middle Ages (AD 476–1400), Ottoman Empire or Early Modern Period (AD 1400–1850), and Late Modern Period (AD 1850–present day). These are relevant socioeconomic periods corresponding to the periods of change and climatic conditions in the east Adriatic sea coast.
3. Case Study Results
3.1. Historical Climate, Sea-Level Change, and Hydromorphology
3.1.1. Climate
The climate changes relatively quickly, affects the energy of the environment and life on Earth, and shapes the natural features of the Earth’s surface through physical and chemical weathering. No relevant local data exist on climate change on the eastern coast of the Adriatic region. Therefore, historical climate change was considered based on the situation in Europe and the Mediterranean [19,20,21].
Until modern times, climate change in Europe was caused by natural processes, but since 1850, humans have become increasingly significant generators of climate and environmental change. In prehistory (3200–1100 BC), the climate was warm and dry (subboreal climate) and favorable to nature and people (Holocene climatic optimum). After 2500 BC, the “Subatlantic” was created, which is the current climatic age of the Holocene epoch. Throughout history, owing to volcanic activity, solar radiation has dramatically decreased, and there has been a global drop in temperature, a change in the precipitation regime, and problems with food production and nutrition, which have caused socioeconomic problems [19,20]. Thus, in the last 4,500 years, there have been 45 major decreases in temperature and cold periods of varying duration, and 2 decreases of shorter duration have occurred since 1970, indicating that volcanic activity continues to affect air temperature and precipitation regimes.
In ancient times, the air temperature in the Mediterranean rose, reaching its height in around 50 BC (the Roman Warm Period; Figure 2). Between 27 BC and AD 547, the climate changed significantly and became colder, which negatively affected the environment and humanity [19]. From AD 750 to 1050, warming and a decrease in climate variability occurred. This was the period of the medieval climatic optimum. From 1050, the variability returned. After the eruption of the Samalas volcano in 1257, the eruptions of more than 30 volcanoes, and the expansion of Arctic ice, a small ice age occurred that lasted until 1800. Since 1860, the air temperature has been rising, creating a modern climate optimum that continues to this day. At the beginning of the 20th century, under the influence of humans (greenhouse gases), temperature and weather variability significantly increased again.
3.1.2. Mean Sea-Level Change
The rising seawater level is mostly due to a combination of meltwater from glaciers and ice sheets and thermal expansion of seawater as it warms as a result of climate change and rising air temperatures. These are extremely slow changes in relation to climate change, which alters the river system and position of the coast, river mouth, and delta environment. It affects the river geopotential energy, energy, and mass balance of the river system—that is, the system entropy.
During the Ice Age, the sea level was approximately 125 m lower than it is today; hence, the mouth of the Neretva was in the middle of today’s Adriatic Sea (Figure 3), and the area of today’s delta was a river valley. Therefore, the basin and length of the river were considerably greater than today [22,23]. The warming and melting of the ice massifs during the Pliocene, Pleistocene, and Holocene caused the sea level to rise, varying from as low as about 6.0–9.9 mm/yr to as high as 30–60 mm/yr during brief periods of accelerated rise. This caused the movement of the river mouth and delta toward the interior of the continent (top transgressive coast; Figure 3). In the early Neolithic, the sea was approximately 35 m above today’s level (10,000 years ago), and 5000 years ago it was 4 m above the current MSL (Figure 4a) [23].
With the cooling that occurred after the Roman Warm Period, the MSL rise slowed down, and the sediment filled the available area in the delta and expanded and moved the land, coasts, and estuaries deeper into the sea (bottom) regressive coast. How warm and cold periods throughout distant history impacted MSL changes in shorter periods is unknown; however, the general trend is known (Figure 4a). However, data from recent history (the Roman period) are more reliable because they can be detected based on archaeological data (Figure 4b).
The sea-level rise after the Roman Warm Period was slower (about 0.6 mm/yr); hence, the mouth of the Neretva River moved from the interior to its present position (Figure 3) [23]. This could be the period when the Neretva Delta that we know now formed. In the Adriatic Sea, the MSL 2000 years ago was lower, at −1.26 ± 0.06 m (Figure 4b), and the water depth in the delta area was several meters higher than today. Presently, the Roman port on the Adriatic coast is at a depth approximately 1.5 m below MSL; therefore, the bottom next to the port was probably several meters lower. The rise in sea level in the first 900 years AD was even slower; the river valley and delta were increasingly filled with sediment and spread into the sea area. Thereafter, the MSL rise accelerated, reaching 1.8 mm/yr in the last 100 years, amounting to about 20.32 cm [24]. Based on satellite data, from 1993 to 2020, the average MSL rise was 3.25 ± 0.3 mm/yr, while acceleration was estimated at 0.1 mm/yr2, making the delta susceptible to faster transgression [26]. Sea-level rise is a reliable indicator of climate change.
3.1.3. Hydromorphology
Water in stream channels and networks originates from precipitation in the river basin (climate), overland flow, subsurface flow, and groundwater flow. The streams were in dynamic equilibrium, with the slope adjusted to provide the velocity necessary for the transportation of the eroded sediment and supply from the drainage basin. During this time, several local changes to the land and stream channels in the watershed area, as well as sea-level changes, caused streams to become unstable until equilibrium was established [27]. Natural hazards and human activities changed the existing equilibrium (order) and, subsequently, the stability of sediment supply and transport, forming unstable streams and deltas. An unstable stream attempted to adjust the slope through degrading or aggrading processes to sustain the balance (order) of the sediment supply. River energy was used for this. Sediment accumulation resulted in sediment storage along the banks and in the flood zones of the delta and was affected by vegetative cover and sunlight that penetrated the stream, channel bottom type, and diversity of vegetation that grows along the banks as the WEF moves downstream to the delta and sea [27,28]. Further, the WEF flow, dynamic flow closures, and storage are processes that impact the sustainability of nature, stream channels, and delta hydromorphology.
The historical sequence of the Neretva River and Delta’s hydromorphology is divided into the following two periods:
(i) The period of changes caused exclusively by natural forces and processes, which is the period up to the modern era (1850) (Figure 5a–c); and (ii) the period after 1850, when humans, by exploiting water resources, regulated the river and meliorated the drainage of the delta area, changing fluvial processes and the river’s dynamic equilibrium (Figure 5d).
Until 1850, the river system evolved slowly through natural processes, and the speed of change in system entropy, dS/dt, was extremely low. Over that long period, humans did not influence the river system, but the river influenced livelihoods in the river basin. The changes between ecology and physical habitat were not rapid; hence, human society had time to adapt to the new biophysical environment and strengthen their biophysical economy and livelihoods. The CIs of tectonics, climate, sea-level change, and seawater energy are most reflected in the lower river zone and delta’s hydromorphology and biophysical environment. The tectonics and geometry of the receiving basin are defined by the hinterland characteristics, slope, relief, and discharge. Climate controls the sediment–water yield and in situ delta deposits, whereas MSL change and oceanography define river mouth processes, wave processes, tide processes, winds, nearshore currents, shelf slopes, and river system potential energy.
Throughout history, the MSL change has had a long-term cumulative influence on the development of the delta, which has changed the position of the river mouth in the Adriatic Basin and, thus, the total energy of the river system [22,28]. During the Ice Age, the river delta was in the middle of the Adriatic Basin, and unlike today, it was open to the action of waves, tides, and currents (Figure 3). As the sea level rose, the river mouth and delta receded closer to the current position, which was sheltered between the island of Hvar and the Pelješac Peninsula, reducing the influence of waves and currents and strengthening the influence of the river. Over the last 2000 years, the delta has formed within a stable dolomite and limestone valley at the top of the sea channel, protected from wave and current impacts [28].
Consequently, the Neretva River’s fluvial-dominated delta was formed with microtidal settings and limited wave energy, where delta-lobe progradation was significant, and the redistribution of mouth bars was limited. The deposits of this river-dominated delta have well-developed delta-top facies comprising channel and overbank sediments. The channels build out to form the “toes” of the “bird’s foot”, between which there are large interdistributary bays (Figure 5c). These bays are relatively sheltered and are sites of fine-grained subaqueous sedimentation. In front of the channels, mouth bars have formed, localized to the areas in front of the individual delta lobes.
Since the Ice Age, the MSL has risen about 10 mm/yr and constantly moved the mouth of the river deeper and deeper into the land, thus spreading the influence of seawater deeper into the land environment. This constantly reduced the river production zone (watershed), water, and sediment supply. The space on the delta plain generated by the MSL rise could not be filled, so the delta constantly transgressed. Therefore, throughout history, the total length of the river and river zone has constantly reduced (approximately 120 km) [22,23,28].
The rapid rise in sea level and the upstream movement of the estuary and delta averaged 4 cm/yr, ending at the beginning of antiquity. During the antiquity period, the MSL rise slowed down, the equilibrium changed, and a delta (bottom) regressive coast arose, moving the mouth downstream by about 12 km (at an average of 3 m/yr). This increased the influence of the river on delta hydromorphology and biodiversity. This process continued until the beginning of the 20th century, when the equilibrium state changed again and the delta transgressed. The delta transgress process was caused by a rapid MSL rise and low sediment supply owing to the construction of large reservoirs in the river’s upper zone and land reclamation in the lower zone. Today, sediment is transported directly to the coastal sea, outside the “existing” delta. The significant delta areas have less physical variety and connectivity to surrounding areas and do not flood as frequently. Sediment accumulation is significantly reduced, as is the transboundary flow of energy and mass. The river’s hydromorphologies and biophysical environments are unstable and vulnerable and generate high entropy, thus reducing ecosystem services and increasing risks to nature, society, and the economy. Simultaneously, reclaimed land and polders are increasingly exposed to river and seawater energy.
Free transboundary interactions between MSL change and seawater energy occurred only in the peripheral areas of the Neretva Valley. The sediment supply in these areas is extremely low because only local karst watershed areas generate sediment. The characteristics of the natural delta, which is currently a protected wetland area, have been partly preserved. Bottom transgression also occurs in the river itself owing to the influence of the sea and reduced sediment supply, as well as an increase in the level of surface freshwater owing to the intrusion of seawater, thereby raising the groundwater level. Reclaimed lands (polders) are functionally separated from the river and sea energy processes. However, indirect transgression affects polders due to saltwater intrusion into coastal aquifers. This is why the transgression effects will ultimately be the same (flooding) if water pumping does not reduce the levels of surface water and groundwater. Thus, global climate change and historic local human interventions create negative CIs on the delta’s biophysical environment, society, and the biophysical economy.
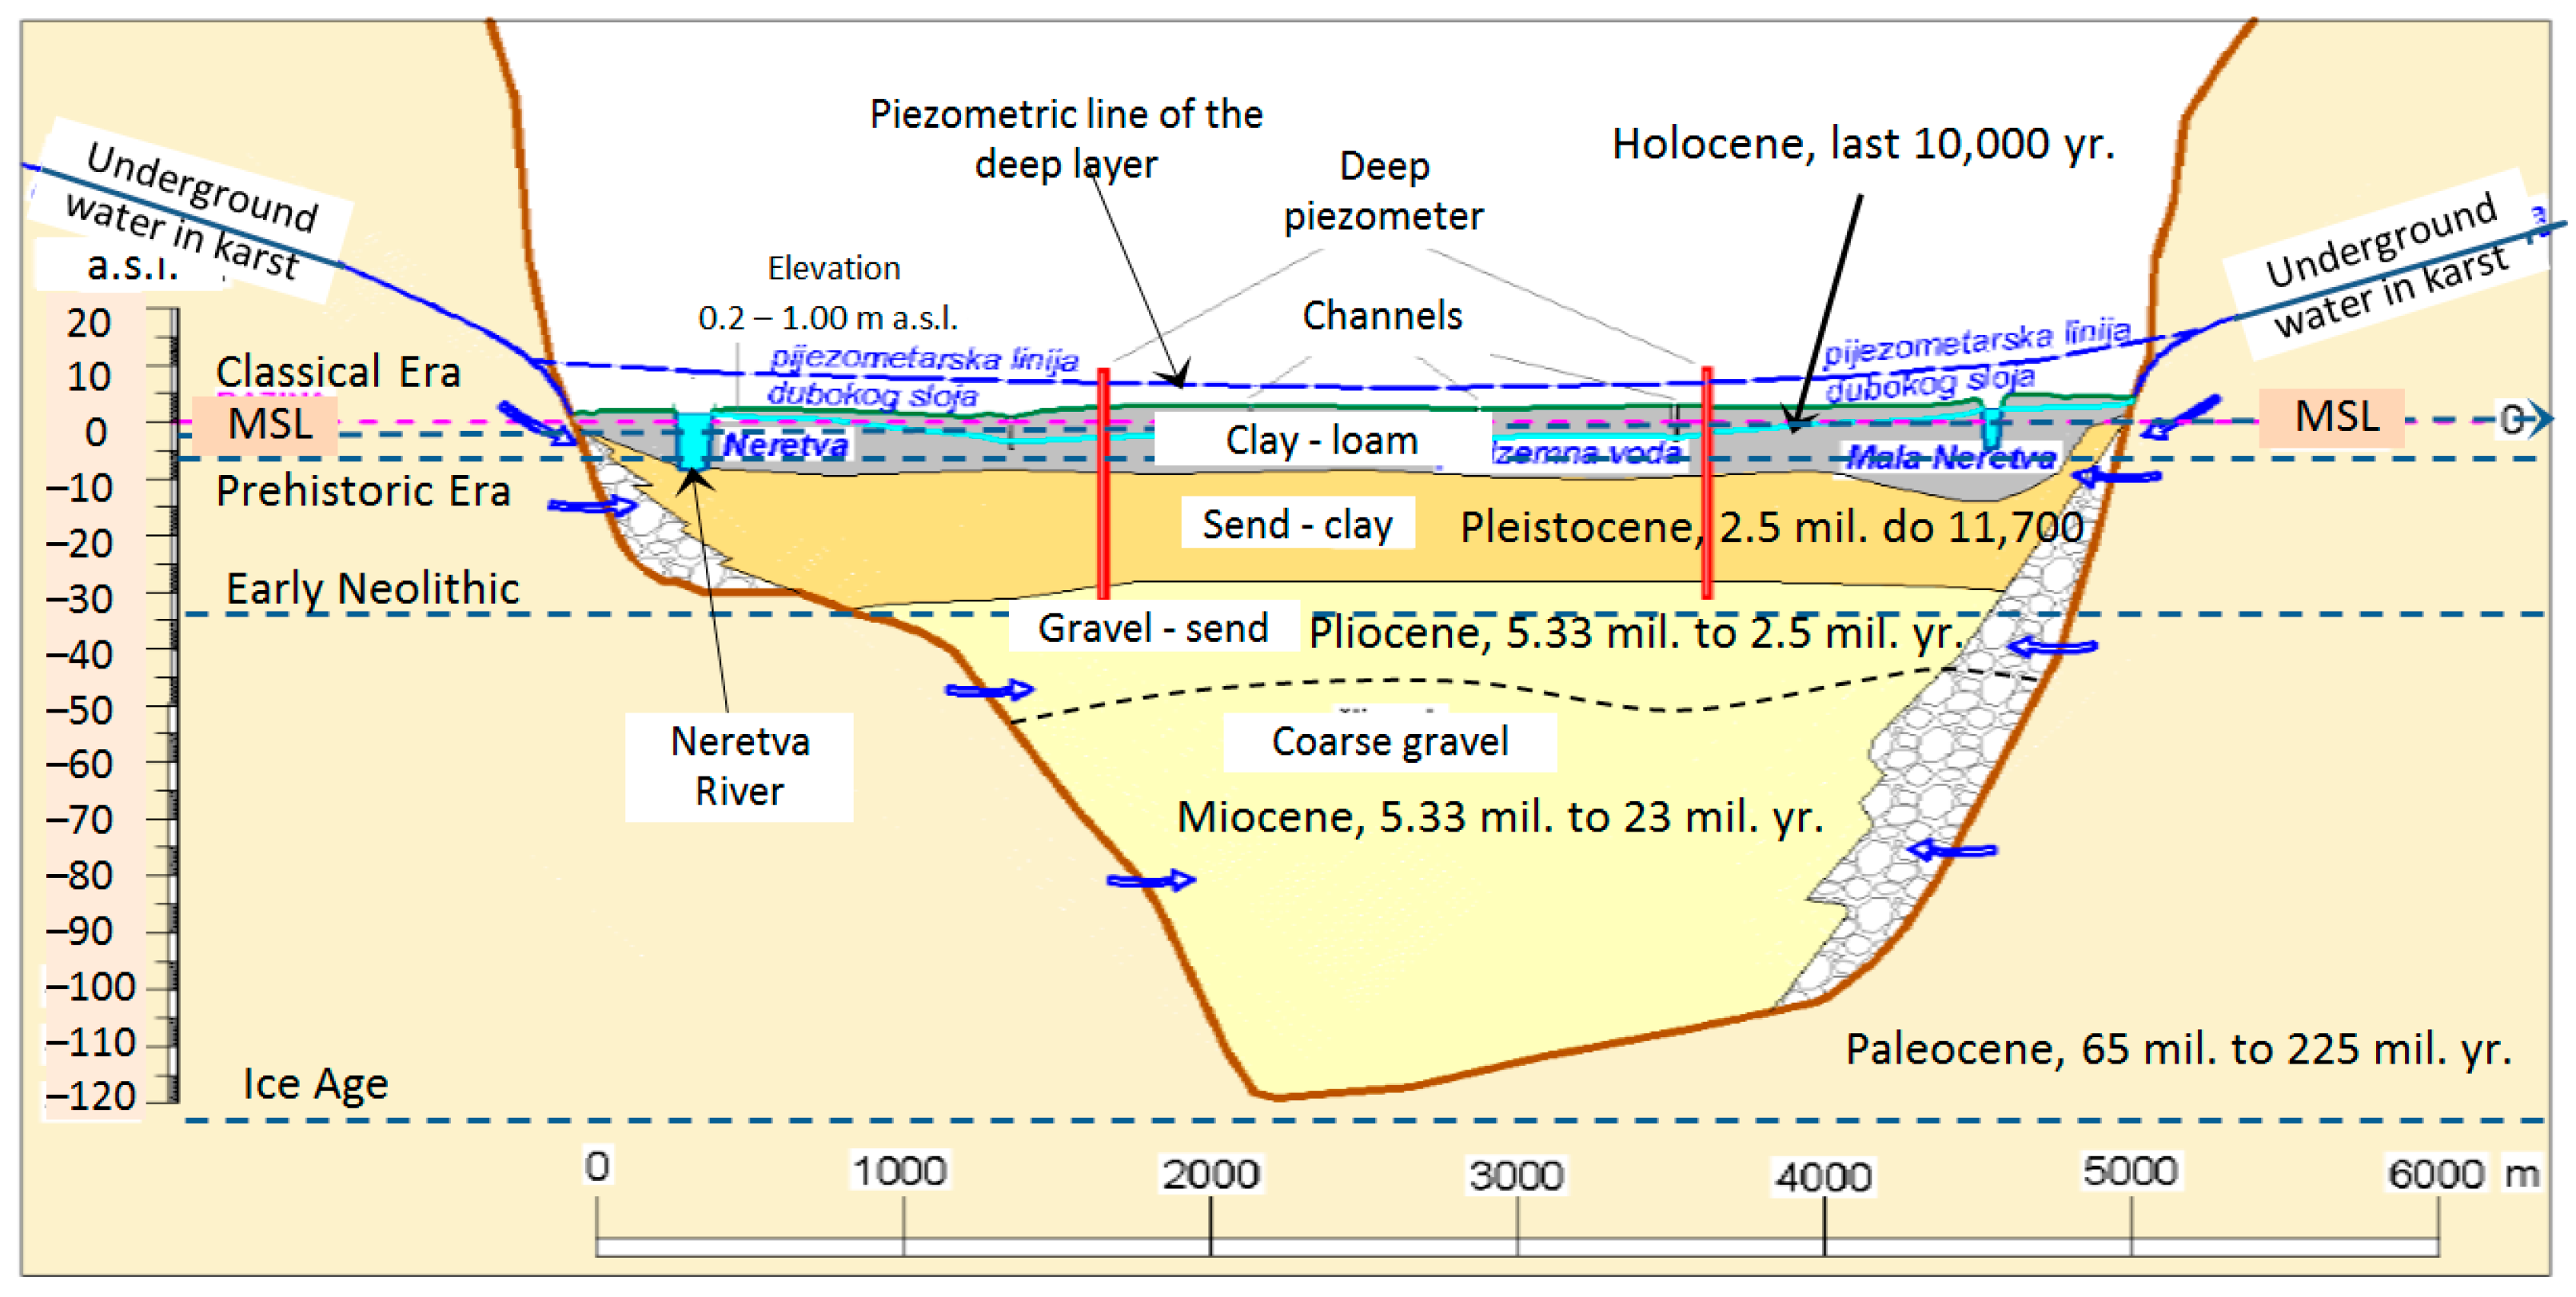
The described historic dynamics of change were confirmed by delta deposits at the town of Opuzen, which, in the distant past, was in the upper zone of the river, changing to the lower zone in the last 2,000 years (Figure 6) [4]. The structure of a deltaic deposit is the result of historical changes in the functional zone positions of streams, internal river characteristics, and delta formation processes. The upper and youngest deposit layers, 3 m-thick, comprise a layer of clay and loam (fine-grained bottomset deposited from a surface sediment plume) created during the period from antiquity to the present day. At a depth of 3–10 m, the sandy material formed as a result of slow transport, and the accumulation of suspended material was created in the Holocene, which also had a layer of silty clay at a depth of 8–10 m, which was probably formed in a shorter period as a bottomset deposit. At a depth of 10–50 m, a layer of gravel with sand (created by the variable intensive transport of dragged and suspended sediment [fluvial sediment load]) in the former middle course of the Neretva River was created during the Pliocene and Pleistocene periods. At a depth of 50–120 m, a layer of coarser gravel formed during a period of continuous intensive transport and deposition of dragged sediment through the upper zone of the river (coarse-grained fluvial-deposited topset) from the Paleocene to the Miocene. At depths greater than 120 m, a geological layer of crushed dolomite and limestone exists. This geological section shows the development of the river network from the Ice Age to the present day [28].
3.2. Historical Socio-Hydromorphology Assessment
River and delta hydromorphologies are indicators of the constant effort of a natural system to establish an equilibrium state (order) that reduces entropy and sustains the system functions that support the biophysical environment and human society. Historic maps, to some extent, reveal such historic socioeconomic changes, whereas hydrogeological profiles present historic sediment buildups that support the maps.
Until 1850, socio-hydromorphological changes were induced by natural forces and processes that operated globally and regionally, independent of humanity. Owing to the limited technology during this period, humans only slightly changed the hydromorphology and system state locally (entropy generation). Throughout history, humans have developed and used different technologies that retroactively influence and change the environment, which then influences society and the economy [33].
In ancient times, the number of inhabitants in the delta was small, and they lived in small settlements on the rocky limestone and dolomite terrain of the delta area, away from the water and flooding zones. Therefore, they exploited WEF resources with environmentally friendly technology, and the human influence on the river system was negligible [33,34]. During this period, the local economy was a subsystem of the river or delta ecosystem, and there were no limits on the biophysical throughput of WEF resources from the ecosystem through the economic subsystem and back to the ecosystem as waste.
In antiquity, the number of inhabitants grew, and Narona, the largest Roman city, was built on the foundations of the Greek emporium that existed from the 4th to the 2nd century BC (Figure 5a) [35]. The city had more than 20,000 inhabitants engaged in trade and craftsmanship. It was abandoned around AD 600 and never rebuilt [34,35]. Like other Roman cities on the seacoast, this city had a port and urban water infrastructure. City and human activities did not significantly impact the hydromorphological and ecological features of the area or the sustainability of nature and humans. During the antiquity period, the climate and slow MSL rise changed the biophysical environment of the bay, which gradually evolved into a shallow wetland delta. The swampy environment was not well suited to life, and navigation from the sea to Narona was difficult, threatening the city’s trade and prosperity. Therefore, with great certainty, we can assume that Narona was abandoned because of climate change (variable and cold weather) and the extremely slow rise of the MSL that caused delta regression [35]. Various political problems in the Roman Empire caused by climate change also contributed to the city’s desertion [19].
Delta regression continued into the modern period. With the beginning of the medieval historical period (AD 476–1400), after the fall of the Western Roman Empire, significant climatic and socioeconomic changes occurred in a wide area, as well as human conflicts [36]. Consequently, the number of inhabitants diminished. This was the period during which the delta area was mostly under Croatian rule [36]. Agriculture was the primary source of income. Owing to regression processes, the fertility of the river valley increased, and the biophysical environment and economy became stronger. The population still preferred living in smaller settlements, mostly in the rocky limestone areas around the delta. The settlement of Gabela, which was located at the beginning of the delta, developed into a new main port and place of trade because the river was navigable for smaller ships (Figure 5b) [34].
After the Croatian rulers, the Neretva River Basin belonged to the Ottoman Empire and Republic of Venice (1420–1797) [34,36]. The middle and upper river zones up to Gabela belonged to the Ottoman Empire, and the delta was mainly governed by the Republic of Venice. Owing to the strategic importance of the delta for access from the sea to the interior of the continent, conflicts were frequent, such that the border and rulers, as well as the number of inhabitants, were constantly changing. After the medieval period, the delta belonged to the first Austrian administration of Dalmatia and Istria (1797–1805) and then briefly to the French administration (1806–1813) [34,36]. The number of inhabitants increased significantly because of the more favorable climatic conditions after the Little Ice Age. A wider and deeper riverbed was formed, which enabled safer navigation, and larger settlements with ports (Gabela, Metković, and Opuzen) developed (Figure 5c) [34]. The delta gradually filled with sediment, and the coast moved downstream (regressive coast). Livelihoods were supported by river and delta resources, agriculture, fisheries, and trade once the delta became a regional trade hotspot [34,36]. The physical productivity was favorable, especially for the surplus produced by agriculture. Humans did not change the river hydromorphology or delta biophysical environment. Delta resources with low entropy due to human exploitation were transformed into residuals with a slightly higher entropy, mostly of organic matter. Therefore, residuals in environments with a high receptive capacity did not threaten ecosystem functions and services.
Significant and rapid changes in hydromorphology occurred from 1813 to 1918, when Croatia and B&H were governed by the second Austrian administration [16,36]. This modern period had a favorable climate in which the river basin population grew rapidly, and larger settlements were created that changed and polluted the environment. There was sufficient financial capital to build a railway from Metković to the interior of B&H along the river valley (in 1855) and a river port in Metković, which regulated the river up to the sea to make navigation safer for large ships and protect the urban area from flooding (1881–1887) (Figure 5d) [16,34]. By regulating the river and building embankments, flood safety was strengthened, leading to the expansion of urbanization and agricultural land, which reduced and degraded the natural environment.
After the collapse of Austria–Hungary in 1918, the territory belonged to the Kingdom of Serbs, Croats, and Slovenes—that is, from 1929 to the Kingdom of Yugoslavia and after 1945 to the new Yugoslavia. During this period, the number of inhabitants continued to increase, as did urbanization, industrial development, and trade. Urbanization and industrial development occurred on land, which is the most productive agricultural area in the delta. This systematically reduced the most valuable natural resources—that is, the WEF and net products. Changes in the natural systems reduced the physical and biophysical productivity. In 1955, the marine port Ploče was built near the river mouth. Consequently, economic activities moved to the delta and coastal zone [16,34].
Since 1963, large-scale reclamation work has been conducted in the delta [4,16,34]. The hydromorphology has changed in addition to the biophysical environment and socio-economy. In the upper reaches of the Neretva River in today’s B&H, larger cities and industries are developing, exploiting, and polluting water resources [4,15]. The geomorphological and hydrological systems of the river have changed significantly, which has further increased the rates of delta transgression and water salinity. Urbanization and land reclamation in the delta have increased the vulnerability of the socioeconomic system, which is worsening with climate change, and the MSL rise has caused a modern period of delta transgression. Land-water and fresh saline water interrelations, energy gradients, water salinity, and the level of surface and underground water are changing, which increases the risk of floods and the salinity of agricultural land, creating uncertainty in agricultural production [4,37]. This significantly increases the cost of operating the water management system, which consumes an increasing amount of energy and other resources to slow the growth of entropy. Agriculture is becoming less profitable, and the cost of living is increasing. The resulting coupling processes are less sustainable and productive, and building resilience is expensive and uncertain. Future-oriented planning has become increasingly demanding and uncertain.
4. Discussion
The proposed approach presents the key characteristics of the synergism of effects acting over past and future time horizons because defining future processes and conditions in the delta is difficult as local data on the future climate are insufficient and unreliable [38,39,40]. Historical information, though extremely general, interpreted by the proposed method determines the change in entropy in a certain period (Equation (6)) and thus becomes significant for the interpretation of hydromorphological processes in the delta. Therefore, a historic socio-hydromorphological study in the Neretva Delta can provide missing information for assessing system evolution, and at the same time, the results are visible. This study supports a decision-making framework that combines the historical experiences of the past, the constraints of the present, the visions of a possible and desirable future, the biophysical environment, and the economy.
Climate models of the Neretva Basin forecast minimal changes in annual and seasonal precipitation and temperature by 2040. For the period 2040–2100, models forecast increases of 0.6–4.0° C in the average annual temperature and 0.9–4.7° C in the summer temperature, and a reduction of 2–7% in annual precipitation, with the majority occurring during summer (5–25%), followed by autumn (3–13%) and spring (3–8%). Precipitation is expected to increase by approximately 2–7% in winter [39]. A rise in the MSL in the Adriatic Sea of 15–40 cm by 2050 and 30–120 cm by 2100 has been predicted. The speed of exchange of entropy between the delta and environment, dSe/dt, plus the speed of entropy production inside the delta, dSi/dt, will increase—that is, the speed of change in delta entropy, dS/dt—but the value is difficult to predict with such general climate and MSL change data.
Historical co-evolution results indicate that the delta in the future could become a submerged estuary (rias)—that is, a sea bay—owing to subsequent delta progradation resulting from an MSL rise, similar to progradation during the Holocene. In that case, Qriver ∙ fr < r ∙ Adelta, while Sdelta > 0 and constantly increases. The delta may lose a significant part of its land surface area by 2100 and much more after that [41]. A change in the current trend of delta-forced transgression and adaptation to future climate frameworks is expensive and uncertain because the speed of change in system entropy is difficult to predict (dSdelta/dt). Force transgression will not stop anytime soon because nature has sufficient energy and time to achieve an equilibrium state, and entropy has nothing to do with time. Planned man-made adaptation measures cannot permanently resist environmental energy because they are of limited duration. Hence, the problem should be solved in such a way that the exposure and entropy generation are constantly reduced (DSdelta → 0).
Experts, decision-makers, and stakeholders need to find a policy for both global imbalance (climate)—that is, external entropy change—and locally generated disturbances (physical closure in the delta). Therefore, a wider scope of policies and possible technology options have been assessed. By applying a future-oriented planning methodology, two “extreme” policies have been considered to find a set of locally appropriate policies and options for further elaboration:
- (i).
- A long-range sustainable policy maximizing the natural order and equilibrium state of the system. This implies a system open to natural transgression processes that lead to sustainable hydromorphological systems and ecosystems without man-made adaptation and resilience measures. This is a natural energy-based evolution and adaptation with low entropy generation. The hydromorphology and biophysical environment will be similar to those of the Roman period. Such systems will support a natural and sustainable economy.
- (ii).
- A limited-range sustainable policy that will reduce disorder while respecting the established regulatory framework and EU policy toward the Sustainable Development Goals [42]. This implies the application of adaptation measures and strengthening of resistance through a combination of gray and green solutions (technology) to reduce transgression impacts on society and the economy, man-made evolution, and adaptation with technology for high entropy generation. Future hydromorphology and biophysical environments will be a continuation of current transgression processes with an accelerated growth of imbalance. This is a modern-day policy supported by the EU’s circular economy and green policy.
In the first option, the population gradually moves to safe ground in and around the delta. This would restore the natural interconnecting processes as a framework for long-range sustainable WEF interconnections. The long-term goal is to gradually increase and deliver WEF resources while preserving the health of natural ecosystems with low entropy ecosystem services, which form the basis for diverse sustainable economic activities. Society and the economy would adapt to changes in the biophysical environment that support long-term sustainable socioeconomic development. It is all about the development of a new, more sustainable biophysical economy that fully acknowledges the underlying uncertainty. This option supports climate change mitigation measures (global response) because the intrusion of the sea deeper into the area will increase the salinity of the water, slowing down the decomposition of accumulated organic matter and reducing the release of methane and other greenhouse gases. This would improve the air quality and local climate and create healthy living conditions [43].
The second option strengthens resistance and adaptation through engineering procedures. This will cause a constant large exposure that generates high entropy for both the delta and man-made systems because the equilibrium between sediment supply and MSL change will constantly increase. Success is uncertain owing to the limestone–dolomite geological structure’s high permeability. The goal is to protect the current urbanization trend, although the delta topsets will be lower in relation to the MSL. The key concern is determining the value of the available WEF resources for the future society and economy, which is difficult to assess. Urbanization, human activities, and gases from freshwater wetlands and agricultural land (methane, CO2) will continue to be a source of significant greenhouse gases, which is not in accordance with the EU environmental policy.
The extreme options represent the boundaries of the option set. For most stakeholders, an affordable combination of options (i) and (ii) is the most desirable because it is less demanding about the future implications of technological options. In a real economy, accepting long-term visions and strategies is difficult. Therefore, implementing measures that gradually support environmental security and sustainable livelihoods—that is, to increase the natural order at an acceptable cost to society—is more acceptable. Such options gradually decrease disorder by implementing technology that respects local social issues (costs and benefits). The CI can be assessed using Equation (6). Stakeholders would prefer to both regenerate the natural delta and protect the environment and defend existing urban areas in accordance with the predictable magnitude of exposure at a minimum cost. This would lead to a hydromorphology and biophysical environment similar to those at the beginning of the modern era (Figure 5c,d). In essence, this is an appropriate approach to environmental economics. It also considers the balance between wetlands and human health in a changing environment. Therefore, future trends and developments, an understanding of timing and rate change, and the impacts and consequences of previous technological interventions will direct this policy and new interventions closer to the first or second policy. The speed of climate change, level of uncertainty, socioeconomic matters, and EU regulatory framework will define the direction and dynamics of convergence.
5. Conclusions
The proposed historic socio-hydromorphology assessment involves different ways of thinking about environmental and social impacts by combining a broad geographical scale, many inducers and actions, and extended time horizons. Without this, defining a rational and sustainable long-term vision and policy for the Neretva Delta would be difficult. Every new piece of information from the interdisciplinary field focused on the dynamic interactions and feedback between river systems, marine systems, and people helps create a more complete understanding of the trend in changes and the resulting state, as defined by the proposed state equation (Equation (4)).
However, a constant framework of data collection and coupling research strategy with a policy-relevant framework is needed because the possible time lags between MSL change and delta morphological adjustment, such as auto retreat, are mostly unknown. Detailed research studies are necessary to better understand the morphodynamics, as well as sustainable physical and mathematical modeling. The biggest challenge will continue to be conducting a sufficiently reliable assessment of the long-term CIs of the climate on the biophysical environment and economy of the delta region.
The biggest decision-making problem is convincing local stakeholders of the need for long-term planning, a horizon longer than the human lifespan, the observation of delta change, and the necessity of multidisciplinary research. The proposed historic socio-hydromorphological approach, thermodynamic framework, and indicators can significantly facilitate decision-making. This simple approach is primarily based on historical documentation and expert knowledge. Examples of socio-hydromorphological co-evolution from the past reveal possible changes and policies for the future, which can be explained and justified by the proposed entropy assessment.
The recommended approach can be applied to any river system or reach, with appropriate adjustments.
Funding
This study received no external funding.
Institutional Review Board Statement
Not applicable.
Informed Consent Statement
Not applicable.
Data Availability Statement
The original contributions presented in the study are included in the article, and further inquiries can be directed to the corresponding author.
Conflicts of Interest
The author declares no conflict of interest.
References
- Sivapalan, M.; Savenije, H.H.G.; Blöschl, G. Socio-Hydrology: A new science of people and water. Hydrol. Process 2012, 26, 1270–1276. [Google Scholar] [CrossRef]
- Montanari, A.; Young, G.; Savenije, H.H.; Hughes, D.; Wagener, T.; Ren, L.L.; Koutsoyiannis, D.; Cudennec, C.; Toth, E.; Grimaldi, S.; et al. “Panta Rhei—Everything Flows”: Change in hydrology and society—The IAHS Scientific Decade 2013–2022. Hydrolog. Sci. J. 2013, 58, 1256–1275. [Google Scholar] [CrossRef]
- Margeta, J.; Iacovides, I.; Azzopardi, E. Integrated Approach to Development, Management and Use of Water Resources; UNEP/MAP, Priority Actions Programme: Split, Croatia, 1997; p. 154. ISBN 953-6429-11-X. [Google Scholar]
- Vranješ, M.; Prskalo, M.; Džeba, T. Hydrology and hydrogeology of the Neretva and Trebišnjica basins. e-ZBORNIK, June 2013; pp. 1–23, No. 5. (In Croatian) [Google Scholar]
- Newson, M.D. Sustainable integrated development and the basin sediment system: Guidance from fluvial geomorphology. In Integrated River Basin Development; Kirby, C., White, W.R., Eds.; Wiley: Chichester, UK, 1994; pp. 1–10. [Google Scholar]
- Blair, P.; Buytaert, W. Socio-hydrological modelling: A review asking “why, what and how?”. Hydrol. Earth Syst. Sci. 2016, 20, 443–478. [Google Scholar] [CrossRef]
- Liu, Y.; Tian, F.; Hu, H.; Sivapalan, M. Socio-hydrologic perspectives of the co-evolution of humans and water in the Tarim River basin, Western China: The Taiji–Tire model. Hydrol. Earth Syst. Sci. 2013, 18, 1289–1303. [Google Scholar] [CrossRef]
- Troy, T.; Pavao-Zuckerman, M.; Evans, T.P. Debates—Perspectives on Socio-Hydrology: Socio-Hydrologic Modeling: Tradeoffs, Hypothesis Testing, and Validation. Water Resour. Res. 2015, 51, 4806–4814. [Google Scholar] [CrossRef]
- Zhao, X.; Liu, D.; Wei, X.; Ma, L.; Lin, M.; Meng, X.; Huang, Q. Analysis of Socio-Hydrological Evolution Processes Based on a Modeling Approach in the Upper Reaches of the Han River in China. Water 2021, 13, 2458. [Google Scholar] [CrossRef]
- Liu, D.; Tian, F.; Lin, M.; Sivapalan, M. A conceptual socio-hydrological model of the co-evolution of humans and water: Case study of the Tarim River basin, western China. Hydrol. Earth Syst. Sci. 2015, 19, 1035–1054. [Google Scholar] [CrossRef]
- Tejedor, A.; Longjas, A.; Caldwell, R.; Edmonds, D.A.; Zaliapin, I.; Foufoula-Georgiou, E. Quantifying the signature of sediment composition on the topologic and dynamic complexity of river delta channel networks and inferences toward delta classification. Geophys. Res. Lett. 2016, 43, 3280–3287. [Google Scholar] [CrossRef]
- Margeta, J. An Engineering Approach to Assessing the Vulnerability of Water Abstraction. Appl. Sci. 2024, 14, 1879. [Google Scholar] [CrossRef]
- Ma, W.; Kang, Y.; Song, S. Analysis of Streamflow Complexity Based on Entropies in the Weihe River Basin, China. Entropy 2020, 22, 38. [Google Scholar] [CrossRef]
- Kumar, P.; Ruddell, B.L. Information driven ecohydrologic self-organization. Entropy 2010, 12, 2085–2096. [Google Scholar] [CrossRef]
- Margeta, J. The Neretva River: Integrated coastal area and river basin management. In Transboundary Water Resources in the Balkan; Ganoulis, J., Murphy, I.L., Brilly, M., Eds.; Kluwer Academic Press: Dordrecht, The Netherlands, 2000; pp. 55–65. [Google Scholar]
- Jurić, I. Economic Development of the Harbor and the Metković Market 1850–1918; Matica hrvatska Ploče: Ploče, Croatia, 2000; pp. 1–140. (In Croatian) [Google Scholar]
- Rinaldo, A.; Rodriguez-Iturbe, R.I.; Rigon, E.; Ijjasz-Vasquez, R.L. Self-organized fractal river networks. Phys. Rev. Lett. 1993, 70, 822–825. [Google Scholar] [CrossRef] [PubMed]
- Paola, C.; Robert, R.; Twilley, D.A.; Edmonds, W.K.; Mohrig, D.; Parker, G.; Viparelli, E.; Voller, V.R. Natural Processes in Delta Restoration: Application to the Mississippi Delta. Annu. Rev. Mar. Sci. 2011, 3, 67–91. [Google Scholar] [CrossRef] [PubMed]
- McCormick, M.; Büntgen, U.; Cane, M.A.; Cook, E.R.; Harper, K.; Huybers, P.; Litt, T.; Manning, S.W.; Mayewski, P.A.; Alexander, F.M.; et al. More Climate Change during and after the Roman Empire: Reconstructing the Past from Scientific and Historical Evidence. J. Interdiscip. Hist. 2012, 43, 169–220. [Google Scholar] [CrossRef]
- Büntgen, U.; Tegel, W.; Nicolussi, K.; Mccormick, M.; Frank, D.; Trouet, V.; Kaplan, J.O.; Herzig, F.; Heussner, K.-U.; Wanner, H. 2500 Years of European Climate Variability and Human Susceptibility. Science 2011, 331, 578–582. [Google Scholar] [CrossRef] [PubMed]
- May, A. Climate and Civilization for the Past 4000 Years. Installed 22.6. 2016. Available online: https://andymaypetrophysicist.com/climate-and-civilization-for-the-past-4000-years/ (accessed on 10 October 2023).
- Malović, T.; Velić, J.; Cvitković, M.; Vekić, M.; Šapina, M. Definition of new Pliocene, Pleistocene and Holocene lithographic units in the Croatia part of the Adriatic Sea (Shallow offshore). Geoadria 2015, 20, 85–108. [Google Scholar]
- Kačar, S. The Neolithisation of the Adriatic: Contrasting Regional Patterns and Interactions along and across the Shores. Open Archaeol. 2021, 7, 798–814. [Google Scholar] [CrossRef]
- Šegota, T. Sea level and vertical movement of the bottom of the Adriatic Sea from the Ris-Virmian interglacial to the present day. Geol. Vjesn. 1982, 35, 93–109. (In Croatian) [Google Scholar]
- Morhange, C.; Marriner, N.; Excoffon, P.; Bonnet, S.; Flaux, C.; Zibrowius, H.; Goiran, J.-P.; El Amouri, M. Relative Sea-Level Changes during Roman Times in the Northwest Mediterranean: The 1st Century A.D. Fish Tank of Forum Julii, Fréjus, France. Geoarchaeol. Int. J. 2013, 28, 363–372. [Google Scholar] [CrossRef]
- Cazenave, A. Climate change and sea-level rise. World Sci. Encycl. Clim. Chang. 2021, 3, 113–122. [Google Scholar]
- Chembolua, V.; Duttab, S. Entropy and Energy Dissipation of a Braided River System. Procedia Eng. 2016, 144, 1175–1179. [Google Scholar] [CrossRef]
- Balić, D.; Malvić, T. Pliocene–Quaternary stratigraphy and sedimentation at the Neretva River Mouth, on the Croatian Adriatic Coast. Geol. Q. 2013, 57, 233–242. [Google Scholar] [CrossRef]
- Peutinger’s Tabula. Available online: https://en.wikipedia.org/wiki/Tabula_Peutingeriana#/media/File:TabulaPeutingeriana.jpg (accessed on 9 July 2024).
- Farčić, J.; Glamuzina, M. Donjoneretva region on Coronelli’s maps “Atlante della Republica di Venezia”. Acta Geographica Croatica 1999, 34, 89–125. [Google Scholar]
- Maps of Europe. Available online: http://geoportost.ios-regensburg.de/map/BV043564212 (accessed on 5 October 2023).
- Cartographic Collection HR-DAZD-383, topographic map of of Austro-Hungarian Empire, 1880–1889, No. 53, sheet 26, State Archives in Zadar, Croatia.
- Angelakis, A.N.; Margeta, J.; Salgot, M.; Zheng, X.Y. Evolution of Hydro-Technologies and Relevant Associations Focusing on Hellenic World. Water 2023, 15, 1721. [Google Scholar] [CrossRef]
- Smoljan, I. Neretva; Independent Author’s Edition; Zrinski: Čakovec, Croatia, 1970. (In Croatian) [Google Scholar]
- Patch, C. History and Topography of Narona; Matica Hrvatska Metković: Metković, Croatia, 1996. (In Croatian) [Google Scholar]
- Novak, G. History of Dalmatia, Book 1 and 2; Marjan tisak d.o.o.: Split, Croatia, 2004; ISBN 953-214-183-9. (In Croatian) [Google Scholar]
- Racetin, I.; Krtalić, A.; Srzić, V.; Zovko, M. Characterization of short-term salinity fluctuations in the Neretva River Delta situated in the southern Adriatic Croatia using Landsat-5 TM. Ecol. Indic. 2019, 10, 1–14. [Google Scholar] [CrossRef]
- IPPC. Climate Change 2022: Impacts, Adaptation and Vulnerability. Contribution of Working Group II to the Sixth Assessment Report of the Intergovernmental Panel on Climate Change; Cambridge University Press: Cambridge, UK, 2022. [Google Scholar] [CrossRef]
- Official Gazette of Croatia. Climate Change Adaptation Strategy in the Republic of Croatia for the Period up to 2040 with a View to 2070; NN 46/2020 NN 46/2020; Official Gazette of Croatia: Zagreb, Croatia, 15 April 2020. (In Croatian) [Google Scholar]
- Nienhuis, J.H.; Kim, W.; Milne, G.A.; Quock, M.; Slangen, A.B.; Törnqvist, T.E. River Deltas and Sea-Level Rise. Annu. Rev. Earth Planet. Sci. 2023, 51, 79–104. [Google Scholar] [CrossRef]
- Official Gazette of Croatia. Water Management Plan of Croatia until 2027; NN 54/2022; Official Gazette of Croatia: Zagreb, Croatia, 2022. [Google Scholar]
- The 2030 Agenda for Sustainable Development’s 17 Sustainable Development Goals (SDGs). Available online: https://sdgs.un.org/sites/default/files/2020-09/SDG%20Resource%20Document_Targets%20Overview.pdf (accessed on 9 July 2024).
- Dale, P.E.R.; Connelly, R. Wetlands and human health: An overview. Wetl. Ecol. Manag. 2012, 20, 165–171. [Google Scholar] [CrossRef]
Figure 1.
Case study area: the River Neretva and the “Delta of Neretva” (CC BY-SA 3.0).
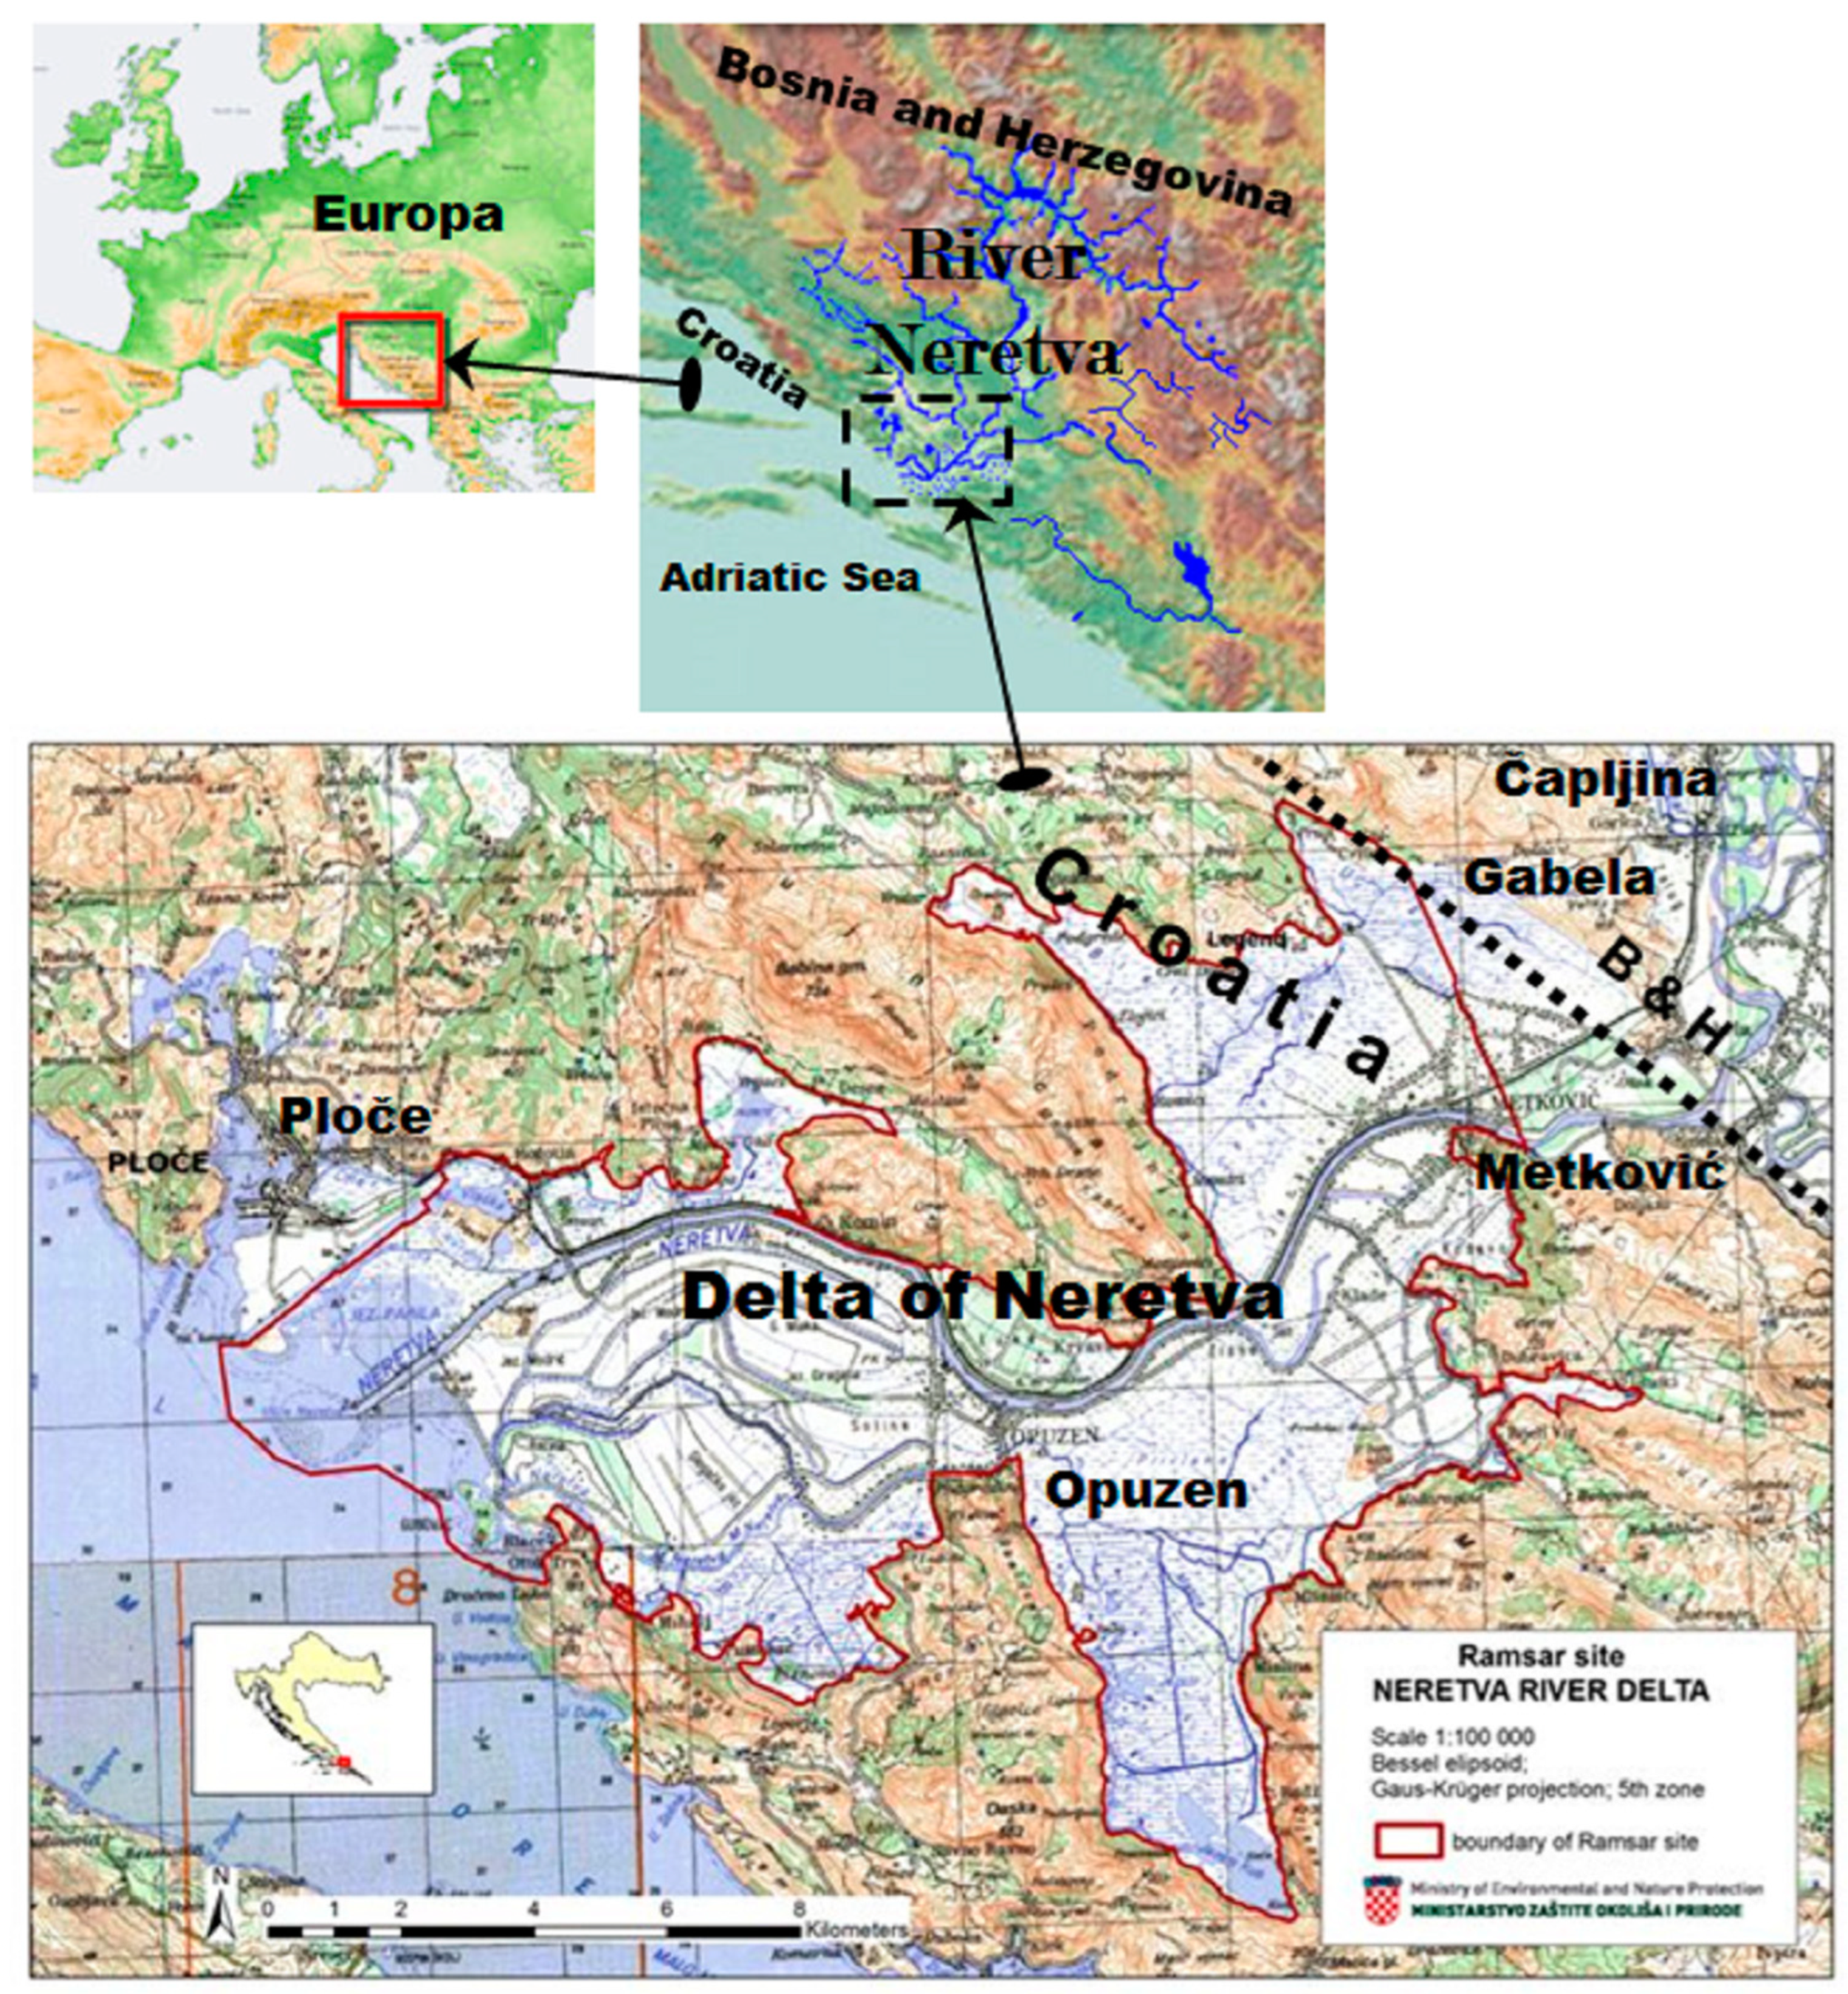
Figure 2.
Central Greenland temperature: 4000 BP to present [21].
Figure 2.
Central Greenland temperature: 4000 BP to present [21].
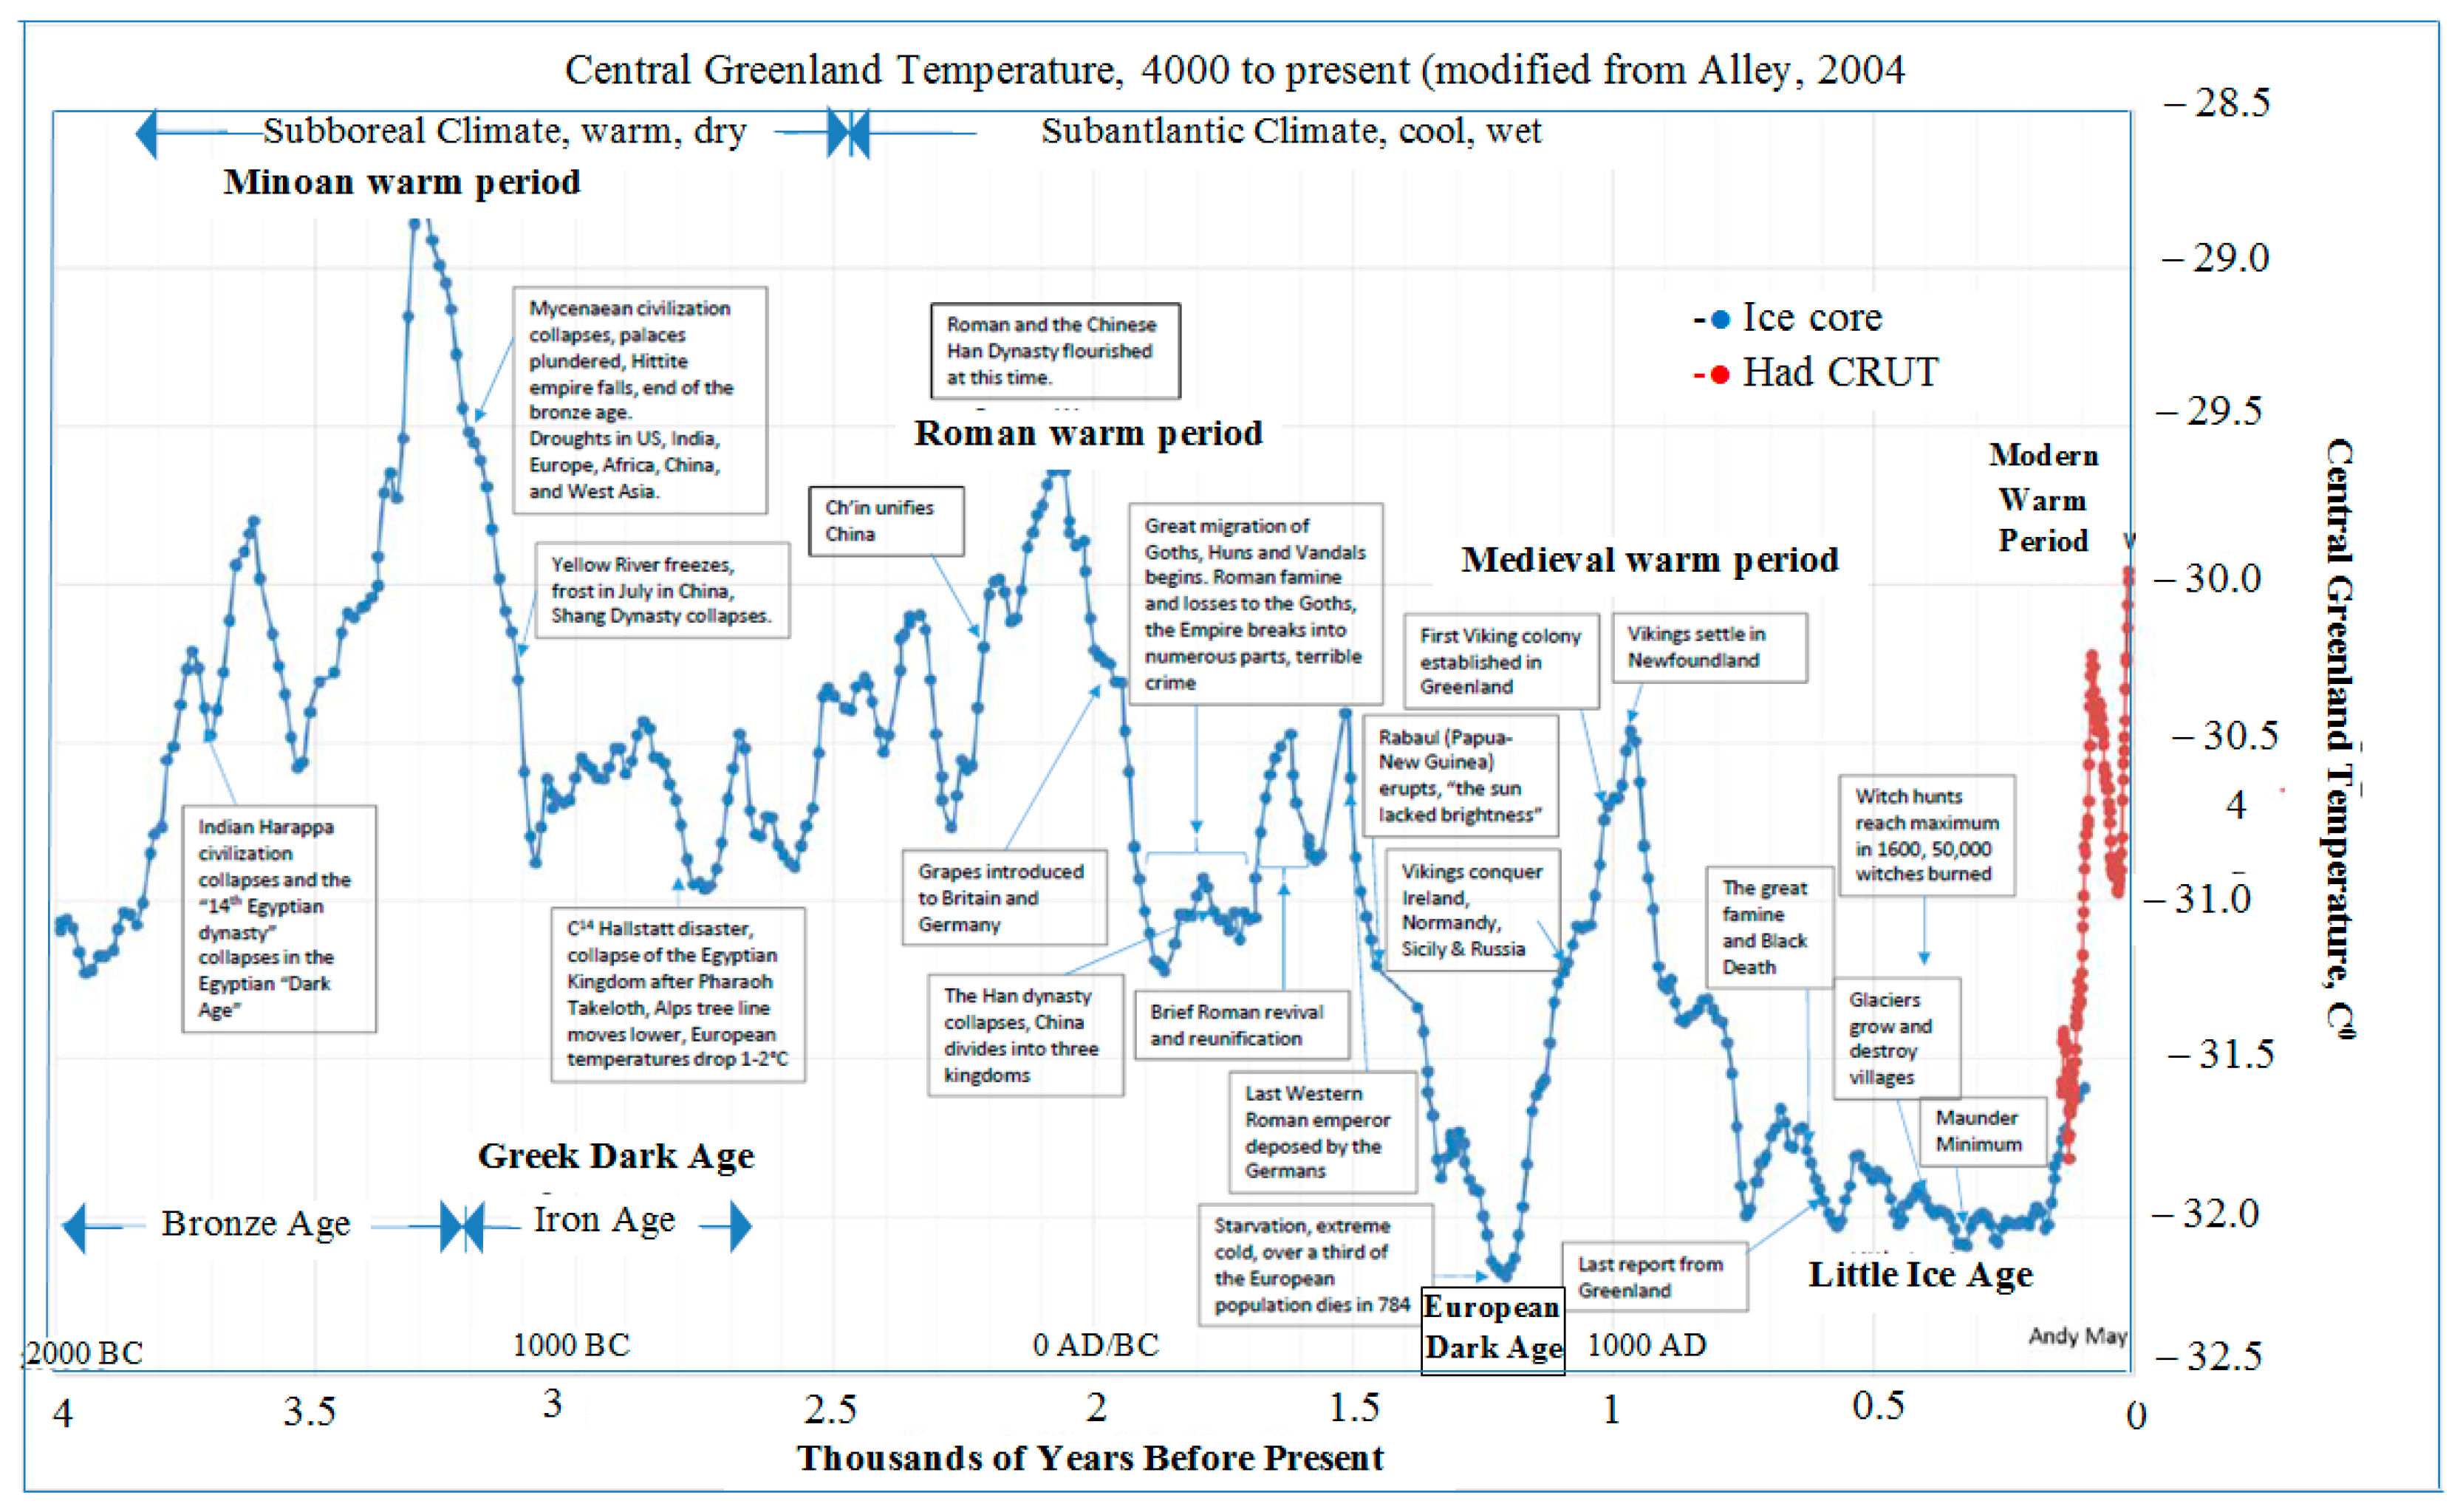
Figure 3.
Depositional area of the Neretva River during the Pliocene, Pleistocene, and Holocene; A, B, and C are interpreted 2D seismic lines [22] (CC BY 4.0).
Figure 3.
Depositional area of the Neretva River during the Pliocene, Pleistocene, and Holocene; A, B, and C are interpreted 2D seismic lines [22] (CC BY 4.0).
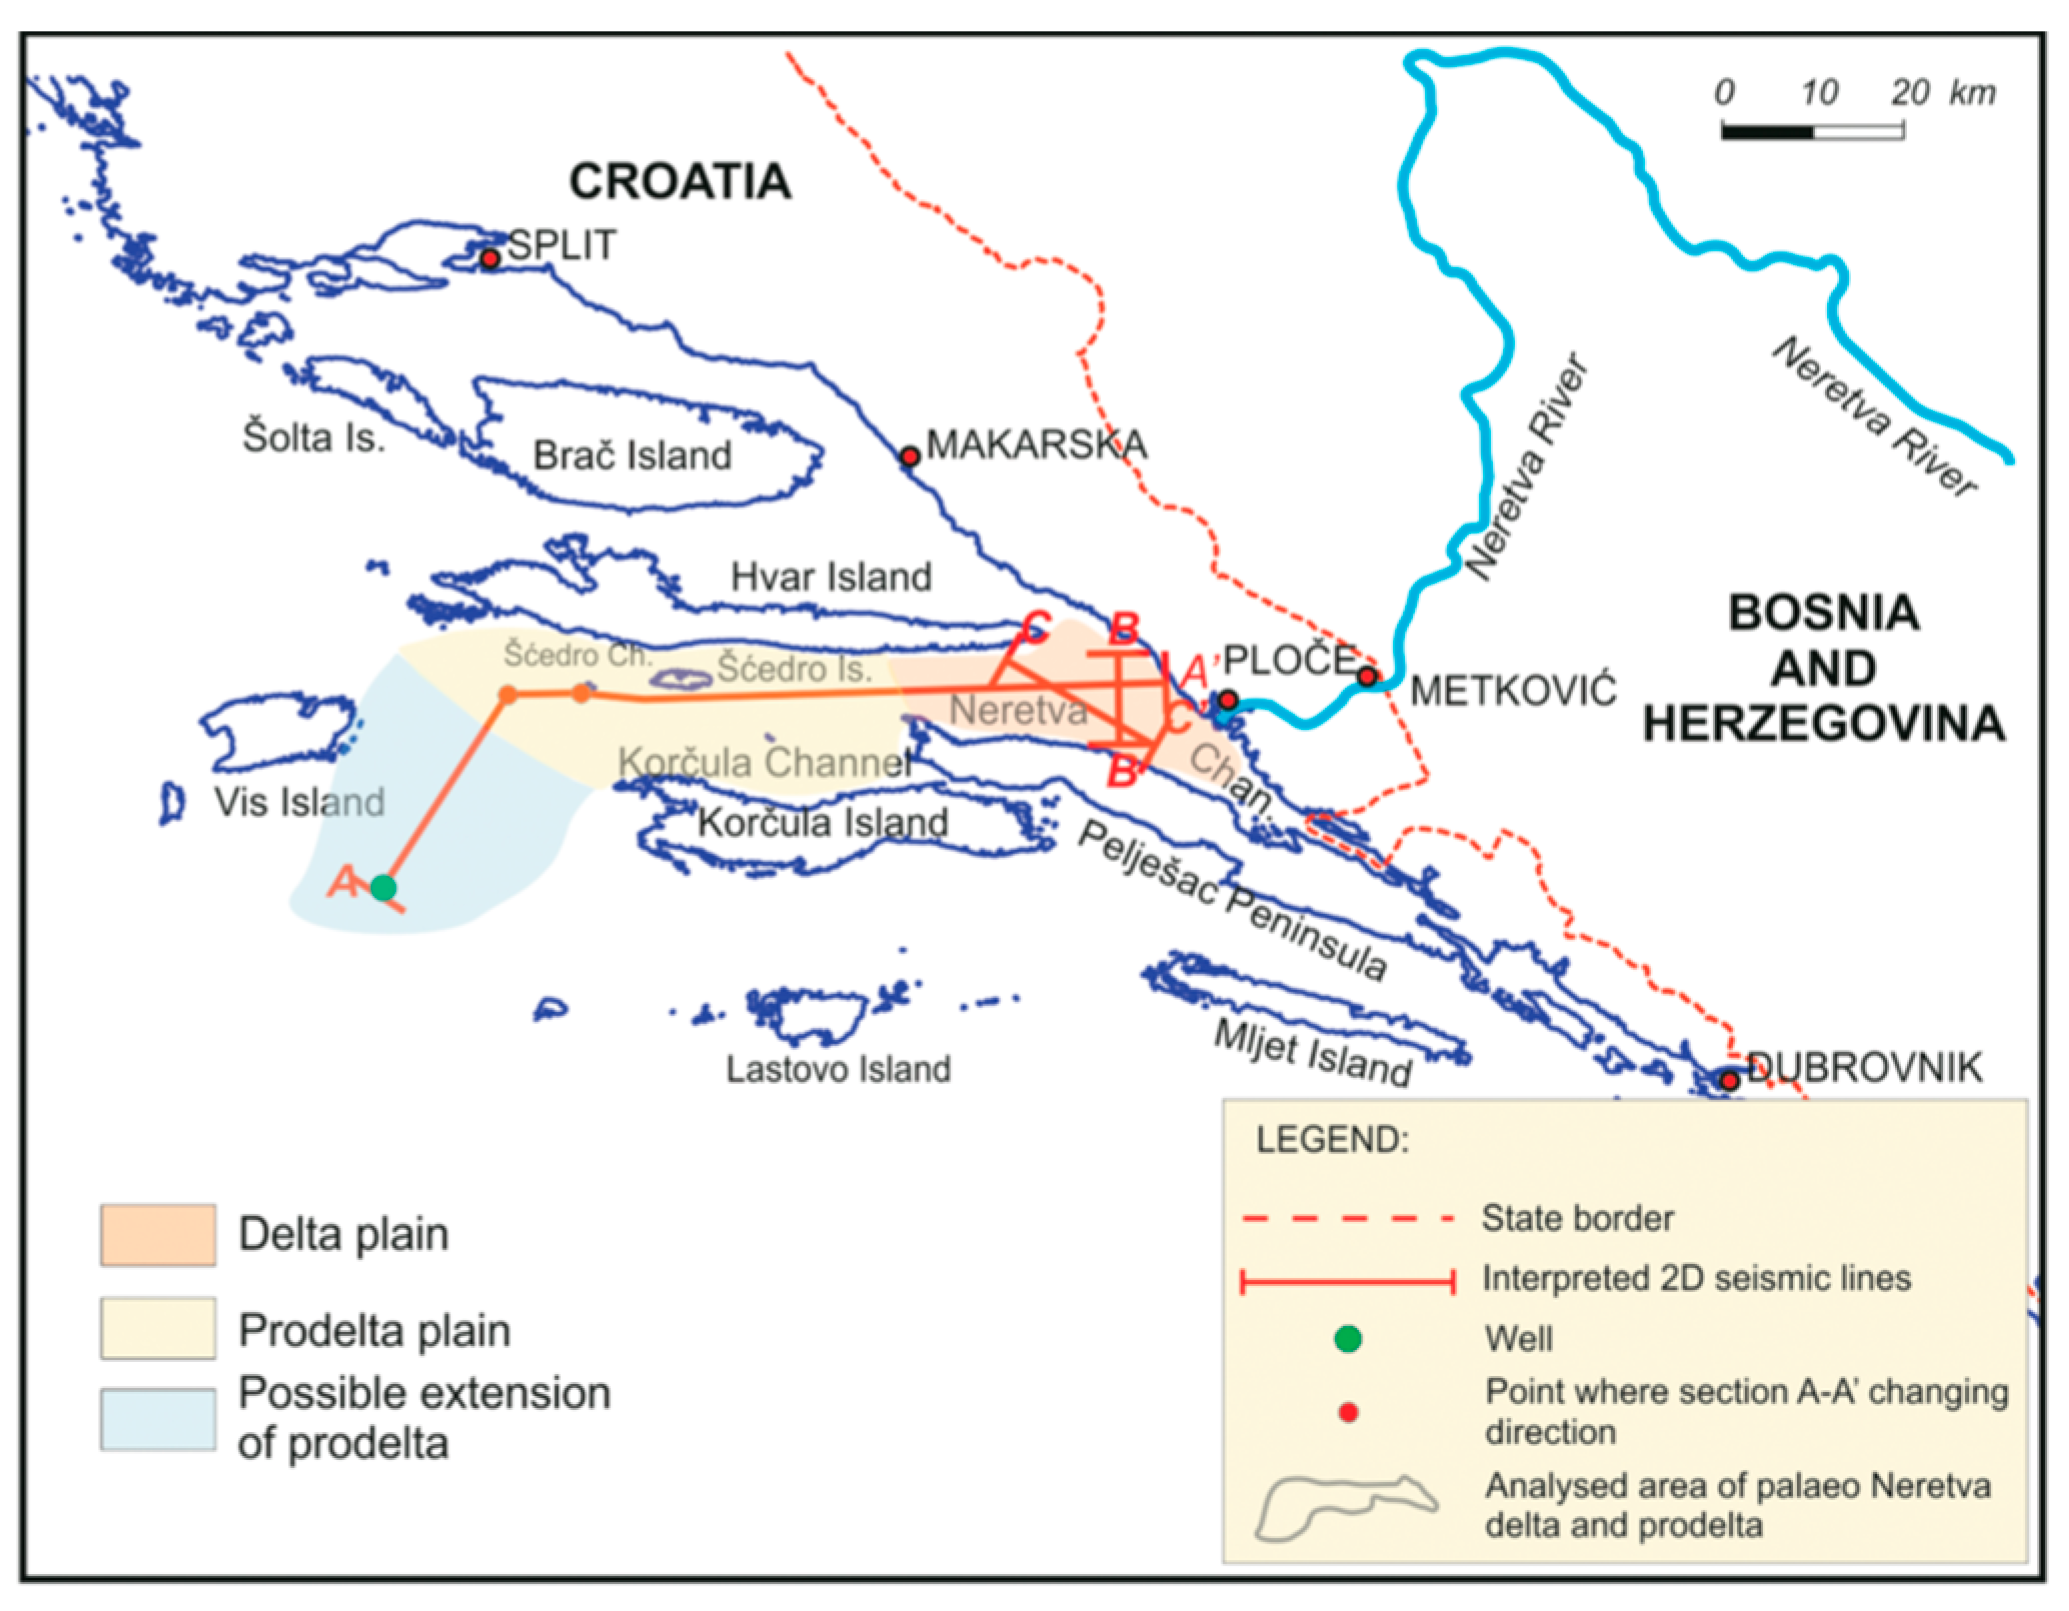
Figure 4.
Relative rise in mean sea level in the world, Mediterranean, and Adriatic Sea. (a) Post-glacial sea-level rise. RSM: World sea level in the Holocene; RB: Sea level derived from the Bakar mareograph data; SKB: Land subsidence derived from the Bakar mareograph data [24] (CC BY 4.0). (b) Relative rise in mean sea level in the Mediterranean [25].
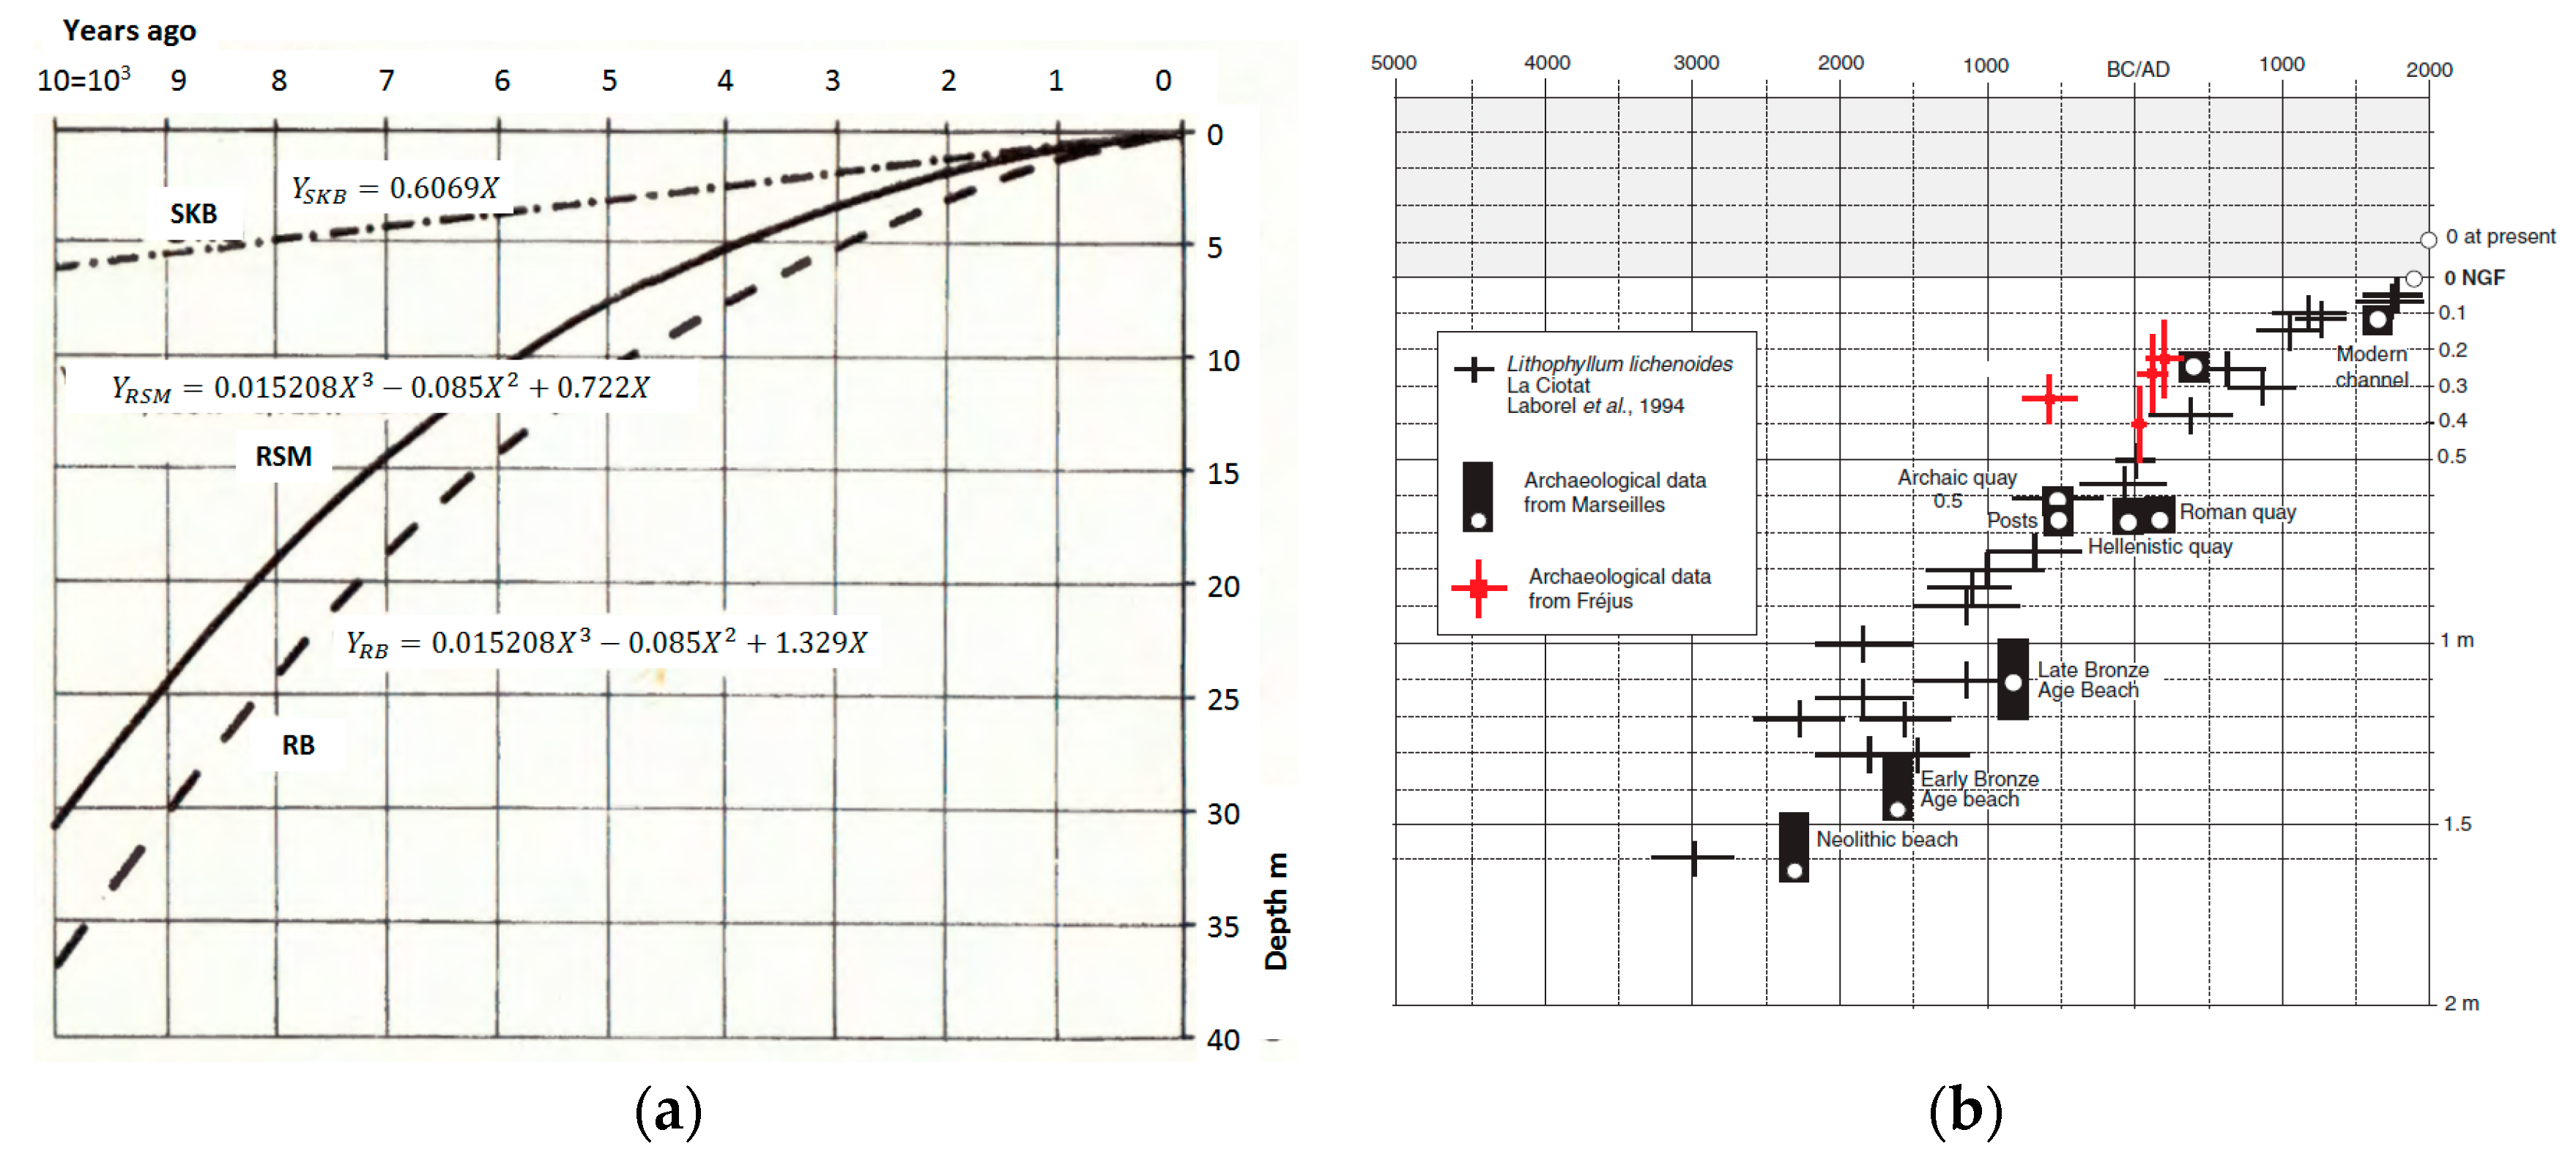
Figure 5.
Historical sequence of the development of the Neretva Delta (CC BY 4.0). (a) The Neretva River in the Roman period [29]. (b) Belin’s version of Cornelius’ map of the region from 1701 [30]. (c) The Neretva Delta on the map of Dalmatia 1869 [31]. (d) River regulation project 1887 [32].
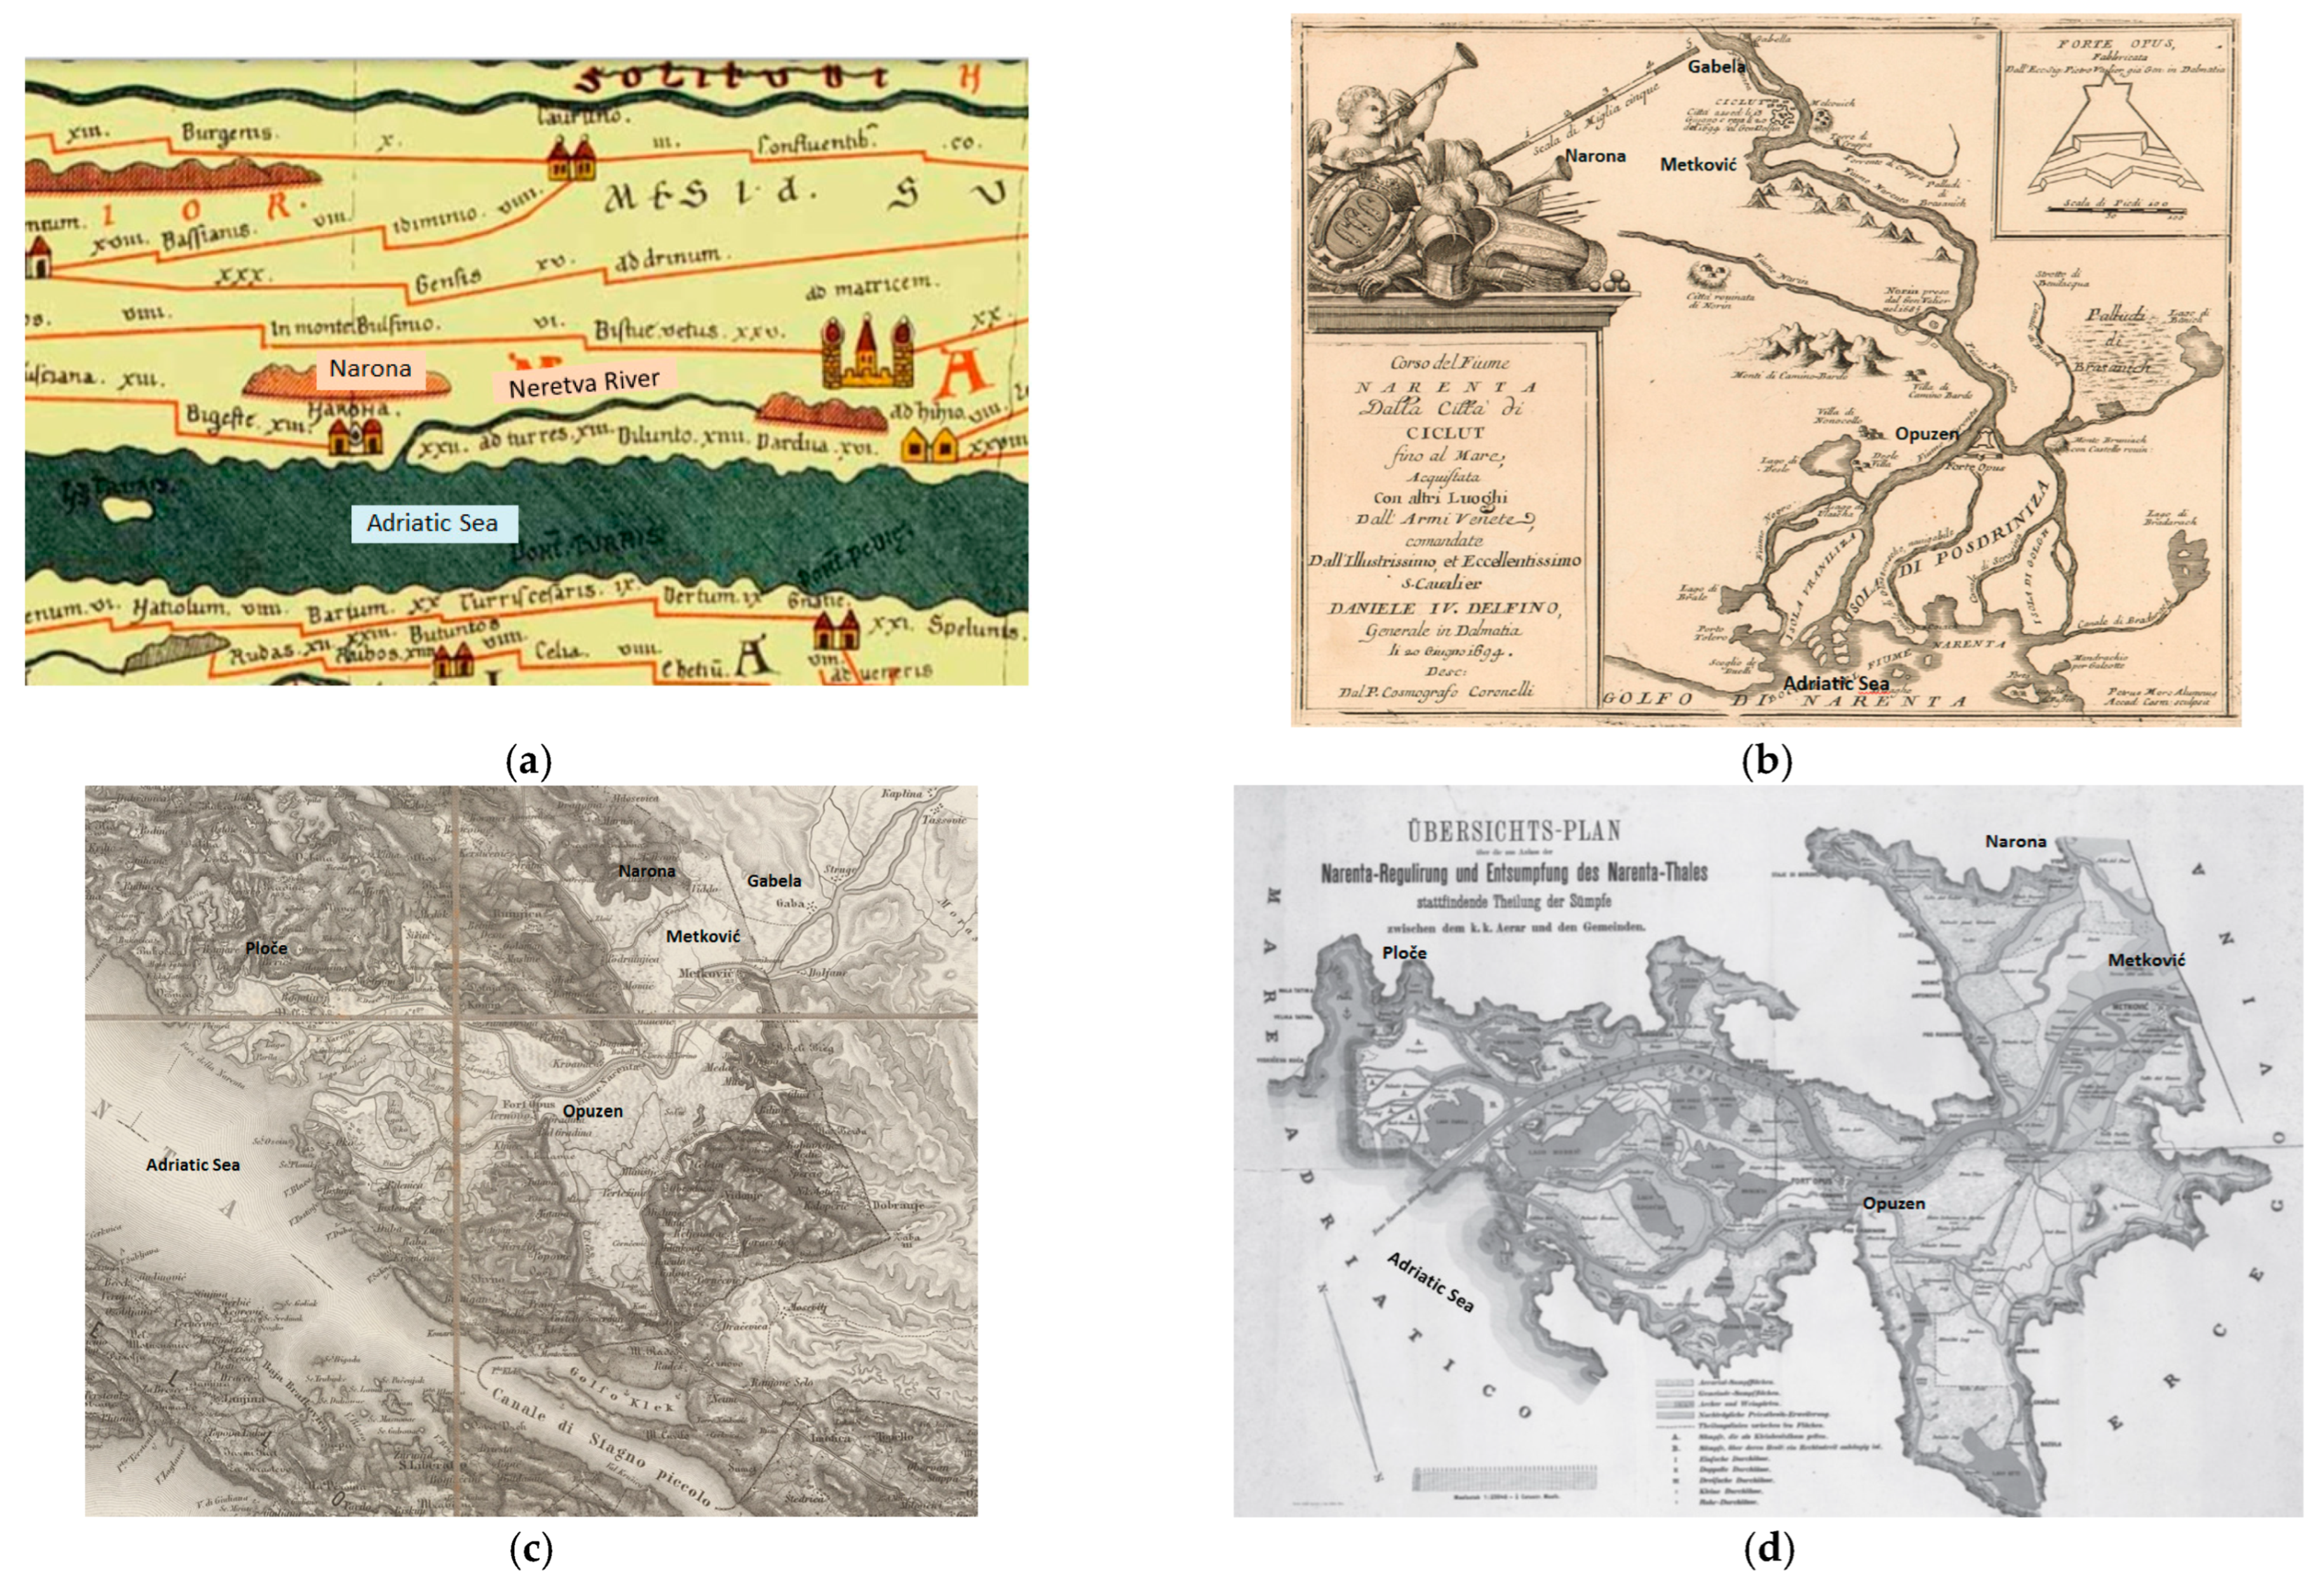
Figure 6.
Hydrogeological section of the delta; MSL: mean sea level, ASL: above sea level (modified from [4]) (CC BY 4.0)
Figure 6.
Hydrogeological section of the delta; MSL: mean sea level, ASL: above sea level (modified from [4]) (CC BY 4.0)
Disclaimer/Publisher’s Note: The statements, opinions and data contained in all publications are solely those of the individual author(s) and contributor(s) and not of MDPI and/or the editor(s). MDPI and/or the editor(s) disclaim responsibility for any injury to people or property resulting from any ideas, methods, instructions or products referred to in the content. |
© 2024 by the author. Licensee MDPI, Basel, Switzerland. This article is an open access article distributed under the terms and conditions of the Creative Commons Attribution (CC BY) license (https://creativecommons.org/licenses/by/4.0/).
Share and Cite
MDPI and ACS Style
Margeta, J. Historic Socio-Hydromorphology Co-Evolution in the Delta of Neretva. Appl. Sci. 2024, 14, 6477. https://doi.org/10.3390/app14156477
AMA Style
Margeta J. Historic Socio-Hydromorphology Co-Evolution in the Delta of Neretva. Applied Sciences. 2024; 14(15):6477. https://doi.org/10.3390/app14156477
Chicago/Turabian StyleMargeta, Jure. 2024. "Historic Socio-Hydromorphology Co-Evolution in the Delta of Neretva" Applied Sciences 14, no. 15: 6477. https://doi.org/10.3390/app14156477
Note that from the first issue of 2016, this journal uses article numbers instead of page numbers. See further details here.