Article

Multi-Stage Coordinated Planning for Transmission and Energy Storage Considering Large-Scale Renewable Energy Integration

1
School of Electrical and Electronic Engineering, North China Electric Power University, Beijing 102206, China
2
Economic and Technological Research Institute, State Grid Shanxi Electric Power Company, Taiyuan 030000, China
*
Author to whom correspondence should be addressed.
Appl. Sci. 2024, 14(15), 6486; https://doi.org/10.3390/app14156486
Submission received: 12 June 2024 / Revised: 18 July 2024 / Accepted: 22 July 2024 / Published: 25 July 2024
(This article belongs to the Special Issue New Insights into Power Systems)

Abstract

:
Due to the large-scale integration of renewable energy and the rapid growth of peak load demand, it is necessary to comprehensively consider the construction of various resources to increase the acceptance capacity of renewable energy and meet power balance conditions. However, traditional grid planning methods can only plan transmission lines, often resulting in low utilization rates of newly constructed lines. Additionally, static planning methods can only address single-target scenarios and cannot cope with dynamic growth in load and renewable energy. To address these issues, this paper proposes a multi-stage collaborative planning method for transmission networks and energy storage. This method considers the non-line substitution effect of energy storage resources and their characterization methods. It establishes the coupling relationship between resources across different planning stages to achieve coordinated multi-stage planning for transmission networks and energy storage. Based on the IEEE-24 node system and a case study in a northern province of China, the results show that the proposed method reduces investment costs by approximately 30% compared to static planning methods and by about 7.79% compared to conventional grid planning methods. Furthermore, this method can accommodate more renewable energy.

1. Introduction

Following the announcement of the “dual carbon” targets in China, new energy power generation technologies, mainly wind and photovoltaic, have been extensively applied. The large-scale grid integration of high-proportion new energy will become a defining feature and development form of the new power system [1,2,3]. According to the National Energy Administration’s data, by the end of December 2023, China’s national cumulative installed power generation capacity reached approximately 2.92 billion kilowatts, representing a year-on-year growth of 13.9%. Of this, solar power capacity was around 610 million kilowatts, reflecting a 55.2% year-on-year increase, while wind power capacity was approximately 440 million kilowatts, showing a 20.7% year-on-year increase [4].
However, as new energy is integrated into the grid on a large scale, conflicts in new energy consumption across different provinces and regions in the country have gradually surfaced, particularly in northwestern provinces rich in new energy resources, where wind and solar curtailment problems are severe [5]. From a transmission expansion planning viewpoint, the rapid growth in new energy installations has outpaced the construction of delivery channels for large-scale new energy plants, resulting in a significant lack of coordination. Furthermore, the long construction period and high investment required for new transmission channels lead to insufficient transmission capacity on the grid side, causing congestion and wind curtailment. Such a phenomenon not only affects the continuous promotion of the low-carbon transformation of the energy system, but also has an adverse impact on resource planning, system operation, and market transactions [6,7].
Traditional transmission grid planning aims to determine the optimal locations for new transmission lines to ensure that power loads are met safely under given planning objectives. As the grid evolves and the factors influencing its planning increase, the transmission grid planning model is also changing. In reference [8], the available transfer capability of the transmission grid is quantified and used as the objective function of the lower-level model. This complements traditional economic-optimal transmission network planning models. These models aim to enhance transmission efficiency by considering investments in wind power. Reference [9] addresses the impact of unpredictable climate changes on the system. It develops a robust expansion planning model for transmission networks that adapts to climate uncertainty. The model employs column generation to solve and demonstrate its ability to enhance operational safety under changing climate conditions. It also aims to reduce costs. Reference [10] introduces a scenario-driven expansion planning model for transmission networks, aiming to minimize costs in configuring the transmission network within the electricity market environment. However, the rapid rise in renewable energy proportions has significantly increased uncertainties in the system. This challenge may affect the effectiveness of these methods in future power system planning scenarios.
With the large-scale integration of renewable energy, the demands on grid planning have changed. It is necessary to consider the handling of renewable energy uncertainty and aim to enhance renewable energy acceptance capacity. Consequently, scholars in the field have conducted extensive research. In reference [11], researchers propose a distributed robust optimization model, aiming to minimize transmission network expansion costs under uncertain conditions while maximizing penetration levels of renewable energy generation. Reference [12] introduces congestion metrics to reflect price signal changes in the market environment. Based on this, the study explores energy storage deployment, wind farm integration, and the impact of price signals. It develops a transmission expansion planning model under market conditions. Reference [13] addresses the transmission expansion planning problem for wind power integration. It develops a mixed-integer linear programming model based on price-responsive demand schemes. In reference [14,15], a multistage robust optimization model is proposed to achieve the optimal expansion planning of transmission networks under the influence of uncertainty of wind power and load, and the robustness of the results is ensured by adjusting the uncertainty budget. Although the above methods consider the increased uncertainty of future power systems, single transmission grid planning methods ignore the synergistic effects between multiple types of resources. In particular, the potential of widely configured energy storage resources to delay line construction is not considered. This deficiency may lead to low utilization rates of transmission lines and overinvestment, hindering the effective economic sustainability of future power systems. Energy storage can serve as a non-wires alternative to traditional transmission line expansion schemes. Therefore the synergistic planning of transmission grid and energy storage has been widely studied in recent years. Reference [16] analyses the necessity and principles of energy storage coordination in energy internet development. Through constructing the energy storage coordination model with the aim of economic efficiency and energy utilization efficiency, respectively, the study concludes that economic efficiency plays the more important role in the energy storage coordination process. With the goal of minimizing the difference between total system cost and flexibility benefit, Reference [17] combined energy storage systems, wind farm power generation expansion planning, and bookstore expansion planning models to improve network flexibility. Reference [18] integrates system optimization with the Markov decision process to determine the least-cost grid line upgrade strategy under demand growth uncertainty, using this multi-stage decision process to assess the value of energy storage as a non-line alternative. Reference [19] proposes a method to quantify the delay in new grid line capacity construction using distributed generation, including energy storage. Reference [20] proposes a collaborative planning model for transmission networks and compressed air energy storage. The study uses an online solution method to conclude that energy storage can delay the construction of new transmission lines. In reference [21], a stochastic optimization model for the coordinated planning of transmission networks and energy storage is proposed, which considers both long-term and short-term uncertainties. Case study analysis demonstrates that energy storage can effectively reduce transmission network investments and increase wind power integration. Considering the intrinsic correlation between load demand and wind power production, reference [22] establishes a collaborative planning model for transmission networks and energy storage. This model uses polyhedral uncertainty sets to model the uncertainties in load demand and wind power generation. Reference [23] proposes a method for energy storage siting and sizing to delay grid upgrades, quantifying the benefits of energy storage in postponing grid upgrades and incorporating them into the upper-level objective function. The proposed bi-level model is solved using an improved differential evolution algorithm. However, most existing studies on the coordinated planning of energy storage and transmission lines are based on static planning. They implement a one-time planning process from the current state to the target year, failing to consider the gradual growth of load demand and renewable energy capacity. This approach does not align with the actual investment and construction needs of various resources. Sequentially conducting static planning calculations for each year is time-consuming and highly sensitive to previous plans, making it less effective compared to multi-stage dynamic planning.
From the aforementioned studies, it can be concluded that under the conditions of large-scale new energy grid integration, considering the expansion planning of transmission networks and the optimal configuration of energy storage in a coordinated manner can not only enhance the consumption level of new energy but also improve system economic benefits and the utilization rate of transmission equipment [24,25]. However, most existing studies on coordinated expansion planning of transmission networks and energy storage are static planning [26], which only invests in and configures the planned equipment of transmission lines and energy storage stations once, lacking comprehensive consideration of the phased growth of new energy installations and load demand. This can easily lead to redundant configuration, premature investment, and equipment idleness in the early stages of planning, and insufficient capacity and aging of equipment in the later stages [27].
Therefore, this paper studies the multi-stage coordinated expansion planning of transmission networks and energy storage considering new energy consumption capacity under large-scale new energy grid integration. The remainder of this paper is organized as follows: Chapter 2 reviews the non-line substitution effect of energy storage and analyzes the feasibility of incorporating energy storage into transmission grid planning. Chapter 3 proposes a multi-stage collaborative planning model for transmission networks and energy storage. Chapter 4 uses two case studies to validate the proposed method and analyzes the impact of factors such as energy storage costs and line capacity on the planning results.
The main contributions are as follows:
(1)
The feasibility of incorporating energy storage into transmission grid planning is analyzed. The collaborative relationship between energy storage configuration and transmission grid planning is clarified, and a framework for the coordinated planning of energy storage and transmission networks is proposed.
(2)
A multi-stage collaborative planning model for transmission networks and energy storage that considers the acceptance capacity of renewable energy is established. The model aims to minimize the total system cost while considering the mutual influences between different planning stages.
(3)
The differences between various grid planning methods are explored. The impacts of factors such as energy storage costs and line capacity on the planning results are summarized.

2. Feasibility Analysis and Modeling of Energy Storage in Transmission Network Expansion Planning

2.1. Analysis of the Non-Wires Alternative Effect of Energy Storage

As a crucial regulatory resource in future power systems, energy storage can reduce the system’s peak-valley difference through charge and discharge behaviors. This can delay the upgrade and renovation of transmission lines, increase the acceptance capacity of renewable energy, and improve equipment utilization. In this paper, energy storage resources that achieve these effects are defined as grid alternative energy storage. Grid alternative energy storage, as a non-wires alternative (NWA) solution, is coordinated with transmission network planning to improve transmission line utilization and increase new energy consumption capacity.
As an important function of alternative energy storage in the grid, the demonstration of the role of deferred transmission line construction is important for reducing system costs. Under traditional planning methods, the transmission and distribution network needs to invest a large amount of power assets to expand or upgrade lines with the purpose of meeting peak load demand periods. However, peak loads occur for only a short period each year, leading to low utilization of the newly built parts. Additionally, the expansion or new construction process is constrained by various factors such as the environment and transmission corridors. Configuring energy storage devices can reduce the peak load at this point, thereby delaying the upgrade of grid lines and improving the utilization rate of existing equipment. The principle is shown in Figure 1.
From Figure 1, it can be observed that the system’s peak load is gradually increasing. Assuming the maximum transmission capacity of this node is   l 1 , expansion planning will be required in y 2 . When energy storage is deployed at this node in y 2 , the peak load of the node decreases from   l 1 to   l 2 , ensuring that the peak load is below the maximum transmission capacity of the line. After Δ n years, the peak load will return to   l 1 . The schematic diagram of the role of energy storage in delaying transmission line upgrades shows that the value of grid alternative energy storage in delaying transmission line upgrades is essentially the time value of delaying the capital needed for equipment construction. The benefits of grid alternative energy storage devices in delaying transmission line upgrades are one of the important indicators that need to be quantified in the project planning process.

2.2. Modeling of the Energy Storage

In this section, we establish an optimal configuration model of energy storage embedded in a typical daily operation simulation. The decision variables are the power capacity and energy capacity of the energy storage system. The objective function minimizes the sum of the optimization configuration cost and the operation and maintenance cost of the energy storage system. The constraints include capacity constraints, as well as constraints on charging and discharging power and state of charge. The energy storage optimization configuration model is formulated as follows:
min c P P + c E S + c 0 P
e t = e t 1 · 1 σ + η c · P c , t · Δ t P d , t η d · Δ t
0 P c , t · η c P · v c , t
0 P d , t / η d P · v d , t
S O C min · S e t S O C max · S
e 0 = e T
v c , t + v d , t 1
where c P , c E and c 0 denote the unit power capacity cost, unit energy capacity cost, and unit operation and maintenance cost of the energy storage, respectively; P and S represent the rated charge/discharge power and rated capacity of the energy storage, respectively; e t denotes the remaining energy during the time ( t ) in the energy storage station; σ represents the self-discharge rate of the energy storage station; P c , t and P d , t represent the charging and discharging of power during the time ( t ) in the energy storage station, respectively; η c and η d   denote the charging and discharging efficiency of the energy storage station, respectively; Δ t represents the dispatch time interval, 1 h; v c , t and v d , t denote the charging and discharging states of the energy storage station, respectively, as binary variables. When the energy storage station is in a charging state, v c , t = 1 and v d , t = 0 ; when it is in a discharging state, v c , t = 0 and v d , t = 1 ; when both are 0, it indicates that the energy storage station is idle. S O C m i n and S O C m a x represent the lower and upper percentage limits of the state of charge of the energy storage station, respectively; T is the dispatch period, 24 h.
In the aforementioned energy storage optimization configuration model, Equation (1) represents the objective function for optimizing energy storage configuration, aiming to minimize the sum of investment and operation and maintenance costs. Equation (2) addresses the energy constraint of the storage system. Equations (3) and (4) impose constraints on the charging and discharging power of the storage system, respectively. Equation (5) sets the capacity constraint, limiting the state of charge within the permissible range. Equation (6) ensures the daily clearance constraint, guaranteeing the operational continuity of the storage station. Equation (7) stipulates the charging and discharging state constraint to ensure that the storage station exhibits only one state at any given time period.

3. Multi-Stage Expansion Planning Model for Transmission Network and Energy Storage Considering New Energy Acceptance Capacity

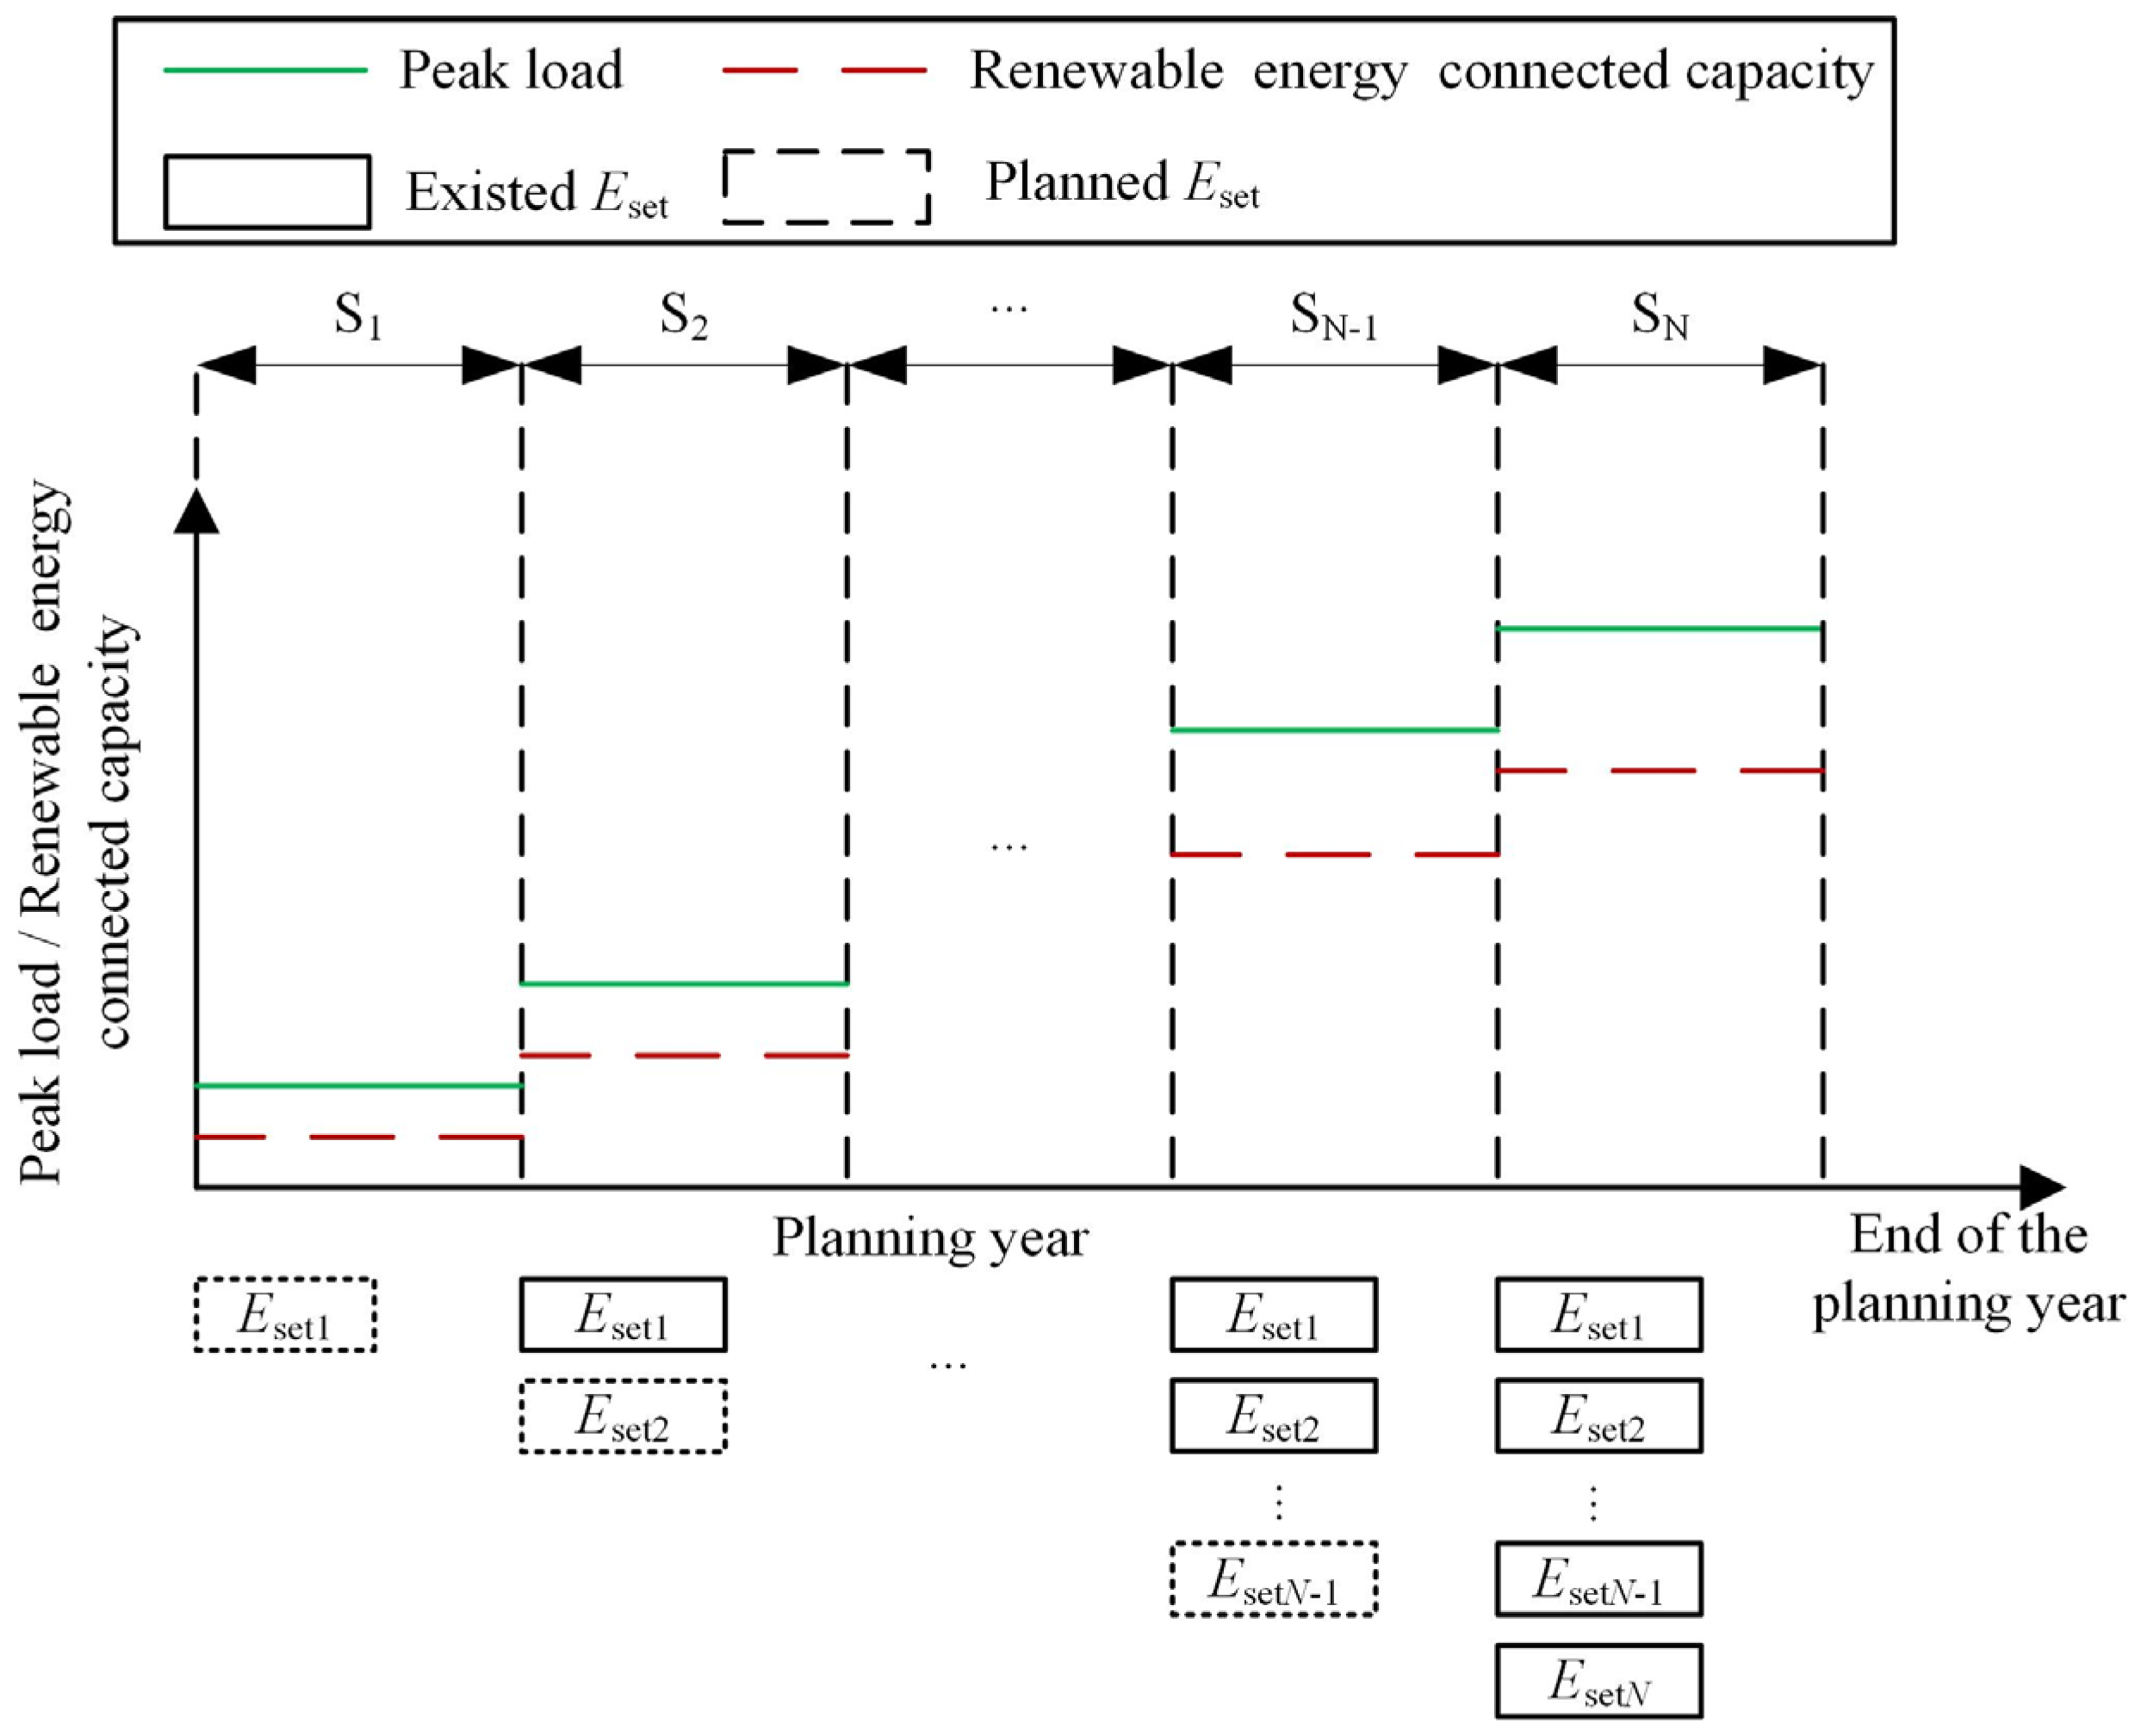
3.1. Framework of Multi-Stage Coordinated Expansion Planning Model for Transmission Network and Energy Storage

The multi-stage coordinated expansion planning model for transmission network and energy storage established in this paper considers the growth of wind power grid-connected capacity and load demand within the planning cycle, and according to the growth of wind power grid-connected capacity and load demand, divides the entire planning cycle into multiple planning stages. The diagram of multi-stage coordinated expansion planning of the transmission network and energy storage is shown in Figure 2.
The division of planning stages needs to be combined with the situation of load demand and the growth of new energy grid-connected capacity. Before planning the transmission network and energy storage system, according to the prediction of future load demand and new energy grid-connected level, the coordinated expansion planning of transmission network and energy storage is divided into N stages. As shown in Figure 2, the load demand and new energy grid-connected capacity in the to-be-built area increase in segmented steps [28].
As shown in Figure 2, the overall idea of multi-stage coordinated expansion planning of transmission network and energy storage is as follows: first, in the initial stage of stage S 1 planning, expand the relevant transmission lines and configure the corresponding energy storage device E s e t 1 to meet the maximum load and new energy consumption demand of stage S 1 planning. Then, in the initial stage of stage S 2   planning, on the basis of the power transmission lines expanded in the previous stage and the energy storage device E s e t 1 configured, plan and configure the power transmission lines and energy storage device E s e t 2 of this stage to meet the maximum load and new energy consumption demand of stage S 2 planning. This process continues until the completion of the last planning stage S N , where power transmission lines are expanded and energy storage devices are configured. Finally, the configuration of transmission lines and energy storage devices in each planning stage and the corresponding optimization operation scheme for each stage are obtained.
Traditional power grid planning aims to minimize the investment and operating costs of the grid, where operating costs can include the generation costs of generator units, load shedding penalty costs, and renewable energy curtailment penalty costs, etc. The constraints include the investment status constraints of candidate lines and constraints related to the operation of the power grid [29]. When the optimization of energy storage is considered in the planning process of the power grid, the output of the power grid expansion scheme at the power grid planning level, the energy storage optimization configuration layer determines the location and capacity of the energy storage based on the new power grid structure, and then returns the configuration strategy of the energy storage. At this time, the model needs to consider the constraints of the energy storage power station, including the investment status constraints of the energy storage power station and the operation constraints of the energy storage power station. At the same time, it is necessary to add the investment and operation costs of the energy storage power station to the objective function.

3.2. Objective Function

Money has a time value, and current funds can generate returns through use. Therefore, in the multi-stage expansion planning process of the transmission network and energy storage, the total cost cannot be simply added up based on the investment and operating costs of each stage. Different funds at different times should be converted into the same time value for comparison [30]. Introducing the present value factor, when calculating various cost expenses during the planning period, the costs generated in different years should be discounted to the equivalent present value at the beginning of the planning period. The present value factor R Y corresponding to the year Y   when the planning cost occurs is.
R Y = 1 + λ Y
where λ represents the annual discount rate.
The objective function of the multi-stage coordinated expansion planning model for transmission network and energy storage is to minimize the sum of the transmission investment cost f l i n e , energy storage investment cost f e s s , wind curtailment penalty cost f w i n d , and solar curtailment penalty cost f s o l a r over the entire planning period. The objective function is as follows:
f = f l i n e + f e s s + f w i n d + f s o l a r
(1) Investment cost of transmission line:
f l i n e = Y N Y ( i , j ) N p i j R Y c i j L i j x l i n e , i j , Y p
where c i j is the unit investment cost of the line; L i j is the length of the line; x l i n e , i j , Y p is the binary variable for constructing the new line p on branch i j in year Y , where 1 indicates that the line is to be constructed, and 0 indicates that the line will not be constructed; N Y and N P   represent the set of planning years and the set of candidate lines, respectively.
(2) Investment cost of energy storage:
f e s s = Y N Y i N e s s R Y x e s s , i , Y α c p P e s s , i , Y + c e E e s s , i , Y
where α is the energy storage cost coefficient, which represents the possible level of energy storage investment cost under different trends; c p and c e are the unit power capacity and unit energy capacity investment costs of constructing energy storage at node i ; x e s s , i , Y is a binary variable indicating whether energy storage is constructed at node i in year Y , with a value of 1 if energy storage is built and 0 otherwise; P e s s , i , Y and E e s s , i , Y are the power capacity and energy capacity of the energy storage constructed at node i in year Y , respectively; N e s s is the set of candidate installation nodes for energy storage.
(3) Penalty Cost for Wind and Solar Curtailment
f w i n d = Y N Y s N s d s j N w i n d t T R Y c wind P wind , j , t , s , Y f P wind , j , t , s , Y
f s o l a r = Y N Y s N s d s k N s o l a r t T R Y c solar P solar , k , t , s , Y f P solar , k , t , s , Y
where d s is the total number of days in scenario s ; c w i n d and c s o l a r are the unit penalty costs for wind and solar curtailment, respectively; P w i n d , j , t , s , Y f and P w i n d , j , t , s , Y represent the forecasted and actual output power of wind farm j during period t in scenario s for year Y , respectively; P s o l a r , k , t , s , Y f and P s o l a r , k , t , s , Y represent the forecasted and actual output power of solar power plant k during period t in scenario s for year Y , respectively; N w i n d and N s o l a r are the sets of wind farms and solar plants, respectively; N s is the set of typical scenarios for load and new energy output.

3.3. Constraints

(1) Energy storage investment constraints
The nodes in the grid suitable for installing energy storage stations are limited:
x e s s , i , Y x n e s s max
where x n e s s m a x represents the maximum number of energy storage installations allowed by the system.
(2) Transmission Expansion Constraints
Throughout the entire planning period, the constraints on the number of transmission lines must be met:
0 Y N Y ( i , j ) N p i j x line , i j , Y p x line , i j max
where x l i n e , i j m a x represents the maximum number of new lines between nodes i and j .
(3) Node Power Balance Constraints
A o P b , t , s , Y o + y = 1 Y 1 A y P b , t , s , Y y + A p P b , t , s , Y p + P g e n , t , s , Y + P w i n d , t , s , Y + P s o l a r , t , s , Y = P l , t , s , Y + y = 1 Y 1 P e s s , t , s , Y y + P e s s , t , s , Y
where: A y is the node-branch incidence matrix for new lines in year y . A o and A p are the node-branch incidence matrices for the initial and candidate lines, respectively. P b , t , s , Y o and P b , t , s , Y p are the active power vectors for initial and candidate lines in scenario s during period t of year Y . P b , t , s , Y y is the active power vector for new lines in year y during scenario s of period t . P g e n , t , s , Y , P w i n d , t , s , Y and P s o l a r , t , s , Y are the active power output vectors of thermal plants, wind farms, and solar power stations in scenario s during period t of year Y . P e s s , t , s , Y is the charging and discharging power vector for new energy storage in scenario s during period t of year Y . P l , t , s , Y is the load vector at each node in scenario s during period t of year Y .
(4) Branch Power Flow Constraints
P i j , t , s , Y o b i j n line , i j o θ i , t , s , Y θ j , t , s , Y = 0 , i , j N p 0
P i j , t , s , Y y b i j n line , i j y θ i , t , s , Y θ j , t , s , Y = 0 ,   y 1 , 2 , , Y 1 , i , j N p
P i j , t , s , Y p x line , i j , Y p b i j θ i , t , s , Y θ j , t , s , Y = 0 , i , j N p , p 1 , 2 , , n line , i j max y = 1 Y 1 n line , i j y
0 n line , i j y n line , i j max
θ ref , t , s , Y = 0
where: b i j is the susceptance of a single line between nodes i and j . n l i n e , i j o and n l i n e , i j m a x are the number of initial and candidate lines, respectively. n l i n e , i j y is the number of new transmission lines in y . P i j , t , s , Y o is the total active power flow through the initial branch i j in scenario s during period t of year Y . P i j , t , s , Y y is the total active power flow through new branches in the scenario s during period t of year Y . P i j , t , s , Y p is the active power flow through the new transmission line in the scenario ( s ) during a period ( t ) of year ( Y ) . θ i , t , s , Y , θ j , t , s , Y and θ r e f , t , s , Y are the voltage phase angles at nodes i ,   j , and the reference node r e f in scenario ( s ) during period ( t ) of year ( Y ) .
Equation (17) represents the power flow constraint for the initial branches of the system; Equation (18) represents the power flow constraint for the new branches constructed in y for Y ; Equation (19) represents the power flow constraint for the candidate branches to be constructed in Y ; Equation (20) limits the number of new branches constructed in y to be less than the maximum number of branches that can be expanded.
(5) Branch Power Limit Constraints
n l i n e , i j o P i j max P i j , t , s , Y o n l i n e , i j o P i j max n l i n e , i j y P i j max P i j , t , s , Y y n l i n e , i j y P i j max x l i n e , i j , Y p P i j max P i j , t , s , Y p x l i n e , i j , Y p P i j max
where P i j m a x is the maximum transmission power of a single line between nodes i and j .
(6) Conventional Generator and Renewable Energy Output Constraints
ω d , g Δ t P g e n , g , t , s , Y P g e n , g , t 1 , s , Y ω u , g Δ t
P g e n , g min P g e n , g , t , s , Y P g e n , g max
0 P wind , j , t , s , Y P wind , j , t , s , Y f
0 P solar , k , t , s , Y P solar , k , t , s , Y f
where: ω d , g and ω u , g are the ramp-up and ramp-down rates of conventional generator g . P g e n , g , t , s , Y is the active power output of a conventional generator g in scenario s during period t of year Y . P g e n , g m a x and P g e n , g m i n are the minimum and maximum output limits of conventional generator g . Δ t is the time interval.
(7) Energy Storage Operation Constraints
0 p c , i , t , s , Y P e s s , i , g x c , i , t , s , Y
0 p d , i , t , s , Y P e s s , i , g x d , i , t , s , Y
v c , i , t , s , Y + v d , i , t , s , Y v e s s , i , Y
S O C min · E e s s , i , Y e i , t , s , Y S O C max · E e s s , i , Y
e i , t + 1 , s , Y e i , t , s , Y = p c , i , t , s , Y Δ t · η e s s + p d , i , t , s , Y Δ t / η e s s
e i , 0 , s , Y = e i , T 24 , s , Y
where P c , i , t , s , Y and P d , i , t , s , Y represent the charging and discharging power of the energy storage device at the node ( i ) in the scenario ( s ) during the period ( t ) of the year ( Y ) ; e i , t , s , Y represents the capacity of the energy storage device at the node i in scenario s during period t of year Y ; v c , i , t , s , Y and v d , i , t , s , Y represent the charging and discharging status of the energy storage device at the node i in scenario s during period t of year Y , which are binary variables, where 1 indicates charging/discharging and 0 indicates no action of the energy storage device; η e s s + and η e s s represent the charging efficiency and discharging efficiency of the energy storage device, respectively; the last constraint is the energy balance constraint of the energy storage the since the technical verification of this planning scheme is for a typical day, so T 24 = 24 , which means the energy balance constraint of the energy storage is a daily balance constraint.

3.4. Model Solving and Linearization

3.4.1. Linearization of Power Flow Constraints

The presence of the product of discrete variables x l i n e , i j , Y p and continuous variables θ i , t , s , Y and θ j , t , s , Y in Equation (19) renders the model a non-convex optimization problem, making it challenging to ensure the attainment of an optimal solution. Therefore, Equation (19) is linearized, resulting in the following form:
M 1 x line , i j , Y p P i j , t , s , Y p b i j θ i , t , s , Y θ j , t , s , Y M 1 x line , i j , Y p i , j N p , p 1 , 2 , , n line , i j max
where M represents a sufficiently large number.
Equation (33) can be interpreted as follows: when the candidate line p of branch i j in stage g is not selected, x l i n e , i j , Y p = 0 , Equation (33) simplifies to P i j , t , s , Y p b i j θ i , t , s , Y θ j , t , s , Y M , where M is an extremely large value, rendering Equation (33) non-binding in this scenario. Conversely, when x l i n e , i j , Y p = 1 , Equation (33) can be expressed in the form of direct current power flow constraints P i j , t , s , Y p = b i j θ i , t , s , Y θ j , t , s , Y . In this case, Equation (33) serves the same function as Equation (19). All variables appearing in this manuscript, together with their meanings and units are listed in Appendix B.

3.4.2. Model Solving Methods

In this paper, the proposed multi-stage collaborative planning model for transmission networks and energy storage is solved using the CPLEX 12.8.0 solver, called through the YALMIP R20230622 toolbox on the MATLAB 2023a platform. Equations (9)–(13) represent the objective functions of the model, and Equations (14)–(32) define the constraints for solving the model. Among them, x l i n e , i j , Y p and x e s s , i , Y are integer variables that determine the transmission network expansion plans and energy storage locations at each planning stage. Besides, P i j , t , s , Y o , P i j , t , s , Y p , P g e n , i , t , s , Y , P w i n d , j , t , s , , P s o l a r , i , t , s , Y , P c , j , t , s , , P d , i , t , s , Y , e i , t , s , Y , θ i , t , s , Y , P e s s , i , Y and E e s s , i , Y are continuous variables, ensuring the system operates normally under various constraints at each stage, P e s s , i , Y and E e s s , i , Y specifically, determine the power and capacity configurations of the energy storage at each stage.

4. Case Study

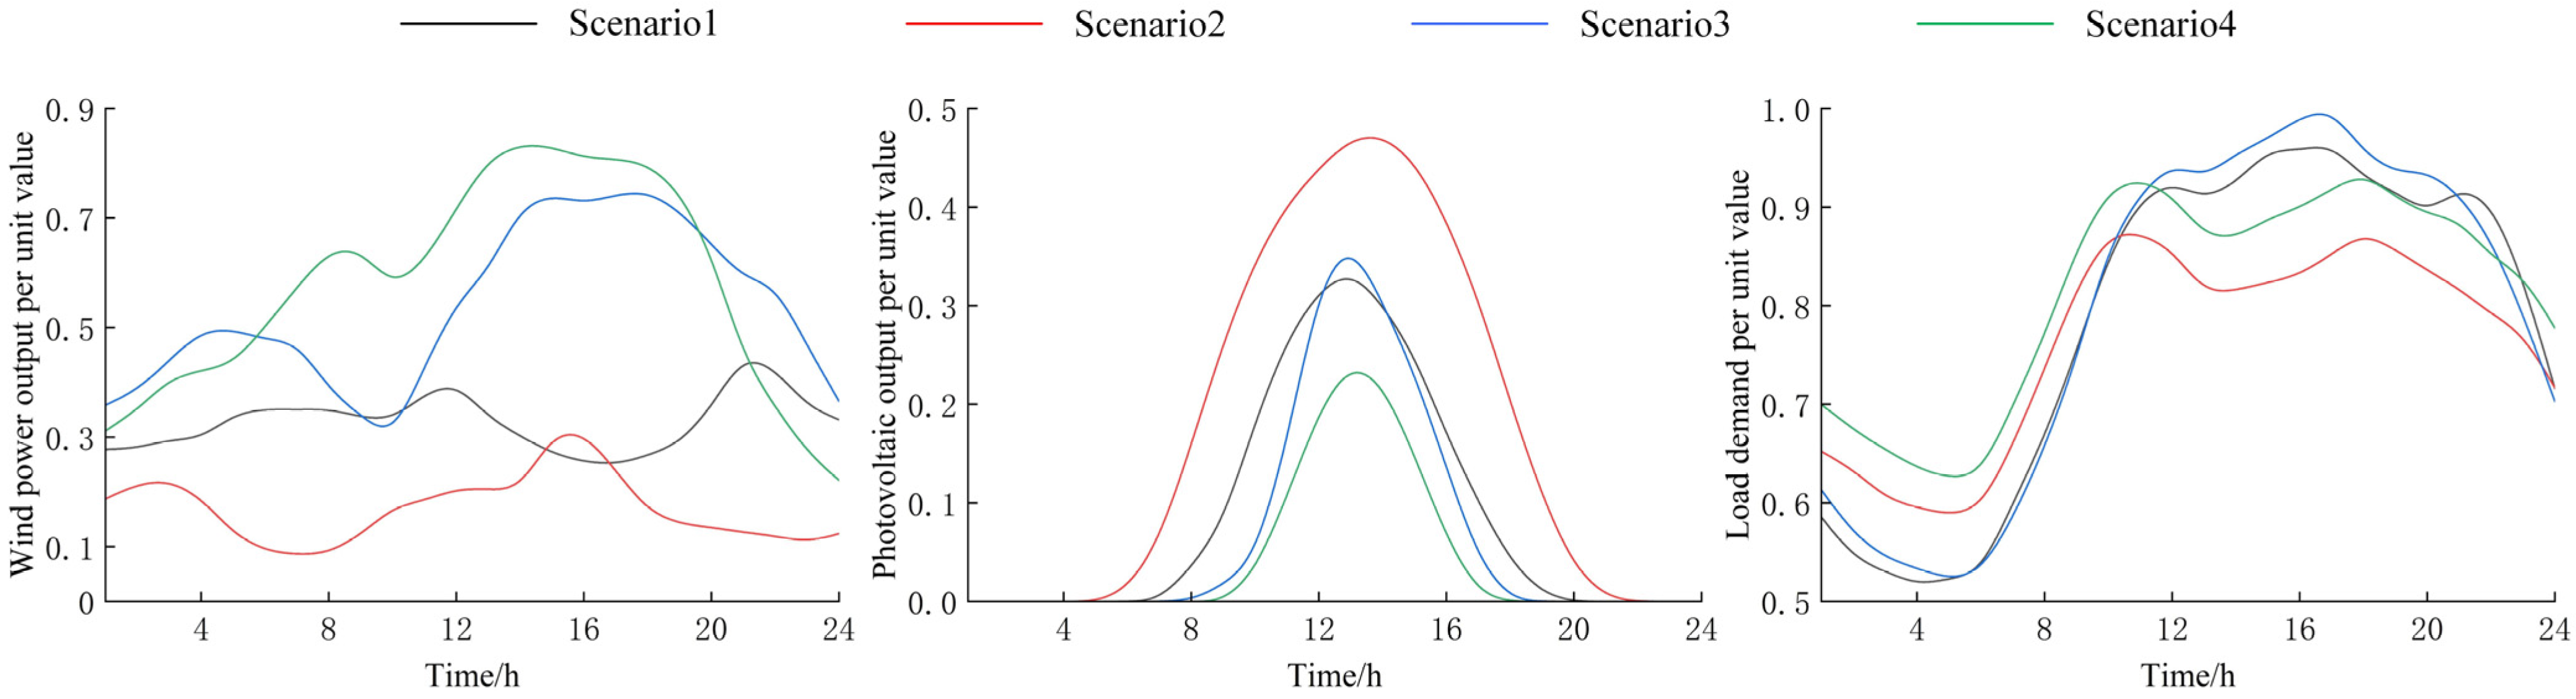
4.1. Generating Typical Scenarios

The historical data used in this case study are all from wind farms, photovoltaic power stations, and load centers in the same region, ensuring the time series of new energy output and load demand while retaining the correlation between new energy output and load demand. To characterize the uncertainty in renewable energy output and load demand, the typical day curves used in the model are obtained by clustering by season, with each typical day curve representing the predicted renewable energy output and load levels for that season. The wind power output, photovoltaic power output, and load demand curves used in this case study are shown in Figure 3.

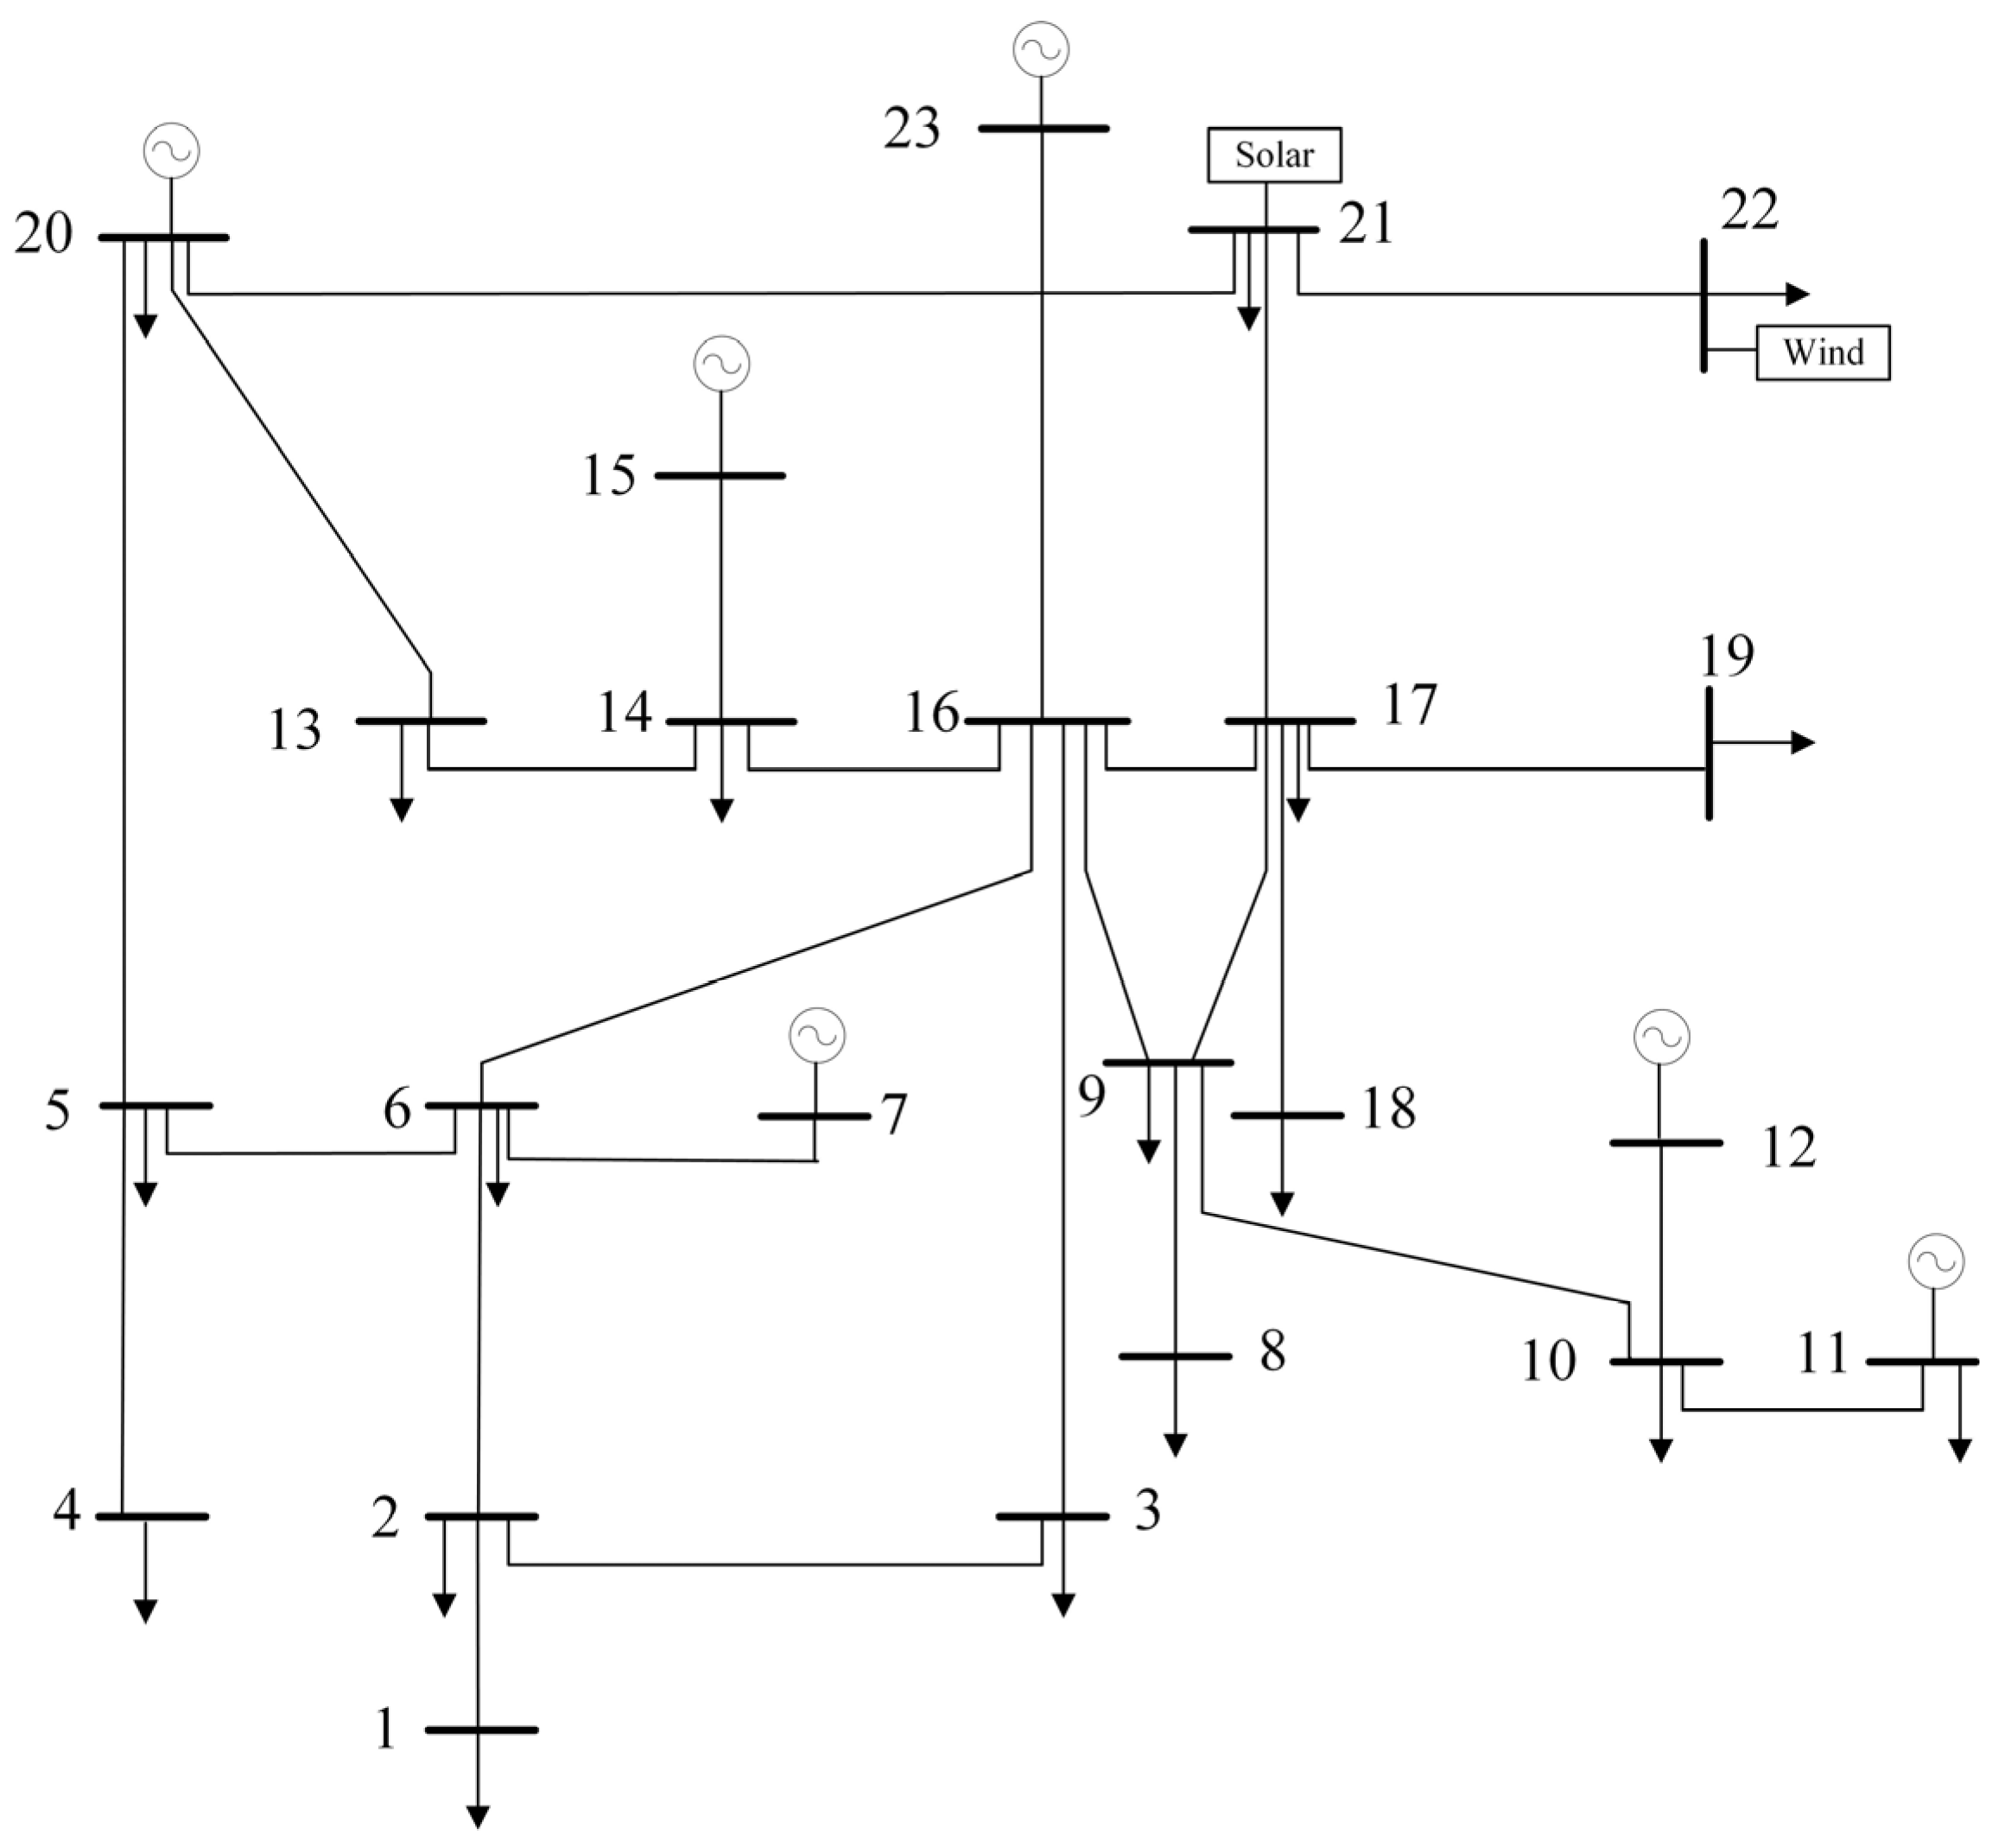
4.2. IEEE RTS-24 Node Case Study System

4.2.1. System Parameter and Case Setting

This section of the case study uses the IEEE RTS-24 node system. The transmission line data, generator data, maximum node loads, and parameters of the selected compressed air type energy storage are based on the data in [31]. A wind power plant is connected to node 23, and a photovoltaic power station is connected to node 4. The total planning period is divided into three stages, assuming that the investment behavior of each planning stage occurs in the first year of that planning stage. The three stages are 2, 3, and 5 years, corresponding to wind power grid connection capacities of 1000 MW, 1500 MW, and 3000 MW, and photovoltaic power plant grid connection capacities of 1000 MW, 1500 MW, and 3000 MW. The IEEE RTS-24 node system has a total of 17 load nodes, with the maximum load demand of each load node increasing at a rate of 20 MW per stage. Considering the development of energy storage technology, the cost of energy storage will also gradually decrease. The unit power cost of energy storage in each stage is 4000 yuan/kW, 3500 yuan/kW, and 3000 yuan/kW, respectively. The unit energy cost of energy storage in each stage is 200 yuan/kWh, 180 yuan/kWh, and 150 yuan/kWh, respectively. The annual discount rate of energy storage devices is 8%, and the annual discount rate of transmission lines is 10%. The economic service life of transmission lines is 25 years, and the unit cost of lines is 1 million yuan/km. c w i n d is set to 0.1 yuan/MWh, and c s o l a r is set to 0.05 yuan/MWh. The number of newly built transmission lines is a variable, and the capacity of each new transmission line is the same as the capacity of the original single transmission line.
To visually compare the differences between the method proposed in this paper and traditional planning methods, and to analyze the impact of coordinated energy storage and transmission grid planning on the development of the power system, three research scenarios are set in this paper:
Scenario 1 employs a single-step static planning method, where static planning is conducted for the final target year’s load and renewable energy integration requirements, using the method described in [21].
Scenario 2 utilizes a single transmission grid planning method as described in [14,15], without considering energy storage planning.
Scenario 3 presents the multi-stage coordinated planning of energy storage and transmission networks proposed in this paper, characterized as dynamic planning.
These three scenarios range from static planning to dynamic planning, extending from traditional methods to the method proposed in this paper, effectively comparing the strengths and weaknesses of different approaches.

4.2.2. Planning Results under Different Scenarios

In order to verify the advantages and disadvantages of the proposed method in this paper, the above example data are substituted into the single-step static transmission grid planning, single transmission grid planning, and the multi-stage collaborative planning model of the transmission grid and energy storage proposed in this paper, respectively. The planning results under different Cases are shown in Table 1, Table 2, and Table 3, respectively. The multi-stage planning scenarios obtained by the multi-stage collaborative planning model of transmission grid and energy storage are shown in Figure 4.
From Table 1, it can be seen that in the single-step static collaborative planning scheme of transmission grid and energy storage, the construction of transmission lines and the location and capacity determination of energy storage are only carried out in the first planning stage, but the planning scheme is based on the grid-connected capacity and load demand of wind farms and photovoltaic power plants in the third stage. The single-step static collaborative planning scheme of transmission network and energy storage will result in “over-investment” of transmission lines and energy storage, that is, the amount of transmission line expansion and energy storage configuration far exceeds the transmission capacity demand corresponding to the current load. Therefore, the new construction of power grid lines and the location and capacity of energy storage of this scheme can fully absorb the wind power of the system when applied in the first stage. The cost of wind abandonment penalty is reduced to 0, and when applied in the second stage, the wind abandonment penalty is only 89 million yuan.
By comparing Table 2 and Table 3, it can be found that the planning results of Single multi-stage transmission expansion planning and the method proposed in this paper are mainly different in the third stage. In the multi-stage coordinated expansion planning scheme of transmission network and energy storage, as shown in Table 3, the number of new lines in the three stages is 3, 4, and 6 respectively, and the number of new lines in the three stages gradually increases. This is because the grid-connected capacity of new energy gradually increases, and the construction of energy storage is mainly concentrated at nodes 4 and 23, which are the grid-connected nodes of new energy stations. In the first stage, the grid-connected capacity of wind power plants and photovoltaic power stations is small, and the expansion of lines is mainly to meet the load demand of system load nodes (6 and 8) and the power output of thermal power plants (nodes 2, 7, and 13); In the second stage, when the grid-connected capacity of new energy increases, the newly built lines are mainly around node 4 (grid-connected node of photovoltaic power station) and node 23 (grid-connected node of wind power plant) to achieve low-cost power output of wind and photovoltaic power generation; In the third stage, the grid-connected capacity of new energy increases significantly. To alleviate the transmission congestion of the system, the number of newly built lines increases significantly, and they are still concentrated around the grid-connected nodes of new energy and related nodes.

4.2.3. Analysis of the Impact of Different Planning Methods

In order to demonstrate the effectiveness of the proposed method in reducing system costs and improving renewable energy acceptance capacity, this section analyzes the planning results in Section 4.2.2. Compared to the planning results of the single-step static method proposed in the literature [21], the total cost of the multi-stage collaborative planning scheme of transmission network and energy storage is reduced by 950 million yuan, which is about 30.4%. This is because the transmission line construction and energy storage location determination in the single-step static collaborative planning scheme of transmission grid and energy storage are only carried out in the first planning stage, so compared with the multi-stage collaborative planning scheme of transmission grid and energy storage, it cannot enjoy the benefits of energy storage cost reduction due to technological update, and it cannot play the time value of funds. From the comparison of Table 2 and Table 3, It can be found that compared to the single grid planning approach described in the literature [14,15], the multi-stage coordinated expansion planning scheme of the transmission network and energy storage mainly differs in the number of new lines in the third stage. The total cost of line construction has been reduced by 54 million, reflecting the role of energy storage in delaying the upgrade and transformation of transmission lines. The total investment cost has been reduced by 184 million, saving 7.79%, indicating that the multi-stage coordinated expansion planning scheme of transmission network and energy storage has better economy. In terms of the punishment for new energy curtailment, from Table 1 and Table 2, it can be seen that the multi-stage coordinated expansion planning scheme of transmission network and energy storage greatly reduces the system’s curtailment punishment costs compared with the single transmission network multi-stage planning scheme. Among them, the total wind curtailment punishment cost has been reduced from 1.789 billion to 1.009 billion, and the total solar curtailment punishment cost has been reduced from 74 million to 14 million, indicating that the coordinated expansion planning of transmission network and energy storage can not only alleviate transmission congestion and delay the upgrade and transformation of transmission lines, but also reduce the cost of new energy curtailment and increase the consumption of new energy.

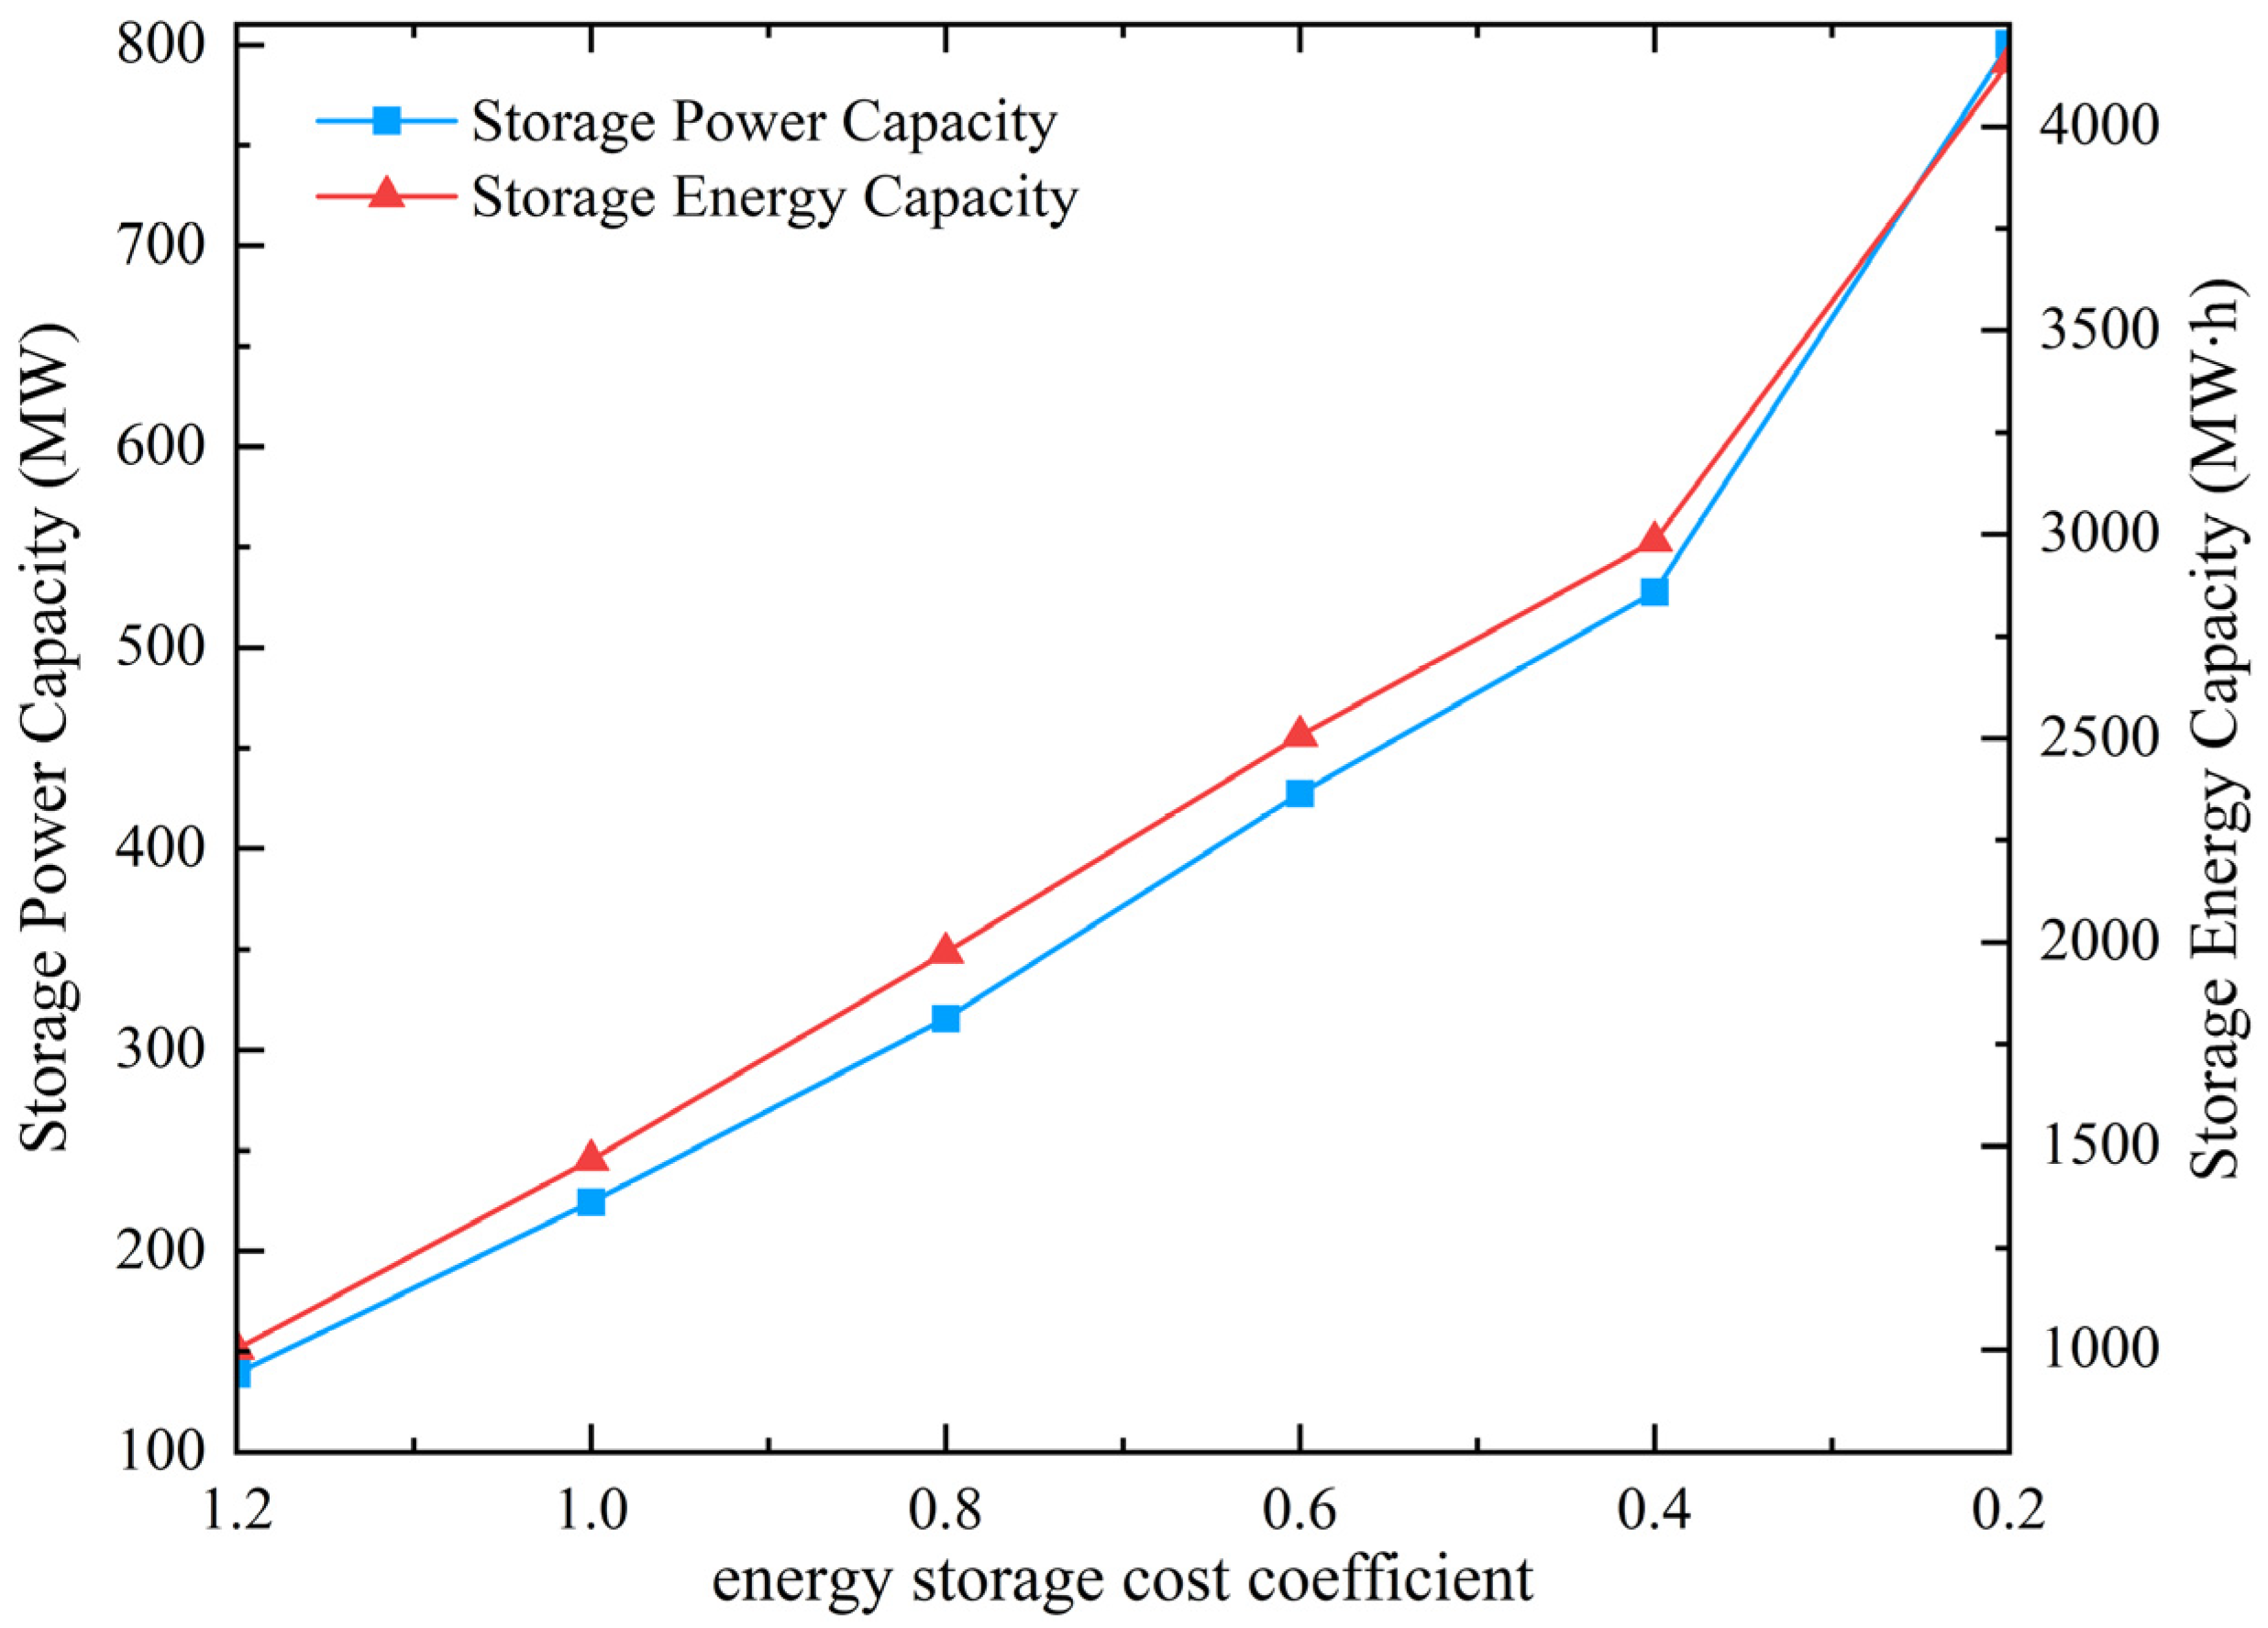
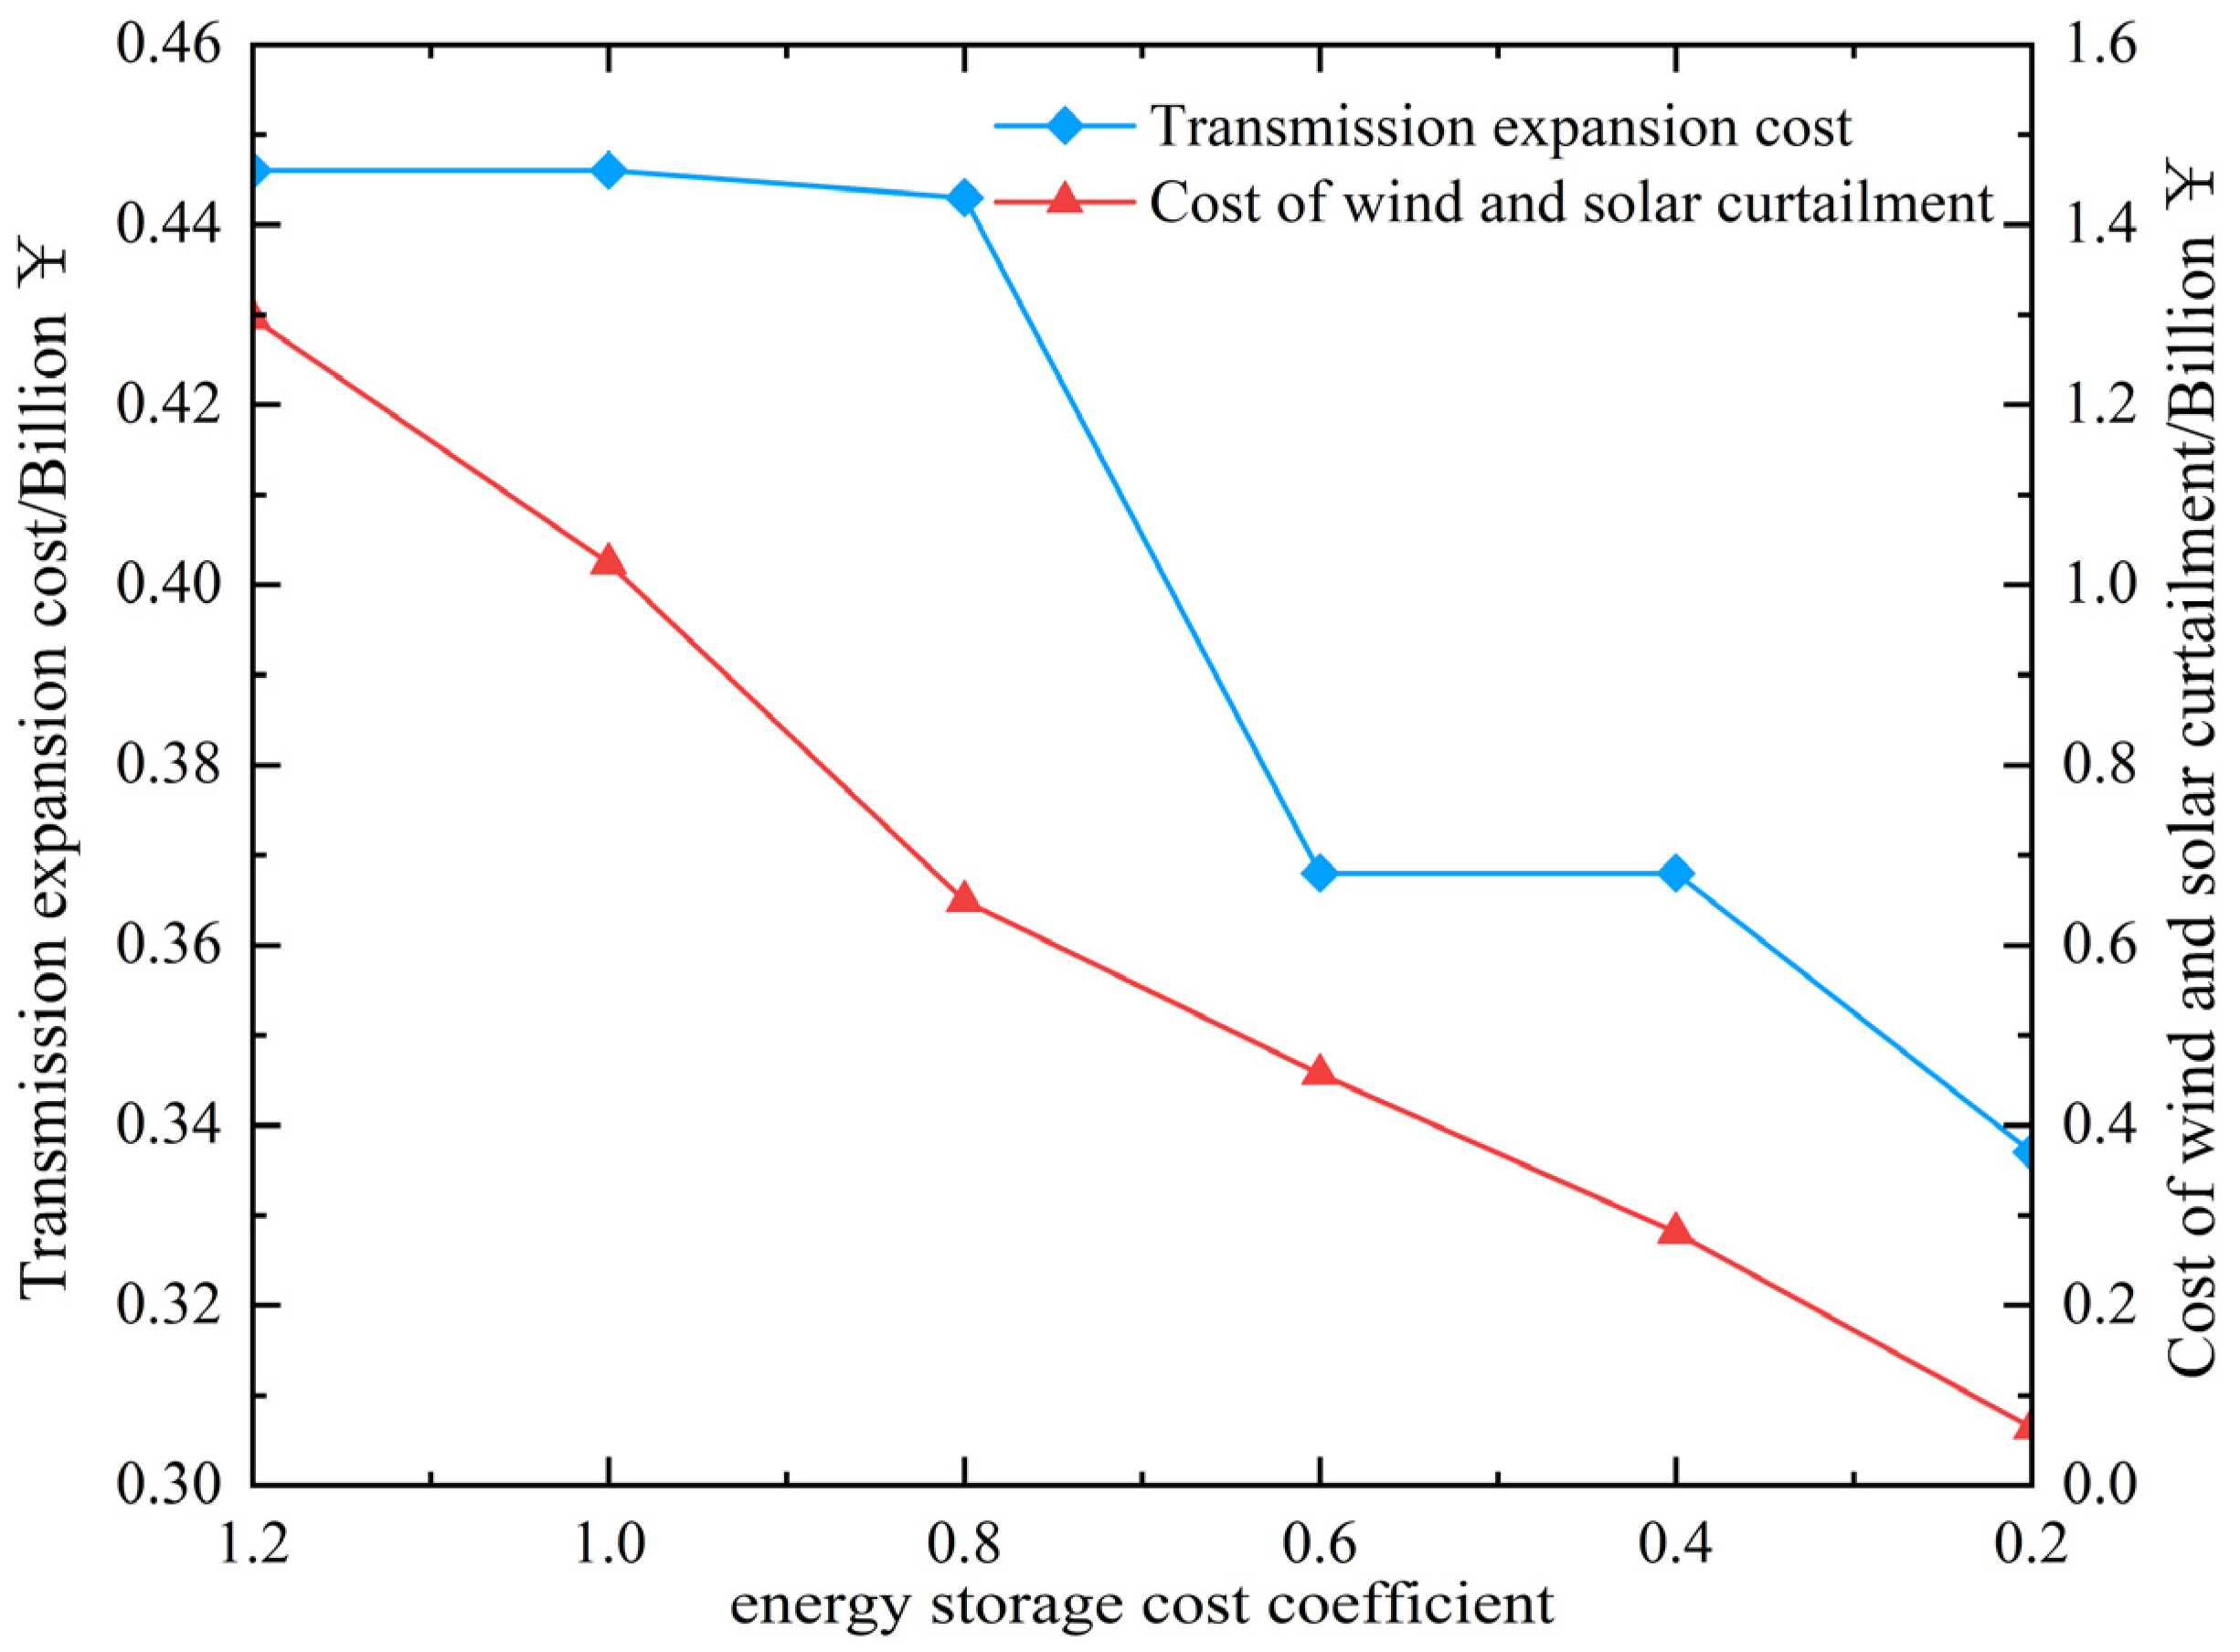
4.2.4. Impact of Energy Storage Costs on Planning Results

Due to the current development of energy storage technology, the cost of energy storage is relatively high. The high cost of energy storage limits the allocation of more energy storage in planning models with economic optimality as the objective function. This section further discusses the impact of energy storage costs on the coordination planning of transmission network and energy storage.
On the basis of Case 3, the energy storage cost coefficient is gradually changed from 0.2 to 1.2 in intervals of 0.2, and the model is solved to obtain the impact of energy storage cost on energy storage configuration results and the impact on transmission construction and wind and solar curtailment, as shown in Figure 5 and Figure 6.
From Figure 5, it can be seen that as the energy storage cost coefficient decreases, the power capacity and energy capacity of the energy storage increase. When the energy storage cost coefficient decreases from 1.2 to 1.0, the power capacity and energy capacity of the energy storage increase from 138.98 MW and 1001.90 MWh to 224.34 MW and 1466.71 MWh, respectively, representing increases of 61% and 46%. However, the line planning scheme remains unchanged during this process, and the cost of wind and solar curtailment decreases by 272 million, indicating that the configuration of energy storage increases the flexibility of system down-regulation and up-regulation, thereby increasing the integration of wind and solar power generation. When the energy storage cost coefficient is less than 1.0, the rate of increase in power capacity and energy capacity of the energy storage significantly accelerates. From Figure 6, it can be seen that the cost of wind and solar curtailment and the cost of line expansion decrease as the energy storage cost coefficient decreases. Especially when the energy storage cost coefficient decreases from 0.8 to 0.6, the cost of line expansion decreases from 443 million to 368 million, a decrease of 16.9%. This indicates that the increase in energy storage capacity can effectively reduce redundant lines in the original power transmission line planning, increase system flexibility, and integrate more wind and solar power generation, while also delaying the upgrade of power transmission lines.

4.2.5. Impact of Transmission Line Capacity

To further investigate the role of energy storage in alleviating transmission congestion and delaying the upgrade of transmission lines, this section extends from the multi-stage coordinated planning of energy storage and transmission networks to single transmission grid planning scenarios. Specifically, the planning considers reducing the capacity of transmission lines to 90% and 80% of the original system capacity. The results are shown in Table 4.
To further quantify the synergistic effects between transmission grid planning and optimized energy storage configuration, this section introduces a synergy index, computed as shown in Equation (34).
I r e p = f T E P f T E P E S / f T E P × 100 %
where   I r e p denotes the synergy index between transmission grid planning and optimized energy storage configuration,   f T E P represents the total cost of the multi-stage planning scheme for a single transmission grid,   f T E P E S represents the total cost of the multi-stage coordinated planning scheme for transmission grid and energy storage.
From Table 4, it is observed that when the transmission capacity is reduced to 90% of the original, the total number of new line expansions across the three stages decreases by only 1 line. In the first stage, even with the same number of new lines (5 lines), the coordinated planning of transmission and storage opts for shorter line expansions, resulting in a reduction of investment by 70 million yuan in the first stage. As the system’s transmission capacity decreases, the demand for new transmission line expansions increases, reflected in an increase in the number of new lines across the three stages.
When the transmission capacity is at the original standard capacity, the total investment for the multi-stage planning of a single transmission grid is 2.362 billion yuan, while for the multi-stage coordinated planning of transmission grid and energy storage, it is 2.179 billion yuan, representing a reduction of 183 million yuan, with a synergy index of 7.75%. When the transmission capacity is reduced to 90% of the original, the total investment decreases by 203 million yuan, resulting in a synergy index of 8.00%. When reduced to 80% of the original capacity, the total investment decreases by 280 million yuan, with a synergy index of 9.85%. Comparatively, as the transmission capacity becomes insufficient, the economic benefits of the multi-stage coordinated planning of transmission grid and energy storage improve compared to the multi-stage planning of a single transmission grid. This enhancement demonstrates better synergy between transmission grid planning and optimized energy storage configuration, enabling increased integration of renewable energy and meeting the low-carbon goals of the system, aligning more closely with the requirements of power system planning under the “dual carbon” targets.

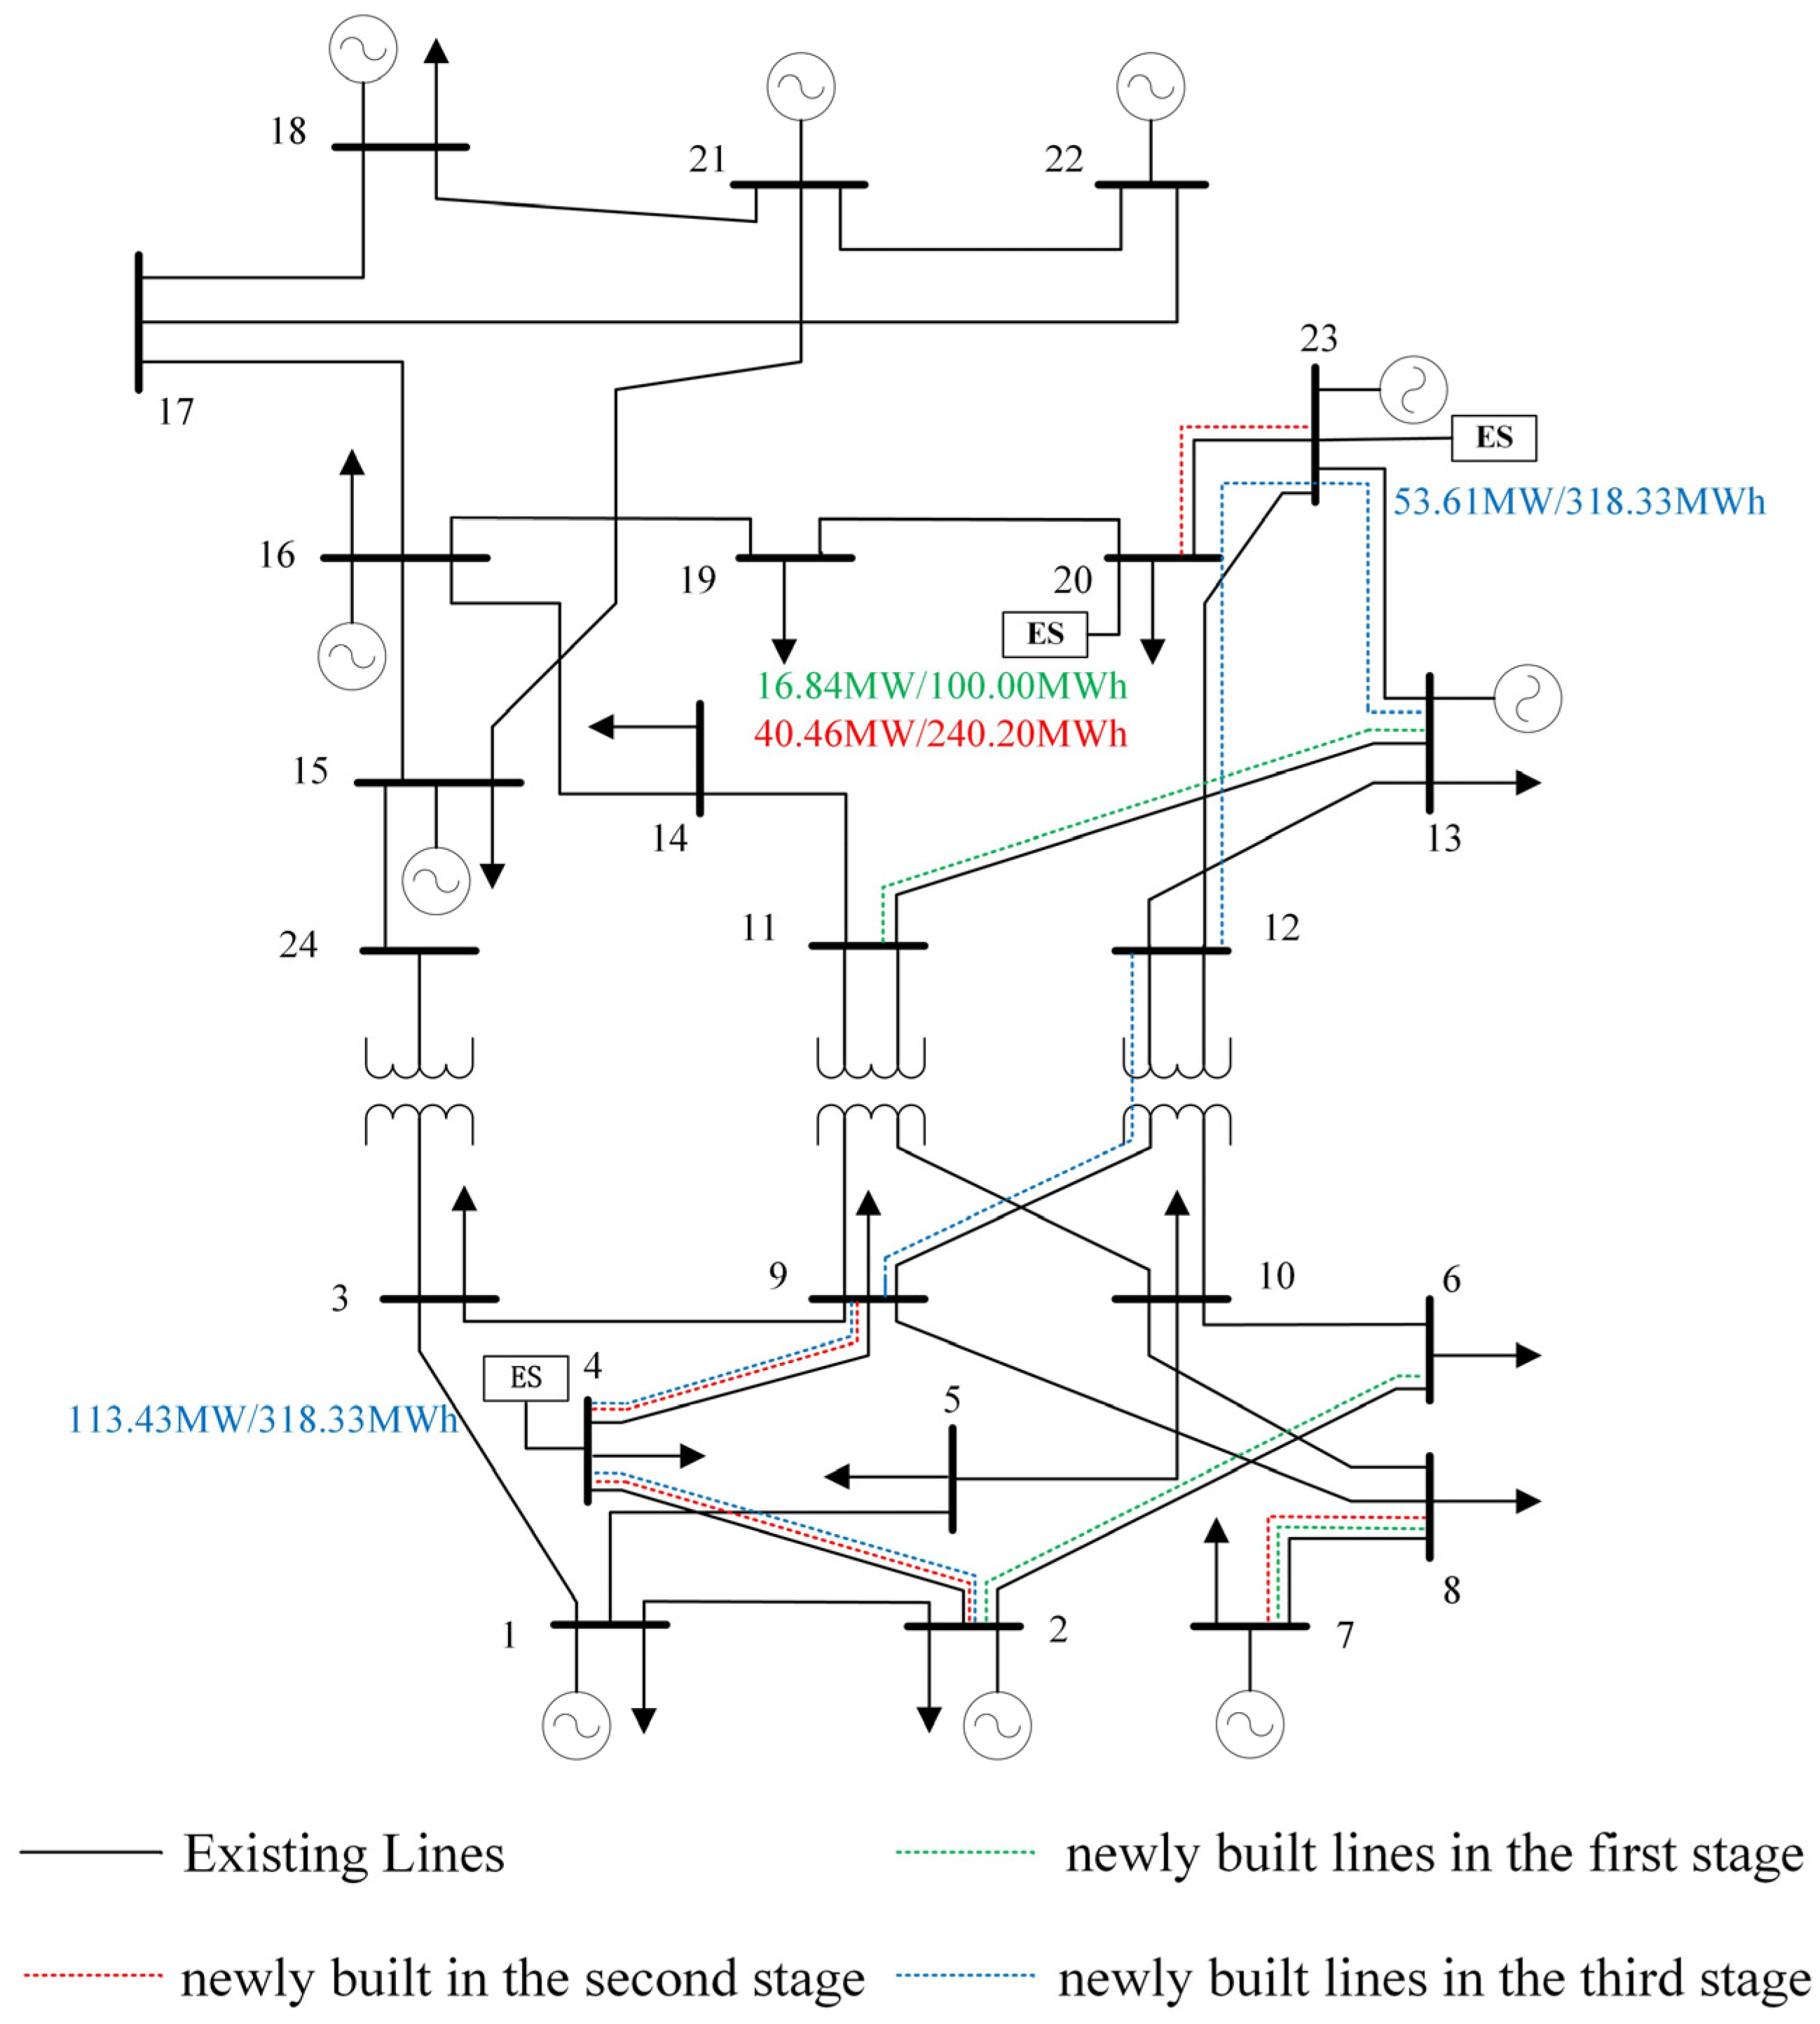
4.3. Actual Power Grid System in a Certain Region

4.3.1. Basic Data

In this section, the actual 23-node power system in a certain region of North China is selected for simulation and verification. This power system contains 27 transmission channels, with a maximum of 3 lines per transmission channel. The system connection diagram is shown in Figure 7, and the data for transmission line capacity, length, etc., as well as the data for power plants in the actual power system, are shown in the Appendix A.

4.3.2. Analysis of Planning Scheme

In this actual power grid system, node 23 is the grid connection node for wind power plants, and node 21 is the grid connection node for photovoltaic power stations. The grid connection scale for wind power plants and photovoltaic power stations is the same, with 1000 MW in the first stage, 1500 MW in the second stage, and 2500 MW in the third stage. Other parameters are the same as those in Section 4.3.1. When considering the single planning of transmission without considering the coordination between the transmission network and energy storage, the planning scheme and various costs are shown in Table 5. The temporal planning scheme for coordinated expansion planning of the transmission network and energy storage in the actual power system optimized under the given constraints is shown in Table 6.
From the data in Table 6, it can be seen that the nodes where energy storage is configured are mainly nodes 4 and 13. The addition of lines 14–15 is to meet the power plant dispatching needs at node 15, and the addition of lines 21–22 is to meet the new energy dispatching needs at node 22. The cost of solar curtailment in the three stages is 0, because the uncertainty of output of photovoltaic power stations is small, while due to the fluctuation and uncertainty of wind power output, the cost of wind curtailment is not zero. Furthermore, when the wind power plant grid-connected capacity reaches 3000 MW in the third stage, the cost of wind curtailment also reaches its maximum of 1.092 billion yuan.
The comparison of data between Table 5 and Table 6 shows that in this actual power system, the multi-stage coordinated expansion planning of the transmission network and energy storage greatly reduces the cost of wind curtailment and light compared to the single-stage multi-stage planning of the transmission alone. However, due to the fluctuation and uncertainty of wind power output, the cost of wind curtailment is still high. The cost of the transmission planning in the second stage in Table 6 is 0.08 billion less than that in Table 6, which is due to the replacement of the longer plan of lines 4–5 with the shorter plan of lines 14–15, demonstrating the synergistic effect between transmission expansion planning and energy storage configuration.

5. Conclusions

Considering that the installation of new energy and the demand for load are phased growths, and money has time value, in order to improve the absorption capacity of new energy, this paper arranges multiple points of energy storage devices on the side of the transmission network, focusing on solving the problems of forced curtailment caused by the volatility and randomness of new energy, as well as the problem of excessive investment caused by single-stage planning. Based on the theory of multiple scenarios, the cost of wind and solar curtailment is quantified directly, and a multi-stage coordinated expansion planning model for transmission network and energy storage considering the cost of wind and solar curtailment is established. The case study results show:
(1)
Compared with the single-stage planning of the transmission network, the multi-stage coordinated expansion planning of the transmission network and energy storage has better economy, saving about 7.79% of the total investment cost, and can accept more new energy. With the maturity of energy storage technology, its unit configuration cost will decrease, and the economic benefits of the multi-stage coordinated expansion planning of the transmission network and energy storage will be further enhanced.
(2)
The dynamic planning scheme has better economic benefits than the static planning scheme, with a total investment cost reduction of about 30%. The planning scheme of the transmission network and energy storage is also more reasonable, reducing the excessive investment of the power grid assets; the optimal configuration capacity of energy storage is sensitive to its unit cost; the less the transmission capacity of the system, the better the economic improvement effect of the multi-stage expansion coordinated expansion planning of the transmission network and energy storage compared with the single-stage planning of the transmission network.
(3)
The power capacity and energy capacity of energy storage in the coordinated expansion planning of the transmission network and energy storage are sensitive to its cost coefficient: the power capacity of energy storage increases with the decrease of its cost coefficient, and the role of delaying the upgrade of transmission lines and increasing the absorption of new energy is greater.
(4)
When the transmission capacity of the power system is reduced to 80% of its original level, the coordinated planning of transmission networks and energy storage saves approximately 9.85% in total investment costs compared to single transmission grid planning. This highlights that the economic benefits of deploying energy storage in-crease significantly in systems where grid capacity is more constrained.
However, this study still has some limitations. On the one hand, to simplify computational complexity, we employed the K-means clustering method to handle the uncertainty of renewable energy and load demands. Yet, this method of selecting typical days may overlook some low-probability but high-impact extreme scenarios, potentially limiting its application in future power systems with high proportions of renewable energy. On the other hand, the study only considers a single generic model for energy storage resources, whereas future grids may incorporate a variety of storage technologies such as hybrid storage, electrolytic hydrogen, dispatchable and load-shifting capabilities, and other generalized energy storage options.
By coordinating and optimizing various types of generalized energy storage resources, it is possible to further smooth out fluctuations in renewable energy generation, enhance the system’s capacity to integrate renewable energy, and improve overall economic efficiency. In the future, we aim to conduct further research addressing these two issues, with the goal of enhancing the power grid’s ability to accommodate renewable energy through multi-stage coordinated planning of transmission networks and energy storage resources, thereby advancing the progress of power systems towards low-carbon solutions.

Author Contributions

Conceptualization, Y.L., H.L. and Z.M.; Data curation, J.L. and M.Z.; Formal analysis, Y.L. and H.L.; Investigation, Y.L.; Methodology, Y.L., H.L., H.Z., Z.M. and J.L.; Resources, H.L. and J.L.; Software, H.Z. and J.L.; Supervision, J.L. and M.Z.; Validation, H.Z.; Visualization, M.Z. All authors have read and agreed to the published version of the manuscript.

Funding

This research was funded by Project “Research on key technologies of power grid integrated planning to enhance generalized adequacy” of State Grid Shanxi Electric Power Company Economic and Technological Research Institute, grant number 520533230006.

Institutional Review Board Statement

Not applicable.

Informed Consent Statement

Not applicable.

Data Availability Statement

The original contributions presented in the study are included in the article, further inquiries can be directed to the corresponding authors.

Conflicts of Interest

Authors Yan Liang, Hongli Liu and Jinxiong Liu were employed by the State Grid Shanxi Electric Power Company Economic and Technological Research Institute. The remaining authors declare that the research was conducted in the absence of any commercial or financial relationships that could be construed as a potential conflict of interest. The authors declare that this study received funding from the Economic and Technological Research Institute of State Grid Shanxi Electric Power Company.

Appendix A

Table A1. Transmission line data in the actual power system.
Transmission Line to Be SelectedFromToCapacity/MWLength/kmExisting NumberExpansion Capacity
112326.94.3222
223400.48.42422
326373.116.46722
4316633.57.44322
545373.110.92422
656373.18.93222
7520268.125.72322
867651.7922
9616373.10.71322
1089373.16.02522
11910629.38.54222
12916373.16.36722
13917603.47.99522
141011630.76.05722
151012651.714.42522
161314378.78.96622
171320378.715.21322
1814153220.50422
191416373.19.02222
2016174276.09922
2116201515.534.38913
2216231515.545.04813
231718373.15.95722
24171942716.62922
251721373.1433.93122
262021378.740.28522
27212268.615.24822
Table A2. Thermal power plant data in the actual power system.
Thermal Power Plant LocationMinimum Output (MW)Maximum Output (MW)Ramp Rate Limit
(MW/h)
728065065
115001222122.2
1230071071
1510021021
2020004331433.1
233001205120.5

Appendix B

Table A3. Definition of main symbols in this paper.
TypeSymbolDefinitionSI Unit
Indices t Index of time/
Y Index of year/
i Index of node/
j Index of node/
Sets N Y Set of planning years/
N P Set of candidate lines/
N e s s Set of candidate installation nodes for energy storage/
N w i n d Set of wind farms and solar plants/
N s o l a r Set of wind farms and solar plants/
N s Set of typical scenarios for load and variable energy output/
A y Node-branch incidence matrix for new lines in year y /
A o Node-branch incidence matrices for the initial lines/
A p Node-branch incidence matrices for the candidate lines/
Parameters c P Unit power capacity costCNY/MW
c E Unit energy capacity costCNY/MWh
c 0 Maintenance cost of the energy storageCNY/MW
σ Self-discharge rate of the energy storage station%
η c Charging efficiency of the energy storage station%
η d Discharging efficiency of the energy storage station%
Δ t Dispatch time intervalh
S O C m i n Lower percentage limits of the state of charge of the energy storage station%
S O C m a x Upper percentage limits of the state of charge of the energy storage station%
T Dispatch periodh
λ Annual discount rate%
f l i n e Transmission investment costCNY
f e s s Energy storage investment costCNY
f w i n d Wind curtailment penalty costCNY
f s o l a r Solar curtailment penalty costCNY
c i j Unit investment cost of the lineCNY/km
L i j Length of the linekm
α Energy storage cost coefficient%
d s Total number of days in scenario s days
c w i n d Unit penalty costs for wind curtailmentCNY/MWh
c s o l a r Unit penalty costs for solar curtailmentCNY/MWh
x n e s s m a x Maximum number of energy storage installations allowed by the system/
x l i n e , i j m a x Maximum number of new lines between nodes i and j /
n l i n e , i j o Number of initial lines/
n l i n e , i j m a x Number of candidate lines/
P i j m a x Maximum transmission power of a single line between nodes i and j MW
ω u , g Ramp-up rates of conventional generator g MW/h
ω d , g Ramp-down rates of conventional generator g MW/h
P g e n , g m a x Maximum output limits of conventional generator g MW
P g e n , g m i n Minimum output limits of conventional generator g MW
η e s s + Charging efficiency of the energy storage device%
η e s s Discharging efficiency of the energy storage device%
Variables P Planned charge/discharge powerMW
S Planned capacity of the energy storageMWh
e t Remaining energy at time t in the energy storage stationMWh
P c , t Charging power at time t in the energy storage stationMW
P d , t Discharging power at time t in the energy storage stationMW
v c , t Charging states of the energy storage station/
v d , t Discharging states of the energy storage station/
R Y Present value factor corresponding to the year Y CNY
x l i n e , i j , Y p Binary variable for constructing the new line p on branch i j in year Y /
x e s s , i , Y Binary variable indicating whether energy storage is constructed at node i in year Y /
P e s s , i , Y Power capacity of the energy storage constructed at node i in year Y MW
E e s s , i , Y Energy capacity of the energy storage constructed at node i in year Y MWh
P w i n d , j , t , s , Y f Forecasted output power of wind farm j during period t in scenario s for year Y MW
P w i n d , j , t , s , Y Actual output power of wind farm j during period t in scenario s or year Y MW
P s o l a r , k , t , s , Y f Forecasted output power of solar power plant k during period t in scenario s for year Y MW
P s o l a r , k , t , s , Y Actual output power of solar power plant k during period t in scenario s for year Y MW
n l i n e , i j y Number of new transmission lines in year y /
P b , t , s , Y o Active power vectors for initial lines in scenario s during period t of year Y MW
P b , t , s , Y p Active power vectors for candidate lines in scenario s during period t of year Y MW
P b , t , s , Y y Active power vector for new lines in year y during scenario s of period t MW
P g e n , t , s , Y Active power output vectors of thermal plants in scenario s during period t of year Y MW
P w i n d , t , s , Y Active power output vectors of wind farms in scenario s during period t of year Y MW
P s o l a r , t , s , Y Active power output vectors of solar power stations in scenario s during pe-riod t of year Y MW
P e s s , t , s , Y Charging and discharging power vector for new energy storage in scenario s during period t of year Y MW
P l , t , s , Y Load vector at each node in scenario s during period t of year Y MW
b i j Susceptance of a single line between nodes i and j s
P i j , t , s , Y o Total active power flow through the initial branch i j in scenario s during period t of year Y MW
P i j , t , s , Y y Total active power flow through new branches in scenario s during period t of year Y MW
P i j , t , s , Y p Active power flow through the new transmission line in scenario s during period t of year Y MW
θ i , t , s , Y Angles at nodes i in scenario s during period t of year Y rad
θ j , t , s , Y Angles at nodes j in scenario s during period t of year Y rad
θ r e f , t , s , Y Angles at reference node r e f in scenario s during period t of year Y rad
P g e n , g , t , s , Y Active power output of conventional generator g in scenario s during period t of year Y MW
P c , i , t , s , Y Charging power of the energy storage device at node i in scenario s during period t of year Y MW
P d , i , t , s , Y Discharging power of the energy storage device at node i in scenario s during period t of year Y MW
e i , t , s , Y Capacity of the energy storage device at node i in scenario s during period t of year Y MWh
v c , i , t , s , Y Charging status of the energy storage device at node i in scenario s during period t of year Y /
v d , i , t , s , Y Discharging status of the energy storage device at node i in scenario s during period t of year Y /

References

  1. Wu, Z.; Chen, Z.; Wang, C.; Zhou, M.; Wang, J.; Chen, L. Unlocking the potential of rooftop solar panels: An incentive rate structure design. Energy Policy 2024, 190, 114159. [Google Scholar] [CrossRef]
  2. Chen, X.; Liu, Y.; Wang, Q.; Lv, J.; Wen, J.; Chen, X.; Kang, C.; Cheng, S.; McElroy, M.B. Pathway toward carbon-neutral electrical systems in China by mid-century with negative CO2 abatement costs informed by high-resolution modeling. Joule 2021, 5, 2715–2741. [Google Scholar] [CrossRef]
  3. Council, T.S. Notice of The State Council on Issuing an Action Plan for Carbon Peaking before 2030. Available online: https://www.gov.cn/zhengce/zhengceku/2021-10/26/content_5644984.htm (accessed on 26 October 2021).
  4. Administration, N.E. National Energy Administration Released Statistics on the National Power Industry in 2023. Available online: https://www.nea.gov.cn/2024-01/26/c_1310762246.htm (accessed on 26 January 2024).
  5. Wu, Z.; Wang, J.; Zhong, H.; Gao, F.; Pu, T.; Tan, C.W.; Chen, X.; Li, G.; Zhao, H.; Zhou, M.; et al. Sharing Economy in Local Energy Markets. J. Mod. Power Syst. Clean Energy 2023, 11, 714–726. [Google Scholar] [CrossRef]
  6. Borasio, M.; Moret, S. Deep decarbonisation of regional energy systems: A novel modelling approach and its application to the Italian energy transition. Renew. Sustain. Energy Rev. 2022, 153, 111730. [Google Scholar] [CrossRef]
  7. Chang, X.; Wu, Z.; Wang, J.; Zhang, X.; Zhou, M.; Yu, T.; Wang, Y. The coupling effect of carbon emission trading and tradable green certificates under electricity marketization in China. Renew. Sustain. Energy Rev. 2023, 187, 113750. [Google Scholar] [CrossRef]
  8. Alshamrani, A.M.; El-Meligy, M.A.; Sharaf, M.A.F.; Saif, W.A.M.; Awwad, E.M. Transmission Expansion Planning Considering a High Share of Wind Power to Maximize Available Transfer Capability. IEEE Access 2023, 11, 23136–23145. [Google Scholar] [CrossRef]
  9. Chen, Y.; Song, Z.; Hou, Y. Climate-Adaptive Transmission Network Expansion Planning Considering Evolutions of Resources. IEEE Trans. Ind. Inform. 2024, 20, 2063–2078. [Google Scholar] [CrossRef]
  10. El-Meligy, M.A.; El-Sherbeeny, A.M.; Mahmoud, H.A. Market Power-Constrained Transmission Expansion Planning Using Bi-Level Optimization. J. Electr. Eng. Technol. 2024, 19, 113–124. [Google Scholar] [CrossRef]
  11. Hu, J.; Xu, X.; Ma, H.; Yan, Z. Distributionally Robust Co-optimization of Transmission Network Expansion Planning and Penetration Level of Renewable Generation. J. Mod. Power Syst. Clean Energy 2022, 10, 577–587. [Google Scholar] [CrossRef]
  12. Niu, W.; Ge, Y.; Pan, D.; Ma, L.; Gao, C.; Nan, K. Transmission Expansion Planning Considering the Integration of Renewable Energy in the Market Environment. In Proceedings of the 2021 IEEE Sustainable Power and Energy Conference (iSPEC), Nanjing, China, 23–25 December 2021; pp. 1862–1867. [Google Scholar]
  13. Baharvandi, S.; Maghouli, P. Risk-constrained expansion planning of wind integrated networks using innovative MPEC primal-dual formulation for directly involving price-based demand response in MILP problem. J. Eng. 2023, 2023, e12314. [Google Scholar] [CrossRef]
  14. Dehghan, S.; Amjady, N.; Conejo, A.J. A Multistage Robust Transmission Expansion Planning Model Based on Mixed Binary Linear Decision Rules—Part I. IEEE Trans. Power Syst. 2018, 33, 5341–5350. [Google Scholar] [CrossRef]
  15. Dehghan, S.; Amjady, N.; Conejo, A.J. A Multistage Robust Transmission Expansion Planning Model Based on Mixed-Binary Linear Decision Rules—Part II. IEEE Trans. Power Syst. 2018, 33, 5351–5364. [Google Scholar] [CrossRef]
  16. Liu, J.; He, D.; Wei, Q.; Yan, S. Energy Storage Coordination in Energy Internet Based on Multi-Agent Particle Swarm Optimization. Appl. Sci. 2018, 8, 1520. [Google Scholar] [CrossRef]
  17. Ansari, M.R.; Pirouzi, S.; Kazemi, M.; Naderipour, A.; Benbouzid, M. Renewable Generation and Transmission Expansion Planning Coordination with Energy Storage System: A Flexibility Point of View. Appl. Sci. 2021, 11, 3303. [Google Scholar] [CrossRef]
  18. Barbar, M.; Mallapragada, D.S.; Stoner, R. Decision making under uncertainty for deploying battery storage as a non-wire alternative in distribution networks. Energy Strategy Rev. 2022, 41, 100862. [Google Scholar] [CrossRef]
  19. Gil, H.A.; Joos, G. On the Quantification of the Network Capacity Deferral Value of Distributed Generation. IEEE Trans. Power Syst. 2006, 21, 1592–1599. [Google Scholar] [CrossRef]
  20. Mazaheri, H.; Abbaspour, A.; Fotuhi-Firuzabad, M.; Moeini-Aghtaie, M.; Farzin, H.; Wang, F.; Dehghanian, P. An online method for MILP co-planning model of large-scale transmission expansion planning and energy storage systems considering N-1 criterion. IET Gener. Transm. Distrib. 2021, 15, 664–677. [Google Scholar] [CrossRef]
  21. Conejo, A.J.; Cheng, Y.; Zhang, N.; Kang, C. Long-term coordination of transmission and storage to integrate wind power. CSEE J. Power Energy Syst. 2017, 3, 36–43. [Google Scholar] [CrossRef]
  22. Dehghan, S.; Amjady, N. Robust Transmission and Energy Storage Expansion Planning in Wind Farm-Integrated Power Systems Considering Transmission Switching. IEEE Trans. Sustain. Energy 2016, 7, 765–774. [Google Scholar] [CrossRef]
  23. Li, Z. Research on Architecture Planning and Optimal Configuration Method of Distributed Energy Storage System in Low Voltage Distribution Network. Master’s Thesis, South China University of Technology, Guangzhou, China, 2021. [Google Scholar]
  24. Balducci, P.J.; Alam, M.J.E.; Hardy, T.D.; Wu, D. Assigning value to energy storage systems at multiple points in an electrical grid. Energy Environ. Sci. 2018, 11, 1926–1944. [Google Scholar] [CrossRef]
  25. Zhang, L.; Li, F. Energy Bus-Based Matrix Modeling and Optimal Scheduling for Integrated Energy Systems. Appl. Sci. 2024, 14, 4297. [Google Scholar] [CrossRef]
  26. Latorre, G.; Cruz, R.D.; Areiza, J.M.; Villegas, A. Classification of publications and models on transmission expansion planning. IEEE Trans. Power Syst. 2003, 18, 938–946. [Google Scholar] [CrossRef]
  27. Li, Z.; Wu, W.; Zhang, B.; Wang, B. Decentralized Multi-Area Dynamic Economic Dispatch Using Modified Generalized Benders Decomposition. IEEE Trans. Power Syst. 2016, 31, 526–538. [Google Scholar] [CrossRef]
  28. Ji, S.; Su, D.; Song, Q.; Li, Y.; Dong, P.; Wang, Y. Multi-stage planning of integrated energy systems considering external carbon trading. In Proceedings of the 2022 2nd International Conference on Electrical Engineering and Control Science (IC2ECS), Nanjing, China, 16–18 December 2022; pp. 293–297. [Google Scholar]
  29. Du, E.; Zhang, N.; Kang, C.; Xia, Q. A High-Efficiency Network-Constrained Clustered Unit Commitment Model for Power System Planning Studies. IEEE Trans. Power Syst. 2019, 34, 2498–2508. [Google Scholar] [CrossRef]
  30. Jiang, H.; Du, E.; Zhang, N.; Zhuo, Z.; Wang, P.; Wang, Z.; Zhang, Y. Renewable Electric Energy System Planning Considering Seasonal Electricity Imbalance Risk. IEEE Trans. Power Syst. 2023, 38, 5432–5444. [Google Scholar] [CrossRef]
  31. Huang, Y. Joint Planning of Energy Storage and Transmission Network with Significant Wind Power Penetration. Master’s Thesis, North China Electric Power University, Beijing, China, 2018. [Google Scholar]
Figure 1. Schematic diagram of energy storage delaying transmission line upgrades.
Applsci 14 06486 g001
Figure 2. Schematic diagram of multi-stage coordinated expansion planning for the transmission network and energy storage.
Applsci 14 06486 g002
Figure 3. Typical scenarios of wind power, photovoltaic output, and load demand in the IEEE RTS-24 system.
Applsci 14 06486 g003
Figure 4. Planning scheme of transmission network and energy storage in different stages.
Applsci 14 06486 g004
Figure 5. Impact of energy storage cost on energy storage configuration results.
Applsci 14 06486 g005
Figure 6. Impact of energy storage cost on transmission construction and wind and solar curtailment.
Applsci 14 06486 g006
Figure 7. Simplified topology of the actual 23-Bus power system.
Applsci 14 06486 g007
Table 1. Single-step static coordination planning scheme of the transmission network and energy storage and associated costs.
StageTransmission Line Planning Scheme: Corridor (Number of New Lines)Energy Storage Planning Scheme: Node (MW/MWh)Transmission Line Investment Cost (×108 CNY)Energy Storage Investment Cost (×108 CNY))Wind Curtailment Cost (×108 CNY)Solar Curtailment Cost (×108 CNY)
12–4(2), 2–6(1),
4–9(2), 7–8(2),
11–13(1), 12–23(2),
20–23(1),
4(119.01/614.92),
12(58.91/248.19),
13(63.76/264.80),
20(112.80/527.72),
23(76.11/361.53)
21.475.3800
2----0.890
3----3.410.13
Total Cost (Present Value)21.475.384.300.13
Table 2. Single multi-stage transmission expansion planning and associated costs.
StageTransmission Line Planning Scheme:
Corridor (Number of New Lines)
Transmission Line
Investment Cost (×108 CNY)
Wind Curtailment Cost (×108 CNY)Solar Curtailment Cost (×108 CNY)
12–6(1), 7–8(1), 11–13(1)1.321.640.02
22–4(1), 4–9(1), 7–8(1), 20–23(1)0.882.570.03
32–4(1), 4–9(1), 10–12(1), 12–23(1), 13–23(1),
16–19(1), 19–20(1)
2.8013.690.69
Total Cost (Present Value)4.9917.890.74
Table 3. Multi-stage coordinated expansion planning scheme for transmission network and energy storage, and associated costs.
StageTransmission Line Planning Scheme: Corridor (Number of New Lines)Energy Storage Planning Scheme: Node (MW/MWh)Transmission Line Investment Cost (×108 CNY)Energy Storage Investment Cost (×108 CNY)Wind Curtailment Cost (×108 CNY)Solar Curtailment Cost (×108 CNY)
12–6(1), 7–8(1), 11–13(1)20(16.84/100.0)1.320.881.380.01
22–4(1), 4–9(1), 7–8(1),
20–23(1)
20(40.46/240.20)0.881.601.520
32–4(1), 4–9(1), 9–12(1),
12–23(1), 13–23(1)
4(113.43/808.17)
Total Cost (Present Value)4.467.0910.090.14
Table 4. Comparison of Case 2 and Case 3 planning scenarios and costs for different transmission capacities.
Transmission Capacity0.90.8
Case 2Case 3Case 2Case 3
Stage 1Transmission Line Planning Scheme: Corridor (Number of New Lines)10(1), 11(1),
17(1), 18(1), 21(1)
5(1), 11(1),
17(1), 18(1),
33(1)
5(1), 11(1),
15(1), 17(1),
18(1), 21(1), 33(1)
5(1), 11(1),
15(1), 17(1),
18(1), 21(1), 33(1)
Energy Storage Planning Scheme: Node (MW/MWh)-4(60.44/361.96)-4(18.25/108.37)
Transmission Line Investment Cost (×108 CNY)2.822.123.963.96
Energy Storage Investment Cost (×108 CNY))-3.17-0.96
Wind and Solar Curtailment Cost (×108 CNY)1.650.911.671.37
Stage 2Transmission Line Planning Scheme: Corridor (Number of New Lines)4(1), 8(1),
33(1)
4(1), 8(1),
21(1)
4(1), 8(1),
10(1), 11(1),
22(1)
4(1), 8(1),
22(1)
Energy Storage Planning Scheme: Node (MW/MWh)-0-4(43.98/261.15)
6(14.04/100)
Transmission Line Investment Cost (×108 CNY)0.741.601.751.49
Energy Storage Investment Cost (×108 CNY))-0-2.32
Wind and Solar Curtailment Cost (×108 CNY)2.591.492.601.31
Stage 3Transmission Line Planning Scheme: Corridor (Number of New Lines)4(1), 5(1),
8(1), 15(1),
21(1), 22(1)
4(1), 5(1),
15(1), 21(1),
22(1)
4(1), 6(1),
8(1), 9(1),
17(1), 21(1),
22(1)
4(1), 8(1),
17(1), 21(1),
22(1)
Energy Storage Planning Scheme: Node (MW/MWh)-2(15.18/108.18)
4(120.0/855.0)
-2(14.04/100.0)
4(120/826.10)
6(14.03/100.0)
Transmission Line Investment Cost (×108 CNY)2.572.262.602.26
Energy Storage Investment Cost (×108 CNY))-3.78-4.11
Wind and Solar Curtailment Cost (×108 CNY)13.828.0013.917.85
Total Cost (×108 CNY)25.3823.3528.4325.63
Table 5. Single multi-stage transmission expansion planning and associated costs in the actual power system.
StageTransmission Line Planning Scheme: Corridor (Number of New Lines)Transmission Line Investment Cost (×108 CNY)Wind Curtailment Cost (×108 CNY)Solar Curtailment Cost (×108 CNY)
14–5(1), 21–22(1)0.262.580
24–5(1)0.093.540.02
313–14(1), 13–20(1), 14–16(1)0.3016.210.07
Total Cost (Present Value)0.6522.320.09
Table 6. Multi-stage coordinated expansion planning scheme for transmission network and energy storage, and associated costs in the actual power system.
StageTransmission Line
Planning Scheme:
Corridor (Number of New Lines)
Energy Storage
Planning Scheme: Node (MW/MWh)
Transmission Line Investment Cost (×108 CNY)Energy Storage Investment Cost (×108 CNY)Wind
Curtailment Cost (×108 CNY)
Solar
Curtailment Cost (×108 CNY)
14–5(1), 21–22(1)13(67.71/482.44)0.263.711.630
214–15(1)4(20.70/108.95)
13(40.84/291.01)
0.012.491.500
313–14(1), 13–20(1),
14–16(1)
13(33.57/239.20)0.300.9410.920
Total Cost (Present Value)0.577.1414.040
Disclaimer/Publisher’s Note: The statements, opinions and data contained in all publications are solely those of the individual author(s) and contributor(s) and not of MDPI and/or the editor(s). MDPI and/or the editor(s) disclaim responsibility for any injury to people or property resulting from any ideas, methods, instructions or products referred to in the content.

