Abstract
Owing to the challenging working conditions aboard ships, equipment may develop various defects that traditional nondestructive testing methods cannot fully detect. This study proposes a combined approach using pulsed eddy current and electromagnetic ultrasonic testing for enhanced probe detection. Utilizing COMSOL 6.2 finite-element software, a two-dimensional model of the probe was developed to optimize the probe’s design. Based on these findings, a composite probe was designed and structurally optimized, resulting in improved energy conversion efficiency. An experimental platform was established to evaluate the detection capabilities of the composite detection probes. The results indicate that the composite detection probe, as designed and optimized in this study, is effective in testing materials with various artificial defects and enhances the detection of near-surface defects in materials.
1. Introduction
Seawater is a potent medium for corrosion owing to its high salt concentration. Notably, ships spend the majority of their time at sea, where they are continuously exposed to corrosive conditions. Marine propulsion support systems, generator support systems, and auxiliary systems contain numerous metal components critical to ship operations. For example, seawater pipelines are essential for cooling main and auxiliary machines, firefighting, ballasting, and cleaning operations. These components play a crucial role in the stable operation of marine power plants and the normal functioning of auxiliary machinery and other equipment. The combination of humid, high-temperature environments on ships frequently leads to corrosion-related issues.
The most common corrosion conditions can be divided into four types: contact corrosion, electrochemical corrosion, stress corrosion, and cavitation corrosion. Contact corrosion occurs when two different metals are present in a seawater pipeline. The interaction of these metals in the seawater electrolyte leads to electromagnetic corrosion, resulting in electrochemical corrosion. Impact corrosion refers to the electrochemical corrosion of the metal surface of seawater pipelines. Stress corrosion refers to damage to the metal in seawater pipelines under the combined effects of seawater and tensile stress, making cracks more likely to occur and posing a threat to ships. Cavitation corrosion refers to the formation of internal bubbles in a state of fluid turbulence, which then collapse under high internal pressure, leading to an impact on surrounding metal pipelines. This, combined with other forms of corrosion, results in deformation and damage in seawater pipelines. It is a comprehensive type of corrosion where mechanical failure is the primary condition, supported by other corrosion factors [1].
Corrosion of metal components can cause significant disruptions to onboard life and, in severe cases, compromise the safety of the crew and the structural integrity of the ship. An analysis by a British company identified that corrosion accounts for 33% of equipment failures within ships [1]. Utilizing portable metal damage detection equipment allows the crew to regularly inspect crucial equipment, prevent failures, reduce maintenance times, and ensure smooth operation of the ship’s systems.
Most current metal damage detection tools employ nondestructive testing technologies. These methods enable the identification of surface or internal defects in materials without compromising their integrity or functionality. Nondestructive testing technologies operate by detecting variations in physical characteristics such as heat, sound, light, and electricity, which reflect changes in the material’s structure [2]. Common nondestructive testing techniques include eddy current testing, X-ray testing, magnetic flux leakage testing, magnetic particle testing, piezoelectric ultrasonic testing, and electromagnetic ultrasonic testing [3].
In the 1950s, Waidelich et al. conducted theoretical and experimental studies on the use of pulsed eddy current measurements to determine the thickness of metal protective coatings in nuclear reactors [4]. Their research established a correlation between the zero-crossing point, the lift-off point, and the thickness of the tested part, where the amplitude of the lift-off point could indicate the thickness of the protective layer. The pioneering work of Waidelich et al. laid a foundational basis for further exploration into pulsed eddy current detection technology. Yu et al. designed a transverse pulsed eddy current probe to detect circumferential cracks in heat exchanger pipes [5]. Sun proposed a quantitative detection method for natural fatigue cracks in aviation aluminum alloy based on pulse eddy current technology and a neural network algorithm, achieving high accuracy [6]. Yang et al. studied the effect of coil placement on pulsed eddy current detection [7]. Ge et al. proposed a spiral pulsed eddy current array probe to detect and classify defects on the inner and outer walls of non-ferromagnetic pipelines [8]. Zhang introduced a near-field method based on pulse eddy current testing for detecting local defects in ferromagnetic metal casings [9]. Xie et al. utilized frequency-selective pulsed eddy current detection (FSPECT) to determine the defect parameters of deep-shallow compound defects (DSCD) and introduced a component separation strategy [10]. However, due to the skin effect, pulsed eddy current detection is concentrated on the surface of the specimen, restricting its use to detecting surface defects only.
Research into electromagnetic ultrasonic testing technology began to gain prominence in the 1970s. Notably, in 1967, Abeles et al. observed the generation of electromagnetic ultrasound in metals under various experimental conditions. They described the excitation process of p-waves by electromagnetic ultrasound in metals, highlighting that the intensity of the sound wave is proportional to the magnetic field intensity. They also derived a formula expressing the fraction of electromagnetic power converted into acoustic power [11]. Kawashima subsequently proposed an analytical expression for the steady-state sound field generated by electromagnetic ultrasound, derived through calculations of magnetic vector potential. He further analyzed the impact of the coil size, the number of turns, and other parameters on the transducer’s performance [11]. Zhou conducted research on defect detection in aluminum plates using electromagnetic acoustic transducers and achieved good detection results [12]. Cong et al. proposed the use of the electromagnetic ultrasonic testing method to detect surface damages on antenna wheels, demonstrating the advantages of the electromagnetic ultrasonic method in locating, quantifying, and qualitatively analyzing surface defects on antenna wheels [13]. Sun et al. employed a hybrid high-order Shear Horizontal (SH) wave electromagnetic ultrasonic transducer (EMAT) guided wave testing technique. They introduced relative energy coefficients and relative order coefficients of guided waves to accurately quantify the depth and normal displacement of hidden defects in the rail web [14]. Based on the findings of the current research, the use of electromagnetic ultrasonic testing mainly focuses on characterizing the defect depth.
However, each nondestructive testing method has inherent limitations, particularly when attempting to detect objects with complex defects using a single technique [15]. The pulsed eddy current detection is affected by the skin effect, and the eddy current is only concentrated on the surface of the sample, making it challenging to detect deep defects. Electromagnetic ultrasonic detection is more accurate for deep-seated defects, while near-surface defects cannot be detected due to echo overlap. In the 1970s, Renken and Selner proposed the combined application of pulsed eddy current detection and ultrasonic methods to inspect metal pipelines, considering the shared principles of pulsed eddy current and electromagnetic ultrasonic testing, as well as the similarities in probe structure [16]. Similarly, Willems et al. proposed integrating electromagnetic ultrasound, eddy current, and magnetic flux leakage detection technologies to enhance pipeline health monitoring. Electromagnetic ultrasound is primarily used for measuring pipeline thickness, while eddy current and magnetic flux leakage testing techniques focus on the inspection of the inner surfaces of pipes [17]. Wang proposed a hybrid online monitoring method combining eddy current testing and electromagnetic acoustic transducer techniques for comprehensive defect inspection in high-temperature environments [18]. Xie et al. introduced a pulsed eddy current and electromagnetic ultrasonic combined nondestructive testing method for detecting both surface and internal defects [19]. Liu et al. studied the electromagnetic ultrasonic/eddy current composite detection technology for defects in metallic materials. Through the design of composite probes, combined with electromagnetic ultrasonic and eddy current testing methods, it is possible to detect internal and surface defects in metal materials [20]. Therefore, both pulsed eddy current and electromagnetic ultrasonic methods can be used to detect surface and subsurface defects simultaneously.
Therefore, this paper presents the design of a combined probe for detecting defects in metal pipelines submerged in seawater, utilizing pulsed eddy current and electromagnetic ultrasonic technologies. A system layer composite method is adopted to obtain independent eddy current signals and electromagnetic ultrasonic signals by applying high-frequency and low-frequency excitation signals, respectively, to the same detector, using an excitation source. By analyzing the two signals, near-surface and deep-layer defect information can be obtained, and the two separate detection methods can complement each other.
It is worth noting that the energy conversion efficiency peaks when the excitation frequency aligns with the natural frequency of the EMAT. At this specific frequency, the coil achieves a higher signal-to-noise ratio, thus enhancing detection performance. The choice of excitation frequency should consider the physical properties of the tested object and the operating environment of the EMAT. This study examines the influence of various factors on the energy conversion efficiency of the composite detection probe, aiming to optimize the probe design and determine the most suitable structural design for detecting flaws in ship metals. The experimental results indicate that the probe can comprehensively detect corrosion thinning defects in the target.
2. Pulsed Eddy Current and Electromagnetic Ultrasonic Testing
2.1. Principles of Pulsed Eddy Current Testing
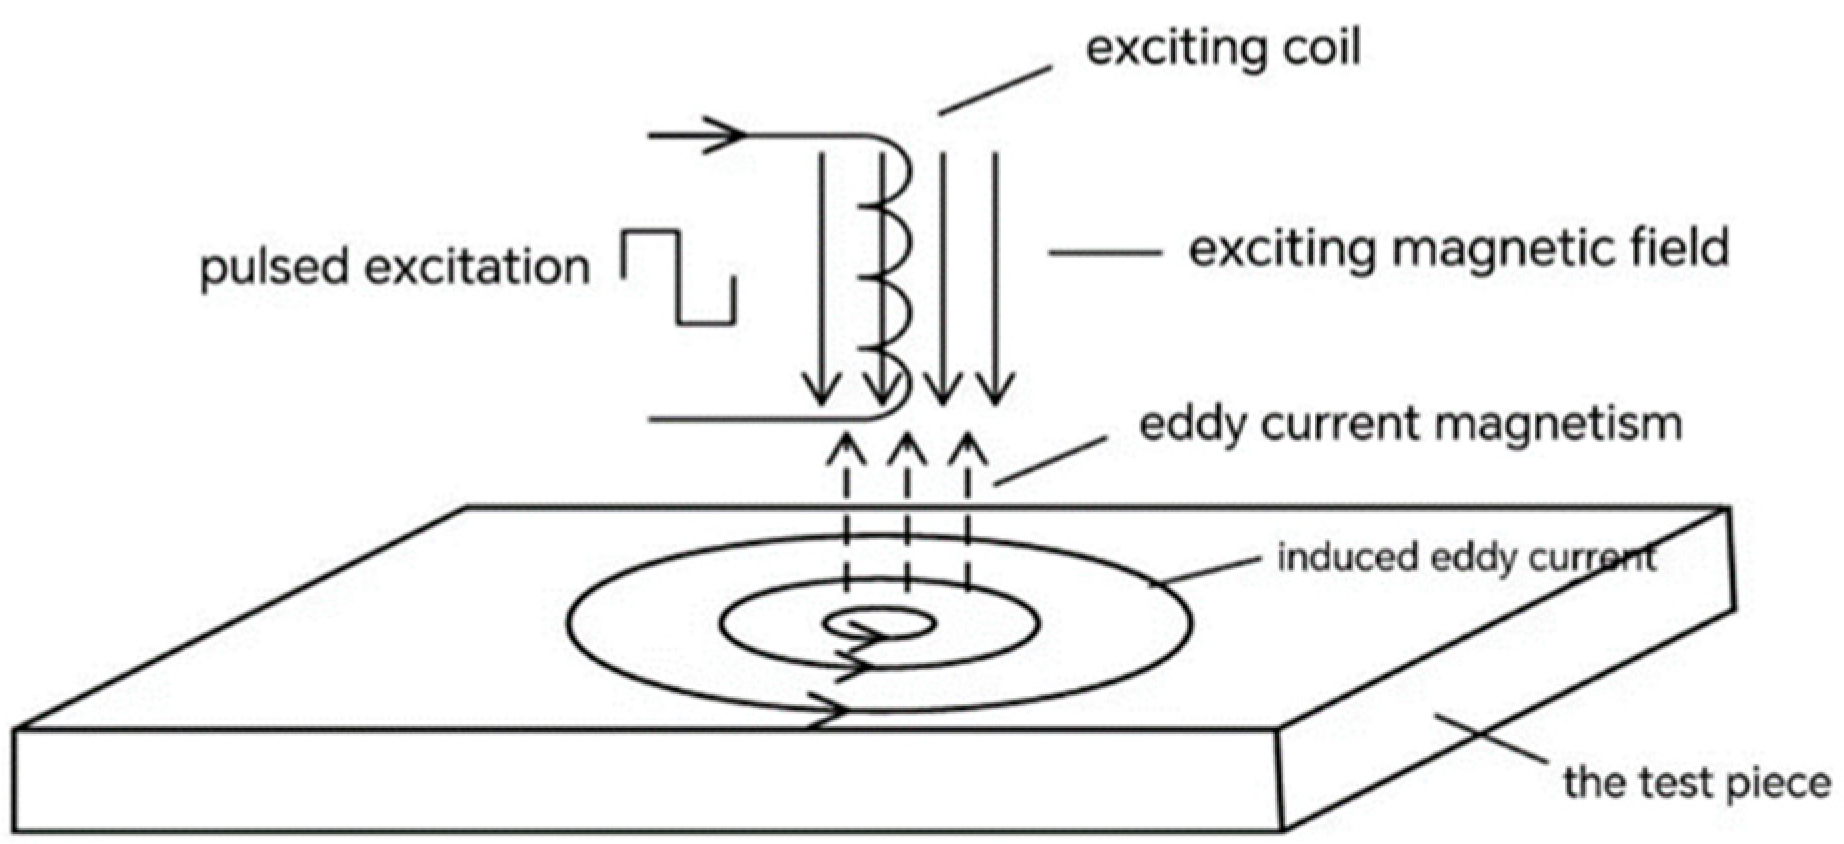
The principle of pulsed eddy current detection [12], as depicted in Figure 1, involves applying pulse excitation to an excitation coil positioned on the surface of the test piece. This excitation generates an alternating magnetic field at the middle of the coil, which, in turn, induces eddy currents on the surface of the test piece. The eddy currents create an induced magnetic field that counteracts changes in the original alternating magnetic field, affecting parameters such as the voltage or impedance in the detection coil. When a defect affects the distribution of these induced eddy currents, it alters the test coil’s parameters differently compared to an intact area. Thus, defect characteristics can be determined based on these variations. This technique is primarily effective for identifying surface and near-surface defects.
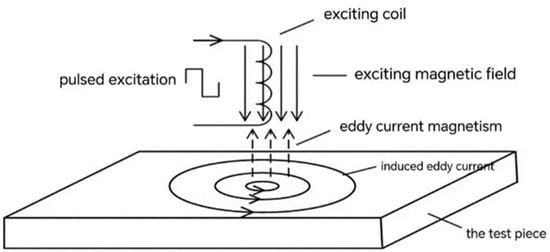
Figure 1.
Schematic of pulsed eddy current detection.
The voltage change at the test coil can be expressed as follows:
where N is the number of coil turns, , is the excitation signal frequency, and ΔB and ΔA represent the variations in magnetic induction intensity and magnetic vector potential, respectively. The symbol represents the plane area surrounded by the coil turns, and represents the coil turns. This equation reveals that the voltage change is directly proportional to the number of coil turns and the frequency of the excitation signal. Pulsed eddy current testing exhibits a phenomenon known as the skin effect, where the distribution of induced eddy currents is uneven and decays rapidly with depth. The expression for the skin depth of a pulse square wave is as follows:
where is the material permeability, is the electrical conductivity, is the pulse square wave duty ratio, and represents the pulse period. Typically, three times the calculated skin depth is considered the effective maximum depth for detecting defects using this method. As the frequency of the excitation signal increases, the maximum depth of detection decreases, rendering pulsed eddy current testing less effective for identifying deep defects within materials.
2.2. Principles of Electromagnetic Ultrasonic Testing
An electromagnetic ultrasonic transducer, a key component of electromagnetic ultrasonic testing technology, represents a nondestructive testing method that uses electromagnetic effects to excite and capture ultrasonic waves. The transducer comprises three main components: a coil that receives high-frequency excitation, a biased magnetic field emanating from the test piece, and a magnet. Depending on the coil structures and magnetic field orientations, the electromagnetic ultrasonic transducer can produce various types of ultrasonic waves, making it versatile for different applications. Transducers that generate ultrasonic body waves are predominantly used for measuring material thickness and are particularly effective in detecting corrosion, thinning defects, and internal flaws within materials.
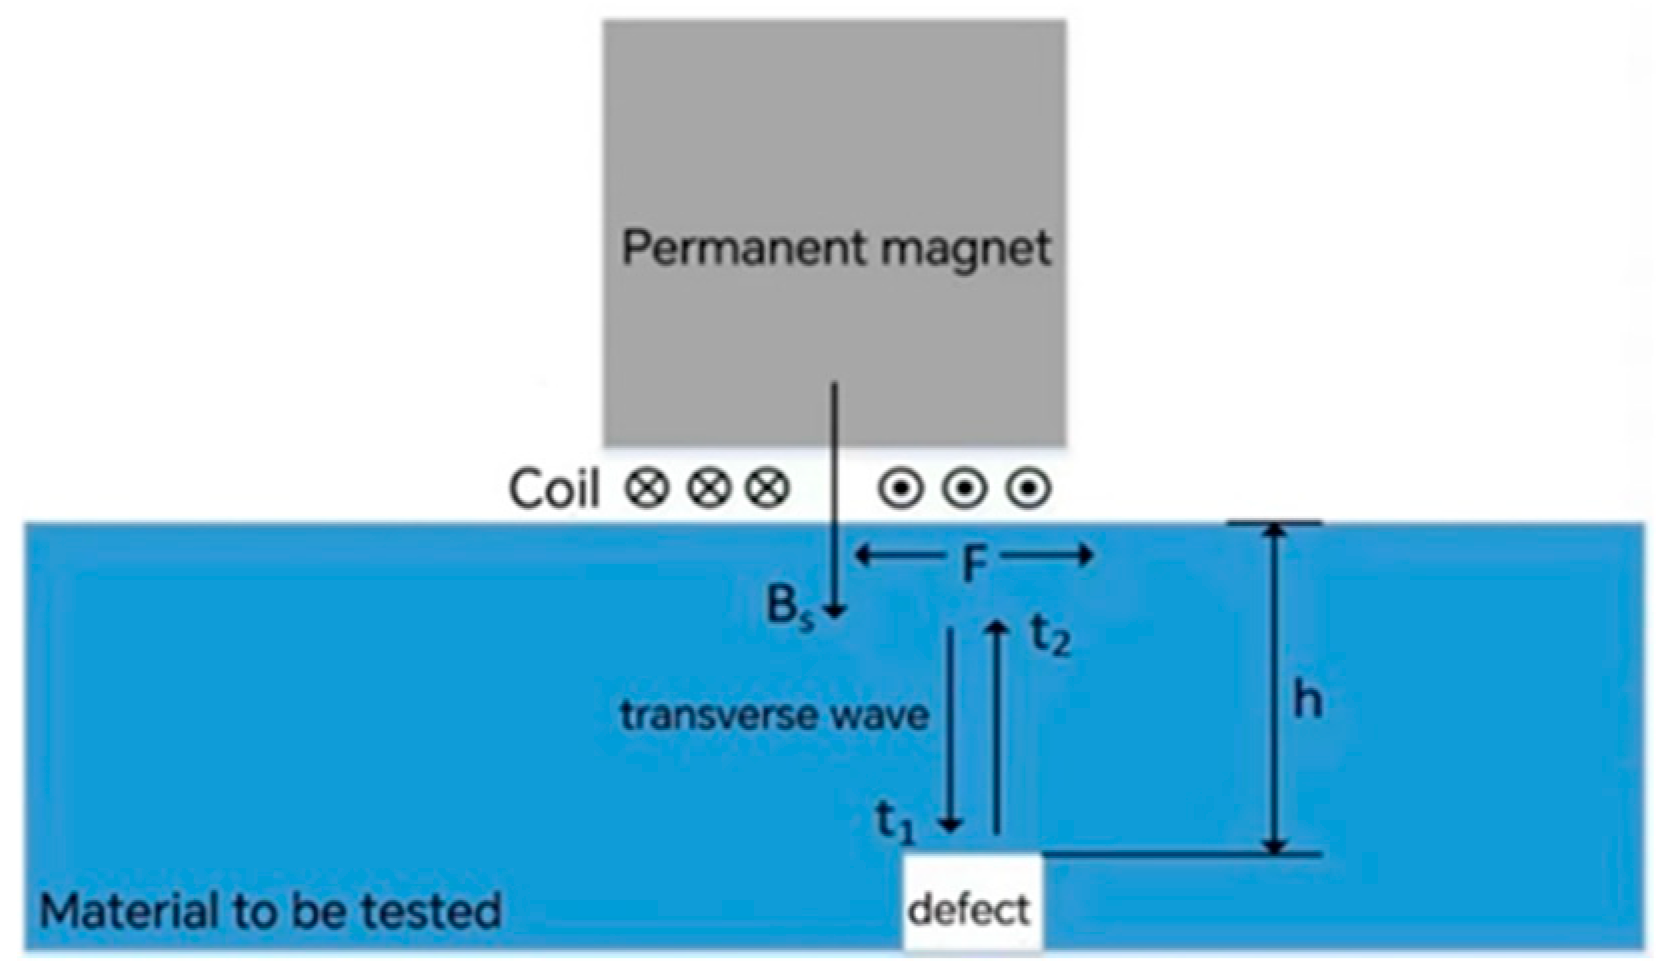
Ultrasonic body waves are categorized into shear waves and longitudinal waves. Typically, the velocity of ultrasonic shear waves is half that of longitudinal waves in solids, resulting in a higher time resolution in shear wave detection. This study, therefore, employs a combined approach using ultrasonic S-wave detection and pulsed eddy current detection. The principle of ultrasonic S-wave detection is illustrated in Figure 2.

Figure 2.
Schematic of ultrasonic S-wave detection.
At specific time , the coil is activated, inducing eddy currents on the conductor’s surface. These currents cause particles on the surface to oscillate horizontally owing to the vertical external magnetic field, which, in turn, propagates ultrasonic shear waves through the conductor. The particle vibrations can be expressed by the following equation:
In this equation , , and represent the Gabriel Lamé constant, shear modulus, and density of the conductor, respectively; u represents the particle displacement; and represents the density of the Lorentz force on the surface of the material.
As the wave encounters a defect or reaches the bottom of the conductor, it reflects back to the surface, inducing a voltage in the coil:
where denotes the induced eddy current density caused by the vibrating particles on the material surface under the influence of the external magnetic field, is the area of the receiving coil, and represents the induced voltage on the receiving coil.
The process of signal reception is considered the inverse of transmission, with the current time denoted by . The depth of the defect (h) is then determined based on the propagation velocity () and propagation time () of the shear wave in the conductor:
3. Choice of Compound Detection Scheme
There are two principal modes for integrating electromagnetic ultrasound and pulsed eddy current technologies: the system layer and the mechanism layer. Because both techniques are based on the principle of electromagnetic induction, they can gather defect information by analyzing the voltage signal from the detection coil. Using the same excitation source for the integrated probe yields a detection signal that encapsulates both pulsed eddy current and electromagnetic ultrasonic data. Separating the eddy current and ultrasonic signals within the composite signal enables the extraction of detailed defect information and facilitates a comprehensive assessment of material flaws. In the mechanism layer approach, a high-frequency excitation signal is required to generate ultrasonic waves. However, under such high-frequency conditions, the pulsed eddy current method may face challenges in detecting deeper material defects.
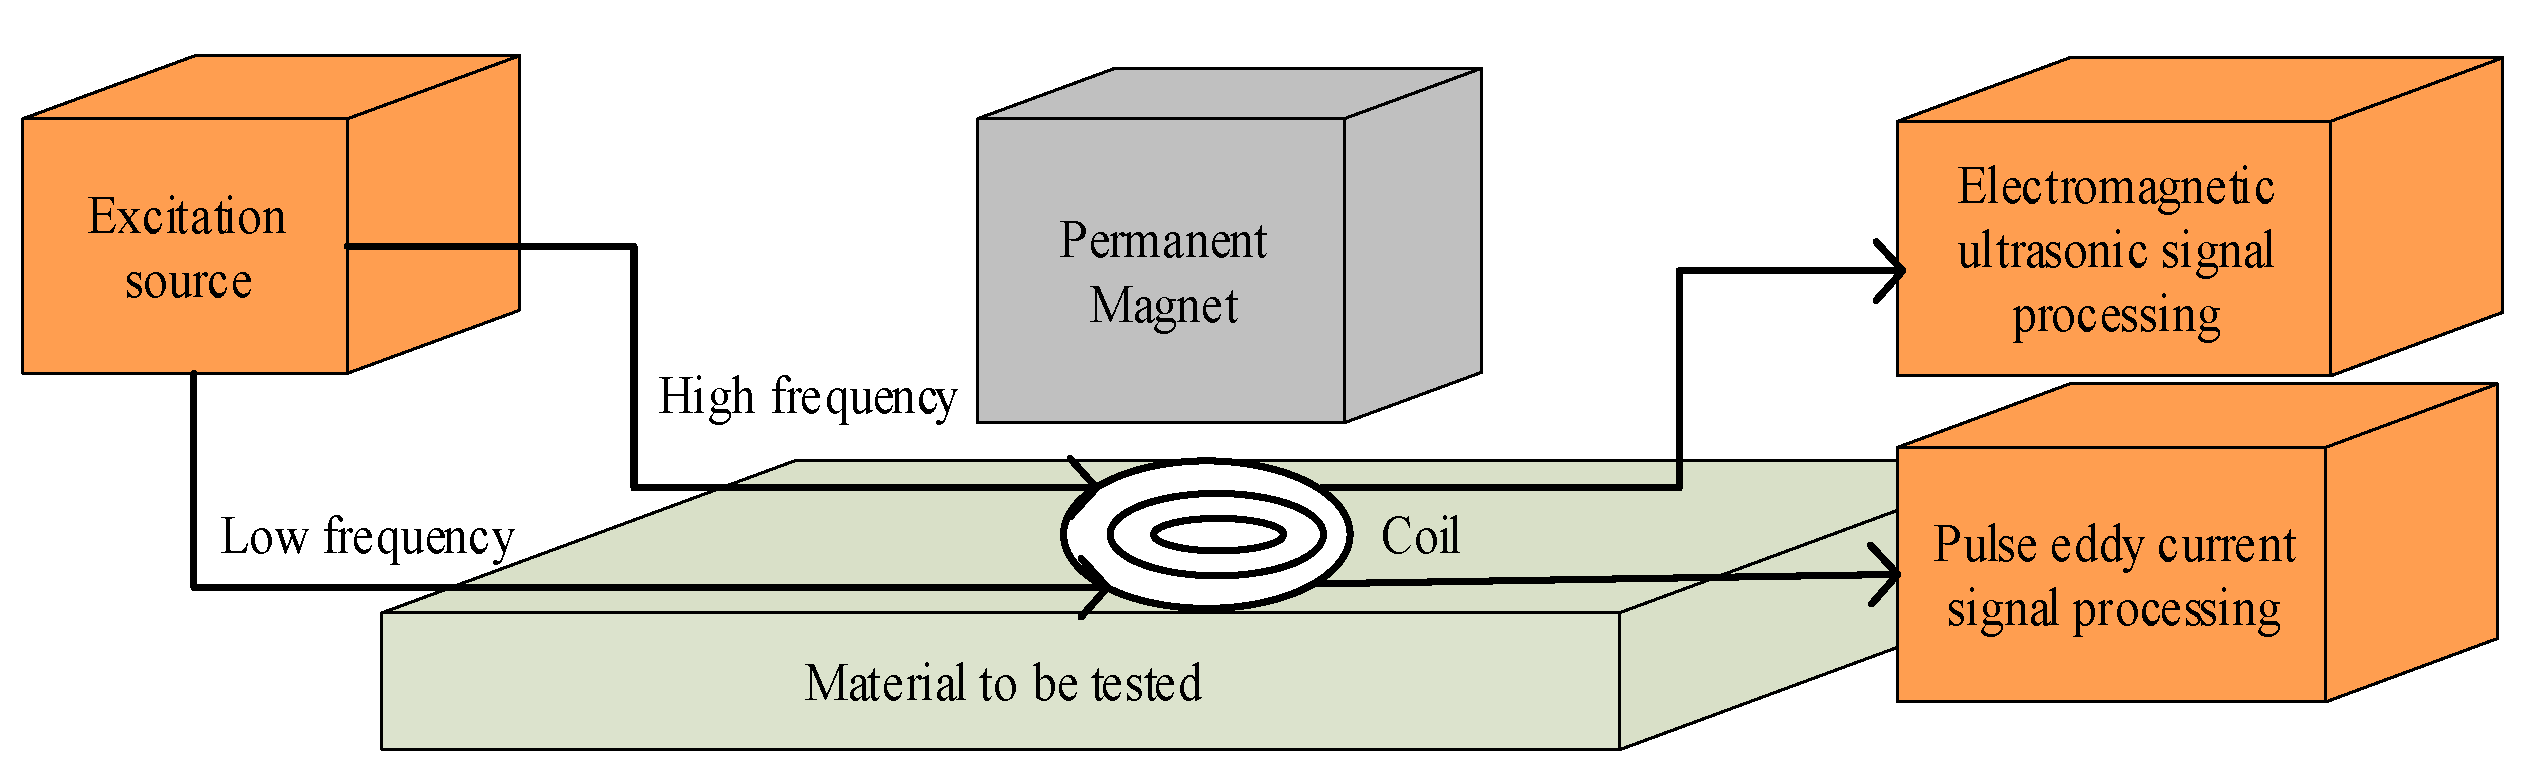
Therefore, this study adopts the system layer composite approach. This strategy involves applying both high- and low-frequency excitation signals to the same detector from a single excitation source, thereby obtaining independent signals for pulsed eddy current and electromagnetic ultrasonic detection. The pulsed eddy current signal is utilized to detect defects on the upper surface and near-surface of the material, while the electromagnetic ultrasonic signal is employed to identify material corrosion thinning and deeper defects, as depicted in Figure 3.
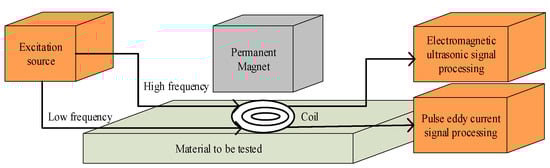
Figure 3.
Composite sketch of pulsed eddy current and electromagnetic ultrasonic testing system layer.
This combined mode maximizes the benefits of both pulsed eddy current testing and electromagnetic ultrasonic testing, enabling effective detection of surface defects, deep internal flaws, and corrosion thinning in materials. A schematic illustrating the detection capabilities is presented in Figure 4.
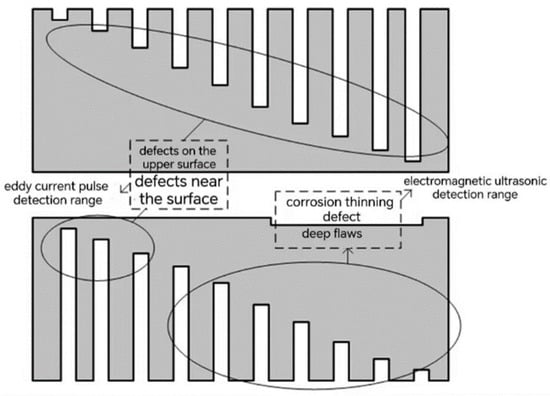
Figure 4.
Schematic of the detection ranges of pulsed eddy currents and electromagnetic ultrasound.
4. Composite Detection Probe Optimization
Given the complexity of calculating the relationship between the received signal, the excitation signal, the coil structure, and other parameters of the composite sensor, this study employed the finite-element simulation software COMSOL 6.2 to simulate and model the composite detection probe. The aim was to enhance the probe’s energy conversion efficiency. To expedite the simulation process, a two-dimensional axisymmetric model of the compound detection probe was developed, as shown in Figure 5.
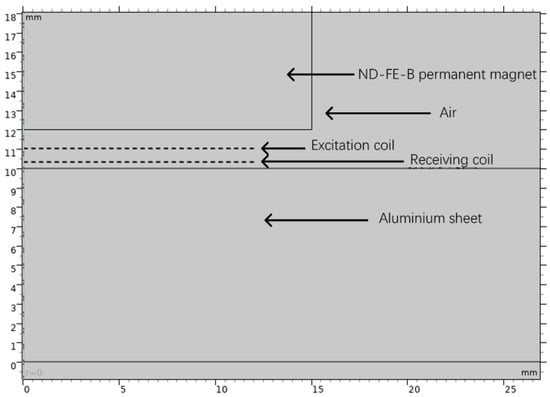
Figure 5.
Simulation model of composite detector.
The geometric model includes an air zone with a radius of 200 mm, an aluminum plate with a diameter of 80 mm × 10 mm, and an aluminum plate with a diameter of 2 mm × 0.1 mm. In practice, a PCB coil is used as the excitation coil to maintain consistent coil distances. Therefore, the model utilizes 30 rectangular PCB spiral coils, each with 30 turns. The space between the lower surface of the permanent magnet and the upper surface of the aluminum plate is 2 mm, and the space between the coil and the aluminum plate is 1 mm. The electrical conductivity of the PCB material is considered to be 0, so the PCB material can be treated as air except for the coil. The specific parameters of the permanent magnet, coil, and material are shown in Table 1.

Table 1.
Simulation model parameters.
To facilitate enhanced detection signal observation, the simulation model incorporates a two-layer coil structure consisting of one transmitter and one receiver.
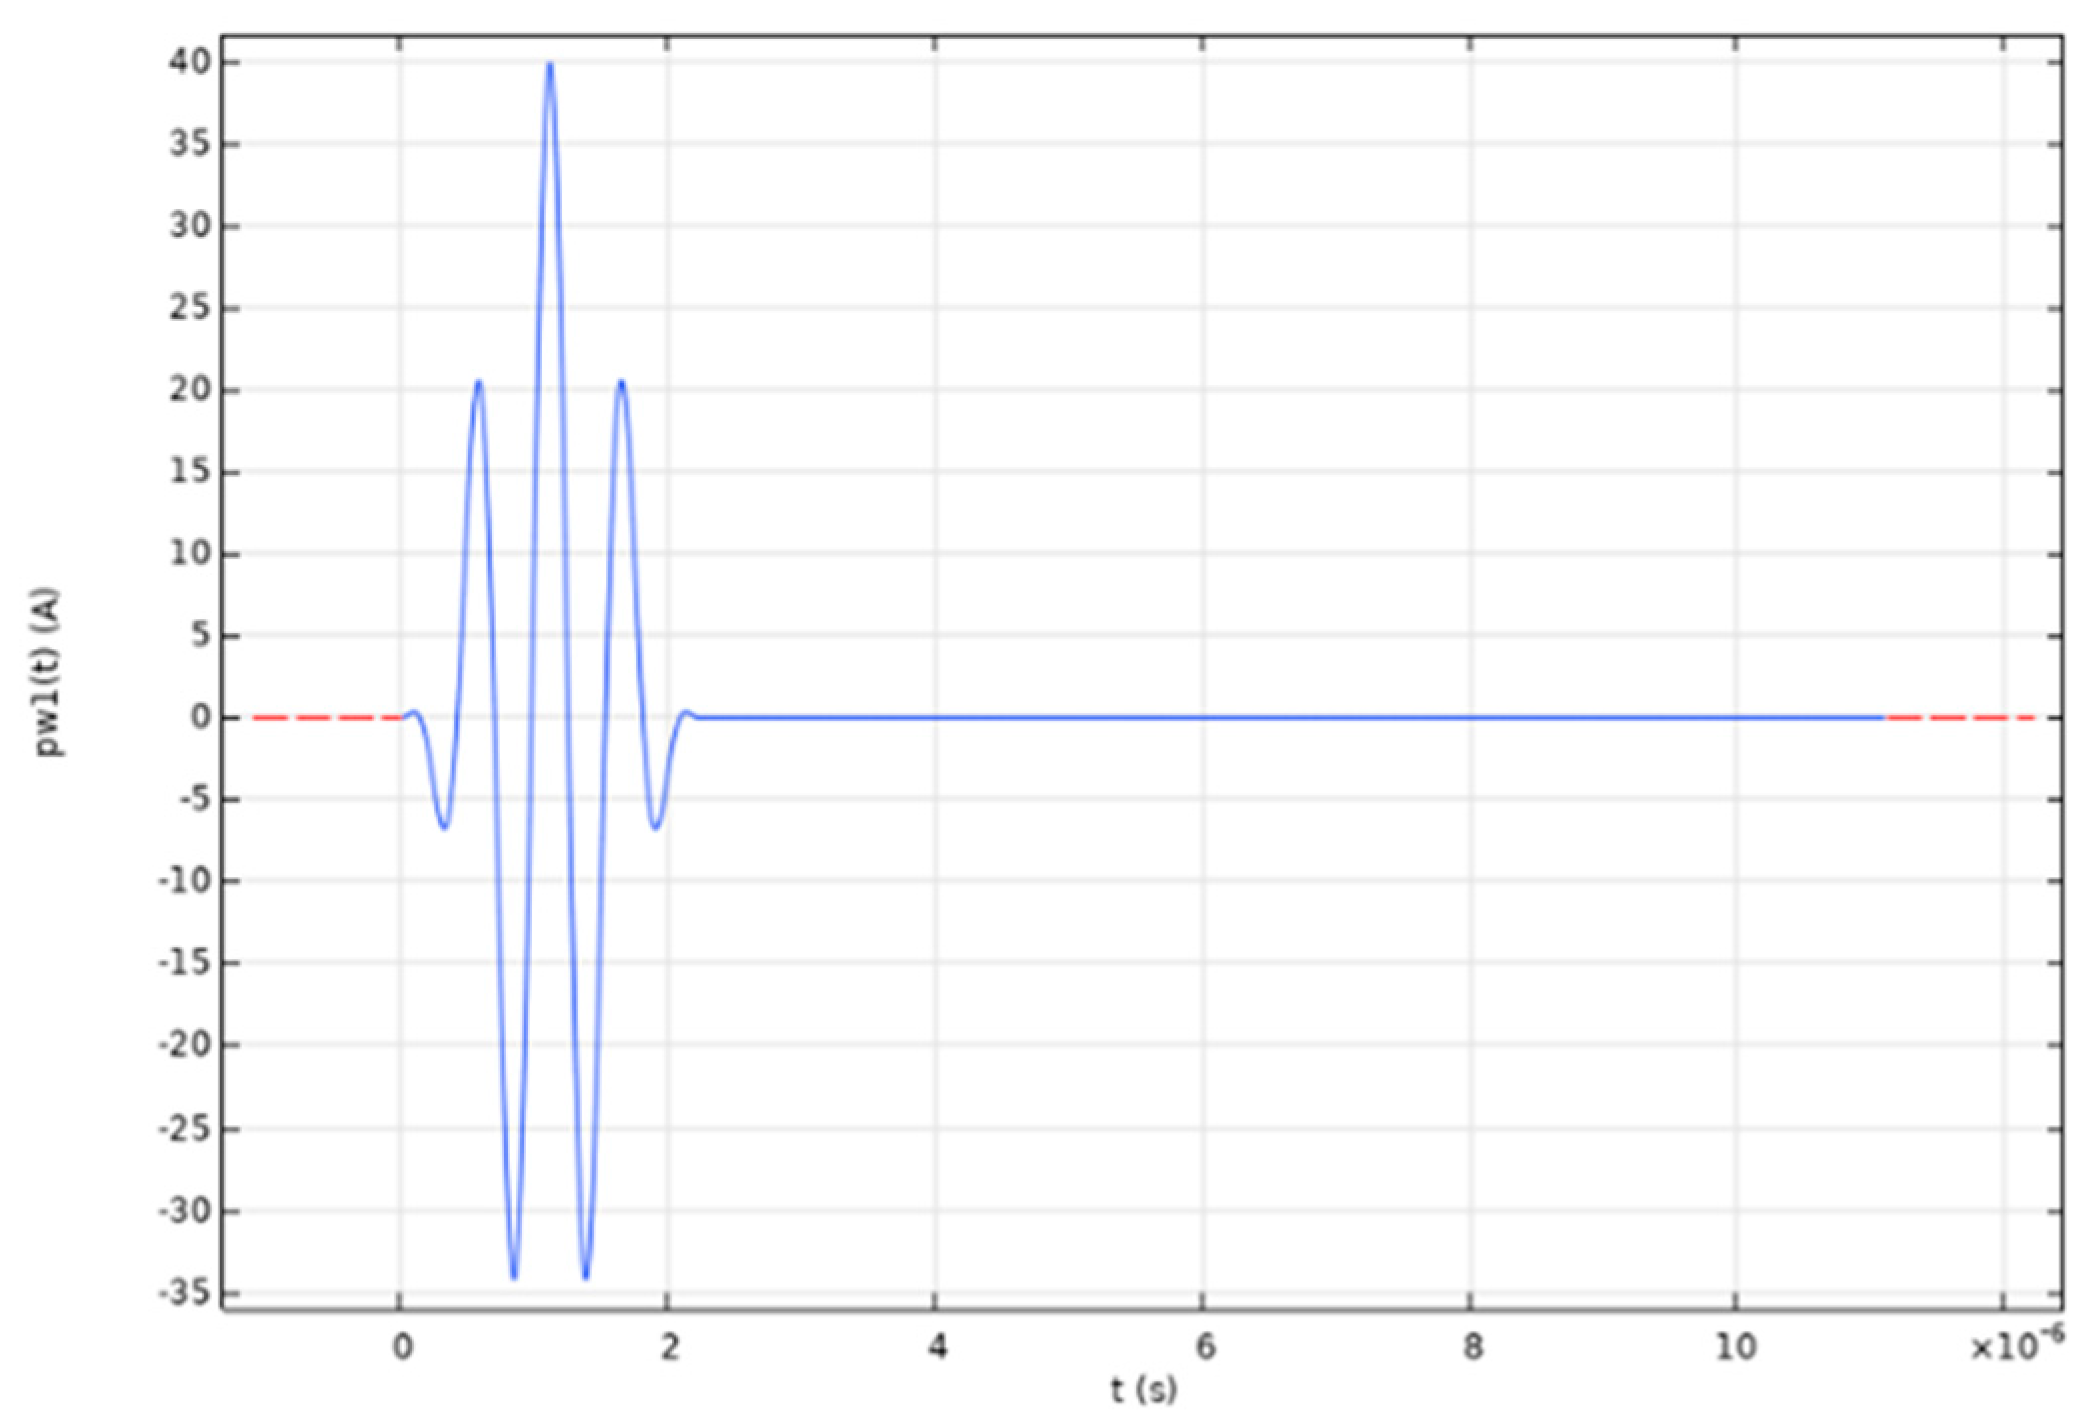
When n = 4, the waveform of the current excitation signal is as depicted in Figure 6.
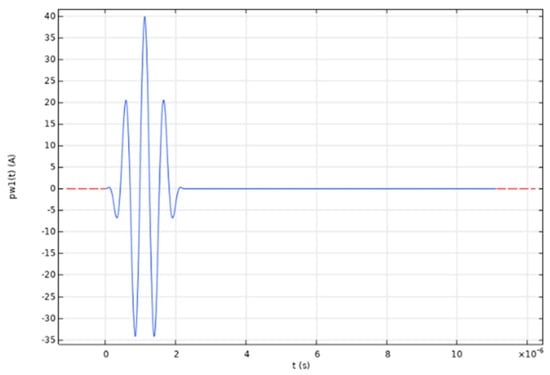
Figure 6.
Current-excited signal waveform.
In this paper, each wavelength is divided into six grids. The formula for calculating the wavelength of an ultrasonic wave is
where represents the wavelength of the ultrasonic wave, represents the shear wave velocity, and represents the frequency. The velocity is mainly related to the properties of the propagation medium itself:
Here, E represents the Young’s modulus of the medium, is the shear modulus of the aluminum plate, and stands for the density of the medium. Based on the material parameters of the aluminum plate specified in the model, the propagation velocity of shear waves in the aluminum plate is approximately 3122 m/s. Consequently, when meshing the aluminum in the model, the maximum cell size should not exceed 520/f.
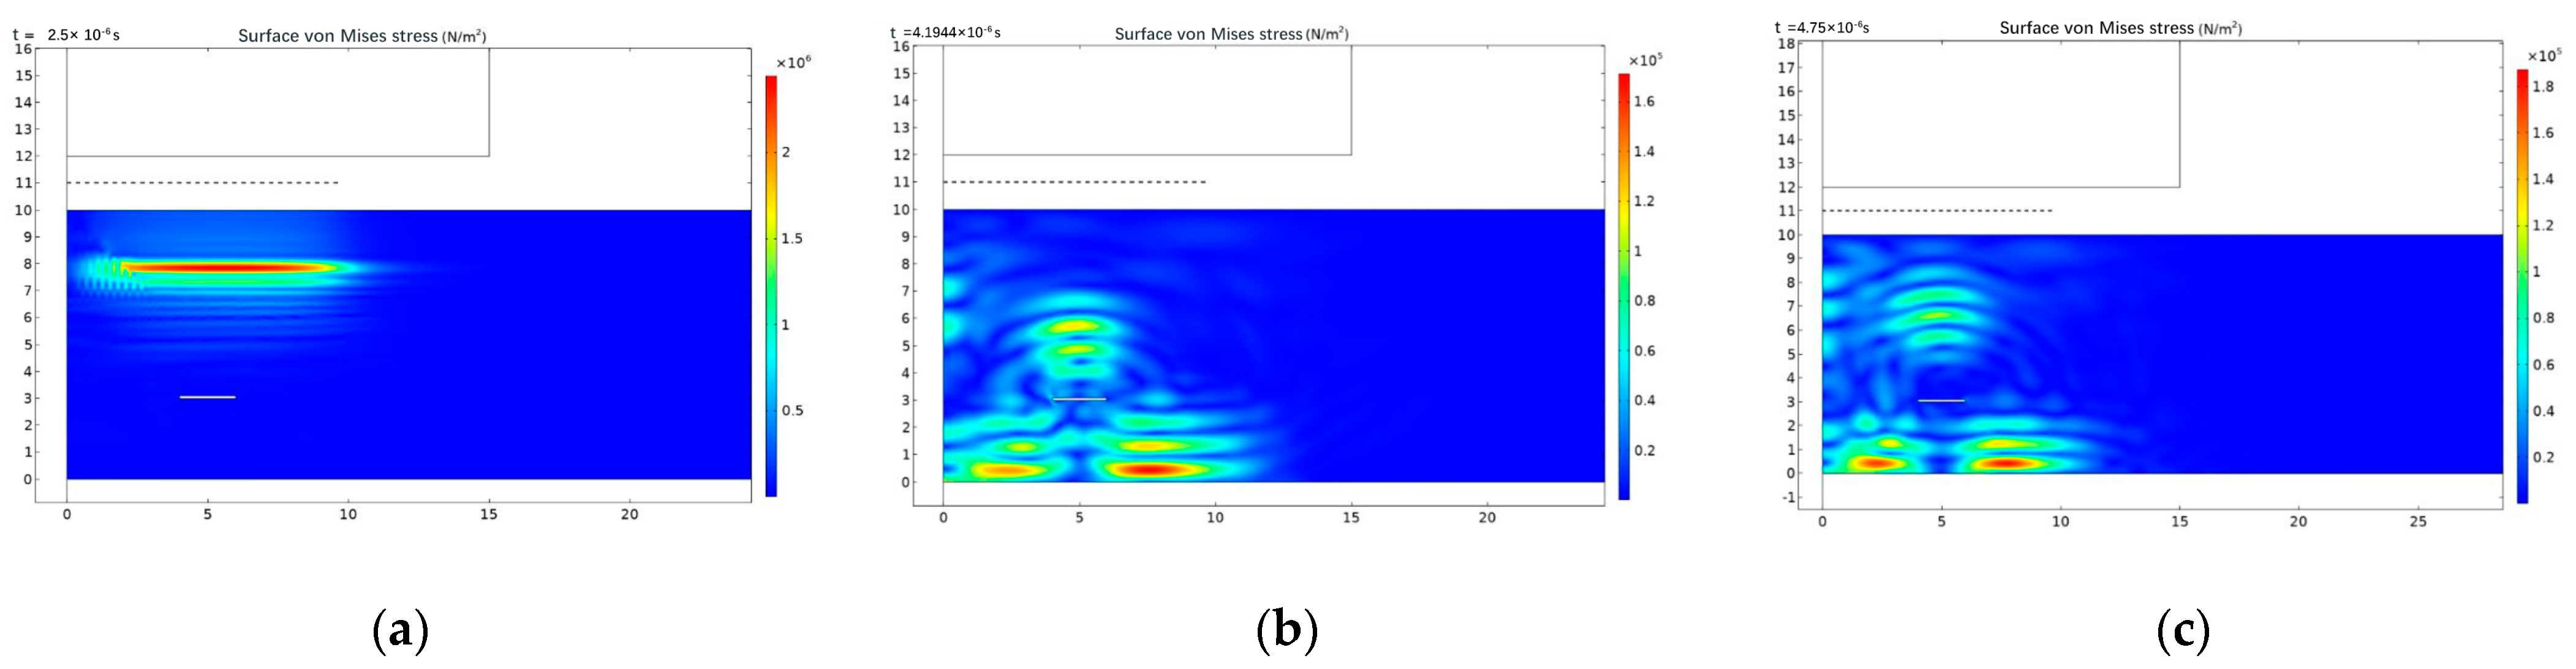
The ultrasonic propagation process and detection signal at different times after the introduction of a 2 mm × 0.1 mm internal defect in the aluminum plate are depicted in Figure 7 and Figure 8.
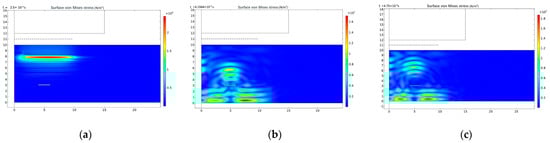
Figure 7.
Surface von Mises stress: (a) t = 2.5 μs; (b) t = 4.2 μs; (c) t = 4.75 μs.
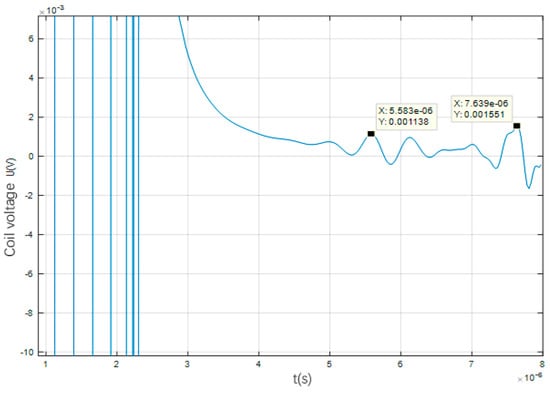
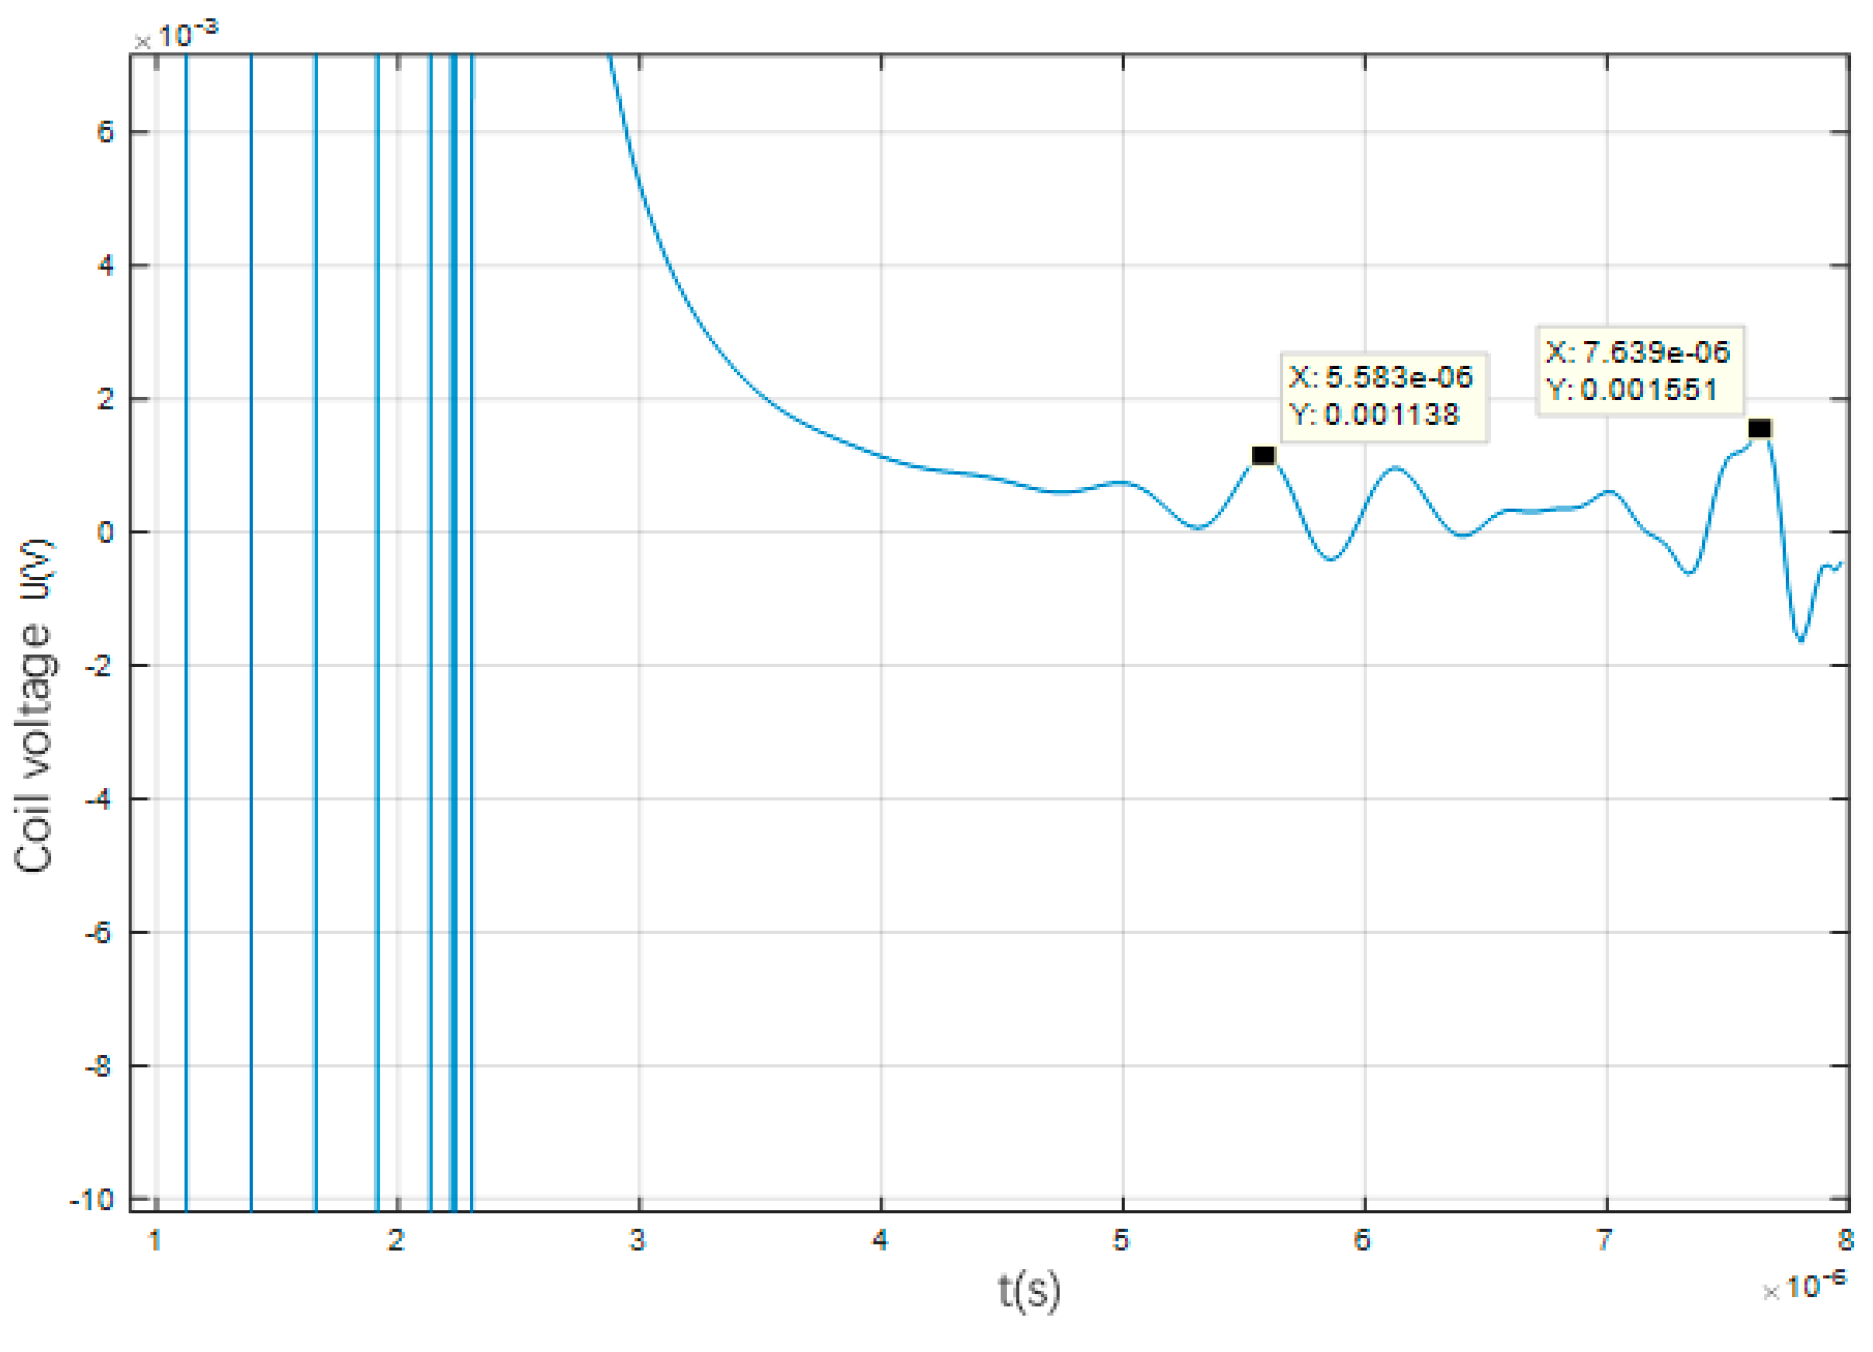
Figure 8.
Ultrasonic detection signal.
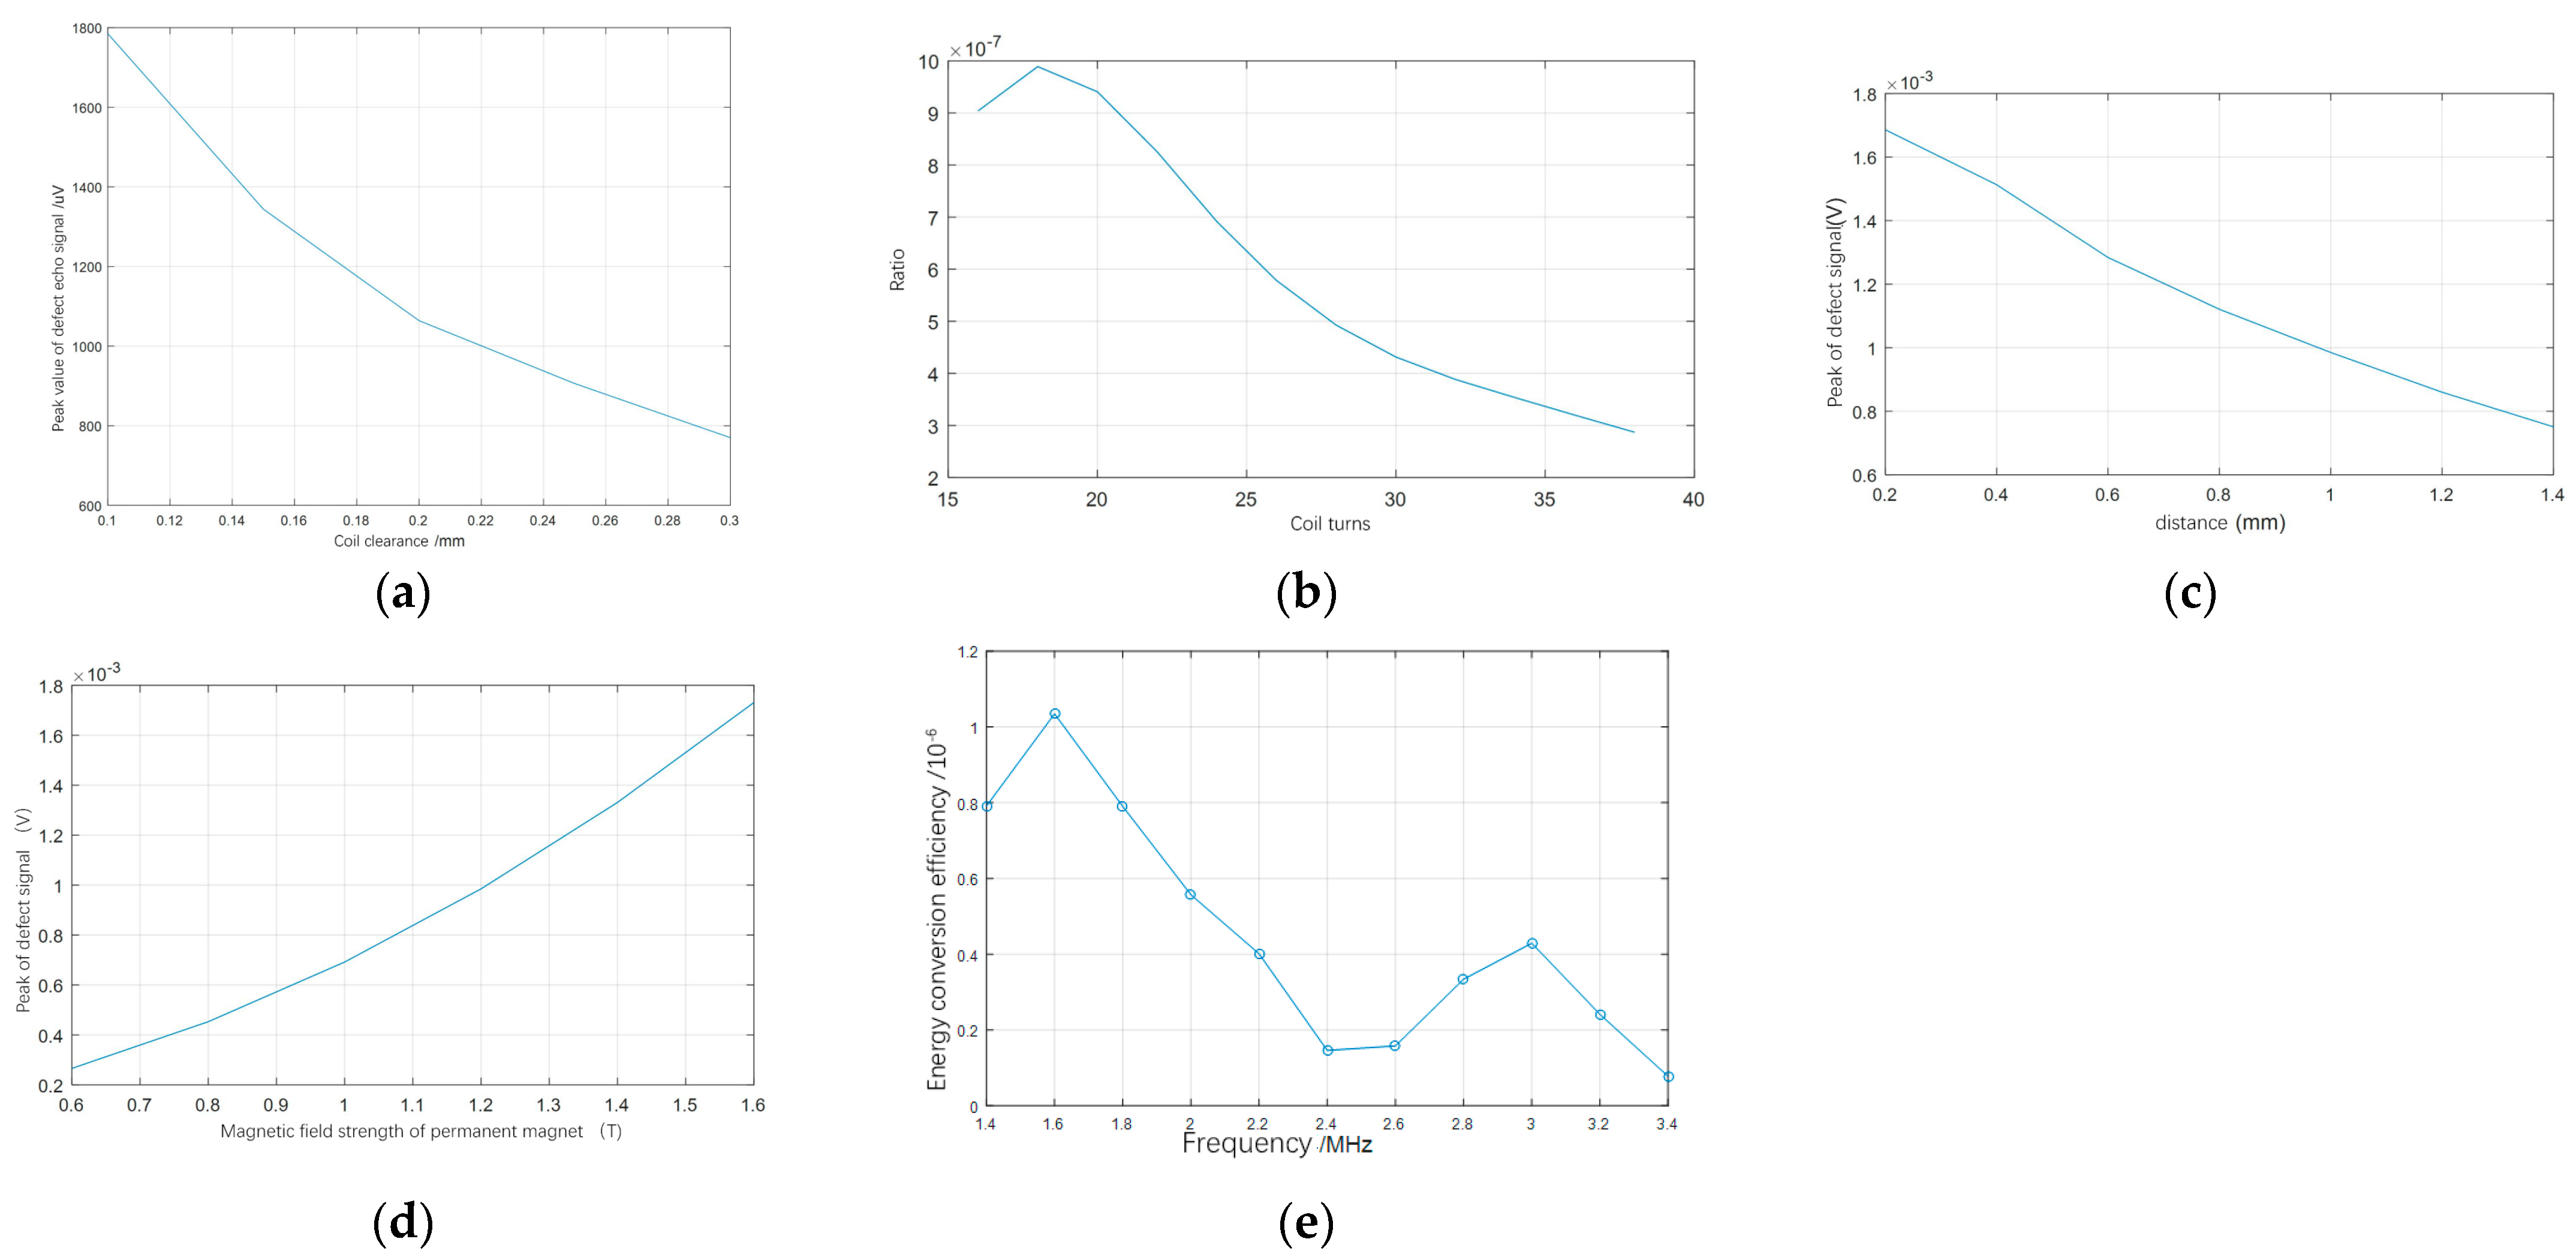
As shown in Figure 7, the reflection of the ultrasonic wave becomes apparent as it encounters the internal defect or reaches the bottom of the aluminum plate. Figure 8 illustrates the voltage signal in the detection coil, generated by the ultrasonic wave reflected from the defect and the plate’s bottom. Notably, the ultrasonic echo signal is weak. To strengthen the echo signal and increase the energy conversion efficiency of the composite detection probe, this study simulated and analyzed the effects of the coil distance, coil turns, coil lift distance, permanent magnet magnetic field strength, and excitation frequency on the probe’s energy conversion efficiency. The results are presented in Figure 9.
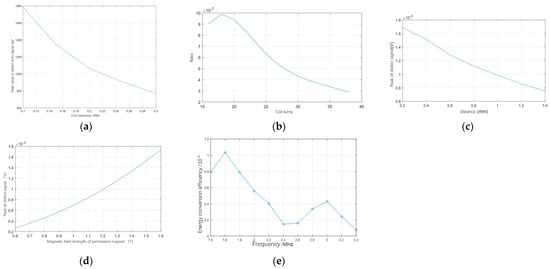
Figure 9.
Effects of various factors on transducer efficiency of the composite probe: (a) effect of coil spacing; (b) effect of coil turns; (c) effect of coil lift distance; (d) effect of external magnetic field strength; (e) effect of excitation frequency.
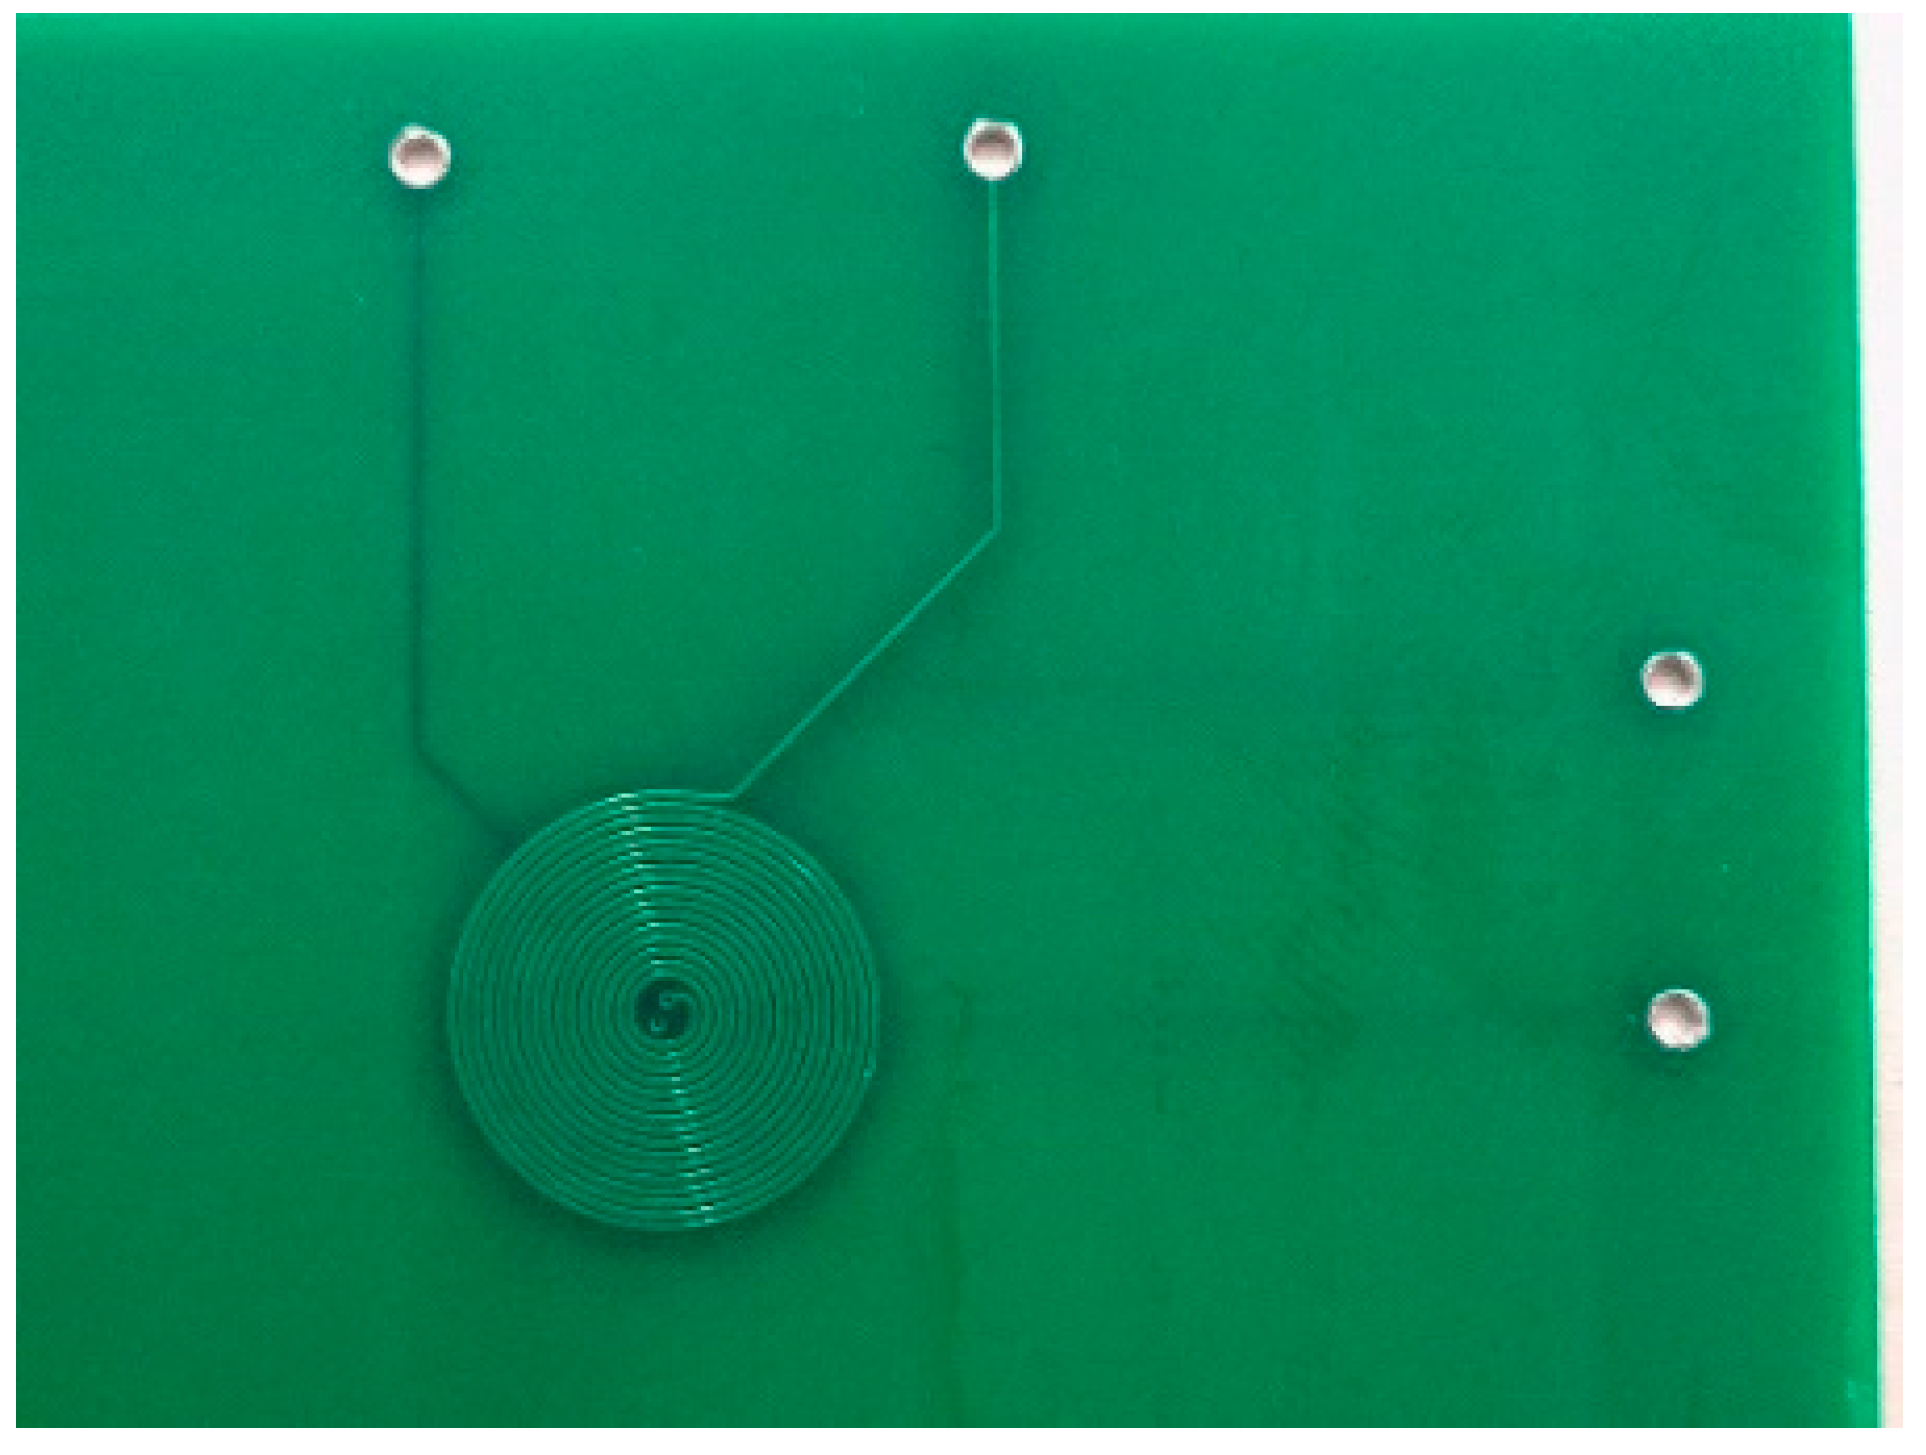
Figure 9 demonstrates that reducing the coil distance and lift distance enhances the energy conversion efficiency of the composite detection probe. Additionally, increasing the external magnetic field strength increases the energy conversion efficiency. However, within a certain range, as the number of coil turns increases, the energy conversion efficiency decreases. Furthermore, the energy conversion efficiency varies with different excitation signal frequencies; it generally decreases as the excitation frequency increases. Thus, in optimizing the probe, it is advisable to select the smallest possible coils and coil thickness to minimize the lift distance. Moreover, maximizing the external magnetic field strength and selecting an appropriate number of turns is recommended. This study’s simulation results led to the final selection of a PCB double-spiral coil with a plate thickness of 0.6 mm, 18 turns, a coil spacing of about 0.1 mm, and a line width of about 0.2 mm, as shown in Figure 10.
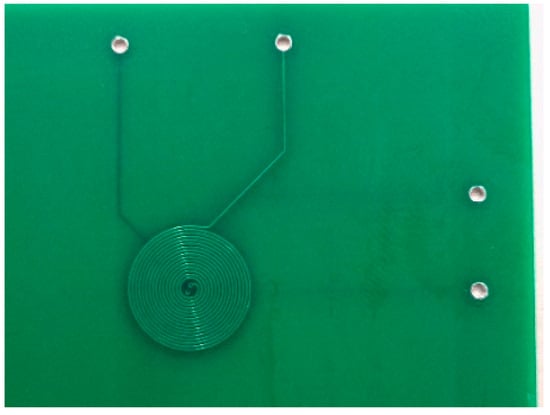
Figure 10.
PCB double-helix coil.
To enhance the external magnetic field intensity, an N52-grade NdFeB permanent magnet measuring 30 mm × 30 mm × 30 mm was selected as the magnetic field source. The remanent magnetic intensity of this magnet ranges from 1.38 T to 1.48 T.
5. Test of Detection Ability of Composite Detection Probe
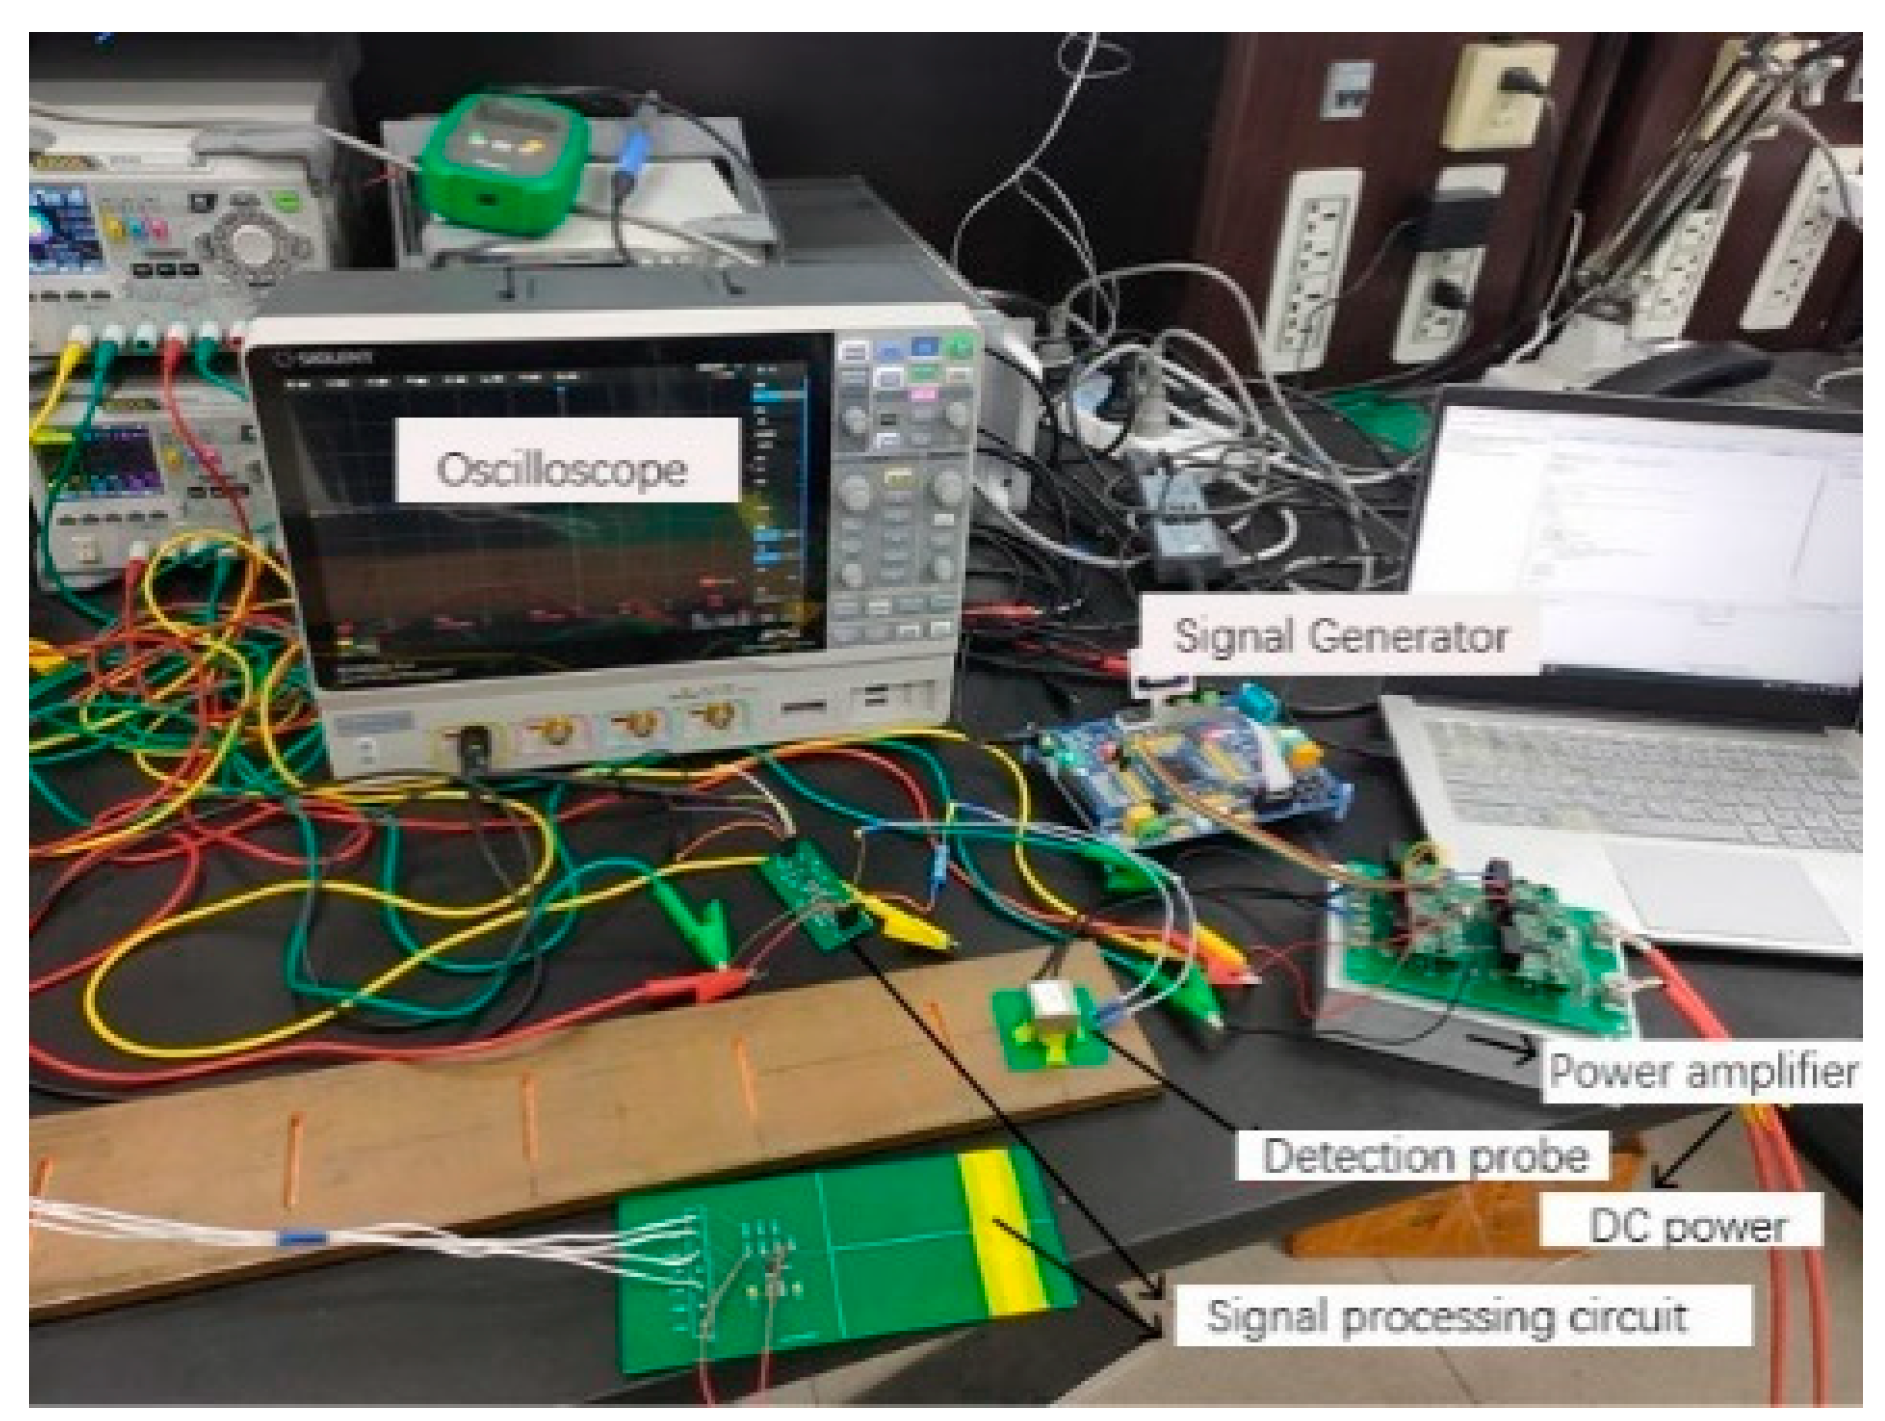
To verify the detection capability of the composite detector, an experimental platform was constructed, as illustrated in Figure 11.
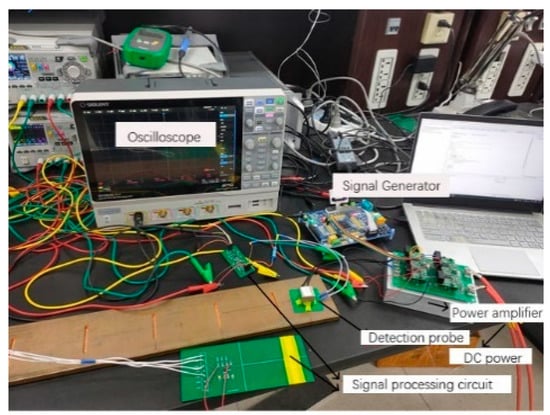
Figure 11.
Composite detection experimental platform.
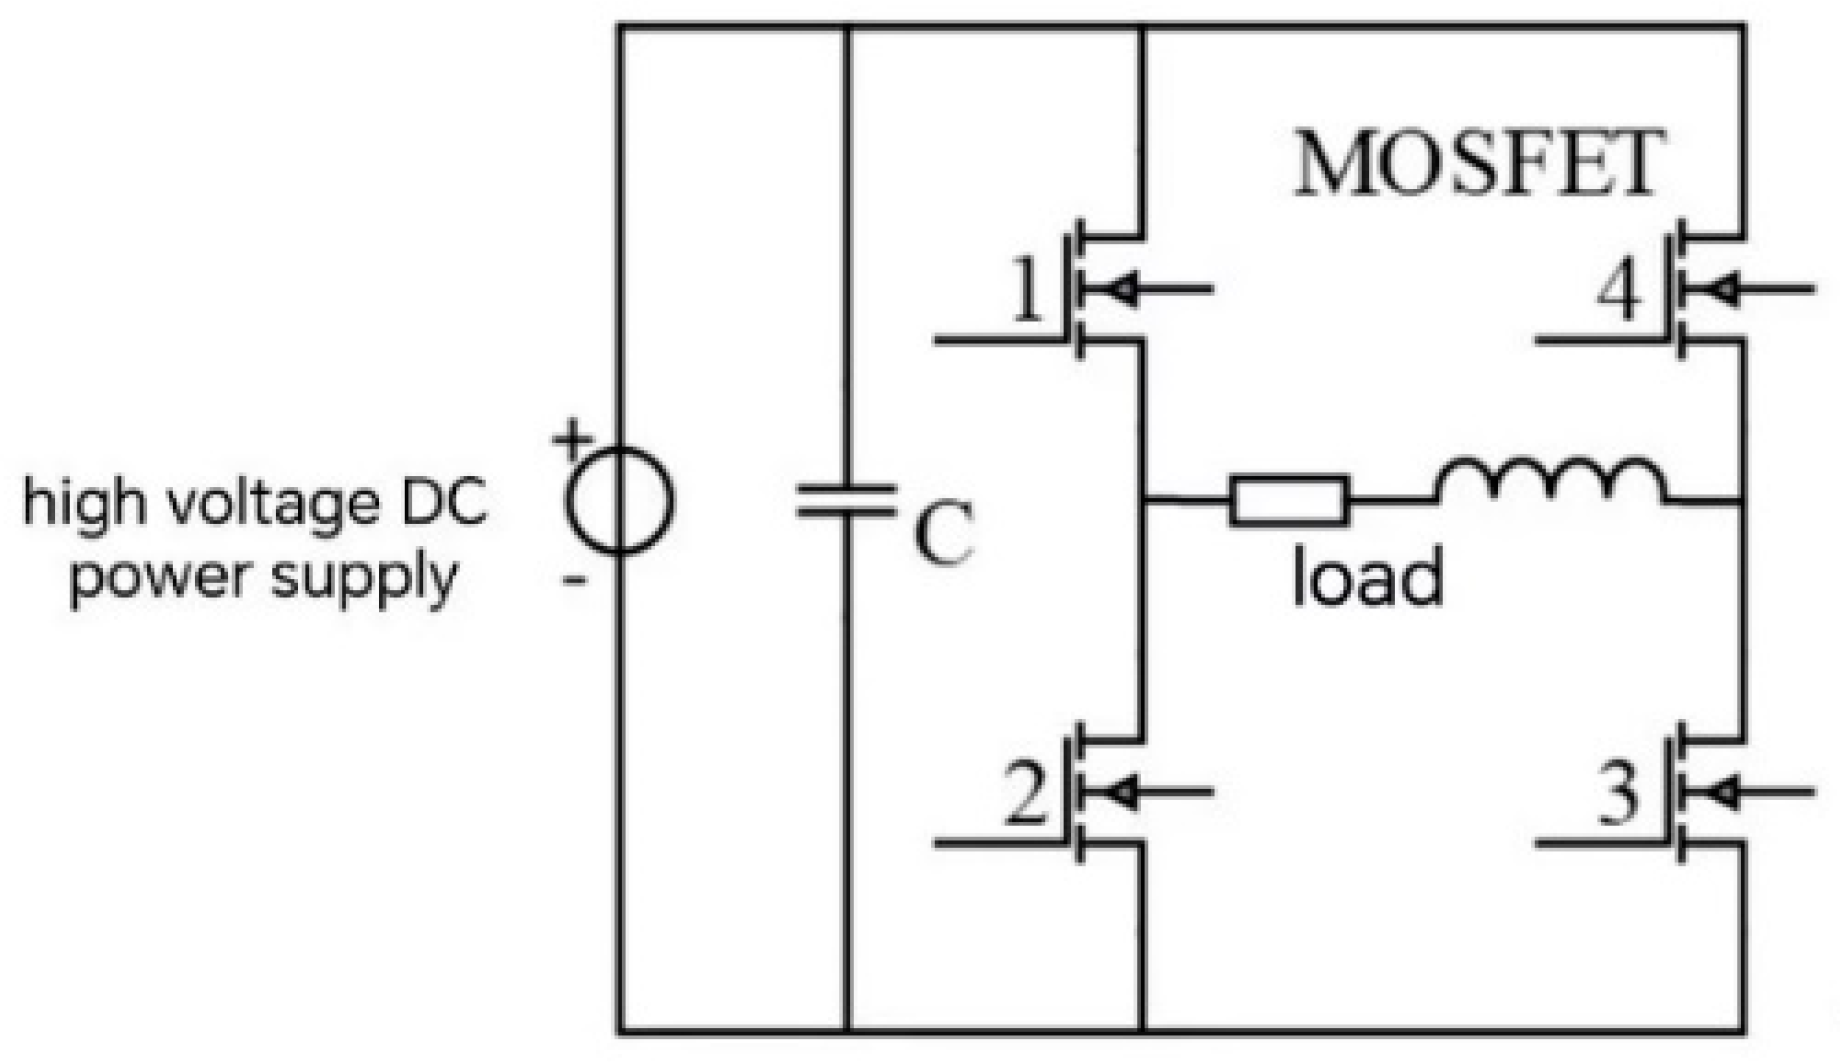
Electromagnetic ultrasonic detection requires an excitation signal of higher frequency and larger voltage, whereas the excitation signal for pulsed eddy current detection is of lower frequency. Accordingly, this study utilized the TMS320F28335 DSP (Texas Instruments, Dallas, TX, USA) processor as the signal generator and a full-bridge inverter circuit as the power amplifier. The MOSFETs within the full-bridge inverter circuit were controlled via a PC program, enabling the application of excitation signals at varying frequencies to the excitation coil. The configuration of the full-bridge inverter circuit is depicted in Figure 12.
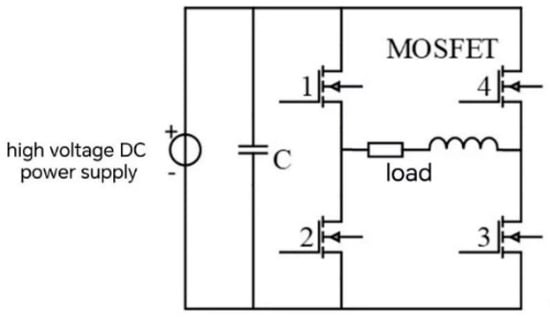
Figure 12.
Full-bridge inverter circuit.
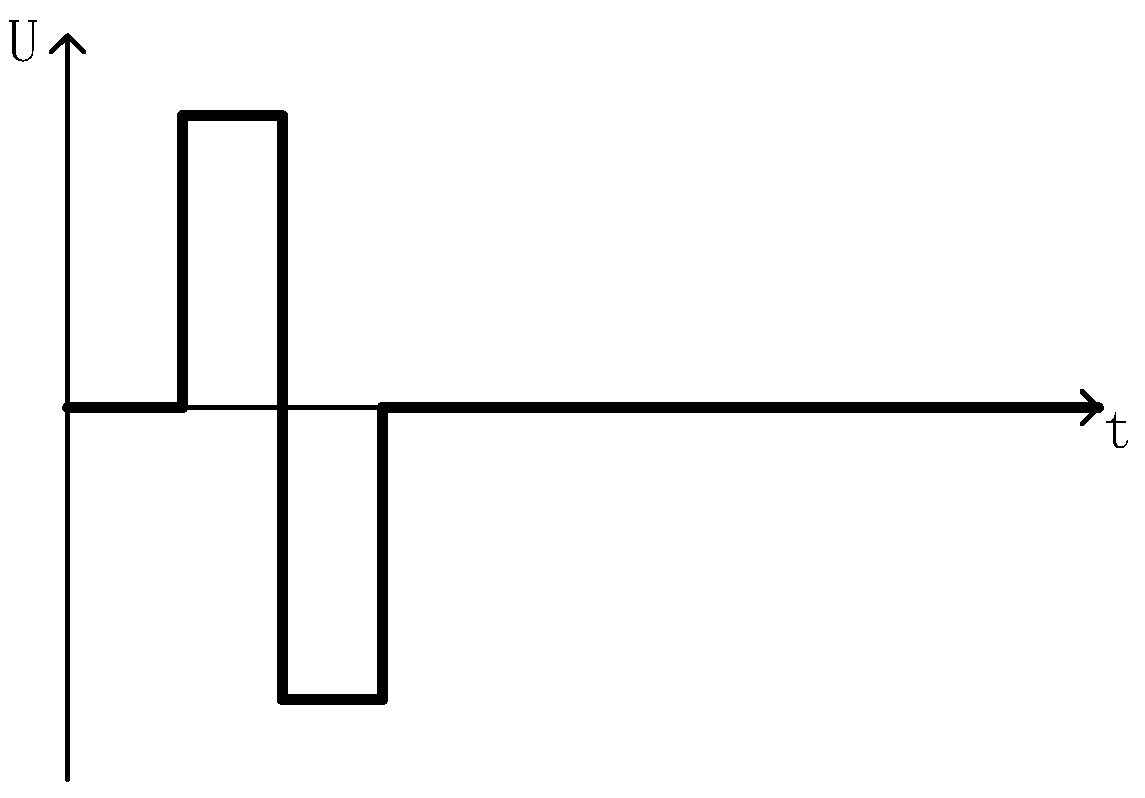
In this setup, different frequency pulse excitations can be applied to the load by synchronously toggling the 1,3 MOS and 2,4 MOS transistors. The ideal excitation waveform is shown in Figure 13.

Figure 13.
Ideal output waveform for a full-bridge inverter circuit.
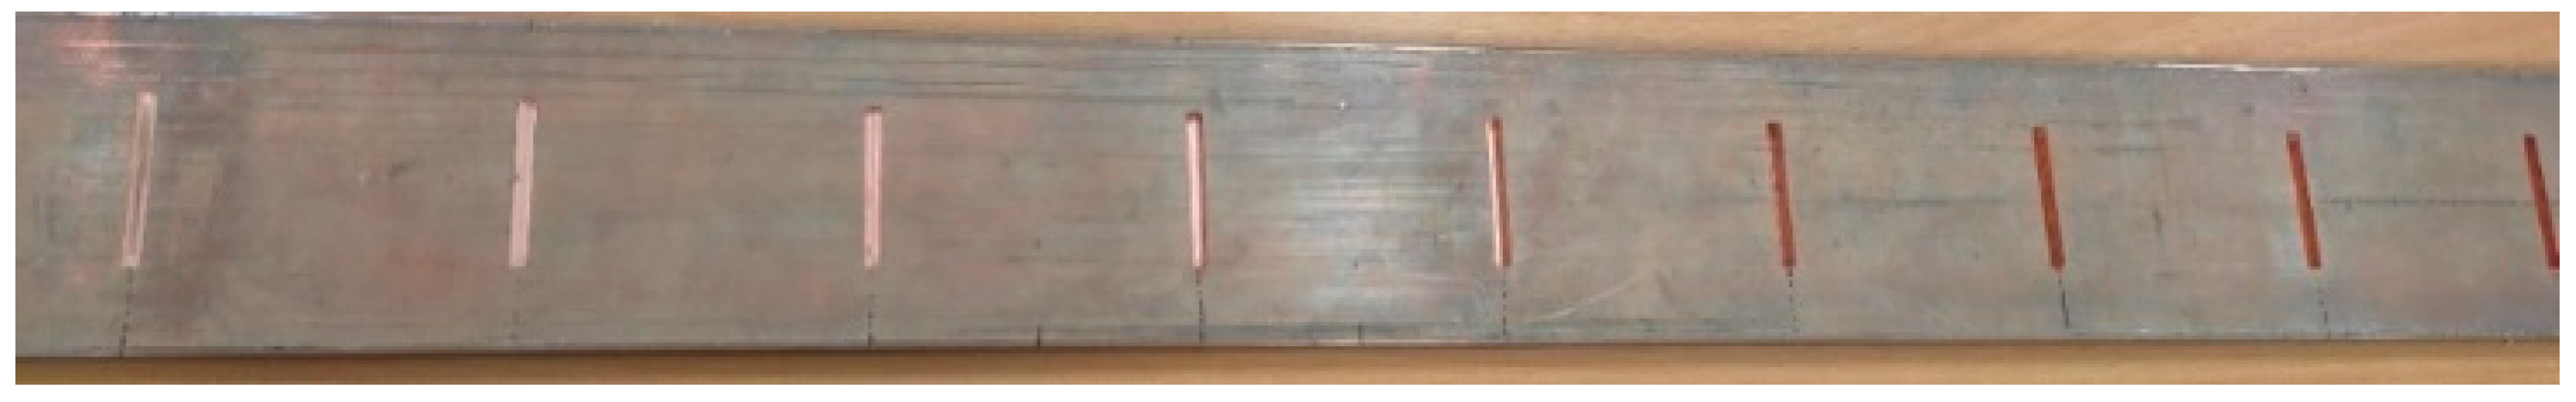
The test material primarily consisted of red copper with a thickness of 10 mm. Machining was applied to introduce cuboid defects into the upper surface of the material, measuring 50 mm in length, 5 mm in width, and 1 mm in depth, distributed from 2 mm to 9 mm from left to right, as shown in Figure 14.
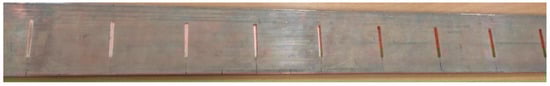
Figure 14.
Material under test.
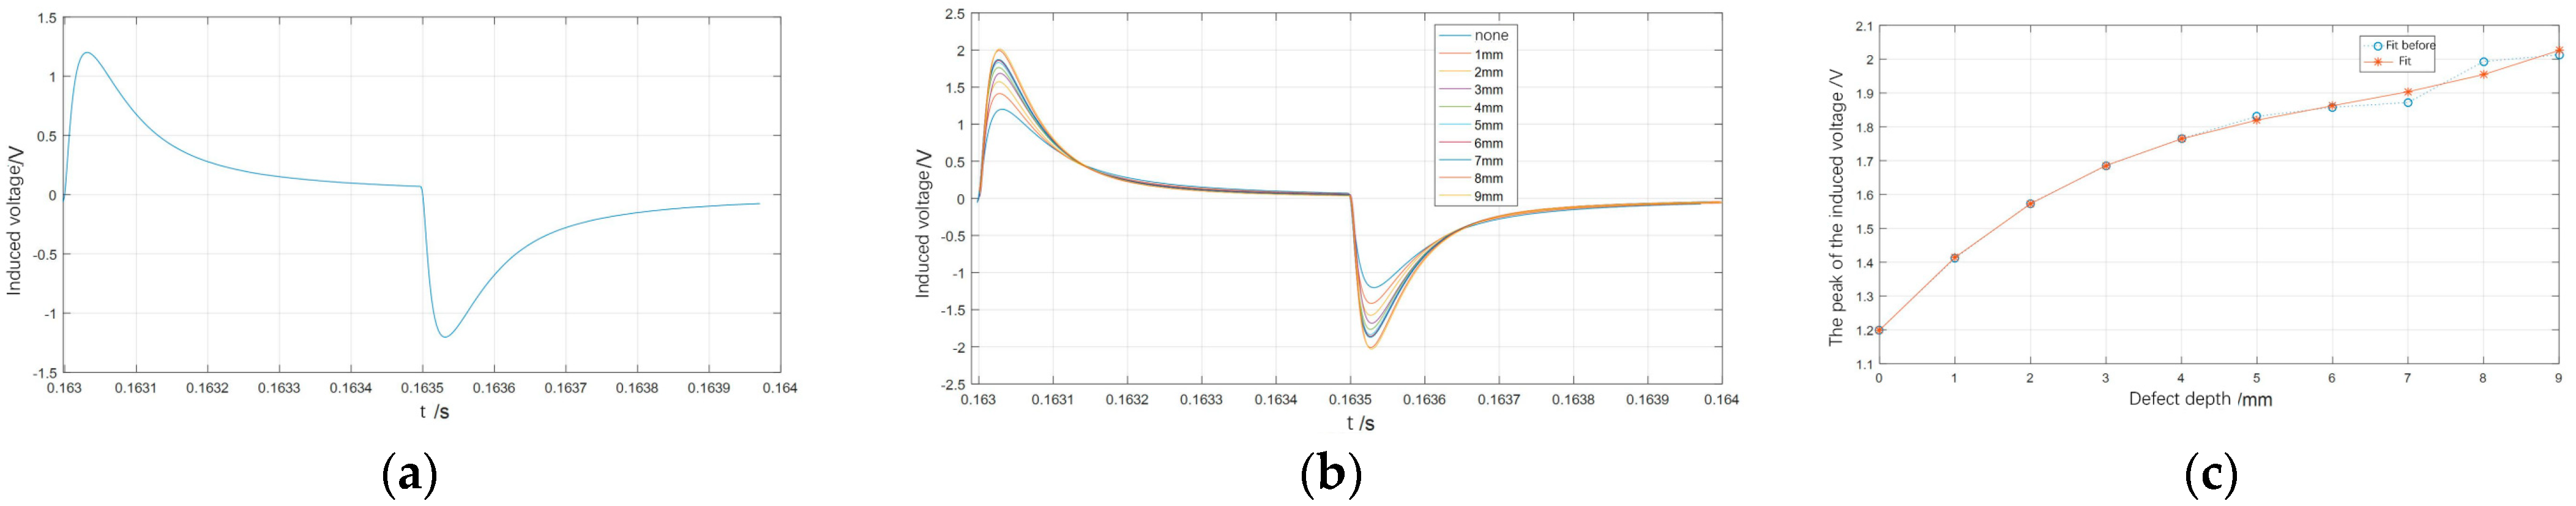
Initially, defects on the upper surface of the material were detected using an excitation signal of 1 kHz, with the pulsed eddy current signal results presented in Figure 15. Figure 15a shows the result without any defects, while Figure 15b compares different results with the defect-free result.
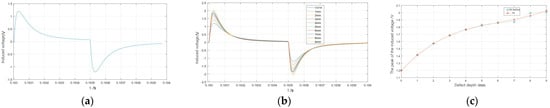
Figure 15.
Eddy current detection signals at different depths of defects on the upper surface: (a) detection signal without defect; (b) induced voltage under different defect depth of lower surface; (c) relationship between peak value of induced voltage and defect depth of upper surface.
The peak value of the detection signal increases with the defect depth, indicating significant changes. This demonstrates that defects ranging from 1 mm to 9 mm in depth on the upper surface of the material can be effectively identified by the pulsed eddy current detection signal.
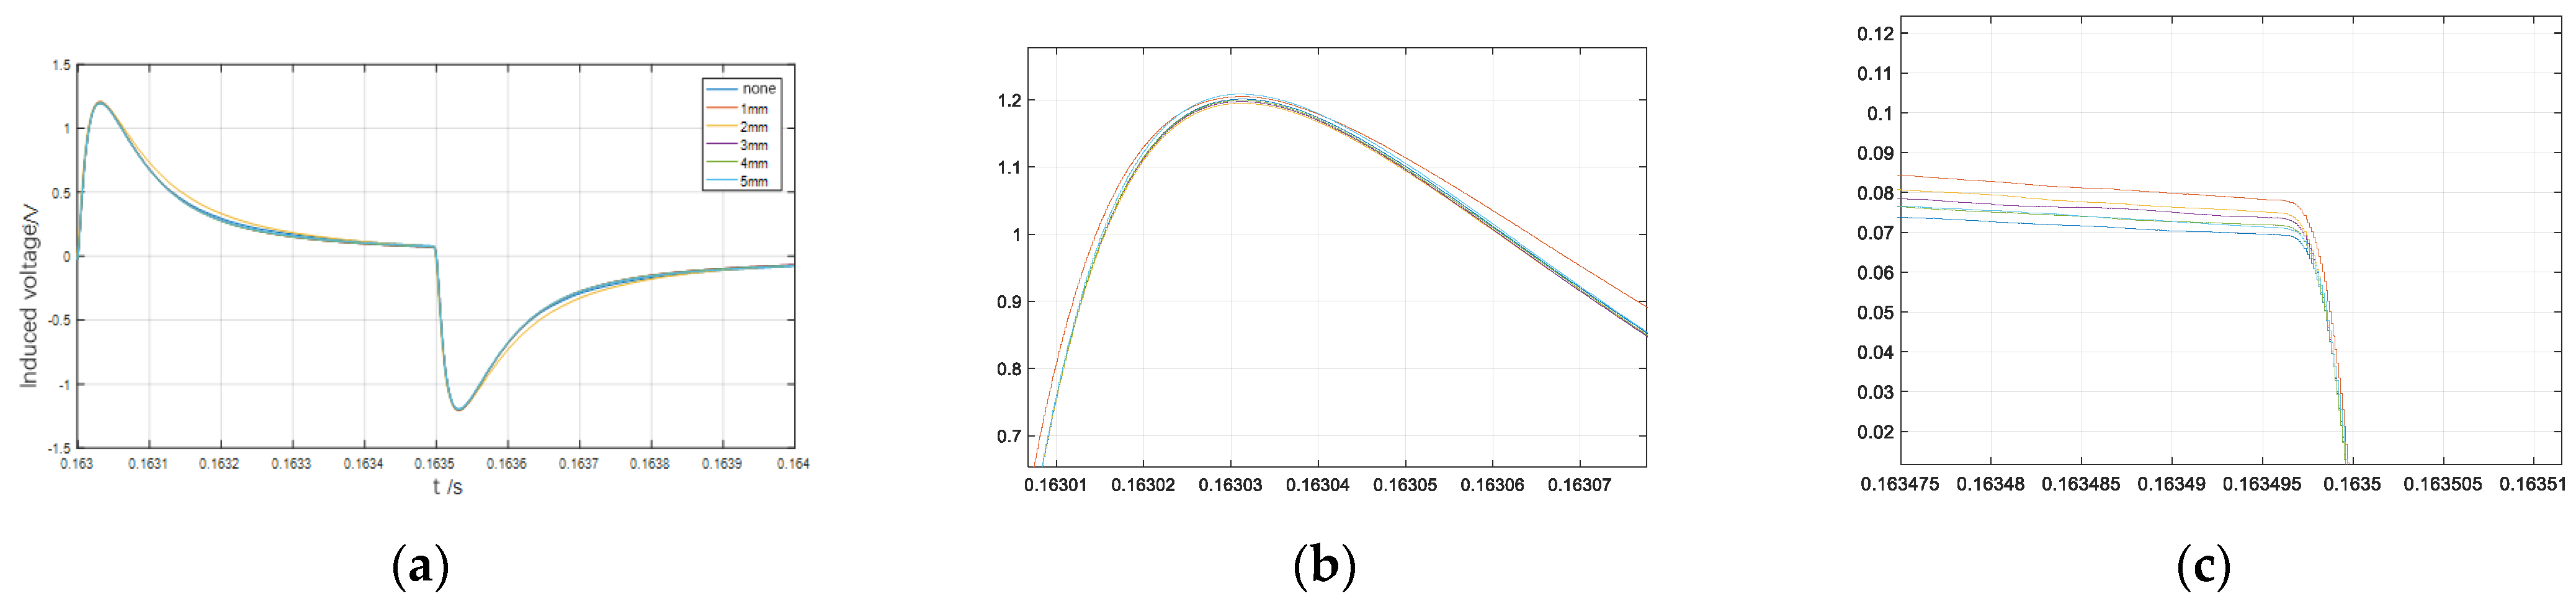
The material was then flipped over, positioning the defects beneath the surface, and the pulsed eddy current detection signal was acquired at various defect locations using the composite detection probe, as illustrated in Figure 16. Figure 16b,c show magnified images of the two peaks.
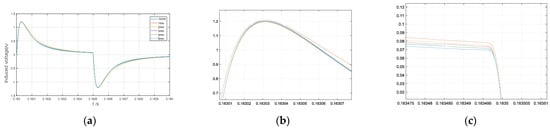
Figure 16.
Eddy current testing signal for different depths of surface defects: (a) induced voltage under different defect depth of lower surface; (b) magnified image of the first voltage peak; (c) the second voltage peak magnified picture;.
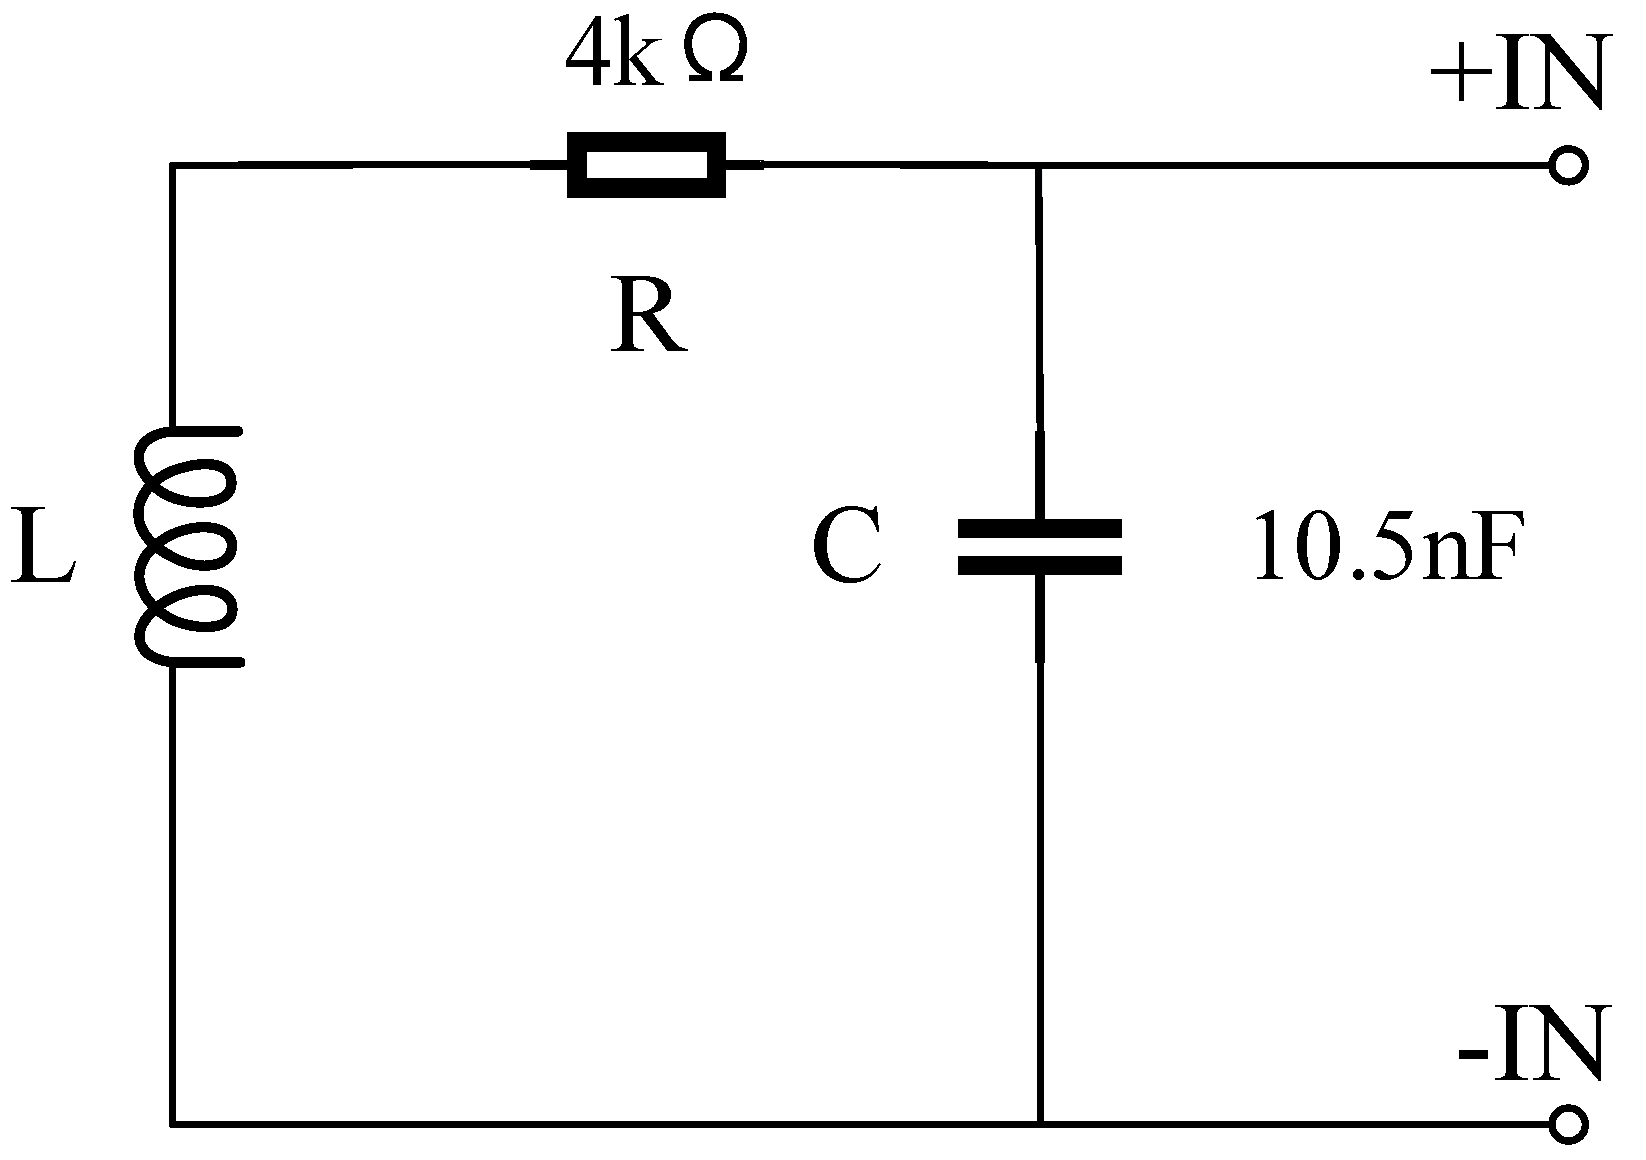
Figure 16 reveals that the peak value of the composite probe does not significantly change when detecting defects on the lower surface of the material. This is attributed to the need for a thinner coil in the composite probe to reduce the lift distance of the permanent magnet. Consequently, compared to traditional pulsed eddy current probes, the compound probe used in this study features fewer coil turns and lower inductance, resulting in relatively stable peak values during the detection of defects on the lower surface. To address this issue, an RLC circuit was constructed for the detection coil. The equivalent circuit is shown in Figure 17.

Figure 17.
Detection coil RLC equivalent circuit.
As depicted in Figure 17, once the pulse excitation stabilizes, the detection coil begins to discharge. In this scenario, the voltage across capacitor C is expressed as follows:
When there is a defect in the tested part, the circuit’s equivalent impedance changes, which also changes the rate of change of . The rate of change in can be determined by monitoring the voltage value of A before the negative pulse arrives, in order to gather information about the defect. The pulsed eddy current test data obtained are summarized in Table 2.
Table 2.
Pulsed eddy current testing data of defects at different positions on the lower surface.
The data in Table 2 show that the induction voltage before the arrival of the negative pulse provides a clearer reflection of defect information compared to the peak detection voltage value, especially for identifying defects within 4 mm of the upper surface. However, detecting defects deeper than 4 mm using pulsed eddy current signals proves challenging, necessitating the use of electromagnetic ultrasonic testing to supplement the measurements. A high-frequency excitation signal of 4 MHz was applied, and the results are depicted in Figure 18.

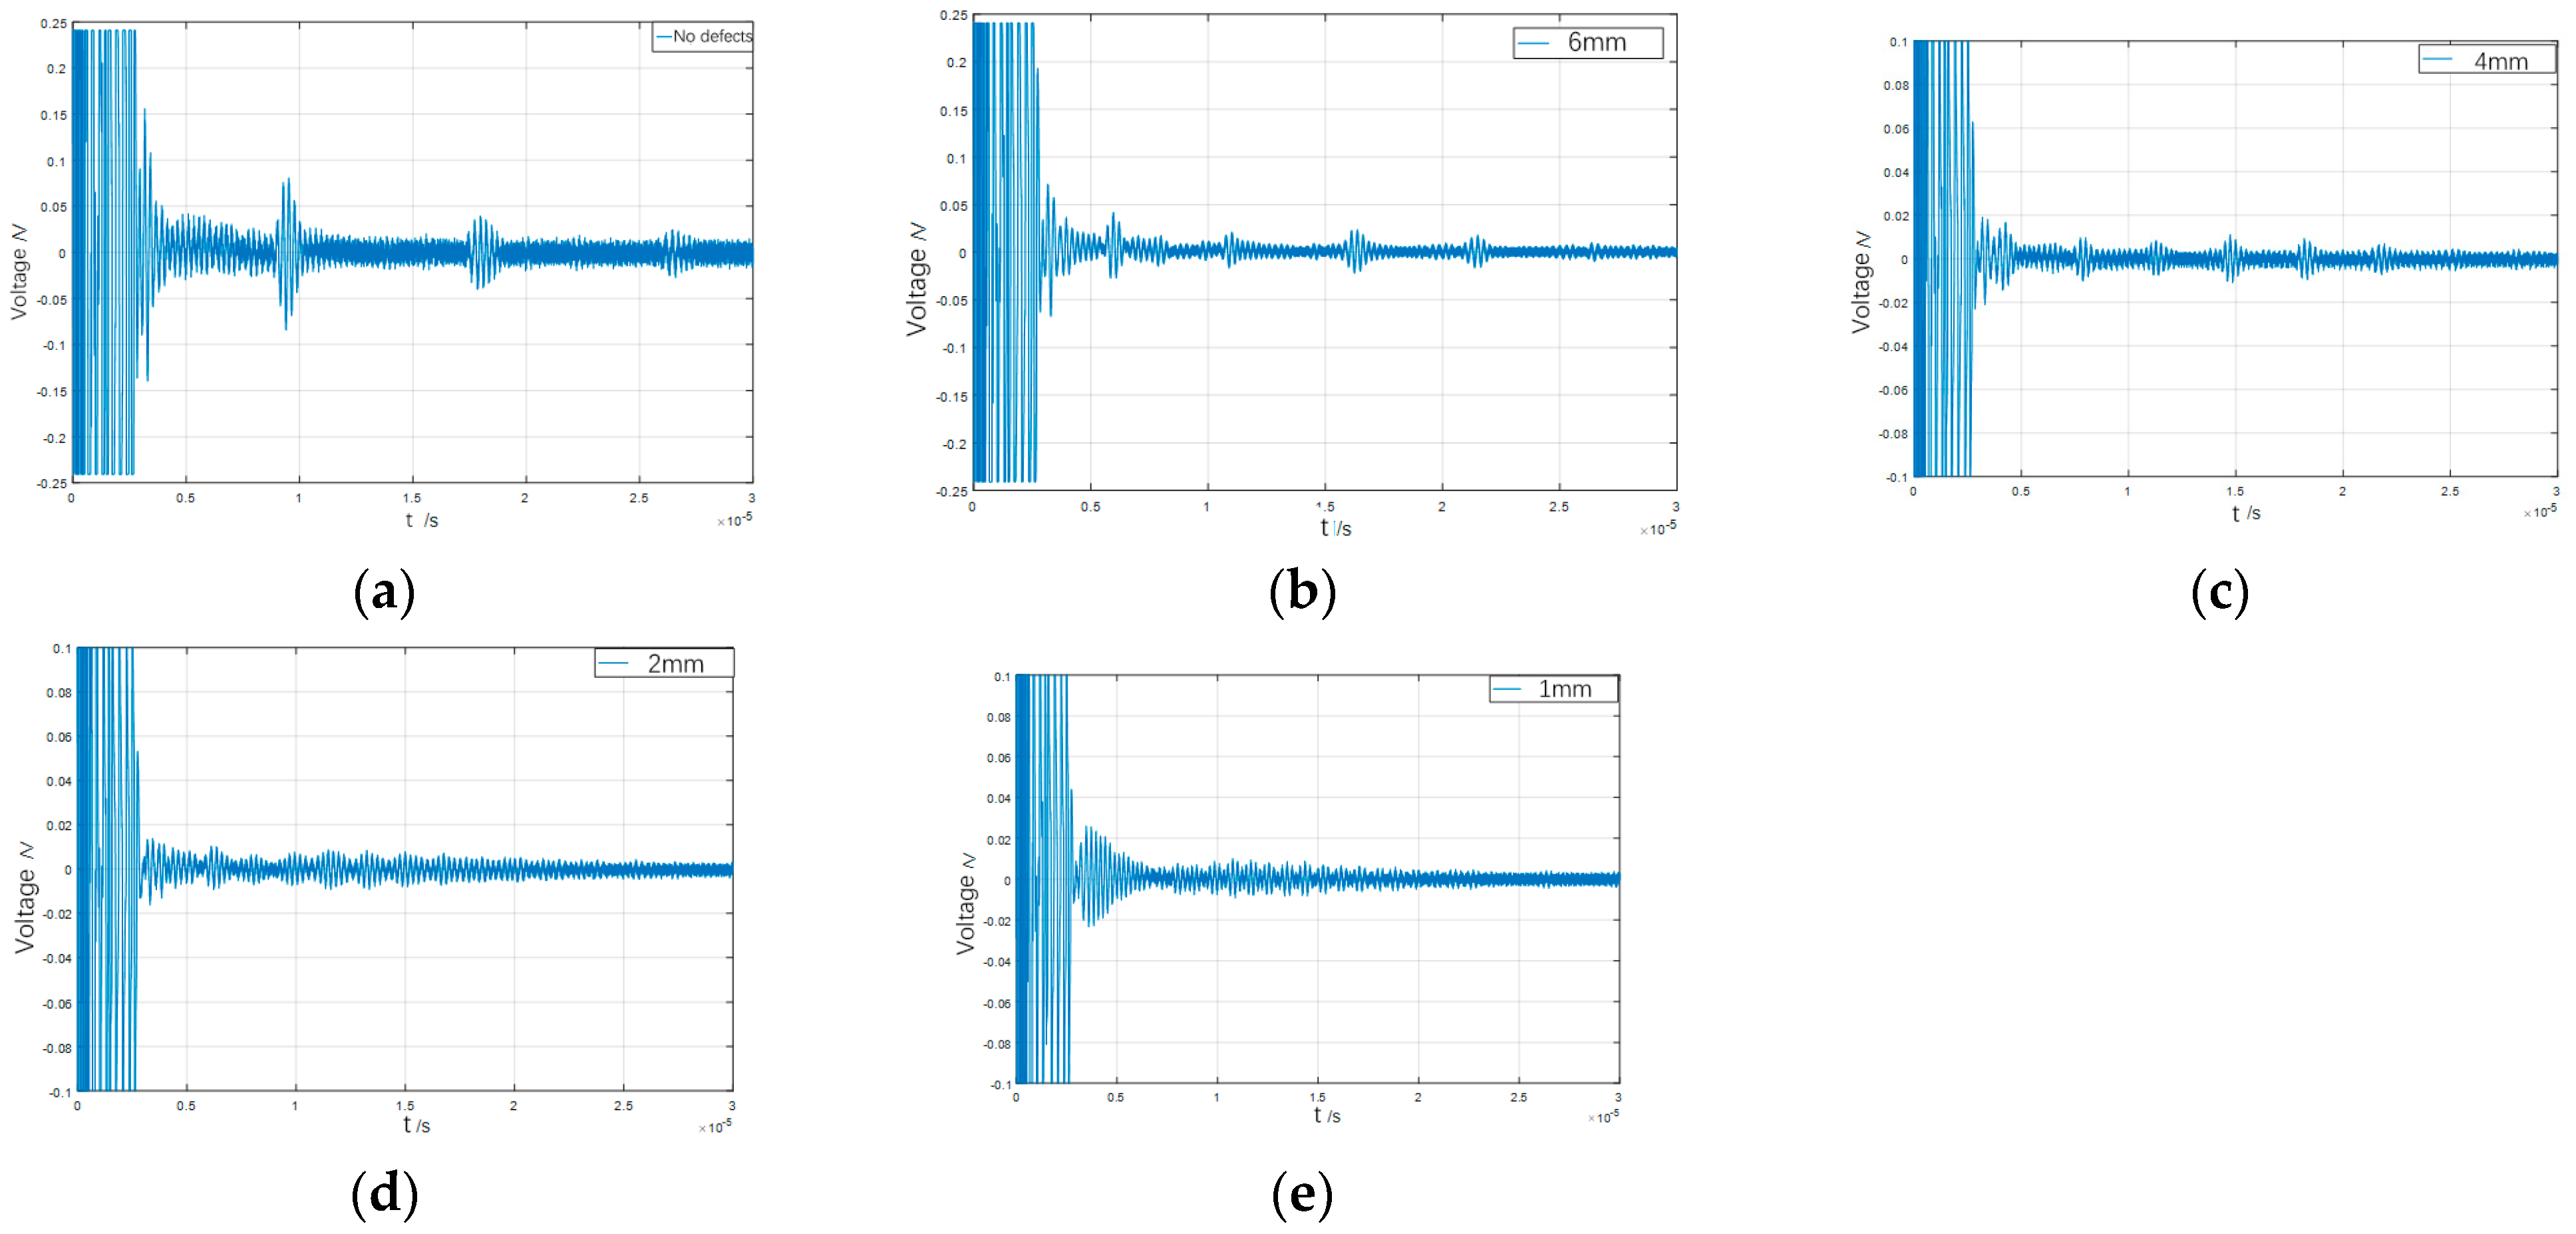
Figure 18.
Electromagnetic ultrasonic detection signals of defects at different distances from the surface: (a) no defects; (b) defect is 6 mm from the surface; (c) defect is 4 mm from the surface; (d) defect is 2 mm from the surface; (e) defect is 1 mm from the surface.
The figure illustrates that the electromagnetic ultrasonic detection signal varies with the defect’s position within the composite detection probe, showing the voltage induced in the detection coil after ultrasonic reflection. As the distance from the defect to the upper surface decreases, the interval between echo voltage signals shortens. When the distance from the defect to the surface exceeds 4 mm, the echo signal becomes clearly distinguishable. This indicates that blind spots in pulsed eddy current testing can be effectively identified using electromagnetic ultrasonic signals. When the defect is 2 mm from the surface, the echo voltage signal begins to overlap. When the defect is within 1 mm of the material surface, the echo signal shows significant overlap, indicating a blind area for electromagnetic ultrasonic testing. The defect position can be estimated using the time interval of the echo voltage signal and the ultrasonic propagation speed, as detailed in Table 3.
Table 3.
Copper plate defect position calculation.
The table indicates that the error for defect position information obtained from the electromagnetic ultrasonic signal is approximately 1%, demonstrating that the limitations of pulsed eddy current testing can be compensated by this method.
6. Conclusions
This study presented the design of a composite nondestructive testing probe, combining pulsed eddy current and electromagnetic ultrasonic technologies, specifically for inspecting marine metal seawater pipelines. Utilizing COMSOL 6.2 finite-element simulation software, a two-dimensional finite-element model of the probe was developed to explore the factors influencing the energy exchange efficiency of the inspection probe. Based on these insights, a composite inspection probe was designed, and its structural design was optimized to enhance the energy conversion efficiency for nondestructive inspection applications.
The findings reveal that the pulsed eddy current testing signal can detect defects on the upper surface of a material and up to 4 mm below the surface. Additionally, defects located deeper than 4 mm beneath the surface can be identified using the electromagnetic ultrasonic signal, effectively addressing the limitations of pulsed eddy current detection in accessing deeper defects. The experimental results confirm that the composite probe is effectively capable of detecting corrosion thinning defects within materials.
Author Contributions
X.Z. writing—original draft, N.L. methodology, J.H. supervision. All authors have read and agreed to the published version of the manuscript.
Funding
This research received no external funding.
Institutional Review Board Statement
Not applicable.
Informed Consent Statement
Not applicable.
Data Availability Statement
The data presented in this study are available on request from the corresponding author. The data are not publicly available due to confidentiality.
Acknowledgments
We thank the Electric Power System Department of the Naval University of Engineering for providing various resources and experimental conditions. We would like to thank the academic editor and the anonymous reviewers for their helpful suggestions and comments.
Conflicts of Interest
The authors declare no conflicts of interest.
References
- Zhang, M. Corrosion causes and protection of marine pipelines. Shanghai Coat. 2010, 48, 52–55. [Google Scholar]
- Ding, S.; Tian, G.; Zhu, J.; Chen, X.; Wang, Y.; Chen, Y. Characterisation and evaluation of paint-coated marine corrosion in carbon steel using eddy current pulsed thermography. NDT E Int. 2022, 130, 102678. [Google Scholar] [CrossRef]
- Datta, S.; Sarkar, S. A review on different pipeline fault detection methods. J. Loss Prevent. Proc. 2016, 41, 97–106. [Google Scholar] [CrossRef]
- Lebrun, B.; Jayet, Y.; Baboux, J.C. Pulsed eddy current application to the detection of deep cracks. Mater. Eval. 1995, 53, 1296–1300. [Google Scholar]
- Yu, Z.; Fu, Y.; Jiang, L.; Yang, F. Detection of circumferential cracks in heat exchanger tubes using pulsed eddy current testing. NDT E Int. 2021, 121, 102444. [Google Scholar] [CrossRef]
- Sun, C.; Yu, Y.; Li, H.; Wang, F.; Liu, D. Quantitative detection for fatigue natural crack in aero-aluminum alloy based on pulsed eddy current technique. Appl. Sci. 2024, 14, 4326. [Google Scholar] [CrossRef]
- Han, Y.; Ding, Q.; Xu, X. Study on the influence of coil placement on pulsed eddy current testing. J. Phys. Conf. Ser. 2023, 2418, 012013. [Google Scholar] [CrossRef]
- Ge, J.; Hu, B.; Yang, C. Bobbin pulsed eddy current array probe for detection and classification of defects in nonferromagnetic tubes. Sens. Actuators A Phys. 2021, 317, 112450. [Google Scholar] [CrossRef]
- Zhang, W.; Sun, H.; Tao, A.; Li, Y.; Shi, Y. Local defect detection of ferromagnetic metal casing based on pulsed eddy current testing. IEEE Trans. Instrum. Meas. 2022, 71, 6003109. [Google Scholar] [CrossRef]
- Xie, S.; Lu, C.; Zhang, L. Quantitative evaluation of deep-shallow compound defects using frequency-band-selecting pulsed eddy current testing. NDT E Int. 2023, 133, 102750. [Google Scholar] [CrossRef]
- Grubin, H.L. Direct electromagnetic generation of compressional waves in metals in static magnetic fields. Ultrasonics 1971, 9, 125. [Google Scholar] [CrossRef]
- Kawashima, K. Quantitative calculation and measurement of longitudinal and transverse ultrasonic wave pulses in solid. IEEE Trans. Sonics Ultrason. 1984, 31, 83–93. [Google Scholar] [CrossRef]
- Zhou, P.; Zhang, C.; Xu, K.; Ren, W. Defect detection of aluminium plates based on near-field enhancement of lamb waves generated using an electromagnetic acoustic tranducer. Sensors 2019, 19, 3529. [Google Scholar] [CrossRef] [PubMed]
- Jin, C.; Ban, Y.; Feng, S. A method for damage detecting of large reflector antennas wheel-rail based on electromagnetic ultrasonic technology. IEEE Access 2024, 12, 54073–54086. [Google Scholar] [CrossRef]
- Piao, G.; Guo, J.; Hu, T.; Deng, Y.; Leung, H. A novel pulsed eddy current method for high-speed pipeline inline inspection. Sens. Actuators A Phys. 2019, 295, 244–258. [Google Scholar] [CrossRef]
- Sun, H.; Feng, Q.; Li, J.; Zheng, F.; Peng, L.; Li, S.; Huang, S.; Xibei, Y. Rail web buried defect location and quantification methods in hybrid high-order guided wave detection. IEEE Trans. Instrum. Meas. 2023, 73, 9501912. [Google Scholar] [CrossRef]
- Renken, C.J.; Selner, I.H. Refractory metal tubing inspection using ultrasonic and pulsed eddycurrent methods: Materials Evaluation. Ultrasonics 1966, 4, 215. [Google Scholar]
- Wang, S.; Gan, F.; Gou, H.; Du, Y. An online monitoring method for high temperature environments combining eddy current testing and electromagnetic acoustic transducer techniques. IEEE Sens. J. 2024, 24, 8682–8693. [Google Scholar] [CrossRef]
- Xie, S.; Tian, M.; Xiao, P.; Pei, C.; Chen, Z.; Takagi, T. A hybrid nondestructive testing method of pulsed eddy current testing and electromagnetic acoustic transducer techniques for simultaneous surface and volumetric defects inspection. NDT E Int. 2017, 86, 153–163. [Google Scholar] [CrossRef]
- Liu, S.; Meng, X.; Zhang, C.; Jin, L. Research on electromagnetic ultrasonic/eddy current composite detection technology for metal material defects. Acoust. Technol. 2018, 37, 43–50. [Google Scholar]


Disclaimer/Publisher’s Note: The statements, opinions and data contained in all publications are solely those of the individual author(s) and contributor(s) and not of MDPI and/or the editor(s). MDPI and/or the editor(s) disclaim responsibility for any injury to people or property resulting from any ideas, methods, instructions or products referred to in the content. |
© 2024 by the authors. Licensee MDPI, Basel, Switzerland. This article is an open access article distributed under the terms and conditions of the Creative Commons Attribution (CC BY) license (https://creativecommons.org/licenses/by/4.0/).