Abstract
The platform–train interface (PTI) is one of the most complex spaces in metro stations. At the PTI, the interaction of boarding and alighting causes a high number of passengers to be present, affecting the boarding and alighting time, among other variables related to safety and efficiency. This research was performed to develop a multidimensional level of service for passengers by means of observing existing stations. The methodology included five dimensions of the level of service (passenger behaviour, train design, passenger characteristics, train operation, and platform built environment), and detection techniques based on a tracking system. The stations are operating urban services in Valparaiso Metro (Chile). The results show that there is a relationship between the speed of passengers and the detected passengers, among other variables. In addition, the dispersion of passengers is analysed at the PTI. Further research will include other types of stations and conditions.
1. Introduction
In developing cities such as Valparaiso (Chile), metro stations are reaching a high level of interaction, generating an increase in the density in spaces such as platforms or inside the train [1]. Similarly, in other developed cities such as London (UK), more than 3 billion interactions happen each year in the railway system due to the high congestion in the boarding and alighting process [2]. The high interaction of passengers in the boarding and alighting process affects the efficiency and safety of the whole system. For instance, if the number of passengers increases, then the boarding and alighting time goes up, impacting the level of service, especially the capacity of the station [3].
The most complex space in metro stations is the platform–train interface [4,5], in which the interaction between passengers is affected by the formation of flow lanes, the distance between passengers, and their distribution, among other variables affecting the level of service in the boarding and alighting process. As shown in Figure 1a, passengers interact with other passengers who are waiting to board the train on the platform. Similarly, passengers interact with the train design and platform built environment (e.g., trash bins, ramps, yellow safety line, seats, handrails, train doors) (see Figure 1b).

Figure 1.
Platform–train interface in Valparaiso Metro: (a) platform; (b) inside the train.
To study the interaction between passengers, the level of service can be used, which is based on variables such as flow, density, and speed of passengers [6]. The level of service, referred to as LOS, can be analysed in walkways, stairs, and queue areas. The LOS is used as an indicator to determine the congestion at the platform–train interface. Although this indicator is commonly used, differences are presented in the LOS according to the type of passenger, culture, and other factors [7,8], and therefore, it is necessary to study the flow, density, and speed from the perspective of passengers and their experience, which is more representative of the interaction of passengers at the platform–train interface than the average or overall values of the LOS [9,10].
To solve the above problem, detection techniques have been developed to identify each passenger, and therefore to identify where and how passengers are moving on the platform or inside the train [11,12]. Therefore, the detection techniques allow us to identify the level of service by determining variables such as flow, density, and speed from the perspective of passengers and their experience, which is the aim of this study, focused on overground metro stations. For this, it is necessary to identify the variables that affect the level of service inside the train or on the platform in metro stations. To do so, detection techniques through video cameras were used to measure the number of passengers and their characteristics (e.g., height). Through this, we analyse the relationship between variables, and identify if there are significant differences between them that may affect the efficiency and safety of metro systems.
The present paper is structured into five sections. The second section describes the existing studies related to the level of service in metro stations, followed by the method based on detection techniques (Section 3). In Section 4, the results are analysed, and a discussion and conclusion are presented in Section 5.
2. Existing Studies Related to the Level of Service in Metro Stations
The level of service of pedestrians has been studied for the last 50 years. The first studies [13,14] were conducted by observations such as videos or photographs in which pedestrians were represented as fluids or particles. This type of representation is called macroscopic, in which pedestrians are analysed in a global view by three main variables: speed, density, and flow. Therefore, this representation is simple to use for standards and it culminates in a graphical representation of the results such as videos, tables, and maps.
Fruin [6] defines 1.43 m/s (5.15 km/h) as the free-flow speed of a pedestrian when there is a unidirectional flow and 1.36 m/s (4.9 km/h) when there is a bidirectional flow. In addition, the author states that the average speed of pedestrians is directly related to the free-flow speed and the density, which is defined as the ratio between pedestrians and the total area. Since then, different studies have been conducted to analyse the walking speed of pedestrians and its relationship to density. All these studies have been compared to the well-known relation between walking speed and density proposed by Weidmann (1993) [15], where the jam density reached a value of 5.4 passengers/m2. The free-flow speed for pedestrians is defined as 1.34 m/s. However, this free-flow speed can vary among types of pedestrians. For example, shoppers have a free-flow speed of 1.04 m/s, commuters 1.45 m/s, and tourists 0.99 m/s.
Another study of bidirectional corridors at Hong Kong MTR stations presented a walking speed at free flow of 1.37 m/s and 0.61 m/s at capacity [16]. The authors compared these values to bidirectional corridors in London Underground (LU) stations, in which the walking speed at capacity was 0.6 m/s. Moreover, Jelić et al. [17] calculated instantaneous Fundamental Diagrams, in which the instantaneous density is defined as the inverse of the spatial headway (number of passengers/m) and the instantaneous velocity is a function of the headway. The authors found that pedestrians avoid other pedestrians and they adapt their speed to the following pedestrian. As a summary, Daamen et al. [18] reported Fundamental Diagrams based on three main variables: speed, density, and flow. Fundamental Diagrams are important tools to evaluate if a space such as the train and the platform in metro stations are congested [19].
In relation to density and speed, Daamen et al. [18] reported that if the density increases, then the speed will decrease almost linearly. However, this type of linearity is not produced for the flow. This variable (flow) is defined as the ratio between the number of pedestrians and time per metre of section. For instance, if we look at Fruin’s curves, it can be seen that if the density increases, the flow will also increase to its capacity, which is reached at approximately 1.3 passengers/m-s. At this point, the density is almost 2.0 passengers/m2. This value of density generates two new zones: zone 1 (unsaturated) and zone 2 (oversaturated). These new zones are related to the concept of saturation flow, which is defined as the flow divided by the capacity.
Another example of a macroscopic method is the use of Fruin′s level of service or LOS, which indicates the degree of congestion and conflict in an area (flat areas, queues, or stairs) using general parameters such as speed, density, or flow. As reported by Feng et al. [20], Fruin studied the behaviour of passengers in existing stations, in which the objective of the LOS was to obtain the capacity of a path. If the space is reduced, then the flow will reach capacity and then passengers’ movement will be reduced. The author considered two different types of pedestrians: commuters and shoppers. As a result of the observations, the LOS was classified into different levels. For example, the LOS in walkways goes from Level A (free flow with no conflicts) to Level F (critical density, sporadic flow, frequent stops and physical contact), where Level E is equal to capacity. The LOS can be obtained similarly in waiting areas and stairs. In other words, with the LOS, any macroscopic representation will only need the number of pedestrians to determine what space (e.g., width of platform) is needed [21,22].
The LOS is an important tool to identify problems of congestion in walkways, waiting areas, and stairs. However, the LOS is based on a global view or macroscopic, in which the flow of pedestrians is understood as “fluid dynamics”, i.e., pedestrians are analysed only by physical variables already explained before (speed, density, and flow). Moreover, some authors [23] state that pedestrians are not like fluids, and they must be analysed by taking into consideration each individual’s characteristics and preferences, because individual pedestrians can overtake (pass each other), be stuck in a bottleneck, or move in different directions.
With respect to density in metro stations, it seems that using general values of densities (overall number of passengers in a physical space such as a platform) is not the ideal way to measure the interaction between passengers. According to Banerjee et al. [24], it is necessary to identify where and how passengers are moving in these spaces to better analyse the interaction between them. Moreover, an interaction index could represent the level of service in metro stations which could be divided into different locations such as exits, stairways, corridors, and open areas [25]. According to [26], the headway of trains and the location of the ticket purchase affect the volume of passengers, and therefore the level of service. In the case of the Shangai metro system, ref. [27] measured the speed and flow in walkways and stairways, which was affected by the space used by passengers. Other studies [28] obtained the speed, walking time, flow, and density of passengers, taking the Swiss Federal Railway as a case study. Recent studies [29] have shown the use of online data to study the level of service in metro stations. In [30,31], the authors studied boarding and alighting behaviour, and their effect on the dwell time, in which passengers boarding while alighting was in process affected the level of service of passengers. According to [32], the interior of the train layout (e.g., handrails or seats) may affect the number of touches as well as the density inside the train (e.g., crowding), which is related to the level of service. Similarly, the seat layout inside the train carriage may affect capacity, and therefore the level of service [33].
Despite the relevant research reported in the literature, there is a lack of studies related to metro stations in the context of developing cities such as Valparaíso, in which the level of service should be analysed according to the passengers’ characteristics and perspectives.
3. Method
3.1. Metro Stations in Valparaíso
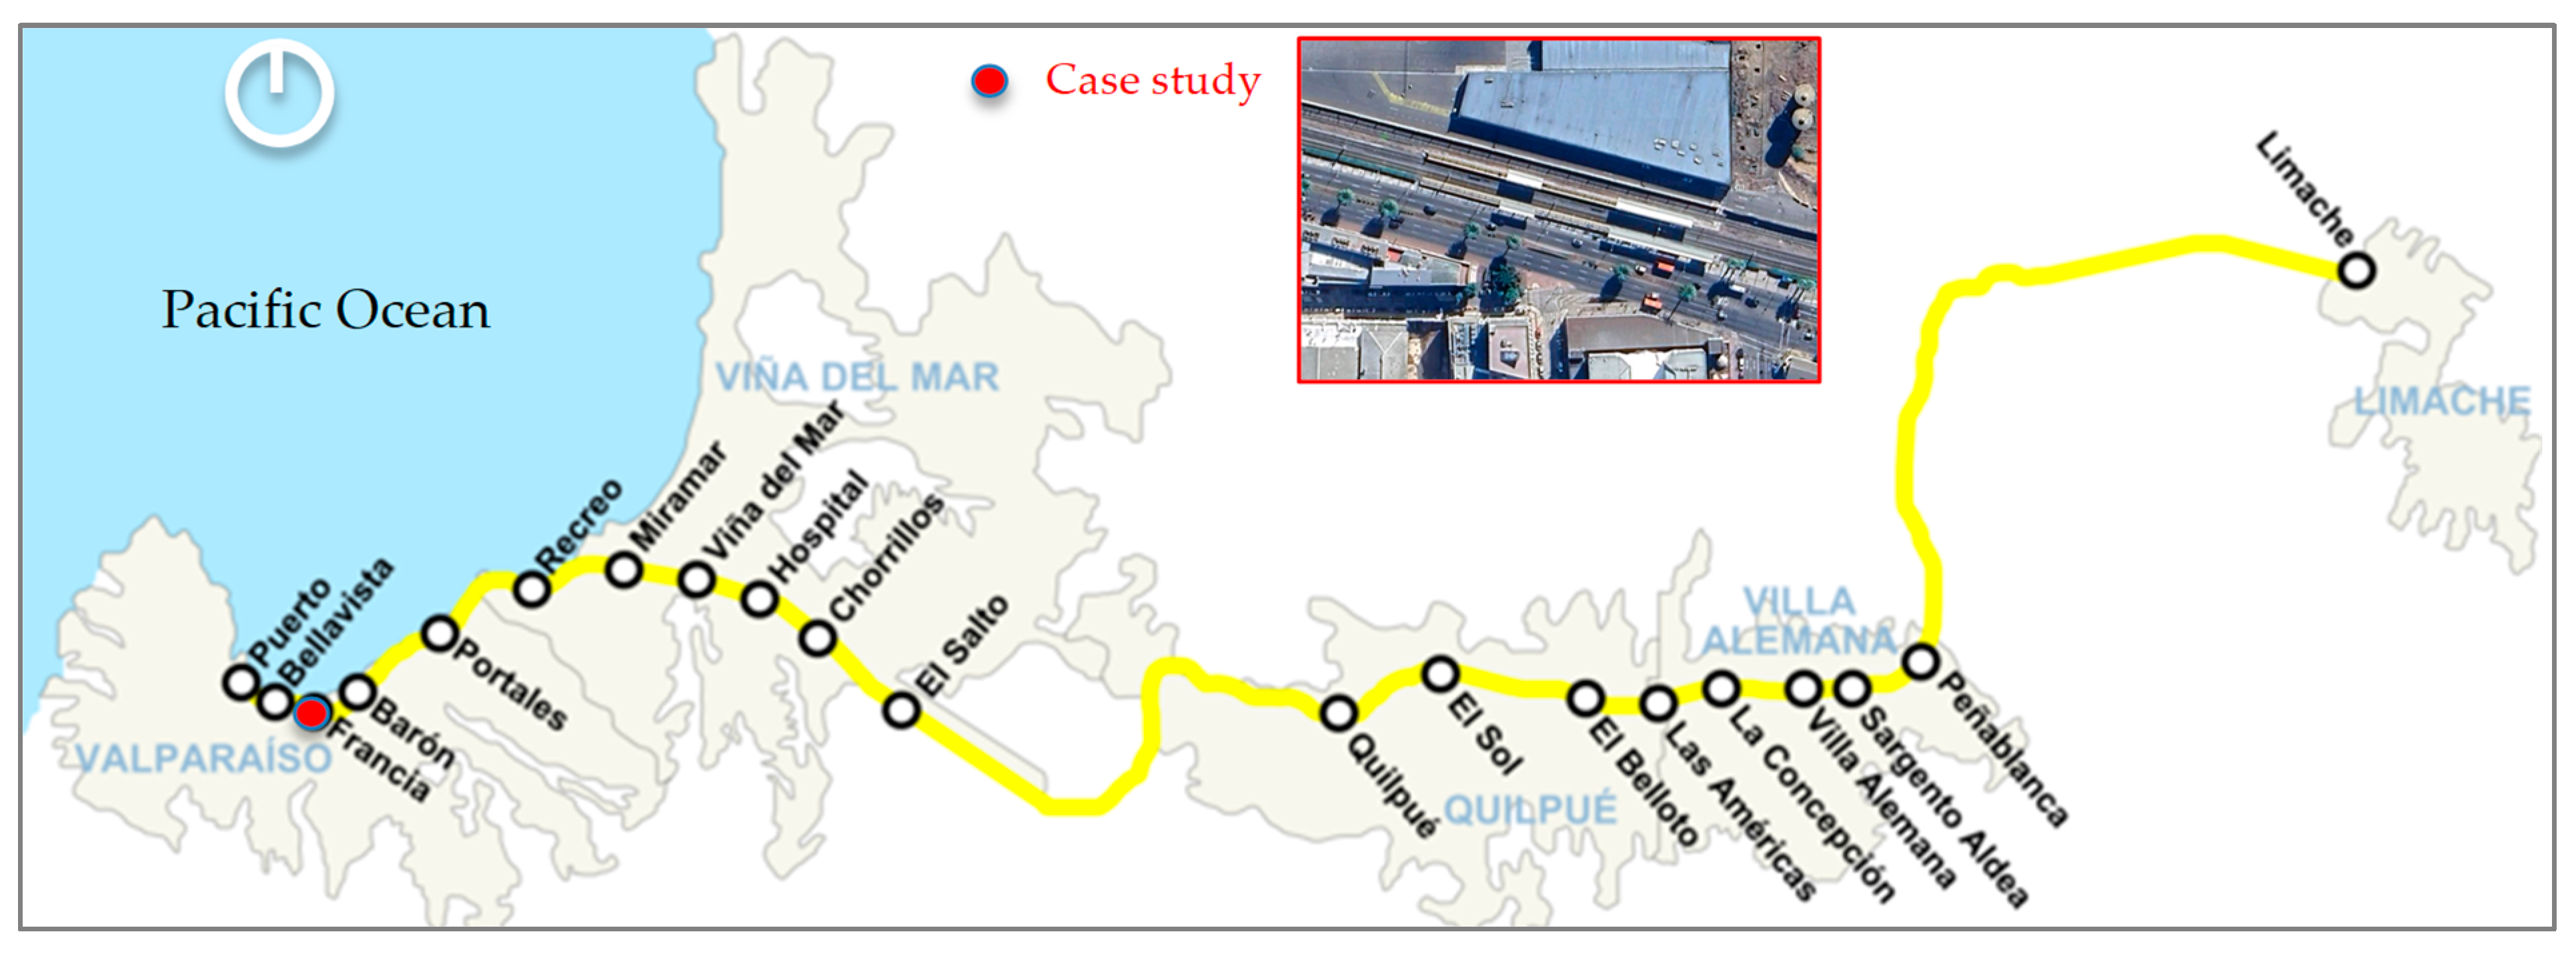
To study the level of service, a sample of videos was recorded in Estación Francia, which is a very busy overground station in the network representing more than 4 passengers per square metre in the peak hour. This study is focused on urban services in the coastline of Valparaíso (from Puerto station to Chorrillos station). It is important to highlight that Francia Station was chosen as a case study due to the high level of demand, reaching almost 1 million passengers per year. The network reaches more than 20 million trips per year, considering 20 stations in 42 km from the coast to the countryside in Valparaiso, Chile [1] (see Figure 2).

Figure 2.
Network in Valparaiso Metro.
The train in Valparaiso Metro is an Alstom model, 46 m long by 3 m wide. The capacity is equal to 376 passengers, assuming that all seats are occupied and the density is equal to 4 passengers/m2. The layout is composed of 12 train doors, 104 seats, vertical/horizontal handrails, a corridor, and a central hall in front of each train door (see Figure 3).

Figure 3.
Train layout in Valparaiso Metro (Xtrapolis modular) and area captured by the camera used inside the carriage.
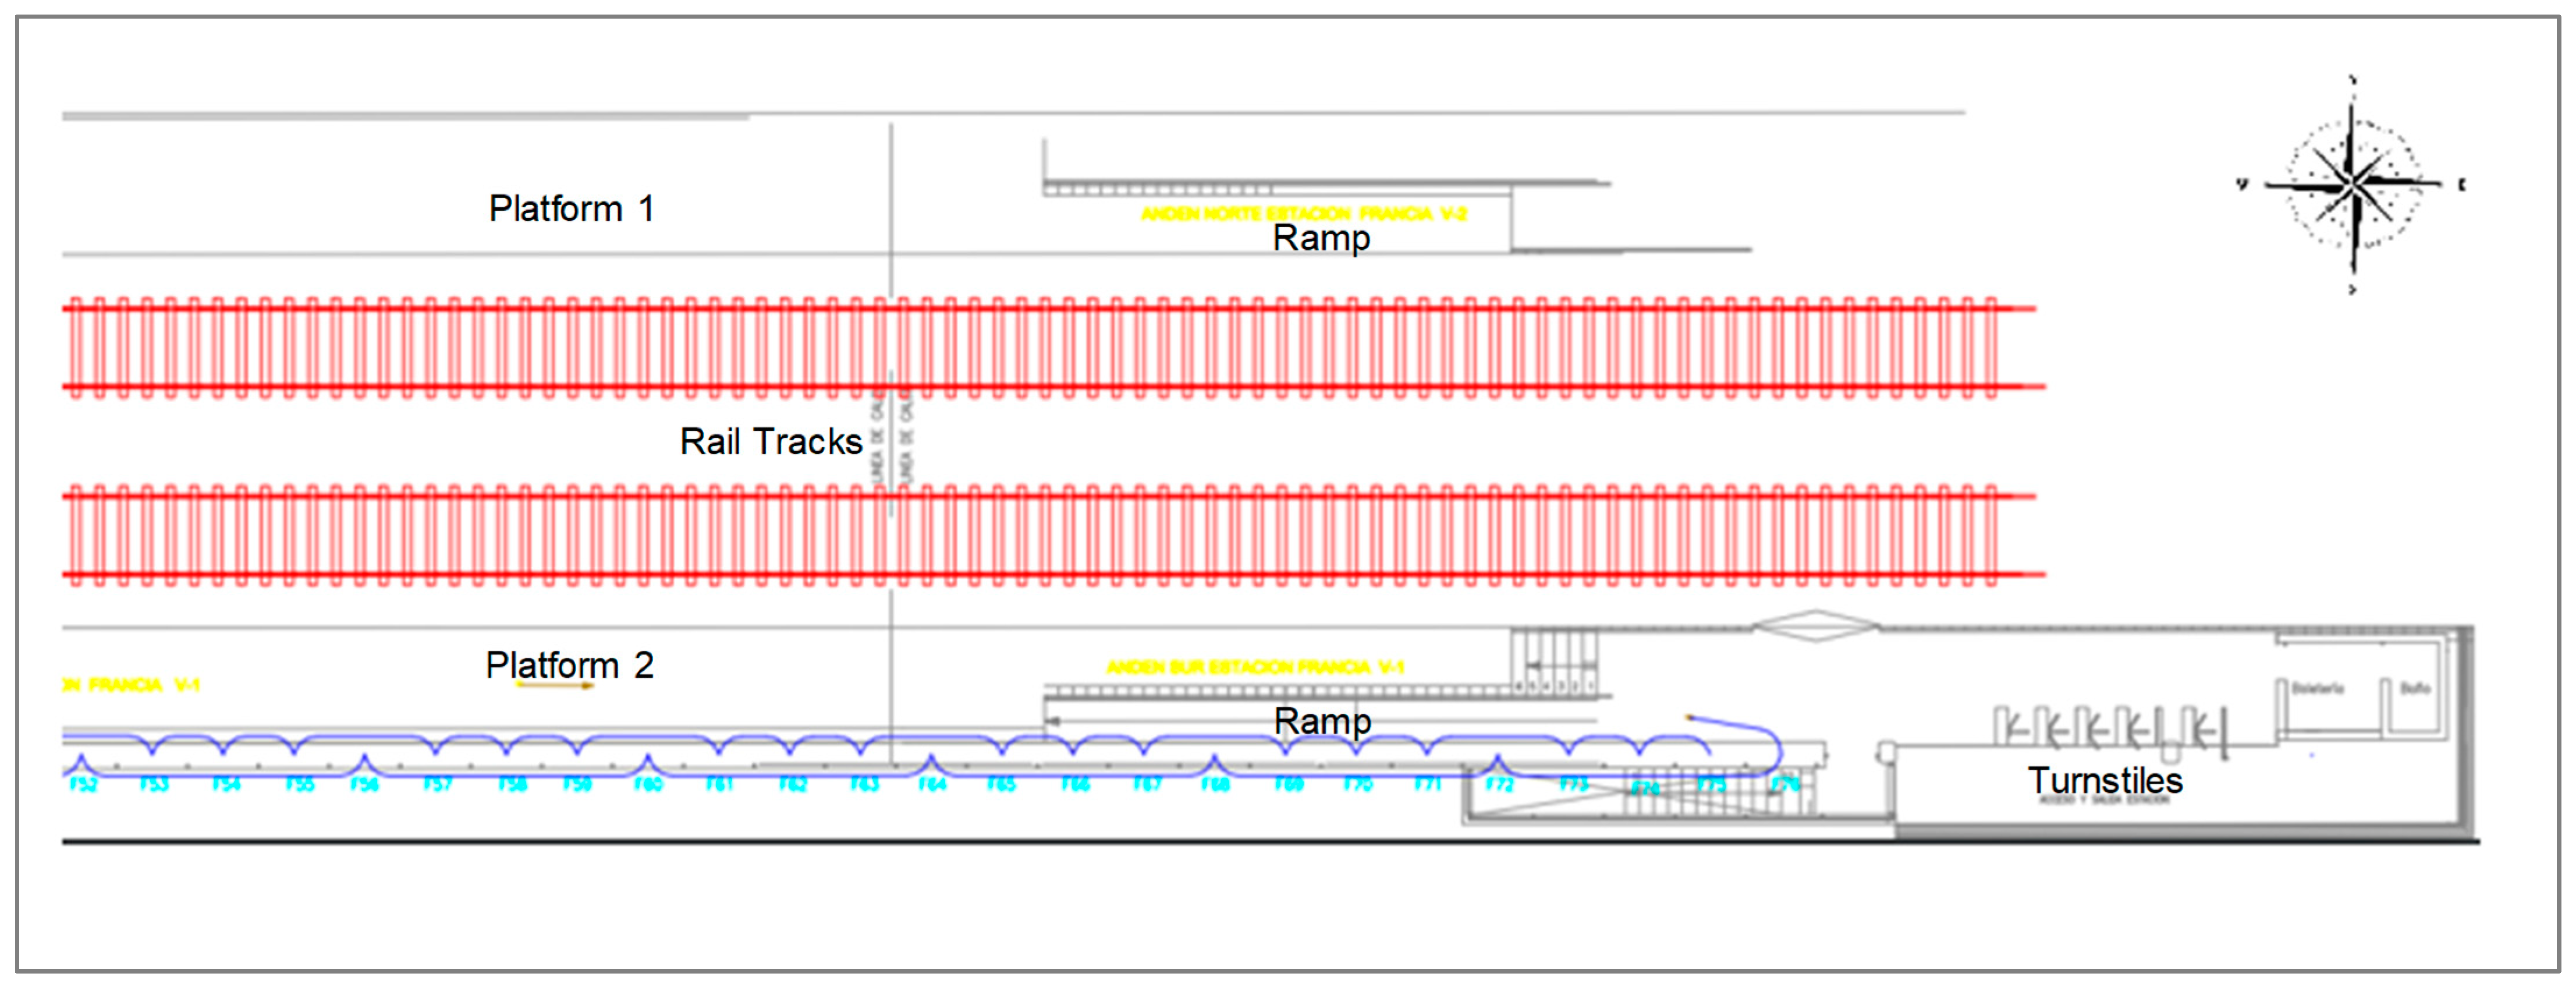
The platform at the observed station is 142 m long by 3 m wide. In addition, bins and benches are used at the border of the platform. As an example, Figure 4 shows the layout of the platform at Estación Francia.

Figure 4.
Platform section in Estación Francia, Valparaiso Metro.
3.2. Observations inside the Train and on the Platform
The observations were carried out during August and October 2023 at the peak hour (7:00 a.m. to 8:00 a.m.). The cameras were located on the ceiling of the platform station and inside the train at the end of the train carriage. In the Francia Station, passengers were mostly students and commuters who regularly used the metro system in Valparaíso. Most students use the metro system from or to different universities (i.e., they use backpacks), which is closer to the Francia Station. Inside the train, three spaces were defined:
- Seats.
- Central hall (in front of the train doors).
- Corridors.
To count the number of passengers inside the train and on the platform, a tracking tool based on Yolo codes was used [12]. For this, the cameras were calibrated using some virtual points. The calibration points were chosen based on the area of analysis. As an example, in Figure 5, points 16-18-19-20-15 represent a group of 3 seats, while points 6-17-16-13-12-9-8-7 represent the central hall in front of the train doors. The corridor is represented by points 13-14-23-20-15-16. If a passenger is detected within those points (shown in a blue rectangle), then this passenger is located in the corresponding areas inside the train and their trajectory is registered (shown in a blue line).

Figure 5.
Calibration points inside the train using the cameras in Valparaiso Metro.
Cameras were located on the ceiling at the end of the train carriage (inside the train). Therefore, 6 seats were detected (seats in groups of 3 represented 0.66 m2), one central hall of 2.6 m wide by 2.0 m long (5.2 m2), and one corridor of 0.90 m wide by 3.2 m long (2.88 m2).
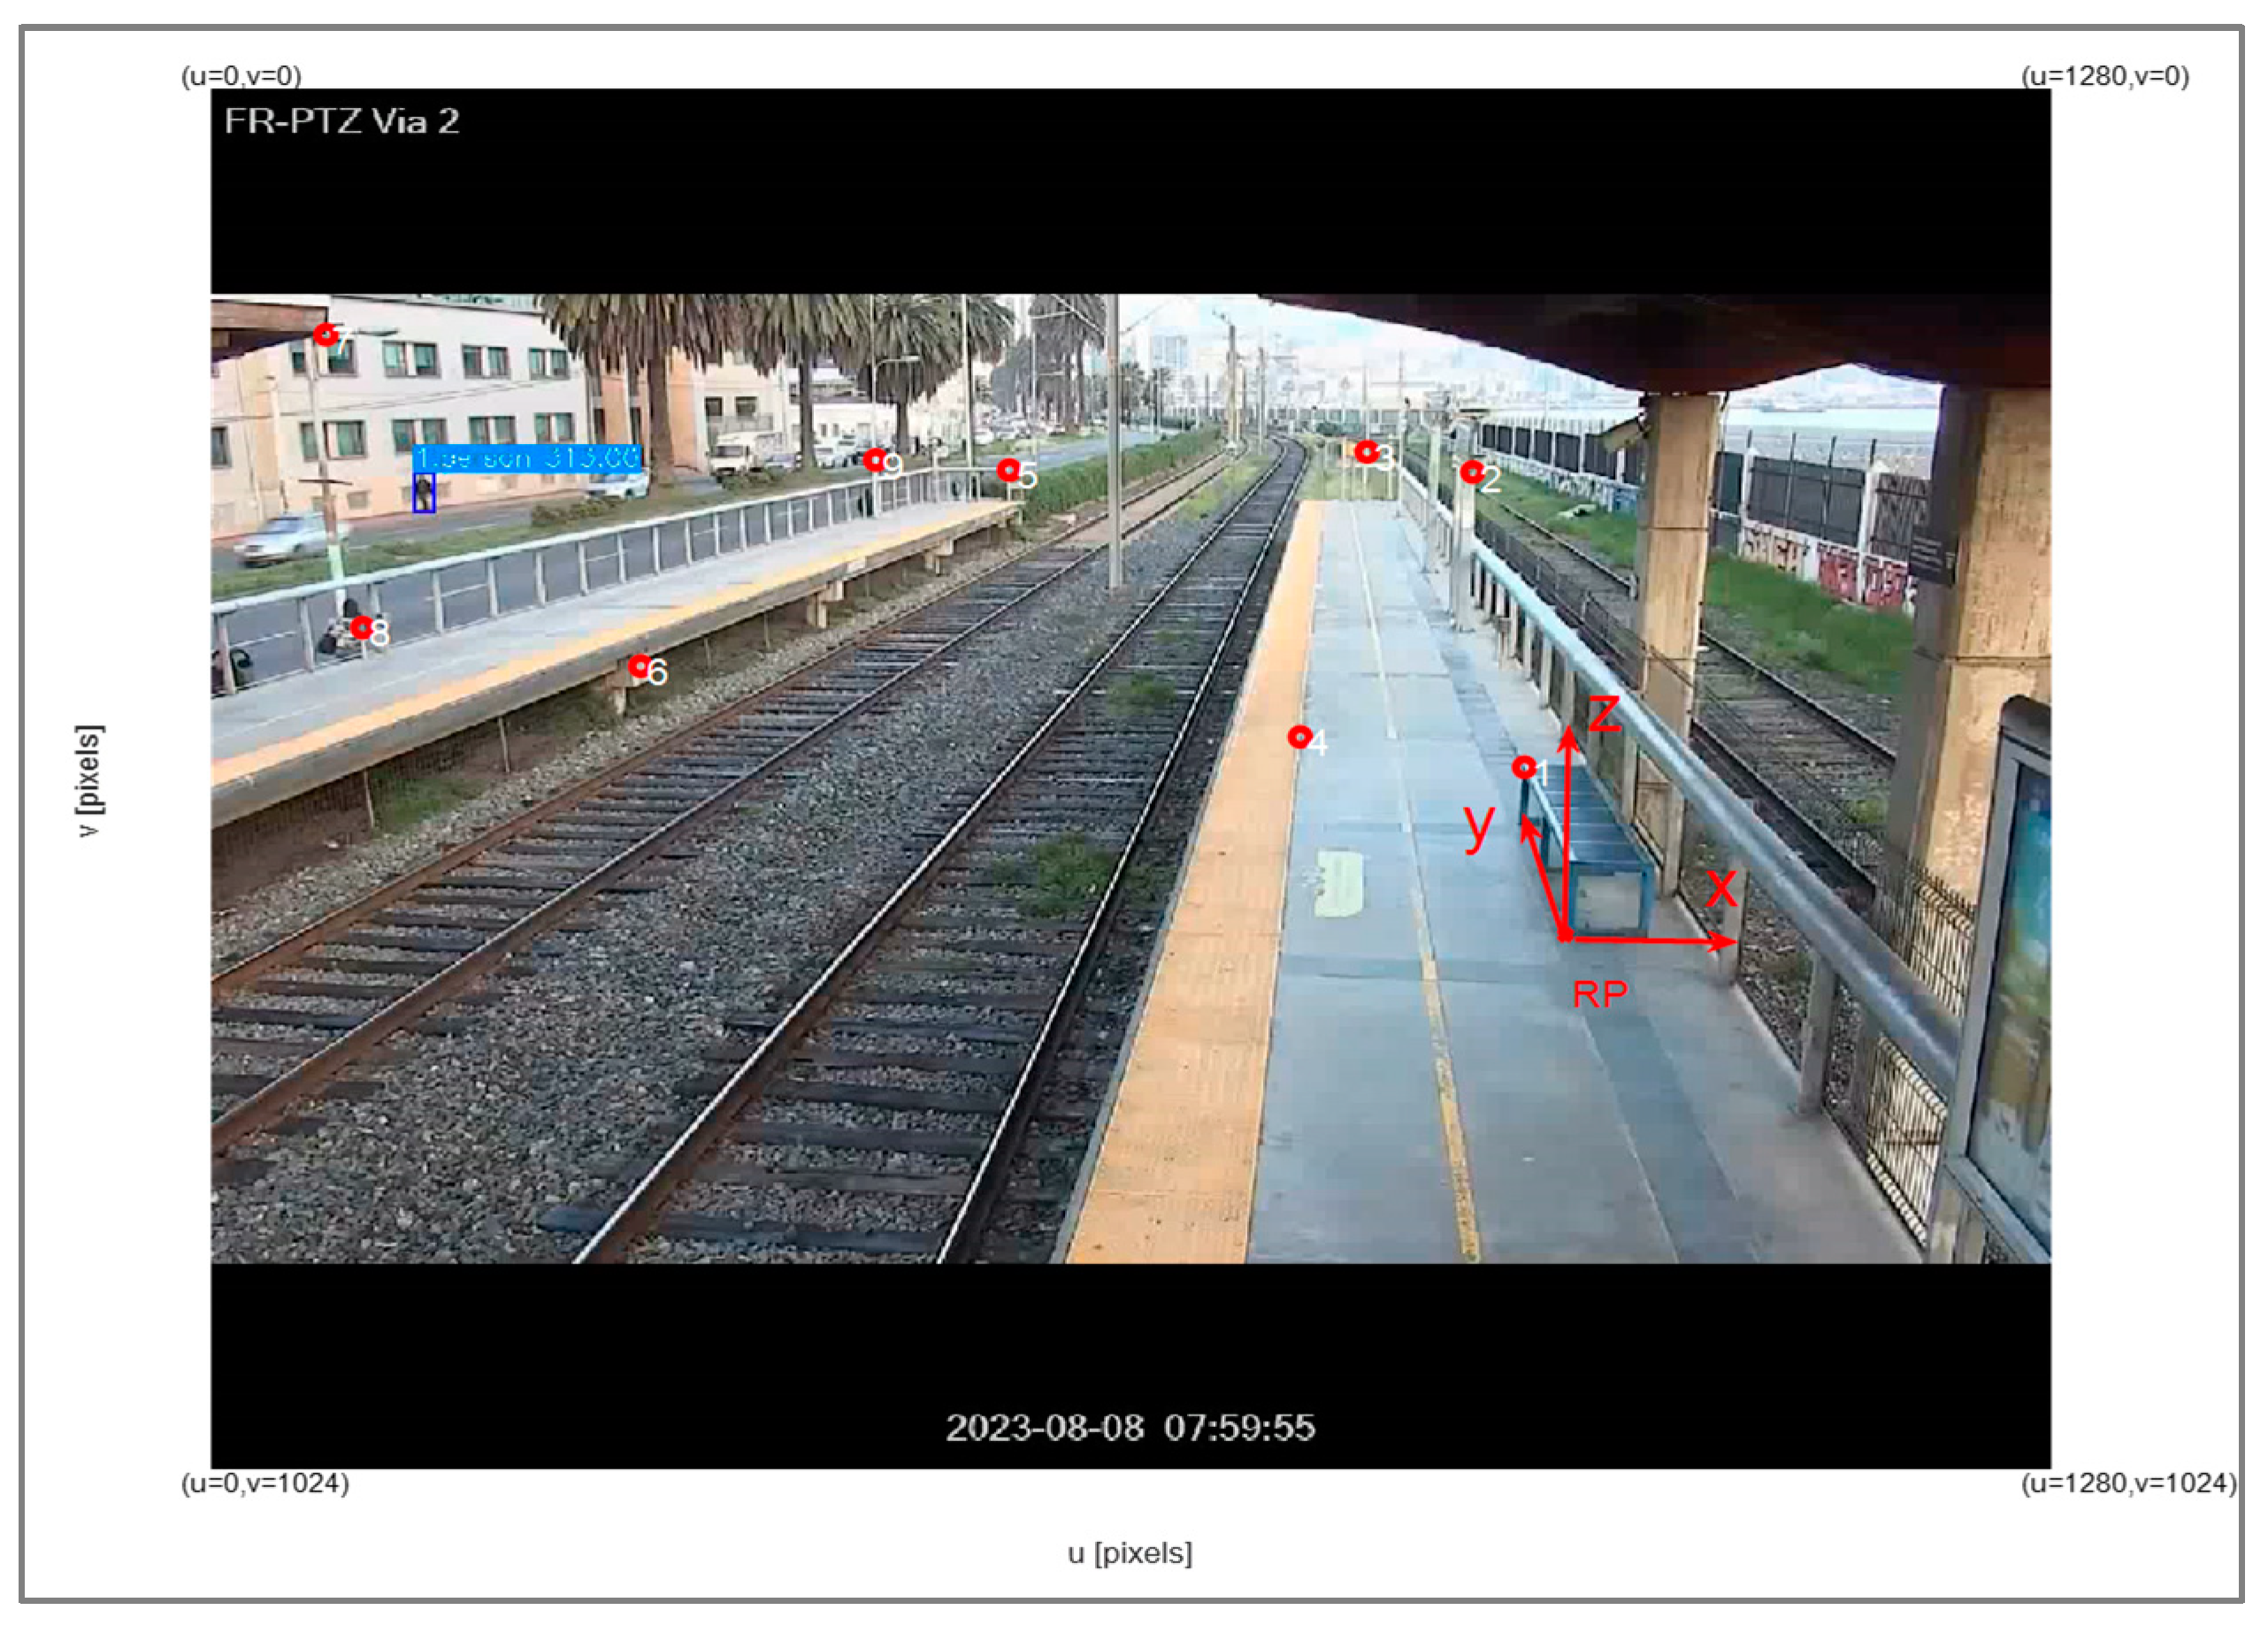
Figure 6 shows the calibration points needed at the platform before using the detection tool. For instance, passengers could be walking next to the benches or bins (or closer to the edge of the platform), which may affect the level of service. Cameras were located at a 4 m height just next to the shelter on the platform (see Figure 6).

Figure 6.
Calibration points on the platform using the cameras in Valparaiso Metro.
Cameras on the platform and inside the train used a continuous time lapse. It is important to highlight that 5–20 frames per second (fps) were registered as an output of the video cameras. In the case of the train, a Gopro camera was used (GoPro, Inc., San Mateo, CA, USA), while a stationary security camera was used on the platform.
3.3. Tracking Technique
Detection and tracking are implemented with the algorithm YOLOv7 (2024) [34], an open-source software, consisting of an arrangement of convolutional neural networks, trained to detect objects, based on the public dataset MS COCO [35]. Images from a video are fed into it, returning bounding boxes and tracking information of persons and trains. The software is able to assign an identification number to different persons and keep them until they disappear from the scene. Bounding boxes are characterised by four vertices, defined in pixels, from where the precise location of the object can be defined. One approach to perform analysis such as location, speed, or other statistics is to declare the location of the object in a single point. One approach is to select the middle point between the two lower vertices, and others could be the centroid, or middle point between the upper vertices.
Data delivered by YOLO are then processed to obtain specific information about the passengers or trains. A smoothing preprocessing step is advisable to reduce slight variations in the bounding box coordinates. Based on [36], a Kalman filter is applied to the position coordinates to obtain smoothed position and speed, which also allows for gaps in the data to be filled with estimated data when a person leaves the frame for a few sample times.
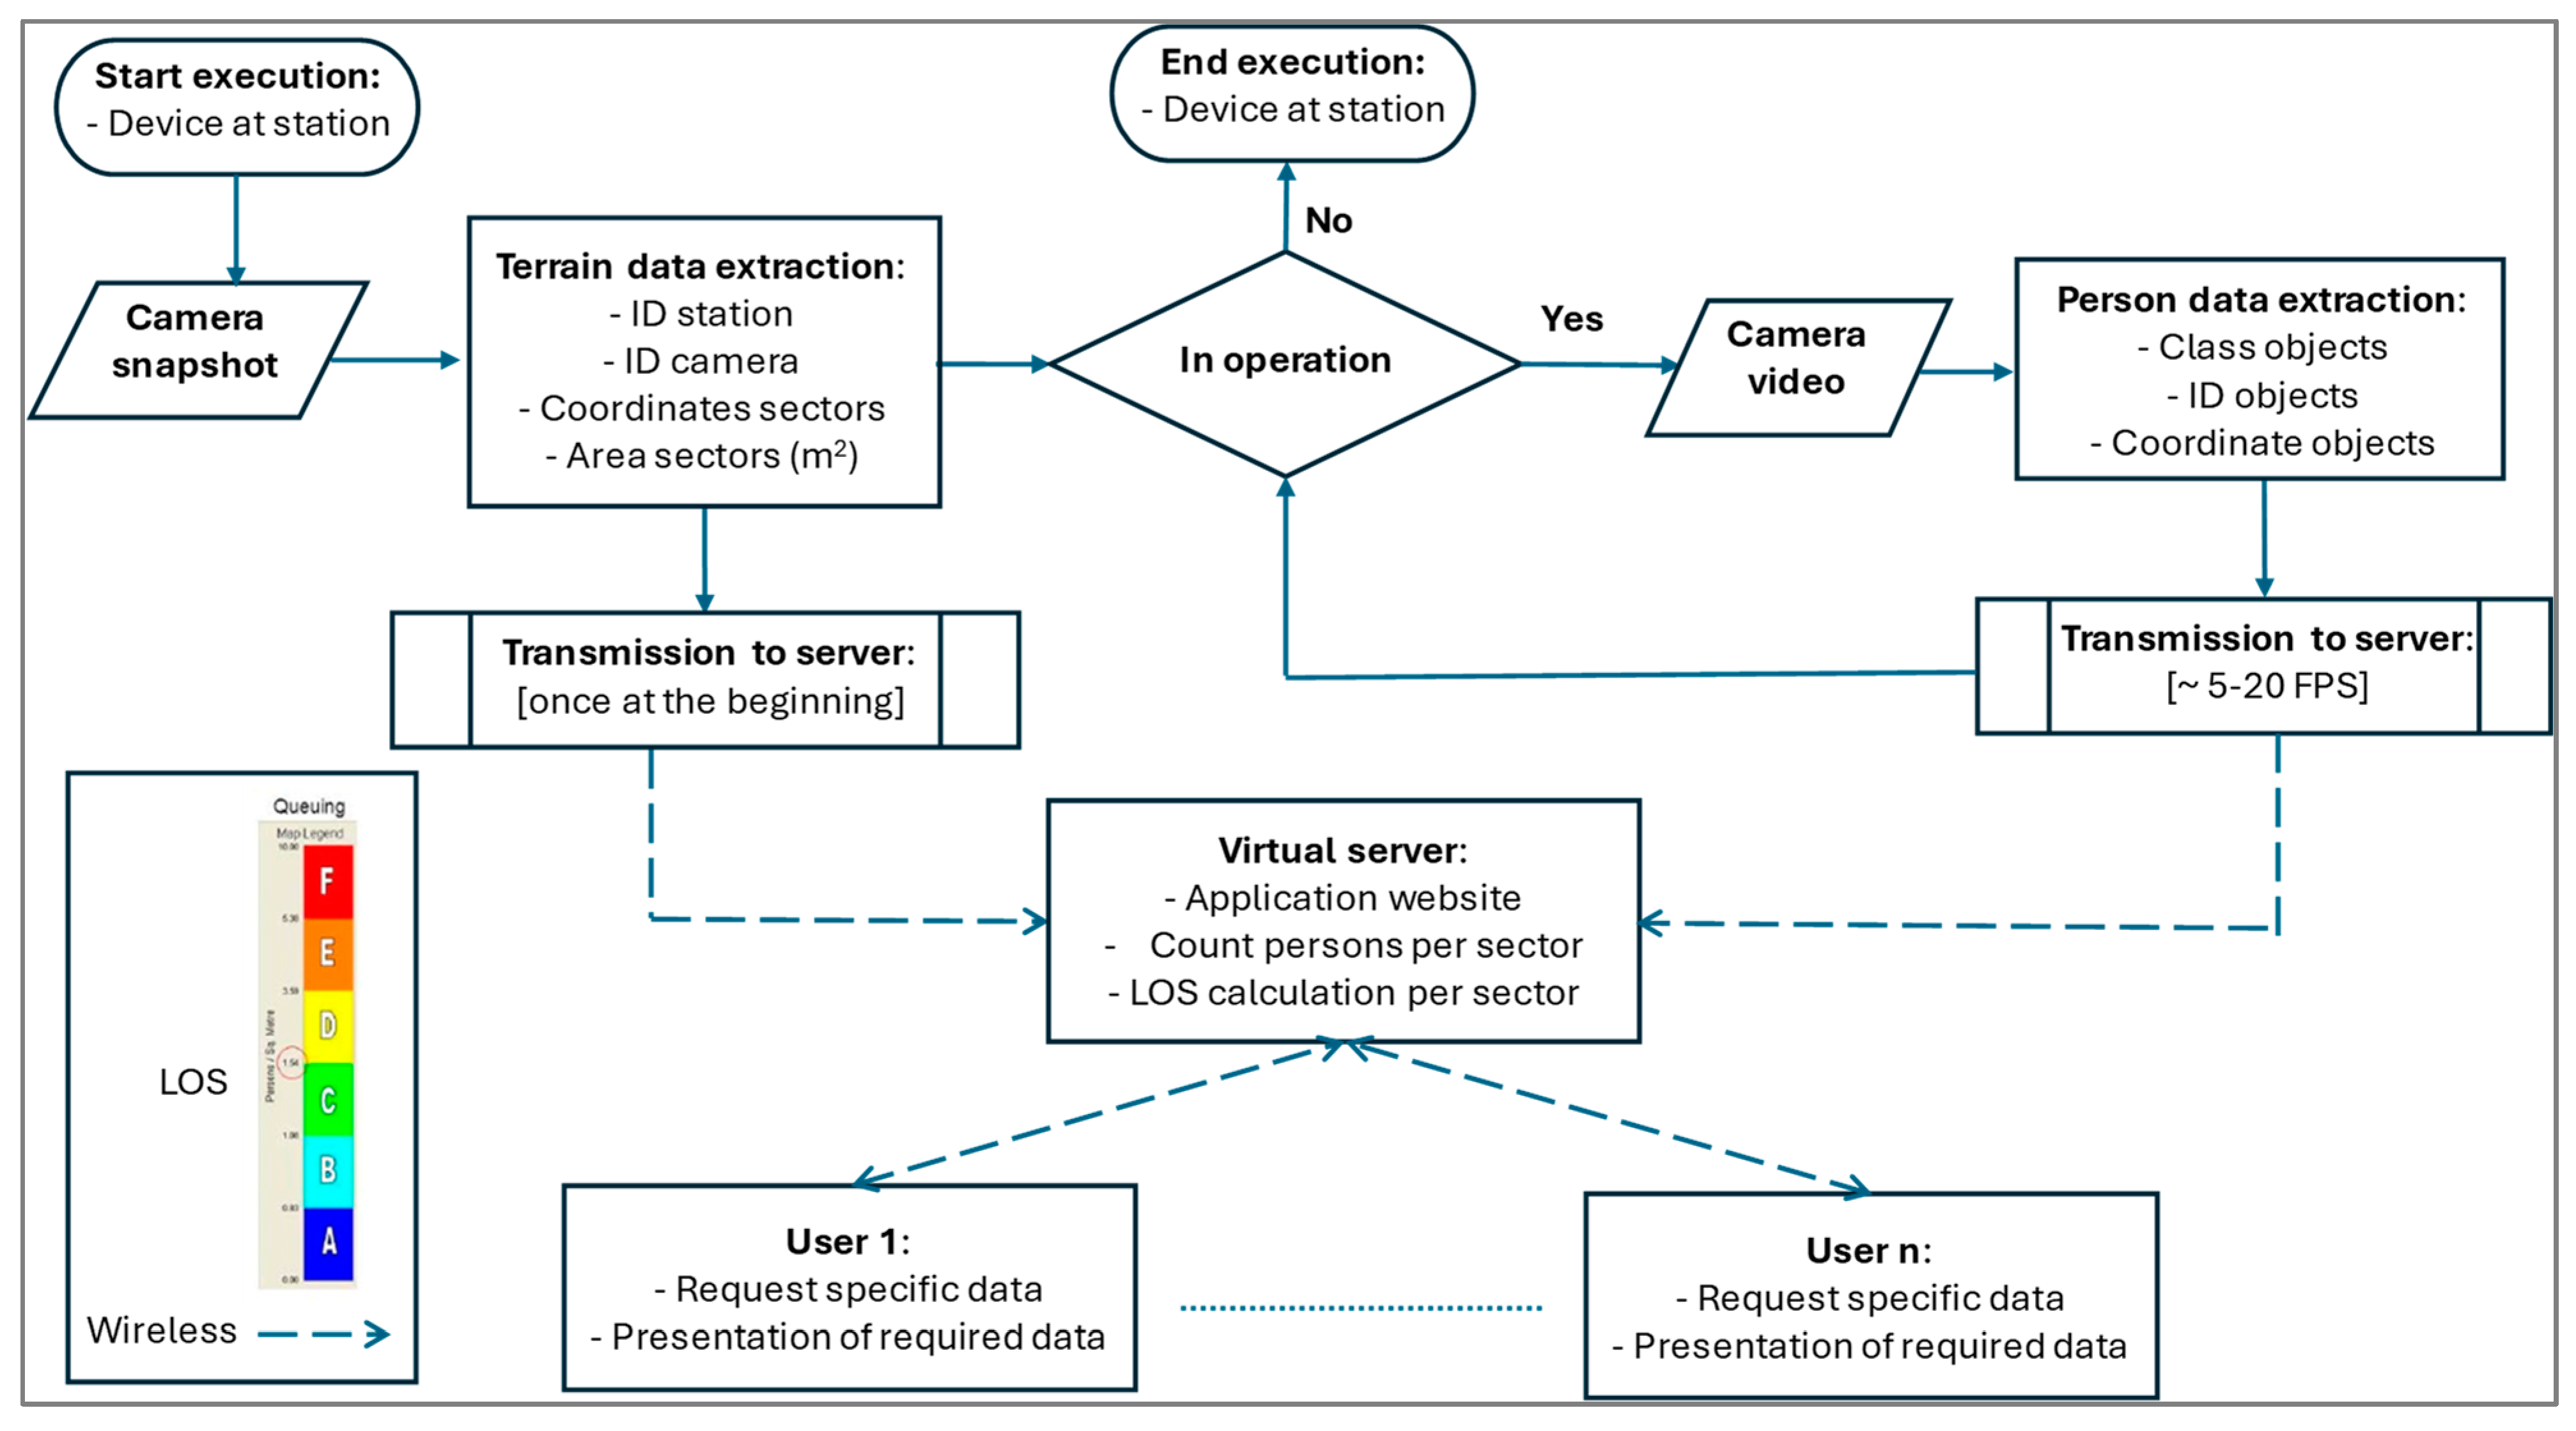
An important processing step consists of determining the number of passengers in different sectors of the station in real time. This is obtained by defining sectors of interest, such as platforms, rails, and crossings, in the images before running the YOLO algorithm. As the camera remains in a static position, this is conducted just once, manually or automatically, and returns the fixed pixel coordinates of all sectors. Then, during operation, a logic based on geometry and trigonometry is used to determine the presence of all detected persons in each of the sectors, which in turn allows us to keep a counting number. This is very useful to provide station managers and safety people with quick information on the accumulated number of persons and whether or not it could surpass a given threshold. Therefore, the LOS was used as an indicator to identify the congestion and conflicts on the platform or inside the train carriage. The inputs used to determine the LOS were based on the speed and the number of passengers detected. These variables were obtained from the new model defined in the Results section using video cameras (see Figure 7).

Figure 7.
Sequence used to track passengers on the platform and inside the train.
4. Results
4.1. Descriptive Analysis
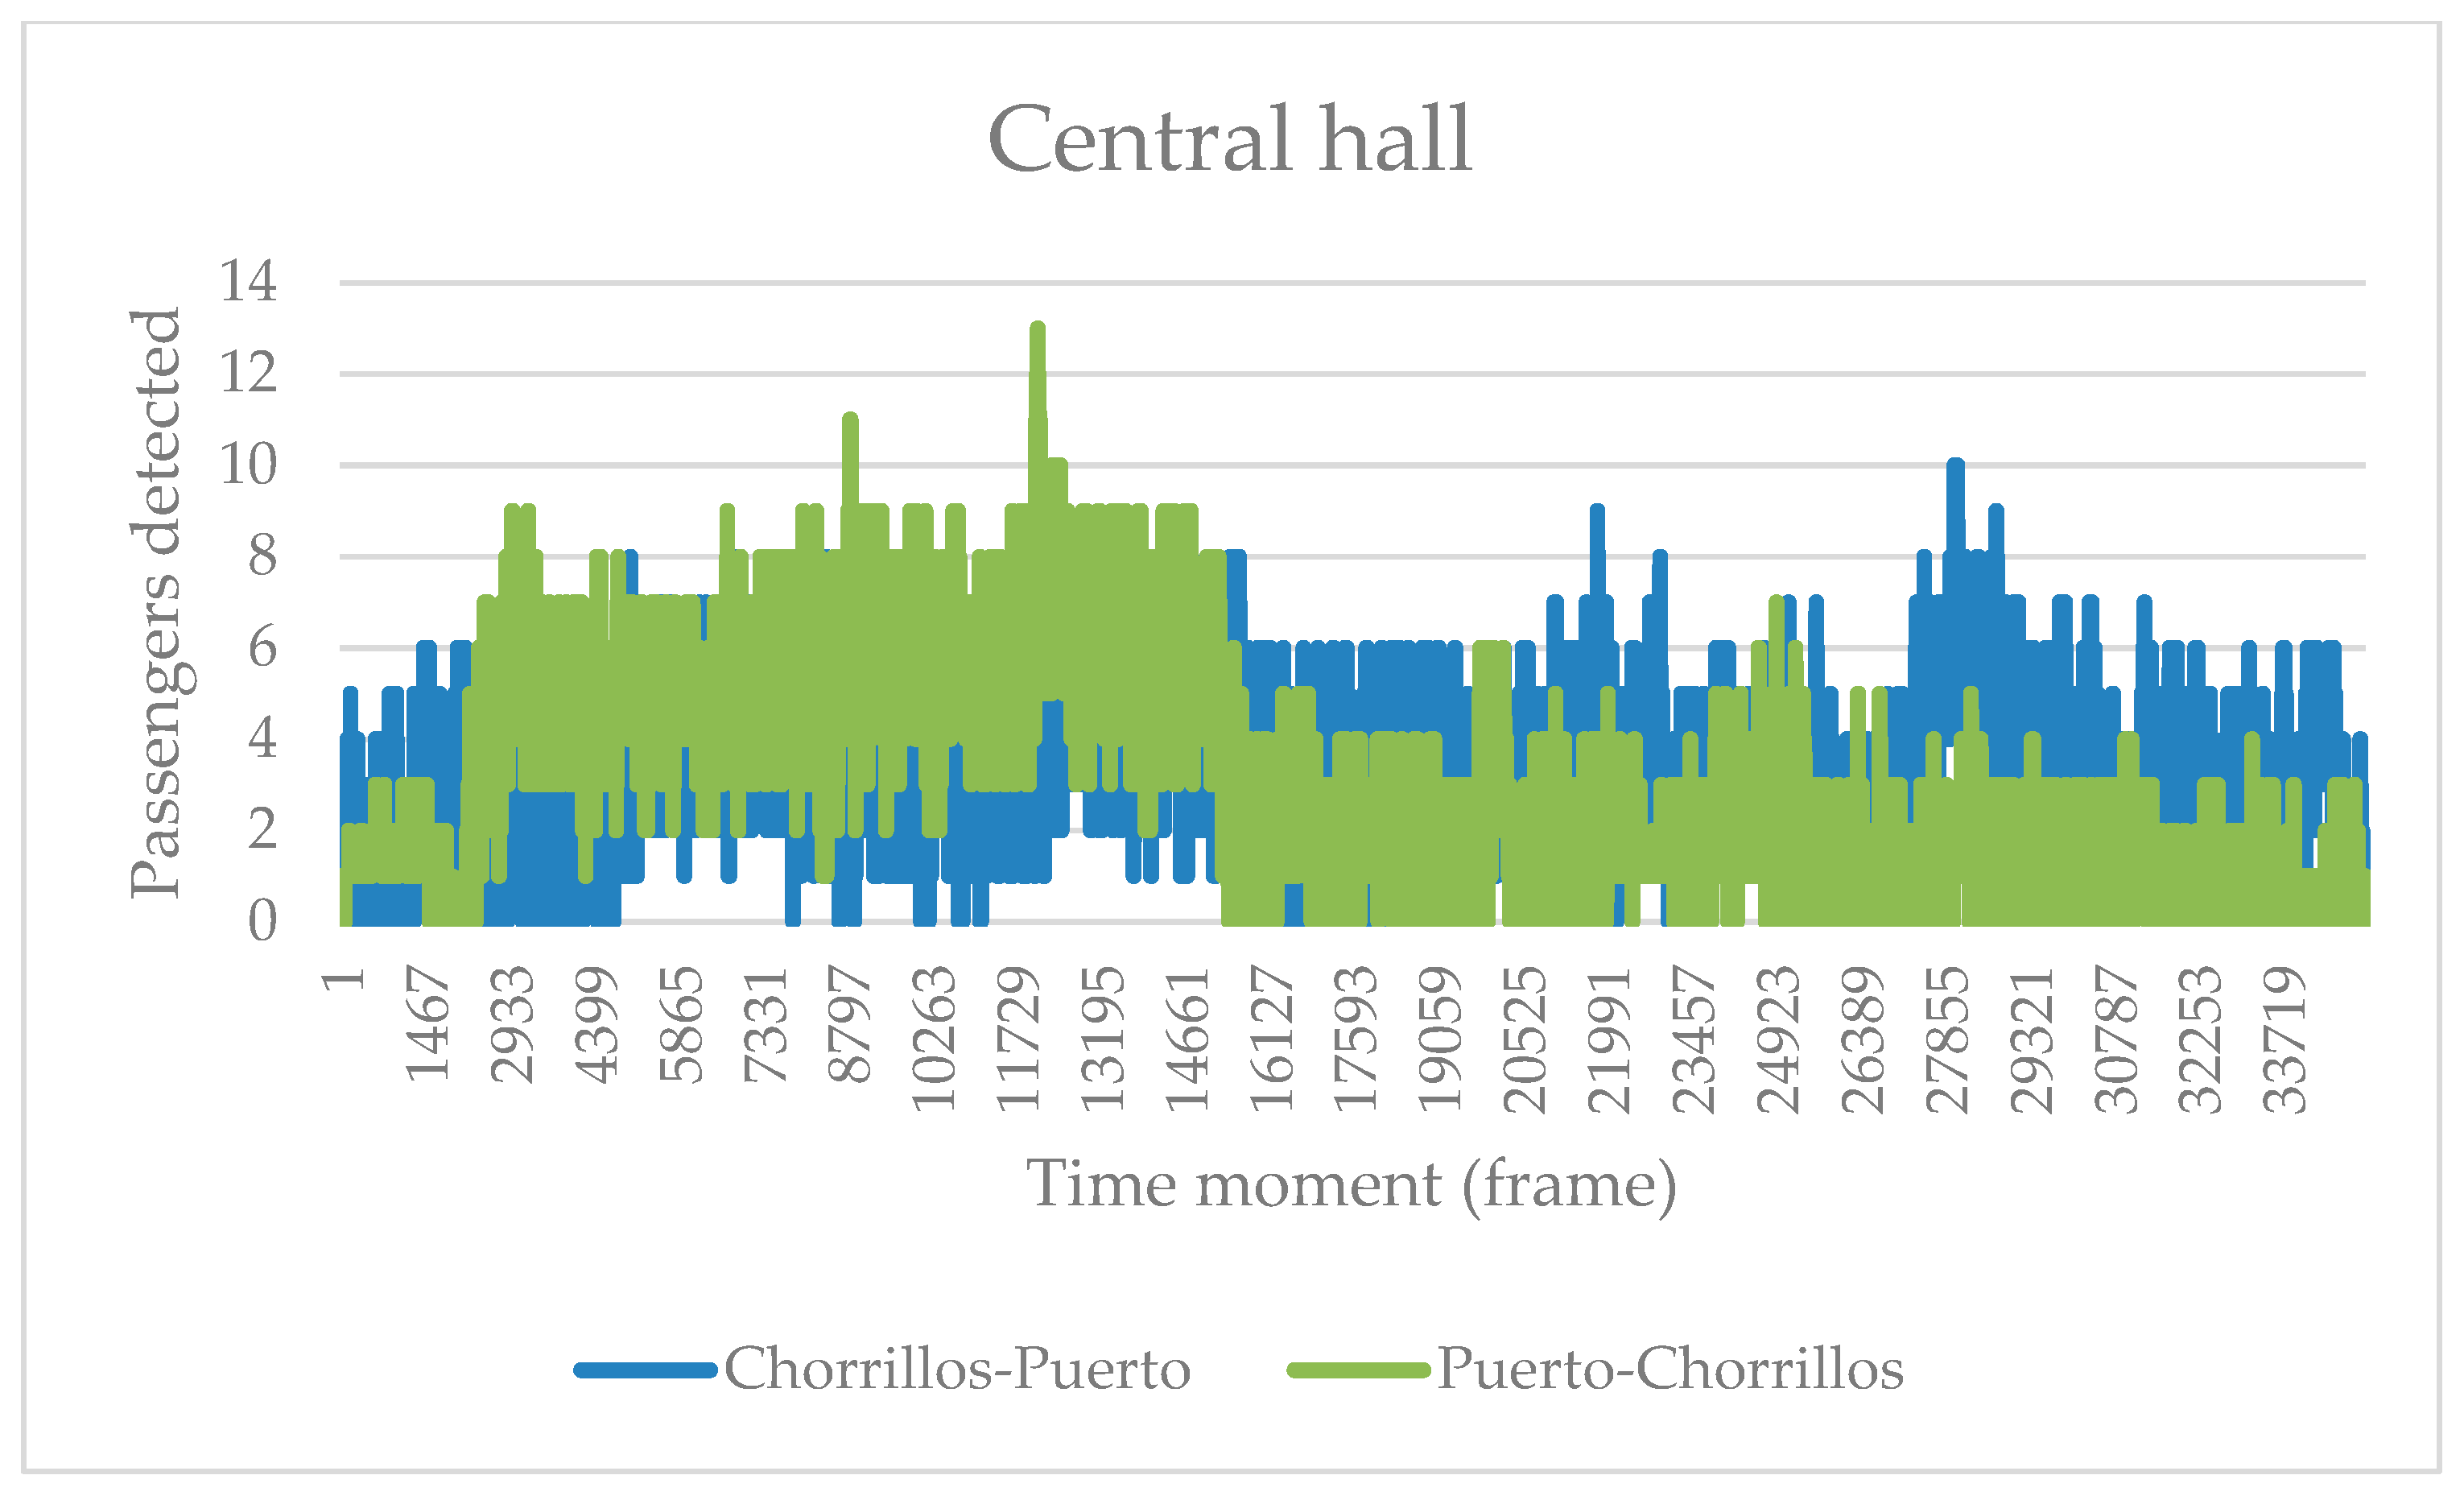
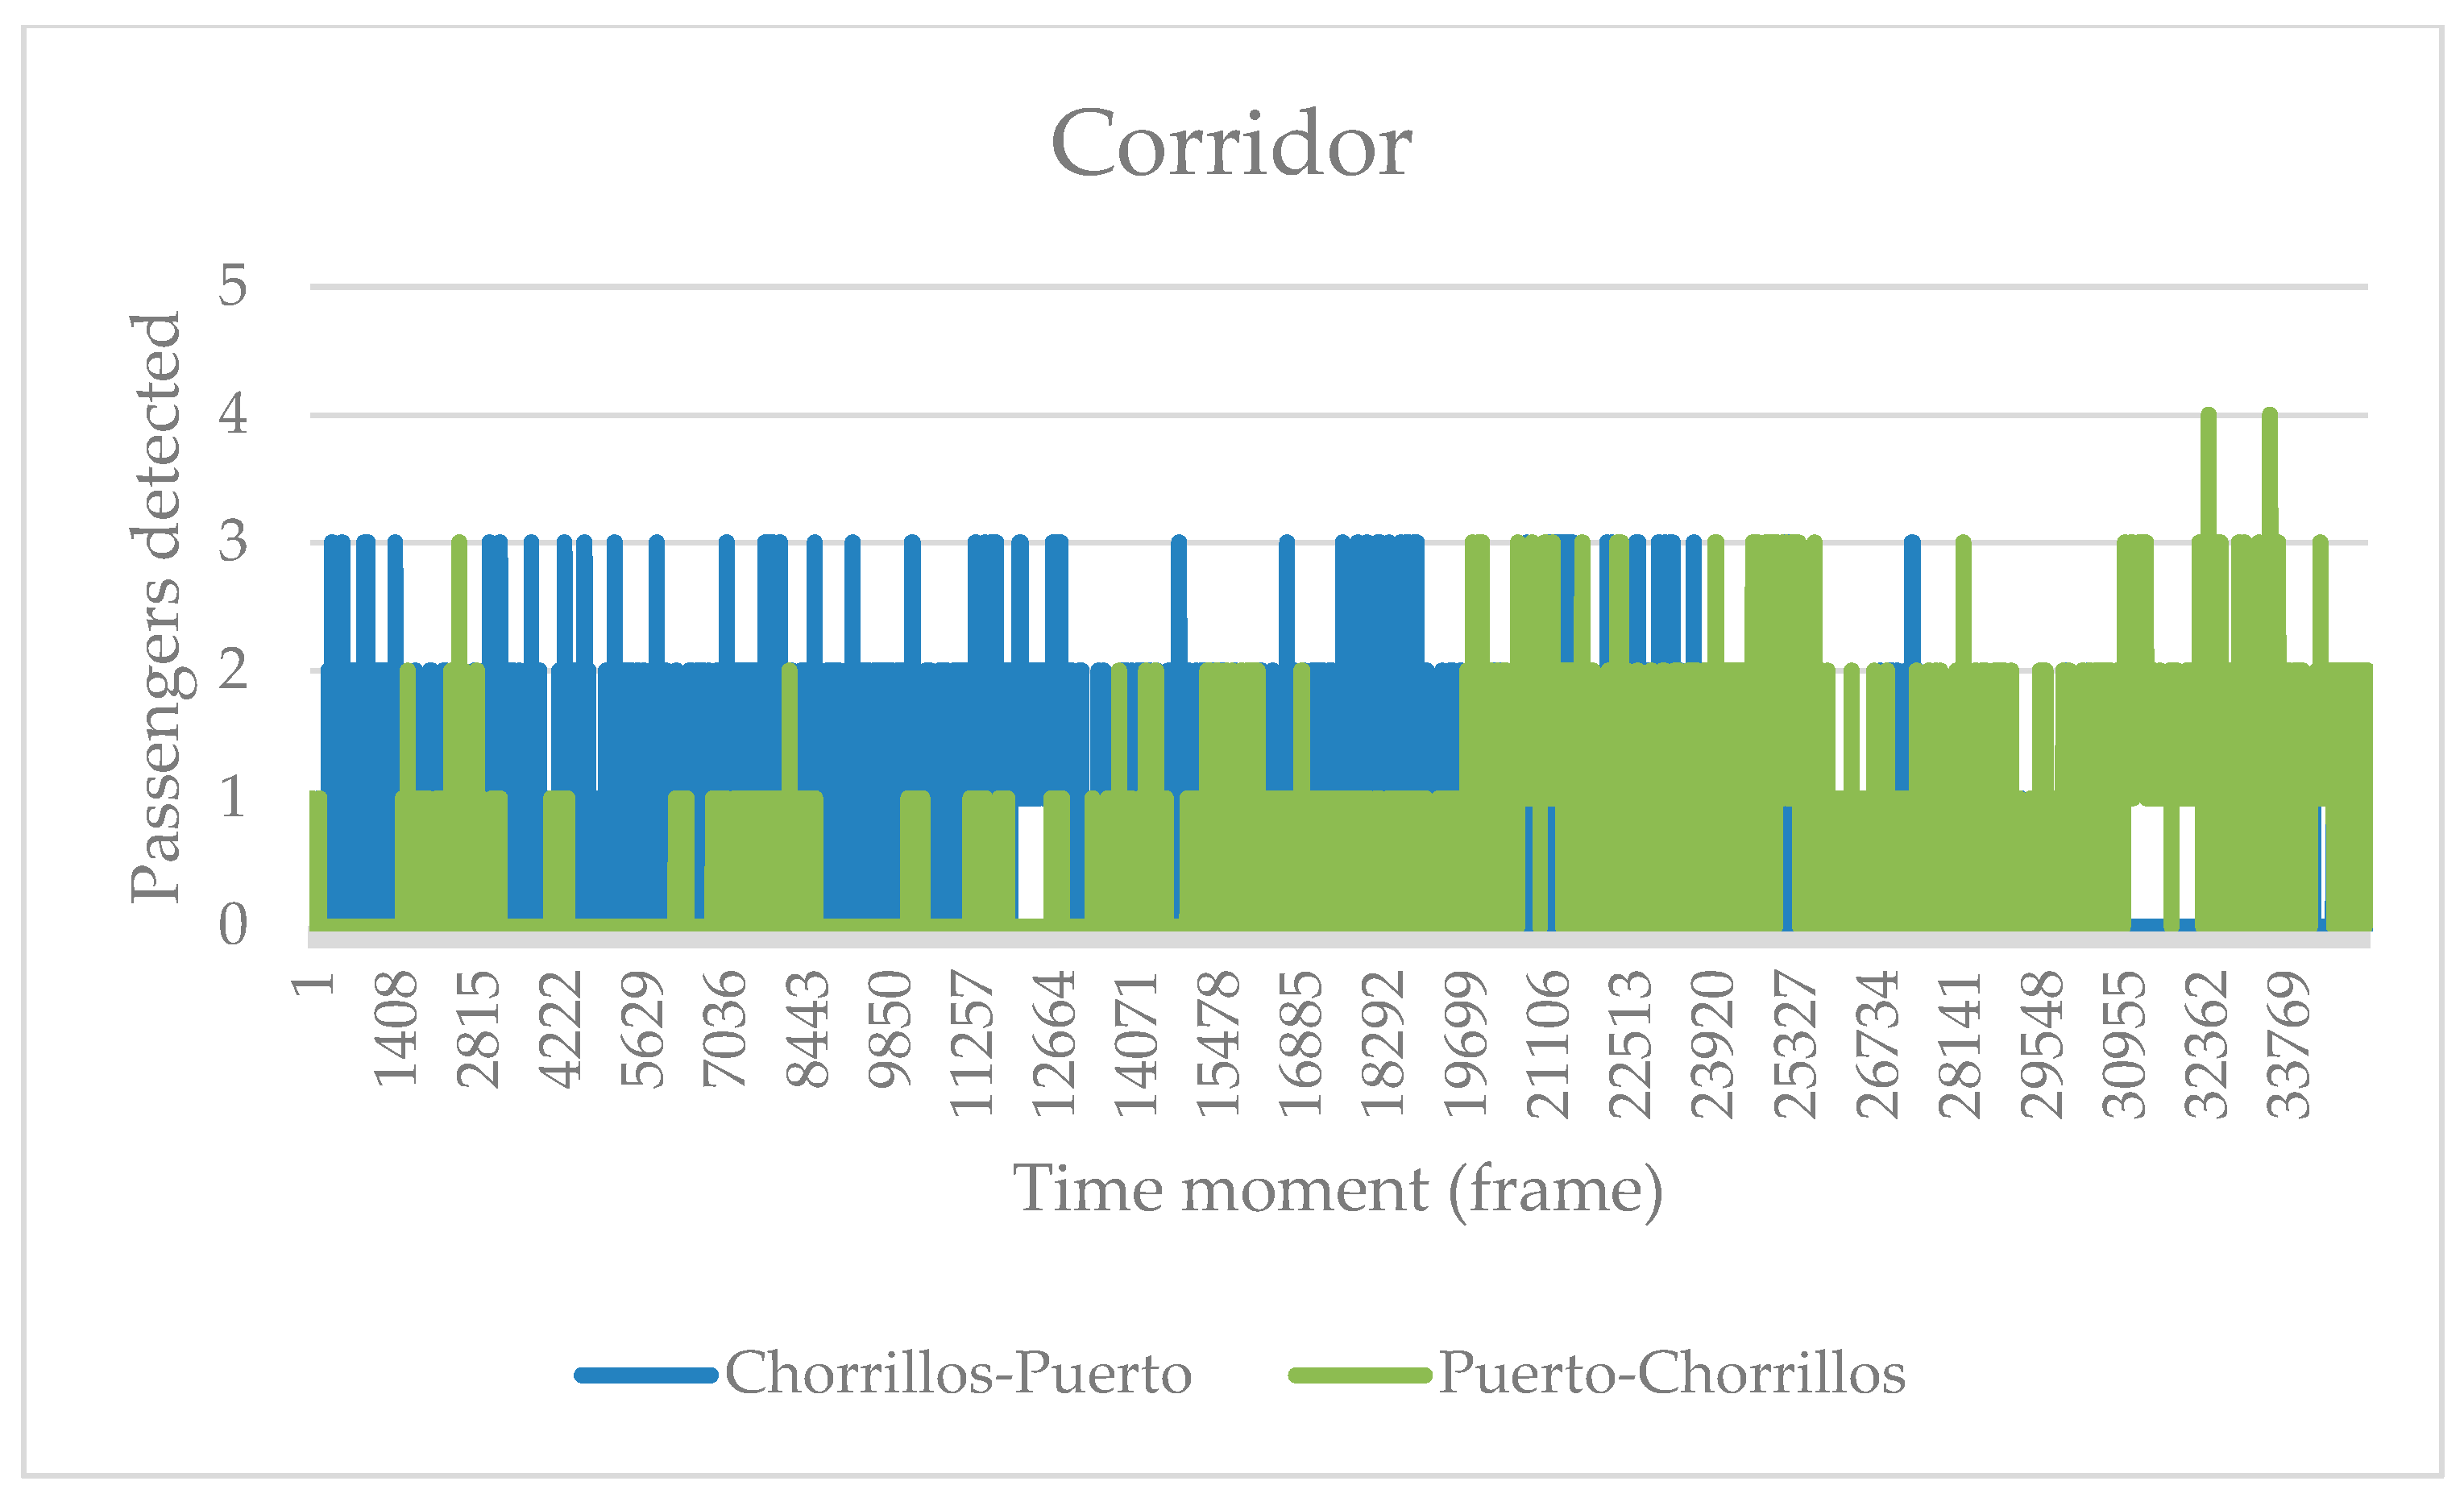
Figure 8 shows the variation in the number of passengers in the central hall, while Figure 9 shows the variation in the number of passengers in the corridor observed. In both figures, more than 30 thousand frames were analysed from Puerto Station to Chorrillos Station (and vice versa). Results from the detection inside the train show that in most cases, passengers preferred to be seated rather than standing in the central hall or corridors. This is noted by the fact that on average, the occupation of seats reached 83%. This may be due to passengers preferring to be comfortable inside the train, which is in concordance with our previous study [33]. In addition, the maximum number of passengers registered in the corridors was equal to 4 (1.4 passengers/m2), which is considered low compared to the maximum number of passengers in the central hall, in which 13 passengers were reached (2.5 passengers/m2). According to the same study [33], in urban services, passengers prefer to stay closer to the train doors rather than along the train.

Figure 8.
Variation in the number of passengers detected in the central hall inside the train carriage.

Figure 9.
Variation in the number of passengers detected in the corridor inside the train carriage.
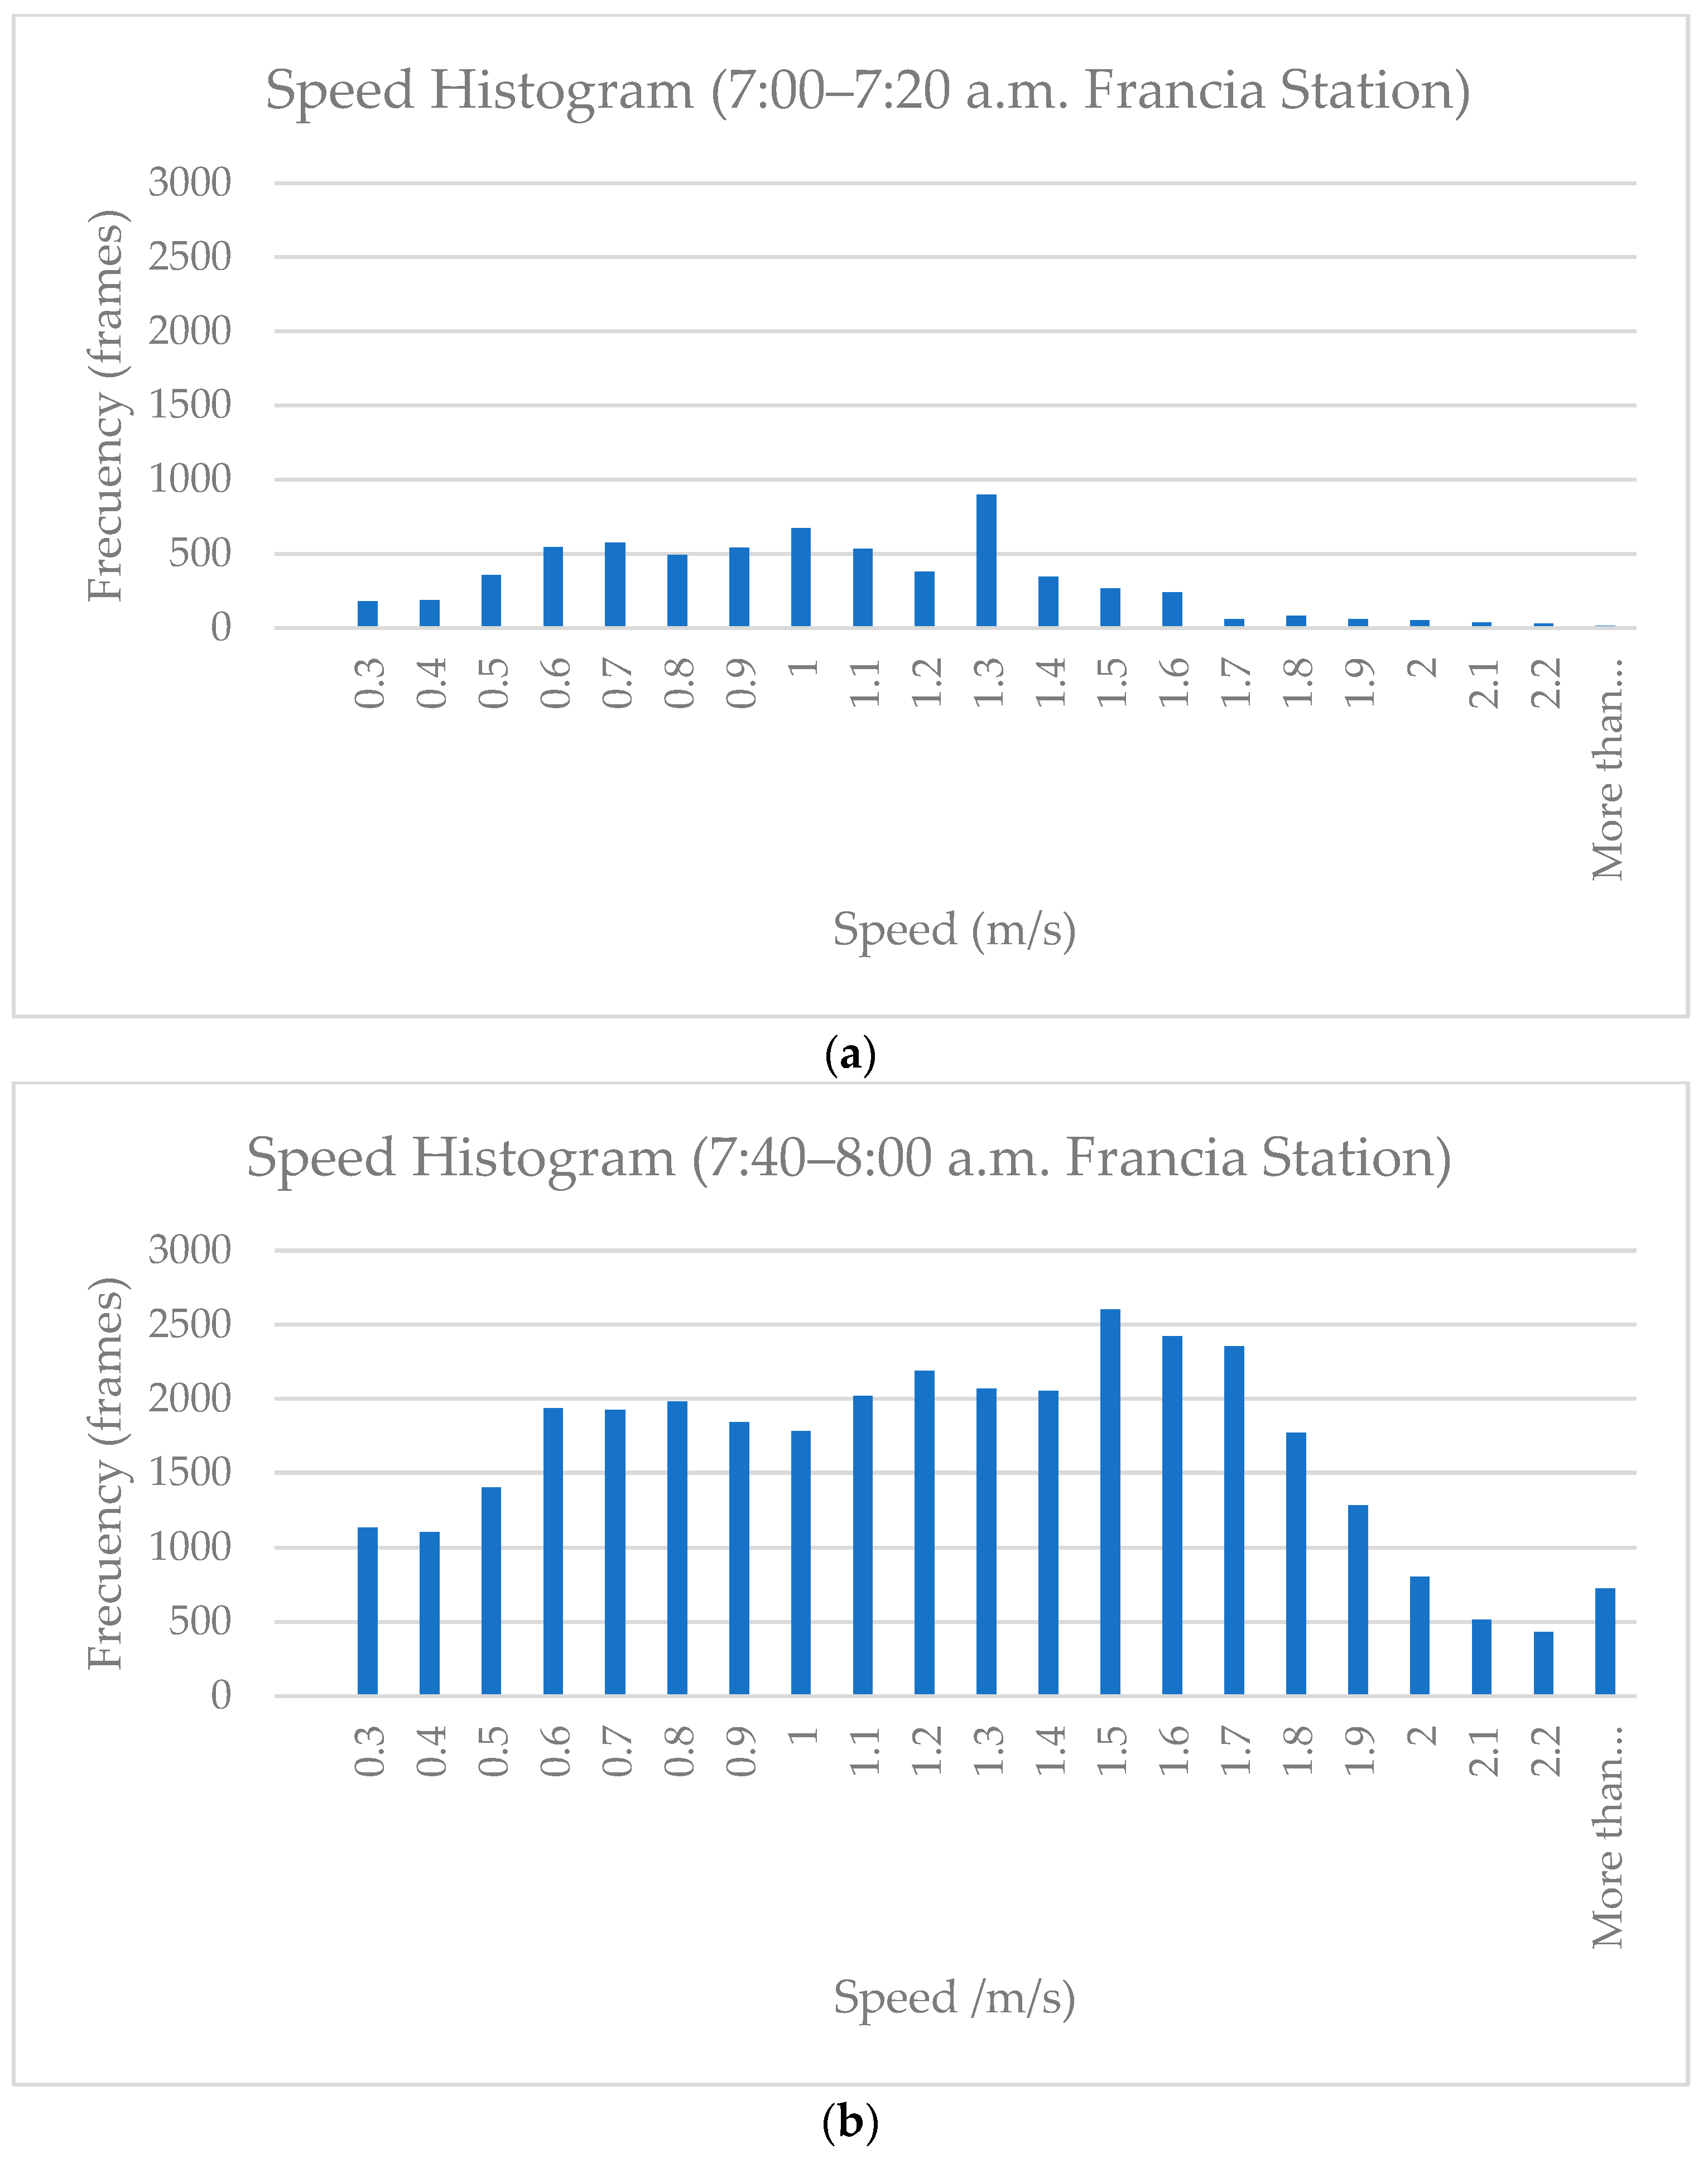
With respect to the platform, Figure 10 shows a histogram of the speed of passengers at the Francia Station. In this station, the analysis was focused on passengers who alighted from the train and walked along the platform to exit the station. It was found that a higher speed of passengers was reached at the end of the peak hour compared to the beginning of the peak hour. This may be caused by the fact that passengers could be late to reach their destination (e.g., workplace or university around Francia Station). On average, at the beginning of the peak hour (7:00–7:20 h), the speed reached 0.47 m/s (standard deviation of 0.57 m/s), while at the end of the peak hour, the speed registered a value of 1.12 m/s (standard deviation of 0.55 m/s). In total, more than 30 thousand frames were analysed (see Figure 11). It is important to consider that the moment of time is referred to as the frames obtained from the video cameras (5–20 fps).

Figure 10.
Speed histogram considering the number of frames in which passengers are observed walking on the platform at Francia Station in the beginning (a) and the end (b) of the peak hour.

Figure 11.
Passengers detected on the platform in Francia Station at the beginning (a) and the end (b) of the peak hour.
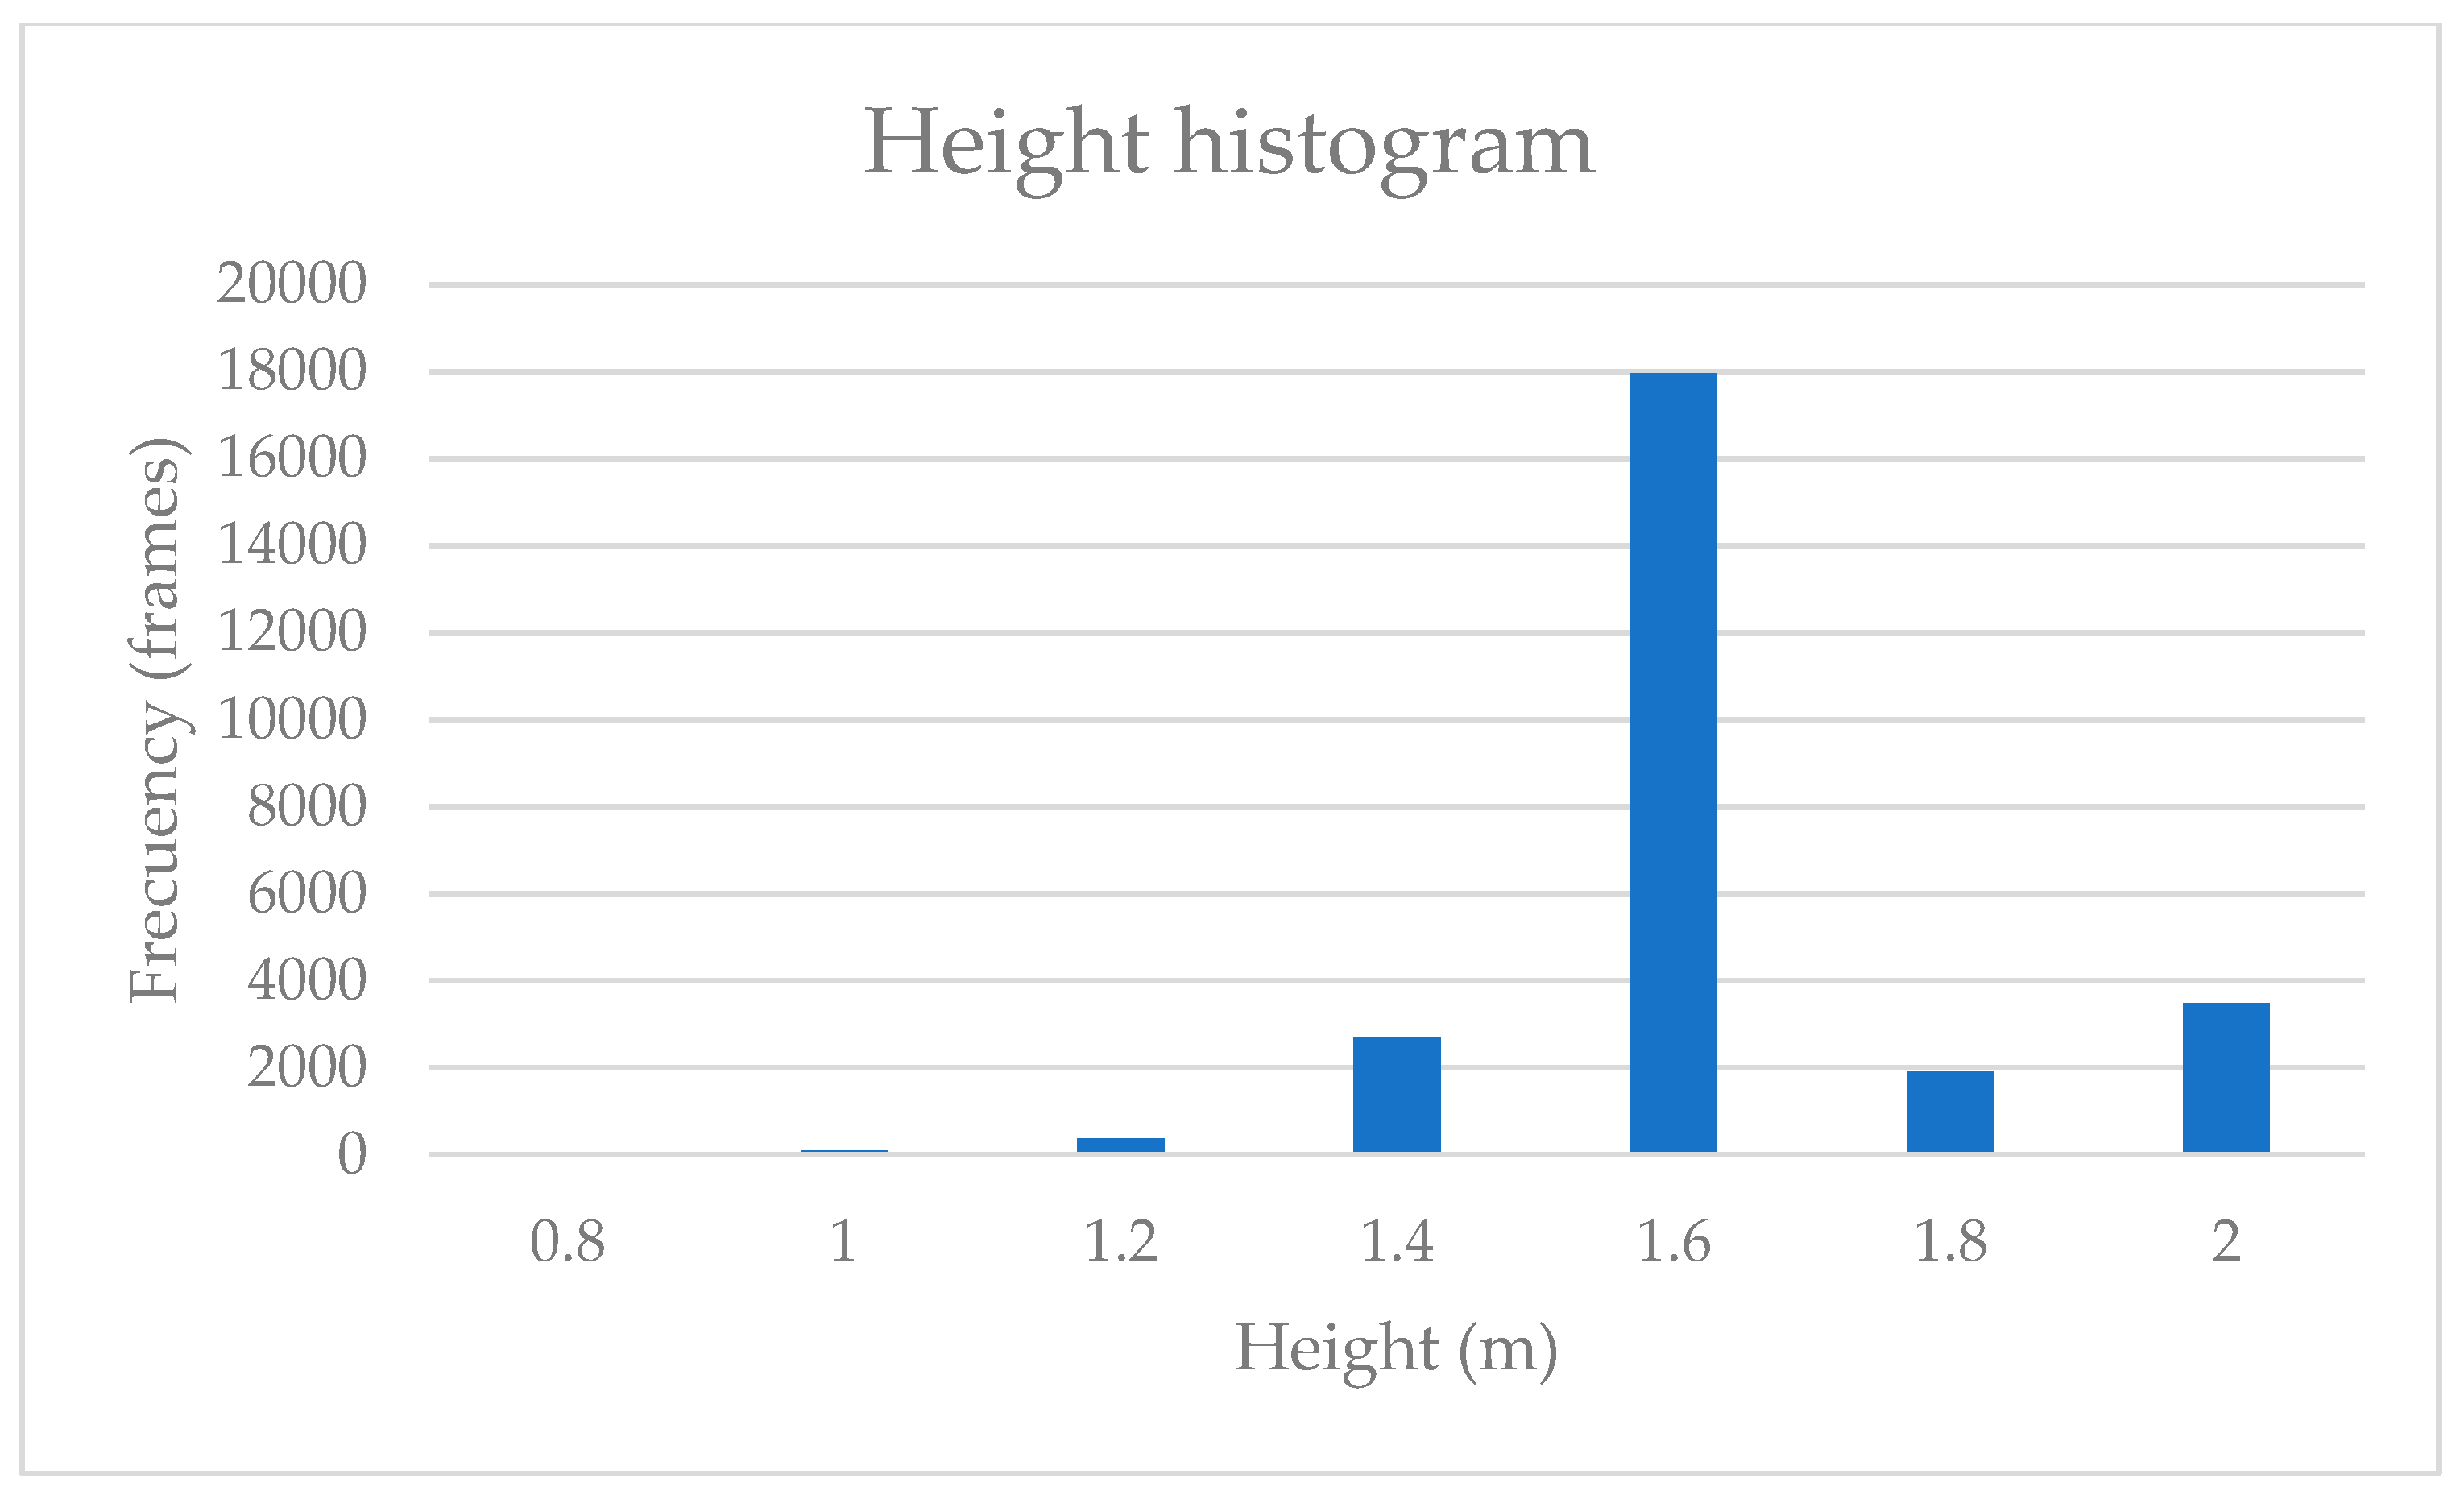
Variables such as the height of passengers could be obtained, and therefore, the characteristics of users could be analysed in metro stations, considering the impact on their speed, and therefore on the level of service on the platform. Figure 12 shows the histogram of the height of passengers, reaching a median of 1.64 m, which is closer to the average height of the Chilean population. However, passengers could be classified into two main groups. For instance, if a passenger is 1.2 m in height or less, this passenger would be considered to represent a child (e.g., less than 7 years old on average according to the WHO (World Health Organization (https://www.who.int/tools/growth-reference-data-for-5to19-years/indicators/height-for-age, accessed on 14 July 2024)), while if the height is greater than 1.2 m, then this passenger is an adult. This classification is in concordance with recent studies based on laboratory experiments and field observations in metro stations [5,33,36]. If this classification is considered, then most passengers during the peak hour are registered as adults.

Figure 12.
Height histogram considering the number of frames in which passengers are observed walking on the platform at Francia Station in the middle of the peak hour (7:20–7:40 a.m.).
4.2. Regression Model Analysis
For the regression model, a least square regression model was applied with the support of the software Eviews 12. The analysis is focused on the dynamics of passengers on the platform of the Francia metro station. The structure of the model (Equation (1)) is based on the following dependent and independent variables, which are described in Table 1:

Table 1.
Description of variables in the proposed multidimensional level of service.
- Speed: dependent;
- Dispersion: independent;
- Type of passenger: independent;
- Platform features: independent;
- Detected passengers: independent.
Speed = β0 + β1⋅Dispersion + β2⋅Type of Passenger + β3⋅Platform Features +
β4⋅Detected Passengers + ϵ
β4⋅Detected Passengers + ϵ
The development of the model is based on the idea that speed is an important variable within the level of service context. Therefore, this model is applied with the objective of understanding the effect of passengers’ behaviour and characteristics, in addition to platform features, on the speed of passengers.
Table 2 shows the results of the regression model. It is possible to observe that during the first period (7:00–7:20), platform features negatively affect the speed of passengers, while type of passengers, detected passengers, and dispersion positively affect the speed of passengers. In the second period (7:20–7:40), platform features, detected passengers, and dispersion presented a positive effect on speed, while the type of passenger had a negative effect. The third period (7:40–8:00) presented a pattern of the effect of variables on speed similar to the first period, with the exception of dispersion, which presented a negative effect on speed.
Table 2.
Results of the least square regression model.
In general, there is one variable, detected passengers, that maintains a similar effect pattern on the speed of passengers in all periods. The variable of detected passengers indicates that there may be some effect of crowded conditions in the station on speed, meaning that the platform design could be inducing the passengers, even in crowded situations, to exit or enter the platform or the train in an organised manner. The variable platform features show a negative effect on speed in most cases. Regarding the type of passengers, it indicates that, possibly, adults tend to have a higher speed. Concerning the dispersion, as expected, if passengers are more distant from one another, the speed of passengers increases.
It is important to highlight that the Francia metro station’s operational context presents external factors that may also have an impact on the speed of passengers that were not considered in this analysis and may be affecting the results. For example, it is an open station (without a full rooftop), exposed to climate variations, and for passengers to enter or exit the considered platform, they have to cross over the metro line and wait for the level crossing gate to open, allowing them to exit and safely enter the platform.
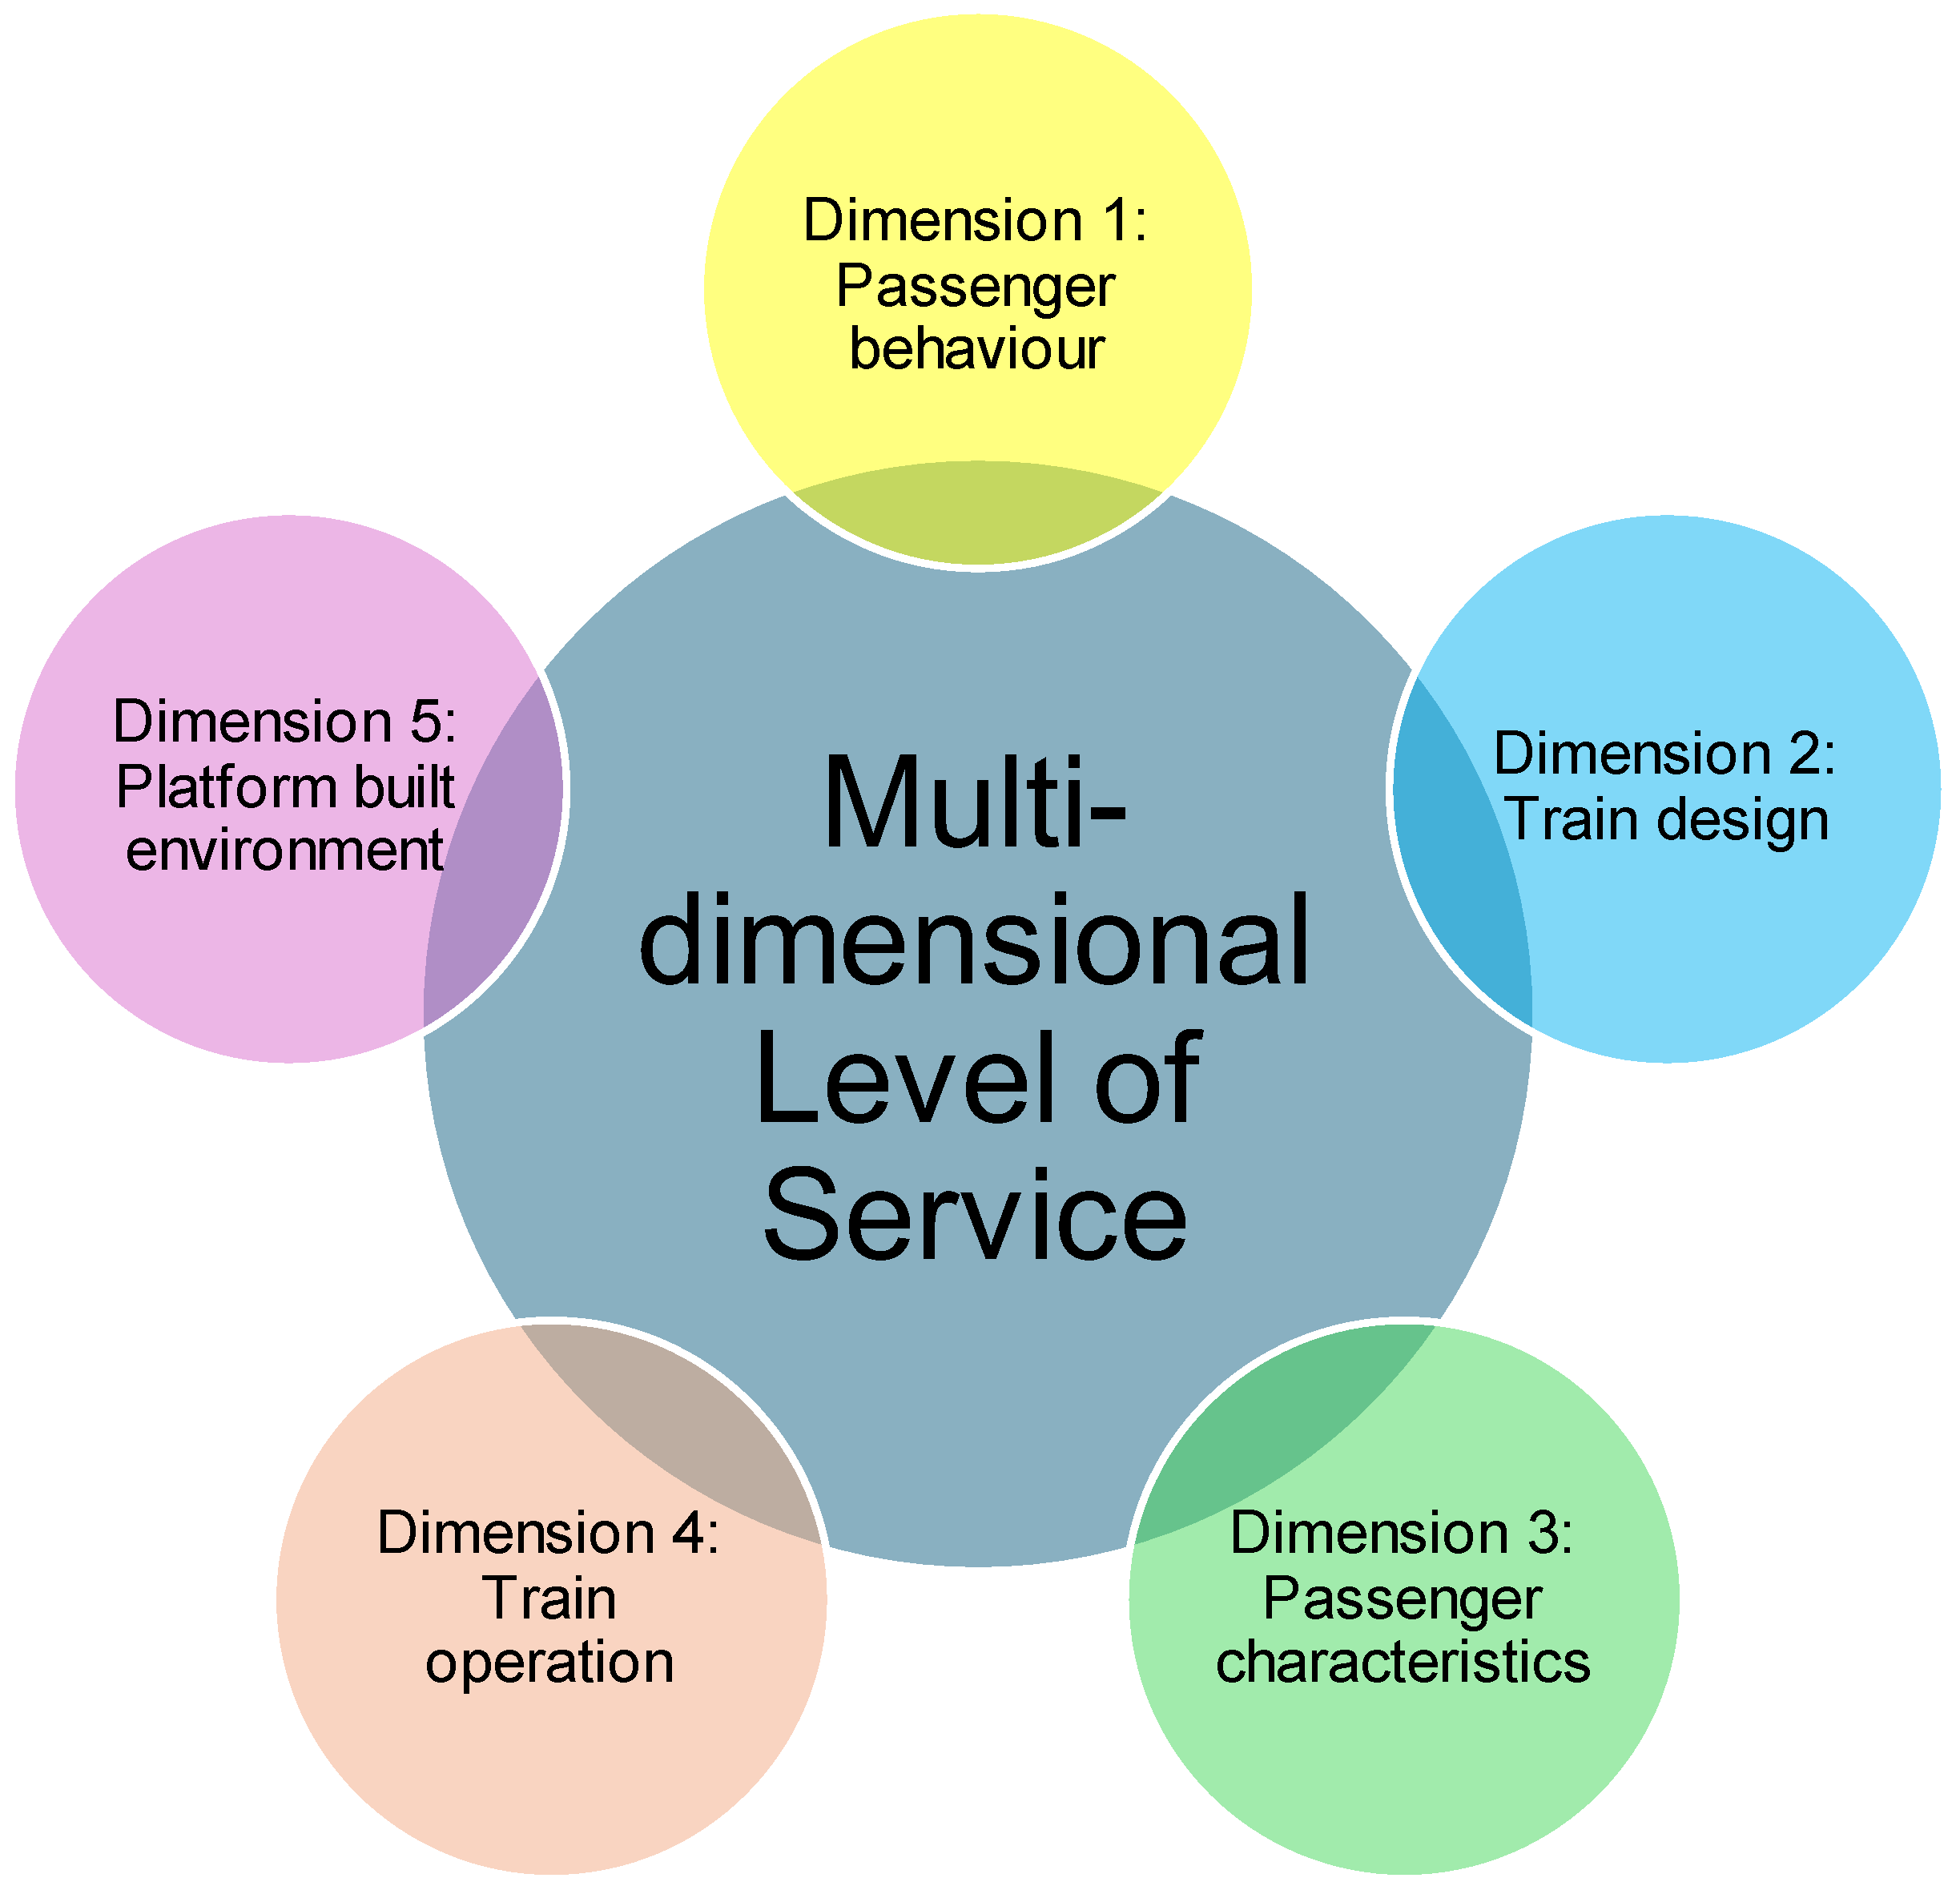
As a result of this regression model, five dimensions are proposed to study the level of service using a multidimensional approach (see Figure 13 and Table 1), which are in concordance with the level of service reported in the literature [6,7].

Figure 13.
Level of service based on a multidimensional approach.
5. Conclusions
In this study, the level of service was analysed based on a multidimensional approach taking the metro system in Valparaíso, Chile, as a case study. This multidimensional approach included a model composed of five dimensions: passenger behaviour, train design, passenger characteristics, train operation, and platform built environment.
Inside the train, it can be observed that seats are occupied most of the time (occupation of 83%). The corridors had a lower number of passengers detected compared to the central hall, which could be related to the type of service in Valparaiso Metro. For instance, passengers in urban services prefer to stay closer to the train doors rather than stay along the length of the train (e.g., corridors).
With respect to the platform, it was found that the speed of passengers is a relevant variable that varies according to the moment of time observed, reaching a value on average between 0.47 and 1.12 m/s. This variable is affected by other variables according to other dimensions presented in the model such as the height of passengers, the number of passengers around (e.g., crowding level), and features around the platform, among others.
From the model, some important results are obtained. Passengers are affected by other passengers around them. In addition, adult passengers have a higher speed compared to children (defined as passengers with a height of less than 1.2 m). An interesting variable is the dispersion of passengers, which is related to the speed of passengers. For instance, if the standard deviation of the distance between passengers increases (i.e., higher dispersion is obtained), then the speed of passengers is increased at the platform; however, when the number of passengers detected on the platform increases, the dispersion negatively affects the speed of passengers. The new model may allow practitioners and researchers to expand the level of service reported in the literature [6,7], which is mainly based on the speed, density, and flow of passengers. This study opens the opportunity to analyse the level of service from different dimensions, including different views and perspectives in a multidimensional approach, which could be then used for railway management. Although this approach is focused on urban services, this study could be expanded to other railway systems such as interurban services or rural services. In addition, other stations and times of day could be considered in further studies to compare the level of service in different conditions (e.g., underground vs. overground stations or peak hour vs. off-peak hour). With respect to the area of analysis, this pilot study considered one carriage, six seats, and one hall plus a corridor. This area will be then expanded in further studies to consider other conditions inside the train.
Author Contributions
Conceptualization, V.A., T.F. and S.S.; methodology, G.G., V.A., T.F. and S.S.; software, V.A. and A.L.; validation, V.A., S.S. and G.G.; formal analysis, S.S.; investigation, V.A., S.S. and G.G.; resources, S.S.; data curation, S.S.; writing—original draft preparation, S.S.; writing—review and editing, V.A. and G.G.; visualization, V.A., S.S. and G.G.; supervision, S.S. and G.G.; project administration, S.S.; funding acquisition, S.S. All authors have read and agreed to the published version of the manuscript.
Funding
This research was funded by Anid, Chile grant number ID22I10018 and Anid, Chile grant number 11230050.
Institutional Review Board Statement
Not applicable.
Informed Consent Statement
Not applicable.
Data Availability Statement
Data is contained within the article.
Acknowledgments
In particular, the authors are thankful for the collaboration between researchers who shared some techniques and methods of study. This study is supported by FONDEF Project ID22I10018, ANID, Chile. In addition, the authors would like to thank other thesis students and professionals who worked at the Mobility and Transport Laboratory (Bernardo Arredondo, Iván Bastías, Catalina Toro, Gonzalo Rojas, Luciano Valenzuela, and Ulises Pintado). In particular, the authors are thankful for Sergio Velastin and Gonzalo Farias, who guided the thesis students.
Conflicts of Interest
The authors declare no conflict of interest.
References
- Empresa de los Ferrocarriles del Estado (EFE). Memoria Anual Empresa de los Ferrocarriles del Estado; Empresa de los Ferrocarriles del Estado: Valparaíso, Chile, 2022. (In Spanish) [Google Scholar]
- Office of Rail and Road (ORR). Passenger Rail Usage. UK. 2022. Available online: https://dataportal.orr.gov.uk/statistics/usage/passenger-rail-usage/#:~:text=A%20total%20of%20417%20million,year%20to%2031%20December%202023 (accessed on 14 May 2024).
- TRB. National Research Council, Highway Capacity Manual 2010; TRB: Washington, DC, USA, 2010. [Google Scholar]
- Seriani, S.; Fernández, R. Planning guidelines for metro–bus interchanges by means of a pedestrian microsimulation model. Transp. Plan. Technol. 2015, 38, 569–583. [Google Scholar] [CrossRef]
- Seriani, S.; Fujiyama, T.; Holloway, C. Exploring the pedestrian level of interaction on platform conflict areas at metro stations by real-scale laboratory experiments. Transp. Plan. Technol. 2017, 40, 100–118. [Google Scholar] [CrossRef]
- Fruin, J.J. Pedestrian Planning and Design; Metropolitan Association of Urban Designers and Environmental Planners: New York, NY, USA, 1971. [Google Scholar]
- Seyfried, A.; Steffen, B.; Klingsch, W.; Boltes, M. The fundamental diagram of pedestrian movement revisited. J. Stat. Mech. Theory Exp. 2005, 2005, P10002. [Google Scholar] [CrossRef]
- Bellomo, N.; Liao, J.; Quaini, A.; Russo, L.; Siettos, C. Human behavioral crowds: Review, critical analysis, and research perspectives. Math. Models Methods Appl. Sci. 2023, 33, 1611–1659. [Google Scholar] [CrossRef]
- Evans, G.W.; Wener, R.E. Crowding and personal space invasion on the train: Please don’t make me sit in the middle. J. Environ. Psychol. 2007, 27, 90–94. [Google Scholar] [CrossRef]
- Yang, J.; Shiwakoti, N.; Tay, R. Train passengers’ perceptions and preferences for different platform and carriage design features. J. Public Transp. 2024, 26, 100085. [Google Scholar] [CrossRef]
- Boltes, M.; Seyfried, A. Collecting pedestrian trajectories. Neurocomputing 2013, 100, 127–133. [Google Scholar] [CrossRef]
- Aguayo, P.; Seriani, S.; Delpiano, J.; Farias, G.; Fujiyama, T.; Velastin, S.A. Experimental Method to Estimate the Density of Passengers on Urban Railway Platforms. Sustainability 2023, 15, 1000. [Google Scholar] [CrossRef]
- Polus, A.; Schofer, J.L.; Ushpiz, A. Pedestrian flow and level of service. J. Transp. Eng. 1983, 109, 46–56. [Google Scholar] [CrossRef]
- Mōri, M.; Tsukaguchi, H. A new method for evaluation of level of service in pedestrian facilities. Transp. Res. Part A Gen. 1987, 21, 223–234. [Google Scholar] [CrossRef]
- Weidmann, U. Transporttechnik der Fussgaenger; Schriftenreihe Ivt-Berichte 90; ETH: Zurich, Switzerland, 1993. (In German) [Google Scholar]
- Cheung, C.Y.; Lam, W.H.K. Pedestrian Route Choices between Escalator and Stairway in MTR Stations. J. Transp. Eng. 1998, 124, 277–285. [Google Scholar] [CrossRef]
- Jelić, A.; Appert-Rolland, C.; Lemercier, S.; Pettré, J. Properties of pedestrians walking in line. II. Stepping behavior. Phys. Rev. E 2012, 86, 046111. [Google Scholar] [CrossRef] [PubMed]
- Daamen, W.; Hoogendoorn, S.P.; Bovy, P.H. First-order pedestrian traffic flow theory. Transp. Res. Rec. 2005, 1934, 43–52. [Google Scholar] [CrossRef]
- Porter, E.; Hamdar, S.H.; Daamen, W. Pedestrian dynamics at transit stations: An integrated pedestrian flow modeling approach. Transp. A Transp. Sci. 2018, 14, 468–483. [Google Scholar] [CrossRef]
- Feng, Y.; Duives, D.; Daamen, W.; Hoogendoorn, S. Data collection methods for studying pedestrian behaviour: A systematic review. J. Affect. Disord. 2021, 187, 107329. [Google Scholar] [CrossRef]
- Teknomo, K.; Takeyama, Y.; Inamura, H. Determination of pedestrian flow performance based on video tracking and microscopic simulations. arXiv 2016, arXiv:1609.02243. [Google Scholar]
- Vanumu, L.D.; Rao, K.R.; Tiwari, G. Fundamental diagrams of pedestrian flow characteristics: A review. Eur. Transp. Res. Rev. 2017, 9, 49. [Google Scholar] [CrossRef]
- Berrou, J.L.; Beecham, J.; Quaglia, P.; Kagarlis, M.A.; Gerodimos, A. Calibration and validation of the Legion simulation model using empirical data. In Pedestrian and Evacuation Dynamics 2005; Springer: Berlin/Heidelberg, Germany, 2005; pp. 167–181. [Google Scholar]
- Banerjee, A.; Maurya, A.K.; Lämmel, G. A review of pedestrian flow characteristics and level of service over different pedestrian facilities. Collect. Dyn. 2018, 3, 1–52. [Google Scholar]
- Hu, M.; Lu, L.; Yang, J. Exploring an estimation approach for the pedestrian level of service for metro stations based on an interaction index. Transp. Lett. 2020, 12, 417–426. [Google Scholar] [CrossRef]
- Azadpeyma, A.; Kashi, E. Level of Service Analysis for Metro Station with Transit Cooperative Research Program (TCRP) Manual: A Case Study—Shohada Station in Iran. Urban Rail Transit 2019, 5, 39–47. [Google Scholar] [CrossRef]
- Wen, Y.; Yan, K.; Yu, C. Level of service standards for pedestrian facilities in shanghai metro stations. In Proceedings of the International Conference on Transportation Engineering 2007, Chengdu, China, 22–24 July 2007; pp. 2072–2078. [Google Scholar]
- Hänseler, F.S.; Bierlaire, M.; Scarinci, R. Assessing the usage and level-of-service of pedestrian facilities in train stations: A Swiss case study. Transp. Res. Part A Policy Prac. 2016, 89, 106–123. [Google Scholar] [CrossRef]
- Liang, J.; Lyu, G.; Teo, C.-P.; Gao, Z. Online Passenger Flow Control in Metro Lines. Oper. Res. 2023, 71, 768–775. [Google Scholar] [CrossRef]
- Li, Z.; Lo, S.; Ma, J.; Luo, X. A study on passengers’ alighting and boarding process at metro platform by computer simulation. Transp. Res. Part A Policy Prac. 2020, 132, 840–854. [Google Scholar] [CrossRef]
- Fu, L.; Chen, Q.; Shi, Q.; Chen, Y.; Shi, Y. Characteristics of pedestrians’ alighting and boarding process in metro stations. Tunn. Undergr. Space Technol. 2023, 141, 105362. [Google Scholar] [CrossRef]
- Mow, C.; Seriani, S.; Fujiyama, T. Where and how often do people touch train interiors? An investigation during the pandemic. In Proceedings of the Institution of Civil Engineers-Municipal Engineer; Emerald Group Publishing Ltd.: Bingley, UK, 2024; Volume 17. [Google Scholar]
- Seriani, S.; Aprigliano, V.; Gonzalez, S.; Baeza, G.; Lopez, A.; Fujiyama, T. The Effect of Seat Layout on the Interaction of Passengers Inside the Train Carriage: An Experimental Approach for Urban Services. Sustainability 2024, 16, 998. [Google Scholar] [CrossRef]
- Munawar, I. Yolov7-Object-Tracking. 2023. Available online: https://github.com/RizwanMunawar/yolov7-object-tracking (accessed on 22 May 2024).
- Lin, T.Y.; Maire, M.; Belongie, S.; Hays, J.; Perona, P.; Ramanan, D.; Dollár, P.; Zitnick, C.L. Microsoft coco: Common objects in context. In Computer Vision–ECCV 2014, Proceedings of the 13th European Conference, Zurich, Switzerland, 6–12 September 2014; Springer: Berlin/Heidelberg, Germany, 2014; pp. 740–755. [Google Scholar]
- Garcia, G.; Velastin, S.A.; Lastra, N.; Ramirez, H.; Seriani, S.; Farias, G. Train Station Pedestrian Monitoring Pilot Study Using an Artificial Intelligence Approach. Sensors 2024, 24, 3377. [Google Scholar] [CrossRef]


Disclaimer/Publisher’s Note: The statements, opinions and data contained in all publications are solely those of the individual author(s) and contributor(s) and not of MDPI and/or the editor(s). MDPI and/or the editor(s) disclaim responsibility for any injury to people or property resulting from any ideas, methods, instructions or products referred to in the content. |
© 2024 by the authors. Licensee MDPI, Basel, Switzerland. This article is an open access article distributed under the terms and conditions of the Creative Commons Attribution (CC BY) license (https://creativecommons.org/licenses/by/4.0/).