Article

Comparative Analysis of Energy System Demands and Performance Metrics in Professional Soccer Players: Running vs. Cycling Repeated Sprint Tests

1
Department of Coaching Education, Faculty of Sport Sciences, Trabzon University, Trabzon 61335, Turkey
2
Department of Coaching Education, Faculty of Sport Sciences, Gazi University, Ankara 06500, Turkey
*
Author to whom correspondence should be addressed.
Appl. Sci. 2024, 14(15), 6518; https://doi.org/10.3390/app14156518
Submission received: 22 June 2024 / Revised: 11 July 2024 / Accepted: 24 July 2024 / Published: 26 July 2024
(This article belongs to the Special Issue Advances in Performance Analysis and Technology in Sports)

Abstract

:
Background: Repeated sprint ability (RSA) is defined as the ability to recover and maintain maximal effort during repeated sprints, recognised as a crucial performance component in team sports. The exercise mode used to test RSA may influence performance and the contributions of different energy systems. The primary aim of this study is to address the critical gap between traditional cycling-based anaerobic tests, such as the Wingate test, and the practical, sport-specific demands of running in field-based team sports. Methods: This study involved 32 professional soccer players (age: 21.2 ± 1.3 years; height: 177.8 ± 4.3 cm; and mass: 71.3 ± 6.4 kg). They performed cycling- and running-based repeated sprint tests, with similar total sprint numbers, durations, and recovery times, on different days. Contributions from adenosine triphosphate-phosphocreatine (ATP-PCr), glycolytic, and oxidative systems were estimated through body weight, oxygen uptake (VO2), blood lactate (BLa), and the fast component of excess post-exercise oxygen consumption (EPOC). The VO2 levels and heart rate (HR) were monitored during the rest (10 min), exercise, and recovery (15 min) phases in a breath-by-breath mode using a portable gas exchange system. BLa was measured before (at rest) and 1, 3, 5, 7, and 10 min after the running and cycling tests using a handheld portable analyser. A mono-exponential model estimated the ATP-PCr system contribution, calculated using the fast component of EPOC following the final sprint and the sum of the VO2-time integral during rest intervals. Results: The cycling tests demonstrated significantly higher values for the peak power (PP), mean power (MP), and rate of perceived exertion (RPE) (p < 0.05), while the heart rate peak and blood lactate responses were similar across all modalities. The fatigue index was notably higher in the running tests (p < 0.05). Furthermore, the running tests showed greater contributions in both the percentage and absolute terms from the adenosine triphosphate-phosphocreatine (ATP-PCr) system (p < 0.01), total energy demand (p < 0.05), and total energy expenditure (TEE) (p < 0.01). Notably, the running tests resulted in an increased phosphocreatine breakdown (p < 0.05) and rapid phosphocreatine replenishment (p < 0.01). A simple linear regression analysis highlighted a significant determination coefficient between these performance variables and the contributions of the energy systems, affirming the robustness of the results. The correlation heatmaps further illustrated these relationships, with higher correlations for the PP and MP across modalities (0.41), emphasising the moderate association between cycling and running tests in these metrics. Conclusions: This study elucidated the similarities and differences in energy system contributions and performance outcomes between a cycling and a running repeated sprint protocol, with a comparable total sprint time and work–rest ratio. The findings reveal that a running repeated sprint test elicits a higher energy demand and a higher contribution from the PCr energy system compared to cycling. Performance variables were not associated between running and cycling tests, suggesting those tests cannot be used interchangeably.

1. Introduction

Soccer is characterised by intermittent bouts of high-intensity activity interspersed with periods of lower intensity or rest. The ability to perform repeated sprints (RSA) is crucial as it directly correlates with key match activities such as chasing the ball, defending, and counter-attacking. Studies have consistently shown that RSA is a significant determinant of match performance, highlighting its relevance across various phases of a game. For instance, research by Rodríguez-Fernández et al. (2019) demonstrates a significant link between RSA and critical match performance indicators such as the total distance covered and high-intensity running in young soccer players [1]. Redkva et al. (2018) identified a strong correlation between the Yo-Yo Endurance Test outcomes and key soccer performance metrics such as the total distance covered, high-intensity activity frequency, and sprint counts, emphasising the importance of RSA in predicting match performance [2]. Research indicates that RSA is crucial for high-level performance, with shorter recovery periods of around 30 s often influenced by game dynamics like player movements and tactical changes [3,4]. This highlights the significance of assessing various sprinting protocols to optimise the understanding and enhancement of soccer performance dynamics.
RSA is typically assessed through protocols that mimic the stop-and-go nature of team sports. The most commonly used protocols include the Running-Based Anaerobic Sprint Test (RAST) and various adaptations of the Wingate Anaerobic Test (WAnT) tailored for running [5,6]. WAnT is extensively used for assessing anaerobic power and capacity through repeated sprints. This test typically involves 30 s of all-out effort on a cycle ergometer. Variations of the WAnT, like the 6 × 5 s and 6 × 10 s bicycle-based repeated sprint tests, are also popular [5,7,8,9]. Both RAST and WAnT are valuable for evaluating the muscular strength and power output in sports like soccer and basketball, appreciated for their cost-effectiveness and ease of use. These tests measure anaerobic power and capacity, reflecting the athlete’s ability to sustain high-intensity efforts. The selection of the protocol often depends on the specific demands of the sport and the practicality of the testing environment.
Comparative studies on cycling- and running-based sprint tests provide insights into how these modalities differ in their assessment of an athlete’s performance [5,10]. Cycling tests, such as the WAnT, are favoured in laboratory settings for their reproducibility and control. However, field-based running tests are considered more sport-specific for soccer and other field sports [11,12], likely providing a better simulation of actual play conditions and fatigue profiles experienced during matches [5,13,14]. Recent studies further elaborate on these differences. For example, Chatterjee et al. (2022) conducted a study comparing the RAST with the WAnT in Indian male track-and-field sprinters. They found that, while RAST overestimated the maximum and minimum anaerobic power, it showed a good reliability for the average power, indicating its practicality for field tests where sophisticated equipment is unavailable [15]. Additionally, Keir et al. (2013) assessed the physiological responses and performance variables during RAST and WAnT in collegiate-level soccer players, finding little correlation between the two, which suggests that different combinations of metabolic contributions exist between the protocols [10]. Moreover, a study by Zagatto, Beck, and Gobatto (2009) investigated the validity of RAST for assessing anaerobic power and predicting short-distance performances in athletes from the armed forces. They demonstrated that RAST is a reliable and valid tool for evaluating anaerobic power, with significant correlations found between the RAST and WAnT results, as well as with actual running performances over distances ranging from 35 to 400 m. The study highlights RAST’s practicality for field tests, reinforcing its relevance for sports that utilise running as the primary form of locomotion [5]. These findings underscore the need for the careful selection of the appropriate test protocol based on specific sport requirements, highlighting the variability in how different tests might align or diverge in terms of assessing specific performance metrics relevant to various sports disciplines. This variability influences the choice of the most appropriate test protocol for assessing repeated sprint ability in athletes.
Understanding the contribution of different energy systems in RSA tests is vital for targeted training. Studies have quantified these contributions, revealing significant differences in how energy systems are taxed during cycling versus running. For example, Gaitanos et al. (1993) underscored the predominance of the ATP-PCr and glycolytic systems, attributing 55.9% and 44.1% of energy production to these pathways, respectively, during initial sprints [16]. This distribution shifts as the duration of the activity extends, with Spencer et al. (2005) noting that a 3 s sprint utilises the ATP-PCr and glycolytic pathways for 65% and 32% of energy, respectively, indicating a higher reliance on immediate energy systems for shorter bursts [9]. Further studies, such as those by Girard et al. (2011), expand on this by quantifying the oxidative system’s contribution, which, while minimal (8%) during short 6 s cycles, plays a crucial role in recovery processes and sustaining performance over successive sprints [8]. This observation aligns with Milioni et al. (2017), who explored the nuanced contributions of oxidative phosphorylation, glycolysis, and phosphagen systems, highlighting their interdependent roles in facilitating recovery and performance sustainability [12]. Moreover, innovative methodologies, such as the use of the oxygen consumption (VO2)-time integral to estimate the phosphocreatine (PCr) replenishment during rest intervals, as noted in these studies, underscore the importance of aerobic recovery mechanisms between high-intensity efforts [16,17,18]. This body of evidence not only enhances our understanding of energy system dynamics during RSA but also suggests that tailored training strategies that consider these diverse energy contributions could significantly benefit athletic performance in intermittent sports.
Despite the extensive use of cycling tests due to their convenience, there is a gap in understanding how well these tests translate to performance in field sports where running is more prevalent. Research suggests that performance outcomes from cycling tests may not correlate strongly with those from running tests [5,10,15]. This discrepancy points to a need for more comparative studies to validate the appropriateness of these tests in different sports contexts. This study aims to address a critical gap in sports science by comparing physiological and performance variables between cycling and running repeated sprint tests. Specifically, the study objectives are as follows: (1) Assess the differences—to evaluate and compare the physiological and performance variables between similar cycling and running repeated sprint tests. This includes analysing variables such as the peak power, mean power, fatigue index, and physiological responses measured through oxygen uptake (VO2) and blood lactate levels. (2) Examine energy system associations—to explore the associations between the energy system demand and performance in both the cycling and running modalities. This involves a detailed measurement of the contributions from adenosine triphosphate-phosphocreatine (ATP-PCr), glycolytic, and oxidative systems, and understanding their impact on performance during the tests.

2. Materials and Methods

2.1. Participants

A group of 32 professional soccer players, with an average age of 21.2 years (±1.3), height of 177.8 cm (±4.3), and weight of 71.3 kg (±6.4), participated in this study. These athletes, all from the under-23 category, had a minimum of five years of systematic training and experience in state and national professional football leagues. The Trabzon University Non-Interventional Clinical Researches Ethics Board granted approval for this study (protocol code E-81614018-000-2200039407, approved on 4 October 2022), ensuring compliance with the Declaration of Helsinki guidelines. Prior to the study, each player was fully informed about the purposes, procedures, risks, and details of the study and provided their signed informed consent. The data collection process for this study commenced on 15 October 2022 and concluded on 23 January 2024.

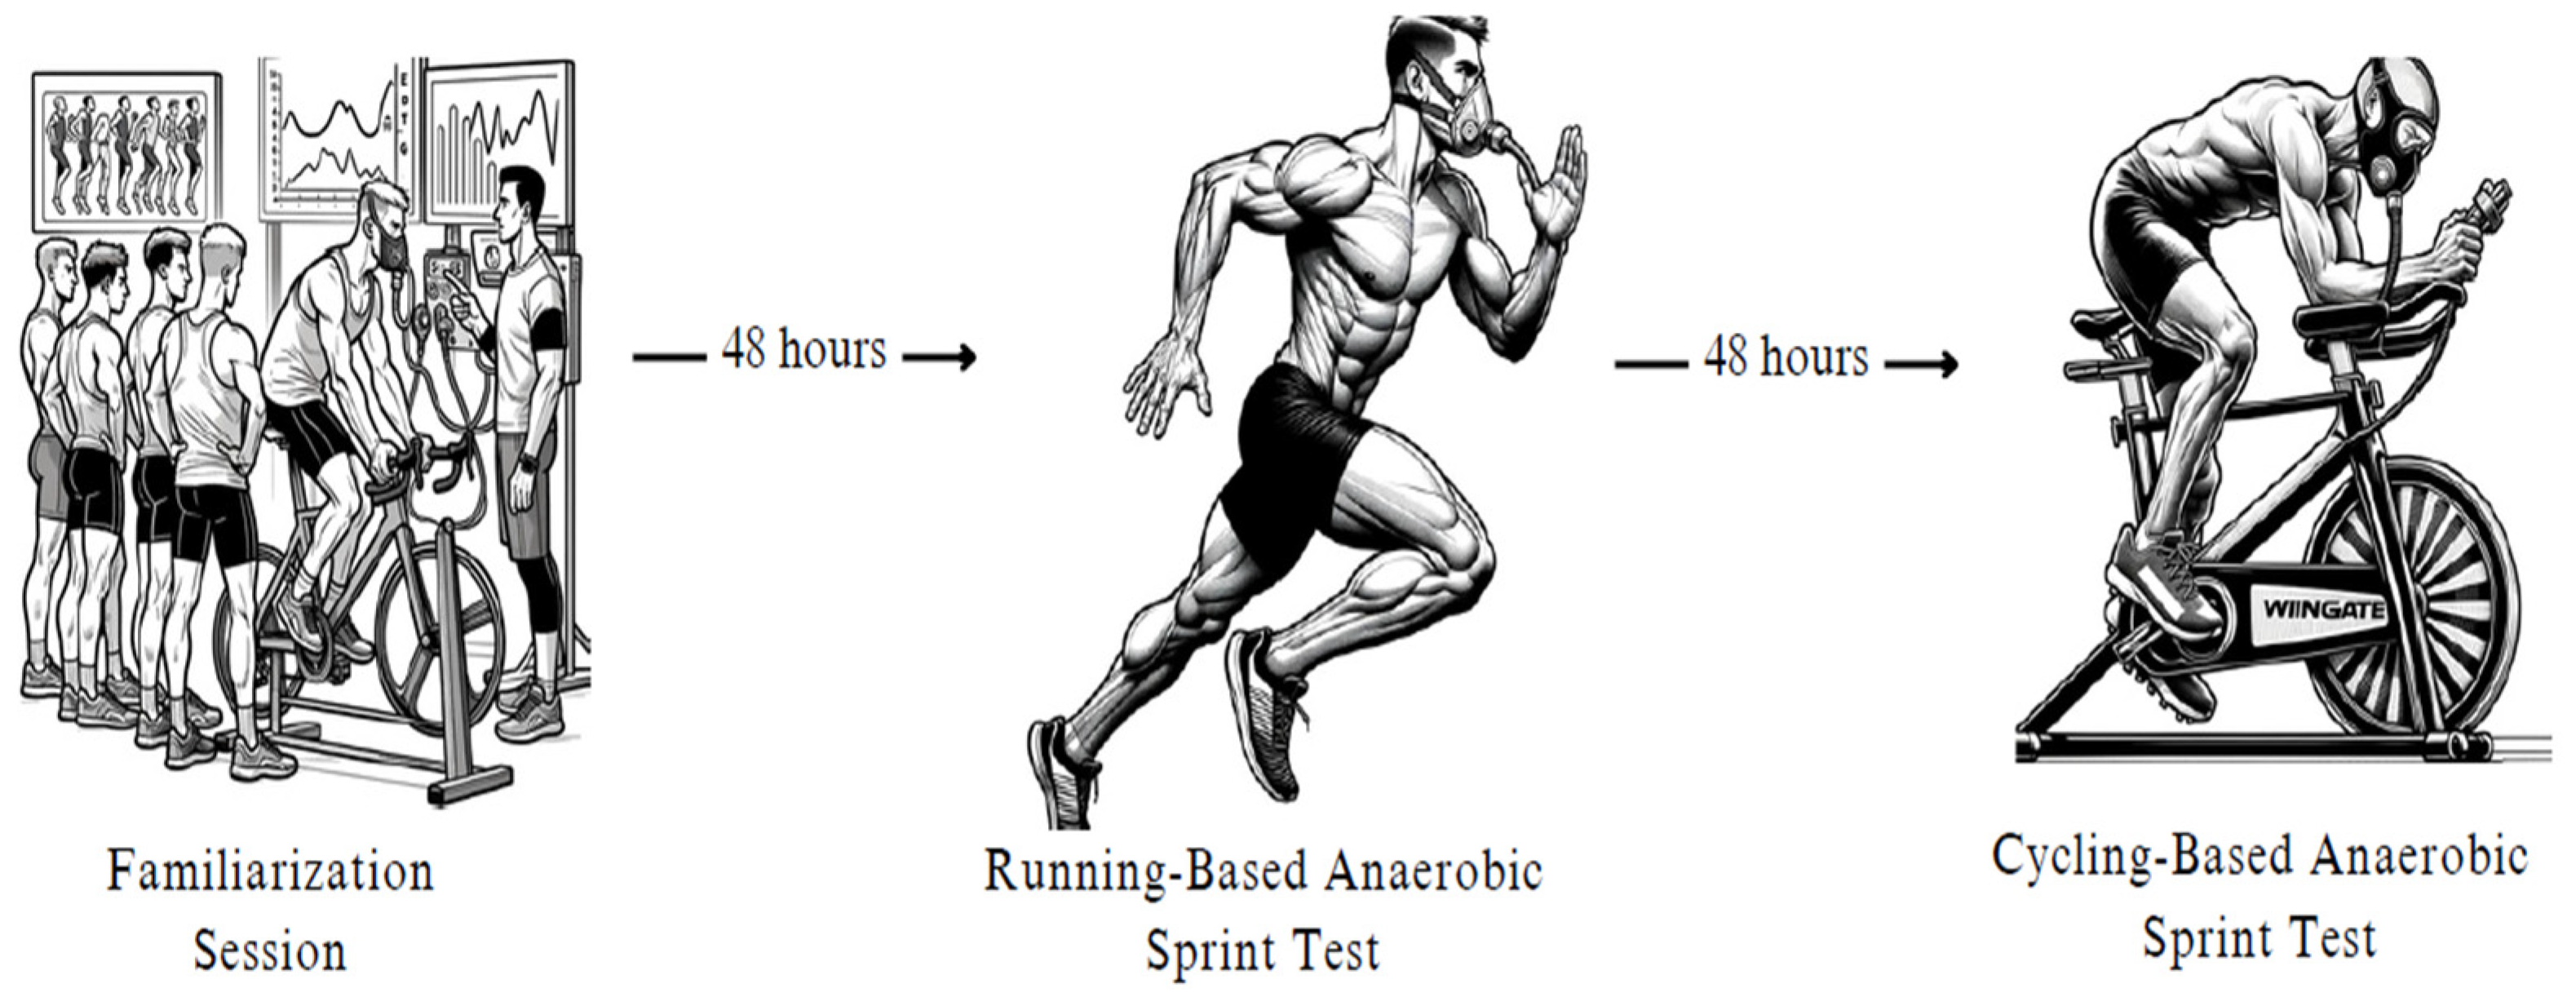
2.2. Experimental Design

In this study, players underwent testing at the Trabzon University Sports Performance Analysis and Talent Centre Laboratory. Before initiating the main testing phase, participants were introduced to a preparatory session at the Trabzon University Sports Performance Analysis and Talent Centre Laboratory. The purpose of this session was to familiarise them with the testing setting, equipment, and specific procedures, aiming to secure consistent and precise data collection during the subsequent tests. The session acquainted participants with the COSMED K5 portable gas exchange system for real-time VO2 monitoring and provided instructions on using the handheld portable analyser for blood lactate (BLa) measurements, as well as the Garmin HRM-Run™ (Garmin Ltd., Olathe, KS, USA)) for continuous heart rate observation. These devices were chosen based on their validation in various studies and their ability to provide continuous monitoring at 1 s intervals. This method ensures minimal error and accurate heart rate data collection throughout the exercise phases [19]. Additionally, they engaged in preliminary runs of the cycling and running repeated sprint tests to familiarise themselves with the test structure, including sprint intervals and rest periods. We utilised the 6–20 Borg scale for the RPE. The 6–20 scale specifically allows participants to rate their exertion on a continuum from 6 (no exertion at all) to 20 (maximal exertion). To address the subjectivity concerns, we conducted a thorough familiarisation session with the participants, ensuring they were comfortable and consistent in using the scale. This session aimed to minimise variability and enhance the accuracy of the perceived exertion ratings [20]. This initial session was crucial for ensuring participants were thoroughly informed and comfortable with the study’s methodologies, thereby reducing potential variations in test outcomes attributable to unfamiliarity with the process. The testing consisted of a familiarisation session and two testing sessions, each conducted 48 h apart, and at the same time of day. The two testing sessions consisted of a running repeated sprint test, and a cycling repeated sprint test, respectively. The players were required to complete a cycling repeated sprint test and a running repeated sprint test on two different occasions. Each session was scheduled in the morning, specifically between 9 and 10 o’clock. During these tests, VO2 levels were monitored in three phases: a 10 min rest period, the exercise phase, and a 15 min recovery phase, where the measurements were taken while the subjects were seated. Rate of perceived exertion (RPE) was assessed directly following the tests. Monitoring was carried out in breath-by-breath mode using the COSMED K5 portable gas exchange system (Rome, Italy). The study by Guidetti et al. (2018) provides significant findings on the validity, reliability, and minimum detectable change of the COSMED K5 portable gas exchange system. The research thoroughly examined the device’s capability to measure in “breath-by-breath” mode and found it to have a high correlation with reference systems (r > 0.90). Additionally, the device demonstrated high internal consistency in repeated measures (ICC > 0.85), and the minimum detectable change, calculated using the standard error of measurement (SEM), indicated the device’s ability to detect small changes. These findings support the use of the COSMED K5 as a reliable and valid measurement tool in both clinical applications and sports sciences [21]. Calibration of the gas analyser was performed before the tests using a known gas sample (5.0% CO2 and 16.0% O2). Blood lactate (BLa) values were measured using a handheld portable analyser (Lactate Plus, Nova Biomedical, Waltham, MA, USA). The study by Hart et al. (2013) provides critical insights into the validity and reliability of the Lactate Plus analyser [22]. The research thoroughly evaluated the device’s capability to provide accurate lactate measurements by comparing its results with the laboratory standard YSI 2300 STAT Plus. The findings indicated a high correlation between the Lactate Plus analyser and the reference system (r > 0.90), demonstrating its validity. Additionally, the device showed high internal consistency (ICC > 0.85) in repeated measures, supporting its reliability. These results suggest that the Lactate Plus analyser is a valid and reliable tool for measuring lactate levels in clinical and sports science applications. Measurements were taken at rest and at 1, 3, 5, 7, and 10 min post-running and cycling tests. The peak blood lactate level was identified as the highest concentration recorded during the post-test period. Heart rate (HR) was continuously monitored at 1 s intervals using Garmin HR monitors. RPE was assessed immediately following each test to gauge subjective effort and fatigue levels. Power output for the running exercises was estimated using a validated equation that considers the athlete’s body mass, the distance covered, and the time taken to complete the sprint.
The sequence of the tests was planned such that players performed the running test first, followed by the cycling test 48 h later. Participants were asked to refrain from intense physical activities for 24 h before each testing session to ensure no residual fatigue could affect performance. Additionally, they were advised to limit caffeine and alcohol intake to no more than one standard drink or one cup of coffee per day, respectively, within the same 24 h period. These measures were implemented to guarantee that the effects observed on performance were more likely to result from the experimental conditions themselves, rather than from outside lifestyle influences. Figure 1 presents the experimental design, outlining the sequence from the familiarisation session through the execution of both anaerobic sprint tests.

2.3. Running-Based Anaerobic Sprint Test (RAST)

The RAST was employed to assess repeated sprint performance [23], a key component in several team sports, including soccer [24]. The RAST is a well-established tool, both valid and reliable [5]. This test involves six 35 m sprints, each requiring maximum effort, with a ten-second passive recovery interval between each sprint. To record the time for each 35 m attempt, a photocell system (Witty, Microgate, Italy) was positioned at the start and end of the 35 m track. Participants were allowed only a single-step acceleration before crossing the initial photocell gate. The performance data from each sprint were used to calculate the power output (P) for each effort, using the formula P = (total body mass × distance2)/time3 [5]. RAST key metrics include the peak power (PP), representing the highest power output across six sprints; mean power (MP), the average output over all sprints; and the fatigue index (FI), which is calculated with the formula FI (%) = ((PP − Pmin)/PP) × 100. Here, Pmin denotes the lowest power output observed.

2.4. Cycling-Based Anaerobic Sprint Test

As in the RAST test, cycling test consisted of six all-out sprint attempts separated by 10 s of passive recovery. The cycling sprint times of each player were constructed from the average sprint times in the running test. The cycling sprint tests were carried out on a Monark (894E, Monark Cycle Ergometer, Vansbro, Sweden) cycle ergometer, and the load was set at 0.10 kg·kg−1 of body mass. As the athlete started to pedal, the brush providing the resistive load on the bicycle dropped down. The measured power outputs during the sprint test were computed without accounting for the pedal’s inertial momentum, since it has been suggested that correcting for inertia has minimal effect on power output calculation during a sprint when using a high resistive load [25]. The performance indicators for the Cycling-Based Anaerobic Sprint Test are defined as follows: (1) Peak Power Output (PP): This represents the maximum power output recorded during each sprint cycle. (2) Mean Power Output (MP): This is the average power output achieved throughout each sprint cycle. (3) Performance Decrement (PD): This metric quantifies the reduction in power output, calculated using the formula provided by Oliver (2009). (4) Ideal Peak Power: This is calculated as the product of the peak power output and the number of repetitions [26].

2.5. Determination of Energy Demand and Energy Systems Contribution

The contributions of the Oxidative, Glycolytic, and ATP-PCr energy systems were estimated using several parameters: body weight, VO2, BLa, and the fast component of excess post-exercise oxygen consumption (EPOC). To calculate the ATP-PCr system’s contribution, we employed the fast component of EPOC kinetics (EPOC_fast), analysed using OriginPro 8.0 software (OriginLab Corp., Northampton, MA, USA). A mono-exponential model was applied to the EPOC kinetics to estimate the ATP-PCr contribution. EPOC_fast is linked with PCr resynthesis because replenishing PCr stores, depleted during high-intensity exercise, is an oxygen-dependent process. This replenishment occurs rapidly post-exercise and is a significant part of the immediate recovery phase, reflected in the increased oxygen consumption during the fast component of EPOC. This system’s total contribution was calculated by combining the fast component of EPOC following the final sprint with the sum of the VO2-time integral during rest intervals. PCr_breaks estimated PCr repayment during rest intervals [27,28]. In the evaluation of the glycolytic system, the methodology was predicated on the premise that an accumulation of 1 mmol∙L−1 in blood lactate levels (BLa) was indicative of a 3 mL O2 consumption per kilogram of body mass [29]. The oxidative system’s contribution was determined by subtracting resting VO2 from exercise VO2 [30,31,32]. Total energy expenditure (TEE) was then calculated as the cumulative energy derived from the Oxidative, Glycolytic, and ATP-PCr systems [33]. Oxygen demand (L) from these three energy systems was converted into energy equivalents, based on the assumption that each litre of O2 is equivalent to 20.92 kJ [34].

2.6. Statistical Analysis
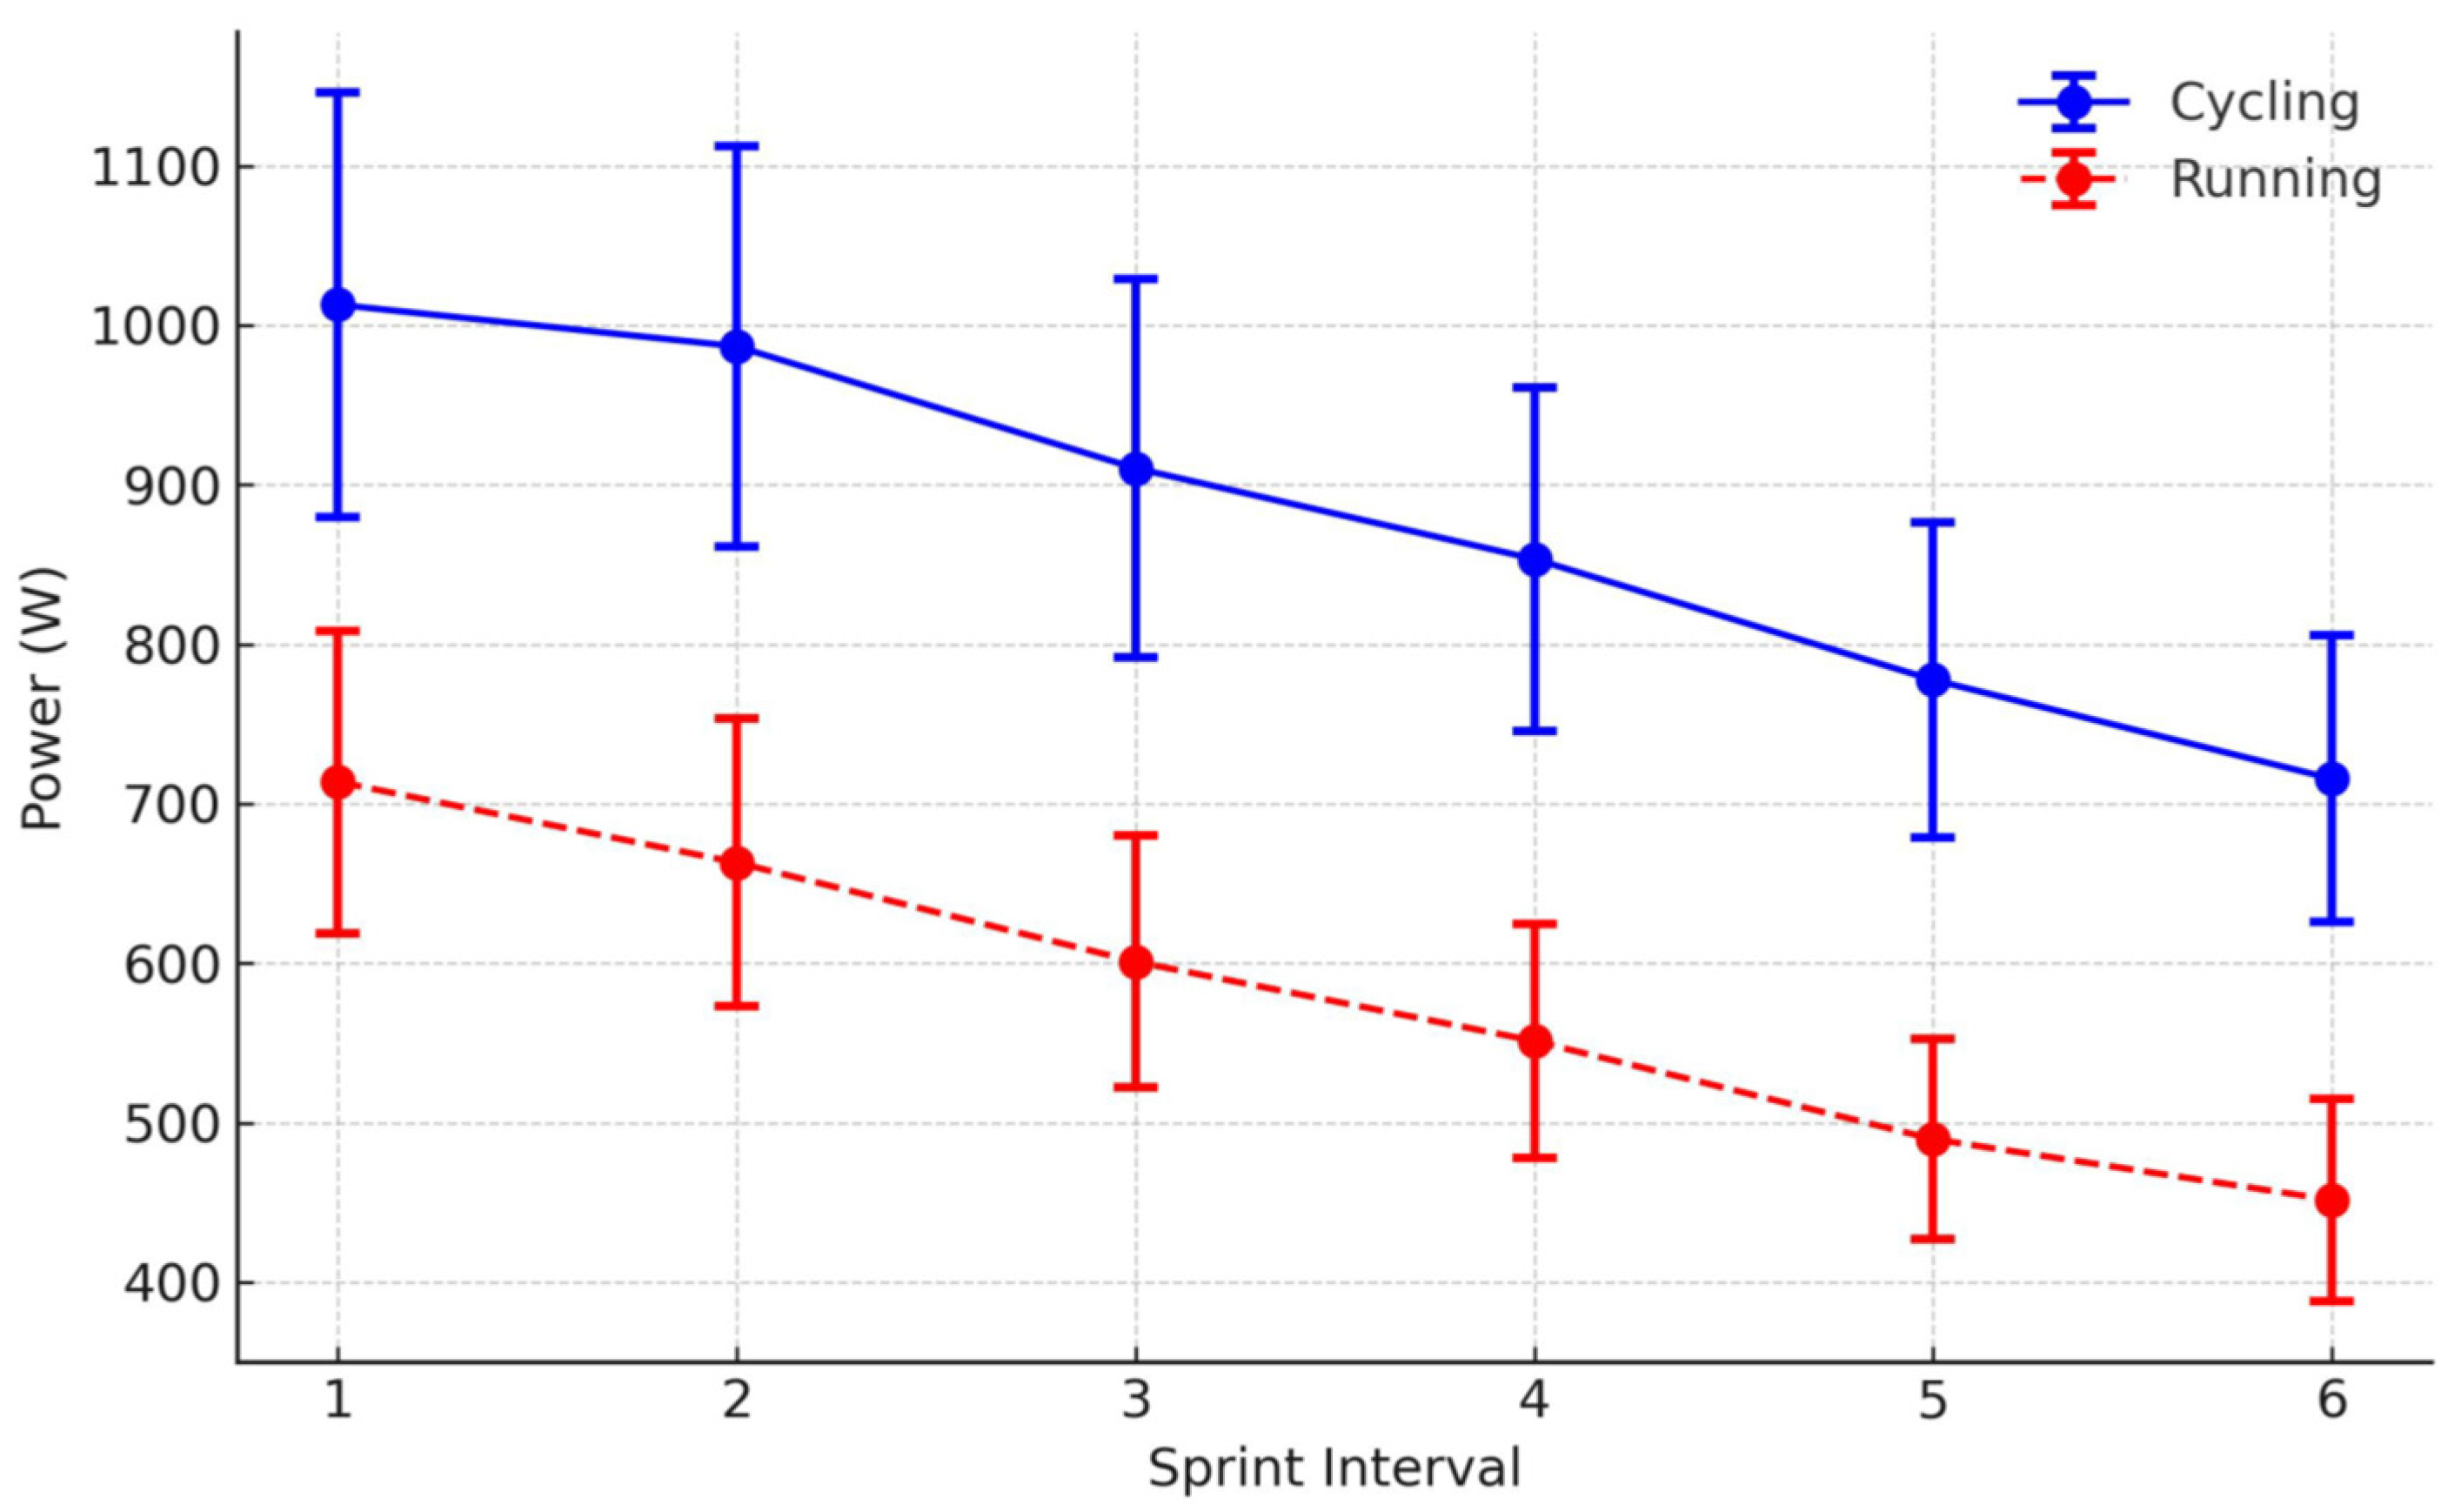
Means and standard deviation were calculated for each parameter. After completing descriptive statistics of all variables, the Shapiro–Wilk test was used for verification of data normality. The assumptions of sphericity were assessed by Mauchly’s test and demonstrated that the assumptions were not violated. A one-way analysis of variance for repeated measures was used to compare the physiological and performance variables between the different sprint modalities. Partial eta square (η2) values were calculated for the effect size in the ANOVA. η2 values of 0.01 indicate a small effect, 0.06 indicate a medium effect, and values of 0.14 or greater indicate a large effect [35]. To elucidate the relationships between different performance metrics (peak power, mean power, and fatigue index) from cycling and running sprint tests, correlation coefficients were calculated and visualised using heatmaps. A simple linear regression was used to establish the coefficient of determination of the relationship between performance variables and energy systems contributions for the repeated sprint modalities. The data were analysed by using the Statistical Package for the Social Sciences version 21.0 (IBM Corp., Armonk, NY, USA), and significance was set at p ≤ 0.05.

3. Results

The descriptive data of the time results of the running and cycling repeated sprint test are presented in Table 1. The cycling sprint times of each player were constructed from the average sprint times in the running test.
The mean values (±SD) for the physiological response and performance variable measurements recorded during the running and the cycling are summarised in Table 2. Significantly greater values for the PP, MP, and RPE were observed in the cycling (p < 0.05), whereas the HRpeak and lactate responses were similar. For the fatigue index, a statistically significant difference was observed, and this difference was higher in the running test (p < 0.05).
Figure 2 displays the peak power output for each sprint interval (running) compared with the power output from cycling partitioned into six 5.37 s intervals.
Regarding the estimated contribution of the energy systems and the energy expenditure (see Table 3), higher values were observed for the percentage and absolute contributions of the ATP-PCr system (p < 0.01), energy demand (p < 0.01), TEE (p < 0.01), PCr_Breaks (p < 0.01), and PCr_Epocfast (p < 0.01) in the running test. However, no difference was observed for the glycolytic and oxidative systems percentage and absolute contributions (Figure 3).
Table 4 presents the coefficient of determination (r2) values, detailing the relationships between different energy system contributions and performance variables across repeated sprint modalities in running and cycling. The results illustrate significant correlations for the ATP-PCr and glycolytic energy systems with their respective performance outputs in both modalities, highlighting their crucial roles in short-duration, high-intensity efforts. Specifically, the ATP-PCr system shows the strongest correlation (r2 = 0.58 for running and r2 = 0.46 for cycling with p < 0.01), underscoring its dominance in energy supply during these activities. Conversely, the oxidative system exhibits lower r2 values (r2 = 0.31 for running and r2 = 0.29 for cycling), which were not statistically significant (p = 0.078 and p = 0.081, respectively). This suggests a less pronounced but still measurable contribution of the oxidative pathway under the conditions of short sprint tests. Such findings indicate that, while the oxidative system is engaged during these sprints, its role may be overshadowed by the more immediate energy contributions from anaerobic sources. The negative coefficients observed for the fatigue index (r2 = −0.14 and r2 = −0.11 with p < 0.05) in both modalities further suggest an inverse relationship between anaerobic energy system contributions and fatigue, implying that a higher anaerobic output might correlate with greater fatigue.
Figure 4 represents the correlation coefficients between the cycling and running sprint test performance metrics. Notably, the mean power (MP) exhibits a moderate positive correlation (0.41) across the two modalities, indicating a significant consistency in power output between the cycling and running tests. This consistency suggests that, while the exercise modalities differ, the relative demand and output in terms of MP are comparably measurable. The heatmap also highlights a weaker correlation (0.08) for the fatigue index across modalities, which points to the varying fatigue dynamics between the cycling and running sprints. This discrepancy underscores the necessity of selecting sport-specific tests that align more closely with the actual performance demands and fatigue profiles experienced in competitive settings.

4. Discussion

The present study systematically compared the physiological demands and performance outcomes between cycling and running sprint tests among professional soccer players. The main results underscore the distinctive energy demands and system contributions specific to each modality, which bear significant implications for athletic training and performance optimisation. The core objective of this investigation is to bridge a gap in knowledge by comparing the physiological demands and performance outcomes of cycling versus running sprints, thereby offering insights into the most appropriate testing modality for soccer players. The primary outcomes highlighted significant statistical differences in performance and physiological reactions between the cycling and running assessments, excluding lactate changes and the peak heart rate (HRpeak). Importantly, it was observed that the running tests elicited a greater total energy expenditure (TEE) and energy demand from the participants. Contrary to previous assumptions, the performance correlations between the test protocols (running and cycling) were less robust than anticipated. This finding suggests that cycling might not be the optimal modality for testing repeated sprint ability (RSA) in running based sports as soccer.

4.1. Performance Metrics Differences

When examining the performance metrics, the study identified notable differences between the cycling and running tests. Cycling demonstrated higher peak power and mean power outputs, whereas the running tests were characterised by a higher fatigue index. This suggests a distinct stress profile for each test type, impacting athlete performance differently. This conclusion is supported by the distinct performance metrics (PP, MP, FI, and RPE) and energy system contributions when cycling- and running-based RSA assessments are compared. Recording the power output at 5 m intervals during each 35 m sprint in the running test might have revealed a higher PP associated with specific sprints, compared to the cycling test. This study observed important increases in blood lactate levels post-exercise; yet, no notable difference was found in the Lactate delta (mmol·L−1) between the cycling and running tests. Determining the precise contribution of glycolysis is challenging, partly due to the variability in measurement timings across different activity modes. Furthermore, participants reported higher RPE values during cycling compared to running, while the FI% was elevated in the running test, as detailed in Table 2. Previous studies suggest that the distinct physiological characteristics evaluated in running and cycling may be attributed to running being inherently more familiar than cycling [36].The interplay between muscular strength and the optimal pedalling frequency partially explains the heightened perception of effort observed in cycling [37]. The FI% is influenced by the nature of recovery—active or passive—in repeated sprint tests employing different sprint protocols (running and cycling) [38]. Research indicates that passive recovery exerts a more favourable impact on FI% compared to active recovery [37,39]. These findings corroborate the results of our study, wherein athletes typically engage in more passive forms of rest (such as sitting) during cycling tests compared to running tests: “While both modalities included passive rest between sprints, the difference in energy demand between standing rest (in the running modality) and seated rest (in the cycling modality) could potentially explain some of the discrepancies in FI%”.

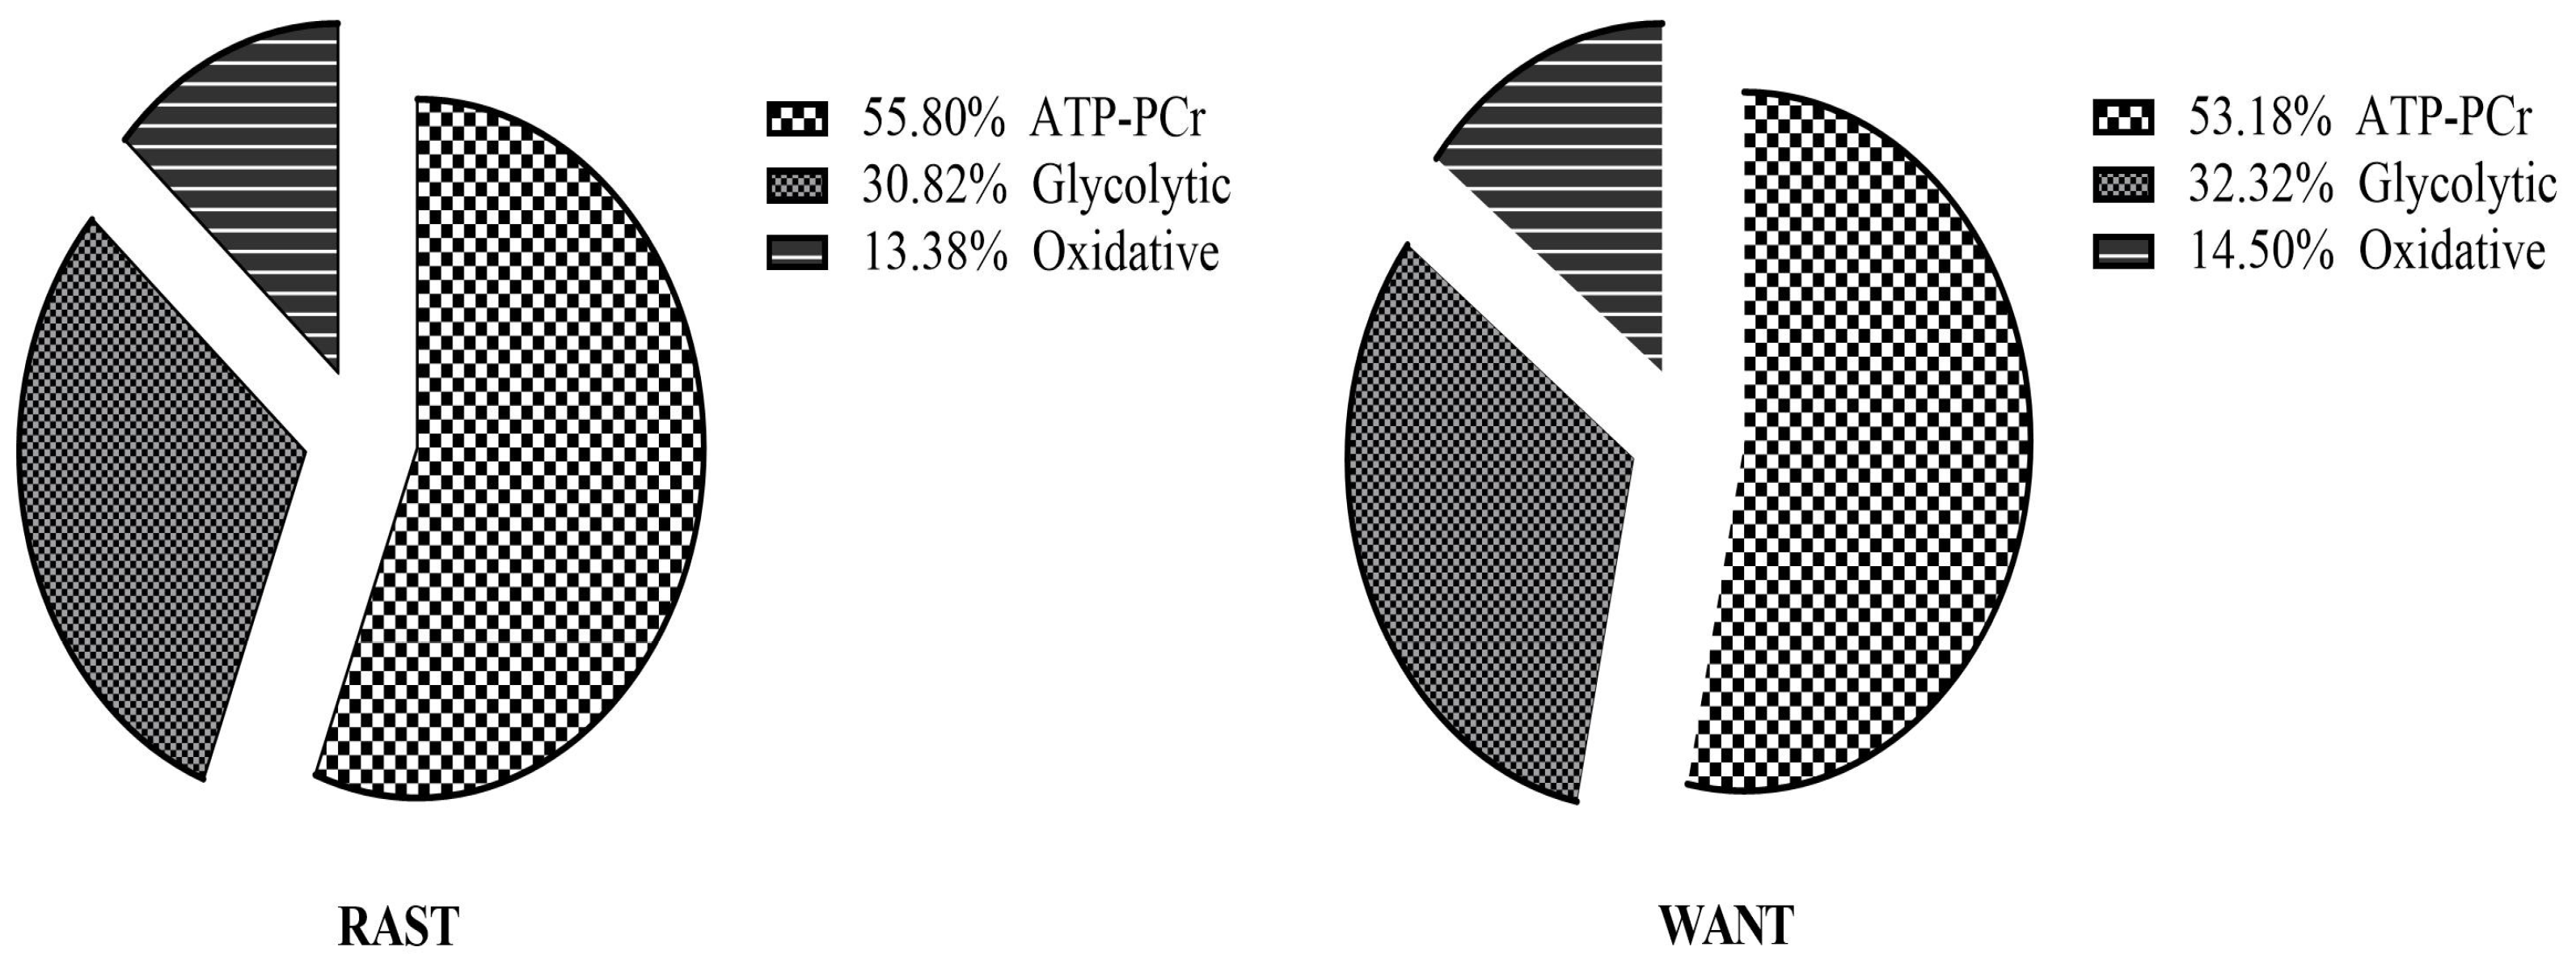
4.2. Total Energy Expenditure (TEE)

The total energy expenditure (TEE) was markedly greater in running tests compared to cycling. This finding aligns with the hypothesis that running requires a broader engagement of muscle groups, leading to higher overall energy expenditure. The comparison of these outcomes with existing studies reveals that, while cycling may be less demanding in terms of energy expenditure, it is crucial for assessing specific aspects of anaerobic power and endurance. Running and cycling elicit distinct central and peripheral sensations with respect to localised perceived effort [40]. In the context of this study, central and peripheral sensations refer to the subjective feelings of exertion experienced by the athletes, which can be influenced by both central factors (such as cardiovascular and respiratory strain) and peripheral factors (including muscle fatigue and metabolic accumulation in the limbs). Localised perceived effort specifically denotes the subjective exertion felt in particular muscle groups engaged during the exercise, reflecting localised muscle fatigue and stress more directly associated with the specific activity (running or cycling).
Given that running demands a higher oxygen consumption [37], it is not surprising that measures such as energy demand, TEE, PCr_Breaks (kJ), and PCr_Epocfast (kJ) were significantly greater in running compared to cycling, as illustrated in Table 3. Additionally, running involves the engagement of postural and upper extremity muscles, contributing to its higher energy demands. This engagement results in a more substantial overall contribution of VO2 from the upper body muscles in running, as opposed to cycling, which shows a comparatively lower VO2 contribution from the metabolic expenditure of upper body activities [40,41]. Electromyographic studies further reveal significant phasic activity in the arm and trunk muscles during running, indicating that the upper body musculature plays a crucial role in oxygen utilisation [42]. The diminished energy demand observed in cycling can be attributed to the significant intramuscular tension during repeated sprints and the strong correlation between the recruitment of type II motor units and the necessity for muscle force generation [41]. Elevated intramuscular pressures may also lead to the partial occlusion of the femoral arterial blood flow, subsequently reducing oxygen delivery and increasing the recruitment of type II motor units [41]. When contrasting running with cycling, the overall VO2 response measured at the mouth predominantly reflects the oxygen consumption in the legs [43].

4.3. Glycolytic Contribution

The glycolytic energy system’s role appeared consistent across both test modalities, with no significant differences in lactate production. This uniformity suggests a balanced contribution from glycolysis during high-intensity repeated sprints, irrespective of the modality. While the glycolytic pathway is recognised as essential for energy production in high-intensity, short-duration cycling efforts [44], its exact impact on enhancing RSA remains unclear [8]. The similarity in the Lactate delta across both protocols suggests that the rates of ATP synthesis through glycolysis were comparable. The glycolytic contribution has been associated with the sprint distance or duration and recovery time [45]. Given that a similar repeated sprint test (RST) protocol was employed in both the cycling and running modalities in our study, it is not surprising that the glycolytic contributions were similar between these modalities. For example, Ulupınar et al. (2021) noted in their study that athletes exhibited higher lactate responses in a 10 × 40 m sprint protocol compared to a 20 × 20 m protocol, despite both having identical total sprint distances. This suggests that, with other factors constant, an increase in sprint distance or duration, or a decrease in recovery time, intensifies the lactate response to exercise [28].

4.4. ATP-PCr Contribution

Significant findings regarding the ATP-PCr system highlight its higher contribution in the running tests, likely due to the increased need for rapid energy repletion. This is crucial for sports that require quick recoveries between high-intensity efforts, such as soccer, illustrating the PCr system’s importance in sport-specific performance contexts. In both the running and cycling protocols, the ATP-PCr system’s absolute and relative contributions were more pronounced compared to the glycolytic and oxidative energy systems contribution. Notably, the ATP-PCr system’s contribution in running was statistically different from that in cycling, with running demonstrating a higher ATP-PCr contribution as depicted in Table 3. However, the outcomes from performance variables did not align with these physiological findings. The performance data showed a higher PP and MP in the cycling test compared to the running test as indicated in Table 2. The post-sprint VO2-time integral offers a viable metric for assessing the contribution of PCr stores, especially considering that the replenishment of PCr stores is presumed to be the primary objective during the rest intervals between sprints [16,17,18]. This methodology represents the only current non-invasive approach for discerning the contributions from three distinct energy systems [46,47,48,49].

4.5. Oxidative Contribution

In the comparative analysis of repeated sprint tests conducted through both the cycling and running modalities, it is noteworthy that the oxidative energy system contributions were remarkably similar in both conditions. This consistent contribution, as reflected by the nearly equivalent percentages and absolute values observed in the oxidative system, highlights an essential aspect of energy metabolism in high-intensity interval training, irrespective of the exercise modality. In both cycling and running tests, the percentage contribution of the oxidative system was recorded at 13.4 ± 2.4% and 14.5 ± 2.6%, respectively, showcasing negligible differences between the modalities. This uniformity in oxidative contributions across different sports modalities can be attributed to the inherent design of the repeated sprint protocols, which involve brief, high-intensity efforts followed by short recovery periods. These conditions stimulate the oxidative system similarly across different types of activities because the primary role of this system under such exercise conditions is to aid in rapid recovery, which is crucial regardless of the exercise type. For example, Bogdanis et al. (1998) demonstrated that, in 6 to 10 cycling sprints, the glycolytic system’s contribution to total ATP resynthesis exceeds 40%, while the oxidative system’s contribution remains minimal [50]. Similarly, in our study, which involved sprints with a mean duration of 5.37 s, we found comparable patterns between running and cycling. Specifically, the contributions from the glycolytic systems in both modalities were similar and significant, while the contributions from the oxidative systems were minimal across both modalities. This highlights that, regardless of the modality—running or cycling—the oxidative system plays a limited role in energy production during these short, intense efforts. Beneke et al. (2002) employed a methodology similar to ours to measure the net energy system contribution during the Wingate Test, observing an approximate 18% contribution from oxidative phosphorylation [44]. By applying the RAST test protocol, Millioni et al. (2017) found significantly higher values in the Wingate Test [12], which indicates that the 10 s intervals between sprints might have increased the influence of oxidative phosphorylation on RSA. Additionally, due to the brief recovery intervals, the oxygen consumed was attributed to the oxidative phosphorylation system, rather than PCr replenishment [12]. These findings align with those of Mendez-Villanueva et al. (2012), who posited that non-mitochondrial metabolism plays a critical role in musculoskeletal performance during sprints, regardless of the absolute force generated. Mendez-Villanueva et al. applied a rigorous test protocol involving ten 6 s all-out sprints on a cycle ergometer, each interspersed with 30 s of recovery. This was followed by a 6 min passive recovery period, then a second set of five 6 s sprints, again each separated by 30 s of passive recovery, emphasising the pivotal role of non-mitochondrial energy pathways in high-intensity intermittent exercises [51].

4.6. Rate of Perceived Exertion (RPE)

During the cycling tests, athletes reported a higher RPE of 16.2 ± 1.4 compared to 13.4 ± 1.1 in the running tests. This differential in perceived exertion highlights the distinct physiological demands and athlete responses to the type of exercise performed. Cycling, often perceived as more strenuous in this context, might reflect the specific muscular and cardiovascular demands unique to this modality, which includes sustained pedalling against resistance that may not directly correlate with the dynamic actions in running.

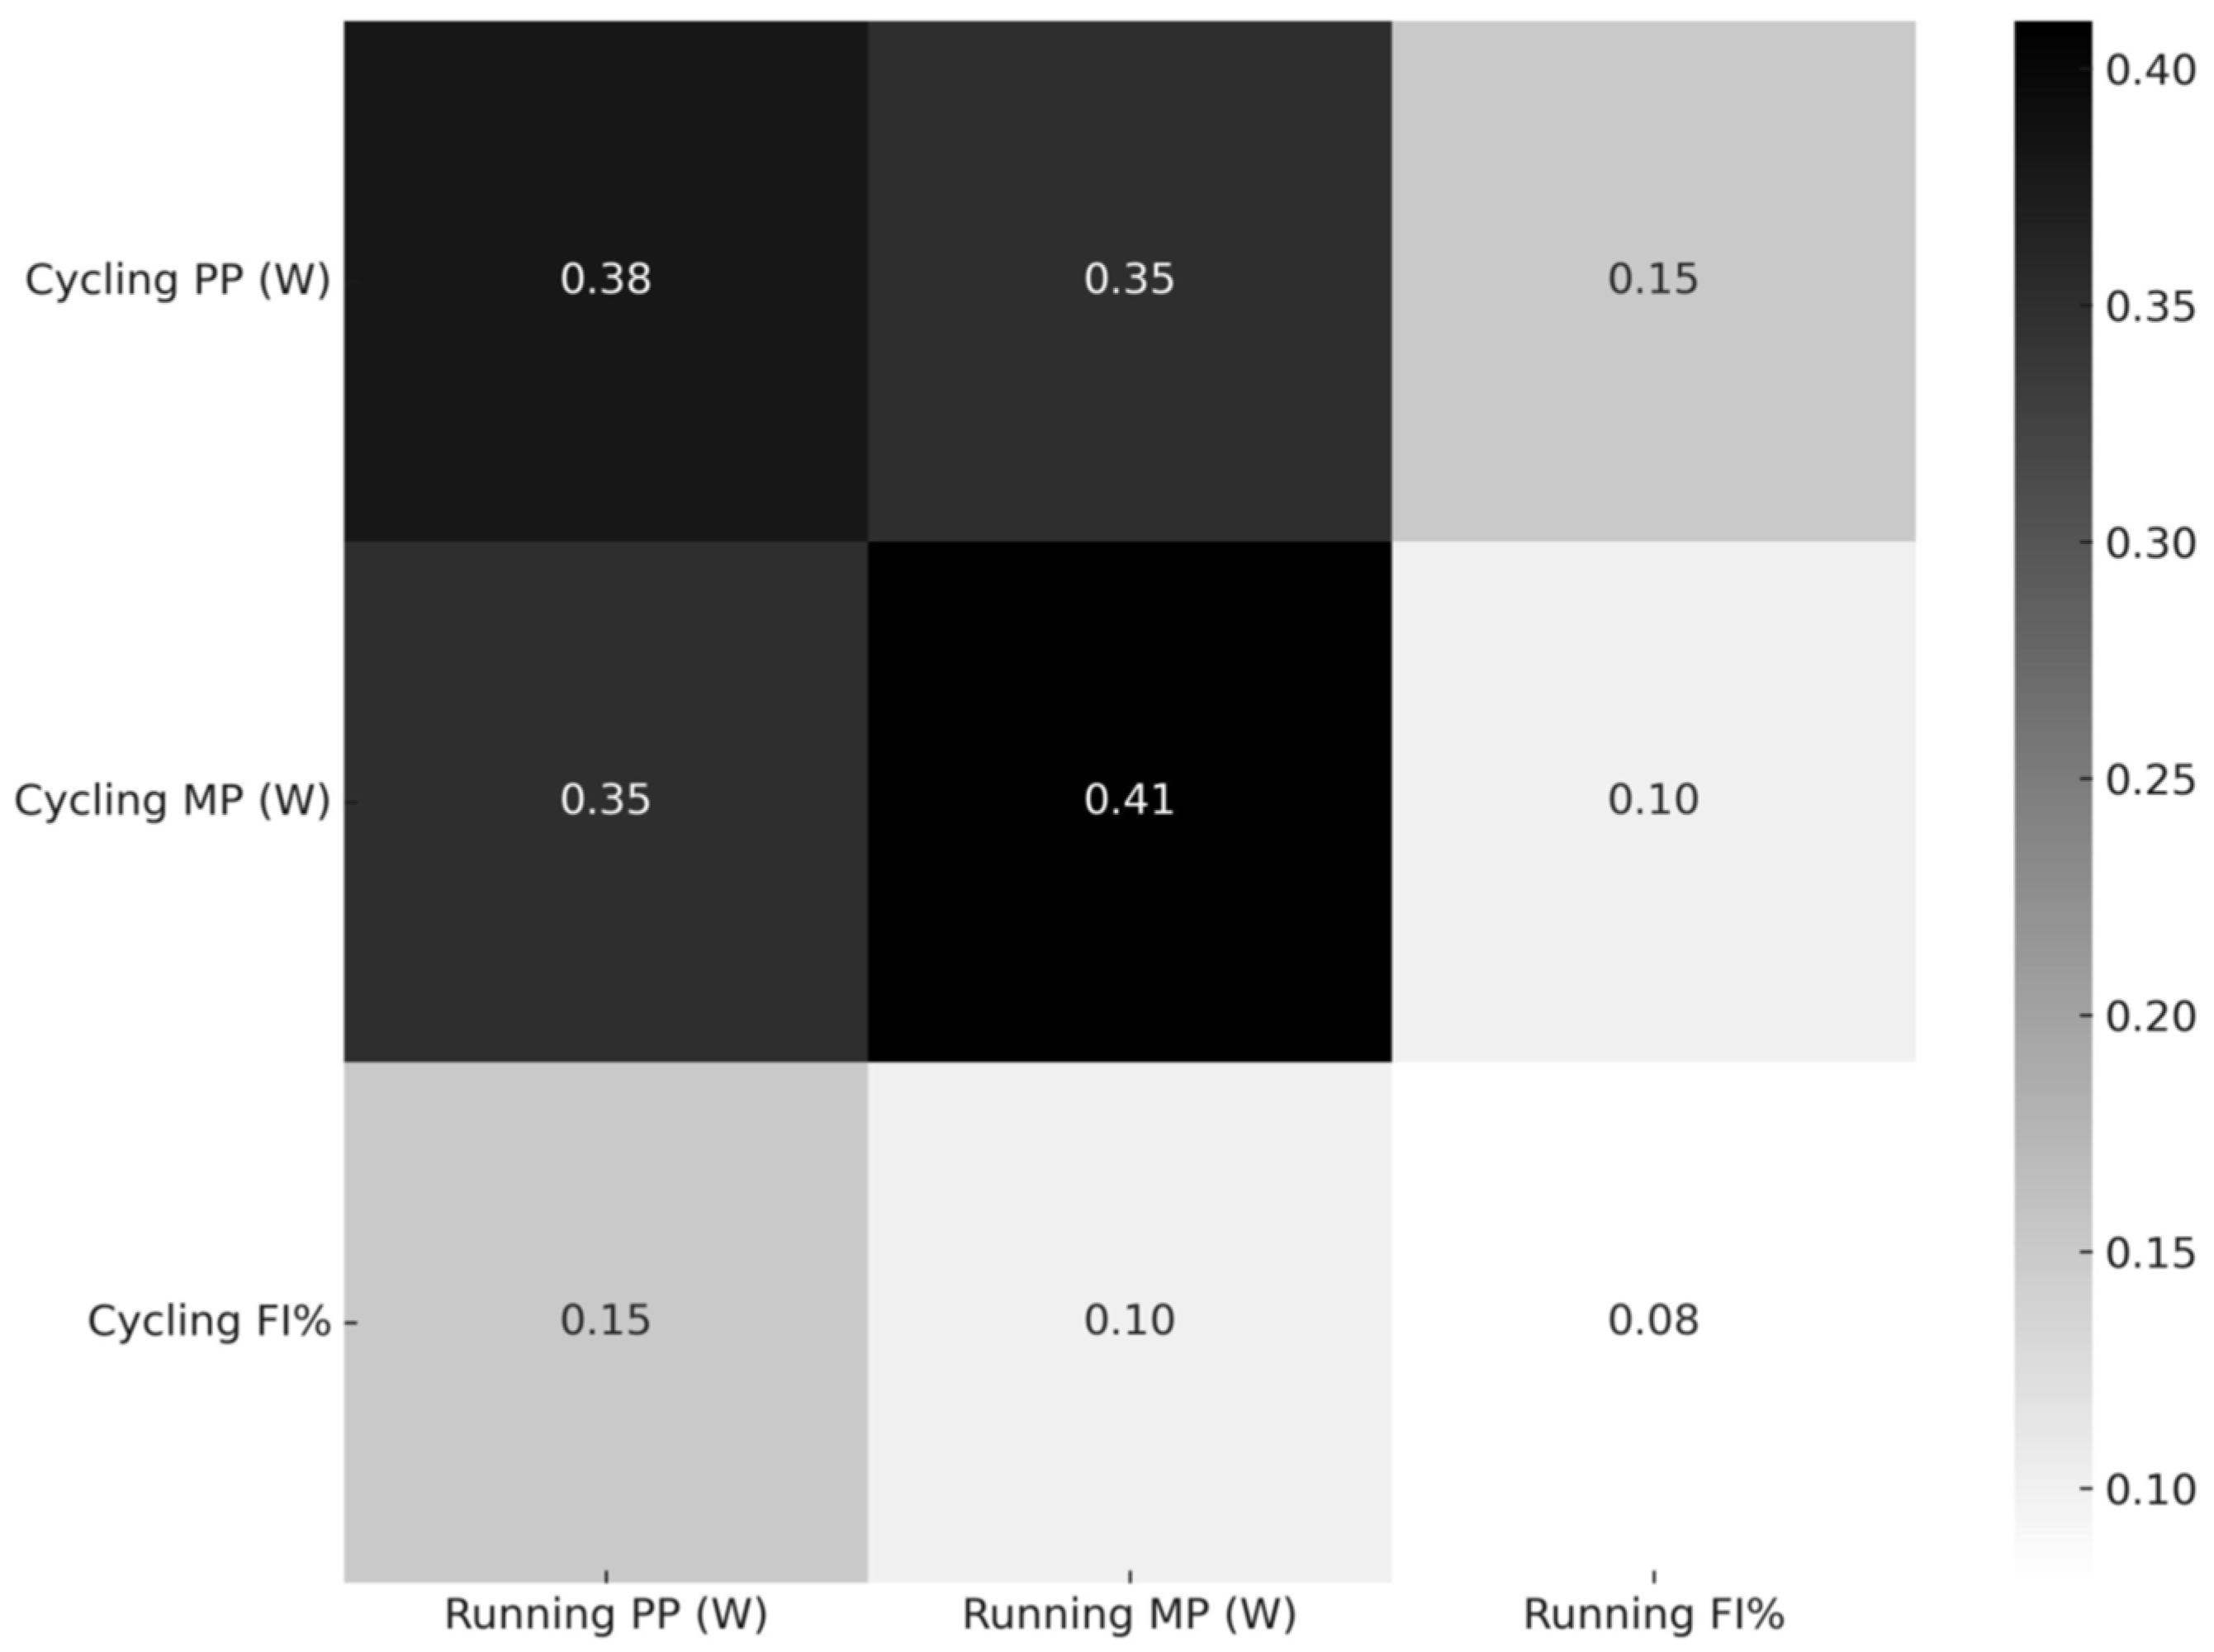
4.7. Associations between Energy Systems and Performance

This study has illuminated the intricate relationship between energy systems and performance outcomes in the context of repeated sprint tests, examining both the cycling and running modalities. An important finding from the analysis is the notable similarities in how energy systems correlate with performance across these different exercise modalities. The analysis of energy system contributions to performance metrics revealed that, while the specific contributions from the ATP-PCr and glycolytic systems exhibited some variations between cycling and running, the associations between these energy systems and performance outcomes were broadly consistent across modalities. This suggests a uniform influence of energy system dynamics on performance, regardless of the exercise type. In both the running and cycling tests, the ATP-PCr system showed a significant correlation with peak power outputs, which aligns with previous research suggesting that the immediate energy supply from phosphocreatine breakdown is crucial for high-intensity, short-duration efforts. The glycolytic system, although slightly more variable, still correlated positively with the mean power outputs in both modalities, underscoring its role in sustaining performance over the duration of the sprints. In related research, Ulupınar and Özbay (2022) reported the contributions of the ATP-PCr, glycolytic, and oxidative energy systems as 68%, 17%, and 14%, respectively, following a 10 × 6 s sprint [46]. Contrastingly, in our study, the values were 56%, 31%, and 13% for running, and 53%, 32%, and 15% for cycling. These variances may stem from different sample groups (indoor team sports athletes vs. combat athletes) or the specific RSA test mode employed. Additionally, running and cycling involve distinct forms of muscle contraction. In running, the support phase, where the foot maintains ground contact, constitutes approximately 60% of the stride time at speeds ranging from 12 to 23 km/h. This phase includes around 34% eccentric muscle activation. Such eccentric muscle activity can significantly influence the oxygen consumption during running, as eccentric exercise is known to have a substantially lower metabolic demand compared to equivalent concentric activity [52]. Furthermore, Bertuzzi et al. [53] identified strong correlations between the results of the Wingate Test against a resistance of 0.09 kg/kg body mass and the contributions of the phosphagen and glycolytic pathways, as measured by the maximal accumulated oxygen deficit. Wadley and Le Rossignol [54], in their study of 12 × 20 m running sprints with 20 s recoveries, and Gaitanos et al. [16], in their examination of 10 × 6 s sprints with 30 s of passive rest on a cycle ergometer, both suggested that PCr plays an essential role in ATP resynthesis during RSA. Our study corroborates this, highlighting the crucial role of the ATP-PCr energy system in RSA performance.
The results of this study, when juxtaposed with the findings from Zagatto et al. (2009), provide a comprehensive understanding of the applicability and relevance of different sprint test modalities in assessing anaerobic power and capacity. Our analysis revealed that running-based tests show higher contributions from the ATP-PCr system, which aligns with the higher total energy expenditure and indicates a significant reliance on this energy system for high-intensity efforts, particularly relevant in field sports like soccer. These findings resonate with the significant correlations between the RAST and Wingate test results as noted by Zagatto et al., which demonstrated the utility of RAST in capturing the anaerobic components crucial to performance across a range of short distances [5]. The parallel drawn here emphasises the importance of selecting sport-specific testing protocols that accurately reflect the performance and energy system demands inherent in the sport, enhancing the training and preparedness of athletes.

4.8. Limitations

This study, while providing insights into metabolic energy contributions during repeated sprint tests, acknowledges several methodological limitations that may influence the interpretation of the results. A significant limitation is the measurement of lactate concentrations solely before and after the exercise protocols without capturing the intra-exercise kinetics. This omission restricts our understanding of real-time lactate dynamics and their interaction with metabolic pathways during high-intensity activity. Additionally, attributing all oxygen consumption during recovery intervals and the fast phase of excess post-exercise oxygen consumption exclusively to the ATP-PCr system overlooks potential contributions from myoglobin re-oxygenation, which could affect the accuracy of our energy system estimations. Furthermore, the study employs a previously validated equation to estimate the power output during the running tests, designed for constant-speed assessments. This equation does not account for speed variations, particularly the acceleration phases critical in sport-specific activities, leading to potential discrepancies in the power output measurements between the running and cycling tests. This limitation underscores the need for refined measurement techniques that can more accurately reflect the dynamic nature of sport-specific performance, ensuring both the validity and applicability of the findings in practical sports settings.

5. Conclusions

This study elucidated the similarities and differences in energy system contributions and performance outcomes between cycling and running repeated sprint protocols with comparable total sprint times and work–rest ratios. The key findings reveal that running repeated sprint tests elicit a higher energy demand and a greater contribution from the phosphocreatine (PCr) energy system compared to cycling. Specifically, running tests demonstrated significantly higher values in TEE, energy demand, and PCr-related metrics, which underscores the greater anaerobic demand associated with running sprints. The performance variables showed distinct differences between the modalities, with a higher PP and MP observed in the cycling tests, while the FI was notably higher in the running tests. These differences suggest that running and cycling sprints impose different physiological demands and may not be used interchangeably for assessing RSA in athletes, particularly in sports such as soccer where running is more prevalent. The association between the performance variables and energy system contributions was also explored. The ATP-PCr system showed a significant correlation with peak power outputs, highlighting its crucial role in high-intensity, short-duration efforts. The glycolytic system’s contributions were consistent across both modalities, while the oxidative system played a minimal role during the sprints but was essential for recovery.
Future research should aim to explore several key areas to enhance our understanding of the energy system contributions and performance metrics in repeated sprint tests. Longitudinal studies investigating the long-term effects of specific training programs on the energy system adaptations and RSA performance in different sports modalities are essential. Additionally, studies measuring the real-time lactate dynamics and oxygen consumption during exercise will provide a more comprehensive understanding of the metabolic contributions. Developing and validating sport-specific RSA testing protocols that closely mimic actual performance demands and fatigue profiles experienced during competition is crucial. Furthermore, examining the effects of varying recovery intervals (active vs. passive) on performance outcomes and energy system contributions will help optimise training regimens for different sports. Finally, integrating advanced wearable technology for the continuous monitoring of physiological parameters can enhance the data accuracy and applicability in real-world settings. These research directions will aid in designing more effective training programs tailored to the specific needs of athletes, thereby improving performance and reducing injury risk.

Author Contributions

Conceptualisation, E.T. and G.D.; methodology, G.D. and E.T.; validation, G.D. and E.T.; formal analysis, G.D. and E.T.; investigation, G.D. and E.T.; resources, G.D. and E.T.; data curation, G.D. and E.T.; writing—original draft preparation, G.D. and E.T.; writing—review and editing, G.D. and E.T.; visualisation, E.T.; supervision, E.T. All authors have read and agreed to the published version of the manuscript.

Funding

This study was funded by the Trabzon University Research Fund (22HZP00211).

Institutional Review Board Statement

The study was conducted in accordance with the Declaration of Helsinki, and the protocol was approved by the Ethics Committee of the University of Trabzon (resolution 4 October 2022). Before the study, written informed consent to participate in the study was obtained from all the participants.

Informed Consent Statement

Informed consent was obtained from all subjects involved in the study.

Data Availability Statement

The raw data supporting the conclusions of this article will be made available by the authors on request.

Acknowledgments

The author thanks the athletes who participated in this study.

Conflicts of Interest

The author declares no conflicts of interest.

References

  1. Rodríguez-Fernández, A.; Sanchez-Sanchez, J.; Ramirez-Campillo, R.; Nakamura, F.Y.; Rodríguez-Marroyo, J.A.; Villa-Vicente, J.G. Relationship between repeated sprint ability, aerobic capacity, intermittent endurance, and heart rate recovery in youth soccer players. J. Strength Cond. Res. 2019, 33, 3406–3413. [Google Scholar] [CrossRef] [PubMed]
  2. Redkva, P.E.; Paes, M.R.; Fernandez, R.; da-Silva, S.G. Correlation between match performance and field tests in professional soccer players. J. Hum. Kinet. 2018, 62, 213. [Google Scholar] [CrossRef] [PubMed]
  3. Bradley, P.S.; Di Mascio, M.; Peart, D.; Olsen, P.; Sheldon, B. High-intensity activity profiles of elite soccer players at different performance levels. J. Strength Cond. Res. 2010, 24, 2343–2351. [Google Scholar] [CrossRef] [PubMed]
  4. Padulo, J.; Tabben, M.; Ardigò, L.; Ionel, M.; Popa, C.; Gevat, C.; Zagatto, A.; Iacono, A.D. Repeated sprint ability related to recovery time in young soccer players. Res. Sports Med. 2015, 23, 412–423. [Google Scholar] [CrossRef] [PubMed]
  5. Zagatto, A.M.; Beck, W.R.; Gobatto, C.A. Validity of the running anaerobic sprint test for assessing anaerobic power and predicting short-distance performances. J. Strength Cond. Res. 2009, 23, 1820–1827. [Google Scholar] [CrossRef] [PubMed]
  6. Zacharogiannis, E.; Paradisis, G.; Tziortzis, S. An evaluation of tests of anaerobic power and capacity. Med. Sci. Sports Exerc. 2004, 36, S116. [Google Scholar] [CrossRef]
  7. Fang, B.; Kim, Y.; Choi, M. Effect of cycle-based high-intensity interval training and moderate to moderate-intensity continuous training in adolescent soccer players. Healthcare 2021, 9, 1628. [Google Scholar] [CrossRef] [PubMed]
  8. Girard, O.; Mendez-Villanueva, A.; Bishop, D. Repeated-sprint ability-part I: Factors contributing to fatigue. Sports Med. 2011, 41, 673–694. [Google Scholar] [CrossRef] [PubMed]
  9. Spencer, M.; Bishop, D.; Dawson, B.; Goodman, C. Physiological and metabolic responses of repeated-sprint activities: Specific to field-based team sports. Sports Med. 2005, 35, 1025–1044. [Google Scholar] [CrossRef]
  10. Keir, D.A.; Thériault, F.; Serresse, O. Evaluation of the running-based anaerobic sprint test as a measure of repeated sprint ability in collegiate-level soccer players. J. Strength Cond. Res. 2013, 27, 1671–1678. [Google Scholar] [CrossRef]
  11. Brocherie, F.; Girard, O.; Forchino, F.; Al Haddad, H.; Dos Santos, G.A.; Millet, G.P. Relationships between anthropometric measures and athletic performance, with special reference to repeated-sprint ability, in the Qatar national soccer team. J. Sports Sci. 2014, 32, 1243–1254. [Google Scholar] [CrossRef]
  12. Milioni, F.; Zagatto, A.M.; Barbieri, R.A.; Andrade, V.L.; dos Santos, J.W.; Gobatto, C.A.; da Silva, A.S.R.; Santiago, P.R.P.; Papoti, M. Energy systems contribution in the running-based anaerobic sprint test. Int. J. Sports Med. 2017, 38, 226–232. [Google Scholar] [CrossRef]
  13. Nara, K.; Kumar, P.; Rathee, R.; Kumar, J. The compatibility of running-based anaerobic sprint test and Wingate anaerobic test: A systematic review and meta-analysis. Pedagog. Phys. Cult. Sports 2022, 26, 134–143. [Google Scholar] [CrossRef]
  14. Zagatto, A.; Redkva, P.; Loures, J.; Filho, C.K.; Franco, V.; Kaminagakura, E.; Papoti, M. Anaerobic contribution during maximal anaerobic running test: Correlation with maximal accumulated oxygen deficit. Scand. J. Med. Sci. Sports 2011, 21, e222–e230. [Google Scholar] [CrossRef]
  15. Chatterjee, S.; Chakraborty, S.; Chatterjee, S. Validity and reliability study of the running-based anaerobic sprint test for evaluating anaerobic power performance as compared to Wingate test in Indian male track and field sprinters. Eur. J. Phys. Educ. Sport Sci. 2022, 8. [Google Scholar] [CrossRef]
  16. Gaitanos, G.C.; Williams, C.; Boobis, L.H.; Brooks, S. Human muscle metabolism during intermittent maximal exercise. J. Appl. Physiol. 1993, 75, 712–719. [Google Scholar] [CrossRef] [PubMed]
  17. Bogdanis, G.C.; Nevill, M.E.; Boobis, L.H.; Lakomy, H.; Nevill, A.M. Recovery of power output and muscle metabolites following 30 s of maximal sprint cycling in man. J. Physiol. 1995, 482, 467–480. [Google Scholar] [CrossRef] [PubMed]
  18. Dawson, B.; Goodman, C.; Lawrence, S.; Preen, D.; Polglaze, T.; Fitzsimons, M.; Fournier, P. Muscle phosphocreatine repletion following single and repeated short sprint efforts. Scand. J. Med. Sci. Sports 1997, 7, 206–213. [Google Scholar] [CrossRef] [PubMed]
  19. Merrigan, J.J.; Stovall, J.H.; Stone, J.D.; Stephenson, M.; Finomore, V.S.; Hagen, J.A. Validation of Garmin and Polar devices for continuous heart rate monitoring during common training movements in tactical populations. Meas. Phys. Educ. Exerc. Sci. 2023, 27, 234–247. [Google Scholar] [CrossRef]
  20. Borg, G. Borg’s Perceived Exertion and Pain Scales: Human Kinetics; American Psychological Association: Champaign, IL, USA, 1998. [Google Scholar]
  21. Guidetti, L.; Meucci, M.; Bolletta, F.; Emerenziani, G.P.; Gallotta, M.C.; Baldari, C. Validity, reliability and minimum detectable change of COSMED K5 portable gas exchange system in breath-by-breath mode. PLoS ONE 2018, 13, e0209925. [Google Scholar] [CrossRef]
  22. Hart, S.; Drevets, K.; Alford, M.; Salacinski, A.; Hunt, B.E. A method-comparison study regarding the validity and reliability of the Lactate Plus analyzer. BMJ Open 2013, 3, e001899. [Google Scholar] [CrossRef] [PubMed]
  23. Andrade, V.; Zagatto, A.; Kalva-Filho, C.; Mendes, O.; Gobatto, C.; Campos, E.; Papoti, M. Running-based anaerobic sprint test as a procedure to evaluate anaerobic power. Int. J. Sports Med. 2015, 36, 1156–1162. [Google Scholar] [CrossRef] [PubMed]
  24. Deminice, R.; Rosa, F.T.; Franco, G.S.; Jordao, A.A.; de Freitas, E.C. Effects of creatine supplementation on oxidative stress and inflammatory markers after repeated-sprint exercise in humans. Nutrition 2013, 29, 1127–1132. [Google Scholar] [CrossRef] [PubMed]
  25. Bogdanis, G.; Papaspyrou, A.; Lakomy, H.; Nevill, M. Effects of inertia correction and resistive load on fatigue during repeated sprints on a friction-loaded cycle ergometer. J. Sports Sci. 2008, 26, 1437–1445. [Google Scholar] [CrossRef] [PubMed]
  26. Oliver, J.L. Is a fatigue index a worthwhile measure of repeated sprint ability? J. Sci. Med. Sport 2009, 12, 20–23. [Google Scholar] [CrossRef] [PubMed]
  27. Latzel, R.; Hoos, O.; Stier, S.; Kaufmann, S.; Fresz, V.; Reim, D.; Beneke, R. Energetic profile of the basketball exercise simulation test in junior elite players. Int. J. Sports Physiol. Perform. 2018, 13, 810–815. [Google Scholar] [CrossRef] [PubMed]
  28. Ulupınar, S.; Özbay, S.; Gençoğlu, C.; Franchini, E.; Kishalı, N.F.; Ince, I. Effects of sprint distance and repetition number on energy system contributions in soccer players. J. Exerc. Sci. Fit. 2021, 19, 182–188. [Google Scholar] [CrossRef] [PubMed]
  29. di Prampero, P.E.; Ferretti, G. The energetics of anaerobic muscle metabolism: A reappraisal of older and recent concepts. Respir. Physiol. 1999, 118, 103–115. [Google Scholar] [CrossRef] [PubMed]
  30. La Monica, M.B.; Fukuda, D.H.; Starling-Smith, T.M.; Clark, N.W.; Panissa, V.L. Alterations in energy system contribution following upper body sprint interval training. Eur. J. Appl. Physiol. 2020, 120, 643–651. [Google Scholar] [CrossRef]
  31. Julio, U.F.; Panissa, V.L.; Esteves, J.V.; Cury, R.L.; Agostinho, M.F.; Franchini, E. Energy-system contributions to simulated judo matches. Int. J. Sports Physiol. Perform. 2017, 12, 676–683. [Google Scholar] [CrossRef]
  32. Julio, U.F.; Panissa, V.L.; Cury, R.L.; Agostinho, M.F.; Esteves, J.V.; Franchini, E. Energy system contributions in upper and lower body wingate tests in highly trained athletes. Res. Q. Exerc. Sport 2019, 90, 244–250. [Google Scholar] [CrossRef]
  33. Franchini, E.; Sterkowicz, S.; Szmatlan-Gabrys, U.; Gabrys, T.; Garnys, M. Energy system contributions to the special judo fitness test. Int. J. Sports Physiol. Perform. 2011, 6, 334–343. [Google Scholar] [CrossRef] [PubMed]
  34. Gastin, P.B. Energy system interaction and relative contribution during maximal exercise. Sports Med. 2001, 31, 725–741. [Google Scholar] [CrossRef] [PubMed]
  35. Lakens, D. Calculating and reporting effect sizes to facilitate cumulative science: A practical primer for t-tests and ANOVAs. Front. Psychol. 2013, 4, 863. [Google Scholar] [CrossRef] [PubMed]
  36. Rampinini, E.; Connolly, D.R.; Ferioli, D.; La Torre, A.; Alberti, G.; Bosio, A. Peripheral neuromuscular fatigue induced by repeated-sprint exercise: Cycling vs. running. J. Sports Med. Phys. Fit. 2016, 56, 49–59. [Google Scholar]
  37. Millet, G.P.; Vleck, V.E.; Bentley, D.J. Physiological differences between cycling and running: Lessons from triathletes. Sports Med. 2009, 39, 179–206. [Google Scholar] [CrossRef] [PubMed]
  38. Bishop, D.J. Fatigue during intermittent-sprint exercise. Clin. Exp. Pharmacol. Physiol. 2012, 39, 836–841. [Google Scholar] [CrossRef] [PubMed]
  39. Özdemir, F.M.; Yılmaz, A.; Kinişler, A. Genç Futbolcularda Tekrarlı Sprint Performansının Yaşa Göre İncelenmesi. Spor Bilim. Derg. 2014, 25, 1–10. [Google Scholar]
  40. Twist, C.; Bott, R.; Highton, J. The physiological, perceptual and neuromuscular responses of team sport athletes to a running and cycling high intensity interval training session. Eur. J. Appl. Physiol. 2023, 123, 113–120. [Google Scholar] [CrossRef]
  41. Carter, H.; Jones, A.M.; Barstow, T.J.; Burnley, M.; Williams, C.A.; Doust, J.H. Oxygen uptake kinetics in treadmill running and cycle ergometry: A comparison. J. Appl. Physiol. 2000, 89, 899–907. [Google Scholar] [CrossRef]
  42. Hinrichs, R. A Three-Dimensional Analysis of the Net Moments at the Shoulder and Elbow Joints in Running and Their Relationship to Upper-Extremity EMG activity; Human Kinetics Publishers: Champaign, IL, USA, 1985. [Google Scholar]
  43. Jones, A.M.; McConnell, A.M. Effect of exercise modality on oxygen uptake kinetics during heavy exercise. Eur. J. Appl. Physiol. Occup. Physiol. 1999, 80, 213–219. [Google Scholar] [CrossRef] [PubMed]
  44. Beneke, R.; Pollmann, C.; Bleif, I.; Leithäuser, R.; Hütler, M. How anaerobic is the Wingate Anaerobic Test for humans? Eur. J. Appl. Physiol. 2002, 87, 388–392. [Google Scholar] [CrossRef] [PubMed]
  45. Little, T.; Williams, A.G. Effects of sprint duration and exercise: Rest ratio on repeated sprint performance and physiological responses in professional soccer players. J. Strength Cond. Res. 2007, 21, 646–648. [Google Scholar] [CrossRef] [PubMed]
  46. Ulupınar, S.; Özbay, S. Energy pathway contributions during 60-second upper-body Wingate test in Greco-Roman wrestlers: Intermittent versus single forms. Res. Sports Med. 2022, 30, 244–255. [Google Scholar] [CrossRef] [PubMed]
  47. Panissa, V.L.; Fukuda, D.H.; Caldeira, R.S.; Gerosa-Neto, J.; Lira, F.S.; Zagatto, A.M.; Franchini, E. Is oxygen uptake measurement enough to estimate energy expenditure during high-intensity intermittent exercise? Quantification of anaerobic contribution by different methods. Front. Physiol. 2018, 9, 868. [Google Scholar] [CrossRef] [PubMed]
  48. Davis, P.; Leithäuser, R.M.; Beneke, R. The energetics of semicontact 3× 2-min amateur boxing. Int. J. Sports Physiol. Perform. 2014, 9, 233–239. [Google Scholar] [CrossRef] [PubMed]
  49. Franchini, E. Response to Beneke and Hoos: Letters to the Editor. Int. J. Sports Physiol. Perform. 2012, 7, 308–309. [Google Scholar] [CrossRef]
  50. Bogdanis, G.; Nevill, M.; Lakomy, H.; Boobis, L. Power output and muscle metabolism during and following recovery from 10 and 20 s of maximal sprint exercise in humans. Acta Physiol. Scand. 1998, 163, 261–272. [Google Scholar] [CrossRef]
  51. Mendez-Villanueva, A.; Edge, J.; Suriano, R.; Hamer, P.; Bishop, D. The recovery of repeated-sprint exercise is associated with PCr resynthesis, while muscle pH and EMG amplitude remain depressed. PLoS ONE 2012, 7, e51977. [Google Scholar] [CrossRef]
  52. di Prampero, P.E.; Ferretti, G. The Energetics and Biomechanics of Walking and Running. In Exercise, Respiratory and Environmental Physiology: A Tribute from the School of Milano; Springer: Berlin/Heidelberg, Germany, 2023; pp. 133–170. [Google Scholar] [CrossRef]
  53. Bertuzzi, R.; Kiss, M.; Damasceno, M.; Oliveira, R.; Lima-Silva, A. Association between anaerobic components of the maximal accumulated oxygen deficit and 30-second Wingate test. Braz. J. Med. Biol. Res. 2015, 48, 261–266. [Google Scholar] [CrossRef]
  54. Wadley, G.; Le Rossignol, P. The relationship between repeated sprint ability and the aerobic and anaerobic energy systems. J. Sci. Med. Sport 1998, 1, 100–110. [Google Scholar] [CrossRef] [PubMed]
Figure 1. Experimental design.
Applsci 14 06518 g001
Figure 2. Results of the power generated in each sprint of running and cycling.
Applsci 14 06518 g002
Figure 3. The percentage contribution of energy during running and cycling test protocols (sprints only).
Applsci 14 06518 g003
Figure 4. Correlation heatmap of performance metrics.
Applsci 14 06518 g004
Table 1. Running and cycling sprints duration.
Running Test (s)Cycling Test (s)
Sprint 14.98 ± 0.1405.37
Sprint 25.11 ± 0.1505.37
Sprint 35.28 ± 0.1635.37
Sprint 45.43 ± 0.1395.37
Sprint 55.64 ± 0.1515.37
Sprint 65.80 ± 0.1925.37
MST5.37 ± 0.3125.37
TST32.2532.24
MST = mean sprint time, TST = total sprint time.
Table 2. Physiological and performance responses for the running and cycling test.
VariablesRunning TestCycling TestSprint Mode Effectpη2
Peak power (W)713.7 ± 94.91012.9 ± 132.9F = 107.3880.0000.634
Mean power (W)578.3 ± 72.1876.1 ± 105.8F = 173.1570.0010.736
Fİ (%)36.5 ± 6.630.0 ± 6.8F = 19.9490.0020.243
Resting lactate (mmol·L−1)0.7 ± 0.20.8 ± 0.3F = 0.2590.1620.003
Maximal lactate (mmol·L−1)15.4 ± 1.615.1 ± 1.5F = 0.5600.1330.251
Lactate delta (mmol·L−1)14.7 ± 1.714.3 ± 1.6F = 0.5610.1020.011
HR peak (bpm)176.3 ± 10.1177 ± 6.7F = 0.2410.1590.009
RPE13.4 ± 1.116.2 ± 1.4F = 10.4560.0000.345
Fİ = fatigue index, HR = heart rate, RPE = rate of perceived exertion.
Table 3. Estimated relative and absolute energy system contribution during the running and cycling test.
VariablesRunning TestCycling TestSprint Mode Effectpη2
ATP-PCr (%)55.8 ± 4.352.9 ± 2.9F = 9.9820.0020.137
Glycolytic (%)30.8 ± 5.032.7 ± 3.6F = 2.9220.0920.044
Oxidative (%)13.4 ± 2.414.5 ± 2.6F = 3.2010.0780.048
ATP-PCr (kJ)108.9 ± 15.794.7 ± 12.2F = 15.4600.0000.200
Glycolytic (kJ)61.1 ± 8.058.4 ± 8.5F = 1.7690.1880.028
Oxidative (kJ)25.9 ± 5.526.0 ± 5.8F = 0.0050.9850.000
Energy demand (L of O2)9.4 ± 1.08.6 ± 0.9F = 9.9510.0020.138
TEE (kJ)195.7 ± 21.4179.0 ± 20.9F = 9.9830.0020.139
PCr_breaks (kJ)51.4 ± 6.345.8 ± 6.2F = 12.5440.0010.168
PCr_epocfast (kJ)57.5 ± 11.948.8 ± 9.2F = 10.4330.0020.144
TEE = total energy expenditure, PCr_breaks = estimated PCr repayment during rest intervals (kJ), PCr_epocfast = estimated PCr repayment during fast phase of EPOC (kJ).
Table 4. Coefficient of determination (R2) of the relationship between energy system contribution and performance variables for the repeated sprint modalities.
Running TestCycling Test
R2p-ValuesR2p-Values
Peak Power (W)
ATP-PCr (kJ)0.580.0010.460.005
Glycolytic (kJ)0.410.0190.360.026
Oxidative (kJ)0.310.0780.290.081
Mean Power (W)
ATP-PCr (kJ)0.350.0300.310.037
Glycolytic (kJ)0.380.0110.340.015
Oxidative (kJ)0.330.0510.280.053
Fatigue index (%)
ATP-PCr (kJ)−0.140.027−0.110.035
Glycolytic (kJ)−0.180.010−0.140.015
Oxidative (kJ)−0.060.314−0.070.428
Disclaimer/Publisher’s Note: The statements, opinions and data contained in all publications are solely those of the individual author(s) and contributor(s) and not of MDPI and/or the editor(s). MDPI and/or the editor(s) disclaim responsibility for any injury to people or property resulting from any ideas, methods, instructions or products referred to in the content.

