Abstract
In this research, an analysis of the socio-environmental vulnerability in the urban area of the border municipality of Tijuana, Baja California (BC), in Mexico is carried out with data from the year 2020. Currently, this municipality is the most populated in the country, housing a population of just over 1.9 million inhabitants, characterized by being a city in constant urban growth due to its geographical location and various social, cross-border and productive dynamics directed by industrial development. However, Tijuana presents territorial problems related to lack of urban planning, overpopulation, urban marginalization, topographic conditions, urban waste management, air quality and lack of infrastructure and basic services. The proposed methodology develops a socio-environmental vulnerability index (SEVI), based on the evaluation of critical or extreme demographic and urban aspects, including social, economic, environmental and physical variables of the territory with the support of the Geographic Information System (GIS). This index is composed of a total of 19 indicators related to education, health, employment, housing conditions, infrastructure, population settlement, industrial concentration and some factors regarding environmental quality, especially focused on the disposal of urban solid waste (USW) in clandestine sites, garbage collection service coverage and flood risk. This analysis allowed us to determine the groups most vulnerable to socio-environmental risks in 692 Basic Geostatistical Areas (AGEB, the acronym in Spanish) of nine city delegations. The results of the research highlight that 14.78% of the population is between a situation of high and very high socio-environmental vulnerability, representing just over 284,000 inhabitants. It is concluded that the use of GIS in spatial planning allows us to identify risk areas and thereby promote more sustainable measures to ensure the well-being of the population.
1. Introduction
In Mexico, considerable environmental pollution issues are present in urban areas, particularly in cities experiencing rapid urban, industrial, and technological development [1,2]. This stems from the development model in Latin America, which is oriented towards a territorial configuration that accompanies the emergence of economic activities and a lack of urban planning to guide the growth process [3,4,5].
It is noteworthy that, in the year 2020, 79.00% of the country’s population resided in urban areas [6], and it is estimated that by 2030, this will increase to 83.20% [7]. This poses a challenge for cities where productive forces and the population are concentrated, making it essential to organize them, increase their productivity and competitiveness, as well as to seek to reduce social inequality and the environmental impact they produce. According to data from the National Institute of Statistics and Geography (INEGI, the acronym in Spanish) [6], the country has more than 120 million inhabitants, 41.90% of whom live in poverty and urban marginalization [8], highlighting that environmental issues are not the only problems in the country’s major cities.
The inclusion of social and environmental issues in public management has been a challenge that, to date, no country in Latin America has considered entirely satisfactory, as it requires the participation of all entities legitimately interested in promoting sustainable development [9]. Therefore, achieving good environmental quality necessitates the coordination of various sectors such as health, education, ecology, urban development, public works, energy, industry, transportation, private initiatives, and the general population [10]. It is essential to understand to what extent the activities of these sectors impact the environmental condition of cities from multiple perspectives.
The concept of sustainable development has been globally accepted as a guide for the interactions between nature and society, to address local and global changes in terms of social inequality, poverty, climate change, ecosystem loss, and overpopulation [11]. Although as a society, we have achieved significant progress toward sustainability, the economic, social, and environmental problems that continue to arise in regions and cities indicate that our efforts have not been enough to reach a state of sustainability. In other words, the literature generally shows that this concept has gained momentum to remain relevant, but the actions taken so far have been insufficient [12,13].
Thus, Mexico faces both social and environmental challenges, which become even more pronounced in the northern border cities where economic, political, and geographical factors converge, intensifying the complexity of the issues [14]. In this region, there is clear evidence of a series of environmental problems related to uncontrolled urbanization and industrial activity, including an inability to establish an efficient urban waste disposal system [15]. Additionally, there is environmental pollution caused by emissions from vehicular traffic in these cities [16]. Consequently, air, water, and soil pollution, resulting from industrial activity and transportation, affect the health of the population and thereby their quality of life [17,18].
In addition to the aforementioned issues, border cities face severe urban planning problems, which result in a scarcity of housing or, in some cases, lack of access to basic services within the housing, as well as inadequate access to medical services, poor public services, serious exploitation of natural resources, and a lack of green spaces. Furthermore, there are disadvantages related to the specific conditions of the northern border, such as climate and soil conditions, water scarcity, and immigration [15].
Based on this, there arises the need to analyze these problems comprehensively through the implementation of the concept of socio-environmental vulnerability associated with an urban territory [3,19,20,21,22,23,24,25,26,27,28,29,30,31,32,33,34,35,36,37,38,39,40,41,42,43,44,45]. In some cases, methodologies have been implemented to evaluate critical or extreme demographic and urban aspects in an integrated manner, to determine a Socio-Environmental Vulnerability Index (SEVI) from various dimensions, whether in terms of social, economic, environmental, or physical variables [3,19,22,23,25,27,28,30,31,32,33,37,38,41,43,44].
The objective of the present study is to analyze the socio-environmental risk to which the urban population of the border municipality of Tijuana in the state of Baja California, Mexico, is exposed. This will be achieved through the development of a SEVI supported by Geographic Information Systems (GIS) to evaluate each of the 692 Basic Geostatistical Areas (AGEB, the acronym in Spanish) and the nine delegations that compose this municipality.
The term AGEB corresponds to a type of urban territorial division proposed by INEGI, forming part of the National Geo-statistical Framework, and is attributed to a smaller scale of dimension compared to other components [46]. This area can encompass a set of blocks ranging from one to 50, delimited by streets, paths, or any other easily identifiable feature on the ground, and whose land use can be residential, industrial, services, or commercial, among others [47]. It is important to note that the surface area and population in each of these areas vary.
2. Background and Study Area
The municipality of Tijuana is located in the northwest of the state and the national territory, right at the border with the neighboring country of the United States of America (USA) (Figure 1). It covers a land area of 123.8 thousand hectares, which represents 1.70% of the total area of the state and 0.06% of the country’s total area [48].
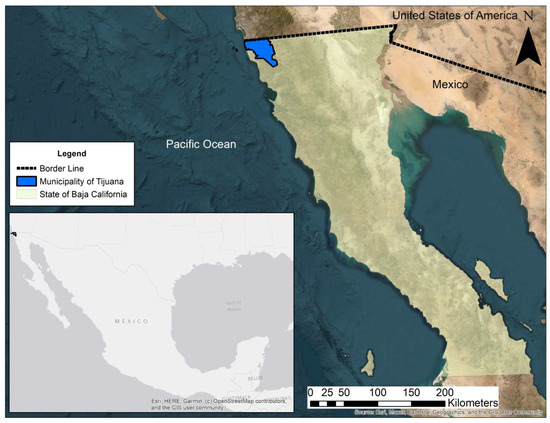
Figure 1.
Location of the Municipality of Tijuana, BC, Mexico.
Tijuana stands out from the rest of the country due to its rapid urban growth, albeit not in the expected manner [49,50]. Coupled with the lack of infrastructure provision, this has led to a compact urban structure influenced by geography and vulnerable to natural events [48]. The urban area of Tijuana is composed of nine districts (Figure 2): San Antonio de los Buenos, Sánchez Taboada, La Presa, Cerro Colorado, Playas de Tijuana, La Mesa, Centro, Otay-Centenario, and Presa Este. It is worth mentioning that each district has its own administration, providing services related to urban control, civil registry, inspection and verification, public works, community development, and supervision of public lighting. This results in varying urban and demographic behaviors across the city, leading to imbalances in infrastructure development and overpopulation in some areas.
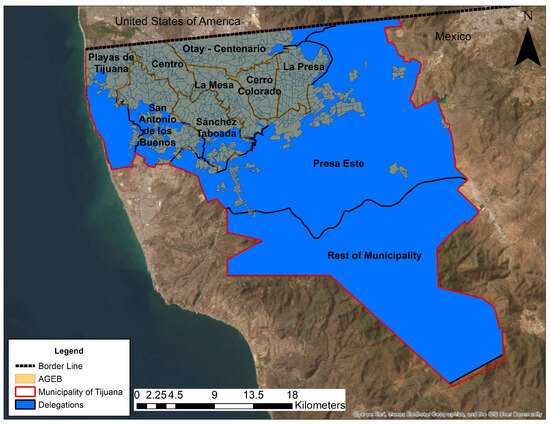
Figure 2.
Delegations of the Municipality of Tijuana, BC, Mexico.
Given its geographical location, this municipality exhibits a highly diverse topography, with various elevations across its territory (Figure 3). The altitude ranges from 100 m above sea level (masl) to 1200 masl [51]. The city is situated amidst hills, canyons, ravines, and streams. In the central part lies a valley through which flows the channelized course of the Tijuana River. To the north is La Mesa de Otay, an almost flat plateau at about 160 m altitude, while to the south, extensive hills and mountains are dominating the landscape. Among the most significant are Cerro Colorado at 550 masl, Cerro Gordo at 1100 masl, and the hills of Consuelo and Grande in the municipality center at 900 masl. Tijuana hosts a system of hydrological basins and sub-basins, primarily belonging to the Transboundary Tijuana River Basin, which includes four aquifer recharge areas: Arroyo Alamar, Arroyo Florido, Arroyo Matanuco, and Arroyo de las Palmas [52].
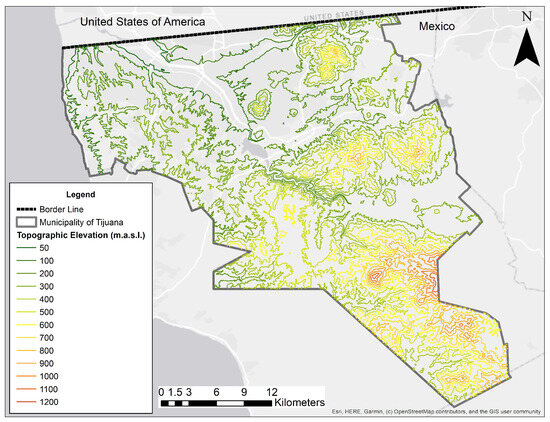
Figure 3.
Topography of the Municipality of Tijuana, BC, Mexico.
Regarding the terrain conditions by delegation, Otay-Centenario, La Presa, La Mesa, and part of Presa Este have 80.00% of their surface area consisting of flat land. These are followed by Playas de Tijuana and Centro, which have two-thirds of their surface area characterized as flat. In contrast, Cerro Colorado, San Antonio de los Buenos, and Sánchez Taboada have the majority of their surface area classified as mountainous terrain [53].
It is worth mentioning that the municipality of Tijuana is the most populous in the nation, with slightly more than 1.9 million inhabitants, representing 51.00% of the total population of Baja California [6]. This significant population growth is largely due to continuous immigration from other states of the republic [54] and even from other countries [55], with individuals either seeking to cross the border into the USA or intending to remain in the city to improve their quality of life. However, this has led to a substantial increase in the population over the past decades [56], which in turn has heightened the demand for housing, infrastructure, and services. On the other hand, this demographic increase has resulted in a phenomenon of overpopulation, which has been accompanied by the emergence of informal settlements. These settlements are characterized by illegally self-built homes on private lands, lacking available services and infrastructure [57]. Moreover, this phenomenon has environmental impacts that pose barriers to environmental sustainability, affecting both developing and developed countries [58].
Undoubtedly, the risks are greater in poorer areas with less availability of infrastructure and urban services, which in turn translates into poor socioeconomic conditions or high levels of urban marginalization. This means a population without access to education and/or healthcare services, lacking employment, and residing in substandard housing conditions due to the absence of potable water, electricity, sewage systems, and certain goods necessary for a dignified life [46].
Both the urban growth and economic development of Tijuana are oriented by the border location, that is, the growth impetus is largely driven by the proximity to the neighboring country, but it exhibits unique dynamics and structure derived from the evident economic and social differences between Mexico and the USA [59]. Over the years, the city has experienced a constant increase in industrial activity, particularly in the manufacturing and maquiladora sectors, with the arrival of transnational companies, primarily from the USA, making this the most important local economic activity, which is distributed in various zones of Tijuana [60]. However, this activity has negatively contributed to environmental pollution in the city due to the disposal of hazardous waste and air pollution, affecting areas near these establishments and thereby causing a decline in the quality of life for the population [61].
On the other hand, the processes of collection, management, and disposal and the environmental risks associated with waste, garbage, or urban solid waste (USW) remain a challenge in Tijuana and most cities of Mexico [62]. These issues are linked to a set of causes specific to each region, among which economic factors, consumption patterns, and cultural conditions stand out [63]. Consequently, several local governments in the country have turned to the private sector for support due to the lack of coverage in urban waste collection services [62,64]. Moreover, there is another problem, no less important, related to urban waste, which involves the location of clandestine sites for final disposal, primarily situated on private land [65].
Another set of urban problems affecting various areas of Tijuana pertains to the risks faced by the population living on uneven terrain and in zones with geological faults, leading to potential flooding and landslides caused by heavy rains [50,66]. A fundamental aspect to counteract this situation involves promoting and maintaining green areas in the city, as these provide environmental benefits such as improving air quality, reducing heat islands, controlling soil erosion, and conserving biodiversity. Also, there are social benefits, including enhancing the quality of life for residents and promoting social cohesion [67].
Therefore, the combination of various social, economic, environmental, political, cultural, and physical dimensions that have emerged as part of the development in Tijuana have resulted in the urban growth having direct effects on the physical environment of the territory. This is especially related to land use and natural resources, as well as leading to issues faced by society in terms of public health and limited access to services, to name a few [49]. It is a priority to strengthen the capacity offered by the territory, its infrastructure, and its public services. Similarly, it is understood that an environmental ordinance is required to ensure the quality of life for the entire population.
3. Literature Review
Since the second half of the 20th century, the exploitation of nature has intensified exponentially on a global scale [68]. The most prominent features of this period include the growth of the global gross domestic product (GDP), the increase in the world population, the trend toward urbanization, and the rise in the consumption of various energy sources [69]. However, this economic growth was not proportional to population growth, meaning that as the economy grew, the population also increased, but not everyone benefited equally from this growth. This resulted in an unequal distribution of resources and opportunities, exacerbating inequality and poverty globally. Furthermore, the lack of adequate environmental policies aggravated these problems, leading to various socio-environmental challenges [68]. This has exposed the population to a condition of vulnerability.
Vulnerability can be seen as multidimensional, encompassing social, economic, environmental, psychological, and other aspects present in a community before a disaster or highly susceptible to them [39,70,71,72,73,74]. In this sense, socio-environmental vulnerability is a systemic condition in the interaction between human groups and the environment. This vulnerability is evident in the exposure of population groups located in high-risk areas, resulting in natural disasters and an exacerbation of their marginalized condition, understood as a lack of access to basic needs such as housing, health, employment, and education [75]. Therefore, it also reflects the lack of basic infrastructure and urban planning, non-compliance with land use legislation, among other factors [26].
It is important to note that, in the context of climate change, socio-environmental risks arising from urbanization intensify in the absence of comprehensive land use policies [76].
A recent trend in vulnerability assessments has been to broaden considerations to include social determinants, not just climatic ones, of vulnerability, such as adaptive capacity, shifting from merely estimating expected damages to identifying opportunities for damage reduction [24]. This approach, known as socio-environmental risk management, can develop a range of human skills and capacities to address vulnerability, focusing especially on preventing socio-environmental threats, contrasting with the misconception that emergency response alone solves natural disaster problems [77]. Accordingly, socio-environmental vulnerability refers to a community’s inability to absorb the effects of environmental change.
Internationally, methodologies have been implemented to assess the socio-environmental vulnerability of an urban territory, based on a multidimensional approach covering social, economic, environmental, and physical aspects, among others deemed relevant [3,19,20,21,22,23,24,25,26,27,28,29,30,31,32,33,34,35,36,37,38,39,40,41,42,43,44,45]. Such methodologies take into account demographic and urban factors unfavorable to the development of indices [38,43]. Additionally, it is necessary to identify delineation areas within the urban territory in question [78,79,80]. In this regard, the SEVI provides a comprehensive diagnosis of the degree of exposure of a population to future hazards or disasters [32].
The SEVI commonly reveals differences between zones within a territory, and the use of this knowledge can be crucial for public policies that address these differences and reduce the population’s level of risk [30,43]. Comprising a series of dimensions integrating variables that translate into indicators, it allows for measurement [37]. These indicators are fed by databases that can be continuously updated with demographic, urban, and other relevant information extracted from institutions, government agencies, or other organizations for its development [22,27,37].
In this regard, various authors have developed indices to assess the socio-environmental vulnerability of a territory, considering diverse indicators and dimensions, primarily those most representative or those with the greatest impact on increasing the vulnerability of the population inhabiting it. In the case of Cardoso [32], topography and hydrography information is crossed to determine flood hazards. According to Daga et al. [38], the health, education, and environmental dimensions largely determine the distribution of the index. In contrast, Zulaica et. al. [76] assert that constructing the SEVI involves three variables: exposure to hazards, sensitivity to risks, and adaptive capacity or resilience.
On the other hand, Cabral and Zulaica [37] constructed a SEVI through weighting, which considers socio-economic, political, legal, physical, educational, health, and housing dimensions. The application in the peri-urban area of Mar del Plata, exposed to agrochemical fumigation, revealed that political aspects, education, and organizational capacity would have the greatest impact on the health of affected communities. Additionally, risk analyses have been conducted using GIS, overlaying layers of territorial information to identify the impact and adaptation that communities and measures can have in response to climate [81]. Gupta et al. [28] and Gupta et al. [25] report that, following a survey and using principal component analysis and the Human Development Index, they accurately estimated the vulnerability of four groups of people based on their altitude in the Himalayas, climate conditions, and productive activities, highlighting that policy perspectives should not be uniform across the altitude gradient.
It is important to note that GIS has been widely used for flood vulnerability analysis. This is because, as a consequence of climate change, floods are becoming more frequent and extreme, causing economic impacts and human losses that are exacerbated in cities with overpopulation, irregular settlements, and inadequate infrastructure. In this regard, flood management must include assessments of socio-environmental vulnerability that adapt to the specific characteristics of the territory and enhance its resilience. In the case of Szewránski et al. [29], they conducted a socio-environmental vulnerability mapping in the city of Wroclaw, incorporating spatial analyses that relate the distribution of flood-prone areas to the poverty risk index. On the other hand, Mavromatidi et al. [30] overlaid the Coastal Sensitivity Index and Social Vulnerability Index to identify cases of socio-environmental vulnerability in coastal districts of France, prioritizing efforts for coastal management and reducing flood impacts.
There are a wide variety of studies focusing on presenting disaster risk models, but few analyze vulnerability due to exposure. Alves et al. [21], for their part, advocate for an integrated framework to enhance flood management in Brazil, using thematic maps to spatially represent vulnerability and flood exposure in urban areas, supported by subjective and objective methods. The value of green areas for urban resilience against environmental vulnerabilities has been recognized; however, in developing countries, they are insufficient, increasingly scarce, and inequitably distributed. In Kumasi, Ghana, spatial techniques have highlighted that socioeconomically disadvantaged communities have the least green area coverage, making them more vulnerable to climate-related risks [82].
4. Materials and Methods
For the methodological development of the SEVI, it was necessary to draw on the contributions established by several authors [3,23,27,37,38,43], aimed at assessing the socio-environmental vulnerability of a territory based on critical or extreme demographic and urban aspects in a comprehensive manner. This involved analyzing five dimensions related to social, economic, environmental, physical, and housing-related variables (Figure 4).
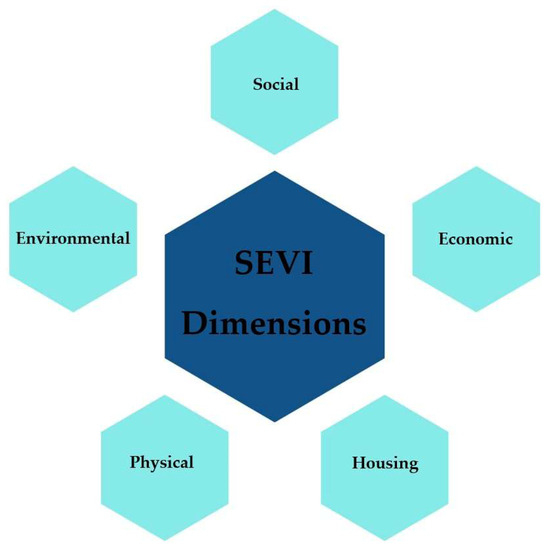
Figure 4.
SEVI Dimensions.
This index consists of a series of dimensions, each of which integrates variables that translate into indicators, facilitating their measurement and evaluation at an AGEB territorial scale (Figure 5).

Figure 5.
Components for the Development of the SEVI.
It is important to note that for the development of the SEVI by the AGEB, descriptive and cartographic information generated in 2020 has been used. This year was chosen because Mexico produces the population and housing census in its most complex version every 10 years. Derived from the above, said census information covers most of the indicators required to develop the analysis. On the other hand, different institutions, government agencies, or other organizations generate their analyses in said periods to complement the census. This information is available in census databases of population and housing, as well as economic units from INEGI, along with urban and other relevant data extracted from institutions, government agencies, and other organizations. These include the Municipal Public Services Directorate (DSPM, the acronym in Spanish), the Metropolitan Institute of Planning of Tijuana (IMPLAN, the acronym in Spanish), and the Center for Scientific Research and Higher Education of Ensenada (CICESE, the acronym in Spanish). The aim is to compile socio-economic and physical variables of the urban environment, considering the presence of infrastructure and other complementary elements, as well as the variable of environmental quality.
This information must be critical in nature, meaning it encompasses unfavorable aspects of the population, infrastructure, and the environment [23,37]. It should also contribute to the analysis of socio-environmental vulnerability in the urban area of the municipality, evaluating population and territorial conditions. Therefore, information was gathered related to the social and economic dimensions: illiterate population, individuals with no schooling or low levels of education, lack of access to health services, and unemployed or without employment. Environmental factors included areas at risk of flooding, the number of clandestine sites with inadequate disposal of USW, the concentration of industrial sector establishments, and areas without garbage collection coverage. Physical aspects considered blocks with partially or unpaved roads, blocks with partially or unpaved sidewalks, blocks with some or no trees on the roads, and areas with irregular settlements. Additionally, housing factors included houses with earthen floors, houses without electricity, houses without piped and/or potable water, houses without a toilet or sanitary facilities, houses without drainage, houses without a refrigerator, and houses without a washing machine.
As a result of the above, a total of 19 indicators were established to obtain the SEVI in the municipality of Tijuana (Table 1), grouped by variables related to access to education and health services, employment, housing conditions, characteristics of the physical environment and infrastructure, and environmental quality.

Table 1.
Dimensions, variables, indicators, and weighting of the SEVI.
As shown in Figure 6, to determine the level of SEVI in each AGEB, socio-environmental vulnerability is classified as Middle-High if the indicator value is between the mean and one standard deviation above, High if it is between one and two standard deviations above the mean, and Very High if values are above two standard deviations. Conversely, AGEBs are classified as Middle-Low socio-environmental vulnerability if their value falls between the mean and minus one standard deviation, Low if it is between one and two standard deviations below the mean, and Very Low if the value is below two standard deviations.
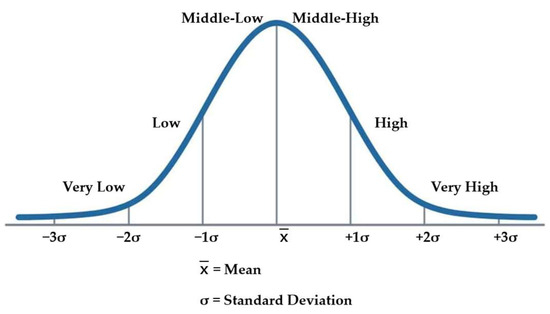
Figure 6.
SEVI levels.
As part of the SEVI acquisition process, it is necessary to establish the weighting value, which for the purposes of this research was the same for each indicator (Table 1), representing equal relative weight and therefore importance in the overall context. This is part of an initial approach to designing the SEVI in the municipality of Tijuana, following the method outlined by Cabral and Zulaica [37], Daga et al. [38], and Zulaica and Ferraro [43], where the sum of the weights equals 1.
The index value per AGEB is determined using the following equation, with the values of the mean, standard deviation, and weighted sum of each of the indicators considered, under the multidimensional methodological framework outlined by CONAPO [83] and García et al. [46], due to its feasibility in its application in the case study:
SEVI = Socio-Environmental Vulnerability Index by AGEB
J = Represents each of the vulnerability indicators
aj = Weight assigned to vulnerability indicator j (in this case, a weight of 0.5263 is considered)
Zij = Standardized value of each vulnerability indicator j, where the percentage value is subtracted from the mean, and the difference is divided by the standard deviation of each socio-environmental indicator.
This equation allows for carrying out a multidisciplinary analysis (physical, environmental, social, infrastructure, etc.) with multiple variables. Once the SEVI value by AGEB has been determined, an analysis will be conducted on a larger territorial scale by municipal delegation. This will demonstrate the administrative practices implemented in each delegation concerning the management of socio-environmental conditions, which subsequently impact the population and their environment.
Based on the results obtained, a geo-referenced database is created to represent thematic maps using ArcGIS (Version 10.8). The use of these tools allows for the identification of risk areas or the most critical regions [29], thereby promoting sustainable measures to ensure the well-being of the population [27,37].
5. Results and Discussions
The application of the previously described methodological procedure enabled the establishment of SEVI results under two perspectives of territorial analysis: (1) on a smaller scale by AGEB, and (2) on a larger scale by municipal delegation.
5.1. Analysis of SEVI by AGEB
In general terms, it can be observed that the majority of the AGEBs that make up the urban area of the municipality of Tijuana exhibit a predominantly medium level of socio-environmental vulnerability (Figure 7). This pattern is observed in 475 out of 692 AGEBs, accounting for a total of 1,382,826 inhabitants, representing 71.93% of the total population (Table 2). It can be noted that both the Middle-High and Middle-Low vulnerability levels are distributed across various areas of the city.
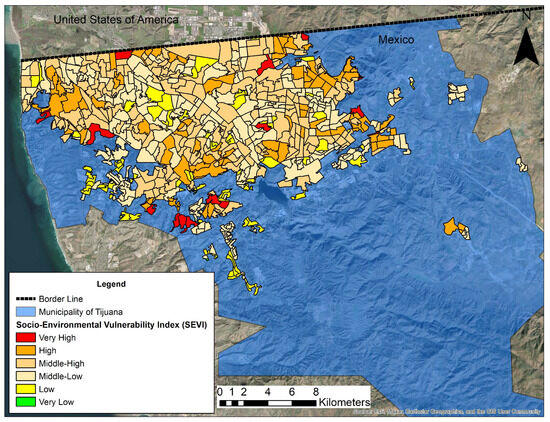
Figure 7.
SEVI by AGEB in the municipality of Tijuana, BC, Mexico.
Table 2.
Summary of SEVI results by AGEB.
On the other hand, slightly more than 226,000 inhabitants, distributed across 112 AGEBs and representing 11.78% of the total population of the municipality, are situated within a Low to Very Low level of socio-environmental vulnerability. However, fewer than 285,000 inhabitants, located in 105 AGEBs and representing 14.78% of the total population, are found within a High to Very High level of socio-environmental vulnerability.
It is worth mentioning that there are a total of 29,162 inhabitants who are not part of the urban area of the municipality of Tijuana or within any AGEB and who represent 1.52% of Tijuana’s population. These individuals are excluded from the analysis in this research.
The SEVI analysis conducted by AGEB provided an initial insight into the situation faced by much of the urban population of Tijuana regarding the lack of access to education, healthcare services, employment, adequate housing conditions, basic services, and infrastructure. It also highlighted health impacts resulting from residing in areas where air pollution emissions or solid waste disposal affect the environment, as well as living in unsuitable zones due to topographical conditions or the risk of potential flooding. Regarding health impacts, there are records of how sulfur dioxide, carbon monoxide, nitrogen dioxide, ozone, and suspended particles cause various adverse health effects such as irritation of the respiratory tract, bronchitis, pneumonia, reduction in lung function, worsening of asthma, cardiovascular and respiratory diseases, and impairment of the body’s ability to respond to various conditions such as oxidative stress, representing morbidity and mortality risks. Likewise, carbon monoxide can be dangerous, causing dizziness, unconsciousness, and death at high concentrations. Fine particles are also associated with the development of diabetes and can affect fetal formation [1,18].
5.2. Analysis of SEVI by Municipal Delegations
This section will present the socio-environmental vulnerability patterns exhibited by each of the nine municipal delegations within the municipality of Tijuana (Figure 8).
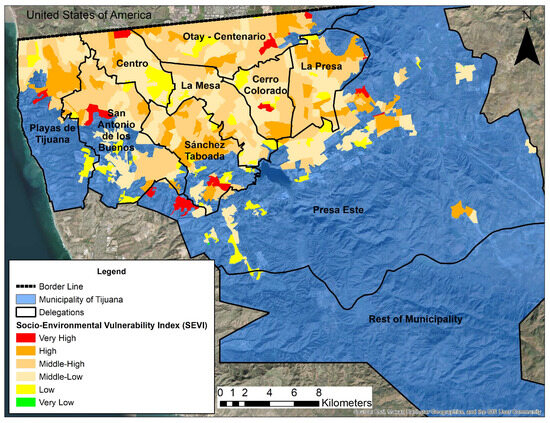
Figure 8.
SEVI by AGEB and delegation in the municipality of Tijuana, BC, Mexico.
It can be observed that there are 19 AGEBs at a Very High level of socio-environmental vulnerability, totaling 19,478 inhabitants, which represents 1.01% of the total population of Tijuana (Table 3). In terms of distribution by delegation, six AGEBs with 5994 inhabitants are located in Presa Este, three with 2866 inhabitants are in Sánchez Taboada, another three with 1274 inhabitants are in Otay-Centenario delegation, three more with 592 inhabitants are in Playas de Tijuana, one with 4743 inhabitants in San Antonio de los Buenos, another with 2933 inhabitants in Centro, another with 1018 inhabitants in Cerro Colorado, and one more with 58 inhabitants in La Presa. It can be observed that the largest population in this situation is found among the Presa Este, San Antonio de los Buenos, Centro, and Sánchez Taboada delegations, accounting for nearly 85.00% of the total in the Very High category, totaling 16,536 inhabitants. It should be noted that there is no population residing in the La Mesa delegation at this level of vulnerability.
Table 3.
SEVI results by delegation at the Very High level.
In terms of High socio-environmental vulnerability level, there are 86 AGEBs in this situation, totaling 264,644 inhabitants, which represents 13.77% of the total population (Table 4). It is noteworthy that AGEBs in all delegations exhibit this situation. In the La Presa delegation, there are 19 AGEBs with 53,101 inhabitants, 17 with 52,572 inhabitants in Sánchez Taboada, 13 with 53,759 inhabitants in Otay-Centenario, another 13 with 33,252 inhabitants in Presa Este, 10 with 17,590 inhabitants in San Antonio de los Buenos, seven with 25,608 inhabitants in Playas de Tijuana, three with 12,906 inhabitants in Centro, another three with 12,631 inhabitants in Cerro Colorado, and one with 3225 inhabitants in La Mesa. It can be observed that the largest population in this situation is found among the Otay-Centenario, La Presa, and Sánchez Taboada delegations, comprising over 60.00% of the total in the High category, totaling 159,432 inhabitants.
Table 4.
SEVI results by delegation at the High level.
At the Middle-High socio-environmental vulnerability level, there are 217 AGEBs, totaling 655,161 inhabitants, which represents 34.08% of the total population (Table 5). It is noteworthy that AGEBs in all delegations exhibit this situation. In the San Antonio de los Buenos delegation, there are 41 AGEBs with 113,989 inhabitants, 37 with 106,168 inhabitants in Otay-Centenario, 30 with 96,804 inhabitants in Sánchez Taboada, 29 with 100,938 inhabitants in La Presa, 21 with 54,616 inhabitants in Presa Este, 17 with 52,645 inhabitants in La Mesa, 14 with 46,753 inhabitants in Cerro Colorado, another 14 with 42,429 inhabitants in Centro, and another 14 with 40,819 inhabitants in Playas de Tijuana. It can be observed that the largest population in this situation is found among the San Antonio de los Buenos, Otay-Centenario, La Presa, and Sánchez Taboada delegations, comprising nearly 64.00% of the total in the Middle-High category, totaling 417,899 inhabitants.
Table 5.
SEVI results by delegation at the Middle-High level.
The Middle-Low socio-environmental vulnerability level represents the largest population in Tijuana, with 727,665 inhabitants, accounting for 37.85% of the total, distributed across 258 AGEBs (Table 6). It is noteworthy that AGEBs in all delegations exhibit this situation. In the Presa Este delegation, there are 77 AGEBs with 233,763 inhabitants, 34 with 80,243 inhabitants in San Antonio de los Buenos, 29 with 79,184 inhabitants in La Mesa, 27 with 93,263 inhabitants in La Presa, 21 with 54,922 inhabitants in Cerro Colorado, another 21 with 53,537 inhabitants in Sánchez Taboada, 19 with 49,239 inhabitants in Playas de Tijuana, 16 with 49,948 inhabitants in Otay-Centenario, and 14 with 33,566 inhabitants in Centro. It can be observed that the largest population in this situation is found among the Presa Este, La Presa, San Antonio de los Buenos, and La Mesa delegations, comprising nearly 67.00% of the total in the Middle-Low category, totaling 486,453 inhabitants.
Table 6.
SEVI results by delegation at the Middle-Low level.
At the socio-environmental vulnerability level of Low, there are 110 AGEBs, comprising a total of 226,413 inhabitants, representing 11.78% of the total population (Table 7). It is worth noting that in all delegations, there are AGEBs exhibiting this condition, including one AGEB located outside the area known as the rest of the municipality, with a population of 3270 inhabitants. In the delegation of Presa Este, there are 29 AGEBs with 67,290 inhabitants; 21 with 30,580 inhabitants in San Antonio de los Buenos; 17 with 34,522 inhabitants in Sánchez Taboada; 10 with 15,803 inhabitants in La Mesa; nine with 20,078 inhabitants in Playas de Tijuana; seven with 14,952 inhabitants in Cerro Colorado; six with 22,702 inhabitants in La Presa; another six with 5591 inhabitants in Otay-Centenario; and four with 11,625 inhabitants in Centro. It can be observed that the largest portion of the population in this condition is concentrated among the delegations of Presa Este, Sánchez Taboada, San Antonio de los Buenos, and La Presa, accounting for nearly 69.00% of the total in the Low category and amounting to a total of 155,094 inhabitants.
Table 7.
SEVI results by delegation at the Low level.
Regarding the socio-environmental vulnerability level classified as Very Low, there are only two AGEBs located in the Presa Este delegation, with no recorded inhabitants (Table 8). This suggests the absence of a population in these AGEBs, or that the territory does not exhibit high or medium levels of socio-environmental vulnerability.
Table 8.
SEVI results by delegation at the Very Low level.
In relation to the data presented in the tables with SEVI results by delegation, it is shown that three delegations have the largest populations within the levels of socio-environmental vulnerability classified as Very High and High, each exceeding 50,000 inhabitants. In descending order, they are Sánchez Taboada with 55,438 inhabitants, Otay-Centenario with 55,033 inhabitants, and La Presa with 53,159 inhabitants. It is noteworthy that these delegations together comprise a total of 163,630 inhabitants, representing 57.59% of the total population in these levels. However, when considering the population of all delegations at these levels, it amounts to 284,122 inhabitants, which represents 14.78% of the total population of the municipality of Tijuana.
On the other hand, there are seven delegations considered to have the largest populations within the middle levels of socio-environmental vulnerability, specifically in a situation classified as Middle-High and Middle-Low, each exceeding 100,000 inhabitants. In descending order, they are Presa Este with 288,379 inhabitants, San Antonio de los Buenos with 194,232 inhabitants, La Presa with 194,201 inhabitants, Otay-Centenario with 156,116 inhabitants, Sánchez Taboada with 150,341 inhabitants, La Mesa with 131,829 inhabitants, and Cerro Colorado with 101,675 inhabitants. It is noteworthy that these delegations together comprise a total of 1,216,773 inhabitants, representing 87.99% of the total population at these levels. However, when considering the population of all delegations at these levels, it amounts to 1,382,826 inhabitants, which represents 71.93% of the total population of Tijuana.
Similarly, there are five delegations categorized as having the largest populations within the levels of socio-environmental vulnerability classified as Low and Very Low, each exceeding 20,000 inhabitants. In descending order, they are Presa Este with 67,290 inhabitants, Sánchez Taboada with 34,522 inhabitants, San Antonio de los Buenos with 30,580 inhabitants, La Presa with 22,702 inhabitants, and Playas de Rosarito with 20,078 inhabitants. It is noteworthy that these delegations together comprise a total of 175,172 inhabitants, representing 77.36% of the total population at these levels. However, when considering the population of all delegations at these levels, it amounts to 226,413 inhabitants, which represents 11.78% of the total population of Tijuana.
After analyzing the results across different levels of socio-environmental vulnerability, it was found that the delegations with populations in critical to unfavorable conditions, i.e., those with Very High, High, and Middle-High levels of vulnerability, each exceeding 60,000 inhabitants, in descending order, were Otay-Centenario with 161,201 inhabitants, La Presa with 154,097 inhabitants, Sánchez Taboada with 152,242 inhabitants, San Antonio de los Buenos with 136,322 inhabitants, Presa Este with 93,862 inhabitants, Playas de Tijuana with 67,019 inhabitants, and Cerro Colorado with 60,402 inhabitants. It is noteworthy that these delegations together comprise a total of 825,145 inhabitants, representing 87.84% of the total population at these levels. However, when considering the total population of all delegations that exhibit these levels of vulnerability, it amounts to 939,283 inhabitants, which represents 48.85% of the total population of Tijuana.
The somewhat homogeneous dispersion of the situation at the Middle High and Middle Low levels, which reaches up to 71.00%, in addition to the identification of areas with high socio-environmental vulnerability, indicates that it is necessary to generate special attention in the city and in an integrated manner regarding the management of USW, the sources of atmospheric pollutants, and the neglect in the provision of infrastructure and basic services.
After analyzing the results for the delegations that exhibited the most disadvantaged levels of socio-environmental vulnerability in relation to the variables that determine urban marginalization, it is found that, in order of priority, attention should be given to the delegations of Presa Este, Otay-Centenario, Sánchez Taboada, San Antonio de los Buenos, La Presa, Playas de Tijuana, Cerro Colorado, Centro, and La Mesa. The first five delegations are by far the most disadvantaged, as they have double or more than double the population in critical situations compared to the following ones. This indicates that it is necessary for public and private entities responsible for promoting better housing conditions, health services, education, and employment to implement actions or public policies in favor of these areas.
From the perspective of waste management schemes, it is necessary to strengthen the capacity of the city’s garbage collection service, with particular attention to the recognized high-generation zones such as the delegations of La Presa, Presa Este, San Antonio de los Buenos, and Otay-Centenario. Regarding clandestine dumping sites, vacant lots or abandoned properties have been found to exist and are distributed throughout the urban area. Typically, these areas are prone to the disposal of construction debris, heavy domestic waste, heavy weed clearing, and tires, among other materials.
Another issue perceived is related to garbage being washed away by runoff during rain events, which ends up affecting the efficiency of the stormwater infrastructure, obstructing its functioning, and causing floods in many areas of the urban area.
In terms of air quality conditions, contributions from emissions generated by industry were considered, with special attention to the manufacturing sector, detecting high concentrations in the delegations of Otay-Centenario, Centro, La Mesa, Presa Este, and Cerro Colorado.
Regarding the lack of basic infrastructure, such as unpaved roads, pedestrian sidewalks or footpaths, green areas or trees, and the presence of irregular settlements, it is necessary to prioritize and address the following delegations in the following order: La Presa, Presa Este, San Antonio de los Buenos, Sánchez Taboada, and Otay-Centenario. Therefore, it is essential to promote the improvement of road surface conditions across the entire road network of the municipality, as well as the paving of a significant number of dirt roads, focusing primarily on the outskirts of the urban area. Similarly, it is crucial to complement this effort with the establishment and construction of sidewalks to promote pedestrian mobility, recognizing an even greater need in the city’s peripheries.
In terms of afforestation and green areas, the municipality of Tijuana exhibits a varied distribution of tree presence throughout the urban area. It is notable that delegations Otay-Centenario and Cerro Colorado have the least amount of trees. Similarly, there is a significant need to increase the provision of green areas per inhabitant, as the loss of vegetation contributes to pollution and health issues and increases water runoff, soil saturation, and potential flooding.
On another note, regarding flood risks, it has also been identified that while there are multiple scattered points throughout the city, the delegations with the highest concentration of cases are Sánchez Taboada, Playas de Tijuana, San Antonio de Buenos, Otay-Centenario, and Cerro Colorado. It is necessary to implement a plan to restore the natural function of the Tijuana River Watershed, which should include reorganization of stormwater infrastructure, a cleaning program, and environmental preservation efforts.
6. Concluding Remarks
This research provided an initial approach to the unfavorable situation faced by much of the urban population of Tijuana. This includes lack of access to education, healthcare services, employment, adequate housing conditions, and insufficient service offerings within the city. Additionally, there is inadequate basic infrastructure such as paving, sidewalks, trees or green areas, and garbage collection service; and health issues caused by living near industrial areas where pollution is emitted into the environment, either through air emissions or solid waste disposed of on the ground. Furthermore, living in areas unsuitable due to topographic conditions or at risk of possible flooding exacerbates these challenges.
For the development of the SEVI in the municipality of Tijuana, it was necessary to analyze available information from updated databases of various national, regional, and local government institutions and agencies. This aimed to identify socio-environmental vulnerability conditions within the population, on a micro-scale through AGEB or on a macro-scale based on the delineation of municipal delegations, utilizing GIS as a spatial analysis tool. The creation of thematic maps including SEVI results facilitates vulnerability analysis processes, enabling the identification of territorial areas and populations exposed to risks, as well as potential required public policies [74].
Likewise, for SEVI to be considered a comprehensive evaluation tool, it must include a multidimensional approach related to social, economic, environmental, physical, and housing-related aspects [37,38,39,43,73,74,76].
According to the results of this research, it can be deduced that nearly 15.00% of the population of Tijuana municipality, which is just over 284,000 inhabitants, live in socio-environmental vulnerability levels categorized as Very High and High. On the other hand, just under 72.00% of the population, which is just under 1,383,000 inhabitants, live in levels categorized as Middle High and Middle Low.
It was observed that the delegations presenting the most disadvantaged levels of socio-environmental vulnerability were primarily located in peripheral areas of the city, such as Otay-Centenario, La Presa, Sánchez Taboada, San Antonio de los Buenos, Presa Este, and Playas de Tijuana. Other delegations had a lower proportion of population in any of the three high-vulnerability levels.
A noteworthy point is that there was no population in the Very Low levels; only two AGEBs were identified but without any inhabitants. Therefore, the trend suggests that AGEBs with low population or minimal urban marginalization, meaning access to education, healthcare services, employment, and adequate housing with basic services, tend to exhibit levels between Middle Low and Low. Thus, dimensions related to urban marginalization, including social, economic, and housing factors, largely determine the distribution of SEVI.
Undoubtedly, the results of this research will facilitate decision-making in the government sector and improve planning conditions in the municipality of Tijuana. This is primarily achieved by considering a comprehensive approach to identifying socio-environmental risks and employing sustainability criteria.
Likewise, it is recommended to incorporate public policies that promote better environmental conditions in the city of Tijuana, reflecting an improvement in the quality of life for its urban population through actions that help enhance housing conditions, healthcare services, and education to reduce urban marginalization; strengthen the capacity of the city’s solid waste management service and heavy garbage collection program; develop a management plan for infectious biological waste that includes all delegations; establish a program to review vacant and abandoned lots; collaborate with industrial sectors to reduce emissions and waste generation; enhance environmental audit capabilities and promote green business certification; strengthen the city’s air quality monitoring system by adding more monitoring stations; promote a program to pave unpaved road sections and maintain paved road networks; strengthen municipal afforestation programs; develop a plan to restore the hydrological function of the Tijuana River Basin, including implementing environmental cleaning and preservation programs; consolidate flood risk management programs; promote the construction of stormwater infrastructure and programs for removing sediments and other particles from the stormwater network; and enhance synergy among departments and urban planning agencies to promote regulatory adjustments and analyze socio-environmental risk management in the municipality.
As part of the process of obtaining the SEVI, it is necessary to establish the weighting value. This research took as a reference the methods presented by Cabral and Zulaica [37], Daga et al. [38], and Zulaica and Ferraro [43], where adding the weights gives 1. However, there are different results in case studies regarding the importance of each dimension and indicator, such as the health, educational, and environmental dimensions, which are those that determine to a greater extent the SEVI distribution [38], in contrast to other investigations that obtain the political and educational aspects that have the greatest influence [37]. Since this investigation is the first effort and analysis of this type carried out in the region and therefore, the first approach to the SEVI design in the municipality of Tijuana, the same value is applied to each indicator (Table 1), representing the same relative weight and importance in the general context. However, it is considered important in future studies to perform a statistically supported sensitivity analysis to determine the influence of each variable.
Finally, considering that SEVI is developed under a multidimensional approach, future research will aim to include iterations adding variables related to vehicular traffic flow and emissions generated, whether in linear infrastructure such as urban roads and highways, or specifically through wait times at border crossings in entry ports. On the other hand, it is intended to develop a specific risk assessment that relates the used indicators of percentage of area with irregular settlements and percentage of area at risk of flooding, to identify the vulnerability and risk to which the population is exposed. For this, it is important to incorporate information related to precipitation, topography, soil characteristics and its cover, as explained by Gutiérrez et al. [84] and Rodríguez Esteves [85] for the Alamar area and Los Laureles canyon. This approach undoubtedly provides a more holistic analysis of the problem of socio-environmental vulnerability and its impacts in the border municipality of Tijuana.
Author Contributions
Conceptualization, L.G., A.M.-M., M.M.-A., A.S.-A., J.C.-R. and J.M.G.-M.; Data curation, L.G.; Formal analysis, L.G. and M.M.-A.; Investigation, L.G.; Methodology, L.G.; Project administration, A.M.-M.; Supervision, L.G., A.M.-M., M.M.-A., A.S.-A., J.C.-R. and J.M.G.-M.; Validation, A.M.-M.; Writing—original draft, L.G. and M.M.-A. All authors have read and agreed to the published version of the manuscript.
Funding
This research received no external funding.
Institutional Review Board Statement
Not applicable.
Informed Consent Statement
Not applicable.
Data Availability Statement
The database of the population and housing census can be found in https://www.inegi.org.mx/programas/ccpv/2020/ (accessed on 5 January 2022).
Conflicts of Interest
The authors declare no conflicts of interest.
References
- Hernández Cerda, C.N.; Ávila Galarza, A.; Cerda Alonso, D.G. Impacto de la movilidad urbana en la calidad del aire de la zona metropolitana de San Luis Potosí, México. Rev. Cienc. Ambient. 2023, 57, 1–27. [Google Scholar] [CrossRef]
- Coq-Huelva, D.; Asián-Chaves, R. Urban sprawl and sustainable urban policies. A review of the cases of Lima, Mexico City and Santiago de Chile. Sustainability 2019, 11, 5835. [Google Scholar] [CrossRef]
- Molpeceres, M.C.; Loyza, M.B.; Zulaica, M.L.; Calderon, G.; Mujica, C.M. Vulnerabilidad socioambiental, agroquímicos e impactos en la salud en el corredor costero y periurbano sur de Mar del Plata (Buenos Aires, Argentina). Rev. Int. Contam. Ambient. 2023, 39, 11–24. [Google Scholar] [CrossRef]
- Vargas-Cuervo, G.; Hernández-Peña, Y.T.; Zafra-Mejía, C.A. Challenges for Sustainable Urban Planning: A Spatiotemporal Analysis of Complex Landslide Risk in a Latin American Megacity. Sustainability 2024, 16, 3133. [Google Scholar] [CrossRef]
- Alfonso Pina, W.H.; Pardo Martinez, C.I. Development and urban sustainability: An analysis of efficiency using data envelopment analysis. Sustainability 2016, 8, 148. [Google Scholar] [CrossRef]
- INEGI. Censo de Población y Vivienda 2020; Instituto Nacional de Estadística y Geografía: Ciudad de México, México, 2020.
- ONU-HABITAT. Índice de prosperidad urbana en la República Mexicana. In Reporte Nacional de Tendencias de la Prosperidad Urbana en México; Ciudad de México, México, 2016; Volume 78, Available online: https://dduia.puebla.gob.mx/datos/SITEP/apartados/Referencias_documentales/Estudios/RepNalCPIMexico.pdf (accessed on 2 July 2024).
- Carvajal García, A. Pobreza y marginación en México: Imágenes de la exclusión. Revista 2020, 925, 27. [Google Scholar]
- De Miguel, C.J.; Tavares, M. El Desafío de la Sostenibilidad Ambiental en América Latina y el Caribe; Textos seleccionados 2012–2014; CEPAL: Santiago, Chile, 2015; Available online: https://hdl.handle.net/11362/37791 (accessed on 8 January 2024).
- Sánchez, J.; Domínguez, R.; León, M.; Samaniego, J.; Sunkel, O. Recursos Naturales, Medio Ambiente y Sostenibilidad: 70 Años de Pensamiento de la CEPAL; CEPAL: Santiago, Chile, 2019. [Google Scholar]
- Ávila, P.Z. La sustentabilidad o sostenibilidad: Un concepto poderoso para la humanidad. Tabula Rasa 2018, 28, 409–423. [Google Scholar] [CrossRef]
- Rashed, A.H. The impacts of unsustainable urbanization on the environment. In Sustainable Regional Planning; IntechOpen: London, UK, 2023. [Google Scholar]
- Cortés Mura, H.G.; Peña Reyes, J.I. De la sostenibilidad a la sustentabilidad. Modelo de desarrollo sustentable para su implementación en políticas y proyectos. Rev. EAN 2015, 78, 40–55. [Google Scholar] [CrossRef]
- Trejo Nieto, A. Desafíos de la competitividad en la frontera norte de México en el marco del reajuste global. Front. Norte 2013, 25, 213–221. [Google Scholar]
- Alfie Cohen, M. Riesgos y redes ambientales: El caso de la región fronteriza México-Estados Unidos. In Nuevos Actores en América del Norte Seguridad, Energía, Economía y Medio Ambiente; UNAM: Ciudad de México, México, 2019. [Google Scholar]
- Calderón Ramírez, J.A.; Lomeli Banda, M.A.; Moctezuma, A.M.; Alegría, M.H.; García Gómez, L.G. Efectos de CO en la población de las inmediaciones de los cruces fronterizos de México y Estados Unidos. Caso de estudio: Baja California–California. ACE Archit. City Environ. 2017, 12, 29–44. [Google Scholar] [CrossRef]
- Sánchez, M.; Rosa, A. Salud y medio ambiente. Rev. Fac. Med. 2022, 65, 8–18. [Google Scholar] [CrossRef]
- Pérez, S.M.; Reátegui, J.S.; Mendoza, A.S. Contaminación ambiental producida por el tránsito vehicular y sus efectos en la salud humana: Revisión de literatura. Inventum 2021, 16, 20–30. [Google Scholar] [CrossRef]
- Alves, H.P.d.F. Socio-environmental vulnerability in the São Paulo Macro-metropolis’ three main metropolitan regions: A socio-environmental indicators analysis. Ambiente Soc. 2021, 24, e00302. [Google Scholar] [CrossRef]
- González-Ramírez, A.M.; Güiza, F.; Reyes-Quintero, M.S.; Méndez-López, M.E.; Torres-Lima, P. Vulnerabilidad Socioambiental desde los Feminismos Comunitarios: El Desastre por el Sismo del 19S en Tetela del Volcán, Morelos, México. Rev. Estud. Latinoam. Sobre Reducción Riesgo Desastres REDER 2022, 6, 35–50. [Google Scholar] [CrossRef]
- Alves, P.B.R.; Djordjević, S.; Javadi, A.A. An integrated socio-environmental framework for mapping hazard-specific vulnerability and exposure in urban areas. Urban. Water J. 2021, 18, 530–543. [Google Scholar] [CrossRef]
- Lacabana, P. Gradiente de vulnerabilidad socio-ambiental en el Partido de Quilmes, Provincia de Buenos Aires, Argentina. Rev. Geográfica 2022, 164, 39–62. [Google Scholar] [CrossRef]
- Rótolo, M.; Zulaica, M.L. Vulnerabilidad socioambiental y resiliencia en dos barrios del borde urbano de la ciudad de Mar del Plata: Aportes para la gestión local. Astrágalo Cult. Arquit. Ciudad. 2021, 28, 73–102. [Google Scholar] [CrossRef]
- Long, J.W.; Steel, E.A. Shifting perspectives in assessing socio-environmental vulnerability. Sustainability 2020, 12, 2625. [Google Scholar] [CrossRef]
- Gupta, A.K.; Negi, M.; Nandy, S.; Kumar, M.; Singh, V.; Valente, D.; Petrosillo, I.; Pandey, R. Mapping socio-environmental vulnerability to climate change in different altitude zones in the Indian Himalayas. Ecol. Indic. 2020, 109, 105787. [Google Scholar] [CrossRef]
- Doroni, G. Costos ambientales-sociales en el marco de la mercantilización de los recursos naturales. Contextos de vulnerabilidad social-ambiental. Derecho Global. Estud. Sobre Derecho Y Justicia 2021, 6, 77–106. [Google Scholar] [CrossRef]
- Cardoso, M.M. Estudio de la vulnerabilidad y la resiliencia en la ciudad de Santa Fe, Argentina: El rol de los servicios urbanos en general y del transporte de pasajeros en particular. Rev. Geogr. Norte Gd. 2019, 73, 133–159. [Google Scholar] [CrossRef]
- Gupta, A.K.; Negi, M.; Nandy, S.; Alatalo, J.M.; Singh, V.; Pandey, R. Assessing the vulnerability of socio-environmental systems to climate change along an altitude gradient in the Indian Himalayas. Ecol. Indic. 2019, 106, 105512. [Google Scholar] [CrossRef]
- Szewrański, S.; Świąder, M.; Kazak, J.K.; Tokarczyk-Dorociak, K.; Van Hoof, J. Socio-environmental vulnerability mapping for environmental and flood resilience assessment: The case of ageing and poverty in the City of Wrocław, Poland. Integr. Environ. Assess. Manag. 2018, 14, 592–597. [Google Scholar] [CrossRef] [PubMed]
- Mavromatidi, A.; Briche, E.; Claeys, C. Mapping and analyzing socio-environmental vulnerability to coastal hazards induced by climate change: An application to coastal Mediterranean cities in France. Cities 2018, 72, 189–200. [Google Scholar] [CrossRef]
- Sieron, K.; Montiel, F.C.; Pérez, J.C.; Rocha, J.C.A. Vulnerabilidad socioambiental ante fenómenos naturales en las localidades de Texcaltitán, Tonalapan y Nacimiento de Xogapan. UVserva Rev. Electrónica Coord. Univ. Obs. Univ. Veracruzana 2018, 5, 75–84. [Google Scholar]
- Cardoso, M.M. Estudio de la vulnerabilidad socio-ambiental a través de un índice sintético. Caso de distritos bajo riesgo de inundación: Santa Fe, Recreo y Monte Vera, Provincia de Santa Fe, Argentina. Cad. Geogr. 2017, 27, 156–183. [Google Scholar] [CrossRef]
- Ho, H.C.; Lau, K.K.-L.; Yu, R.; Wang, D.; Woo, J.; Kwok, T.C.Y.; Ng, E. Spatial variability of geriatric depression risk in a high-density city: A data-driven socio-environmental vulnerability mapping approach. Int. J. Environ. Res. Public Health 2017, 14, 994. [Google Scholar] [CrossRef]
- Gordillo, G.d.C.Á.; Pablos, E.T. Vulnerabilidad social de la población desplazada ambiental por las inundaciones de 2007 en Tabasco (México). Cuad. Geogr. Rev. Colomb. Geogr. 2016, 25, 123–138. [Google Scholar] [CrossRef]
- Krellenberg, K.; Welz, J.; Link, F.; Barth, K. Urban vulnerability and the contribution of socio-environmental fragmentation: Theoretical and methodological pathways. Progress. Human. Geogr. 2017, 41, 408–431. [Google Scholar] [CrossRef]
- López-García, T.G.; Manzano, M.G. Vulnerabilidad climática y situación socioambiental: Percepciones en una región semiárida del noreste de México. Madera Y Bosques 2016, 22, 105–117. [Google Scholar] [CrossRef][Green Version]
- Cabral, V.N.; Zulaica, M.L. Análisis de la vulnerabilidad socioambiental en áreas del periurbano de Mar del Plata (Argentina) expuestas a agroquímicos. Multiciencias 2015, 15, 172–180. [Google Scholar]
- Daga, D.; Zulaica, M.L.; Vázquez, P. Evaluación de la vulnerabilidad socio-ambiental del periurbano de Mar del Plata. Estud. Socioterritoriales 2015, 18, 45–59. [Google Scholar]
- Araújo, R.O.d.; Rosa, T.C. Socio-environmental vulnerability and disaster risk reduction: The role of Espírito Santo State (Brazil). Ambiente Soc. 2014, 17, 117–132. [Google Scholar] [CrossRef]
- Cuadra, D.E. Industria maderera y vulnerabilidad socioambiental: El caso de Machagai en el centro del Chaco. Geográfica Digit. 2012, 9, 1. [Google Scholar] [CrossRef][Green Version]
- Lara-Valencia, F.; Álvarez-Hernández, G.; Harlow, S.D.; Denman, C.; García-Pérez, H. Vulnerabilidad socioambiental y mortalidad infantil en barrios de Hermosillo, Sonora. Salud Pública México 2012, 54, 367–374. [Google Scholar] [CrossRef] [PubMed][Green Version]
- Sánchez-González, D.; Egea-Jiménez, C. Enfoque de vulnerabilidad social para investigar las desventajas socioambientales: Su aplicación en el estudio de los adultos mayores. Papeles Población 2011, 17, 151–185. [Google Scholar]
- Zulaica, L.; Ferraro, R. Vulnerabilidad socio-ambiental y dimensiones de la sustentabilidad en un sector del periurbano marplatense. Estud. Socioterritoriales 2010, 8, 197–219. [Google Scholar]
- Bello Sánchez, W.; González Rego, R. La vulnerabilidad socio-ambiental en la evaluación socio-espacial del centro histórico de La. Habana. Proyección 2010, 9, 105–122. [Google Scholar]
- Beraud Lozano, J.L.; Covantes Rodríguez, C.; Beraud Martínez, I. Vulnerabilidad socioambiental en Mazatlán, México. Cuad. Geográficos Univ. Granada 2009, 45, 31–62. [Google Scholar]
- García, L.; Mungaray-Moctezuma, A.; Calderón, J.; Sánchez-Atondo, A.; Gutiérrez-Moreno, J. Impacto de la accesibilidad carretera en la calidad de vida de las localidades urbanas y suburbanas de Baja California, México. EURE 2019, 45, 99–122. [Google Scholar] [CrossRef]
- Montejano Escamilla, J.A.; Avila Jiménez, G.; Caudillo Cos, C.A. Estandarización de las áreas geoestadísticas básicas urbanas para 100 ciudades del Sistema Urbano Nacional. Real. Datos Y Espacio. Rev. Int. Estadística Y Geogr. 2020, 11, 3. [Google Scholar]
- IMPLAN. Plan Integral de Movilidad Urbana Sustentable (PIMUS) del Municipio de Tijuana, Baja California 2019–2040; IMPLAN: Huntersville, NC, USA, 2019. [Google Scholar]
- Encinas, M. El crecimiento Urbano de Tijuana Desde la Perspectiva del Espacio Relacional. Ph.D. Thesis, El Colegio de la Frontera Norte, Tijuana, México, 2018. [Google Scholar]
- Sanchez Rodriguez, R.A.; Morales Santos, A.E. Vulnerability assessment to climate variability and climate change in Tijuana, Mexico. Sustainability 2018, 10, 2352. [Google Scholar] [CrossRef]
- INEGI. Compendio de Información Geográfica Municipal 2010 Tijuana; Instituto Nacional de Estadística y Geografía: México, D.F., México, 2010.
- IMPLAN. Programa de Desarrollo Urbano del Centro de Población Tijuana, B.C. (PDUCPT) 2010–2030; Instituto Metropolitano de Planeación Tijuana, Baja California: Tijuana, México, 2010.
- Huizar Contreras, H. Evaluación de los parques de Tijuana desde un enfoque de justicia ambiental. Master´s Thesis, El Colegio de la Frontera Norte, Tijuana, México, 2012. [Google Scholar]
- Sánchez, E.S.; Sandoval, R.P.; Castro, I.G. Migración y trabajo en el norte de México: Tijuana, la frontera utópica. Rev. Inclusiones Rev. Humanidades Y Cienc. Soc. 2016, 3, 69–86. [Google Scholar]
- Marchand, M.H.; Ramírez, A.S.O. Globalising cities at the crossroads of migration: Puebla, Tijuana and Monterrey. Third World Q. 2019, 40, 612–632. [Google Scholar] [CrossRef]
- Acosta, F.; Reyes, A.; Solís, M. Crisis económica, migración interna y cambios en la estructura ocupacional de Tijuana, México. Papeles Población 2015, 21, 9–46. [Google Scholar]
- Galicia Cerda, C.M. Borderland: Análisis Morfológico de los Paisajes Informales de Tijuana, México. Master’s Thesis, Universitat Politècnica de Catalunya, Barcelona, Spain, 2021. [Google Scholar]
- Rahman, M.M.; Husnain, M.I.u.; Azimi, M.N. An environmental perspective of energy consumption, overpopulation, and human capital barriers in South Asia. Sci. Rep. 2024, 14, 4420. [Google Scholar] [CrossRef] [PubMed]
- Alegría, T. Metrópolis Transfronteriza: Revisión de la Hipótesis y Evidencias de Tijuana, México y San Diego, Estados Unidos; El Colegio de la Frontera Norte: Tijuana, México, 2015. [Google Scholar]
- Martínez Cuero, J. La subcontratación como estrategia de rentabilidad para el capital transnacional: La industria maquiladora en Tijuana, 1990–2017. Análisis Económico 2018, 33, 143–167. [Google Scholar] [CrossRef]
- Cota, N.D. Consideraciones Sobre Los Residuos Peligrosos Generados Por Maquiladoras En Tijuana, Mexico, En La Decada De Los Noventas. Contrib. A Las Cienc. Soc. 2017. Available online: https://www.eumed.net/rev/cccss/2017/01/residuos.html (accessed on 9 April 2024).
- Jiménez, N. La gestión integral de residuos sólidos urbanos en México: Entre la intención y la realidad. Let. Verdes Rev. Latinoam. Estud. Socioambientales 2015, 17, 29–56. [Google Scholar] [CrossRef][Green Version]
- Espinosa-Aquino, B.; Gabarrell Durany, X.; Quirós Vargas, R. The Role of Informal Waste Management in Urban Metabolism: A Review of Eight Latin American Countries. Sustainability 2023, 15, 1826. [Google Scholar] [CrossRef]
- Gutierrez Galicia, F.; Coria Paez, A.L.; Tejeida Padilla, R. A study and factor identification of municipal solid waste management in Mexico City. Sustainability 2019, 11, 6305. [Google Scholar] [CrossRef]
- Esparza, J. Clasificación y afectación por residuos sólidos urbanos en la ciudad de La Plata, Buenos Aires, Argentina. Rev. Int. Contam. Ambient. 2021, 37, 357–371. [Google Scholar] [CrossRef]
- IMPLAN. Atlas de Riesgos Naturales del Municipio de Tijuana 2014. 2014. Available online: https://implan.tijuana.gob.mx/pdf/atlas/ATLAS%20TIJUANA%202014.pdf (accessed on 2 July 2024).
- Semeraro, T.; Scarano, A.; Buccolieri, R.; Santino, A.; Aarrevaara, E. Planning of urban green spaces: An ecological perspective on human benefits. Land 2021, 10, 105. [Google Scholar] [CrossRef]
- Andrade, M.I.; Anzoátegui, M. Crisis ambiental y sociedad de riesgo: Algunos lineamientos para pensar la vulnerabilidad socio ambiental. In Proceedings of the I Jornadas Platenses de Geografía, La Plata, Argentina, 17–19 October 2018. [Google Scholar]
- Valencia-Herrera, H.; Santillán-Salgado, R.J.; Venegas-Martínez, F. On the interaction among economic growth, energy-electricity consumption, CO2 emissions, and urbanization in Latin America. Rev. Mex. Econ. Y Finanz. 2020, 15, 745–767. [Google Scholar] [CrossRef]
- Hufschmidt, G. A comparative analysis of several vulnerability concepts. Nat. Hazards 2011, 58, 621–643. [Google Scholar] [CrossRef]
- Rana, I.A.; Routray, J.K. Multidimensional model for vulnerability assessment of urban flooding: An empirical study in Pakistan. Int. J. Disaster Risk Sci. 2018, 9, 359–375. [Google Scholar] [CrossRef]
- Kasperson, J.X.; Kasperson, R.E.; Turner, B.; Hsieh, W.; Schiller, A. Vulnerability to global environmental change. In Social Contours of Risk; Routledge: London, UK, 2022; pp. 245–285. [Google Scholar]
- Vieira, R.M.d.S.P.; Tomasella, J.; Cunha, A.P.M.d.A.; Barbosa, A.A.; Pompeu, J.; Ferreira, Y.; Santos, F.C.; Alves, L.M.; Ometto, J. Socio-environmental vulnerability to drought conditions and land degradation: An assessment in two northeastern brazilian river basins. Sustainability 2023, 15, 8029. [Google Scholar] [CrossRef]
- Malta, F.S.; Costa, E.d. Socio-environmental vulnerability index: An application to Rio de Janeiro-Brazil. Int. J. Public Health 2021, 66, 584308. [Google Scholar] [CrossRef]
- Padilla Gil, L.L.; Huape Padilla, G.A.; Nieto del Valle, C.A. La vulnerabilidad socio-ambiental como pérdida del bienestar. Rev. Psicolología Univ. Autónoma Estado México 2021, 11, 71–92. [Google Scholar] [CrossRef]
- Zulaica, L.; Molpeceres, C.; Vazquez, P.; Somoza, A. Vulnerabilidad Socioambiental en Ciudades Argentinas: Desafíos Para el Ordenamiento Territorial en un Contexto de Cambio Climático; CONICET: Buenos Aires, Argentina, 2020.
- Gutiérrez-Murillo, R.S.; Grossi, P.K. Socio-Environmental Risk Management of the COVID-19 Pandemic in Central America: Unity Became Strength Even in Times of Uncertainty. Environ. Sci. Proc. 2022, 24, 6. [Google Scholar] [CrossRef]
- Eakin, H.; Luers, A.L. Assessing the vulnerability of social-environmental systems. Annu. Rev. Environ. Resour. 2006, 31, 365–394. [Google Scholar] [CrossRef]
- Mello, B.J.; de Moraes Souza, C.M.; Aumond, J.J.; Silva, J.I.A.O.; Langa, E.D.; de Novaes, J.M. Socio-environmental vulnerability to disasters: Scenarios and challenges for the municipality of Brusque (SC). Rev. Gestão Ambient. E Sustentabilidade 2023, 12, 1–27. [Google Scholar]
- Palacios, A.; Mellado, A.; León, Y. Qualitative Methodologies for the Analysis of Intra-Urban Socio-Environmental Vulnerability in Barcelona (Spain): Case Studies. Urban. Sci. 2018, 2, 116. [Google Scholar] [CrossRef]
- Tanim, A.H.; Goharian, E.; Moradkhani, H. Integrated socio-environmental vulnerability assessment of coastal hazards using data-driven and multi-criteria analysis approaches. Sci. Rep. 2022, 12, 11625. [Google Scholar] [CrossRef] [PubMed]
- Nero, B.F. Urban green space dynamics and socio-environmental inequity: Multi-resolution and spatiotemporal data analysis of Kumasi, Ghana. Int. J. Remote Sens. 2017, 38, 6993–7020. [Google Scholar] [CrossRef]
- CONAPO. Metodología de Estimación del Índice de Marginación Urbana 2010. Anexo C. de Metodología para la Medición Multidimensional de la Pobreza en México. 2010. Available online: http://www.conapo.gob.mx/work/models/CONAPO/indices_margina/2010/anexoc/AnexoC.pdf (accessed on 2 July 2024).
- Gutiérrez, M.; Sánchez-Atondo, A.; Mungaray-Moctezuma, A.; Calderón, J. Assessment of the environmental and socioeconomic impact derived from urbanization processes in the vicinity of the Tijuana river, Mexico. Interciencia 2021, 46, 162–168. [Google Scholar]
- Rodríguez Esteves, J.M. La conformación de los “desastres naturales”. Construcción social del riesgo y variabilidad climática en Tijuana, B.C. Front. Norte 2007, 19, 83–112. [Google Scholar]


Disclaimer/Publisher’s Note: The statements, opinions and data contained in all publications are solely those of the individual author(s) and contributor(s) and not of MDPI and/or the editor(s). MDPI and/or the editor(s) disclaim responsibility for any injury to people or property resulting from any ideas, methods, instructions or products referred to in the content. |
© 2024 by the authors. Licensee MDPI, Basel, Switzerland. This article is an open access article distributed under the terms and conditions of the Creative Commons Attribution (CC BY) license (https://creativecommons.org/licenses/by/4.0/).