Article

Packaging Matters: Preservation of Antioxidant Compounds of Fresh Stinging Nettle Leaves (Urtica dioica L.)

1
Faculty of Agriculture, University of Zagreb, Svetošimunska Cesta 25, 10000 Zagreb, Croatia
2
Faculty of Food Technology and Biotechnology, University of Zagreb, Pierottijeva 6, 10000 Zagreb, Croatia
3
Teaching Institute of Public Health “Dr. Andrija Štampar”, Mirogojska 16, 10000 Zagreb, Croatia
*
Author to whom correspondence should be addressed.
Appl. Sci. 2024, 14(15), 6563; https://doi.org/10.3390/app14156563
Submission received: 8 July 2024 / Revised: 23 July 2024 / Accepted: 24 July 2024 / Published: 26 July 2024
(This article belongs to the Special Issue Antioxidant Compounds in Food Processing)

Abstract

:

Featured Application

The findings from this research may have a specific and so far unique application in creating new packaged food products that are not traditionally distributed as such. The results show that the selection of proper packaging material with good thickness, transparency and permeability characteristics along with favorable storage conditions can help to preserve the antioxidant compounds of fresh-cut nettle leaves for 14 days.

Abstract

Green leafy vegetables are very challenging in terms of storage and preservation, while packaging in controlled conditions with the selection of appropriate polymer material is crucial for maintaining their nutritional value and quality. Various packaging materials have different gas and water vapor permeability as well as physicochemical properties that can create a specific environment inside the package, therefore affecting the chemical composition, sensory characteristics, and overall quality of packed leafy vegetables. Stinging nettle is an edible plant with a high antioxidant content, making it a valuable leafy vegetable. Therefore, this study aimed to evaluate the influence of four packaging materials (biaxially oriented polypropylene (BOPP), low-density polyethylene (LDPE), polyamide/polyethylene (PA/PE), and polylactic acid (PLA)) on the antioxidant content of packed fresh nettle leaves during 14-day storage. Ascorbic acid content was the highest after 6 days of storage, equally well preserved in all tested films, with an average of 86.74 mg/100 g fm (fresh mass). After 14 days of storage, the total phenolic content was best preserved when packed in LDPE. The content of caffeoylmalic and chlorogenic acids was the highest in LDPE after 6 days. In addition, leaves packed in LDPE after 6 days of storage had the highest content of all photosynthetic pigments. According to FRAP analysis, the antioxidant capacity was best maintained in LDPE (at the 14th day, the measured capacity was 43.61 µmol TE/g). This study shows that the type of packaging material (BOPP, LDPE, PA/PE, and PLA) and storage duration (6 and 14 days) have a great impact on the level of antioxidant compounds in the nettle leaves, where LDPE and BOPP can be highlighted as the most favorable for the preservation of total and individual phenolic compounds, photosynthetic pigments, and antioxidant capacity.

1. Introduction

Maintaining the organoleptic and nutritional quality of freshly cut leafy vegetables is demanding, considering their tender structure is prone to deterioration and loss of nutritional value. The selection of a suitable packaging material and appropriate storage conditions are the most important first steps in the production of new fresh food products, as these measures can greatly preserve the nutritional value and overall quality of the plant material [1,2]. Previous research on the packaging of fresh leafy vegetables can lay the foundation for research on the packaging of new species. Understanding the role, characteristics, and properties of packaging films is crucial for prolonging shelf life, preserving chemical composition, and ensuring the optimal quality of leafy greens.
After harvest, leafy vegetables continue their metabolic processes, including respiration, transpiration, and enzymatic activity, leading to wilting, spoilage, loss of antioxidant compounds, other nutrients, and quality in general [3,4,5,6]. Various techniques are used to slow down the post-harvest processes, moisture loss, microbial growth, and spoilage of leafy vegetables, including temperature management, humidity control, the selection of packaging material, and modified atmosphere packaging (MAP) [6,7,8,9,10,11]. In addition to establishing optimal conditions, the choice of packaging material also plays a crucial role in preserving the freshness and quality of leafy vegetables, especially when it comes to antioxidant compounds, since different polymer packaging materials can create a protective barrier against oxygen, light, and moisture depending on different permeability features, thickness, and transparency [12,13,14,15,16,17,18]. Studies on the packaging conditions along with the product shelf life of various green leafy vegetables and plants such as lettuce, lamb’s lettuce, spinach, kale, and Swiss chard have been well studied in the available scientific literature, where different polymer materials such as polypropylene, polyethylene, and polyethylene terephthalate have been used [7,10,19,20]. In addition, using biodegradable materials for vegetable packaging, such as polylactic acid, may be an alternative to conventional polymers, offering several advantages that are consistent with the principles of circular economy and sustainability. Unfortunately, these materials provide a moderate barrier to gases that, due to their degradability, may not provide the same level of protection as conventional polymers, and therefore the possibility of use on a specific food product must be further studied [19,20,21,22].
It is important to note that most research [6,10,19,23,24] on the packaging and storage of leafy vegetables focuses on microbiology, sensory characteristics, and shelf life, while comprehensive studies on the preservation of antioxidant compounds using different polymer packaging materials are lacking. Preserving the content of these compounds is essential for maximizing their health benefits, which can help prevent chronic diseases and support immune function in the human organism. Appreciated both as a culinary ingredient and as a traditional herbal remedy, stinging nettle (Urtica dioica L.) is a green leafy vegetable species with a rich nutritional composition and is a great source of proteins, carbohydrates, fatty acids, minerals, and antioxidant compounds such as vitamins, polyphenolic compounds, and pigments [25,26,27]. Since each plant species has specific storage and packaging requirements with regard to the peculiarities of its texture, tissue structure, and chemical composition, it is necessary to set adequate storage conditions (temperature, air humidity), choose the appropriate packaging material, and determine the durability of such packaging in order to obtain initial guidelines for creating a new packaged fresh-cut plant product. After a detailed examination of the literature and database, we did not come across any scientific research on the possibilities of packaging and storing fresh nettle leaves. Considering the significant nutritional value, along with the high antioxidant and pharmacological potential of stinging nettle, and in the absence of its availability in the food industry and on the market, this opens up an opportunity for packaging fresh nettle leaves as a finished food product intended for consumers. Research and optimization are required to strike a balance between the preservation of antioxidants and maintaining the overall quality of fresh stinging nettle leaves. This type of research is important for both the food industry and the scientific community, as it enables the creation of a new food product previously unknown on the market and also lays the foundations for further scientific research into the possibilities of packaging nettle leaves for a longer period of time using modern methods.
Therefore, the objective of this study was to assess the impact of different packaging materials with various characteristics on the preservation of antioxidant compounds and the quality of fresh packaged nettle leaves during a storage period of 14 days. The storage period was determined based on previous research on the preservation of leafy vegetables [7,10,19,23].

2. Materials and Methods

2.1. Materials

All chemicals, reagents and standards used: EtOH (96%), Folin–Ciocalteu reagent, sodium carbonate, hydrochloric acid (37%), formaldehyde, acetonitrile (≥99.9%, HPLC grade), MeOH and water (≥99%, HPLC grade), standards of individual phenolic compounds (caffeoylmalic, chlorogenic, coumaric, ellagic, ferulic, gallic, p-hydroxybenzoic, protocatehuic, vanillic acid, kaempferol, naringin, quercetin, quercetin-3-glucoside, and rutin trihydrate), acetone (p.a.), 2,6-dichlorophenolindophenol, ABTS (2,2′-azinobis(3-ethylbenzothiazoline-6-sulfonic acid)), potassium persulfate, TPTZ (2,4,6-tri pyridyl-s-triazine), iron (III) chloride hexahydrate, and Trolox (6-hydroxy-2,5,7,8-tetramethylchroman-2-carboxylic acid) were purchased from Sigma-Aldrich, Merck (St. Louis, MO, USA).
Stinging nettle leaves (Urtica dioca L.) were obtained from plants grown during the 2022/2023 growing season in Zagreb (Croatia) at the Department of Vegetable Crops, University of Zagreb Faculty of Agriculture, Croatia. The experiment was set up as part of the project “URTICA-BioFuture—Nutritional and functional value of nettle (Urtica dioica L.) by application of modern hydroponic cultivation techniques” (HRZZ IP-2019-04-3325). The plants were grown in a greenhouse in a hydroponic ebb and flow system and harvested before flowering, on 28 March 2023. The leaves were separated from the stems, immediately transported to the Laboratory for Food Packaging, University of Zagreb Faculty of Food Technology and Biotechnology (Zagreb, Croatia), and packaged. Four different packaging films were used: biaxially oriented polypropylene (25 µm, BOPP; Petruzalek d.o.o., Zabok, Croatia), low-density polyethylene (45 µm, LDPE; Helana-pak d.o.o. Zagreb, Croatia), polyamide/polyethylene (65 µm PA/PE; SIMPEX, Salzburg, Austria), and polylactic acid (45 µm, PLA; NATIVIA®NTSS40, Taghleef Industries, Tiszaújváros, Hungary). The materials were chosen due to their different barrier properties, which can influence the exchange of gases between the inner space and surrounding atmosphere in a packed product. The materials were purchased in rolls, and hand-cut to dimensions of 33 × 20 cm. The edges were sealed with a manual sealing machine (AUDION, Virovitica, Croatia).

2.2. Packaging Conditions

Part of the fresh plant material was separated for chemical analysis of the fresh leaves immediately after harvest and used as a control. The total dry matter content of fresh leaves was determined (18.1%), as it includes the content of all chemical compounds except water. The rest of the leaves were packed, stored, and analyzed periodically (after 6 and 14 days) using standard laboratory methods, at the Department of Sustainable Technologies and Renewable Energy Sources, University of Zagreb Faculty of Agriculture (Zagreb, Croatia).
An approximate amount of 50 ± 1 g of fresh leaves was packed in prepared pouches and sealed with a manual heat sealer (AUDION, Virovitica, Croatia). For each packaging material and each sampling time, nettle leaves were packed in three replicates. All packaged samples were stored in a temperature-controlled air conditioning chamber (KK750 SmartPro—PolEko, Richmond Scientific Ltd., Unit 9 Edward Street, Chorley, UK) under controlled conditions at a constant air temperature of 4 °C and a relative air humidity (RAH) of 80% for 14 days. Immediately after taking the sample from the cold room, sampling of the gas contained in each package was taken with an OXYBABY® gas analyzer (OXYBABY WITT-GASETECHNIK GmbH & Co., KG, Witten, Germany) equipped with an injection needle to penetrate the packs, and to monitor the evolution of the composition of the atmosphere inside the package due to the respiration of the product. After opening the packages, the chemical analyses of the plant material were performed.

2.3. Characterization of Packaging Materials

All used packaging materials were analyzed for their thickness, transparency, and water vapor and gas permeability properties (oxygen and carbon dioxide). Considering that PA/PE is a two-layer film, for some analysis, both sides, the smooth (s) and the ribbed (r), were analyzed separately.
The material thickness (l) was measured with a digital micrometer with a precision of 0.001 mm (Digmet, HP, Helios Preisser, Gammertingen, Germany) and expressed as the average value of 10 measurements taken from random positions on each film surface.
The transparency of the films was measured using a UV-VIS spectrophotometer (Lambda 25, PerkinElmer, Waltham, MA, USA) by recording the absorbance in the 200–800 nm spectrum. The measurements were performed in three replicates. The value at 600 nm was used to calculate the transparency of the material (T600) according to Equation (1):
T600 = A600/x
where A600 is the absorbance measured at 600 nm; and x is the material thickness (mm).
The transmittance, i.e., percentage of the light that passes (transmitted) through the sample, was calculated following Equation (2):
T (%) = 10−A · 100
The water vapor permeability of polymer materials was determined using a gravimetric method according to the modified ASTM E96-80 standard (ASTM, 1980) [28]. The glass cells were filled with 20 mL of distilled water, covered with samples of the tested packaging films, and secured with Teflon rings. Four repetitions of each sample were stored in a ventilated climatic chamber (Memmert HPP110, Memmert, Germany) at 23 °C and a relative humidity of 30% (so that the gradient RH was ΔRH = 70%).
The water vapor permeability (WVP, g/m s Pa) was calculated according to Equation (3):
WVP = (∆m/∆t · A · ∆p) · l
and the water vapor transfer rate through the sample (WVTR, g/s m2) according to Equation (4):
WVTR = ∆m/∆t · A
where Δmt is the weight loss of water vapor per unit of time (g/s); A (9.08 ·10−4 m2) is the film surface area exposed to moisture transfer; l is the film thickness (m); ∆p is the difference in water vapor pressure between the two sides of the film (Pa).
Gas permeability was measured by the manometric method (Brugger, GDP-C, Brugger Feinmechanik GmbH, Munich, Germany) [29] and expressed as oxygen (PO2) and carbon dioxide (PCO2) permeability coefficients calculated from the permeance and film thickness. The measurements were performed at 24 °C and 0% RAH and carried out in three repetitions.

2.4. Respiration of Nettle Leaves

The respiration intensity of nettle leaves was measured by monitoring the changes in the proportion of oxygen and carbon dioxide in a closed jar using an OXYBABY® gas analyzer (WITT-GASETECHNIK GmbH & Co., KG, Witten, Germany). A known mass of nettle leaves (15 g) was hermetically sealed in 500 mL jars and stored at 4 ± 2 and 23 ± 2 °C. The proportion of O2 and CO2 was performed in three replicates and measured every 30 min for the first 4.5 h until a steady state, and then again after 22 h. The respiration rate was expressed through O2 consumption and CO2 release, and was calculated according to Equations (5) and (6) [30]:
R O 2 = P O 2 i n P O 2 f · V V 100 · W · t
R C O 2 = P C O 2 f P C O 2 i n   · V V 100 · W · t
where PO2 and PCO2(%) are the partial pressures of O2 and CO2, initial (in) and final (f); Vv is the volume of empty space (mL); W is sample mass (kg); ∆t is time (h).
The respiratory quotient (RQ) was calculated according to Equation (7):
R Q = R C O 2 R O 2

2.5. Nettle Leaf Analysis

2.5.1. Water Content

To determine the total dry matter content (DM, %) of fresh samples and water content (W, %) of packed samples, the leaves were dried in an oven at 105 °C until a constant mass was obtained and were calculated as the difference between the mass before and after drying (AOAC) [31]. Three repetitions per packaging treatment were performed.

2.5.2. Chromaticity Parameter Analyses

Color and chromatic characteristics were measured using a ColorTec PCM+ colorimeter (PCE Instruments, Southampton, UK). Six random measurements of fresh leaf samples per package were created. The total color difference (ΔE*) was calculated using Equation (8):
ΔE* = [(L*L0*)2 + (a*a0*)2 + (b*b0*)2]1/2
where L0*, a0*, and b0* are the lightness, green–red and blue–yellow components, respectively, of the reference (unpacked fresh leaves); and L*, a*, and b* are lightness, green–red and blue–yellow components of the packed samples.

2.5.3. Chemical Analyses

All chemical analyses were performed in three repetitions. Total phenolics, flavonoids, nonflavonoids, and antioxidant capacity were determined in the 80% ethanol extracts (v/v). Stinging nettle leaves were extracted by boiling and condensing with reflux at a final concentration of 100 mg/mL, previously described by Dujmović et al. [26]. For analyses of the individual phenolic compounds, the plant material was extracted with 80% HPLC-grade MeOH (v/v) at 100 mg/mL concentration, in an ultrasonic bath (Bandelin RK 103H, Berlin, Germany) at 50 °C for 30 min.

Pigment Compounds

The chlorophylls (chlorophyll a, chlorophyll b, and total chlorophylls) and carotenoids (total carotenoids) contents, expressed in mg/g fm (fresh mass), were determined spectrophotometrically (Shimadzu, 1900i, Kyoto, Japan) by measuring the absorbance of acetone (p.a.) extracts at different wavelengths (662, 644, and 440 nm) [26]. The resulting absorbance measurements were applied to Holm–Wettstein equations [32,33].

Ascorbic Acid

The amount of ascorbic acid (AsA) in fresh and packaged nettle leaves was determined by titration with 2,6-dichlorophenolindophenol (DCPIP) (AOAC) [31] as described in Dujmović et al. [26], and the AsA content was expressed in mg/100 g fm.

Phenolic Compounds

The content of total phenolic (TPC), total nonflavonoid (TNFC), and total flavonoid (TFC) compounds was determined spectrophotometrically, by applying the Folin–Ciocalteu method [26,34]. The absorbance was measured with a spectrophotometer (Shimadzu, 1900i, Kyoto, Japan) at a wavelength of 750 nm with distilled water as a blank. The results of TPC and TNFC were presented as mg of gallic acid equivalents per 100 g of fresh mass (mg GAE/100 g fm) of the sample, while TFC was expressed as milligrams of catechol equivalents per 100 g of fresh mass (mg CTH/100 g fm).
Individual phenolic compounds (caffeoylmalic, chlorogenic, coumaric, ellagic, ferulic, gallic, p-hydroxybenzoic, protocatechuic, vanillic acid, kaempferol, naringin, quercetin, quercetin-3-glucoside, and rutin trihydrate) were analyzed with liquid chromatography. The separation of the analytes was carried out using HPLC (LC Nexera, Shimadzu, Kyoto, Japan) with a photodiode array and fluorescent (PDA-RF) detector and column Nucleosil® 100-5 C18 (5 µm, 250 mm × 4.6 mm i.d.). Analytical conditions for the separation of phenolic compounds were previously described in Dujmović et al. [26]. Calibration curves were obtained by injecting individual phenolic standards with different concentrations, from whose equations (Table 1) the contents of the individual phenols were calculated (mg/100 g fm).

Antioxidant Capacity

The antioxidant capacity of fresh and packaged nettle leaves was measured with free radical scavenging activity using two standard methods: the method based on a reduction in the radical 2,2′-azinobis (3-ethylbenzothiazoline-6-sulphonic acid) (ABTS assay) and the antioxidant power of reducing ferric ions (FRAP assay), according to Dujmović et al. [26]. The results were expressed as Trolox equivalents (µmol TE/g fm).

2.6. Statistical Analysis

For the statistical analysis, the obtained data were analyzed using ANOVA with SAS software version 9.4 [35]. For packaging material properties and nettle respiration, a one-way ANOVA was conducted, while the results of the chemical compound content were analyzed using a two-way ANOVA, and means were compared by the Fishers least significant difference (LSD) post hoc test and considered significantly different at p ≤ 0.05. Different letters are indicated along the results in tables to denote significant differences between the mean values of treatments.

3. Results

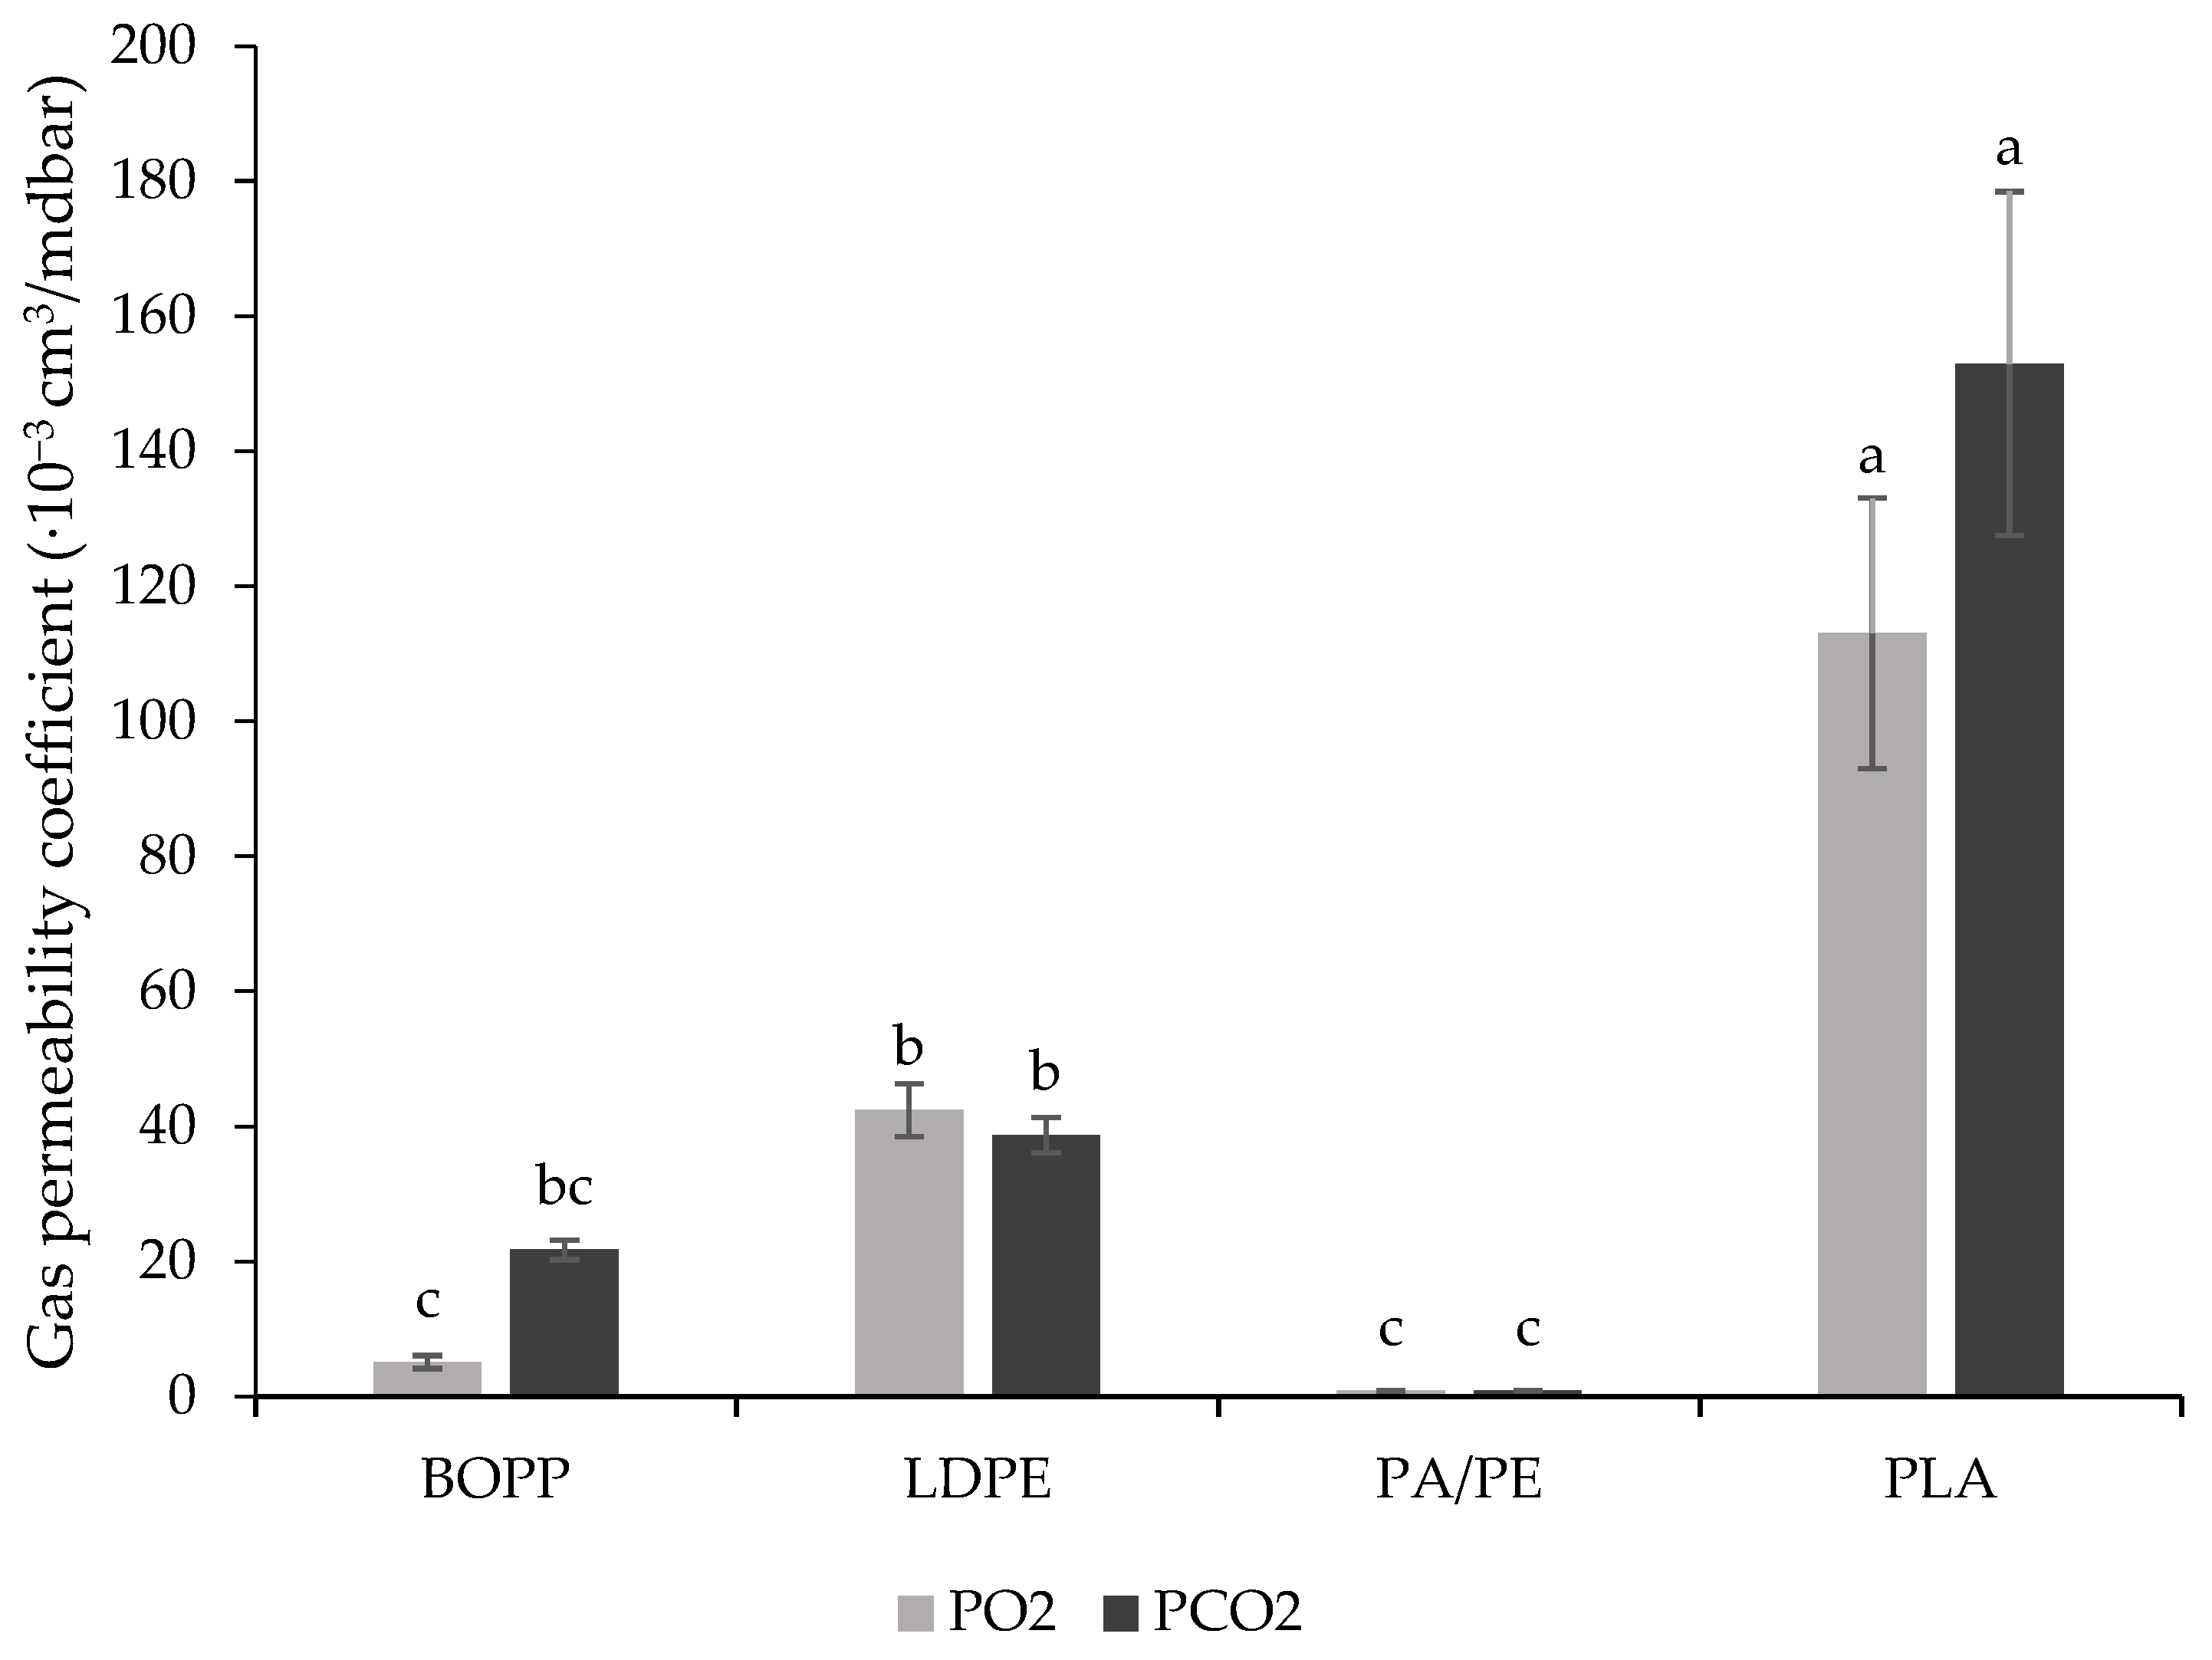
3.1. Physicochemical and Barrier Properties of Used Packaging Materials

The measurement data of film thickness, transparency (T600), transmittance, and water vapor barrier parameters are given in Table 2. Among the used films, PA/PE was the thickest, followed by LDPE, PLA, and BOPP. All results are close to the technical data sheet provided by the producer, except for PA/PE ribbed, where the differences were attributed to the bulges due to the ribbed surface. The most transparent material (T600) was LDPE, followed by BOPP, while the least transparent was PA/PEs. The highest transmittance was observed for PLA, with an even 80% higher value compared to PA/PEr, for which the lowest transmittance was measured.
The highest WVP was measured for PLA film, while the lowest was for BOPP and PA/PE film. There was no statistically significant difference between the smooth and ribbed PA/PE film, which was to be expected due to the same composition. Obtained results indicate that PLA was even 87 times more permeable to water vapor than BOPP, while LDPE was 10 times. Additionally, PLA had approximately 64-fold and 46-fold higher WVTR than BOPP and PA/PEs, respectively.
The permeability coefficients (P) of tested materials to O2 (PO2) and CO2 (PCO2) gases are given in Figure 1. Like the water vapor barrier performance, as expected, and due to its biobased character, the PLA had the highest permeability values for both gases, while the PA/PE had the lowest. LDPE was more permeable to O2 than BOPP.

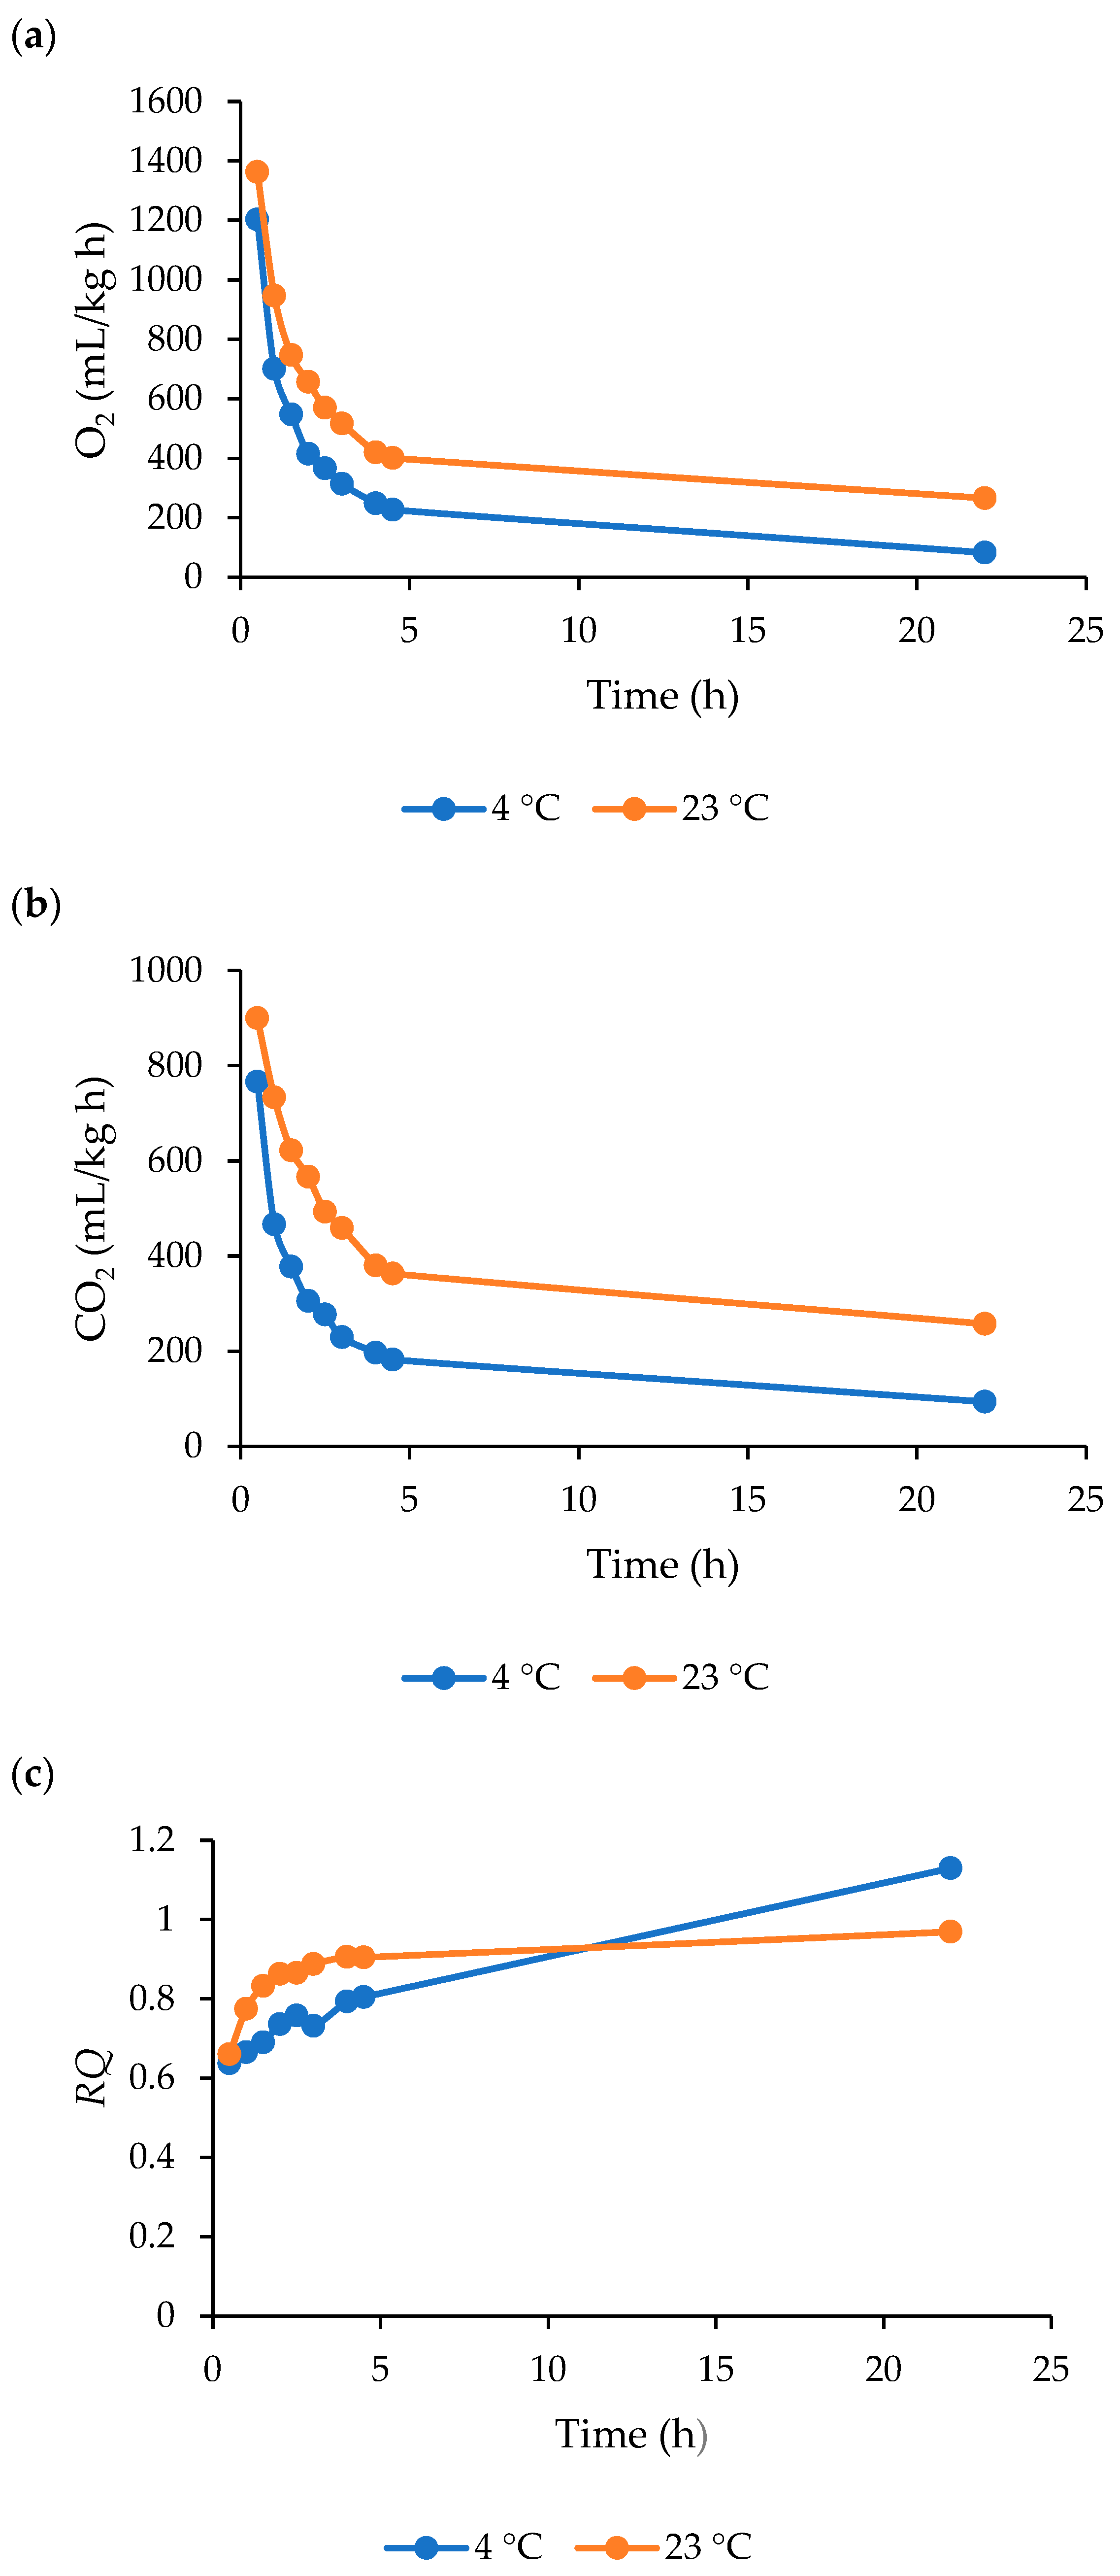
3.2. Respiration of Nettle Leaves

The results of nettle respiration rate, expressed as O2 consumption (RO2) and CO2 production (RCO2), are shown in Figure 2a,b, while the respiratory quotient (RQ) is shown in Figure 2c. Fluctuations throughout the storage were observed for all samples. At the beginning of the measurement, O2 consumption was intense, with a sharp drop after 4.5 h when it stabilized. The same behavior was observed at 4 and at 23 °C, but it was evident that a significantly larger amount of O2 was consumed at a higher temperature. The initial values were recorded as 1203.33 mL O2/kg h and 1363.33 mL O2/kg h for 4 and 23 °C, respectively. Then, after 4.5 h a significant drop was recorded (to 227.16 and 401.24 mL O2/kg h at 4 °C and 23 °C, respectively), and after that, the O2 consumption was still decreasing but at a slower rate, being 83.18 at 4 °C and 265.81 mL/kg h at 23 °C at the end of the measurement. The trend of O2 consumption was the same at both temperatures. The CO2 production rate followed the O2 consumption rate, and was also higher at 23 °C. At the beginning of the measurement, a high production of CO2 was recorded (766.66 at 4 °C and 900 mL/kg h at 23 °C), which dropped sharply in the first 4.5 h of the measurement to the amounts of 182.72 and 362.96 mL/kg h, respectively. During the next 17.5 h, the rate of CO2 production was significantly slower, and after 22 h it was 182.72 at 4 °C and 362.96 mL/kg h at 23 °C. The RQ values for nettle leaves varied between 0.64 and 1.13 at 4 °C and 0.66 and 0.97 at 23 °C during measurement (Figure 2c). At the beginning, the RQ was lower at 4 °C, but at the end of the measurement, it was higher when compared to 23 °C.

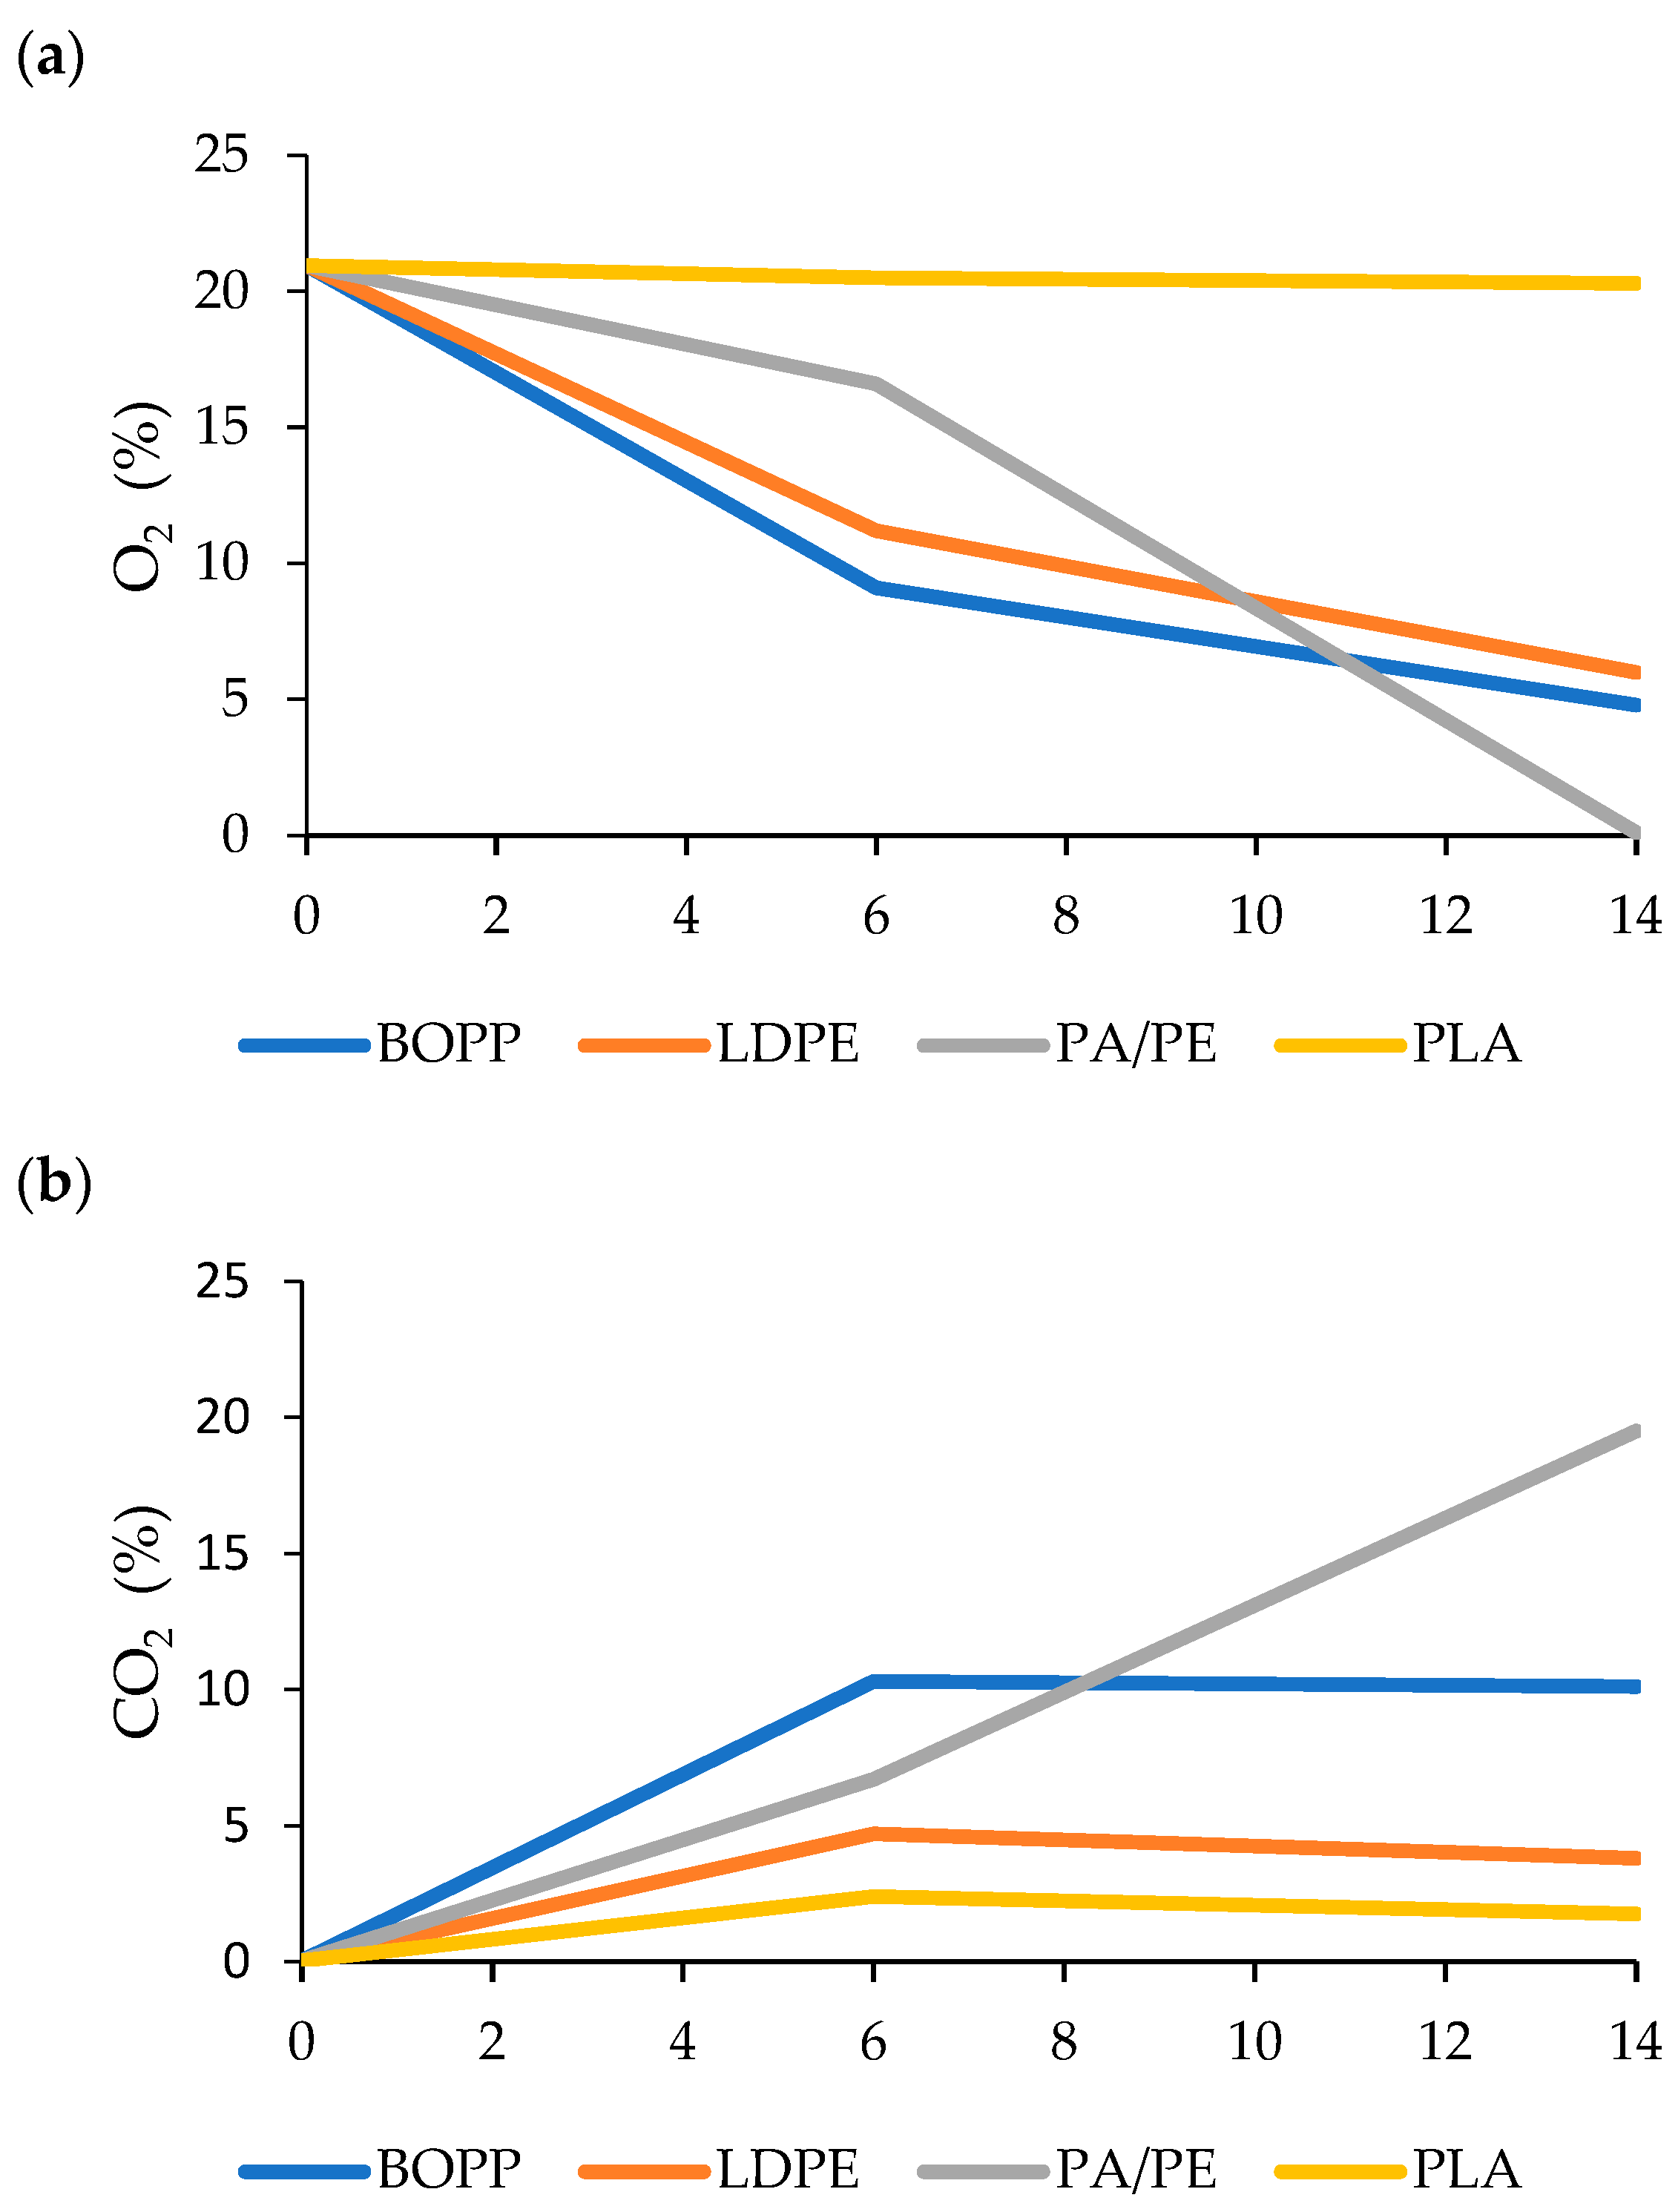
3.3. Gas Composition during the Storage Period

The composition of the gases in the packages was monitored at the 0, 6th, and 14th days of storage, and the results are shown in Figure 3. Immediately after sealing the packages, the composition of the headspace gases was checked using the Oxybaby device. At the beginning of the storage (day 0), the composition of the initial atmosphere in all packages was: 21% O2 and 0.04% CO2 (ambient air atmosphere). The O2 content decreased sharply in all packages, with the exception of PLA, where it remained unchanged until the end of storage. The change in O2 content in BOPP and LDPE pouches was more pronounced in the first 6 days, after which the O2 content decreased more slowly. In contrast to LDPE and BOPP, the decrease in the O2 content in PA/PE pouches was more pronounced between 6 and 14 days, which can be attributed to the higher barrier properties against gases compared to other tested materials. The CO2 content increased in all packages from day 0 to day 6, due to respiration. Further storage resulted in its steady state in BOPP, LDPE, and PLA pouches, while in PA/PE, CO2 content continued to grow sharply because of the impermeable character of PA/PE.

3.4. Characteristics of Fresh and Packed Nettle Leaves

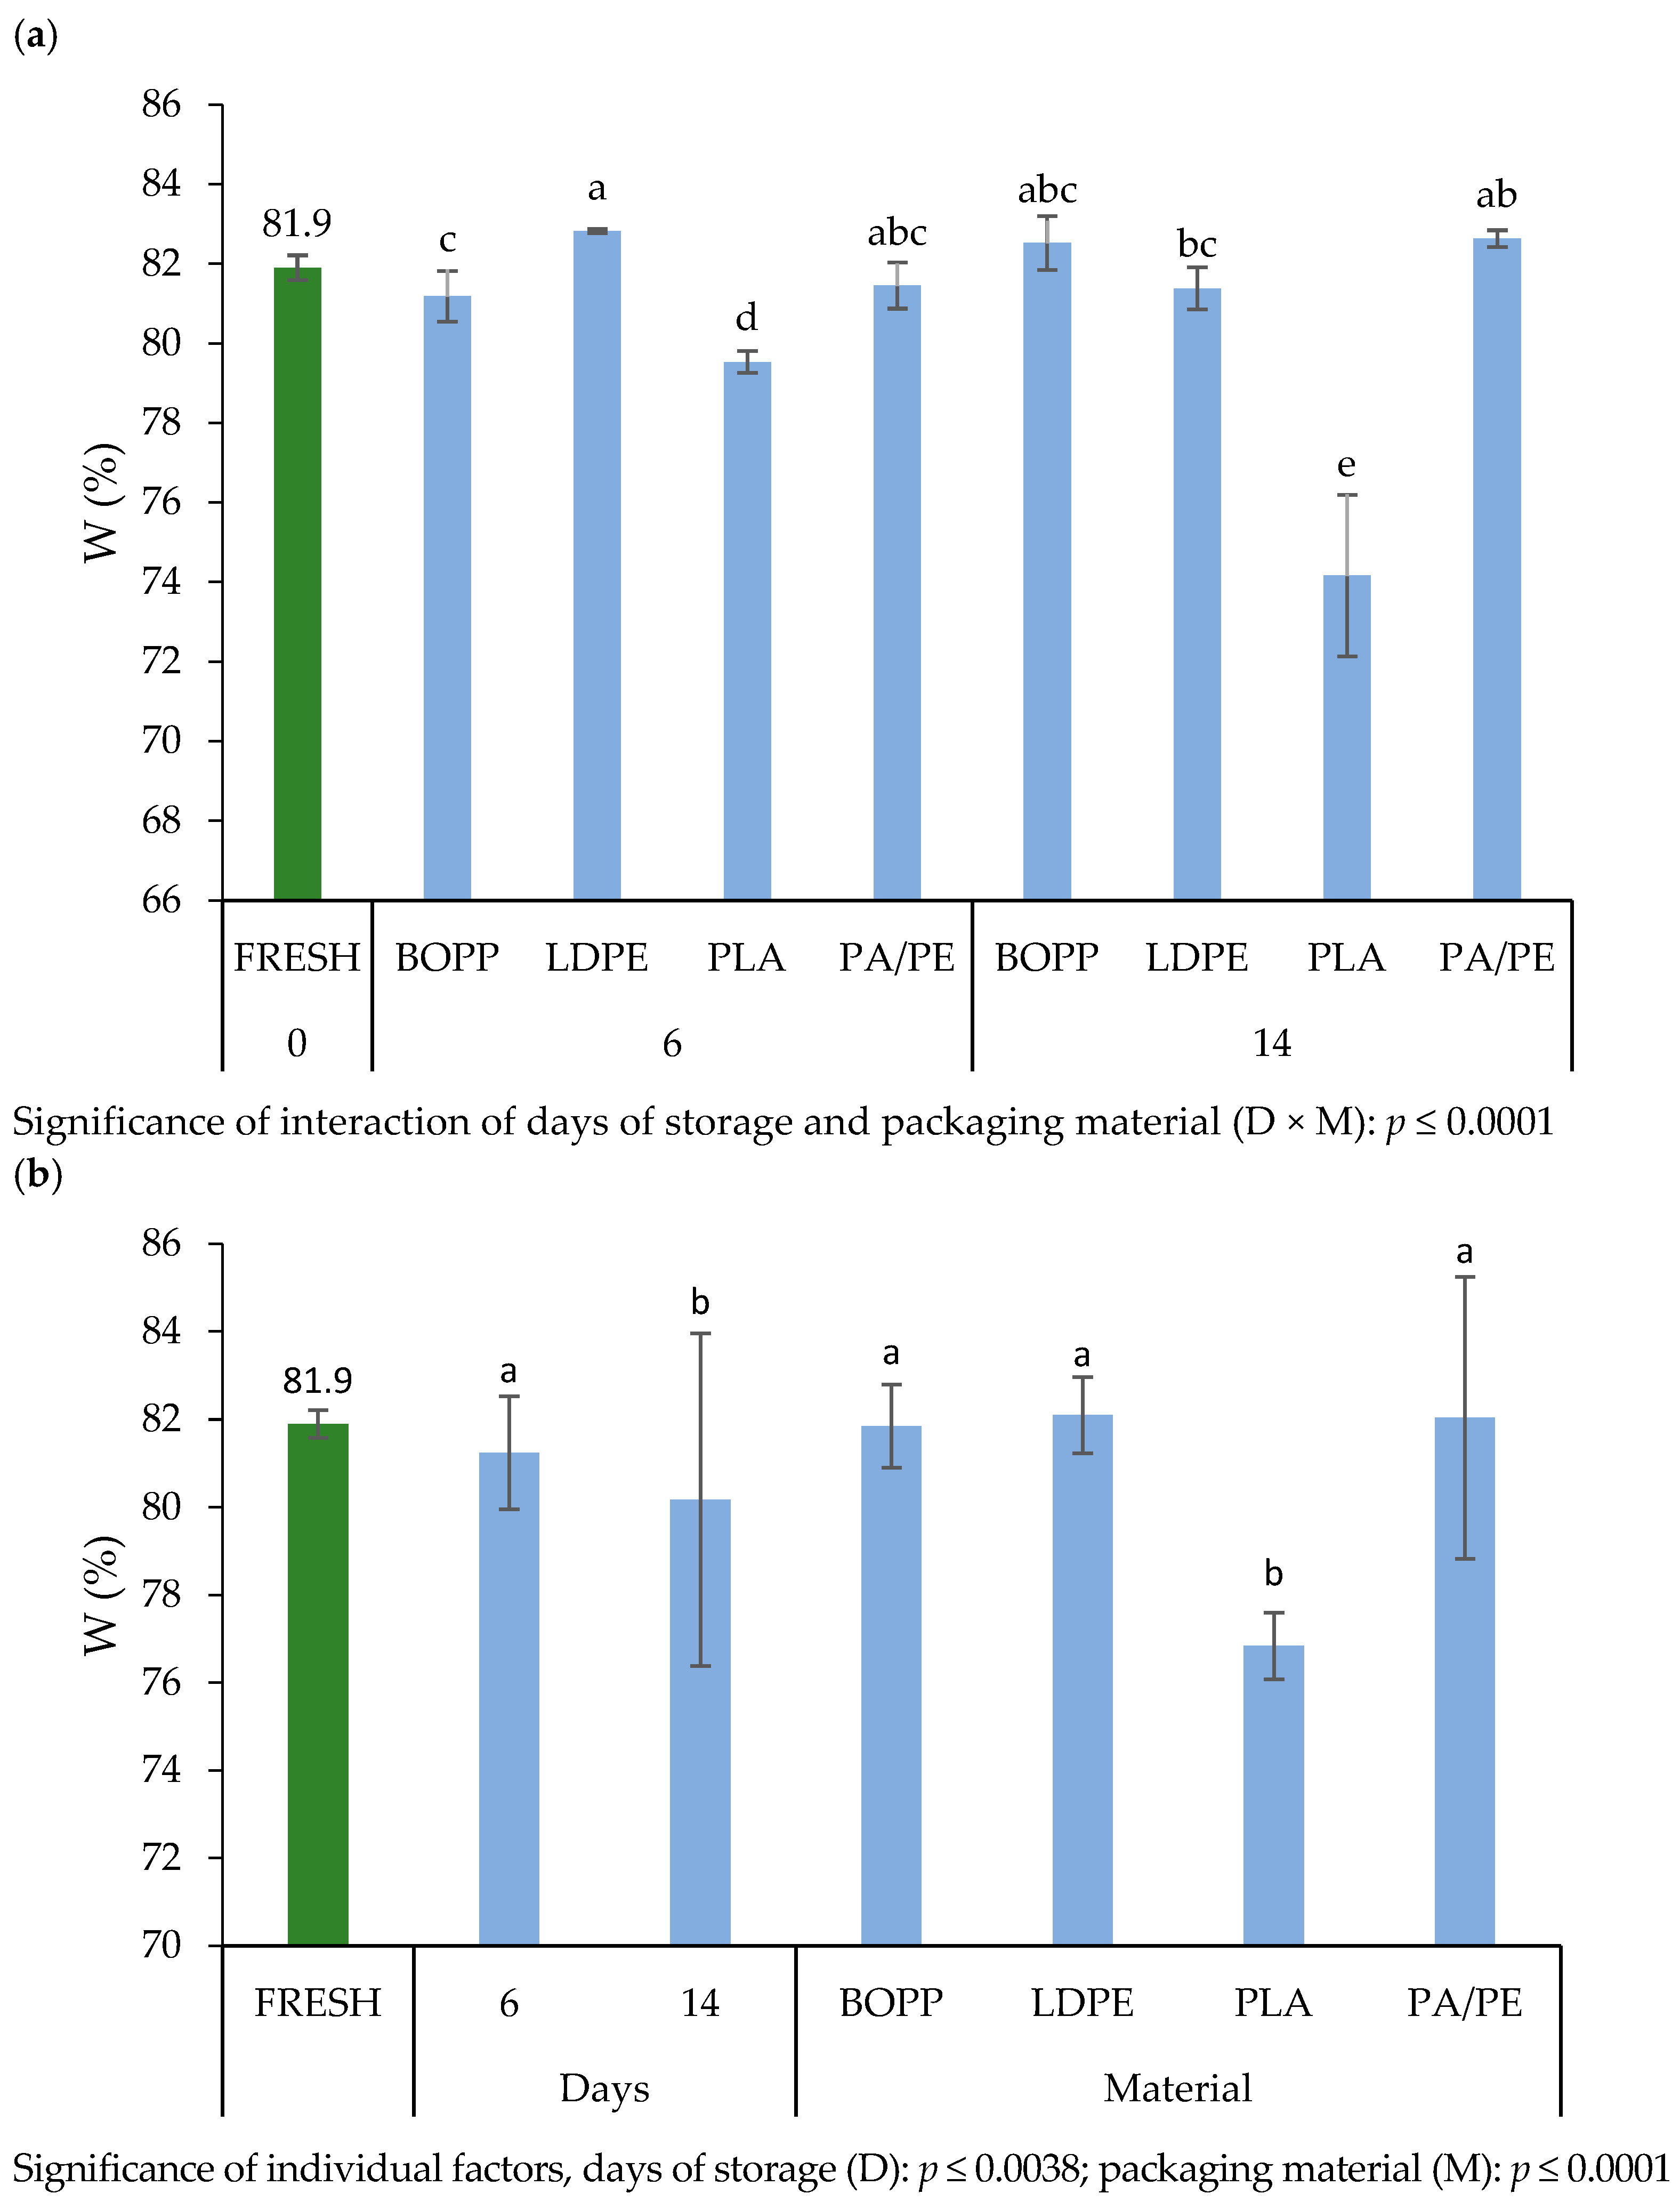
3.4.1. Water Content of Nettle Leaves

The results of the present study (Figure 4) indicate that the interaction of the factors (D × M) had a strong influence on nettle water content (p ≤ 0.0001) and that both individual factors, the days of storage (D) and the material (M), significantly affected water content (W), but with a stronger impact of the material (p ≤ 0.0001). Looking at the packaging material separately as a factor (Figure 4b), there were no statistical differences between the W of nettle leaves packaged in BOPP, LDPE, and PA/PE, and these values were significantly higher (on average, 82%) than the W recorded for leaves packed in PLA. When comparing the W of fresh and packaged nettle leaves, it can be seen that the W in the nettle leaves packaged in BOPP has not changed, while it has actually increased slightly in LDPE and PA/PE compared to the fresh plant material. Comparing the W during the storage period, regardless of the material, it is evident that significantly lower values were recorded after 14 days of storage compared to the 6-day period (Figure 4b). Overall, if observing a combination of factors (Figure 4a), the highest W was recorded in nettle leaves packed in LDPE film after 6 days (82.82%), while the lowest values were observed in leaves packed in PLA after 14 days of storage (74.16%).

3.4.2. Chromaticity Parameters

The tested factors, i.e., the packaging material and the days of storage, and their interaction influenced the chromaticity parameters of nettle leaves (Table 3), whereby the packaging material (M) as an individually observed factor had a higher influence on the overall color parameters and the color change compared to the days of storage (D). The L* value ranged from 35.85 (PA/PE 14 days) to 45.41 (PA/PE 6 days). The a* value did not differ between samples packaged in all variants of packaging material during the 6 and 14 days of storage, with generally lower a* values recorded, averaging −13.63, except for the nettle leaves packaged in PA/PE material after 14 days of storage, where an a* value of −9.39 was recorded. The lowest b* value was recorded for the samples packaged in PA/PE after 14 days of storage (15.4), while the highest value was recorded for the leaves packaged in PA/PE after 6 days and for the leaves packaged in BOPP after 14 days of storage, with no statistical differences between these two samples. The highest color change (∆E) between the packaged samples and the fresh, unpackaged leaves was observed in the nettle leaves packaged in PA/PE after 14 days (12.15), while the lowest was observed in the nettle leaves packaged in LDPE after 6 days of storage (0.74) and in the leaves packaged in BOPP material after 14 days of storage (1.93), with no significant difference between these two samples.

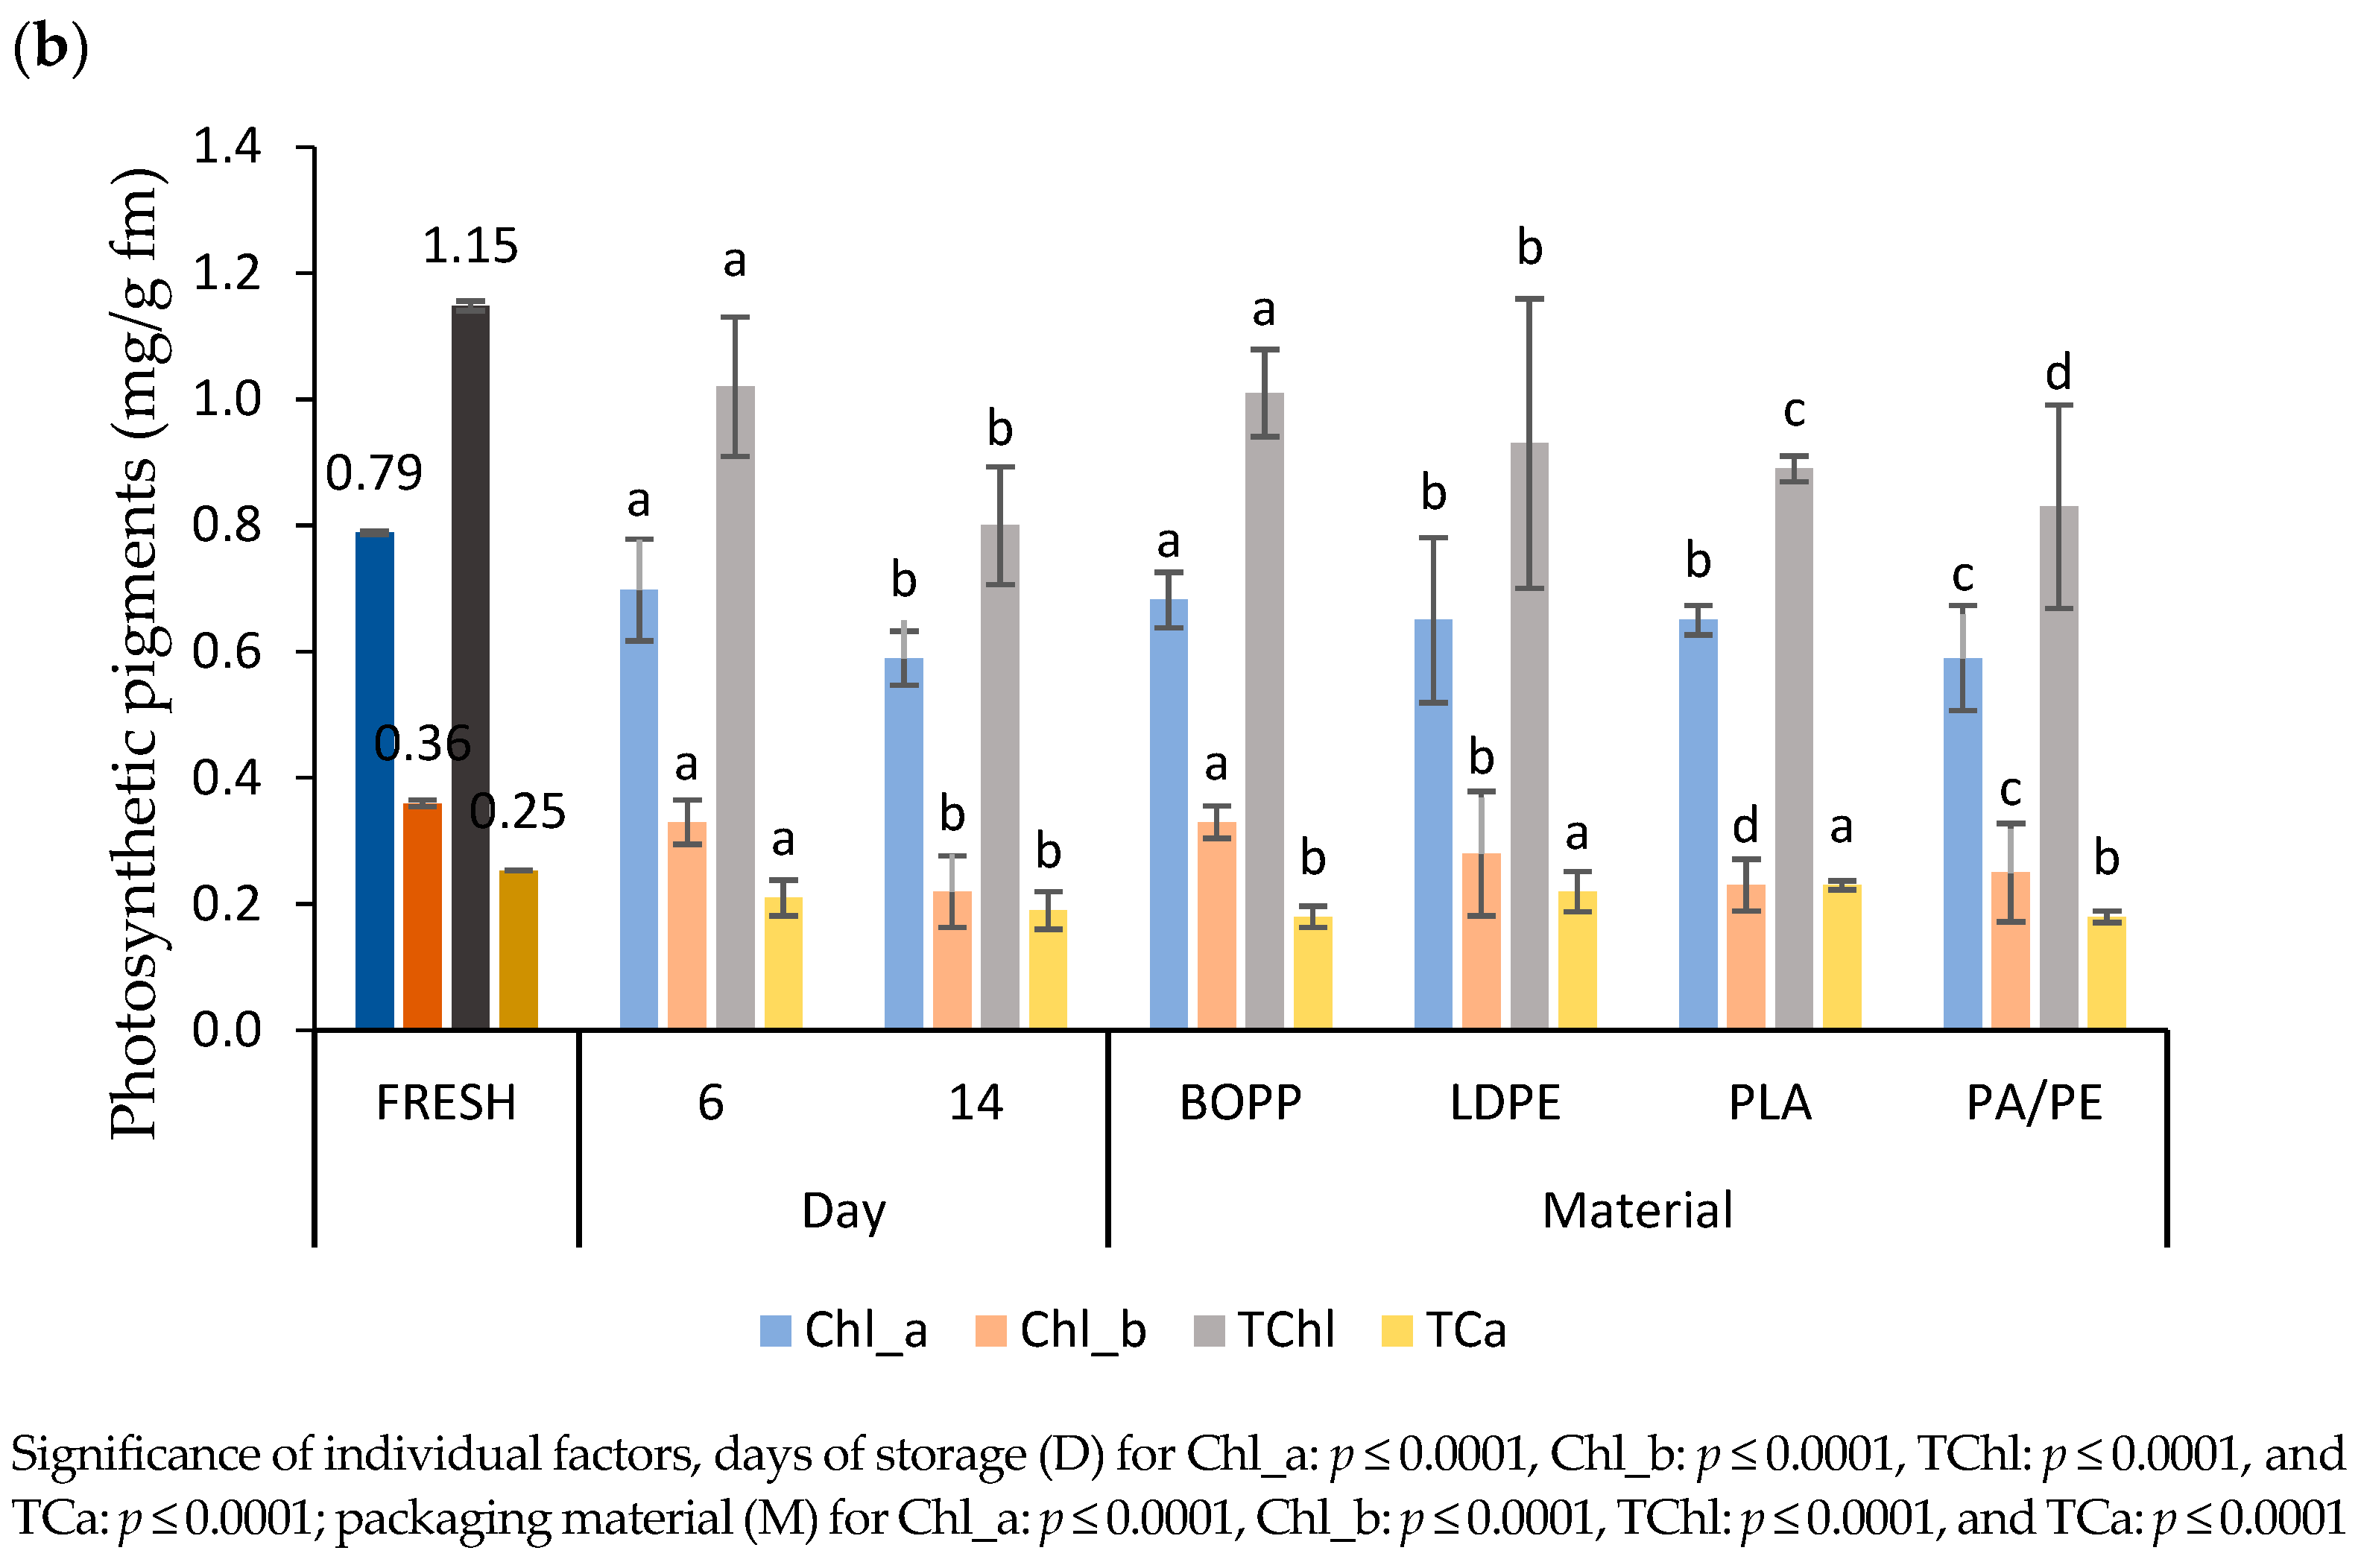
3.4.3. Photosynthetic Pigments

When looking at the results of the photosynthetic pigment content, a significant influence of the interaction of the factors (D × M, p ≤ 0.0001), but also of each individual factor (p ≤ 0.0001) was observed. As can be seen from the results shown in Figure 5a, the highest chlorophyll a (Chl_a) and chlorophyll b (Chl_b) content was determined in the samples packed in LDPE after 6 days of storage with values of 0.77 and 0.37 mg/g, respectively, while the highest total chlorophyll content (TCh) was recorded in both LDPE and BOPP after 6 days with no significant difference between samples. The lowest TCh and Chl_a content was measured after 14 days, in LDPE material, while the lowest Chl_b content in the same period was in nettle leaves packaged in PLA material. The highest total carotenoid content (TCa) was determined in LDPE material after 6 days of storage. Considering packaging material, as an individually observed factor (Figure 5b), all analyzed chlorophyll pigment content was the highest in nettle leaves packed in BOPP material, with the lowest Chl_a and TCh content in PA/PE material and Chl_b content in PLA material. Different from chlorophylls, total carotenoids (TCa) were best preserved in nettle leaves packed in LDPE and PLA packaging materials.

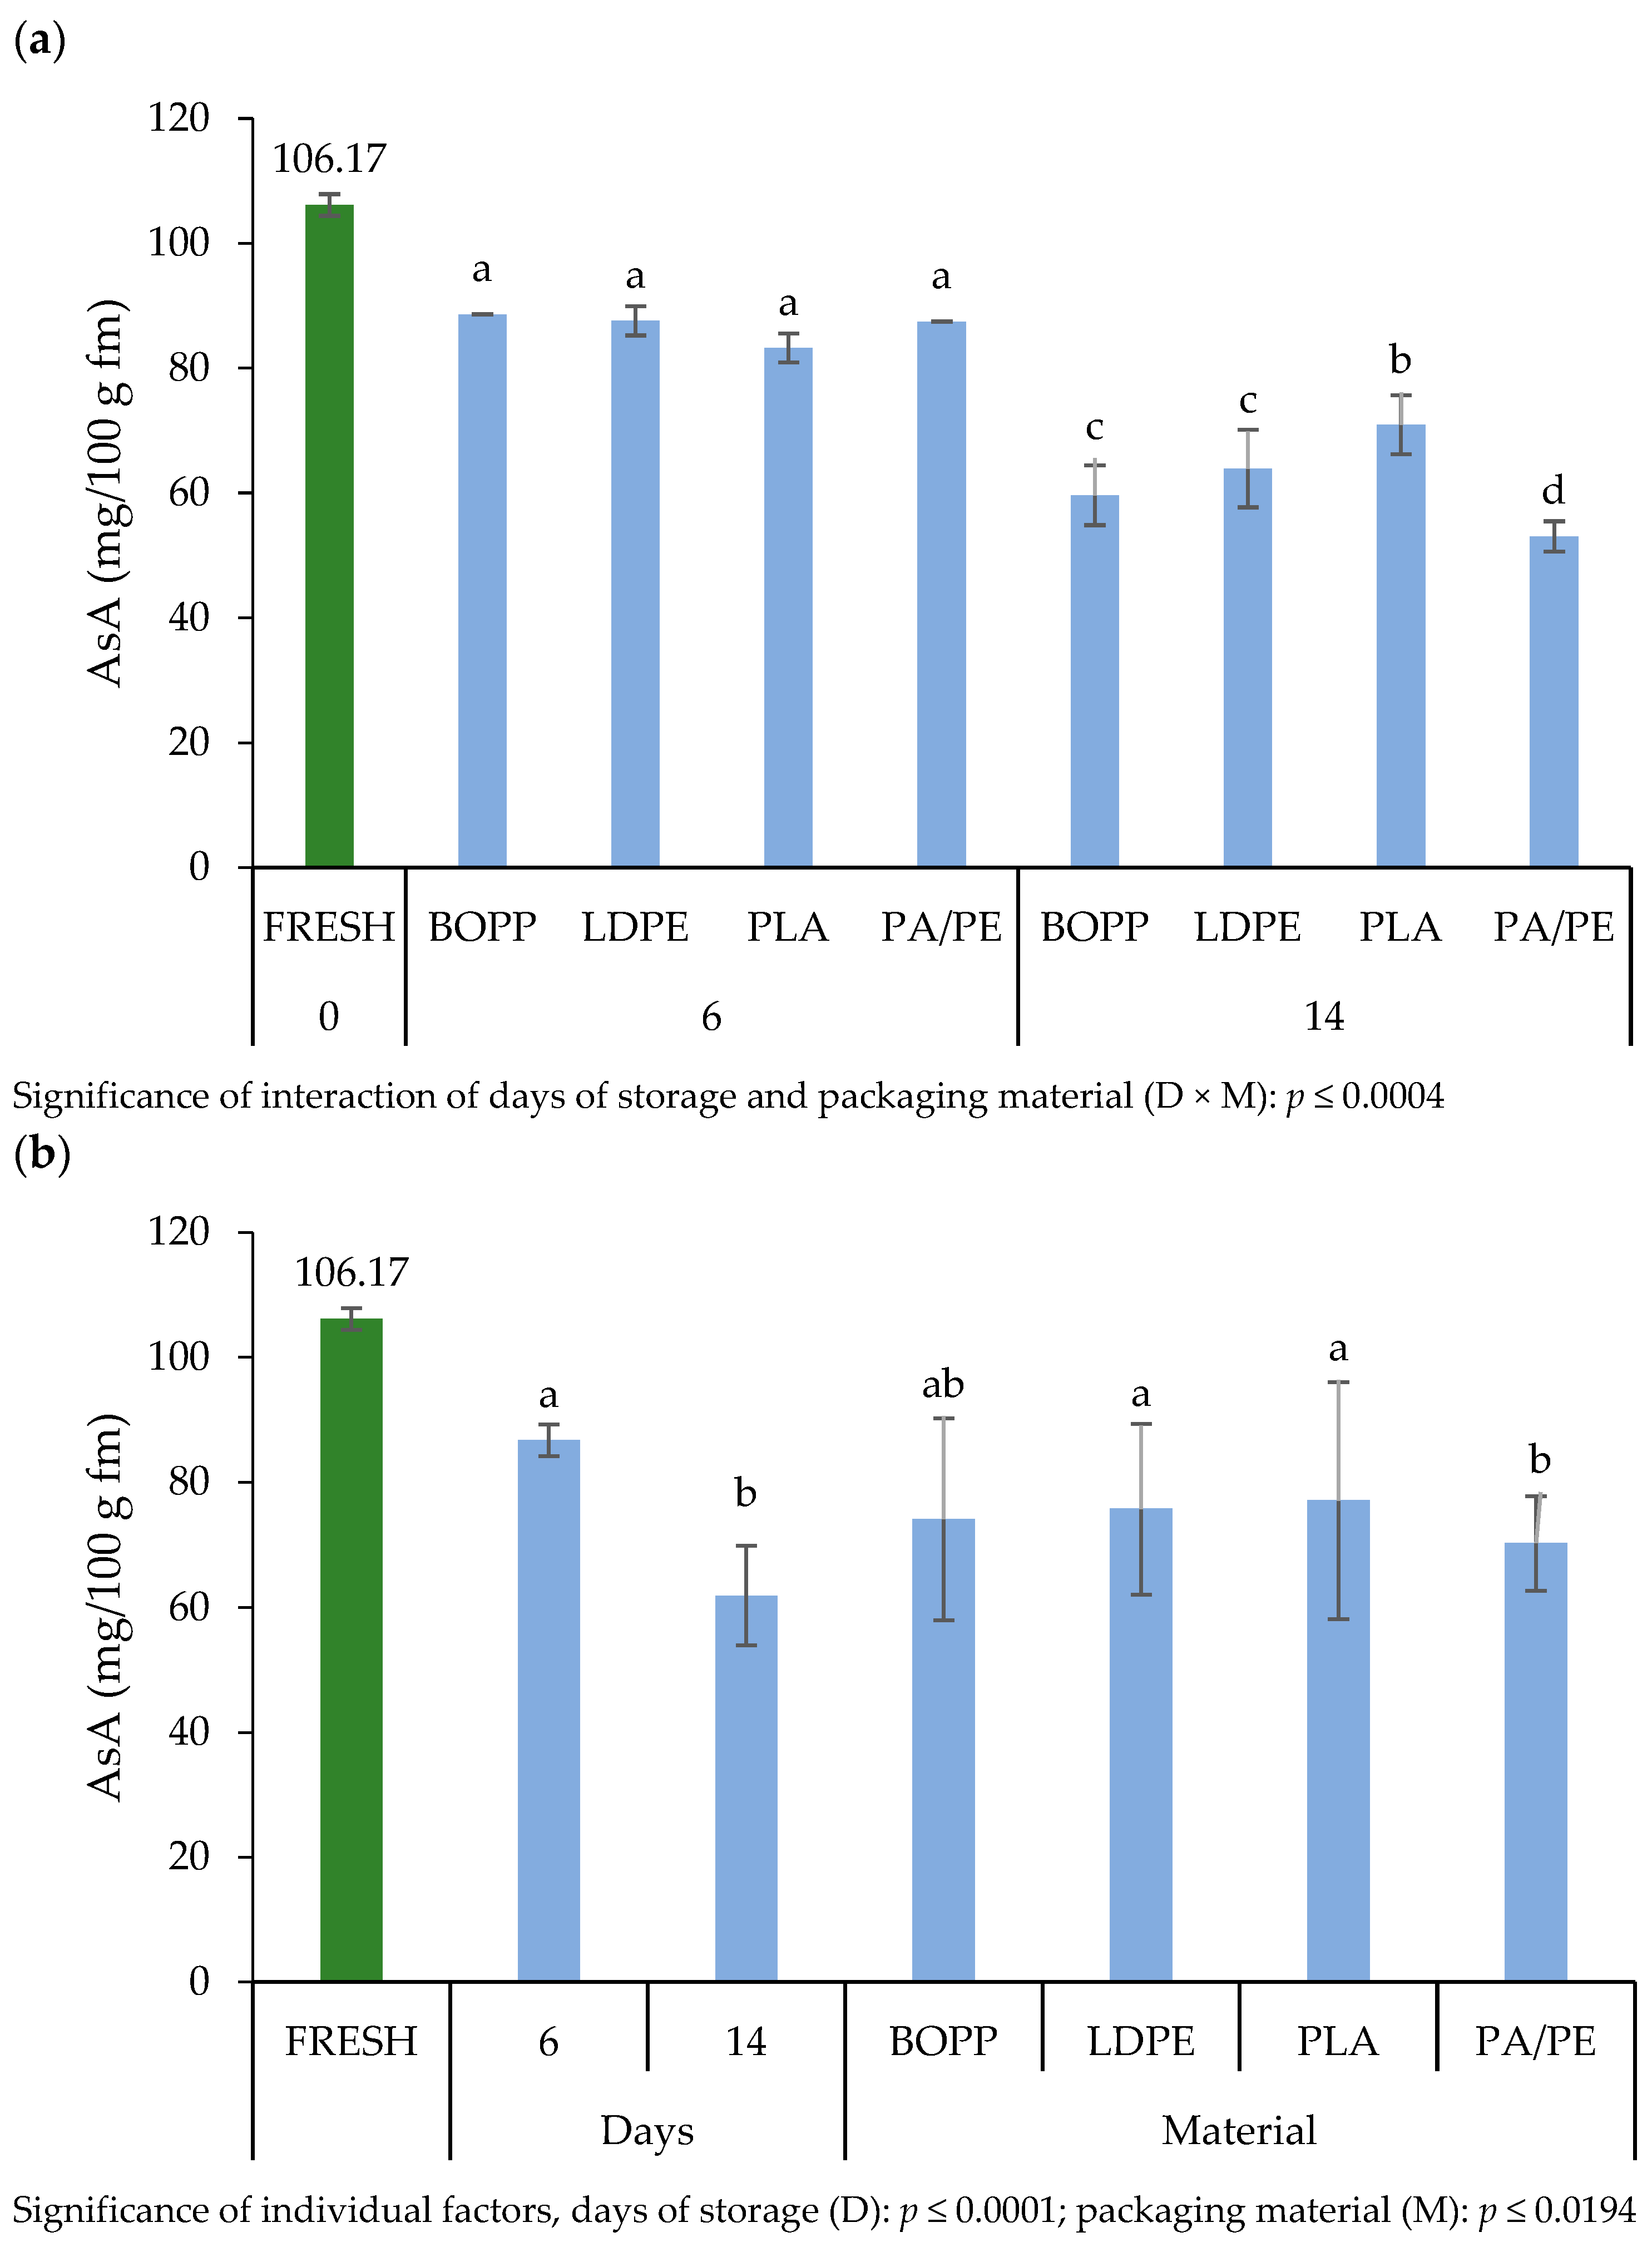
3.4.4. Ascorbic Acid

The results of ascorbic acid (AsA) content in fresh nettle leaves packed in different packaging materials and stored for a total of 14 days are shown in Figure 6a,b. Statistical analysis showed that the interaction of the different factors, storage duration, and packaging material (D × M) significantly influenced the AsA content (p ≤ 0.0004). During the 6-day storage, the AsA content in the nettle leaves did not differ, with an average content of 86.74 mg/100 g fm considering the combined factors (Figure 6a). Significant changes in AsA content in the nettle leaves were observed after 14 days of storage, depending on the packaging material, with the highest value (70.95 mg/100 g fm) measured in nettle leaves packaged in PLA material and the lowest value (53.05 mg/100 g fm) in leaves packaged in PA/PE material. Looking at the results of the significance of the influence of the individual factors (Figure 6b), the packaging material (M), and days of storage (D), it can be clearly seen that days of storage had a stronger influence on the AsA content (p ≤ 0.0004) than the factor M (p ≤ 0.0194).

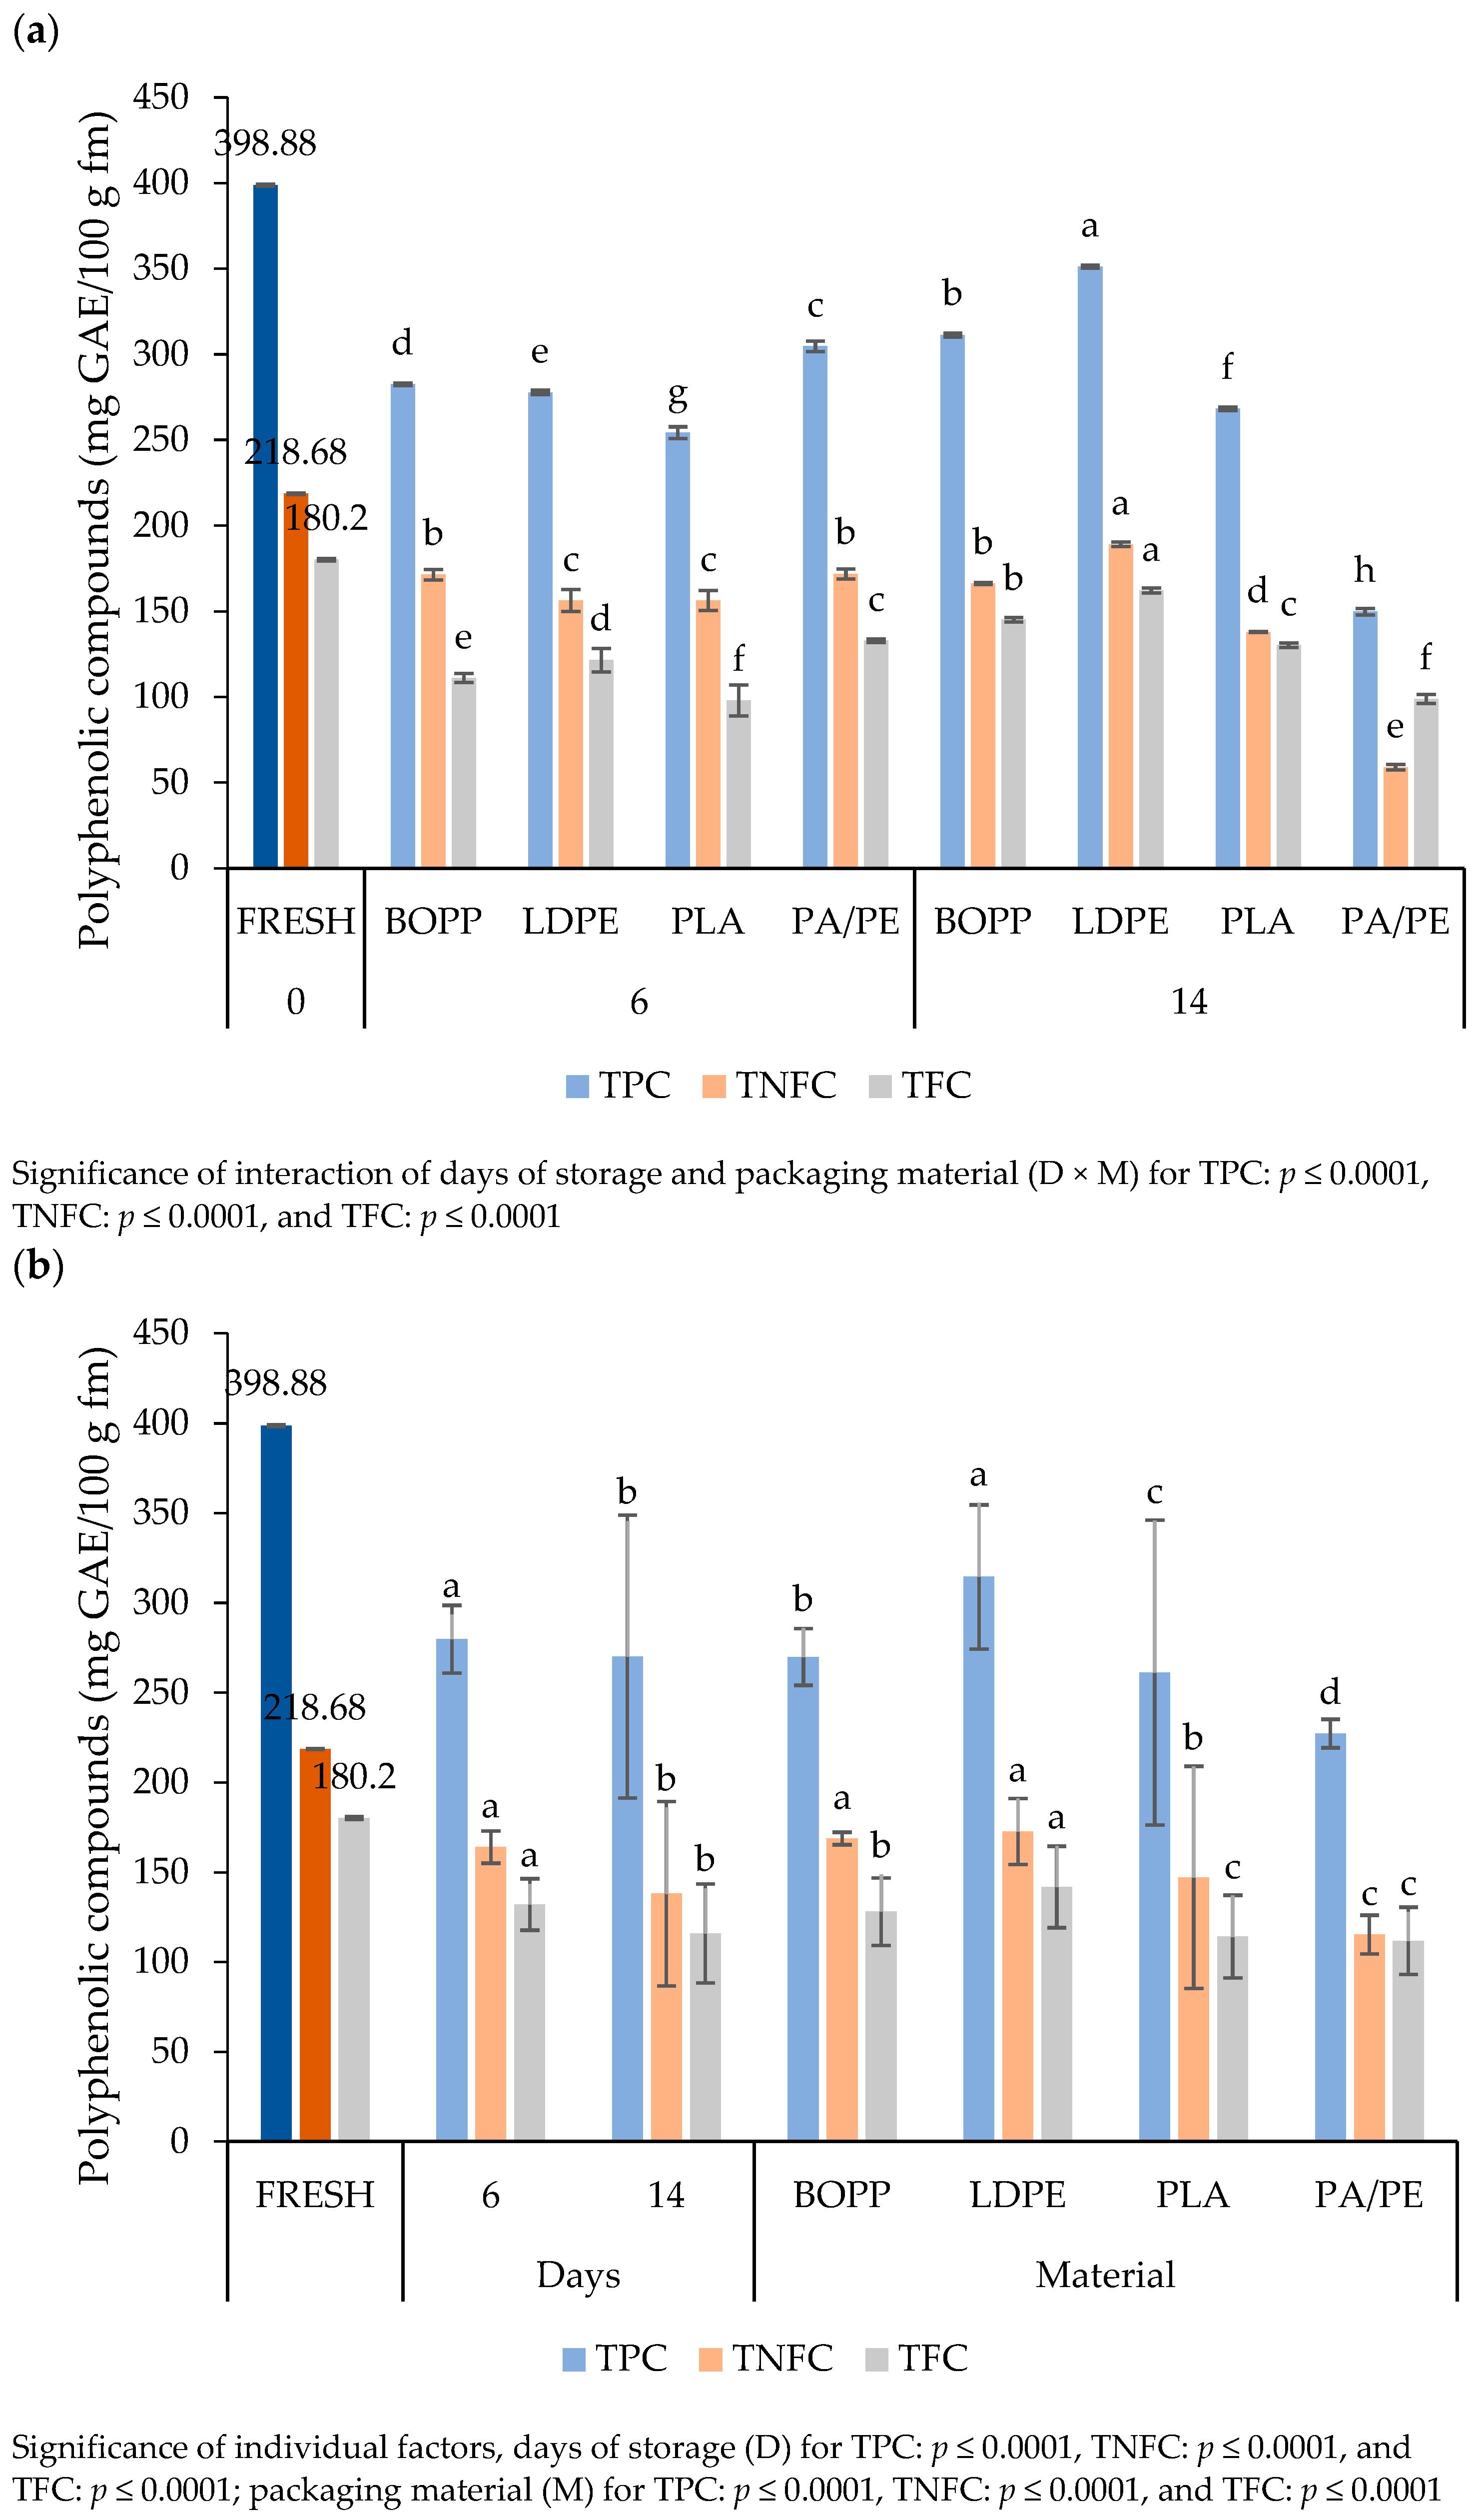
3.4.5. Phenolic Compounds

The total polyphenolic content of nettle leaves packed in different packaging materials and stored for 14 days is presented in Figure 7. In fresh nettle leaves, the TPC content was 398.88 mg GAE/100 g fm, the TNFC content was 218.68 mg GAE/100 g fm, and the TFC content was 180.2 mg CTH/100 g fm, which are significantly higher values compared to the content of polyphenolic compounds determined in the packaged leaves during the 6- and 14-day storage periods. All tested factors, days of storage (D), packaging material (M), and their interaction (D × M) significantly affected the content of all analyzed polyphenolic compounds (p ≤ 0.0001). The highest TPC content was found in nettle leaves packaged in LDPE after 14 days of storage, and the lowest TPC value was found in nettle leaves packaged in PA/PE, also after 14 days of storage. The same trend was observed for TNFC and TFC content, with the highest values in nettle leaves packaged in LDPE and the lowest in leaves packaged in PA/PE, both after 14 days of storage. While observing factors individually (Figure 7b), and regarding days of storage, all total polyphenolic compounds remained better preserved during the first 6 days of storage compared to the second storage period (14 days).
The composition of 14 selected individual phenolic compounds in nettle leaves packed in different packaging materials is presented in Table 4. The interaction of varied factors (D × M) significantly affected all analyzed individual polyphenolic compounds except quercetin-3-glucoside, and individual factors (D and M) also influenced all phenolic compounds, with the exception of ellagic acid, which was not influenced by storage duration (D). Caffeoylmalic acid was found to be the most dominant individual phenolic compound in all samples. The high content of chlorogenic acid was also observed. The content of caffeoylmalic acid in nettle leaves packed in different materials varied from 55.99 mg/100 g (PA/PE 14 days) to 258.70 mg/100 g (LDPE 6 days), while for chlorogenic, it varied from 33.92 mg/100 g (PA/PE 14 days) to 162.12 mg/100 g (LDPE 6 days). As can be seen, both compounds, caffeoylmalic acid and chlorogenic acid content, were the highest in samples packed in LDPE after 6 days, and the lowest in PA/PE after 14 days. When considering packaging material (M) as the individual variable tested, it can be seen that caffeoylmalic and chlorogenic acid content were the highest in nettle leaves packed in LDPE, while the lowest in PA/PE corresponds to the TPC content determined in nettle leaves. Significantly lower contents of gallic, protocatechuic, vanillic acids, kaempferol, naringin, quercetin, quercetin-3-glucoside, and rutin trihydrate were measured both in unpacked and packed samples, while some other compounds (p-hydroxibenyoic, coumaric, and ellagic acid) were found only in trace amounts.

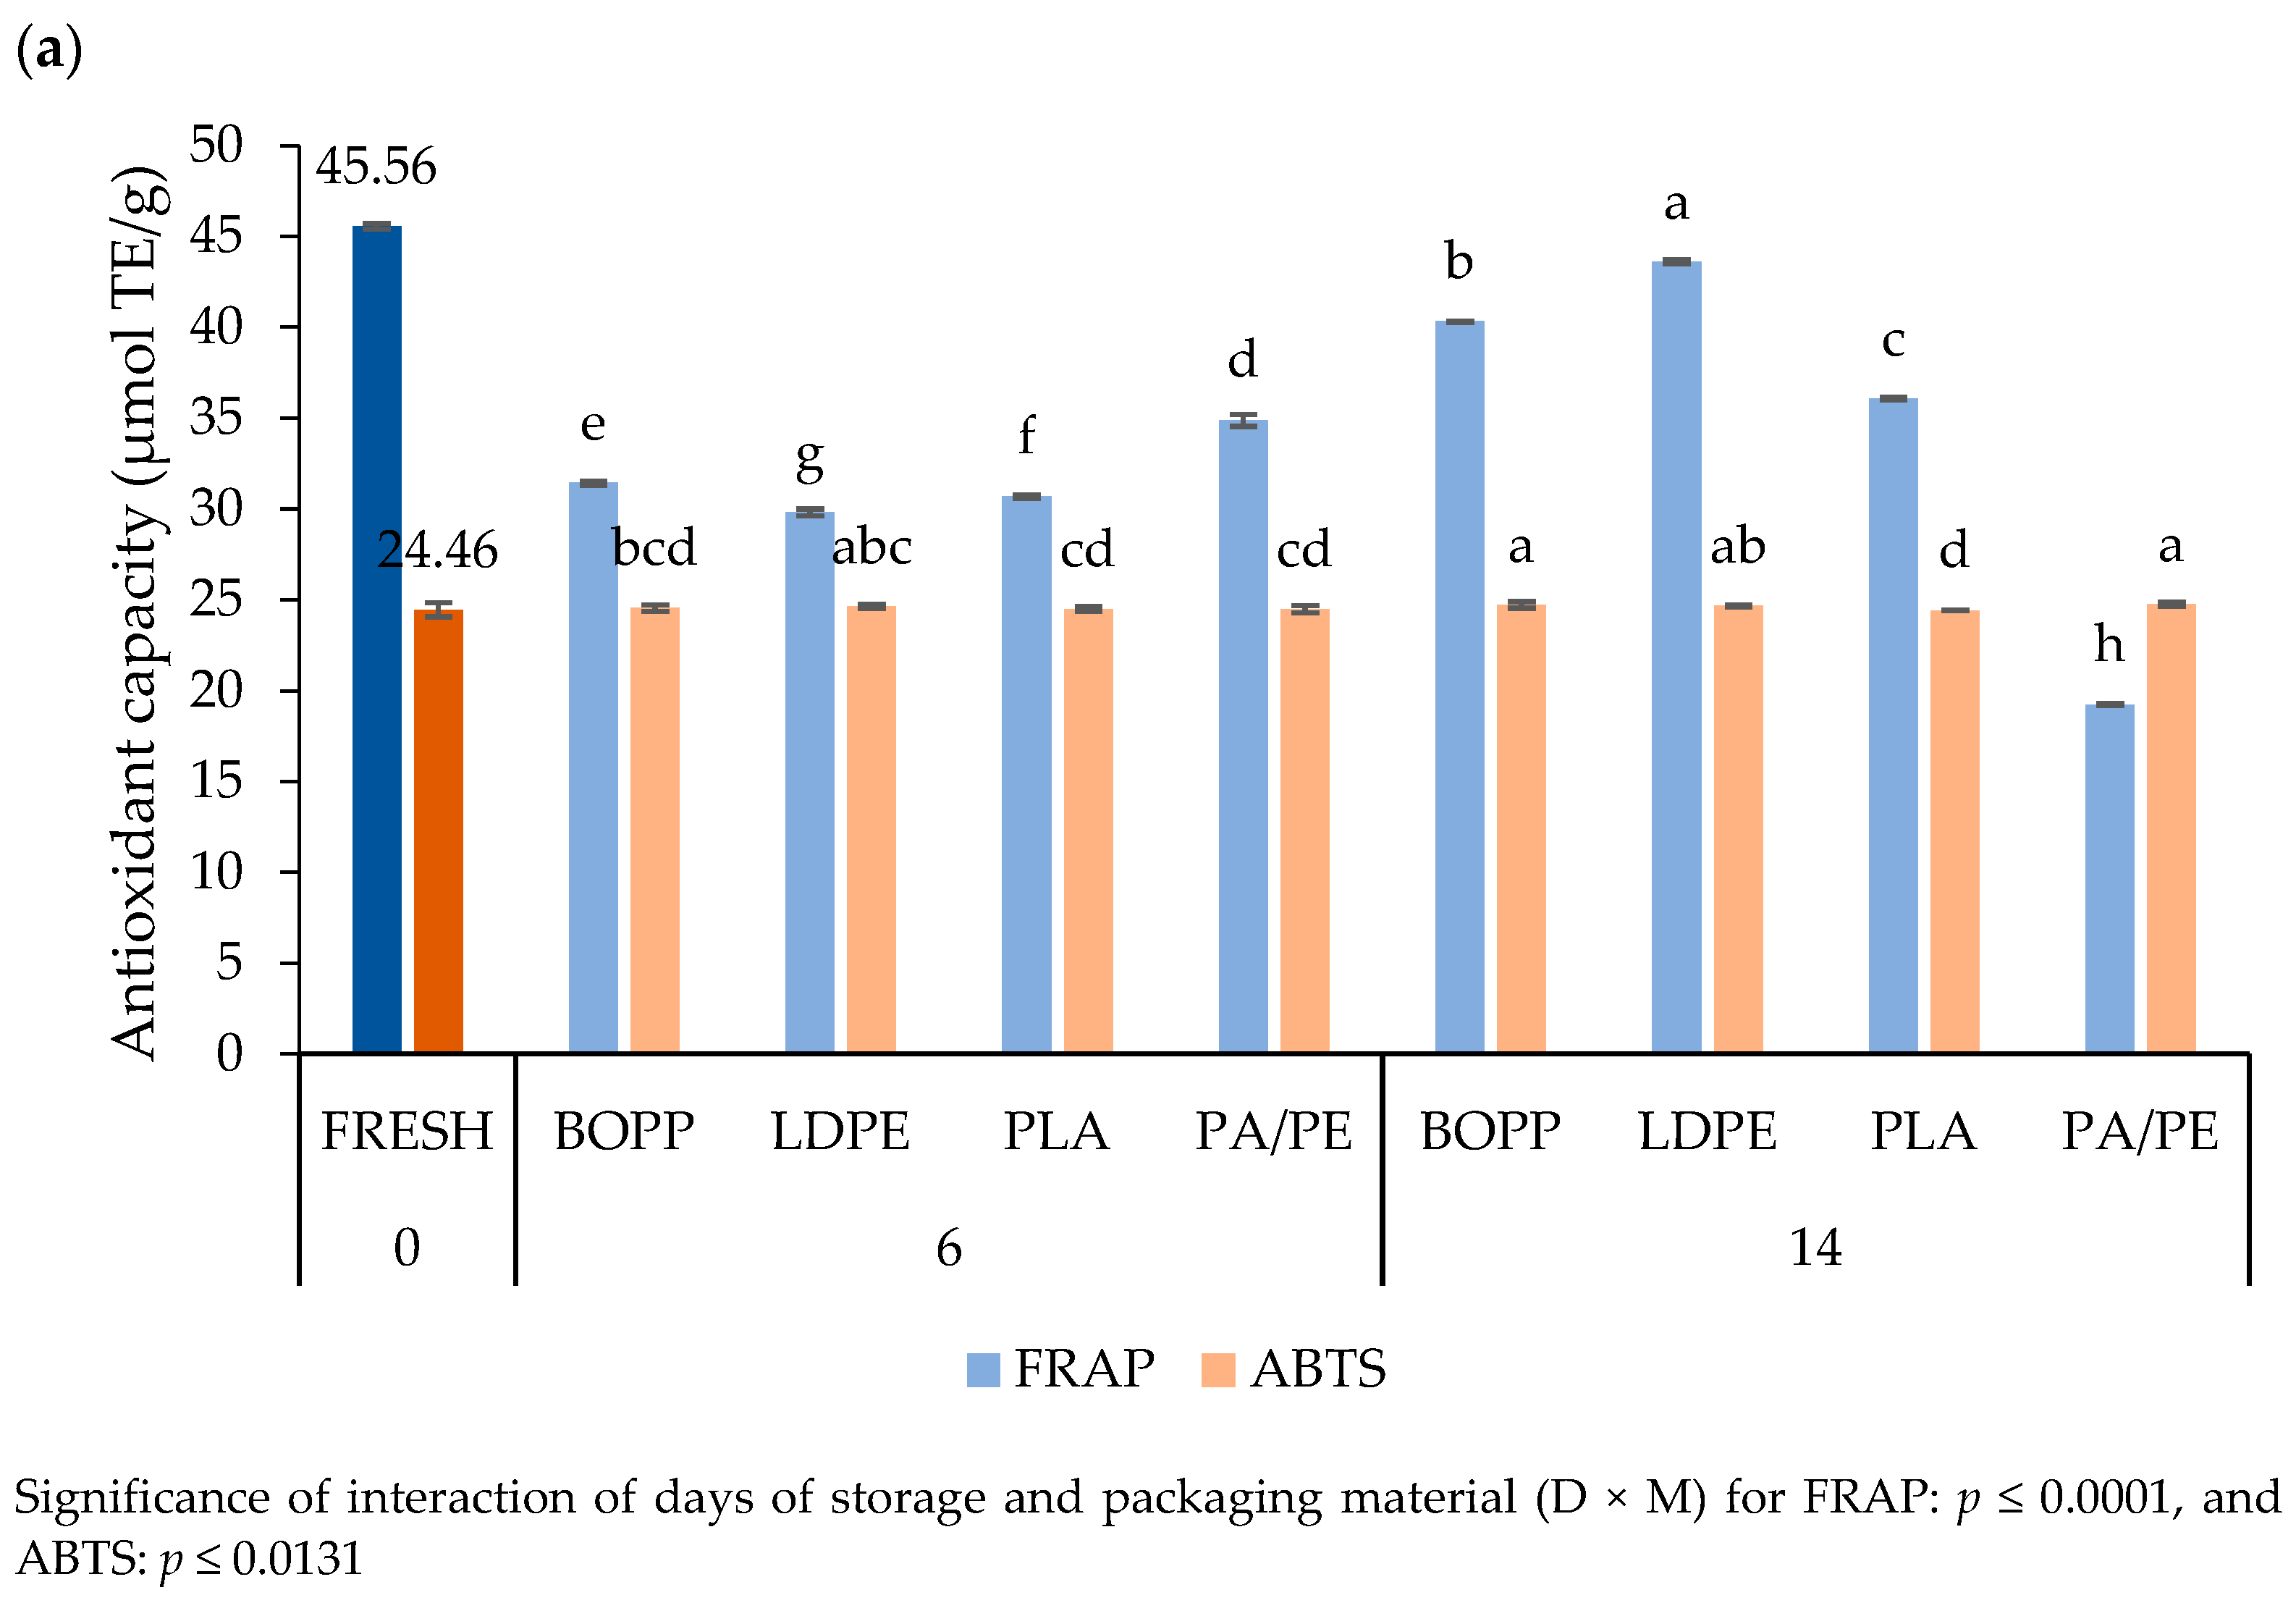
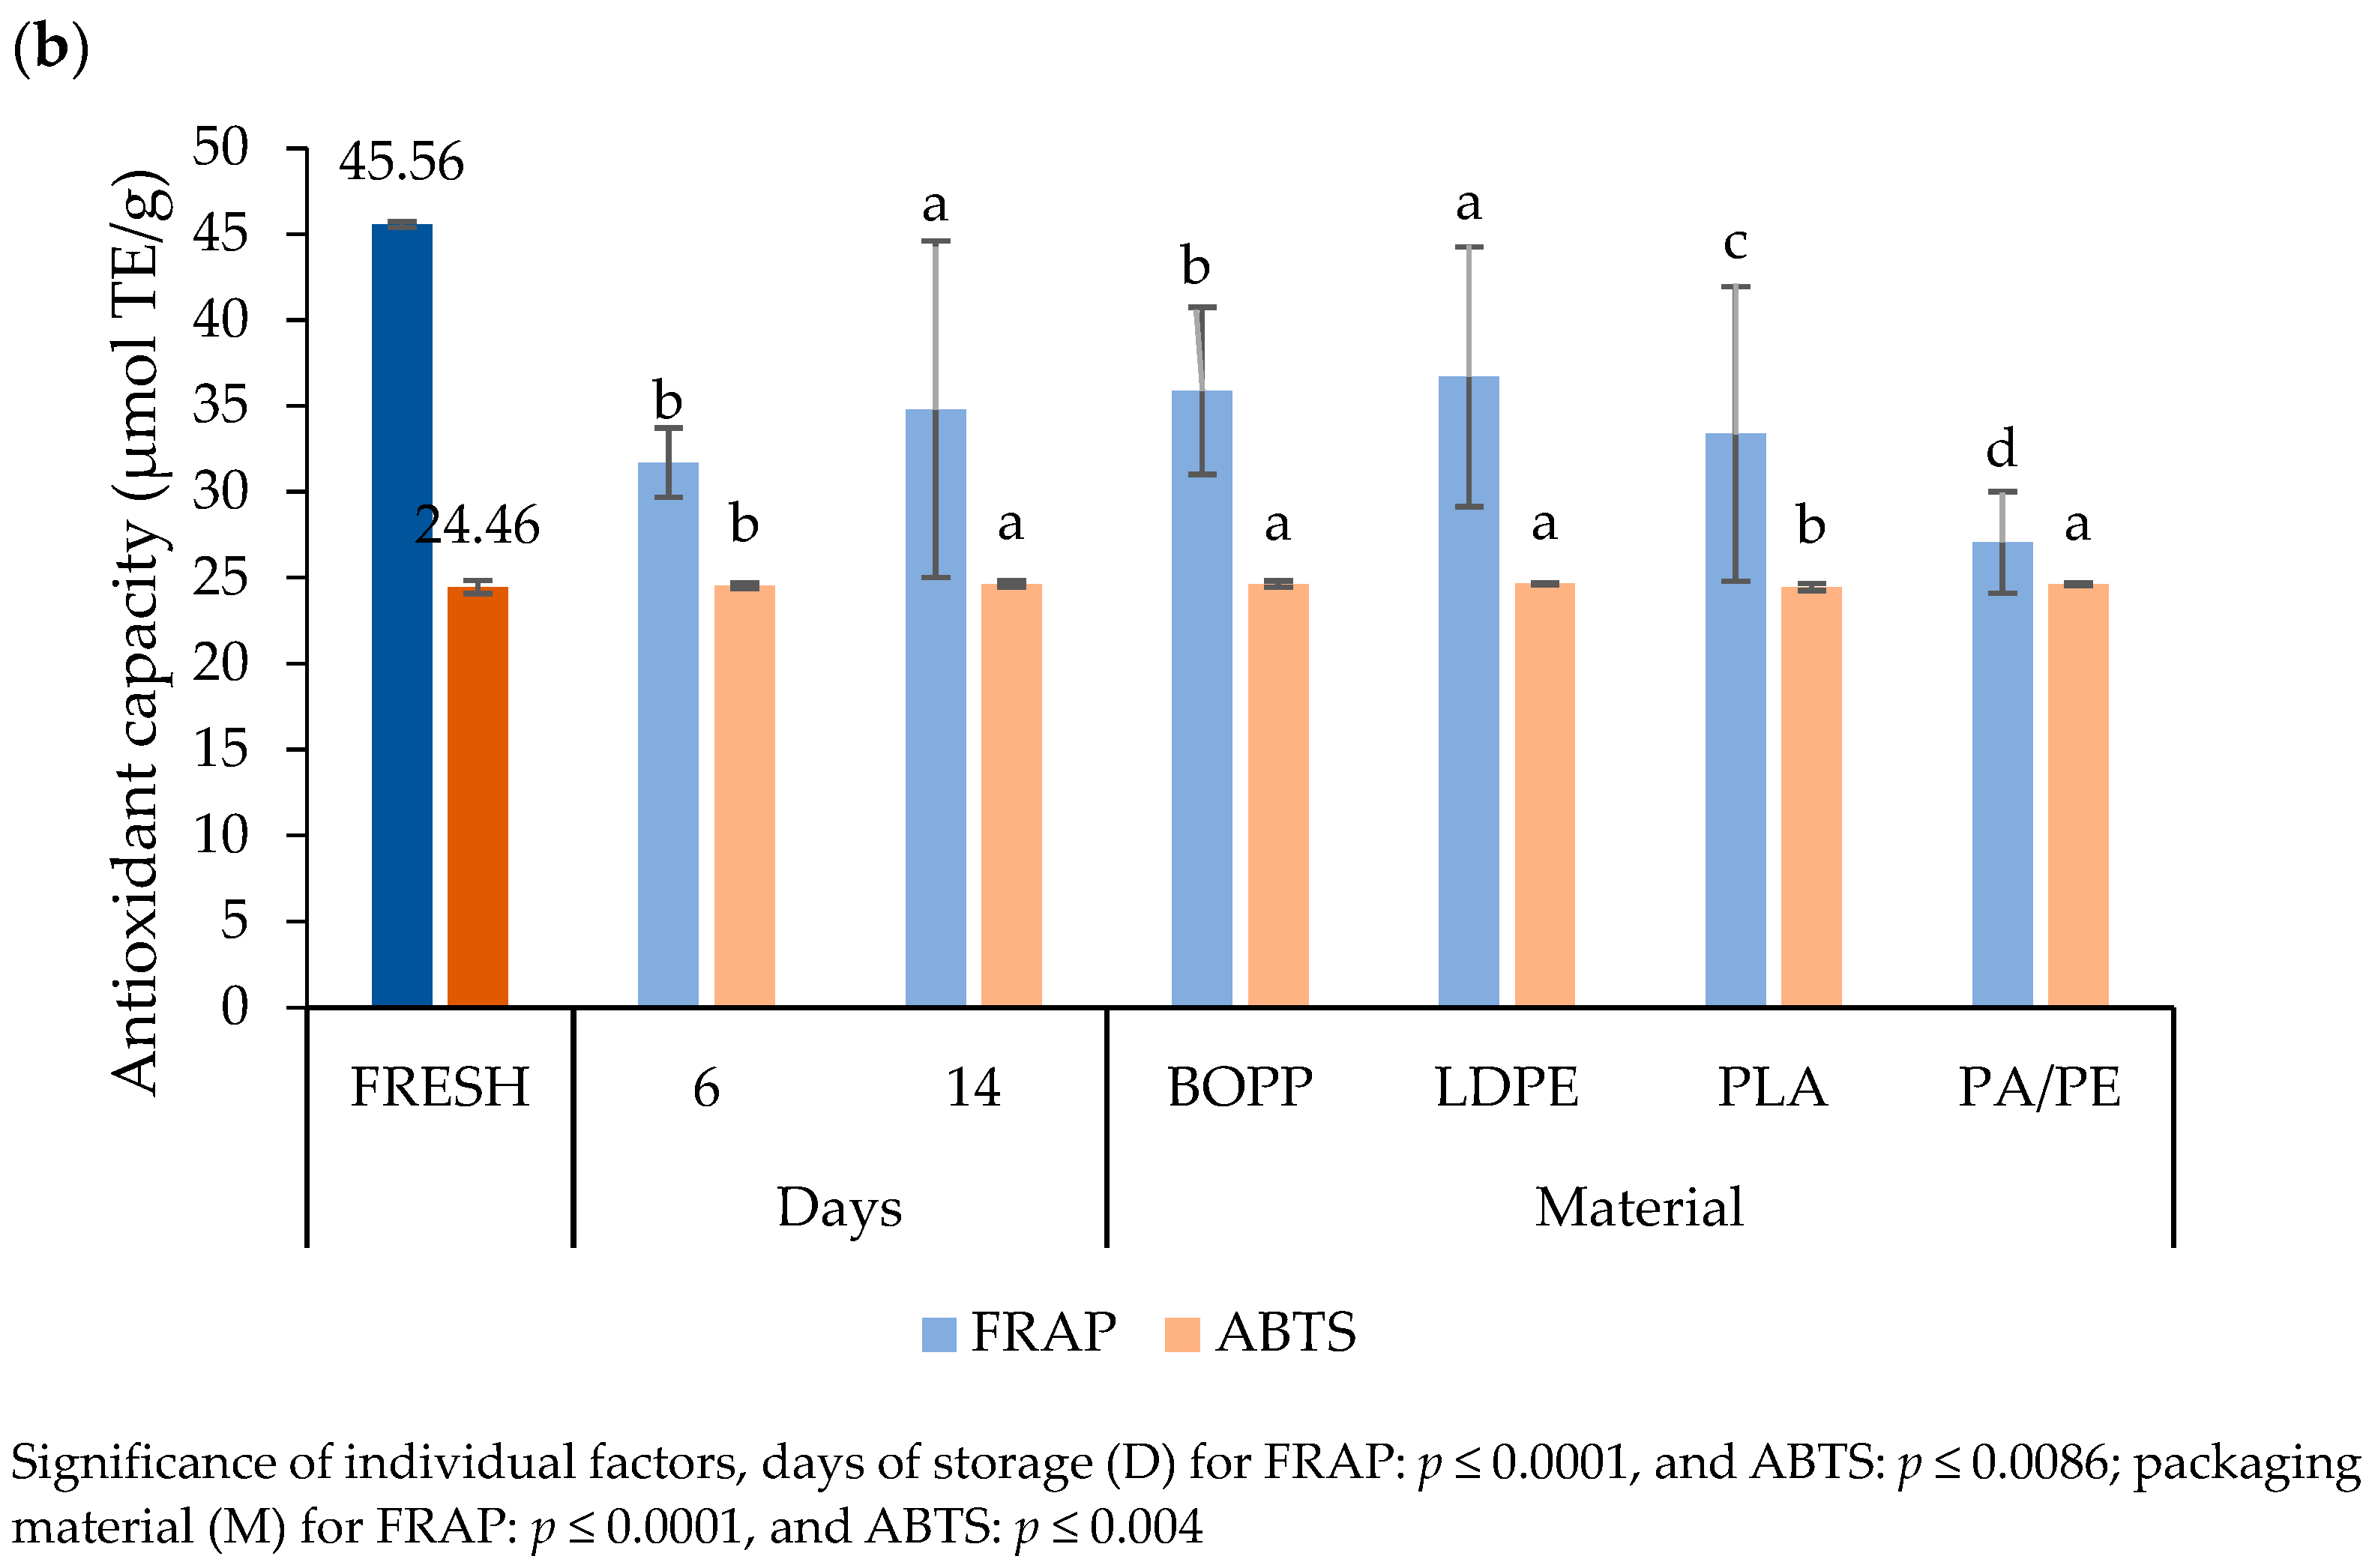
3.4.6. Antioxidant Capacity

The multifactorial ANOVA showed that the packaging material (M) and days of storage (D) individually and in combination (D × M) influenced the antioxidant capacity determined by two different methods. The highest antioxidant capacity, according to the FRAP assay, was recorded after 14 days of storage, in samples packed in LDPE material (Figure 8a), while also a high value of antioxidant capacity was recorded in nettle leaves packed in BOPP materials after 14 days. According to the results of the ABTS method, no statistical difference was observed between the nettle leaves packed in the LDPE material after 6 days and LDPE, BOPP, and PA/PE after 14 days, where the highest antioxidant capacity was found. In contrast to the results obtained with the FRAP assay, the lowest capacity observed with ABTS was in the sample PLA on day 14. The results also show that the highest antioxidant activity was observed after 14 days of storage when the storage period is taken into account (Figure 8b).

4. Discussion

4.1. Physicochemical and Barrier Properties of Used Packaging Materials

Table 2 shows the results of analyzing the packaging material’s properties (thickness, transparency, transmittance, permeability to water vapor, and water vapor transfer rate). According to T600 the most transparent material was LDPE, followed by BOPP, while the least transparent was PA/PE. Results are similar to what was previously given in LDPE (with T600 of 3.05 and transmittance of 86.9%), OPP (T600 of 1.67 and transmittance of 89.1%), and PLA (with a transmittance of 90%) [36,37]. According to Guzman-Puyol et al. [17], the acceptable limit of transparent packaging polymer materials is approximately 80%, and materials with transmittances above 90% are considered highly transparent. Therefore, only PA/PE used in this study can be considered as not well transparent. Good transparency is indeed a property of BOPP, LDPE, and PLA that are widely used in the packaging industry, contributing to the visibility of the packed content as an important factor [38,39]. The determination of transparency and transmittance is important, as they enable a visual inspection of the contents and an assessment of the freshness and appearance of the food. In addition, materials with extremely high transparency and transmittance that allow too much light to penetrate can accelerate the degradation of bioactive compounds due to light exposure; therefore, storage in dark conditions is recommended.
Measurements of the permeability of films to water vapor (WVP) and the rate of water vapor transfer through the films (WVTR) shown in Table 2 indicate that PLA material used in this study was less permeable to water than previously reported (approximately 1.8 · 10−11 [40] and 2.3 · 10−11 g m/s m2 Pa [41]. In general, the water vapor barrier performance of biodegradable polymers is much lower than that of some synthetics, such as LDPE, which is therefore suitable for the short-term protection of plant materials against water [42]. Water vapor permeability and transmission of packaging films are important parameters as they determine the rate of moisture exchange between the packaged food product and the surrounding environment. Too high-water permeability can lead to moisture and weight loss, and texture degradation of packed fresh fruits and vegetables. On the other hand, low-water permeability of the packaging material can lead to condensation of moisture on the inner surface of the film, which favors microbial growth, but it also helps maintain optimal moisture levels, preventing dehydration and wilting [42,43,44,45]. The water vapor permeability of polymer packaging materials is therefore important for maintaining the quality, freshness, and shelf life of packed vegetables. By carefully selecting materials with the appropriate permeability, it is possible to control moisture levels, reduce spoilage, and ensure the vegetables reach consumers in optimal condition. Low WVP is considered desirable for packaging leafy vegetables [46], therefore, it is important to test permeability to water vapor and choose proper packaging films for specific plant materials.
The results of the permeability coefficient (P) of tested materials to O2 (PO2) and CO2 (PCO2) shown in Figure 1 indicate large differences between tested materials. These differences in the gas permeability would influence the exchange of gases through the films used in MAP packaging and, therefore, the quality of oxidation-sensitive and respiring food products, as is the case with the nettle used in this study. From Figure 1, it is evident that the permeability coefficients were the highest for PLA and the lowest for PA/PE. PO2 values measured for PLA film (113.07 · 10−3 cm3/m d bar) were significantly higher than previously reported [41]. According to Ščetar et al. [47], PO2 for LDPE film (thickness 25 µm and measured at 25 °C) was 0.192 cm3/m d bar, and PCO2 was 1.04 cm3/m d bar. In this present research, the permeability of LDPE film to O2 was 0.042 cm3/m d bar, while for CO2 it was 0.039 cm3 /m d bar, which shows that the material used in this research was less permeable to the tested gases if compared to the abovementioned study [47], which can be explained by the greater thickness. The PO2 of BOPP in the present study was also lower than that by Verde et al. [48], probably due to the difference in thickness values. Too high gas permeability of packaging materials can increase respiration rate, lead to moisture loss, loss of flavor, and nutritional value, impacting the quality of packed fresh products [43,45,49]. Fruits and vegetables continue to respire after harvest, which leads to the accelerated senescence. Therefore, a reduced O2 and increased CO2 environment can slow down the respiration rate, delaying decay and nutrient loss while extending the shelf life of the product [50,51]. The permeability of packaging materials to gases is critical in managing the internal atmosphere around packed fruits and vegetables. Properly chosen packaging materials with suitable permeability characteristics can help in regulating the levels of O2 and CO2 inside the package, affecting respiration rates and the microbial growth of plant material [51,52].

4.2. Respiration of Nettle Leaves

Respiration in plant materials involves the consumption of O2 and the production of CO2 and water vapor. In general, respiration is increased in wounded plant tissues, implying alterations of the primary metabolism because of the increased energy demand for defense and repair mechanisms. The respiration continues to occur as long as there are stored carbohydrates (such as sugars and starches) available for breakdown within the tissues [51]. As this process continues even after harvest, it impacts the freshness and longevity of the product. A significant slowdown in O2 consumption and CO2 production in the present study occurred after 4.5 h, implying that most of the carbohydrates have been consumed and that the nettle’s metabolic processes have slowed down.
Measurements of respiration rates at two different temperatures (4 and 23 °C) show the influence of temperature on nettle leaf respiration. Generally, respiration rates tend to increase in the presence of higher temperatures, as these conditions promote increased metabolic activity in the plant cells [10,53]. Overall, the respiration rate was higher at the start of the experiment and gradually slowed down at both temperatures and became almost constant during the measurement period. The results are similar to those of other studies on different plants [54,55]. Changes in respiration rate might be because, immediately after being cut, nettle leaves exhibited an initial burst of respiration due to the stress response of the plant tissues caused by cutting.
The knowledge of RQ helps to select appropriate packaging materials when designing MAP systems [51]. Singh et al. [30] pointed out that the ratio of CO2 production and O2 consumption will be close to the value of 1, when carbohydrates are the substrate used in the metabolic process and when enough O2 is available, which justifies the results obtained in this research. Namely, nettle is a plant rich in carbohydrates [25], and from Figure 2c, it can be seen that after 22 h the RQ at 4 °C was 1.13, while at 23 °C it was 0.97.
An investigation of respiration rate is necessary for the selection of optimal packaging material for certain plant materials. Kader [56] classifies horticultural plant material according to respiration rates in six classes, from plants with very low to extremely high respiration rates. For example, according to Kader [56], respiration rate is high for lettuce leaf (20–40 mg CO2/kg h), very high for endive, kale, and watercress (40–60 mg CO2/kg h), and extremely high for parsley and spinach (>60 mg CO2/kg h) (measured at 5 °C). Considering other leafy vegetables, Akan [57] found that the respiration rate of spinach samples exhibited fluctuations throughout the storage period, from 33.65 mL CO2 kg–1 h–1 at the beginning, 40.03 mL CO2 kg–1 h–1 at 3 days, 44.68 mL CO2 kg–1 h–1 on the 6th day, and 15.94 mL CO2 kg–1 h–1 after 15 days. Sohail et al. [58] studied the senescence of six leafy green vegetables: pak choy, coriander, choy sum, spinach, parsley, and rocket, but to our knowledge, there is no published data about the respiration rate of fresh nettle leaves. According to the results obtained in the present study, it can be categorized as a plant with extremely high respiration rates.

4.3. Gas Composition during the Storage Period

The results of gas composition (Figure 3) show modifications in the initial atmosphere that developed in packages during the storage period. The changes in O2 were partly due to the leaves’ consumption during respiration and partly because of the material permeability. In PLA packages, the O2 content remained high during the entire storage period, probably due to the significantly higher permeability of PLA to O2 and thus the higher exchange rate between the external surroundings and the package. Therefore, it was to be expected that the respiration of these samples would be at a higher rate, and therefore the senescence of these samples, as it was shown later in nettle leaf properties results. The lower O2 content in BOPP than in LDPE during the entire storage period was measured. Analysis of the gas permeability of the material determined that BOPP was less permeable than LDPE, which affected the gas composition of the packaged nettle leaves. The O2 consumed by the plant could not have been replaced by new O2, because, due to the lower permeability of the BOPP, it diffused poorly through the material. The consumption of O2 in the PA/PE package was almost complete after 14 days of storage, as no external O2 could permeate over the storage period through the material as PA/PE was shown to have a significantly higher barrier to gases than other tested materials.
Due to the material properties and like results on O2 content, the CO2 accumulated in a larger amount in the BOPP than in the LDPE bags, i.e., due to the lower permeability, it could not diffuse out of the packaging, so it remained better preserved. As respiration of a packaged product implies consumption of available O2 and production of CO2, a gradient in concentration soon after packaging occurs, causing O2 to enter and CO2 to exit, which strongly depends on the material’s permeability. Finally, when the rates of O2 consumption and CO2 formation are equal to the diffusion rates of these two gases, an equilibrium gas concentration is created [59], which was, in the present research, partially achieved in BOPP, LDPE, and PLA packages.
The results of gas alteration match the measured gas permeability properties. The least permeable film (PA/PE) did not enable gas exchange with the outside environment, so the plant material consumed all the O2, and the CO2 produced by the plant through respiration accumulated in the packaging, since it could not escape due to the impermeability of the film. The conditions in the packages composed of the most permeable material (PLA) were expected, because, due to the high permeability, there was an exchange of gases with the external environment, i.e., the entry of O2 and the exit of CO2 from the packages, so there was no significant change in the composition of the gases compared to the initial one. Taking into account the previous research [11] on the packaging of other leafy vegetables and their favorable gas composition, it can be summarized that BOPP and LDPE have created favorable conditions for keeping fresh cut leaves (9.1–4.8% of O2 and 10.3–10.1% of CO2 within BOPP and 11.2–6% of O2 and 4.7–3.8% of CO2 within LDPE from day 6 to 14), while the values of gases in PA/PE and PLA were unbalanced for the optimal storage of this type of product.
Due to the packaging barrier properties and the respiration of the nettle leaves during storage in closed conditions, a passive modified atmosphere was developed by the natural metabolic activities of the plant material, which varied in intensity depending on the packaging material. These atmospheric alterations in packed leafy vegetables, such as spinach, lettuce, and mulberry leaf vegetables, were previously confirmed and highlighted the positive effect of the modified atmosphere on the preservation of fresh-cut vegetables [10,53,54,55,60]. For example, for baby spinach packages stored for 12 days at 4 °C, there was a rapid decrease in O2 after 3 days, with increased production of CO2 [10], and low O2 and high CO2 concentrations retarded the respiration rate of fresh cut romaine lettuce stored in PP films (2 °C, 15 days) [55]. Obtained results demonstrate that the respiration of plant material and the permeability of packaging film are closely connected, and selecting packaging materials with appropriate permeability helps create an optimal environment that slows down respiration and potentially delays spoilage and nutrient loss of fresh produce.

4.4. Characteristics of Fresh and Packed Nettle Leaves

4.4.1. Water Content of Nettle Leaves

In the chemical analysis of plant material, the first general quality indicator is the total dry matter content, as it comprises the composition of all chemical components of a raw material except water [61]. However, a particular challenge during storage, especially of green leafy vegetables, is the transpiration of the plant material, where there is a significant loss of water in the plant material, which ultimately affects the quality of the food, especially its sensory and textural properties, such as wilting, discoloration, loss of freshness, and the appearance. This is because leafy vegetables have a high surface-to-volume ratio and therefore a proportionally higher transpiration rate, i.e., water loss during storage, is greater in this raw material [62]. By selecting suitable packaging materials that are adapted to the properties of water vapor permeability and gases, the prolongation of the quality of such leafy vegetables can be significantly influenced [63,64].
While observing separate individual factors (Figure 4b), it can be seen that water content (W) remained equally well maintained in all packaging, with the exception of PLA, regardless of days of storage. The lowest W value in nettle leaves packaged in PLA material was to be expected, as this material has been shown to be the most permeable to water vapor (Table 2), which affects the W content of nettle leaves. Regardless of packaging material and considering days of storage, recorded data show higher W values during the first 6 days compared to the 14 days, which is also justified because plants lose moisture over time. However, it should be noted that despite the statistically justified difference, W loss did not decrease as much in the following days of storage (14 days in total), justifying the need to pack the leaves in order to minimize water loss and thus other important external characteristics of the product, which are particularly important from the consumer’s point of view. Although various factors significantly influenced the W in nettle leaves, the W in leaves from this study was consistent with the values of other leafy vegetables obtained by other authors, again proving the validity of the packaging [65,66,67].
Additionally, there are several studies on fresh nettle plant material, but information on packaged and stored nettle leaves has not been found. In a study by Biesiada et al. [68], the water content of fresh nettle averaged 71.66%, which was lower than in packed leaves from this present study. Rutto et al. [69] reported 89–75.1%, while Radman et al. reported [70] 80.3–73.7% of water content in fresh nettle leaves, which is in accordance with the results of the present study.
The W content of packaged leaves can significantly be influenced by the choice of packaging materials with varying permeability properties, but it also depends on storage conditions, especially air humidity. Materials with high permeability generally tend to evaporate water more intensively, leading to moisture exchange between the plant material and the environment [63,64], which was also confirmed by our results. If the outer environment is less humid than the inner packaging space, the plant material will lose water, as was the case with the nettle leaves packaged in PLA materials in this study. The high W content in nettle leaves packaged in BOPP, LDPE, and PA/PE indicates that the freshness and quality of the leaves packaged in these materials were well preserved. This is also consistent with the measurements of the WVP of the materials (Table 2), which show that the selection of the appropriate polymer packaging material is important for the preservation of the water content of fresh plant material.

4.4.2. Chromaticity Parameters

The leaf color was evaluated as the first key factor that consumers use to assess the quality of leafy vegetables (Table 3). According to the chromaticity parameters determined, the L* values were lower than 50, indicating a darker color, while the a* values had a negative sign in all samples, indicating a green coloration, which is generally characteristic of nettle leaves. Considering individual factors and days of storage, all chromaticity parameters were better maintained after 6 days of storage compared to 14 days. Regardless of days of storage, the specific color of nettle leaves was satisfactorily maintained in BOPP and LDPE with ∆E 2.11 and 1.74, respectively. In this study, nettle leaves packaged in material with the lowest permeability properties (PA/PE) had the least preserved color with the highest recorded color change depending on the fresh sample, which could be related to the content of photosynthetic pigments, with the lowest values of total chlorophyll determined precisely in nettle leaves packed in PA/PE. As PA/PE has a very low gas permeability, this resulted in a very high CO2 content and a low O2 content, indicating an unbalanced gas composition, which favored the degradation of the photosynthetic pigments and thus led to a pronounced negative color change. The color was also poorly retained in the most permeable material (PLA), probably due to the excessive O2 content. The ΔE parameter, which represents the color change, is crucial for the packaging and storage of fresh-cut leafy vegetables, which are generally susceptible to color changes and enzymatic browning [4,71]. A ΔE value above 3.5 indicates a significant color change, which may affect consumer perception and product marketability. Values below 1.0 are usually imperceptible, values between 1.0 and 2.0 are perceptible but often acceptable, while values between 2.0 and 3.0 are perceptible and may be acceptable depending on the plant material [72]. Uniform color is important to ensure the visual quality and freshness of the vegetables, which has a direct impact on consumer acceptance and satisfaction [71,73].

4.4.3. Photosynthetic Pigments

Photosynthetic pigments play a crucial role in the development of plants, but they are also considered important nutrients in the human diet with therapeutic properties [74]. In packaged products, the chlorophyll content might vary depending on the specific combination of gases, temperature, and other factors within the packaging. By limiting O2 levels, enzymatic processes are inhibited, including those that lead to chlorophyll degradation, while also oxidative processes can be slowed down, thereby maintaining chlorophyll and carotenoid content [75]. Since the degradation of photosynthetic pigments can be the result of oxidative processes in plant cells, CO2 can help to mitigate oxidation by scavenging reactive oxygen species (ROS), while increased CO2 levels reduce the degradation of pigments. More importantly, high atmospheric CO2 levels generally increase the photosynthetic rate of plants [76] and thus ensure the preservation of photosynthetic pigments. However, it should be emphasized that an extremely low level of O2 or a high level of CO2 can lead to side effects and increase the degradation of photosynthetic pigments. The effect of O2 and CO2 content inside the packages of the different types of packaging materials used in this study (Figure 5a,b) clearly indicates that the packaging material of lower gas permeability (PA/PE) with extremely high CO2 content and low O2 content favored the degradation of photosynthetic pigments, so that this type of packaging generally had the lowest content of all photosynthetic pigments analyzed, which is consistent with other literature data [2,77]. On the other hand, the highest content of photosynthetic pigments was found in nettle leaves packed in BOPP material during both 6 and 14 days of storage (Figure 5a). When monitoring the gas composition during the storage period, the lowest O2 content and higher CO2 content than in LDPE and PLA were found in the mentioned package, which was obviously a suitable level for the preservation of the content of photosynthetic pigments, and at the same time, it explains the crucial role of the proportion of atmospheric gases during the storage period in certain packaging materials. Mampholo et al. [77] concluded that the low level of O2 in packaged Chinese cabbage played a major role in maintaining the chlorophyll and carotenoid content, which correlates with our data.
While observing days of storage as individual factors (Figure 5b), photosynthetic pigments were best preserved after 6 days of storage, whereby 89% of TChl and 84% of TCa remained preserved compared to fresh nettle leaves. During the subsequent storage period, i.e., over a total period of 14 days, the degradation of the photosynthetic pigments continued, with the content of TCh decreasing by approx. 28% and TCa by approx. 11% compared to the samples stored for 6 days, regardless of the packaging material (Figure 5b). Chlorophyll degradation is a natural process influenced by various internal and external factors that occur in plant green organs, particularly during senescence [78], and the degradation of photosynthetic pigments during time was also recorded for other leafy vegetables [57,79]. It was therefore expected that the pigment content in leaves packed in different packaging materials would be degraded over time as a result of the plants’ natural senescence process.

4.4.4. Ascorbic Acid

Ascorbic acid is one of the most powerful antioxidant agents with high functional potential [80], so its preservation in fresh-cut vegetables is of great importance. In addition, when analyzing certain key factors in the storage of fresh leafy vegetables, the AsA content is used as one of the most important indicators for maintaining the nutritional quality of the food [81].
AsA is an unstable chemical compound as it reacts to various environmental, processing, and storage factors, whereby its content can be significantly degraded by light, aerobic conditions (oxygen), high temperatures, a longer storage period, etc. [82]. Oxygen is a primary factor in the degradation of AsA, as it promotes oxidative reactions, leading to the AsA degradation. Reducing the O2 content in the packaging can significantly slow down the rate of AsA degradation, and this trend is confirmed by several studies on other leafy vegetables [53,54,60]. However, our results on AsA content in nettle leaves after the entire storage period are not consistent with these findings, as the AsA content was equally well preserved in nettle samples packed in different packaging materials tested after 6 days of storage. On the contrary, after 14 days of storage, the highest AsA content was determined in the nettle leaves packed in PLA, in which the highest O2 content (20.3%) and the lowest CO2 content (1.75%) were noted (Figure 3a,b), while the lowest AsA content was determined in the nettle leaves packed in PA/PE material, in which the lowest O2 content (0.1%) and the highest CO2 content (19.50%) were found. These results therefore do not agree with the statement that O2 is one of the limiting factors for the preservation of AsA during the storage period. One of the reasons for this discrepancy between the results of this study and those of other studies could lie in the fundamental stability of AsA, its initial concentration in the plant materials, and other environmental factors, especially temperature, light, etc. Ascorbic acid shows considerable instability in aqueous solutions, which is crucial for its initial concentration and the pH of the solution plays a crucial role [83]. If the plant material contains a higher concentration of AsA at the beginning, the degradation during the storage period is not as pronounced as if the concentration of AsA is low at the beginning of the storage period [84]. However, some studies have also shown that excessive concentrations of AsA can increase the autoxidation process with the formation of dehydroascorbic acid anions, which mainly depend on the pH of the solution, while ascorbic acid generally shows better stability under acidic conditions than under alkaline conditions [83]. Another possible reason for the discrepancy in the results could also be the role of CO2. In this case, too high CO2 content could have the opposite effect or increase the degradation of AsA. From all this, it can be concluded that there are several key elements that could have caused the explanatory inconsistency in the results, from nettle leaves having unique physiological responses to O2 levels compared to other leafy vegetables studied, to the interaction between the concentrations of O2 and CO2, which could play a complex role in the preservation of AsA that is not yet fully understood. Ditto, the results suggest that O2 may not be the only limiting factor for the preservation of AsA in nettle leaves during storage.
Specifically, considering the isolated factor days of storage (D) in this study (Figure 6b), the AsA content decreased by approximately 40% from the 6th to the 14th day of storage, and significant changes can also be observed between the AsA content of fresh nettle leaves and the AsA content in leaves stored for 6 and 14 days. The AsA content fell by approximately 22% in the first 6 days of storage and by as much as 72% after 14 days of storage compared to fresh plant material, which was to be expected due to the high sensitivity of AsA and was confirmed by studies on other leafy vegetables [85,86]. Therefore, to maintain the AsA content during the storage period, it is important to optimize several key factors, starting from the selection of the appropriate packaging material, the specific properties in terms of permeability to gases, water vapor, thickness, etc., to the optimization of temperature and relative humidity during storage and the reduction of exposure to a direct light source.

4.4.5. Phenolic Compounds

Polyphenolic compounds are specialized metabolites in plants that possess high antioxidant properties and contribute to the color, flavor, and nutritional value of vegetables [87]. The efficiency of utilization of packaging materials on the preservation of total polyphenolics (total polyphenolics, TPC; total flavonoids, TFC; and total nonflavonoids, TNFC) (Figure 7) and individual phenolic compounds (Table 4) during the storage period was also observed within this study. When considering the individual variables tested (Figure 7b), the packaging material (M) had a significant effect on the TPC, TNFC, and TFC content in nettle leaves (p ≤ 0.0001), with the highest values recorded in leaves packaged in LDPE (and for TNFC content in BOPP as well) and the lowest TPC, TNFC, and TFC contents in leaves packaged in PA/PE, and for TFC content also in PLA. Similar results were found in a study conducted by Kaur et al. 2011 [88], where fresh-cut spinach packed in LDPE had a higher phenolic content than the one packed in PP.
Studies have shown that exposure of plants to high CO2 levels can increase the production of secondary metabolites and antioxidants [76,89], as plants can utilize the carbon resources from the available CO2 surplus for the synthesis of secondary metabolites such as phenolic compounds and flavonoids. For example, under elevated CO2 levels, lettuce showed a significant increase in total phenolics [89], which is consistent with the present data. Samples packed in LDPE and BOPP with a slightly elevated CO2 content, had the highest total phenolic levels, compared to the PLA packages with a lower CO2 content. However, if we take into account the CO2 content depending on the type of packaging material during the storage period, then we can still see some deviations in the results of this study from the influence of CO2 already established, namely the fact that a higher CO2 content utilizes the synthesis of polyphenols. For example, the lowest content of polyphenolic compounds was found in PA/PE packaging, although packages had the highest CO2 content. A possible explanation for this discrepancy could be related to the creation of the internal microenvironment. Therefore, this could have an impact on the metabolic processes in the nettle leaves, as too high CO2 content can cause side effects and specific stress reactions in the plant material, leading to degradation or inhibition of the synthesis of polyphenolic compounds [80,90]. These results emphasize the complex relationship between CO2 levels, plant stress responses, and the synthesis of polyphenolic compounds, making the management of the internal atmosphere of the packaging crucial for maintaining the nutritional quality of leafy vegetables during storage.
When considering the duration of storage (D) as an individual factor influencing the content of polyphenolic compounds in nettle leaves, higher levels of TPC, TNFC, and TFC were found after 6 days of storage than after 14 days, regardless of the packaging material. The TPC content was approximately 4% higher after 6 days than after 14 days, the TNFC content was approximately 19% higher, and the TFC content was approximately 14% higher. When looking at the polyphenol content in fresh nettle leaves compared to samples stored for 6 and 14 days, a significant decrease in TPC, TNFC, and TFC content was observed. Thus, the TPC content in fresh nettle leaves was approximately 43% higher compared to 6-day storage and approximately 48% higher compared to 14-day storage. The degradation of total phenols over time during prolonged storage is inevitably due to enzymatic and nonenzymatic activities, and this phenomenon is clearly noticeable in leafy vegetables. Over time, oxidative enzymes such as polyphenol oxidase (PPO) and peroxidase (POD) become more active, leading to the degradation of phenolic compounds [91]. In addition, leafy vegetables, including nettle leaves, continue their respiration process after harvest, consuming O2 and producing CO2 and water in the packaging, while higher respiration rates can lead to the degradation of phenolic compounds as the plant tissue uses these compounds for its metabolic needs during storage [90]. One of the limiting factors during the storage period for the phenolic compounds can also be the transpiration rate, which leads to a loss of water in the plant material, causing the degradation of the cells and resulting in the loss of the phenolic compounds [92,93].
Phenolics are a diverse group of bioactive compounds, susceptible to different environmental conditions, so storage and packaging conditions can affect the distribution of individual phenolic compounds differently. Several studies have investigated the phenolic profile of stinging nettle leaves, but since there is no research on nettle packaging, there is also no data on the influence of different packaging materials and the composition of gases during storage on the content of individual phenols in nettle leaves. The phenolic profile of nettle leaves determined in this study by analyzing fresh, unpackaged leaves corresponds with previous research [25,26,27,94,95,96]. Caffeoylmalic acid has already been established as the most dominant phenolic compound, followed by chlorogenic acid [95,96], and the same findings were obtained in the present research both in fresh leaves and packed leaves during the storage period.
The highest content of caffeoylmalic and chlorogenic acid was determined in nettle leaves packed in LDPE after 6 days and the lowest in PA/PE after 14 days of storage, the same as measured for total polyphenolic compounds. LDPE and BOPP used in this study had similar gas permeability, with relatively similar O2 and CO2 content during the storage period. During storage, the atmospheric conditions within those packages remained moderate with a gas composition that is desirable for the packaging of leafy vegetables [11], which consequently positively affected the final content of phenolic compounds. Specifically, the gas composition created in LDPE packages had a good impact on the preservation of caffeoylmalic and chlorogenic acid in nettle leaves during storage, while the gas ratios in PA/PE packages were too extreme due to excessive O2 and CO2 levels. The results of the research show that the type of packaging material and the length of storage also have a strong effect on other individual phenolic compounds, which were found in significantly lower amounts, with the potential to significantly slow down their deterioration.

4.4.6. Antioxidant Capacity

The bioactive compounds analyzed in this work are known for their strong antioxidant properties that are beneficial both for plants and human organisms. As shown in Figure 8, the highest antioxidant capacity measured by FRAP was in leaves that were packed in LDPE after 14 days of storage. It is well mentioned that samples packed in BOPP also had a strong antioxidant capacity. Similar results were shown for the preservation of photosynthetic pigments, total phenolic compounds, and AsA (Section 4.4.3, Section 4.4.4 and Section 4.4.5), so this correlation indicates that they were indeed responsible for the strong antioxidant capacity. The positive correlation between the content of polyphenolic compounds as strong antioxidants and their antioxidant potential is confirmed by numerous studies [97,98,99].
The retention of antioxidant compounds in nettle leaves was due to the reduced levels of O2 and the increased levels of CO2 in LDPE and BOPP. These observations are similar to other examples in the scientific literature, where authors showed that the antioxidant capacity of lettuce was the highest under high CO2, [89] and of baby spinach in the atmosphere with reduced O2 and increased CO2 as well [10]. The lowest antioxidant capacity measured by FRAP was after 14 days in PA/PE. Oxygen exposure can cause the oxidation of molecules characterized by a strong antioxidant potential, while, in contrast, lower levels of O2 can reduce oxidative stress and attenuate the production of ROS (reactive oxygen species) while maintaining the antioxidant status of plant tissues [100]. Some common packaging materials, especially BOPP and LDPE, can provide effective barrier and permeability properties, ensuring a decrease in O2 content and thus helping to maintain antioxidant levels, as suggested by our results obtained by FRAP. Elevated CO2 can stimulate the production of certain antioxidants in plants as it acts as a signaling molecule, triggering the expression of genes involved in antioxidant defense mechanisms [101], which may be the reason for the higher antioxidant capacity of nettle leaves packed in LDPE and BOPP measured by the FRAP method. The results of antioxidant capacity measured by ABTS and FRAP showed some differences. These deviations can be explained by the fact that the FRAP assay is more sensitive to compounds of hydrophilic nature, which were in the majority in this study, especially polyphenols, while the ABTS method detects molecules of lipophilic nature in addition to hydrophilic ones, which were not strongly presented in nettle leaves.

5. Conclusions

The results of the analyses of the packaging materials showed that the composition of the gases in the packages was created as a result of the strong respiration of the nettle leaves and the permeability properties of used materials which strongly influenced the preservation of the antioxidant compounds in packed nettle leaves. LDPE and BOPP were shown as the most suitable materials for the preservation of antioxidant compounds in nettle leaves. The highest content of total polyphenolics, with caffeoylmalic acid as the most dominant individual phenolic compound, as well as the highest antioxidant capacity, were observed in samples packed in LDPE, ensuring the preservation of even 88% of TPC and 96% of antioxidant capacity after 14 days of storage when compared to fresh unpacked material. High levels of photosynthetic pigments and polyphenolic compounds were also measured in leaves packed in BOPP. The biodegradable and most permeable material (PLA) did not retain the water content, while the least gas permeable packages (PA/PE) did not preserve the specific green color of nettle leaves. The results of the study show that properly chosen packaging materials with suitable permeability characteristics help to regulate the levels of O2 and CO2 inside the packaging, creating an optimal environment that slows down the respiration rate and potentially delays the nutritional and sensory quality loss of nettle leaves. This research has provided valuable data important for both the food industry and the scientific community that can serve as a basis for further research into the packaging of fresh nettle leaves. Further research could be directed towards the use of packaging in a modified atmosphere and the use of other sustainable materials combined with active and intelligent packaging, which would contribute even more to the preservation of antioxidant compounds in nettle leaves as well as to their freshness. Additionally, research can be focused on a market study to evaluate consumer demand for this product. It should be emphasized that proper packaging management can significantly reduce food waste, which is one of the key points of the European Green Deal.

Author Contributions

Conceptualization, M.D., J.Š.Ž., M.K., S.R., N.O. and Z.M.; methodology, M.D. and J.Š.Ž.; software, M.D., M.K. and P.P.; validation, M.D., M.K. and J.Š.Ž.; formal analysis, M.D., M.K. and P.P.; investigation, M.D., J.Š.Ž., M.K. and P.P.; resources, J.Š.Ž., M.K., S.R., N.O. and Z.M.; data curation, M.D.; writing—original draft preparation, M.D.; writing—review and editing, J.Š.Ž. and M.K.; visualization, M.D.; supervision, J.Š.Ž. and M.K.; project administration, S.V.; funding acquisition, S.V. All authors have read and agreed to the published version of the manuscript.

Funding

This research was funded by the Croatian Science Foundation (Hrvatska zaklada za znanost www.hrzz.hr) under the project IP-2019-04-3325 URTICA-BioFuture–Nutritional and functional value of nettle (Urtica dioica L.) by application of modern hydroponic cultivation techniques.

Institutional Review Board Statement

Not applicable.

Informed Consent Statement

Not applicable.

Data Availability Statement

The original contributions presented in the study are included in the article, further inquiries can be directed to the corresponding author.

Conflicts of Interest

The authors declare no conflicts of interest.

References

  1. Nunes, M.C.N. Impact of Environmental Conditions on Fruit and Vegetable Quality. Stewart Postharvest Rev. 2008, 4, 1–14. [Google Scholar] [CrossRef]
  2. Beshai, H.; Sarabha, G.K.; Rathi, P.; Alam, A.U.; Deen, M.J. Freshness Monitoring of Packaged Vegetables. Appl. Sci. 2020, 10, 7937. [Google Scholar] [CrossRef]
  3. Kanlayanarat, S. Postharvest Technologies for Fresh Leafy Vegetables in Thailand. In Best Practices in Postharvest Management of Leafy Vegetables in Greater Mekong Subregion Countries, 9th ed.; Acedo, A.L., Jr., Weinberger, K., Eds.; AVRDC-World Vegetable Center: Hanoi, Vietnam, 2007; pp. 44–83. [Google Scholar]
  4. Degl’Innocenti, E.; Pardossi, A.; Tognoni, F.; Guidi, L. Physiological Basis of Sensitivity to Enzymatic Browning in ‘Lettuce’, ‘Escarole’ and ‘Rocket Salad’ When Stored as Fresh-Cut Products. Food Chem. 2007, 104, 209–215. [Google Scholar] [CrossRef]
  5. Bovi, G.G.; Caleb, O.J.; Linke, M.; Rauh, C.; Mahajan, P.V. Transpiration and Moisture Evolution in Packaged Fresh Horticultural Produce and the Role of Integrated Mathematical Models: A Review. Biosyst. Eng. 2016, 150, 24–39. [Google Scholar] [CrossRef]
  6. Yu, H.; Sun, M.; Liu, M.; Xiong, M.; Liu, L.; Wang, T.; Guo, Y.; Xie, Y.; Yao, W. Postharvest Shelf Life Simulation for Lettuce (Lactuca sativa L.) Based on Coupling Dynamic Models of Respiration, Gas Exchange, and Pseudomonas fluorescens Growth. Food Packag. Shelf Life 2023, 35, 101021. [Google Scholar] [CrossRef]
  7. Mangaraj, S.; Goswami, T.K.; Mahajan, P.V. Applications of Plastic Films for Modified Atmosphere Packaging of Fruits and Vegetables: A Review. Food Eng. Rev. 2009, 1, 133–158. [Google Scholar] [CrossRef]
  8. Khalil, R.K.S. Effect of Abusive Storage Temperatures on Growth and Survival of Escherichia coli O157:H7 on Leafy Salad Vegetables in Egypt. LWT—Food Sci. Technol. 2016, 65, 954–962. [Google Scholar] [CrossRef]
  9. Wilson, M.D.; Stanley, R.A.; Eyles, A.; Ross, T. Innovative Processes and Technologies for Modified Atmosphere Packaging of Fresh and Fresh-Cut Fruits and Vegetables. Crit. Rev. Food Sci. Nutr. 2017, 59, 411–422. [Google Scholar] [CrossRef]
  10. Mudau, A.R.; Soundy, P.; Araya, H.T.; Mudau, F.N. Influence of Modified Atmosphere Packaging on Postharvest Quality of Baby Spinach (Spinacia oleracea L.) Leaves. HortScience 2018, 53, 224–230. [Google Scholar] [CrossRef]
  11. Fang, Y.; Wakisaka, M. A Review on the Modified Atmosphere Preservation of Fruits and Vegetables with Cutting-Edge Technologies. Agriculture 2021, 11, 992. [Google Scholar] [CrossRef]
  12. Petersen, L.; Nielsen, P.V.; Olsen, M.B. Physical and Mechanical Properties of Biobased Materials. Starch 2001, 53, 356–361. [Google Scholar] [CrossRef]
  13. Murmu, S.B.; Mishra, H.N. Engineering Evaluation of Thickness and Type of Packaging Materials Based on the Modified Atmosphere Packaging Requirements of Guava (Cv. Baruipur). LWT 2017, 78, 273–280. [Google Scholar] [CrossRef]
  14. Wójtowicz, A. 2018 Selected Properties of Multilayer Films Applied for Vacuum and Modified Atmosphere Packaging Systems. Agric. Eng. 2018, 22, 89–98. [Google Scholar] [CrossRef]
  15. Sangroniz, A.; Zhu, J.B.; Tang, X.; Etxeberria, A.; Chen, E.Y.-X.; Sardon, H. Packaging Materials with Desired Mechanical and Barrier Properties and Full Chemical Recyclability. Nat. Commun. 2019, 10, 3559. [Google Scholar] [CrossRef]
  16. Szlachetka, O.; Witkowska-Dobrev, J.; Baryła, A.; Dohojda, M. Low-Density Polyethylene (LDPE) Building Films—Tensile Properties and Surface Morphology. J. Build. Eng. 2021, 44, 103386. [Google Scholar] [CrossRef]
  17. Guzman-Puyol, S.; Benítez, J.J.; Heredia-Guerrero, J.A. Transparency of Polymeric Food Packaging Materials. Food Res. Int. 2022, 161, 111792. [Google Scholar] [CrossRef]
  18. Agarwal, A.; Shaida, B.; Rastogi, M.; Singh, N.B. Food Packaging Materials with Special Reference to Biopolymers-Properties and Applications. Chem. Afr. 2023, 6, 117–144. [Google Scholar] [CrossRef]
  19. Del Nobile, M.A.; Conte, A.; Cannarsi, M.; Sinigaglia, M. Use of Biodegradable Films for Prolonging the Shelf Life of Minimally Processed Lettuce. J. Food Eng. 2008, 85, 317–325. [Google Scholar] [CrossRef]
  20. Abdul Khalil, H.P.S.; Banerjee, A.; Saurabh, C.K.; Tye, Y.Y.; Suriani, A.B.; Mohamed, A.; Karim, A.A.; Rizal, S.; Parideh, M.T. Biodegradable Films for Fruits and Vegetables Packaging Application: Preparation and Properties. Food Eng. Rev. 2018, 10, 139–153. [Google Scholar] [CrossRef]
  21. Agustin-Salazar, S.; Torrieri, E.; Immirzi, B.; Di Lorenzo, M.L. Cellulose-Based Sustainable Packaging of Leafy Vegetables: An Experimental Study on the Shelf Life of Baby Spinach. Org. Agric. 2023, 14, 167–180. [Google Scholar] [CrossRef]
  22. Versino, F.; Ortega, F.; Monroy, Y.; Rivero, S.; López, O.V.; García, M.A. Sustainable and Bio-Based Food Packaging: A Review on Past and Current Design Innovations. Foods 2023, 12, 1057. [Google Scholar] [CrossRef]
  23. Saini, R.K.; Ko, E.Y.; Keum, Y.S. Minimally Processed Ready-to-Eat Baby-Leaf Vegetables: Production, Processing, Storage, Microbial Safety, and Nutritional Potential. Food Rev. Int. 2016, 33, 644–663. [Google Scholar] [CrossRef]
  24. Kowalska, B.; Szczech, M. Differences in Microbiological Quality of Leafy Green Vegetables. Ann. Agric. Environ. Med. 2022, 29, 238–245. [Google Scholar] [CrossRef]
  25. Opačić, N.; Radman, S.; Fabek Uher, S.; Benko, B.; Voća, S.; Šic Žlabur, J. Nettle Cultivation Practices—From Open Field to Modern Hydroponics: A Case Study of Specialized Metabolites. Plants 2022, 11, 483. [Google Scholar] [CrossRef]
  26. Dujmović, M.; Opačić, N.; Radman, S.; Fabek Uher, S.; Voća, S.; Šic Žlabur, J. Accumulation of Stinging Nettle Bioactive Compounds as a Response to Controlled Drought Stress. Agriculture 2023, 13, 1358. [Google Scholar] [CrossRef]
  27. Dujmović, M.; Opačić, N.; Radman, S.; Fabek Uher, S.; Čoga, L.; Petek, M.; Voća, S.; Šic Žlabur, J. How to Increase the Nutritional Quality of Stinging Nettle Through Controlled Plant Nutrition. Food Technol. Biotechnol. 2023, 16, 451–464. [Google Scholar] [CrossRef]
  28. ASTM E96-80; Standard Test Methods for Water Vapor Transmission of Materials. American Society for Testing and Materials: West Conshohocken, PA, USA, 1980.
  29. München, G. Gas Permeability Testing Manual; Brugger Feinmechanik GmbH: Munich, Germany, 2008. [Google Scholar]
  30. Singh, R.; Giri, S.K.; Kulkarni, S.D. Respiratory Behavior of Turning Stage Mature Tomato (Solanum lycopersicum L.) Under Closed System at Different Temperature. Croat. J. Food Sci. Technol. 2013, 5, 78–84. [Google Scholar]
  31. AOAC. Official Methods of Analysis, 17th ed.; Association of Official Analytical Chemists: Washington, DC, USA, 2002. [Google Scholar]
  32. Holm, G. Chlorophyll Mutations in Barley. Acta Agric. Scand. 1954, 4, 457–471. [Google Scholar] [CrossRef]
  33. Wettstein, D. Chlorophyll-letale und der submikroskopische Formwechsel der Plastiden. Exp. Cell Res. 1957, 12, 427–434. [Google Scholar] [CrossRef]
  34. Ough, C.S.; Amerine, M.A. Methods for Analysis of Musts and Wines, 2nd ed.; John Wiley & Sons: New York, NY, USA, 1988. [Google Scholar]
  35. SAS®/STAT 9.4; SAS Institute Inc.: Cary, NC, USA, 2018.
  36. Shiku, Y.; Hamaguchi, P.Y.; Tanaka, M. Effect of pH on the Preparation of Edible Films Based on Fish Myofibrillar Proteins. Fish. Sci. 2003, 69, 1026–1032. [Google Scholar] [CrossRef]
  37. Ongaro, A.E.; Di Giuseppe, D.; Kermanizadeh, A.; Crespo, A.M.; Mencattini, A.; Ghibelli, L.; Mancini, V.; Wlodarczyk, K.L.; Hand, D.P.; Martinelli, E.; et al. Polylactic is a Sustainable, Low Absorption, Low Auto-Fluorescence, Alternative to Other Plastics for Microfluidic and Organ-On-Chip Applications. Anal. Chem. 2020, 92, 6693–6701. [Google Scholar] [CrossRef]
  38. Emblem, A. Plastics Properties for Packaging Materials. In Packaging Technology, 1st ed.; Emblem, A., Emblem, H., Eds.; Woodhead Publishing: Cambrige, UK, 2012. [Google Scholar] [CrossRef]
  39. Lin, Y.; Bilotti, E.; Bastiaansen, C.W.M.; Peijs, T. Transparent Semi-Crystalline Polymeric Materials and Their Nanocomposites: A Review. Polym. Eng. Sci. 2020, 60, 2351–2376. [Google Scholar] [CrossRef]
  40. Rhim, J.W.; Hong, S.I.; Ha, C.S. Tensile, Water Vapor Barrier and Antimicrobial Properties of PLA/nanoclay Composite Films. Food Sci. Technol. 2009, 42, 612–617. [Google Scholar] [CrossRef]
  41. Sanchez-Garcia, M.D.; Lagaron, J.M. On the Use of Plant Cellulose Nanowhiskers to Enhance the Barrier Properties of Polylactic Acid. Cellulose 2010, 17, 987–1004. [Google Scholar] [CrossRef]
  42. Shogren, R. Water Vapor Permeability of Biodegradable Polymers. J. Environ. Polym. Degr. 1997, 5, 91–95. [Google Scholar] [CrossRef]
  43. Siracusa, V. Food Packaging Permeability Behaviour: A Report. Int. J. Polym. Sci. 2012, 2012, 302029. [Google Scholar] [CrossRef]
  44. Abdul Khalil, H.P.S.; Saurabh, C.K.; Syakir, M.I.; Fazita, M.R.N.; Bhat, A.; Banerjee, A.; Fizree, H.M.; Rizal, S.; Tahir, P.M. Barrier Properties of Biocomposites/Hybrid Films. In Mechanical and Physical Testing of Biocomposites, Fibre-Reinforced Composites and Hybrid Composites, 1st ed.; Jawaid, M., Sultan, M.T.H., Saba, N., Eds.; Woodhead Publishing: Cambrige, UK, 2019; pp. 241–258. [Google Scholar] [CrossRef]
  45. Baschetti, M.G.; Minelli, M. Test Methods for the Characterization of Gas and Vapor Permeability in Polymers for Food Packaging Application: A review. Polym. Test. 2020, 89, 106606. [Google Scholar] [CrossRef]
  46. Long, J.; Zhang, W.; Zhao, M.; Ruan, C.-Q. The Reduce of Water Vapor Permeability of Polysaccharide-Based Films in Food Packaging: A Comprehensive Review. Carbohydr. Polym. 2023, 321, 121267. [Google Scholar] [CrossRef]
  47. Ščetar, M.; Kurek, M.; Galić, K. Trends in Fruit and Vegetable Packaging—A Review. Croat. J. Food Sci. Technol. 2010, 5, 69–86. [Google Scholar]
  48. Verde, A.B.; Alvim, I.D.; Luccas, V.; Junior, L.M.; Alves, R.M.V. The Influence of Formulation and Packaging Material on the Rheological Properties of Milk Chocolate. Appl. Food Res. 2022, 2, 100199. [Google Scholar] [CrossRef]
  49. Gajdoš, J.; Galić, K.; Kurtanjek, Ž.; Ciković, N. Gas Permeability and DSC Characteristics of Polymers Used in Food Packaging. Polym. Test. 2000, 20, 49–57. [Google Scholar] [CrossRef]
  50. Bodbodak, S.; Moshfeghifar, M. Advances in controlled atmosphere storage of fruits and vegetables. In Eco-Friendly Technology for Postharvest Produce Quality; Siddiqui, M.V., Ed.; Academic Press: Cambridge, MA, USA, 2016; pp. 127–183. [Google Scholar] [CrossRef]
  51. Kandasamy, P. Respiration rate of fruits and vegetables for modified atmosphere packaging: A mathematical approach. J. Postharvest Technol. 2022, 10, 88–102. [Google Scholar]
  52. Mohammadi, M.; Fasihi, M. Polymer Films Characteristics for Modified Atmosphere Packaging: A Brief Review. In Proceedings of the 13th International Conference on Food Industry Science, Organic Agriculture and Food Security, Tibilisi, Georgia, 13 March 2023. [Google Scholar]
  53. Fonseca, S.C.; Oliveira, F.A.R.; Brecht, J.K. Modelling Respiration Rate of Fresh Fruits and Vegetables for Modified Atmosphere Packages: A Review. J. Food Eng. 2002, 52, 99–119. [Google Scholar] [CrossRef]
  54. Fonseca, S.C.; Oliveira, F.A.; Frias, J.M.; Brecht, J.K.; Chau, K.V. Modelling Respiration Rate of Shredded Galega Kale for Development of Modified Atmosphere Packaging. J. Food Eng. 2002, 54, 299–307. [Google Scholar] [CrossRef]
  55. Choi, I.-L.; Lee, J.-H.; Choi, D.-H.; Wang, L.-X.; Kang, H.-M. Evaluation of the Storage Characteristics in Maintaining the Overall Quality of Whole and Fresh-Cut Romaine Lettuce during MA Storage. Horticulturae 2021, 7, 461. [Google Scholar] [CrossRef]
  56. Kader, A.A. Postharvest Biology and Technology: An Overview. In Postharvest Technology of Horticultural Crops, 3rd ed.; Kader, A.A., Ed.; University of California: Richmond, CA, USA, 2002; pp. 39–47. [Google Scholar]
  57. Akan, S. Effects of Storage Temperature and Packaging on Physiological and Nutritional Quality Preservation of Minimally Processed Spinach. J. Agric. Sci. Technol. 2022, 24, 679–691. [Google Scholar]
  58. Sohail, M.; Wills, R.B.H.; Bowyer, M.C.; Pristijono, P. Impact of Exogenous Arginine, Cysteine and Methionine on the Postharvest Senescence of Six Green Leafy Vegetables. J. Hortic. Postharvest Res. 2021, 4, 253–262. [Google Scholar] [CrossRef]
  59. Kou, L.; Luo, Y.; Park, E.; Turner, E.R.; Barczak, A.; Jurick, W.M. Temperature Abuse Timing Affects the Rate of Quality Deterioration of Commercially Packaged Ready-to-Eat Baby Spinach. Part I: Sensory Analysis and Selected Quality Attributes. Postharvest Biol. Technol. 2014, 91, 96–103. [Google Scholar] [CrossRef]
  60. Yang, T.-D.; Chen, Y.-L.; Zeng, F.-K.; Ye, M.-Q.; Wang, L.; Luo, Y.; Qi, Y.-W.; Chen, F.-P. Effects of Modified Atmosphere Packaging on the Postharvest Quality of Mulberry Leaf Vegetable. Sci. Rep. 2022, 12, 10893. [Google Scholar] [CrossRef]
  61. Toivonen, P.M.A.; Lannard, B. Dry Matter Content Association With Time of on-Tree Maturation, Quality at Harvest, and Changes in Quality After Controlled Atmosphere Storage for ‘Royal Gala’ Apples. Can. J. Plant Sci. 2021, 101, 98–106. [Google Scholar] [CrossRef]
  62. Schmitz, F.R.W.; Carvalho, L.F.D.; Bertoli, S.L.; de Souza, C.K. Effect of Refrigerated Storage Conditions on Leafy Vegetables. MOJ Food Process Technol. 2019, 7, 75–77. [Google Scholar] [CrossRef]
  63. Lee, J.S.; Chandra, D. Effects of Different Packaging Materials and Methods on the Physical, Biochemical and Sensory Qualities of Lettuce. J. Food Sci. Technol. 2018, 55, 1685–1694. [Google Scholar] [CrossRef] [PubMed]
  64. Cheptoo, G.; Owino, W.; Kenji, G. Effect of Different Packaging Materials on Nutritional Stability of Minimally Processed African Indigenous Leafy Vegetables. J. Med. Act. Plants 2020, 9, 98–110. [Google Scholar] [CrossRef]
  65. Westwood, C.T.; Mulcock, H. Nutritional Evaluation of Five Species of Forage Brassica. J. N. Z. Grassl. 2012, 74, 31–38. [Google Scholar] [CrossRef]
  66. Akter, S.; Briste, P.S.; Rabbani, M.G.; Shamsunnahar; Hoshain, S. Effect of Different Levels of Nitrogen (N) and Phosphorus (P) Fertilizer on Growth and Yield of Lettuce in Coastal Zone of Bangladesh. Res. Agric. Livest. Fish. 2022, 9, 125–134. [Google Scholar] [CrossRef]
  67. Kunicki, E.; Grabowska, A.; Sękara, A.; Wojciechowska, R. The Effect of Cultivar Type, Time of Cultivation, and Biostimulant Treatment on the Yield of Spinach (Spinacia oleracea L.). Folia Hortic. Ann. 2010, 22, 9–13. [Google Scholar] [CrossRef]
  68. Biesiada, A.; Kucharska, A.Z.; Sokół-Łętowska, A.; Kuś, A. Effect of the Age of Plantation and Harvest Term on Chemical Composition and Antioxidant Activity of Stinging Nettle (Urtica dioica L.). Ecol. Chem. Eng. A 2017, 17, 1061–1068. [Google Scholar]
  69. Rutto, L.K.; Xu, Y.; Ramirez, E.; Brandt, M. Mineral Properties and Dietary Value of Raw and Processed Stinging Nettle (Urtica dioica L.). Int. J. Food Sci. 2013, 2013, 857120. [Google Scholar] [CrossRef] [PubMed]
  70. Radman, S.; Žutic, I.; Čoga, L.; Fabek, S.; Benko, B.; Toth, N. Yield and Mineral Content of Stinging Nettle as Affected by Nitrogen Fertilization. J. Agric. Sci. Technol. 2016, 18, 1117–1128. [Google Scholar]
  71. Eldesouky, A.; Pulido, A.F.; Mesias, F.J. The Role of Packaging and Presentation Format in Consumers’ Preferences for Food: An Application of Projective Techniques. J. Sens. Stud. 2015, 30, 360–369. [Google Scholar] [CrossRef]
  72. Mokrzycki, W.S.; Talot, M. Colour Difference ∆E. A Survey. Mach. Graph. Vis. 2021, 20, 383–411. [Google Scholar]
  73. Zheng, S.; Wang, Q.; Zuo, J. Handling and Processing of Fresh-Cut Leafy Vegetables. Acta Hortic. 2021, 1319, 123–130. [Google Scholar] [CrossRef]
  74. Martins, T.; Barros, A.N.; Rosa, E.; Antunes, L. Enhancing Health Benefits through Chlorophylls and Chlorophyll-Rich Agro-Food: A Comprehensive Review. Molecules 2023, 28, 5344. [Google Scholar] [CrossRef] [PubMed]
  75. Torales, A.C.; Gutiérrez, D.R.; Rodríguez, S.C. Influence of Passive and Active Modified Atmosphere Packaging on Yellowing and Chlorophyll Degrading Enzymes Activity in Fresh-Cut Rocket Leaves. Food Packag. Shelf Life 2020, 26, 100569. [Google Scholar] [CrossRef]
  76. Ibrahim, M.H.; Jaafar, H.Z. Impact of Elevated Carbon Dioxide on Primary, Secondary Metabolites and Antioxidant Responses of Eleais guineensis Jacq. (oil palm) seedlings. Molecules 2012, 17, 5195–51211. [Google Scholar] [CrossRef]
  77. Mampholo, B.M.; Sivakumar, D.; Beukes, M.; van Rensburg, W.J. Effect of Modified Atmosphere Packaging on the Quality and Bioactive Compounds of Chinese cabbage (Brasicca rapa L. ssp. chinensis). J. Sci. Food Agric. 2013, 93, 2008–2015. [Google Scholar] [CrossRef] [PubMed]
  78. Guo, Y.; Ren, G.; Zhang, K.; Li, Z.; Miao, Y.; Guo, H. Leaf Senescence: Progression, Regulation, and Application. Mol. Hortic. 2021, 1, 5. [Google Scholar] [CrossRef] [PubMed]
  79. Mudau, A.R.; Nikomo, M.M.; Soundy, P.; Araya, H.T.; Ngezimana, W.; Mudau, F.N. Influence of Postharvest Storage Temperature and Duration on Quality of Baby Spinach. HortTechnology 2015, 25, 665–670. [Google Scholar] [CrossRef]
  80. Gęgotek, A.; Skrzydlewska, E. Antioxidative and Anti-Inflammatory Activity of Ascorbic Acid. Antioxidants 2022, 11, 1993. [Google Scholar] [CrossRef] [PubMed]
  81. Giannakourou, M.C.; Taoukis, P.S. Effect of Alternative Preservation Steps and Storage on Vitamin C Stability in Fruit and Vegetable Products: Critical Review and Kinetic Modelling Approaches. Foods 2021, 10, 2630. [Google Scholar] [CrossRef]
  82. Yussif, N.M. Vitamin C. In Vitamin C—An Update on Current Uses and Functions; LeBlanc, J.G., Ed.; IntechOpen Limited: London, UK, 2018. [Google Scholar] [CrossRef]
  83. Yin, X.; Chen, K.; Cheng, H.; Chen, X.; Feng, S.; Song, Y.; Liang, L. Chemical Stability of Ascorbic Acid Integrated into Commercial Products: A Review on Bioactivity and Delivery Technology. Antioxidants 2022, 11, 153. [Google Scholar] [CrossRef] [PubMed]
  84. Oey, I.; Verlinde, P.; Hendrickx, M.; Loey, A.V. Temperature and Pressure Stability of L-ascorbic Acid and/or [6s] 5-methyltetrahydrofolic Acid: A Kinetic Study. Eur. Food Res. Technol. 2006, 223, 71–77. [Google Scholar] [CrossRef]
  85. Sakaldas, M.; Aslım, A.Ş.; Kuzucu, C.Ö.; Kaynaş, K. The Effects of Modified Atmosphere Packaging and Storage Temperature on Quality and Biochemical Properties of Dill (Anethum graveolens) Leaves. J. Food Agric. Environ. 2010, 8, 21–25. [Google Scholar]
  86. Cantwell, M.I.; Hong, G.; Schmidt, L.; Ermen, H. Impact of Modified Atmospheres on the Vitamin C content of Salad-Cut Romaine and Other Lettuces. Acta Hortic. 2016, 1141, 167–174. [Google Scholar] [CrossRef]
  87. Zagoskina, N.V.; Zubova, M.Y.; Nechaeva, T.L.; Kazantseva, V.V.; Goncharuk, E.A.; Katanskaya, V.M.; Baranova, E.N.; Aksenova, M.A. Polyphenols in Plants: Structure, Biosynthesis, Abiotic Stress Regulation, and Practical Applications (Review). Int. J. Mol. Sci. 2023, 24, 13874. [Google Scholar] [CrossRef] [PubMed]
  88. Kaur, P.; Rai, D.R.; Paul, S. Quality Changes in Fresh-Cut Spinach (Spinacia oleracea) Under Modified Atmospheres with Perforations. J. Food Qual. 2011, 34, 10–18. [Google Scholar] [CrossRef]
  89. Sgherri, C.; Pérez-López, U.; Micaelli, F.; Miranda-Apodaca, J.; Mena-Petite, A.; Muñoz-Rueda, A.; Quartacci, M.F. Elevated CO2 and Salinity are Responsible for Phenolics-Enrichment in Two Differently Pigmented Lettuces. Plant Physiol. Bioch. 2017, 115, 269–278. [Google Scholar] [CrossRef]
  90. Shomali, A.; Das, S.; Arif, N.; Sarraf, M.; Zahra, N.; Yadav, V.; Aliniaeifard, S.; Chauhan, D.K.; Hasanuzzaman, M. Diverse Physiological Roles of Flavonoids in Plant Environmental Stress Responses and Tolerance. Plants 2022, 11, 3158. [Google Scholar] [CrossRef] [PubMed]
  91. Isah, T. Stress and defense responses in plant secondary metabolites production. Biol. Res. 2019, 52, 39. [Google Scholar] [CrossRef]
  92. Giannakourou, M.C.; Tsironi, T.N. Application of Processing and Packaging Hurdles for Fresh-Cut Fruits and Vegetables Preservation. Foods 2021, 10, 830. [Google Scholar] [CrossRef]
  93. Ziv, C.; Fallik, E. Postharvest Storage Techniques and Quality Evaluation of Fruits and Vegetables for Reducing Food Loss. Agronomy 2021, 11, 1133. [Google Scholar] [CrossRef]
  94. Repajić, M.; Cegledi, E.; Zorić, Z.; Pedisić, S.; Elez Garofulić, I.; Radman, S.; Palčić, I.; Dragović-Uzelac, V. Bioactive Compounds in Wild Nettle (Urtica dioica L.) Leaves and Stalks: Polyphenols and Pigments upon Seasonal and Habitat Variations. Foods 2021, 10, 190. [Google Scholar] [CrossRef] [PubMed]
  95. Koczkodaj, S.; Przybył, J.L.; Kosakowska, O.; Węglarz, Z.; Baczek, K.B. Intraspecific Variability of Stinging Nettle (Urtica dioica L.). Molecules 2023, 28, 1505. [Google Scholar] [CrossRef] [PubMed]
  96. Opačić, N.; Radman, S.; Dujmović, M.; Fabek Uher, S.; Benko, B.; Toth, N.; Petek, M.; Čoga, L.; Voća, S.; Šic Žlabur, J. Boosting Nutritional Quality of Urtica dioica L. to Resist Climate Change. Front. Plant Sci. 2024, 15, 1331327. [Google Scholar] [CrossRef] [PubMed]
  97. Muflihah, Y.M.; Gollavelli, G.; Ling, Y.C. Correlation Study of Antioxidant Activity with Phenolic and Flavonoid Compounds in 12 Indonesian Indigenous Herbs. Antioxidants 2021, 10, 1530. [Google Scholar] [CrossRef] [PubMed]
  98. Ferreira, V.B.; da Silva, T.T.C.; Magalhães Couto, S.R.; Sabaa Srur, A.U.O. Total Phenolic Compounds and Antioxidant Activity of Organic Vegetables Consumed in Brazil. Food Nutr. Sci. 2015, 6, 798–804. [Google Scholar] [CrossRef]
  99. Đurović, S.; Kojić, I.; Radić, D.; Smyatskaya, Y.A.; Bazarnova, J.G.; Filip, S.; Tosti, T. Chemical Constituents of Stinging Nettle (Urtica dioica L.): A Comprehensive Review on Phenolic and Polyphenolic Compounds and Their Bioactivity. Int. J. Mol. Sci. 2024, 25, 3430. [Google Scholar] [CrossRef] [PubMed]
  100. Meitha, K.; Pramesti, Y.; Suhandono, S. Reactive Oxygen Species and Antioxidants in Postharvest Vegetables and Fruits. Int. J. Food Sci. 2020, 2020, 8817778. [Google Scholar] [CrossRef]
  101. Jo, N.Y.; Lee, J.; Byeon, J.E.; Park, H.J.; Ryoo, J.W.; Hwang, S.G. Elevated CO2 Concentration Induces Changes in Plant Growth, Transcriptome, and Antioxidant Activity in Fennel (Foeniculum vulgare Mill.). Front. Plant Sci. 2022, 13, 1067713. [Google Scholar] [CrossRef]
Figure 1. Gas permeability coefficients (P) for oxygen (PO2) and carbon dioxide (PCO2) for analyzed packaging materials. Values are represented as means ± standard deviation, and different superscript letters (a–c) indicate statistically significant differences between samples at p ≤ 0.05.
Applsci 14 06563 g001
Figure 2. Nettle respiration rate (a) O2 consumption, (b) CO2 production, and (c) respiratory quotient.
Applsci 14 06563 g002
Figure 3. Composition of gases (a) O2 and (b) CO2, in packages of nettle leaves, packed in BOPP, LDPE, PA/PE, and PLA pouches, and analyzed on the 0, 6th, and 14th days of storage.
Applsci 14 06563 g003
Figure 4. Water content (W, %) of nettle leaves packed in different packaging materials and stored for 14 days, (a) results with regard to the combination of factors, (b) results with regard to individual factors. Values are represented as means of three replicates ± standard deviation. Different superscript letters (a–e) indicate statistically significant differences between samples at p ≤ 0.05.
Applsci 14 06563 g004
Figure 5. Photosynthetic pigments of nettle leaves packed in different packaging materials and stored for 14 days, (a) results with regard to the combination of factors, (b) results with regard to individual factors. Values are represented as means of three replicates ± standard deviation. Different superscript letters (a–h) indicate statistically significant differences between samples at p ≤ 0.05. Chl_a—chlorophyll a, Chl_b—chlorophyll b, TChl—total chlorophylls, TCa—total carotenoids.
Applsci 14 06563 g005aApplsci 14 06563 g005b
Figure 6. Ascorbic acid content of nettle leaves packed in different packaging materials and stored for 14 days, (a) results with regard to the combination of factors, (b) results with regard to individual factors. Values are represented as means of three replicates ± standard deviation. Different superscript letters (a–d) indicate statistically significant differences between samples at p ≤ 0.05.
Applsci 14 06563 g006
Figure 7. Total polyphenolic content of nettle leaves packed in different packaging materials and stored for 14 days, (a) results with regard to the combination of factors, (b) results with regard to individual factors. Values are represented as means of three replicates ± standard deviation. Different superscript letters (a–h) indicate statistically significant differences between samples at p ≤ 0.05. TPC—total phenolics content, TNFC—total nonflavonoid content, TFC—total flavonoid content.
Applsci 14 06563 g007
Figure 8. Antioxidant capacity of nettle leaves packed in different packaging materials and stored for 14 days, (a) results with regard to the combination of factors, (b) results with regard to individual factors. Values are represented as means of three replicates ± standard deviation. Different superscript letters (a–h) indicate statistically significant differences between samples at p ≤ 0.05.
Applsci 14 06563 g008aApplsci 14 06563 g008b
Table 1. Calibration curve equations of the individual phenolic standards.
Phenolic StandardEquationR2
Caffeoylmalic acidy = 20,636.8x + 16,8070.9997280
Chlorogenic acidy = 14511.7x − 66,325.30.9997641
Coumaric acidy = 2551.11x + 2349.010.9998387
Ellagic acidy = 33,829.1x − 6862.970.9999998
Ferulic acidy = 27,461.5x − 90,059.30.9870226
Gallic acidy = 60,235.9x − 117,8540.9998908
p-hydroxybenzoic acidy = 87,853.4x + 2,145,8600.9871377
Protocatechuic acidy = 90,775.3x − 595,1770.9997176
Vanillic acidy = 65,980.1x + 143,6370.9999301
Kaempferoly = 88,470.8x − 1,047,4100.9998243
Naringiny = 3941.28x − 30,329.70.9829743
Quercetiny = 111,886x − 377,5030.9999638
Quercetin-3-glucosidey = 50,449x − 342,6480.9997252
Rutin trihydratey = 34,107.6x – 238,6170.9989752
Table 2. Thickness (l), transparency (T600), transmittance, permeability to water vapor (WVP), and water vapor transfer rate (WVTR) of packaging materials.
Packaging Materiall (µm)Transparency
(T600)
Transmittance
(%)
WVP × 10−14
(g/m s Pa)
WVTR × 10−5
(g/m2 s)
BOPP21.60 ± 1.17 e2.15 ± 0.12 b89.74 ± 0.01 b9.92 ± 9.92 c1.01 ± 0.10 c
LDPE34.00 ± 6.45 c2.18 ± 0.42 a84.33 ± 0.01 c99.40 ± 58.95 b6.44 ± 3.82 b
PA/PEr168.20 ± 5.69 a1.75 ± 0.06 c50.70 ± 0.01 e77.40 ± 16.97 b2.44 ± 0.53 bc
PA/PEs84.50 ± 3.24 b1.04 ± 0.04 e81.66 ± 0.01 d54.10 ± 2.44 bc1.41 ± 0.06 c
PLA29.30 ± 1.06 d1.45 ± 0.05 d90.78 ± 0.01 a859.00 ± 18.53 a64.60 ± 1.39 a
Values are represented as means ± standard deviation, and different superscript letters (a–e) indicate statistically significant differences between samples at p ≤ 0.05. PA/PEr—ribbed, PA/PEs—smooth side of film.
Table 3. Chromaticity parameters of nettle leaves packed in different packaging materials and stored for 14 days.
L*a*b*ΔE
FRESH43.92 ± 0.8−14.15 ± 0.0523.12 ± 1.17-
Results considering combinations of factors
6 days of storage
BOPP42.96 ± 0.70 abc−13.52 ± 0.32 b21.17 ± 1.76 bc2.29 ± 1.85 bc
LDPE43.37 ± 0.3 abc−14.28 ± 0.56 b23.03 ± 0.13 ab0.74 ± 0.28 c
PA/PE45.41 ± 2.14 a−13.6 ± 0.81 b23.93 ± 1.75 a2.81 ± 1.09 bc
PLA40.49 ± 0.96 c−13.54 ± 1.29 b20.36 ± 1.35 c4.66 ± 1.18 b
14 days of storage
BOPP43 ± 0.92 abc−14.42 ± 0.65 b24.12 ± 1.30 a1.93 ± 0.49 c
LDPE44.49 ± 2.14 ab−12.96 ± 0.89 b22.61 ± 1.85 abc2.74 ± 0.71 bc
PA/PE35.85 ± 2.22 d−9.39 ± 1.63 a15.4 ± 1.44 d12.15 ± 3.01 a
PLA42.21 ± 1.92 bc−13.12 ± 0.82 b21.34 ± 0.98 bc3.14 ± 1.09 bc
Results considering individual factors
Days of storage
643.06 ± 2.11 a−13.73 ± 0.78 b22.12 ± 1.92 a2.63 ± 1.80 b
1441.39 ± 3.80 b−12.48 ± 2.15 a20.87 ± 3.66 b4.99 ± 4.56 a
Packaging material
BOPP42.98 ± 0.73 ab−13.97 ± 0.68 b22.65 ± 2.13 a2.11 ± 1.23 bc
LDPE43.93 ± 1.50 a−13.62 ± 0.98 b22.82 ± 1.19 a1.74 ± 1.19 c
PA/PE40.63 ± 5.58 c−11.5 ± 2.57 a19.67 ± 4.89 b7.48 ± 5.50 a
PLA41.35 ± 1.65 bc−13.33 ± 1.00 b20.85 ± 1.19 b3.9 ± 1.31 b
Significance of varied factors
D0.02430.00360.04920.0016
M0.01270.00110.0045≤0.0001
D × M≤0.00010.0013≤0.0001≤0.0001
Values are represented as means of nine replicates ± standard deviation. Different superscript letters (a–d) indicate statistically significant differences between samples at p < 0.05. L*—lightness, a*—green–red components, b*—blue–yellow components, ΔE—color difference, D—days of storage, M—packaging material, D × M—interaction of days of storage and packaging material.
Table 4. Individual phenolic compounds of nettle leaves were packed in different packaging materials and stored for 14 days.
mg/100 g
Caffeoylmalic AcidChlorogenic AcidCoumaric AcidEllagic AcidFerulic AcidGallic Acidp-Hidroxybenyoic AcidProtocatechuic AcidVanillic AcidKaempferolNaringinQuercetinQuercetin-3-GlucosideRutin Trihydrate
FRESH308.56 ± 11.20168.20 ± 9.990.66 ± 0.170.40 ± 0.1319.55 ± 2.513.22 ± 0.011.15 ± 0.0211.19 ± 0.394.53 ± 0.4611.91 ± 0.018.14 ± 0.013.40 ± 0.0113.97 ± 2.017.32 ± 0.01
Results considering combinations of factors
6 days of storage
BOPP225.13 ± 2.44 b141.11 ± 0.01 c0.65 ± 0.01 a0.25 ± 0.01 d19.58 ± 0.11 a2.94 ± 0.01 g0.87 ± 0.01 e10.36 ± 0.11 bc3.71 ± 0.49 bc11.91 ± 0.01 e7.98 ± 0.01 c3.38 ± 0.01 cd7.14 ± 0.07 b7.10 ± 0.01 h
LDPE258.70 ± 1.45 a162.12 ± 0.03 a0.17 ± 0.03 d0.42 ± 0.01 bc16.06 ± 0.04 c3.26 ± 0.15 f0.95 ± 0.01 d10.18 ± 0.04 cd4.96 ± 0.02 a11.91 ± 0.01 e7.91 ± 0.07 d3.40 ± 0.01 a6.92 ± 0.01 e7.24 ± 0.01 e
PA/PE81.27 ± 0.56 g75.91 ± 0.22 f0.32 ± 0.01 c0.46 ± 0.01 a17.38 ± 0.05 b5.18 ± 0.04 b1.05 ± 0.04 c11.43 ± 0.06 a4.03 ± 0.02 b11.91 ± 0.02 e8.09 ± 0.01 b3.39 ± 0.01 bc7.08 ± 0.01 c7.29 ± 0.01 c
PLA147.02 ± 0.72 f114.22 ± 0.01 e0.42 ± 0.01 b0.43 ± 0.01 b3.68 ± 0.01 e4.91 ± 0.16 c0.78 ± 0.01 f10.65 ± 0.46 b3.44 ± 0.53 cd11.90 ± 0.01 e7.86 ± 0.01 e3.39 ± 0.01 bc7.17 ± 0.05 ab7.26 ± 0.01 d
14 days of storage
BOPP214.28 ± 0.24 c114.01 ± 0.05 e0.00 ± 0.00 e0.26 ± 0.01 d3.78 ± 0.01 d4.34 ± 0.02 d1.07 ± 0.01 bc9.97 ± 0.04 d3.19 ± 0.01 d11.99 ± 0.01 c8.01 ± 0.01 c3.38 ± 0.01 cd7.15 ± 0.01 ab7.17 ± 0.01 g
LDPE196.55 ± 0.44 d131.36 ± 0.02 d0.00 ± 0.00 e0.46 ± 0.01 a3.38 ± 0.01 g5.18 ± 0.01 b1.10 ± 0.01 b9.99 ± 0.03 d3.60 ± 0.08 c12.02 ± 0.01 b8.13 ± 0.02 b3.39 ± 0.01 b7.02 ± 0.01 d7.33 ± 0.01 a
PA/PE55.99 ± 1.19 h33.92 ± 0.01 g0.00 ± 0.00 e0.40 ± 0.01 c3.57 ± 0.01 f3.82 ± 0.02 e0.66 ± 0.02 g9.09 ± 0.14 e1.74 ± 0.01 e11.94 ± 0.01 d8.29 ± 0.01 a3.38 ± 0.01 d7.16 ± 0.01 ab7.19 ± 0.01 f
PLA173.73 ± 0.27 e158.16 ± 0.02 b0.00 ± 0.00 e0.45 ± 0.04 a3.78 ± 0.01 d5.77 ± 0.02 a1.40 ± 0.01 a8.99 ± 0.02 e4.59 ± 0.03 a12.09 ± 0.01 a8.27 ± 0.01 a3.39 ± 0.01 b7.20 ± 0.01 a7.31 ± 0.01 b
Results considering individual factors
6178.03 ± 72.09 a123.34 ± 33.65 a0.39 ± 0.18 a0.39 ± 0.09 a14.17 ± 6.46 a4.07 ± 1.03 b0.91 ± 0.11 b10.66 ± 0.54 a4.04 ± 0.67 a11.91 ± 0.01 b7.96 ± 0.10 b3.39 ± 1.53 a7.08 ± 0.11 b7.22 ± 0.08 b
14160.14 ± 64.57 b109.36 ± 48.37 b0.00 ± 0.00 b0.39 ± 0.09 a3.63 ± 0.17 b4.78 ± 0.78 a1.06 ± 0.28 a9.51 ± 0.50 b3.28 ± 1.07 b12.01 ± 0.06 a8.17 ± 0.12 a3.39 ± 0.01 b7.13 ± 0.07 a7.25 ± 0.08 a
BOPP219.70 ± 6.14 b127.56 ± 14.84 c0.32 ± 0.35 a0.25 ± 0.01 b11.68 ± 8.66 a3.64 ± 0.77 d0.97 ± 0.11 c10.17 ± 0.23 a3.45 ± 0.42 b11.95 ± 0.05 b7.99 ± 0.02 c3.38 ± 1.85 a7.14 ± 0.05 b7.13 ± 0.04 c
LDPE227.63 ± 34.05 a146.74 ± 16.84 a0.08 ± 0.09 d0.44 ± 0.02 a9.72 ± 6.94 c4.22 ± 1.05 c1.03 ± 0.08 b10.08 ± 0.11 a4.28 ± 0.74 a11.96 ± 0.06 b8.02 ± 0.13 c3.39 ± 0.01 b6.97 ± 0.05 c7.29 ± 0.05 a
PA/PE68.63 ± 13.87 d54.91 ± 23.00 d0.16 ± 0.17 c0.43 ± 0.04 a10.48 ± 7.56 b4.50 ± 0.74 b0.86 ± 0.22 d10.26 ± 1.29 a2.89 ± 1.26 c11.93 ± 0.02 c8.19 ± 0.11 a3.38 ± 0.01 d7.12 ± 0.04 b7.24 ± 0.05 b
PLA160.37 ± 14.64 c136.19 ± 24.06 b0.21 ± 0.23 b0.44 ± 0.03 a3.73 ± 0.06 d5.34 ± 0.48 a1.09 ± 0.34 a9.82 ± 0.96 b4.02 ± 0.72 a11.99 ± 0.11 a8.06 ± 0.22 b3.39 ± 0.01 c7.18 ± 0.03 a7.28 ± 0.03 a
Significance of varied factors
D≤0.0001≤0.0001≤0.0001ns≤0.0001≤0.0001≤0.0001≤0.0001≤0.0001≤0.0001≤0.0001≤0.00010.0006≤0.0001
M≤0.0001≤0.0001≤0.0001≤0.0001≤0.0001≤0.0001≤0.00010.0041≤0.0001≤0.0001≤0.0001≤0.0001≤0.0001≤0.0001
D × M≤0.0001≤0.0001≤0.0001≤0.0001≤0.0001≤0.0001≤0.0001≤0.0001≤0.0001≤0.0001≤0.0001≤0.0001ns≤0.0001
Values are represented as means of three replicates ± standard deviation. Different superscript letters (a–h) indicate statistically significant differences between samples at p ≤ 0.05. D—days of storage, M—packaging material, D × M—interaction of days of storage and packaging material, ns—nonsignificant.
Disclaimer/Publisher’s Note: The statements, opinions and data contained in all publications are solely those of the individual author(s) and contributor(s) and not of MDPI and/or the editor(s). MDPI and/or the editor(s) disclaim responsibility for any injury to people or property resulting from any ideas, methods, instructions or products referred to in the content.

