Article

Reservoir Characteristics of Marine–Continental Transitional Taiyuan Formation Shale and Its Influence on Methane Adsorption Capacity: A Case Study in Southern North China Basin

1
School of Earth Sciences and Engineering, Suzhou University, Suzhou 234000, China
2
National Engineering Research Center of Coal Mine Water Hazard Controlling, Suzhou 234000, China
*
Author to whom correspondence should be addressed.
Appl. Sci. 2024, 14(15), 6577; https://doi.org/10.3390/app14156577
Submission received: 11 July 2024 / Revised: 25 July 2024 / Accepted: 26 July 2024 / Published: 27 July 2024
(This article belongs to the Special Issue Advances in Unconventional Natural Gas: Exploration and Development)

Abstract

:
To further study the reservoir characteristics and adsorption capacity of the Taiyuan Formation shale in the South North China Basin (SNCB), the pore structure and adsorption capacity of shale are discussed using various analysis tests, including elemental geochemistry, organic geochemistry, mineral composition, low-temperature nitrogen adsorption (LTNA), and methane adsorption experiments. The results indicate that the Taiyuan Formation shale formed in a poor oxygen and anaerobic sedimentary environment in still water. The average value of total organic carbon (TOC) content is 2.37%. The organic matter type mainly consists of type III kerogen. The vitinite reflectance (Ro) ranges from 3.11% to 3.50%. The clay mineral content varies greatly, averaging at 40.7%, while the quartz content averages at 37.7%. The Taiyuan Formation shale mainly develops interparticle (InterP) pores, followed by organic pores, intraparticle (IntraP) pores, solution pores, and microfractures. BET specific surface area (SSA) is between 9.47 m2/g and 22.14 m2/g, while pore volume (PV) ranges from 0.0098 cm3/g to 0.022 cm3/g, indicating favorable conditions for shale gas storage. According to the results of the CH4 adsorption experiment, Langmuir volume from Taiyuan Formation shales exhibits 1.35~4.30 cm3/g, indicating excellent adsorption capacity. TOC content shows a positive correlation with both Langmuir volume and BET SSA from Taiyuan Formation shales, suggesting that TOC plays a crucial role in controlling microscopic pores and gas adsorption capacity. Organic matter enhances the shale adsorption capacity by providing abundant pore SSA. Due to formation compaction, the pore size of clay minerals decreases, leading to an increase in pore SSA, while kaolinite exhibits weak hydrophilic ability. Consequently, with the increase in clay minerals and kaolinite content, the shale adsorption capacity is enhanced to a certain extent. However, an increase in the carbonate mineral content may result in a decrease in the proportion of clay minerals, therefore reducing the CH4 adsorption capacity of shale.

1. Introduction

The increasing global energy demand and gradual depletion of traditional fossil fuel reserves have made shale gas a typical unconventional natural resource. Its efficient exploration and development are now crucial for alleviating the energy crisis and protecting the environment [1,2,3]. Shale gas resources in China have enormous potential, and the organic-rich shale formation has a long geological age, many sedimentary types, and a wide distribution area. Taking into account the differences in material composition and formation environment, shale gas resources can be classified into three types: marine, marine–continental transition, and continental facies [4,5]. Among them, Marine shale gas has a large thickness, wide distribution area, and strong horizontal continuity. The kerogen is mainly type I~II1, and the abundance and maturity of organic matter are high. The commercially developed shale gas mainly comes from the deep-sea shelf mud shale of the Upper Ordovician-Lower Silurian (Wufeng–Longmaxi Formation) in the Sichuan Basin and its surrounding areas [6,7]. The continental shale has a large total thickness, concentrated development, and a high abundance of organic matter. However, due to the low organic matter evolution [8], the high clay mineral content, and the low brittle mineral content, its gas generation capacity is limited, and the development of shale gas is challenging [9]. The marine–continental transitional shale gas has a favorable development situation. The geological resources account for approximately 25% of the total shale gas reserves in China. The shale is widely distributed, with predominantly type III kerogen and high organic matter abundance, currently in the peak stage of gas generation. Despite significant breakthroughs in exploration and development in the Ordos Basin, Qinshui Basin, SNCB, Central Hunan Area, Southeast Sichuan Area, and Guizhou Area, cost and technical challenges are expected due to the thin continuous thickness of shale, rapid vertical and horizontal changes, as well as frequent interbedding with coal seams and tight sandstones [10,11].
The main component of shale gas is CH4, which often occurs in reservoir rock dominated by organic-rich shale. It exists mainly in the adsorption state and free state, with a small amount being dissolved [12,13]. The adsorbed gas primarily exists on the pore surface of organic matter and clay minerals, accounting for 20–85% of the total gas content. The free gas mainly occurs in microcracks and pores with a large pore size, constituting 15–80% of the total gas content. A small amount of dissolved gas is present in asphaltene, liquid hydrocarbon, kerogen, and formation water [13,14,15]. Numerous controlling factors affect the methane adsorption capacity of shale, including the content, type, and maturity of organic matter, the composition and content of minerals, PV, pore structure, water content, and so on [16,17,18]. Among them, Zhang et al. believed that organic matter is the primary controlling factor of gas adsorption in shale gas systems. Type III kerogen exhibits stronger aromatization, more pores, and higher shale adsorption capacity, while type I kerogen has the lowest adsorption capacity [19]. Chen et al. concluded from their adsorption experiments and grand canonical Monte Carlo simulation that organic matter serves as the main adsorbent in shale due to the high distribution density and strong intensity of adsorption sites and large SSA [20]. Zhang and Fu investigated the Langmuir volume (VL) of coal-measure shale from the Shanxi-Taiyuan Formation in the central and southern Qinshui Basin. They found that VL was positively correlated with TOC content, clay mineral content, and SSA, while it was negatively correlated with quartz content and average pore size. Additionally, they observed that as Ro increased, VL initially increased but then decreased [21]. Ji et al. investigated the relationship between the types of clay mineral and methane adsorption in over-mature shales, revealing that illite/smectite (I/S) mixed layer exhibits a stronger methane adsorption capacity than kaolinite, while illite exhibits the weakest methane adsorption capacity [22]. Sun and Guo analyzed the influence of pore structure on the adsorption capacity of Upper Paleozoic transitional shale in the Ordos Basin. Studies have shown that methane adsorption capacity is positively correlated with the SSA of micropores in shale, and TOC content and clay minerals also significantly contribute to the methane adsorption capacity of shale [23]. Xing et al. elucidated the controlling factors of water in the nanopores of shale and its influence on methane adsorption [24]. The analysis revealed that the type and content of clay minerals were the primary factors affecting the water content or water absorption capacity of shale, while competitive adsorption between water and methane at adsorption sites was the main mechanism leading to a decrease in methane adsorption capacity of shale [24]. In recent years, the methane adsorption capacity of marine shale has been extensively studied. Due to differences in sedimentary environments, there are significant differences in reservoir material composition and gas occurrence mechanism between marine–continental transitional shale and marine shale [25]. These differences will cause a significant amount of uncertainty in determining the main controlling factors of gas enrichment in the marine–continental transitional shale [26]. Therefore, it is necessary to further clarify the reservoir characteristics and methane adsorption capacity of transitional shale to provide a scientific basis for accurately evaluating the potential of transitional shale gas.
The Shanxi-Taiyuan Formation is the main stratum of marine–continental transitional shale in the SNCB. The shale has a large thickness and wide distribution, which is of great significance for the exploration and development of marine–continental transitional shale gas. To comprehensively understand the characteristics and gas-bearing properties of the shale reservoir from the Taiyuan Formation in the SNCB, experiments on element geochemistry, mineral composition, organic geochemistry, pore structure characteristics, and methane adsorption were carried out in this paper. The material composition, pore structure parameters of shale, and their controlling effects on methane adsorption capacity are discussed. The research results are helpful for a better understanding of the shale reservoir characteristics and shale gas enrichment mechanism of the Taiyuan Formation in the SNCB, providing a theoretical reference for the exploration and development of coal measures shale gas from the Lower Permian in the study area.

2. Geological Background

The SNCB is in the south of the North China Block, which belongs to the junction between the south of the North China Block and the Qinling–Dabie orogenic belt. It can be divided into six first-order tectonic zones: the western Henan uplift zone, the Zhoukou Depression zone, the Taikang Uplift zone, the Kaifeng Depression zone, the Xuzhou-Bengbu Uplift zone, and the Hefei Basin [27,28]. Well Z is located on the northwest slope of Taikang Uplift, at the junction of Tongxu Uplift and Kaifeng Depression, SNCB (Figure 1a). The tectonic evolution has gone through four periods: the development period of the neritic sedimentary basin of the Cambrian–Middle Ordovician, the denudation period of cratonic paleocontinental uplift of the Late Ordovician–Devonian, the development period of marine–continental transitional subsidence basin of the Carboniferous–Permian, and the development period of the continental basin of the Triassic–Quaternary [29]. The coal-bearing rocks are developed at the lower part of the Permian in this area. The source rocks are widely distributed and well-developed. The Taiyuan Formation consists of carbonate rocks from the epicontinental sea and clastic rocks from shoreland, with a thickness ranging from 39 to 140 m. The lithology mainly comprises limestone, sandstone, mudstone, and coal. The lithology mainly consists of limestone, sandstone, mudstone, and coal (Figure 1b). It represents an overall transgressive and regressive sequence. The shale section represents a lagoon facies, while the limestone section represents a restricted platform facies. Some areas have thick shale with high organic matter content, which presents potential for shale gas exploration [29].

3. Samples and Experiments

3.1. Samples

In this study, 20 shale samples of Taiyuan Formation were collected from Well Z in the SNCB, with a sampling depth ranging from 2844 to 2911 m. We analyzed the organic carbon abundance and whole-rock mineral composition of all samples. Additionally, some samples were analyzed using elemental geochemistry, macerals, LTNA, scanning electron microscopy (SEM), and methane adsorption experiments.

3.2. Experimental Methods

The LECO CS-200 sulfur-carbon analyzer was used to analyze the TOC of shale samples. The sample with a particle size of 0.075 mm, weighing 0.1 g, was taken. The inorganic carbon component in the sample was removed by diluting hydrochloric acid with a mass fraction of 5%. The treated sample was washed with deionized water and then placed in an oven at 80 °C for continuous drying for 48 h. Finally, the TOC determination experiment was carried out after the sample had been dried. The macerals and Ro of shale samples were measured using the LEICA DM 4500 P micro-spectrophotometer. The macerals were identified and quantitatively analyzed following the China Petroleum and Natural Gas Industry Standard (SY/T 6414-2014) [32]. The Ro was measured following the China Petroleum and Natural Gas Industry Standard (SY/T 5124-2012) [33].
The mineral composition was analyzed using a Bruker D8 ADVANCE DaVinci X-ray diffractometer. A sample weighing more than 0.5 g and with a particle size of less than 0.075 mm was taken. The test instrument utilized the Cu target, and the rotation angle ranged from 3° to 70°. Quantitative analysis was conducted through step scanning at a speed of 4°/min and an interval of 0.02°. The database for mineral identification comes from the China Petroleum and Natural Gas Industry Standard (SY/T 5163-2018) [34].
The shale was prepared into a block measuring approximately 1 cm × 1 cm × 0.3 cm, and the sample surface was polished using the Gatan693 ion polishing instrument. The polished samples were then placed in a Quanta 250 FEG high-resolution SEM to observe the pore morphology. The SEM has a resolution of up to 0.8 nm, magnification ranging from 6 to 1 × 10⁶ times, and an adjustable accelerating voltage range of 0.2 to 30 kV.
First, approximately 0.5 g of the sample was subjected to high-temperature calcination to eliminate organic matter. Subsequently, around 0.5 mg of the resulting residue was weighed and dissolved in a mixture of HNO3, HF, and HClO4 with a ratio of 2:2:1, using a volume of 7.5 mL. After being evaporated to dryness at high temperature, a mixed acid of HNO3 and HF with a ratio of 1:1 was added and kept at 190 °C for 48 h. After cooling, the solution was evaporated to obtain a wet salt state and then slowly added with 4 mL of HNO3 and kept at 170 °C for 4 h. The dissolved sample was diluted by a factor of 2000 using 2% HNO3. Finally, the dissolved and diluted sample was tested on an ICP-MS instrument, and the relative error of the analysis data was less than 5%.
The LTNA experiment utilized the Micromeritics ASAP2460 automatic SSA and pore size analyzer. The shale sample was crushed to 80 mesh, and 1.5 g of the shale sample underwent vacuum degassing at 250 °C for 12 h to eliminate free water and volatile substances in the sample. The relative pressure range for the experiment was set between 0.0001 and 0.995. The PV, pore size distribution (PSD), and SSA of the samples were calculated using BJH and BET models, respectively.
Methane adsorption experiments were conducted using the H-Sorb 2600 high-pressure gas isothermal adsorption instrument. The shale samples were crushed to a size of 60–80 mesh, and 1.5 g of samples were vacuumed at 105 °C for more than 12 h. The experiment utilized the static volume method with a test temperature of 90 °C and a maximum experimental equilibrium pressure of 12 MPa.

4. Results

4.1. Organic Geochemical Characters

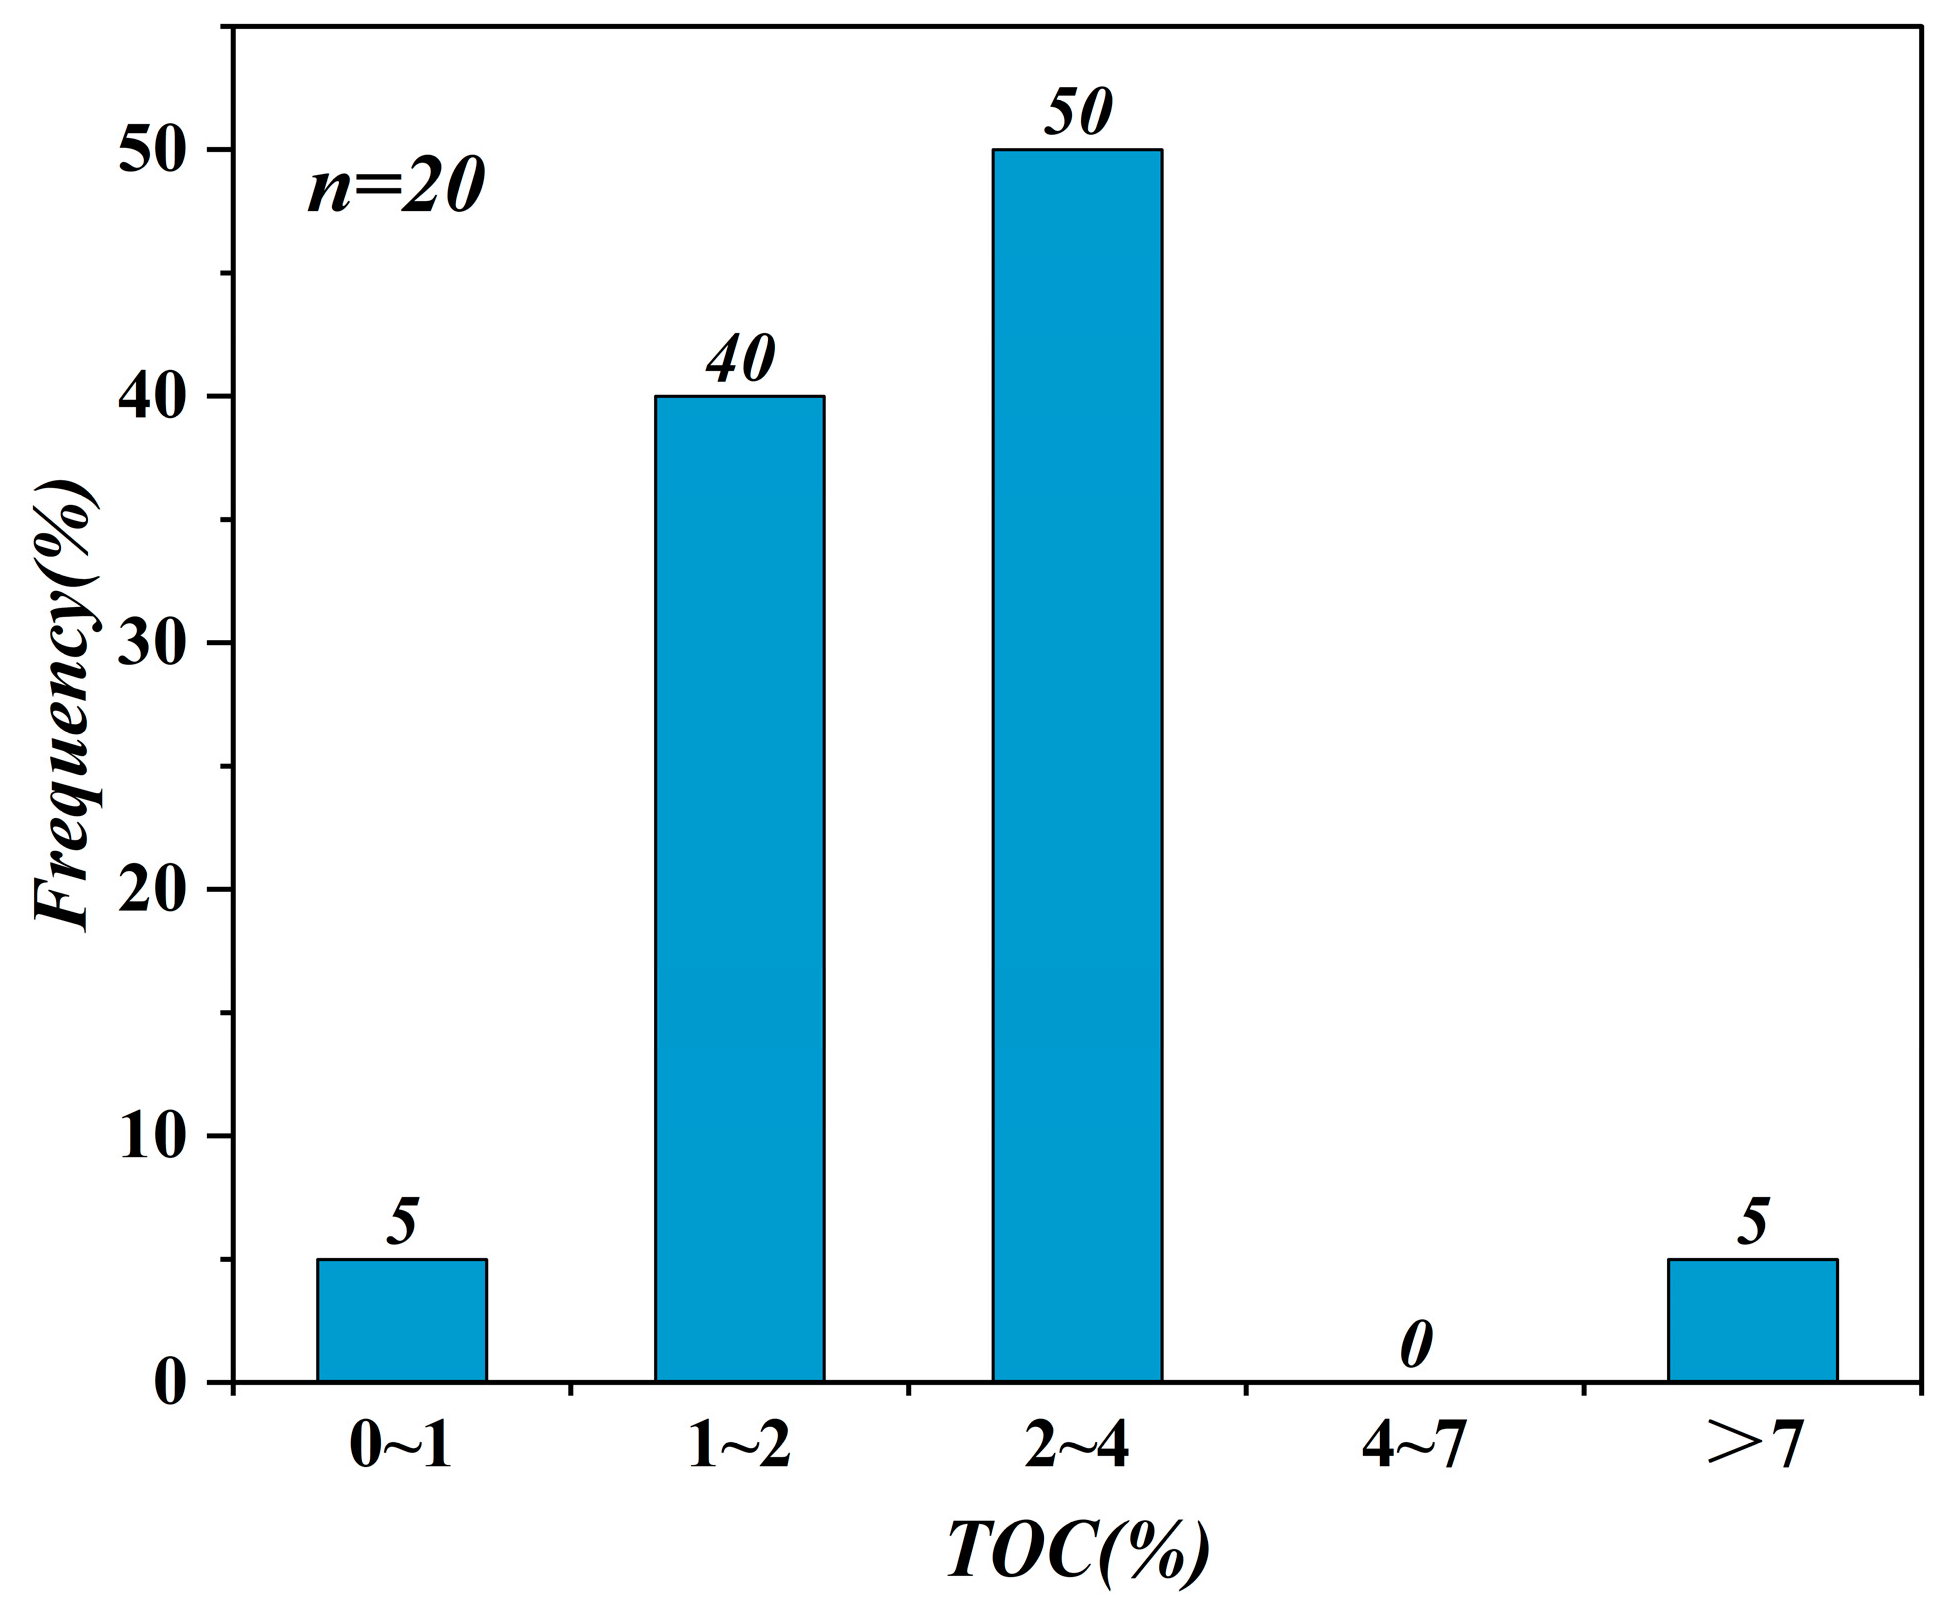
The TOC content distribution of shale samples from Well Z in the SNCB ranges from 0.58% to 7.43%, with an average of 2.37%. From the result of TOC distribution frequency (Figure 2), most shales have a TOC content between 1% and 4%, while a few shales have a TOC content exceeding 7%. It can be observed that the Taiyuan Formation shale exhibits a high organic carbon abundance, providing a good material basis for the formation of shale gas. The Ro of the shale samples from the Taiyuan Formation ranges between 3.11% and 3.50%, with an average of 3.23%. This indicates that the shale from the Taiyuan Formation has reached an over-mature stage. The organic macerals of Taiyuan Formation shale are primarily composed of sapropelic and vitrinite, with the sapropelic accounting for 20.0% to 92.0%, averaging 48.1%. The vitrinite content ranges from 2.0% to 44.0%, with an average of 27.8%. The calculation results of the kerogen type index (TI) indicate that the organic matter of Taiyuan Formation shale is primarily kerogen type III, followed by type II1 kerogen. The results of shale pyrolysis indicate that the hydrocarbon content is low due to the high degree of thermal evolution, resulting in a limited potential for hydrocarbon generation (Table 1).

4.2. Sedimentary Environmental Characteristics

The change in the sedimentary water environment usually elicits a specific geochemical response in sedimentary rocks (shale, sandstone, limestone, mudstone, etc.). Therefore, the parameters of trace elements and rare earth elements in rocks can better reflect the original geochemical information and paleoenvironmental characteristics preserved by source rocks [35,36]. The enrichment and accumulation of V, Ni, Cu, Zn, and other elements in sediments are controlled by the redox conditions of the sedimentary environment. These elements are typically enriched under reducing conditions [37,38].
The V/(V + Ni) ratio can indicate the stratification and redox conditions of the water [37]. When V/(V + Ni) is less than 0.46, it reflects an oxygen-rich oxidation environment; when it is between 0.46 and 0.57, it reflects an oxygen-poor weak reduction environment; when it is between 0.57 and 0.83, it reflects an anoxic reduction environment; when it is between 0.83 and 1, it reflects a static sea environment [37]. The V/(V + Ni) ratio of the Permian Taiyuan Formation shale is 0.76~0.87, with an average of 0.82 (Table 2). This value is significantly higher than the threshold of 0.57, indicating that the ancient water existed in an anoxic static sea environment during the sedimentary period of the Taiyuan Formation. The Cu/Zn ratio can reflect the redox conditions of ancient water. Cu/Zn < 0.21 is an anoxic environment, 0.21 < Cu/Zn < 0.63 is an oxygen-poor environment, and Cu/Zn < 0.63 is an oxygen-rich environment [39]. The Cu/Zn ratio of the Taiyuan Formation shale ranges from 0.16 to 0.23, with an average of 0.22 (Table 2). This indicates that the ancient water existed in an oxygen-poor and anoxic sedimentary environment during the deposition period of the Taiyuan Formation. The Ce anomaly is also a reliable and effective method for determining redox conditions [40]. Due to the extremely low content of Ce, the Ce anomaly can generally be replaced by the ratio of Ce/La. The Ce/La ratio less than 1.5 indicates an oxygen-rich environment, the ratio between 1.5 and 1.8 indicates an oxygen-poor environment, and the ratio greater than 1.8 indicates an anoxic environment [40]. The Ce/La ratio of the Taiyuan Formation shale ranges from 1.57 to 2.00, with an average of 1.81 (Table 2), indicating that the ancient water existed in poor oxygen and anaerobic sedimentary environment during the sedimentation period of the Taiyuan Formation. In summary, the geochemical parameters of the V/(V + Ni) ratio, Cu/Zn ratio, and Ce/La ratio all indicate that the sedimentary period of the Permian Taiyuan Formation in the SNCB was poor oxygen and anaerobic sedimentary environment of static water.

4.3. Petrological and Mineralogical Characteristics

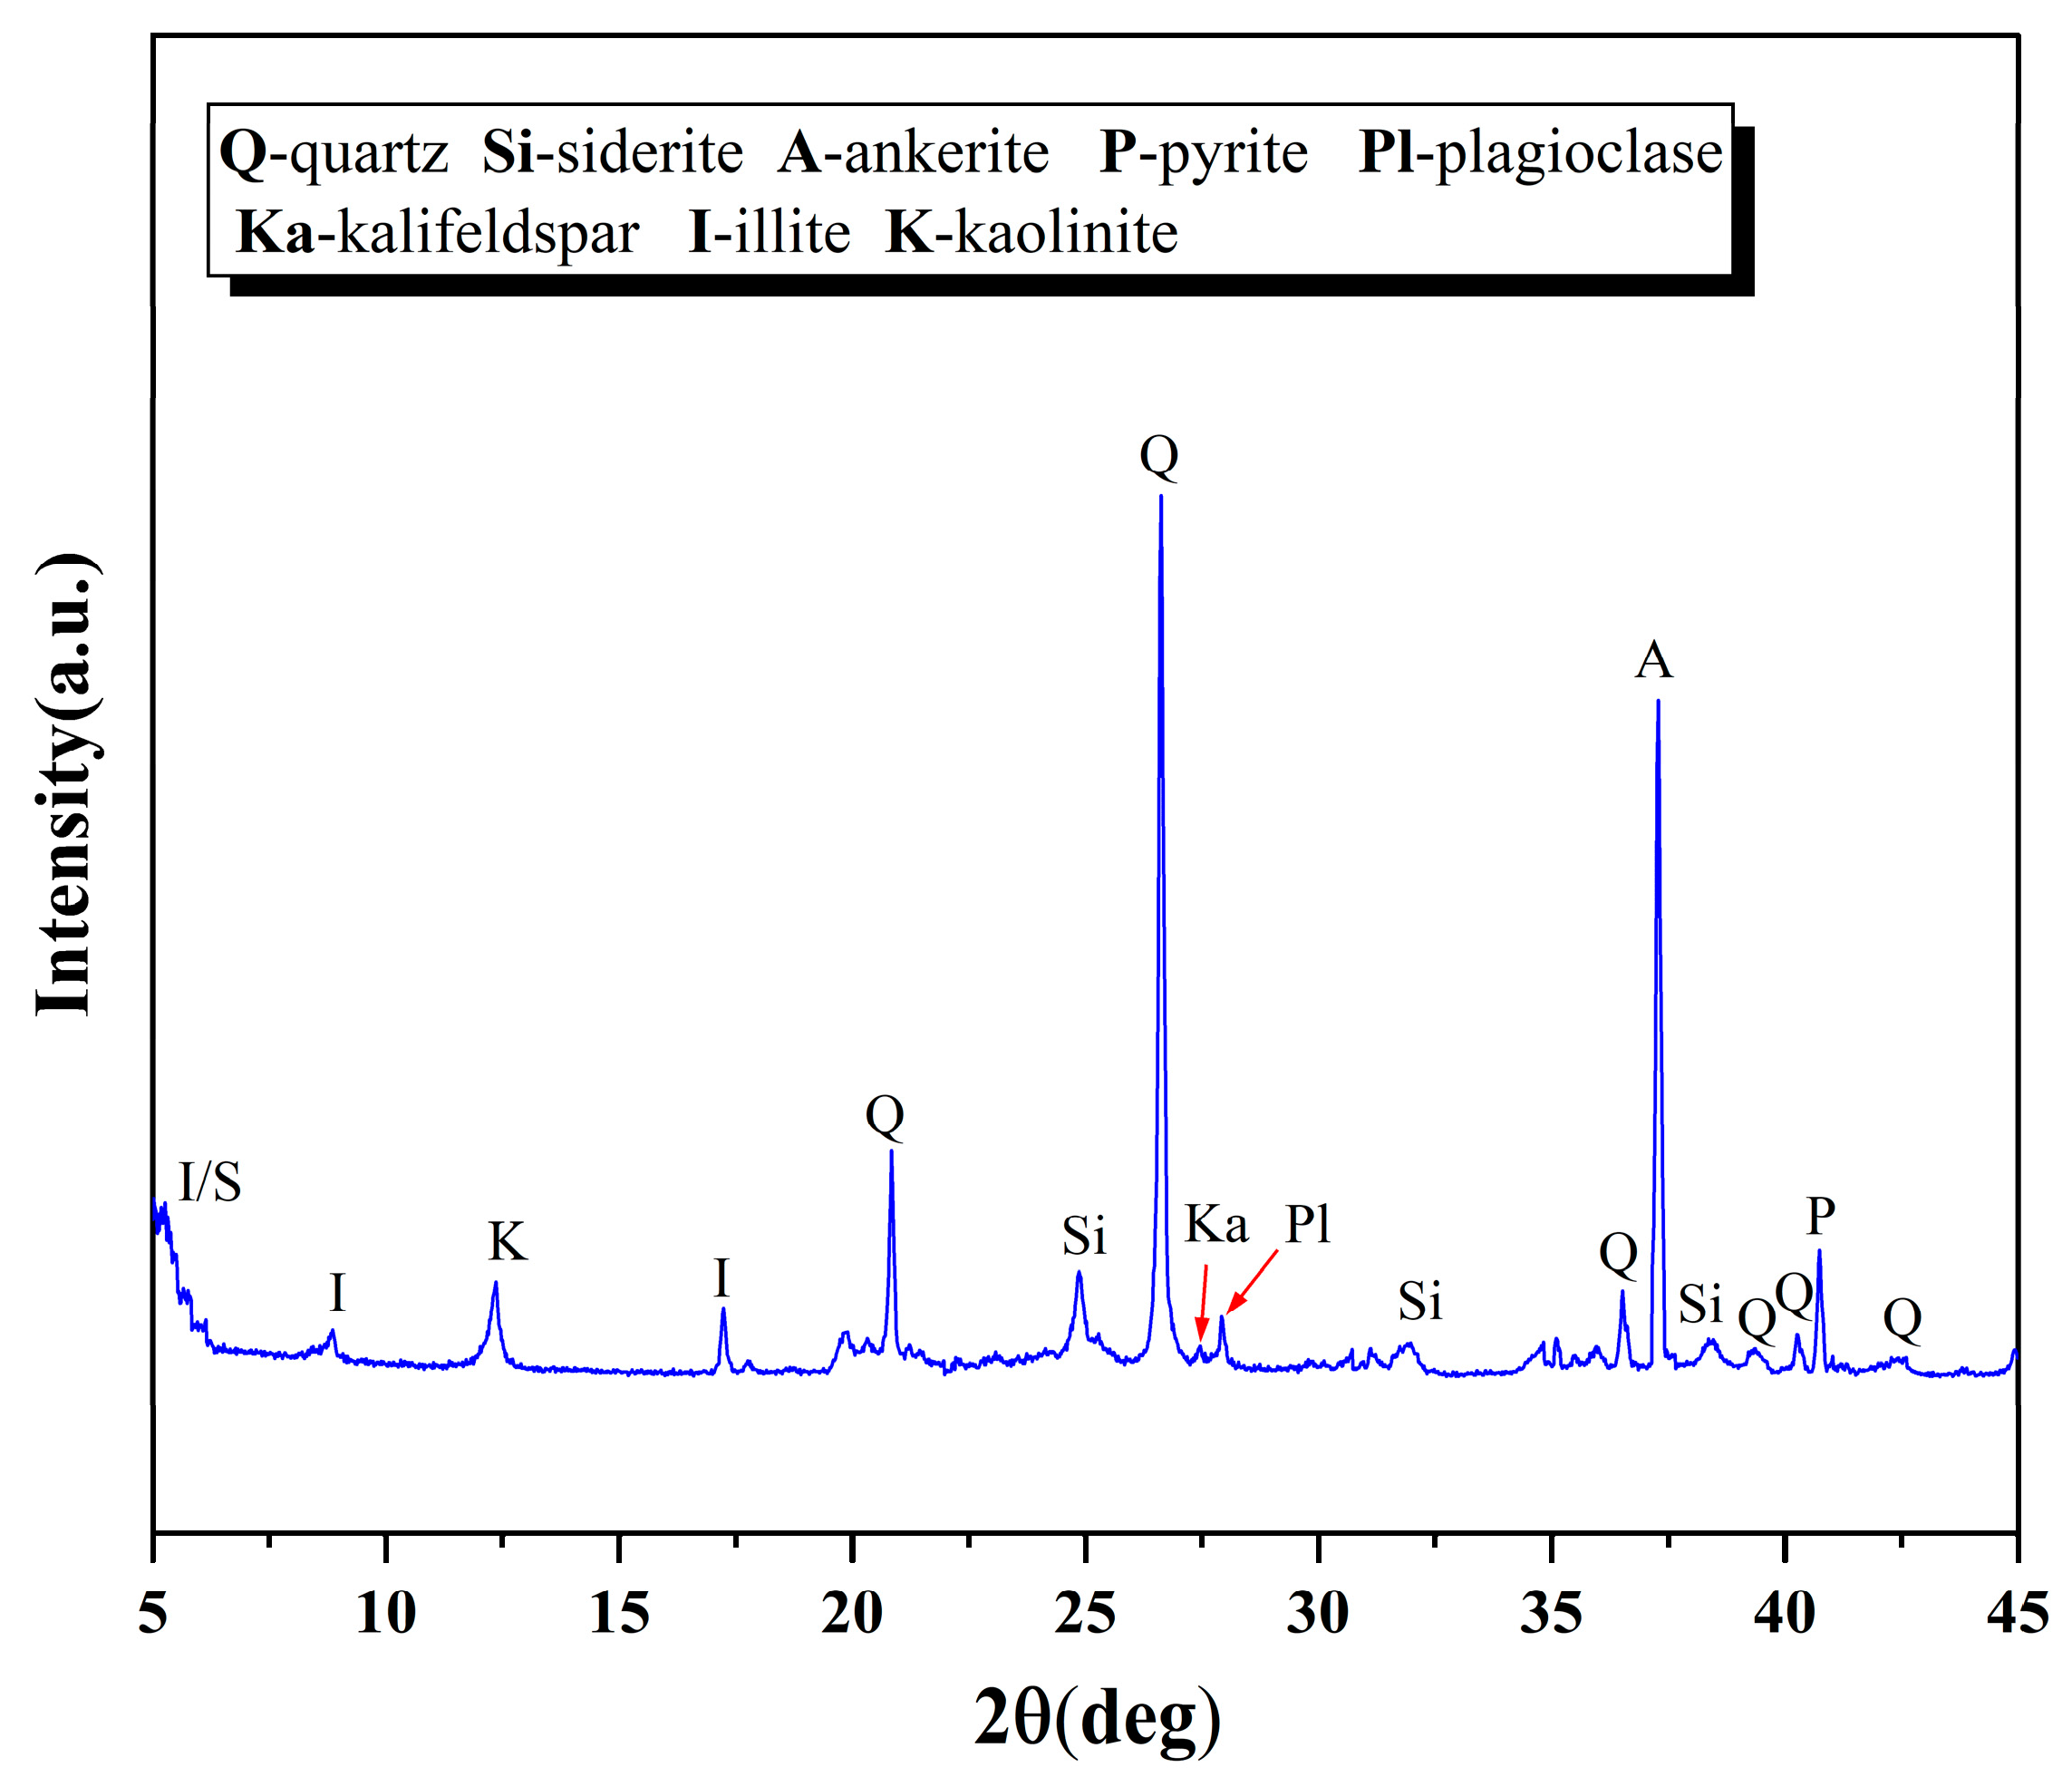
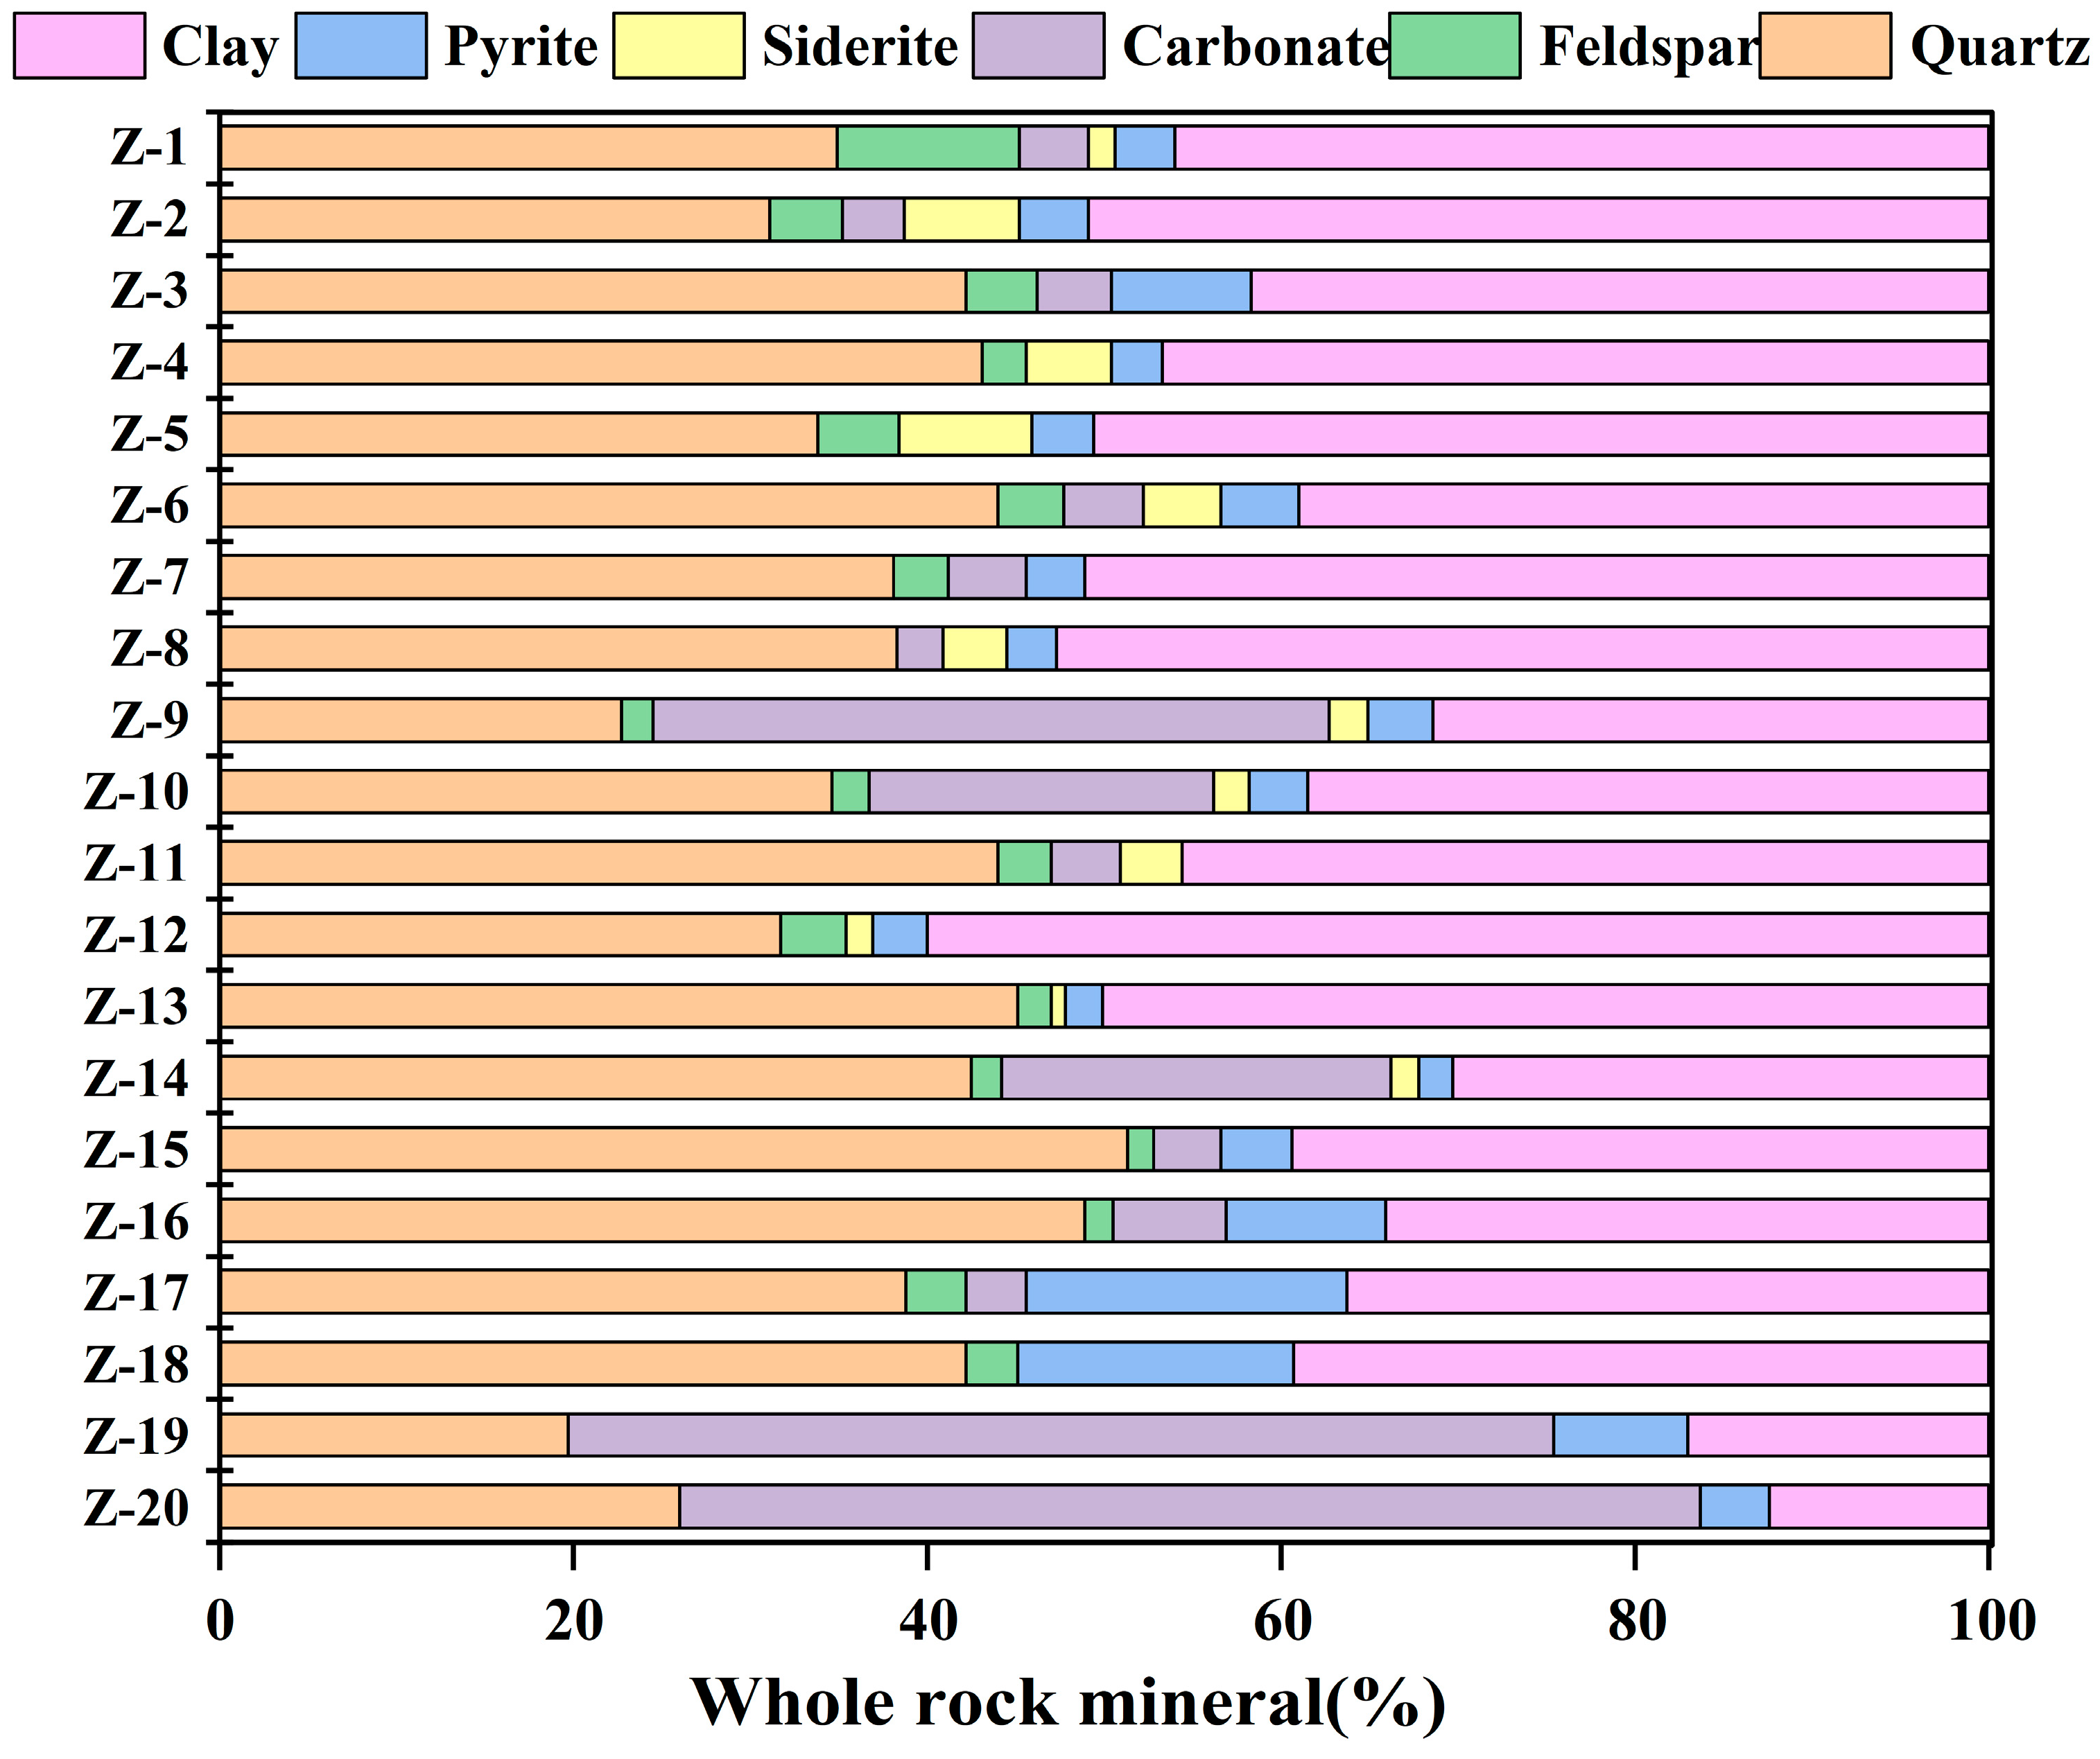
Mineral composition is an important factor that affects the nanopore structure of shale. Different inorganic minerals have distinct differences in crystal structure and physical and chemical properties, which result in variations in pore morphology and size between crystals and particles, as well as SSA and even adsorption heat of particles. Consequently, these differences lead to variations in the adsorption capacity of shale [41]. The XRD test results of Taiyuan Formation shale samples show that the mineral composition is predominantly quartz and clay minerals (Figure 3), with a significant variation in the content of clay minerals ranging from 12.4% to 60.0%, averaging 40.7%. The quartz content ranges from 19.7% to 51.3%, with an average of 37.7%. In addition to quartz and clay minerals, the Taiyuan Formation shale also contains small amounts of feldspar, carbonate, and pyrite. Among these, the feldspar content ranges from 0% to 10.3%, averaging at 2.8%; the carbonate content ranges from 0% to 57.7%, averaging at 11.7%. It exhibits obvious heterogeneous distribution vertically, where individual samples with high carbonate content may be attributed to their collection location near limestone layers. The pyrite content ranges from 0% to 18.1%, averaging at 5.2%. Pyrite shows distinct enrichment sections in the vertical direction. A small amount of siderite is also present in the Taiyuan Formation shale, with the content ranging from 0 to 7.5% and an average of 2.0%. This indicates that the Taiyuan Formation shale has a high concentration of brittle minerals, which is more conducive to shale reservoir fracturing (Figure 4). According to the analysis results of clay mineral composition in the Taiyuan Formation shale, the main clay minerals are I/S mixed layer, accounting for 19.0% to 81.0%, with an average of 55.5%. Followed by illite, its content ranges from 7% to 40%, with an average of 25.2%; only a few samples contain trace amounts of chlorite, with the highest content being at 9% (Figure 5).
Lithofacies refer to the combination of rock types or lithologies formed in a specific sedimentary environment. The division of lithofacies mainly relies on factors such as mineral composition, sedimentary structure, organic matter abundance, and development characteristics of biology [42,43,44]. Based on the characteristics of shale mineral composition, the three-terminal element method is employed, with quartz + feldspar + pyrite, clay minerals, and carbonate minerals as three-terminal elements. The Taiyuan Formation shale in the SNCB can be mainly classified into siliceous shale, clay-rich shale, and mixed shale, with a small amount of siliceous shale (Figure 6).

4.4. Pore Type and Morphological Characteristics

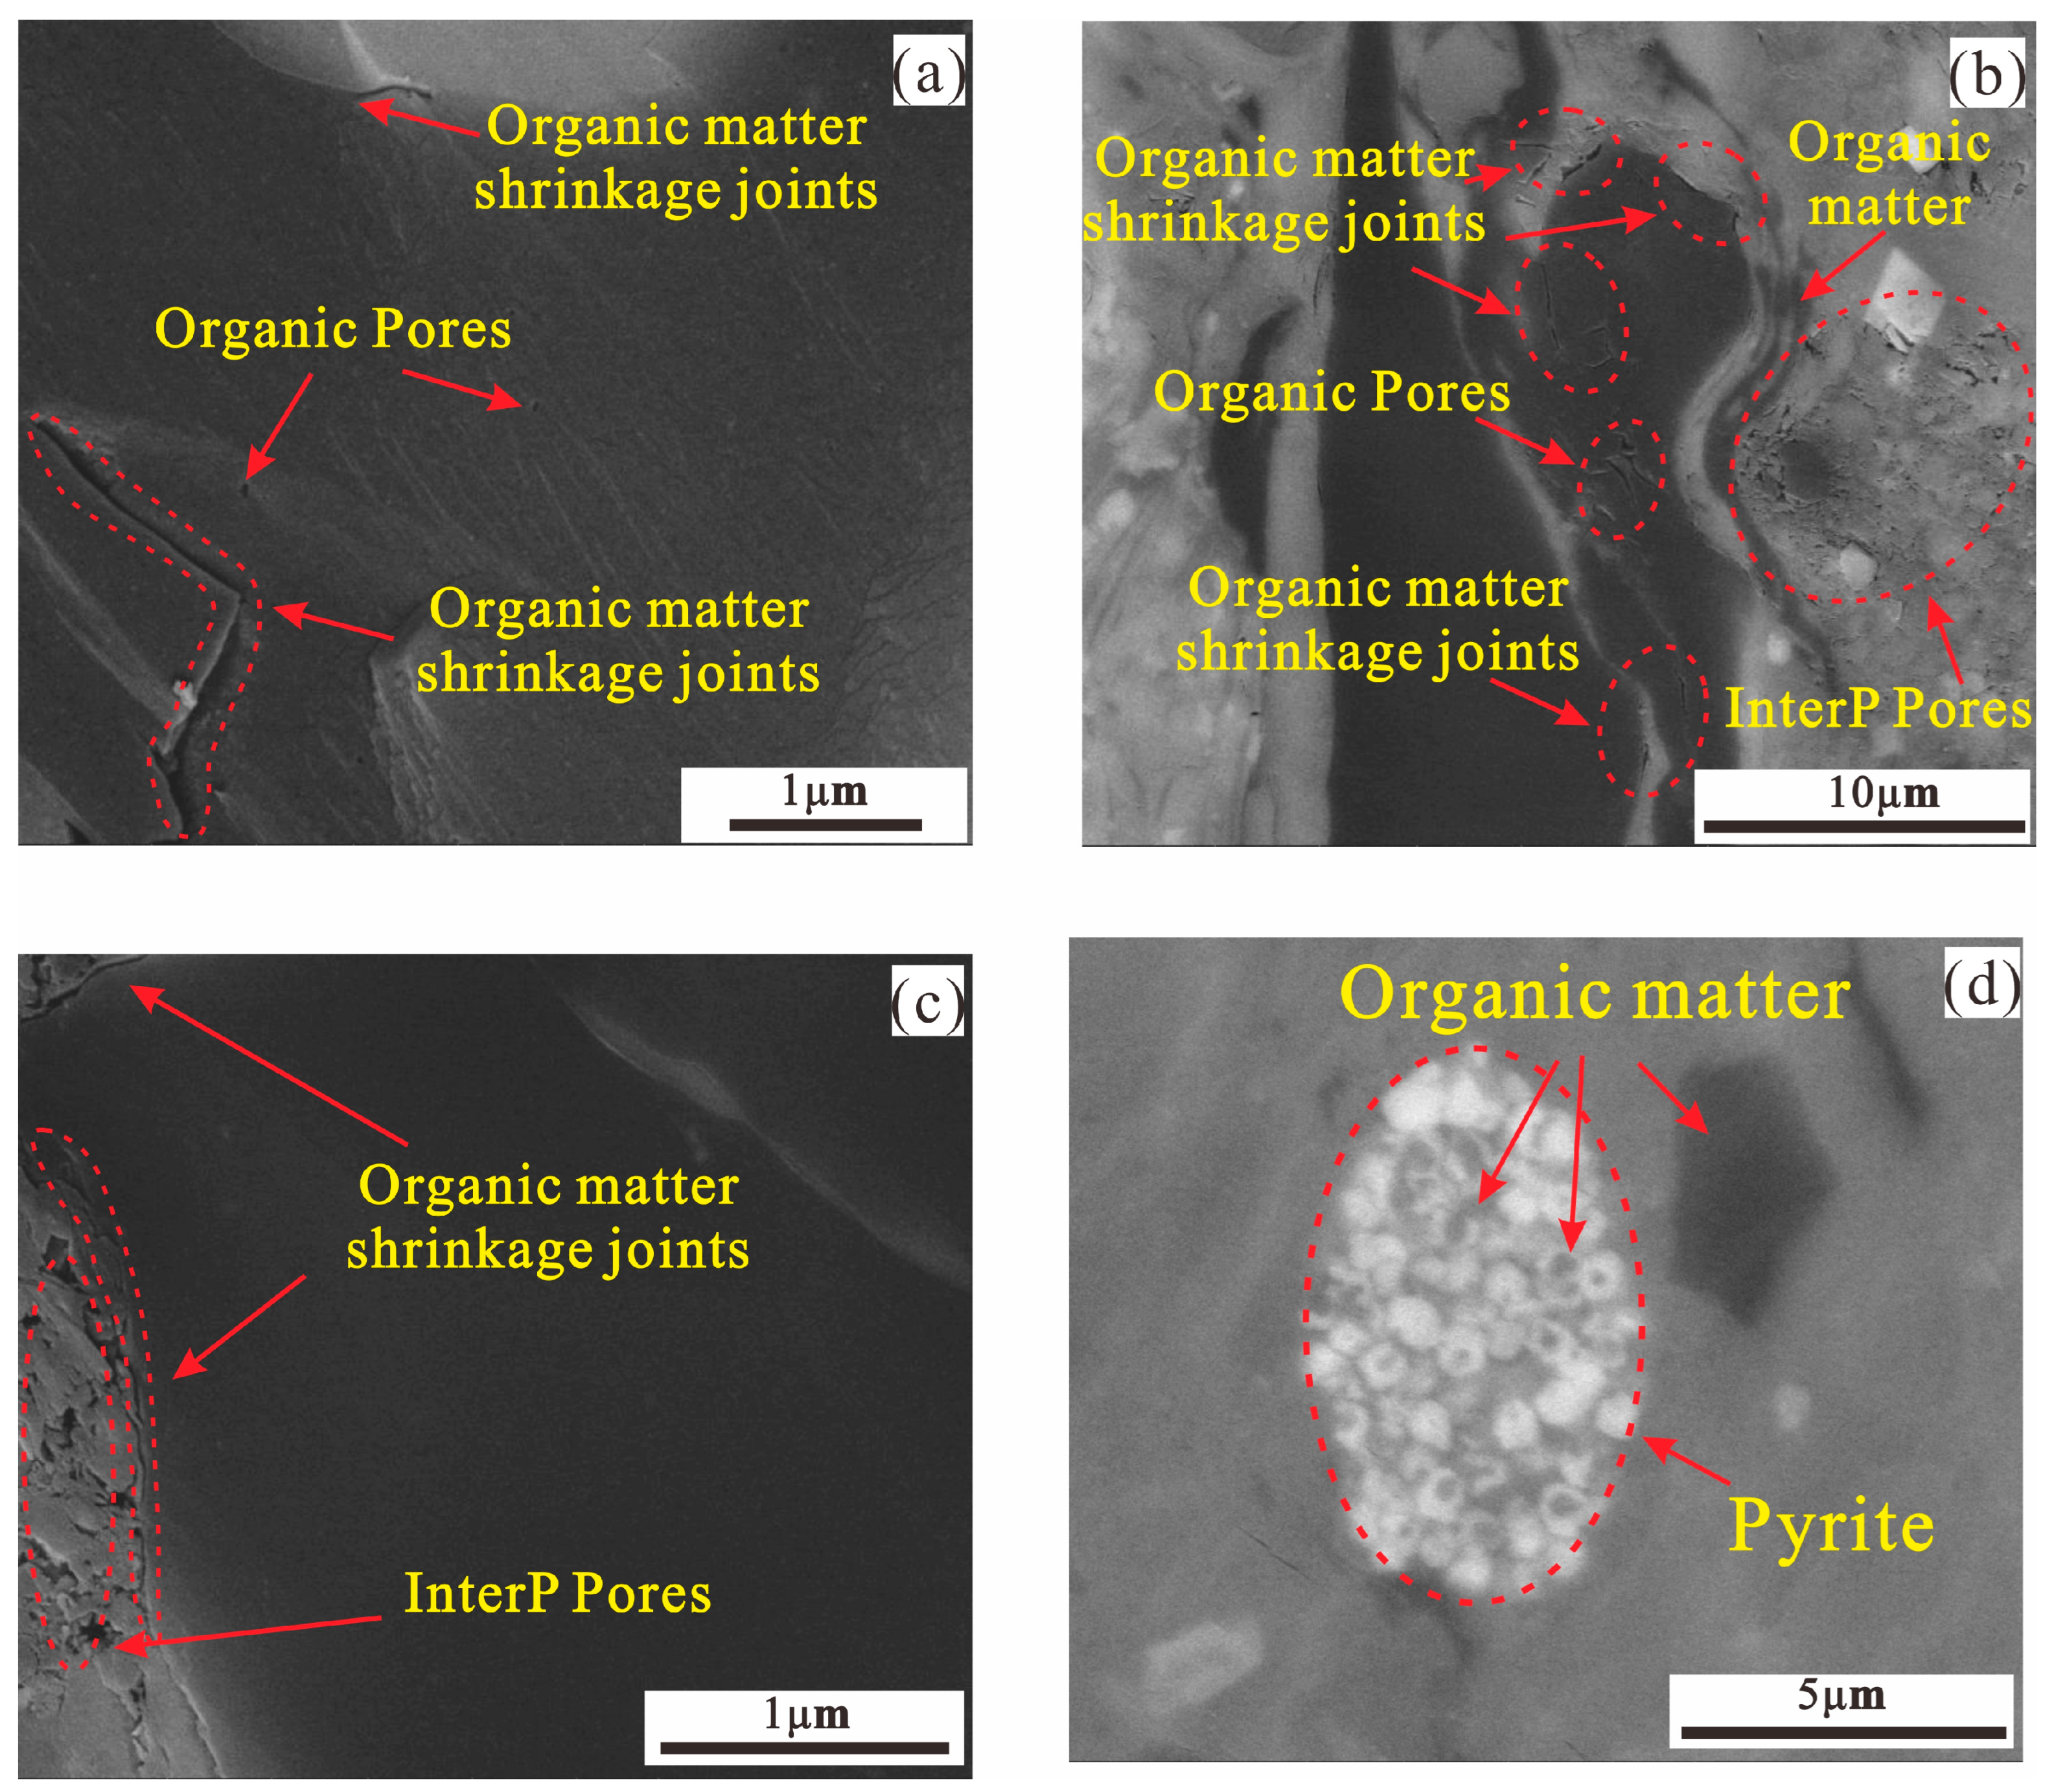
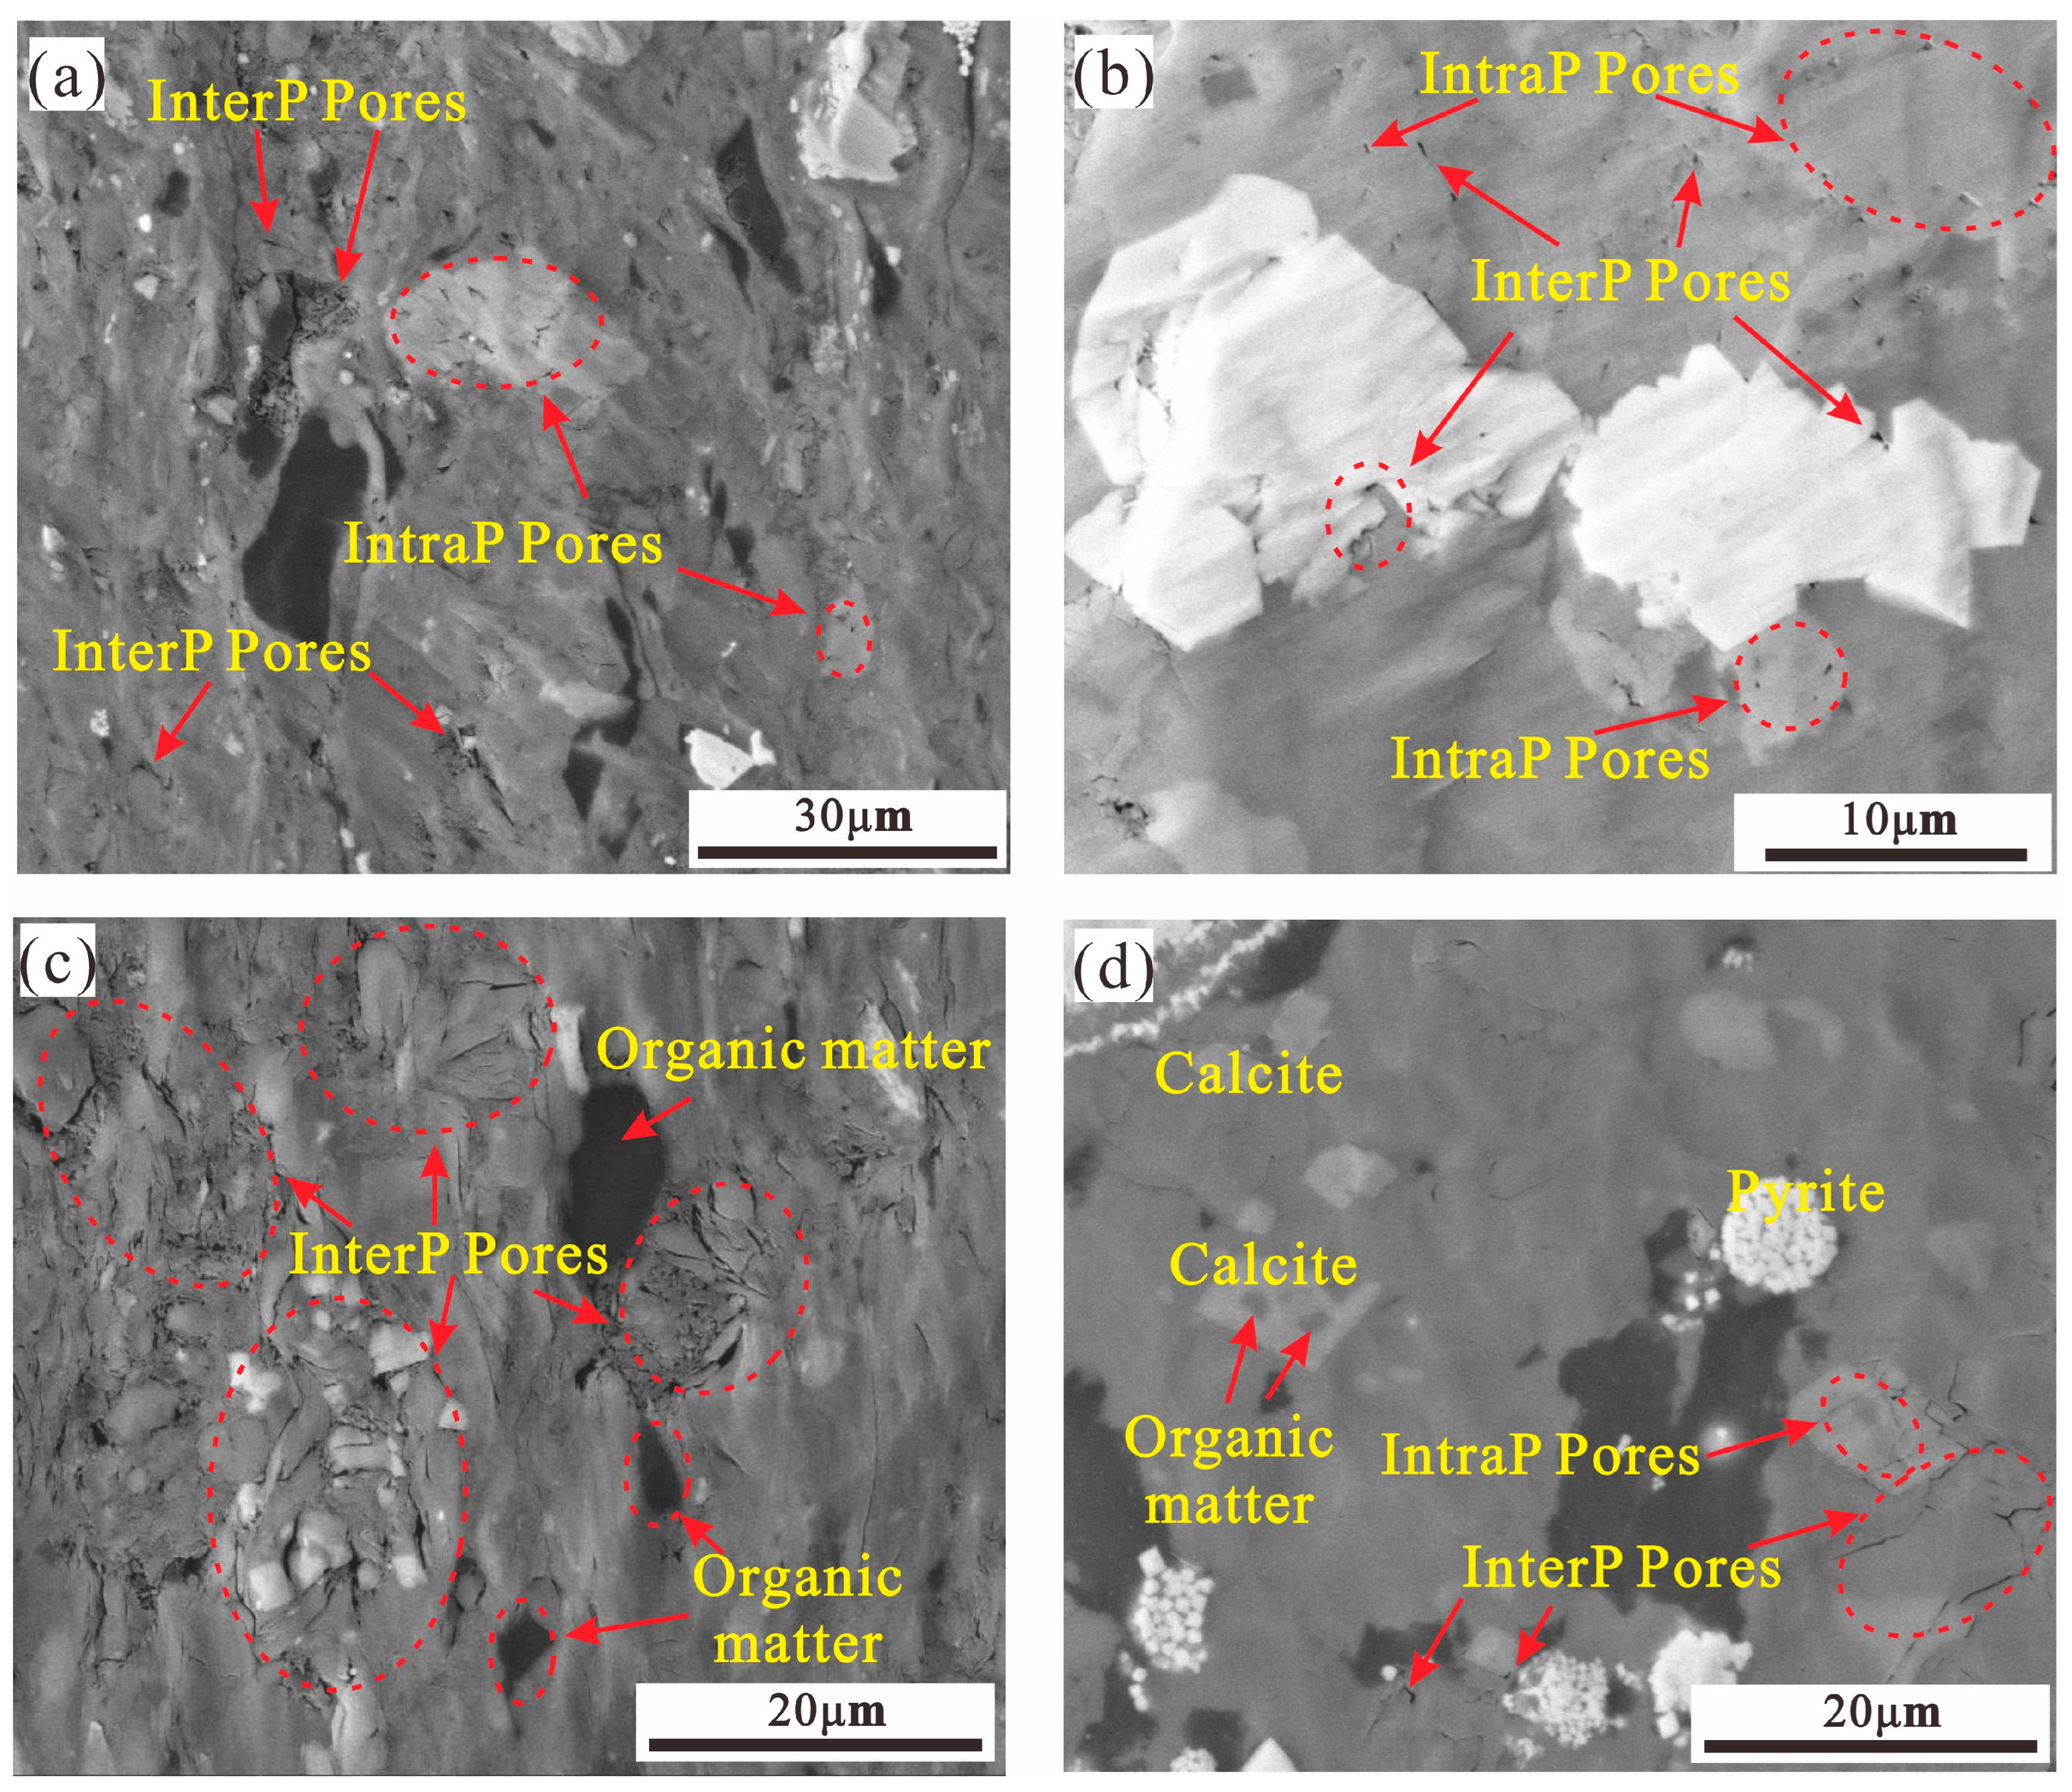
Shale pores are the storage space for gas in shale gas reservoirs, and the microscopic characteristics of the pores largely determine the performance of the shale reservoir [45,46]. According to the genetic mechanism, morphological characteristics, and development location of pores, shale pores can be classified into three categories: inorganic pores, organic pores, and microfractures. Among them, inorganic pores mainly include mineral InterP and IntraP pores [47,48]. The results of SEM show that various pore types develop in the shale samples of the Taiyuan Formation in the SNCB, mainly including organic pores, mineral InterP pores, IntraP pores, and microfractures (Figure 7 and Figure 8).
Organic pores are secondary pores formed during the thermal evolution stage when kerogen is converted into hydrocarbon fluids, primarily developing inside and between organic particles. The organic matter contains nanoscale pores and microfractures, which are small in size and not connected (Figure 7a,b). Some organic matter can fill the InterP pores of strawberry pyrite (Figure 7d), interlayer pores of clay minerals (Figure 7b), and calcite crystals (Figure 8d), forming organic-mineral complexes. The organic matter in these complexes hardly developed internal pores, and some organic matter particles did not develop internal pores (Figure 7c,d).
Some InterP pores are often developed at the edges of mineral particles in the Taiyuan Formation shale (Figure 8). The pore morphology, mostly triangular, banded, or irregular, is controlled by the original pores and diagenesis compaction, and the pore connectivity is good. A small number of IntraP pores develop in the brittle mineral particles (Figure 8a,d). Due to their small pore size and poor connectivity, they have little effect on the enrichment and migration of shale gas. The carbonate unstable minerals develop a small number of dissolution pores due to the influence of acidic fluids (Figure 8b), and these dissolution pores are mostly isolated from each other. The formation of dissolution pores in the gas window has a positive impact on the occurrence of shale gas. Microfractures with various shapes can also be observed in shale samples, primarily shrinkage fractures between clay mineral layers. During the diagenetic process of clay minerals, smectite undergoes a transformation from I/S mixed layer to illite. This transformation is accompanied by dehydration and volume reduction, resulting in shrinkage fractures between clay mineral layers. Additionally, the pore connectivity is good. However, under intense compaction, clay mineral particles are arranged more closely, leading to deformation and closure of pores between them (Figure 8c).

4.5. Pore Structure Characteristics

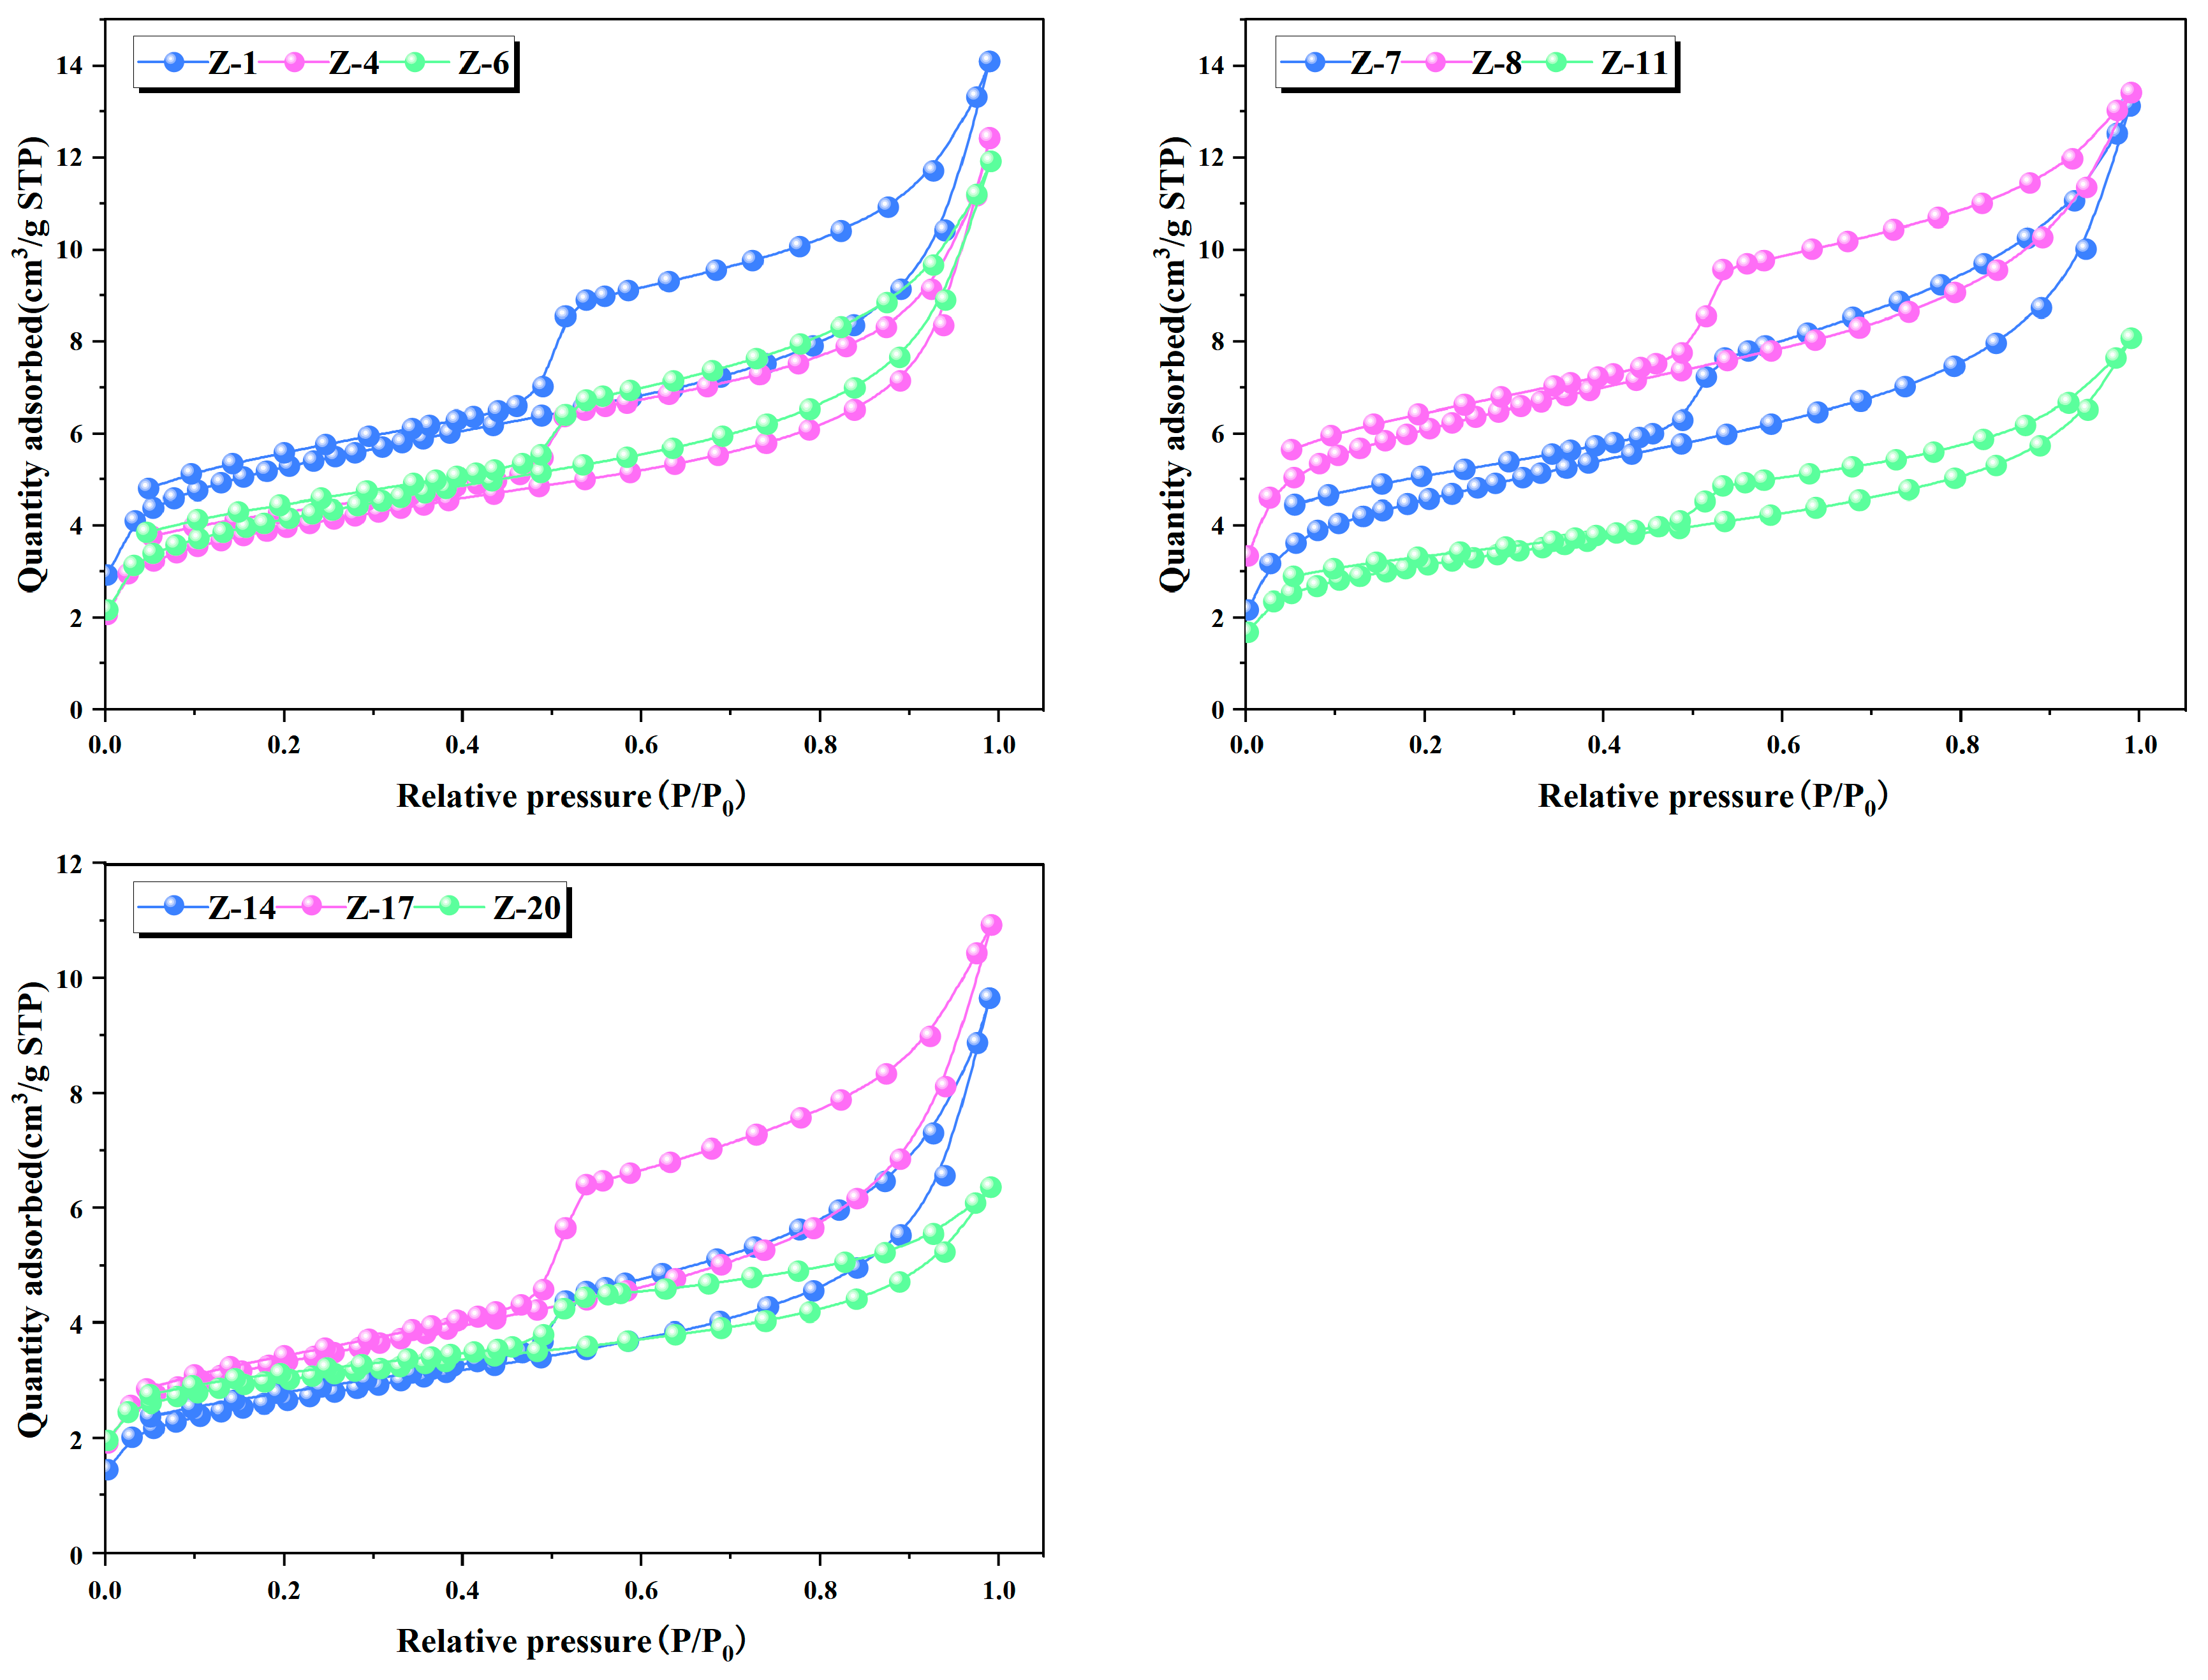
The Taiyuan Formation shale exhibits a highly intricate and varied pore structure characterized by a broad range of PSD. According to the classification system proposed by IUPAC, we can classify these pores into three distinct categories: micropores (λ < 2 nm), mesopores (λ = 2~50 nm), and macropores (λ > 50 nm) [49]. Based on the categorization of adsorption curves by IUPAC and the characteristics of hysteresis loops, the nitrogen adsorption curves of shale exhibit similarities with type IV adsorption curves while predominantly featuring H3 and H4 hysteresis loops (Figure 9). First, the H4 hysteresis loop includes Z-11 and Z-20. The adsorption curve slowly increases. The adsorption and desorption curves overlap when P/P0 is less than 0.5. When P/P0 is between 0.5 and 1.0, the hysteresis loops are narrow with a slight inflection point at P/P0 = 0.5, indicating the presence of fine bottlenecks and slit/wedge pores in the shales.
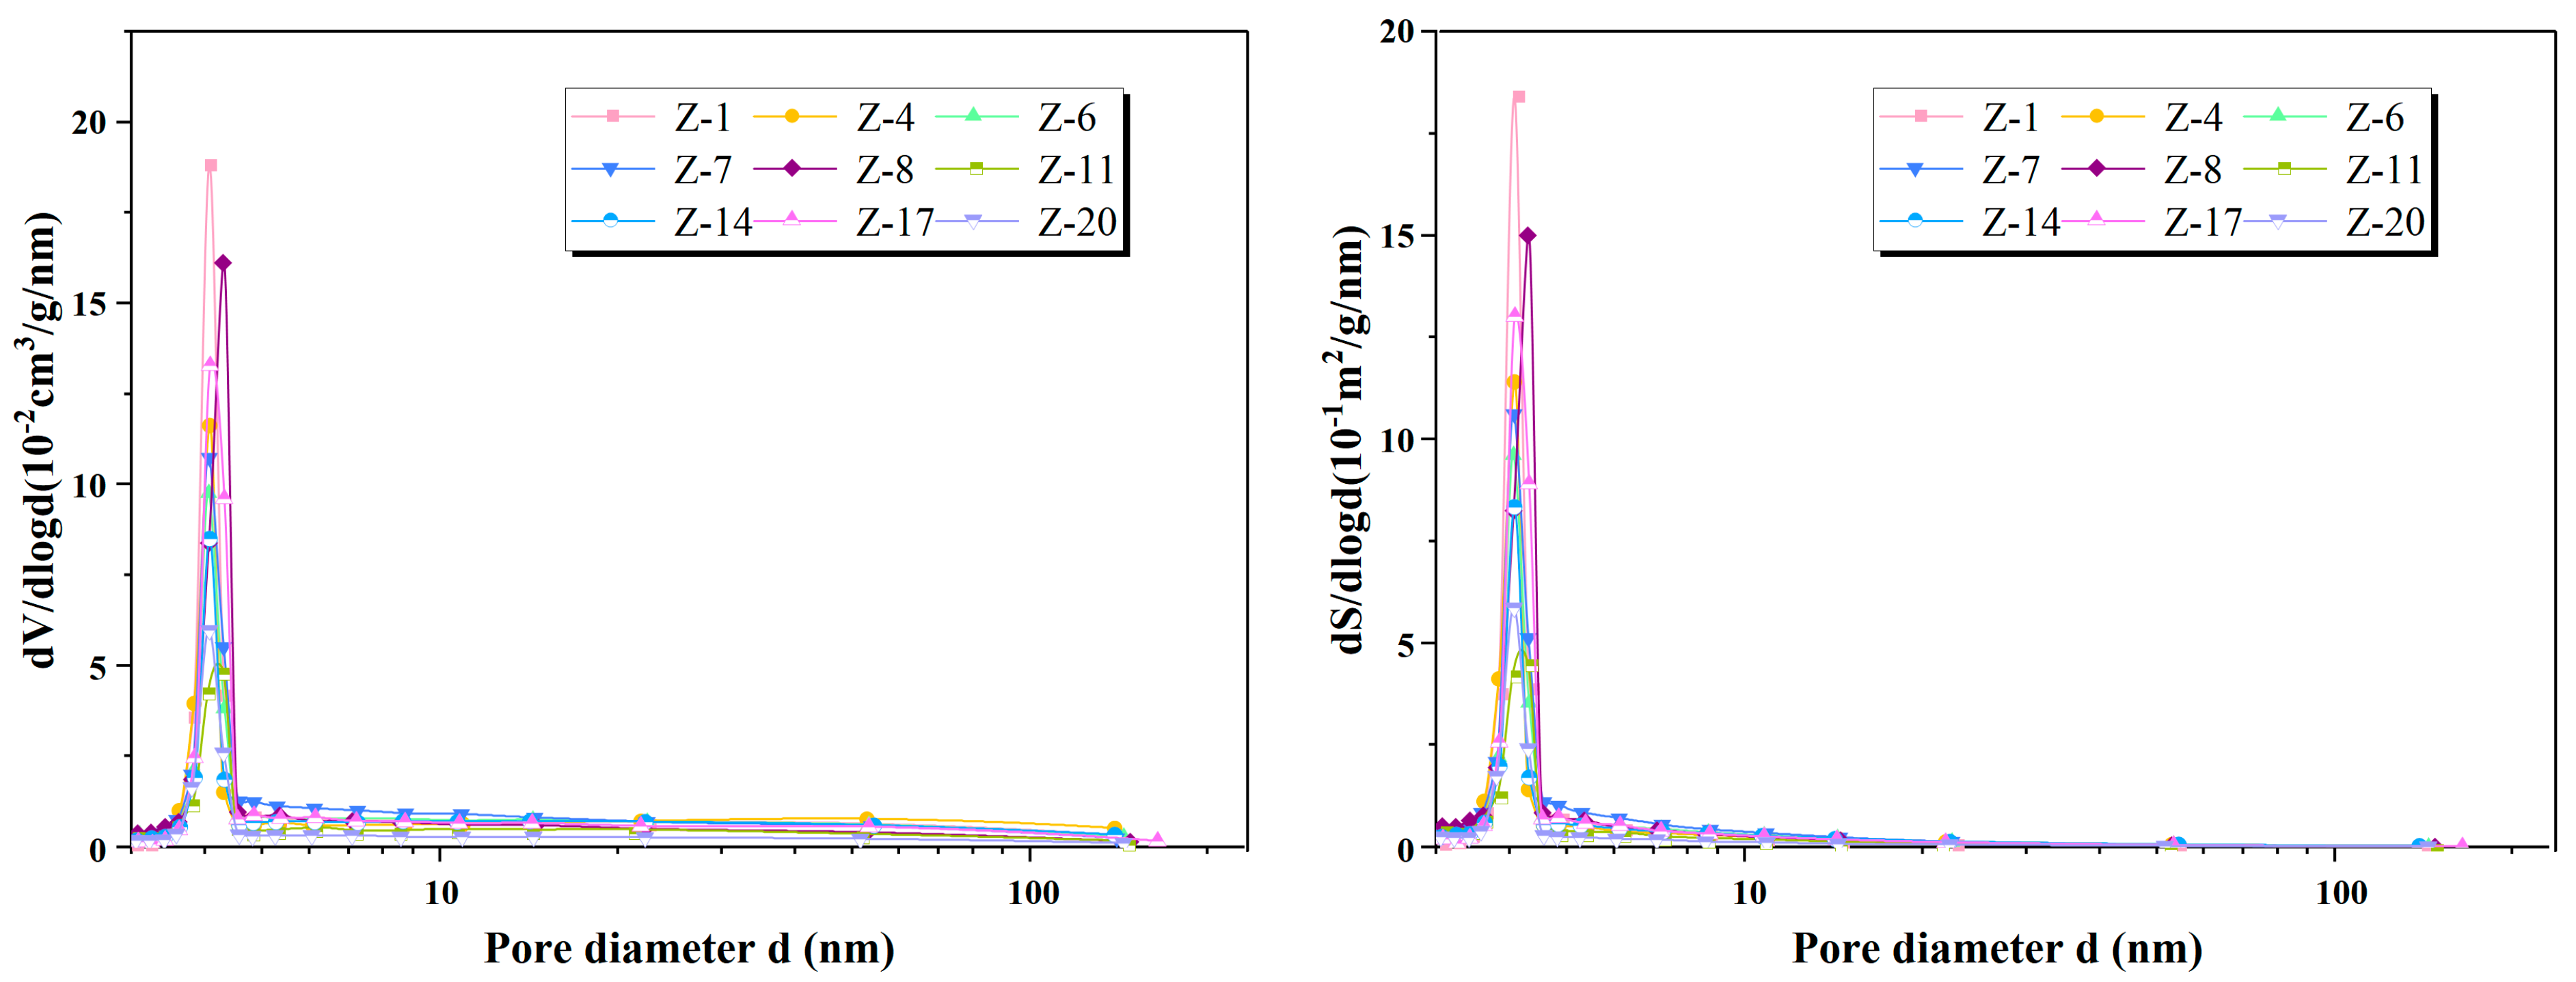
The SSA of Taiyuan Formation shale in SNCB ranges from 9.47 to 22.14 m2/g, with an average of 14.51 m2/g, according to the BET method calculation results. The PV and PSD characteristics of shale samples are analyzed based on the calculation results of BJH theory (Table 3, Figure 10). The total PV varies between 0.0098 and 0.022 cm3/g, with an average of 0.017 cm3/g. The APS varies between 3.59 and 6.30 nm, with an average of 4.84 nm. The PV and SSA distribution of shale is unimodal, with a peak value at 2–5 nm, indicating that the predominant micropores are mesoporous, and the main contribution to SSA comes from pores sized between 2 and 5 nm. The development of nanoscale pores within shale facilitates efficient storage of shale gas by providing sufficient space for gas adsorption.

4.6. Methane Adsorption Characteristics

The methane adsorption test underestimates the actual adsorption capacity because it ignores the volume of the adsorption phase, and direct measurement of the actual adsorption capacity of methane is not possible. The measured gas adsorption volume is referred to as excess adsorption volume. Therefore, the influence of the adsorption phase volume must be considered to accurately calculate the absolute adsorption volume. Rexer et al. modified the binary Langmuir adsorption model by considering the adsorption phase density as a variable and proposed a ternary Langmuir model [50]. Through nonlinear fitting, the excess adsorption volume was used to directly obtain the Langmuir volume and Langmuir pressure. The equation of the ternary Langmuir model is:
V e x = V L × P P L + P 1 ρ g ρ a
where P is the equilibrium pressure, MPa; Vex is the excess adsorption volume at P, cm3/g; PL is the Langmuir pressure, MPa; VL is the Langmuir volume, cm3/g; ρg is the methane density at P, g/cm3; ρa is the density of methane adsorption phase, g/cm3.
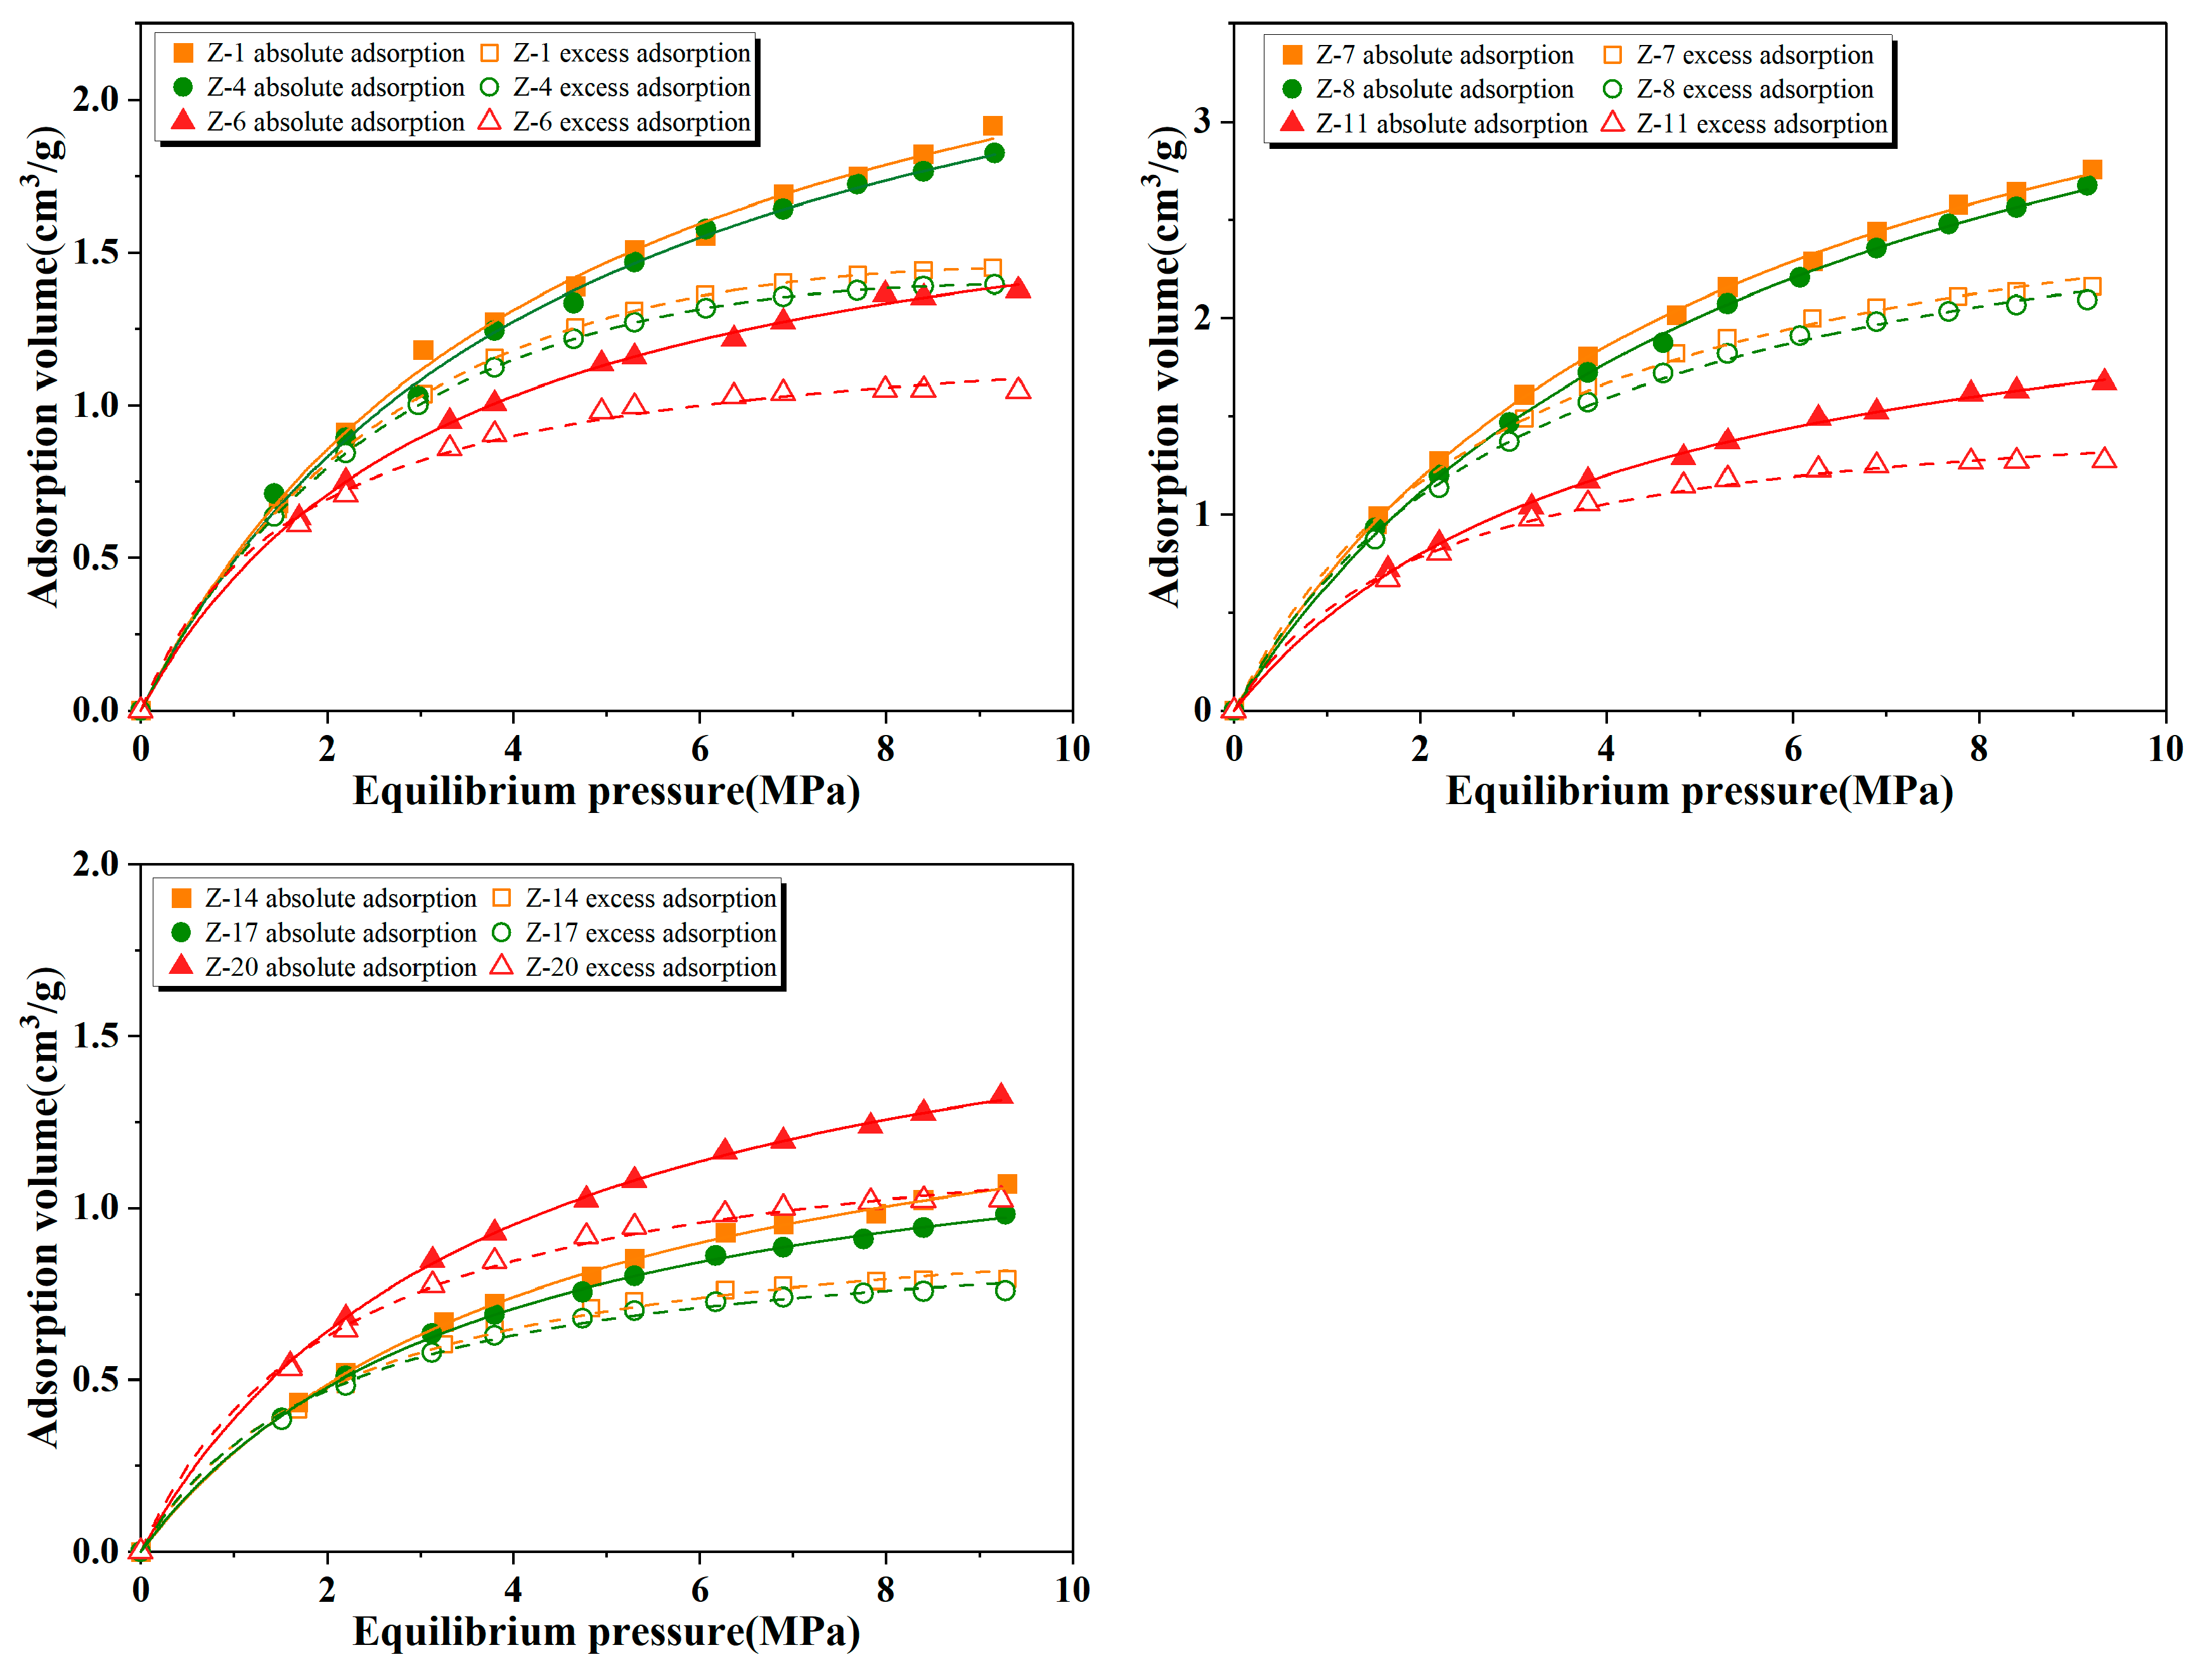
The adsorption curves of shale samples at 90 °C under pressures ranging from 0 to 10 MPa are presented in Figure 11, illustrating the excess and absolute adsorption of CH4. Upon comparing these two curves, it is evident that the CH4 adsorption volume experiences a rapid increase with increasing pressure at low levels (0–3 MPa). Moreover, there is minimal disparity between the excess and absolute adsorption volumes. As the pressure exceeds 4 MPa, the CH4 adsorption volume continues to rise but at a slower pace, while the difference between excess and absolute adsorption volumes becomes more pronounced. Conversely, the absolute adsorption volume significantly surpasses the excess adsorption volume, with this distinction gradually widening. It is crucial to adjust the excess adsorption curve according to formation pressure and temperature when estimating actual methane adsorption capacity under formation conditions. Failure to do so may lead to an underestimation of geological reserves for shale gas [51]. The shale samples exhibit VL fitted by Vex within a range of 1.35 to 4.30 cm3/g and an average value of 2.57 cm3/g. PL varies from 3.34 to 5.70 MPa, with an average value of 4.35 MPa (Table 3).

5. Discussion

5.1. Effect of Organic Matter Characteristics on Shale Adsorption Capacity

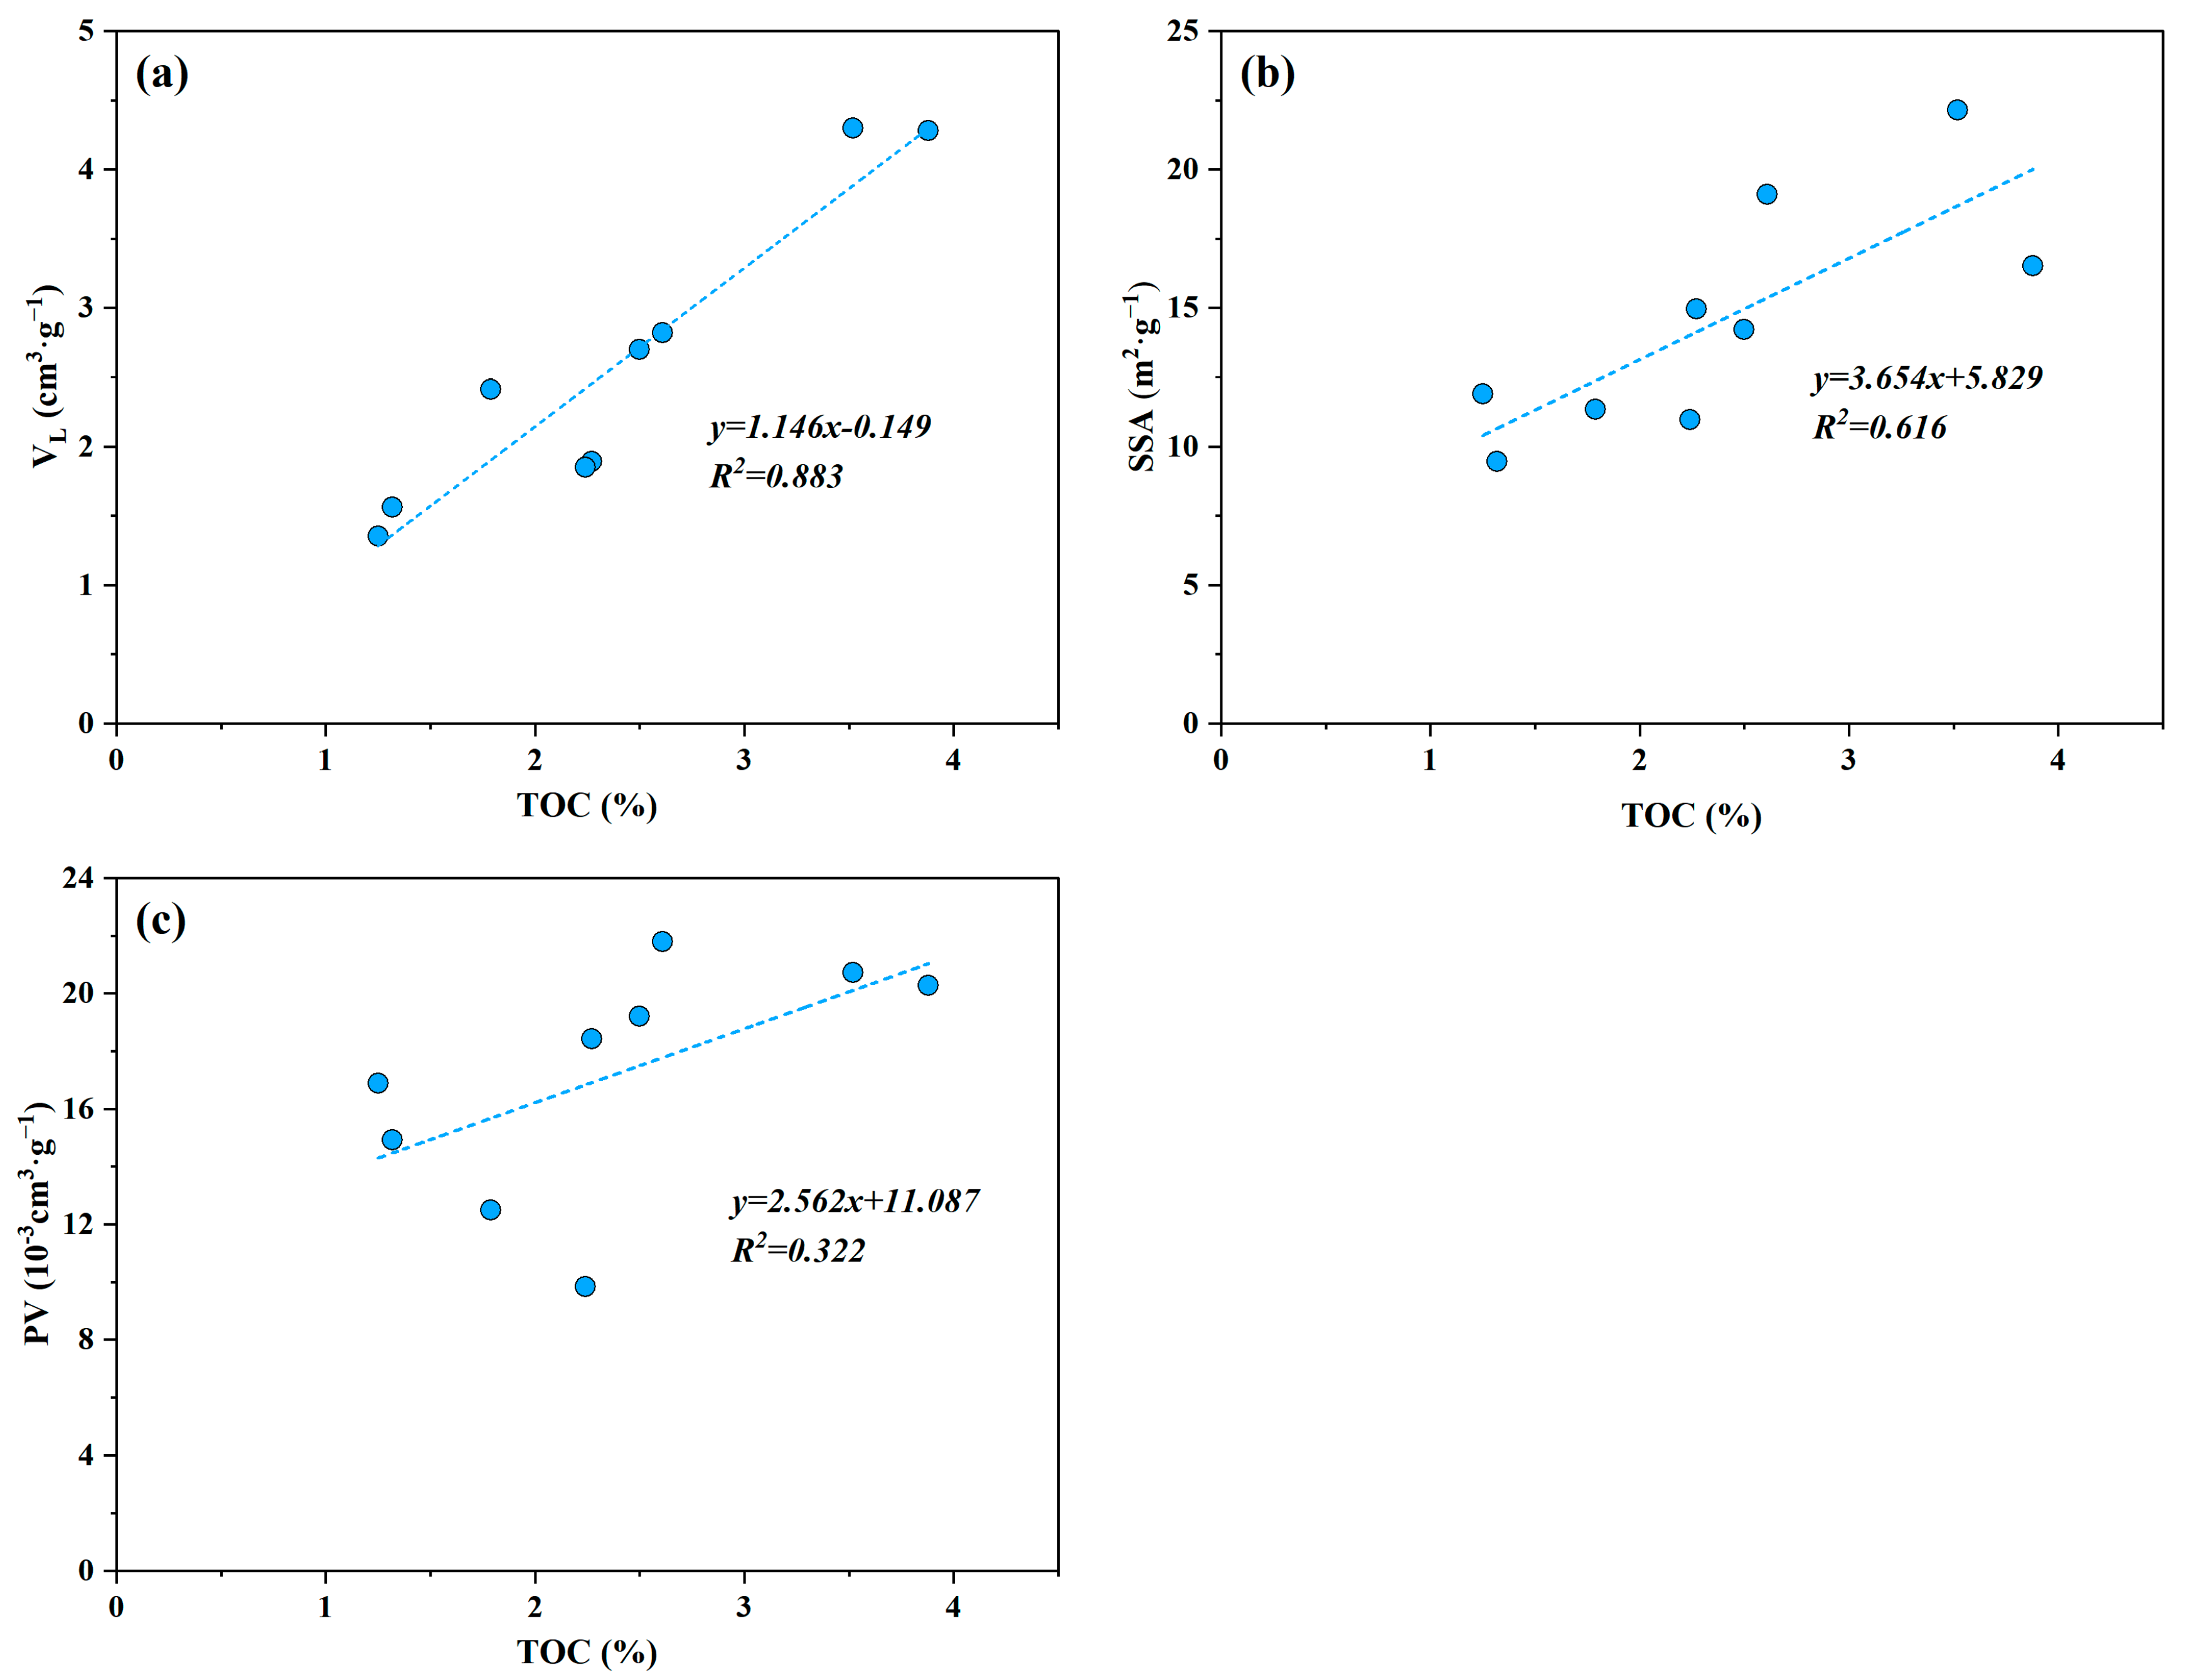
The abundance of organic matter is an important indicator for evaluating the pore development and the adsorption gas content in highly over-mature shale. Organic matter is the material basis for the formation of a nanoscale pore network. It possesses strong adsorption capacity, with its surface and internal pores being the main sites for gas adsorption [52]. From the correlation between VL and TOC of shale (Figure 12a), there is a significant positive correlation between VL and TOC, with a correlation coefficient of 0.883. This indicates that the CH4 absolute adsorption volume increases with the increase of TOC content of shale, which is consistent with previous research findings [23,48]. Meanwhile, through the analysis of the correlation between TOC and total PV as well as pore SSA in shale (Figure 12b,c), there is a positive correlation between TOC and SSA, with a correlation coefficient of 0.616. Additionally, TOC exhibits a weak positive correlation with total PV, with a correlation coefficient of 0.322. These findings indicate a significant coupling relationship among hydrocarbon generation, pore increase, and gas storage in shale. During the process of shale gas reservoirs, numerous nanoscale pores are formed within organic matter due to hydrocarbon generation and discharge. The higher the organic matter abundance in shale, the more developed the organic pores, and the increased pore SSA can provide more adsorption sites for CH4, thus effectively improving the shale adsorption capacity.
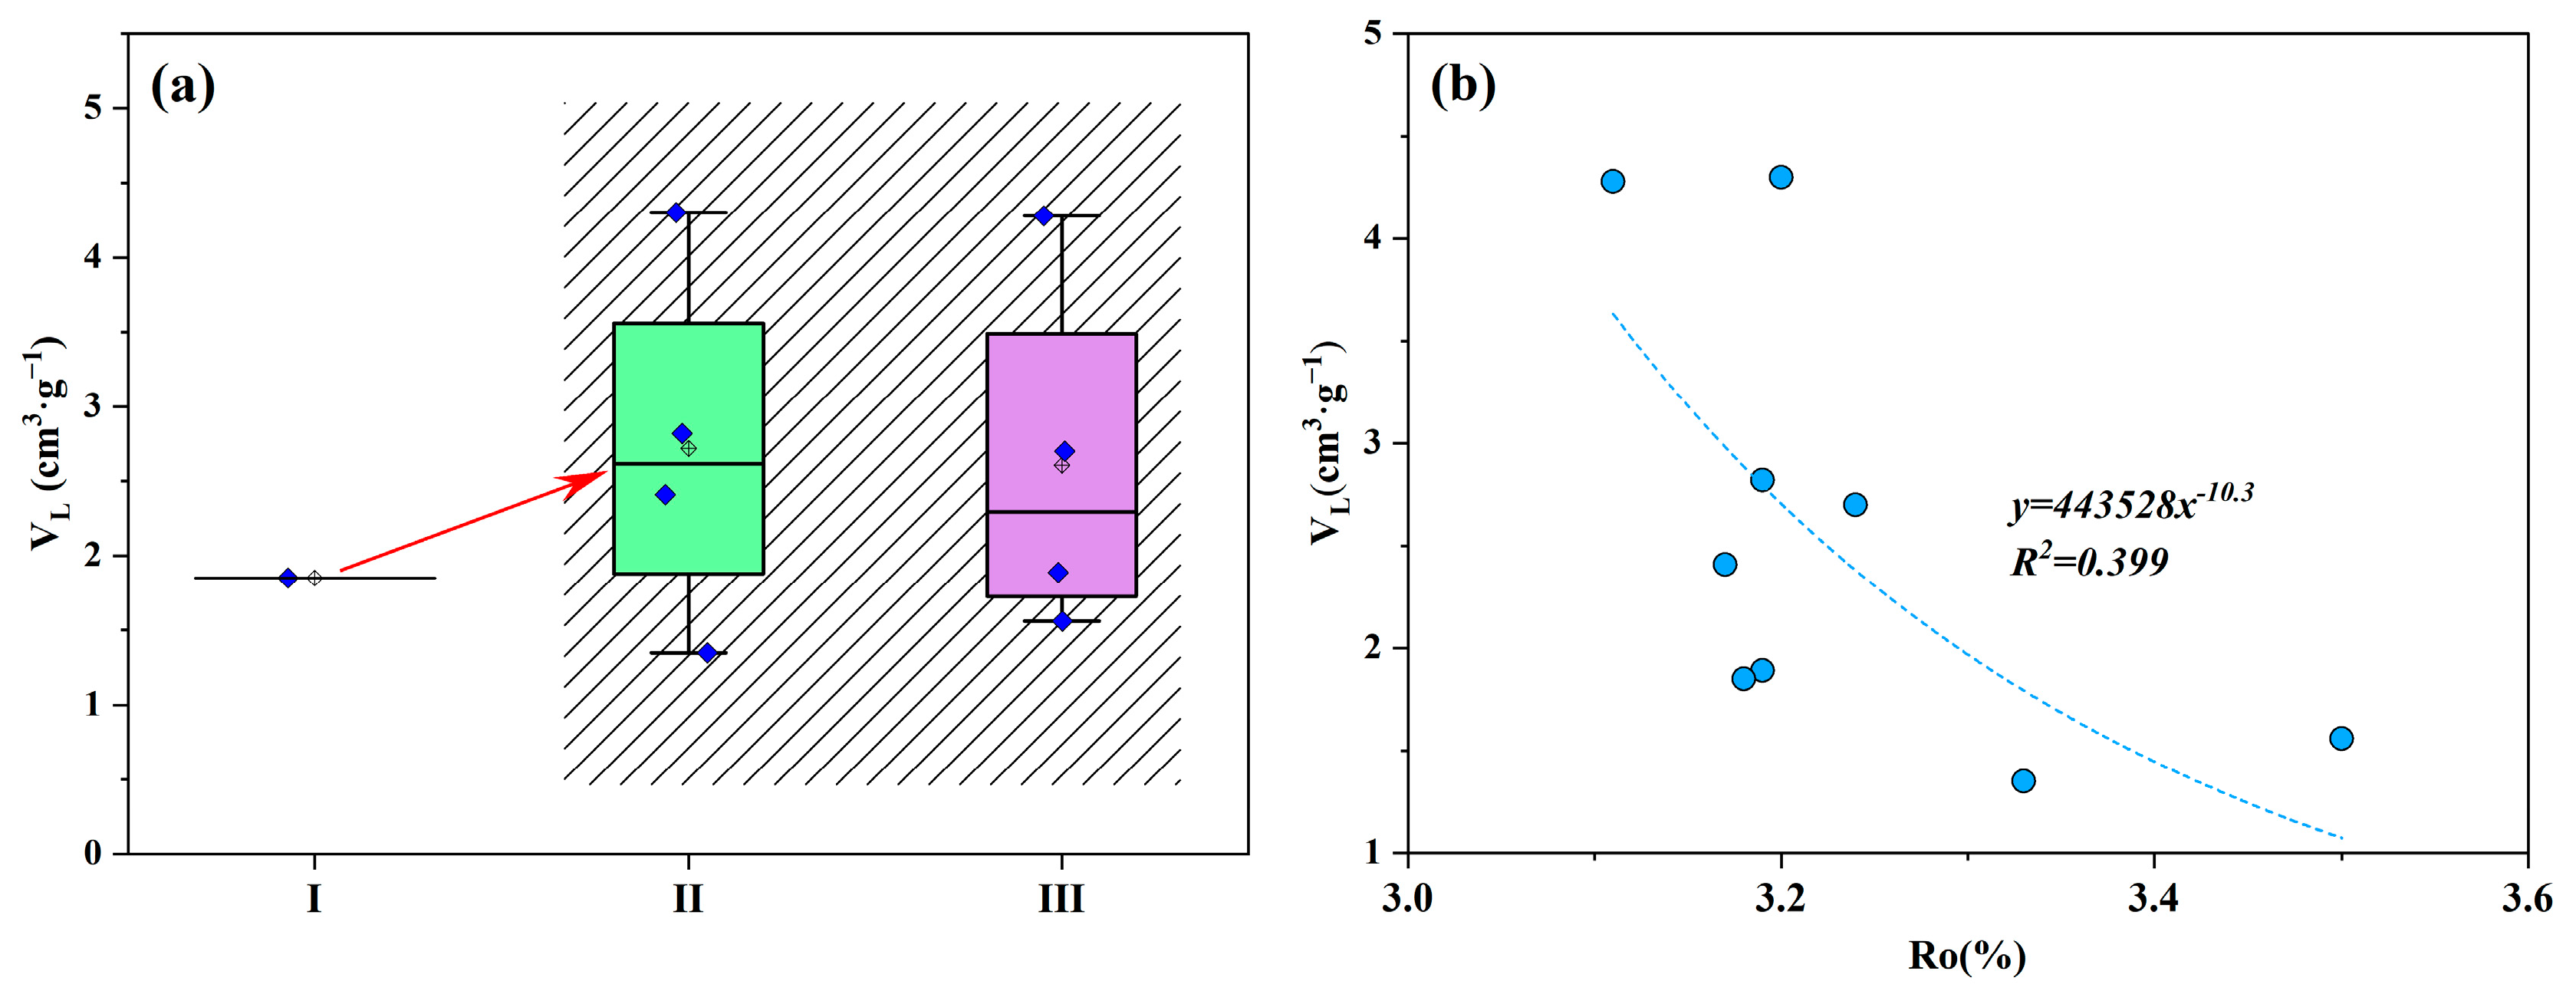
Different types of organic matter possess varying chemical structures in shale, which impact the shale adsorption capacity. It can be observed from the experimental results of methane adsorption in shale with different types of organic matter that the organic matter exhibits the weakest adsorption capacity with type I kerogen (Figure 13a), while the organic matter has strong adsorption capacity with type II and III kerogen, with little difference between them. This is primarily attributed to the different macerals and microstructures of various types of organic matter. Compared to type I, the organic matter with type III kerogen has a higher vitrinite content and more aromatic structures, both of which exhibit a stronger affinity for CH4, therefore enhancing shale adsorption capacity [19]. Although the adsorption capacity of organic matter with type III kerogen is stronger, its hydrocarbon generation capacity and potential for developing organic pores are poor, and almost no organic pores are developed during the thermal evolution process. In contrast, organic matter with type II kerogen has significant hydrocarbon generation potential and is easily able to develop organic pores [53]. Therefore, the adsorption capacity of organic matter with type II kerogen is slightly stronger than that of organic matter with type III kerogen in the study area. However, due to the high maturity of the Taiyuan Formation shale in the SNCB, which is in the stage of cracking and gas generation, the difference in organic matter type does not have a significant effect on shale adsorption capacity [19].
The organic maturity affects the development of organic pores in shale, therefore influencing the shale adsorption capacity. Most researchers believe that with the increase of organic maturity, the organic pores become more developed in shale, and the aromatization of organic matter gradually enhances, resulting in an enhancement of shale adsorption capacity [54,55]. Through the correlation between organic maturity and VL, the absolute adsorption volume of shale decreases with the increase in organic maturity. This is because as the evolution stage progresses into the high-over maturity stage and the burial depth increases, it inhibits the development of shale organic pores. Additionally, solid asphalt and oil formed in the early stages fill some organic pores, therefore reducing pore connectivity and limiting space for shale gas occurrence. As a result, there is a decrease in shale adsorption capacity, indicating that organic maturity has a certain influence on shale adsorption capacity from the Taiyuan Formation in the SNCB (Figure 13b).

5.2. Effect of Pore Structure on Shale Adsorption Capacity

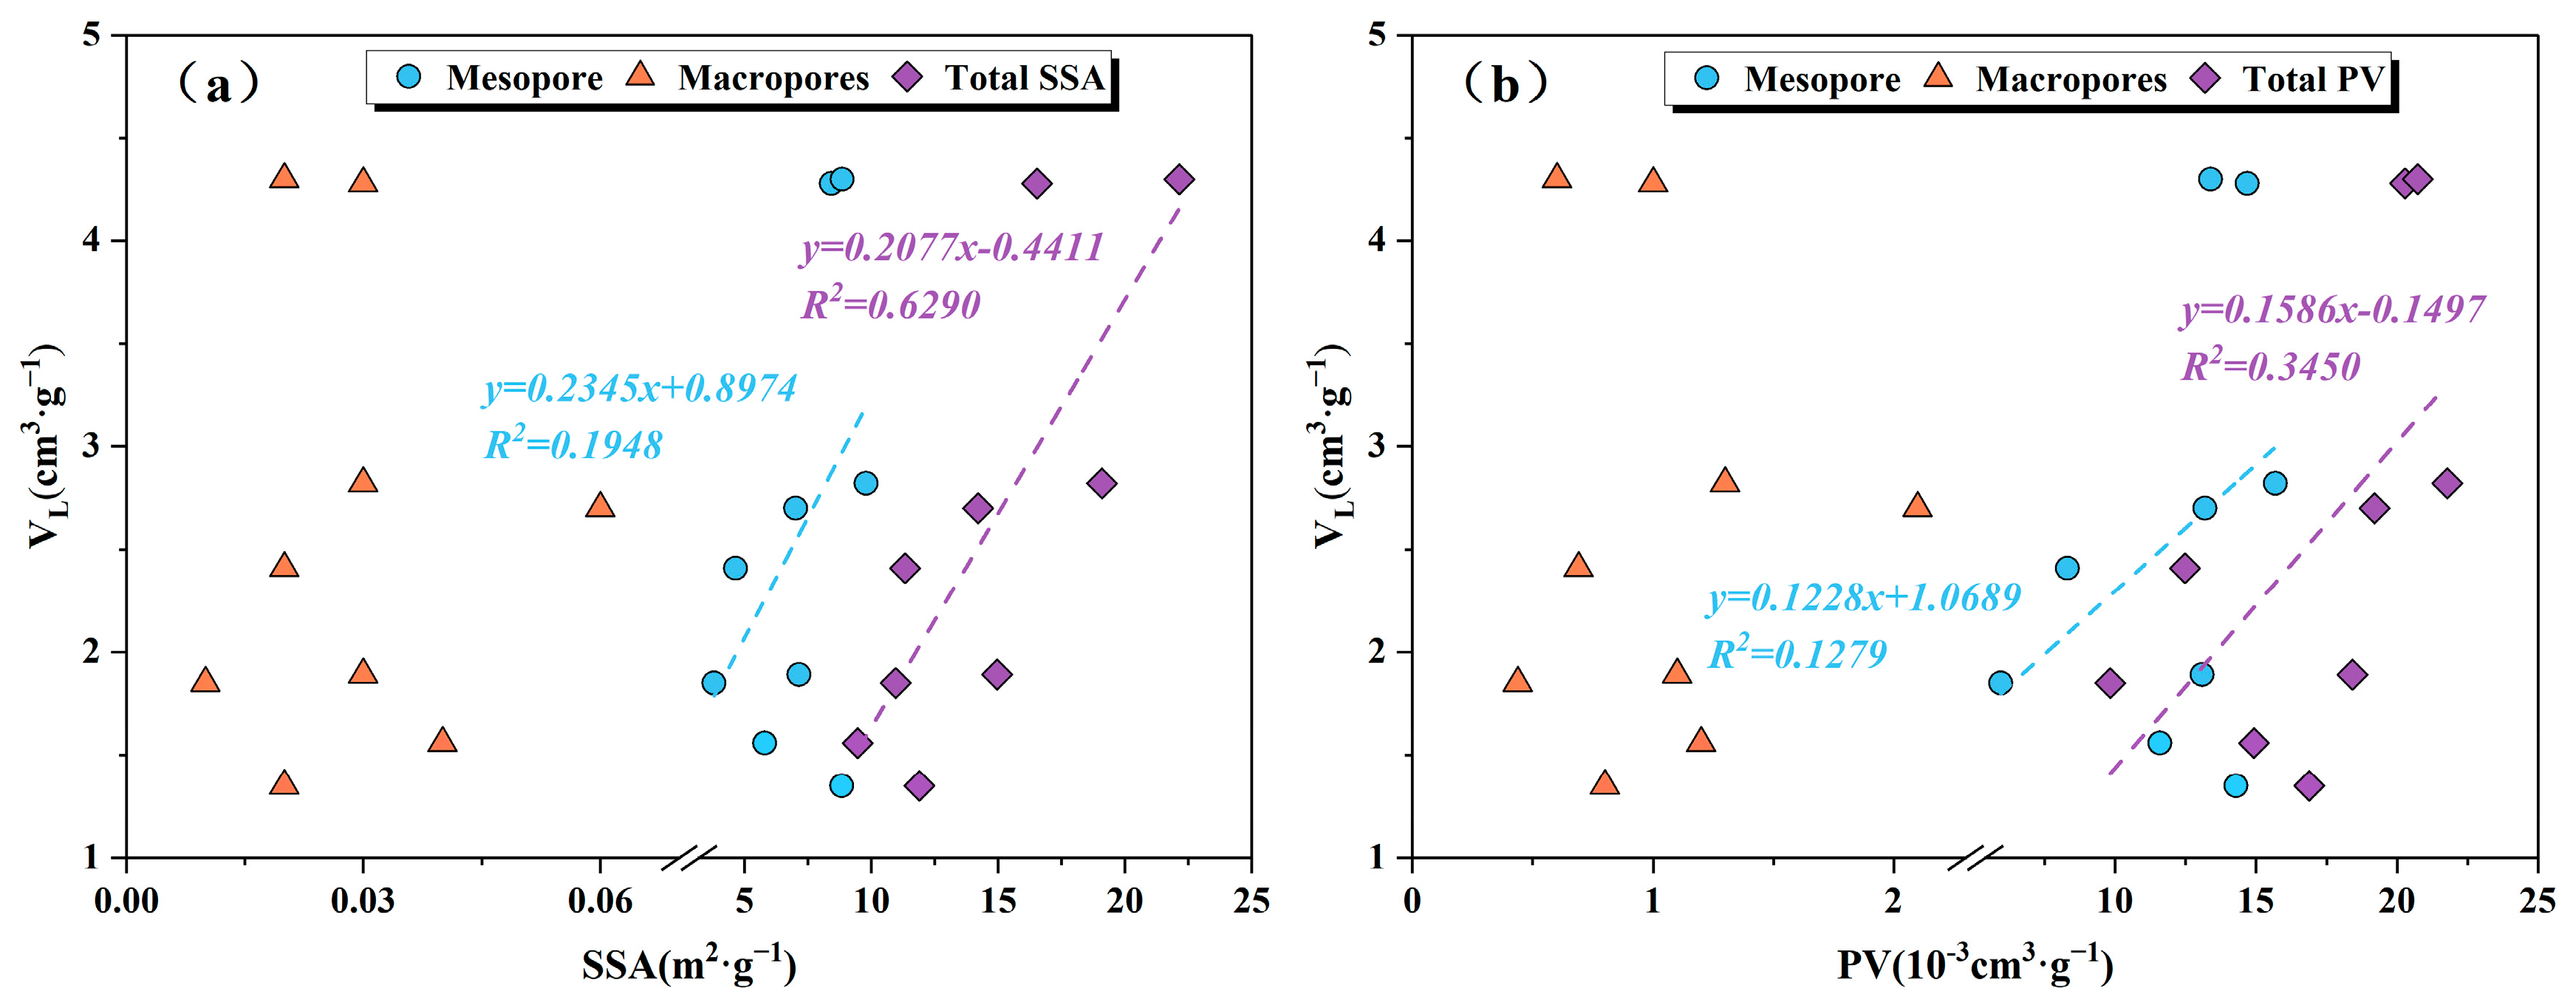
The pore structure characteristics of shale affect the occurrence state of shale gas and are also key factors affecting shale adsorption capacity [55]. The correlation between pore structure parameters and VL of Taiyuan Formation shale was analyzed, leading to the conclusion that the relationship between shale adsorption capacity and pore structure parameters is significantly weaker compared to that with organic matter. Specifically, VL shows a strong positive correlation with total pore SSA and a weak positive correlation with total PV, with respective correlation coefficients of 0.6290 and 0.3450. Macroporous PV and SSA do not show a significant correlation with VL, while mesoporous PV and SSA exhibit a weak positive correlation with VL (Figure 14). Research shows that the greater the total PV and SSA of shale in the Taiyuan Formation, the stronger the shale adsorption capacity. The main reason is that the adsorption of shale gas molecules is a physical process, and it has a certain effective range for adsorption. Meanwhile, macropores in shale primarily serve as storage spaces for free gas and act as migration channels for shale gas [56]. The mesopores are widely developed in the pores of the Taiyuan Formation shale, providing the main PV and SSA for the shale. This increases the number of adsorption sites on its surface and provides the primary storage space for gas adsorption, therefore enhancing the shale adsorption capacity.

5.3. Effect of Mineral Composition on Shale Adsorption Capacity

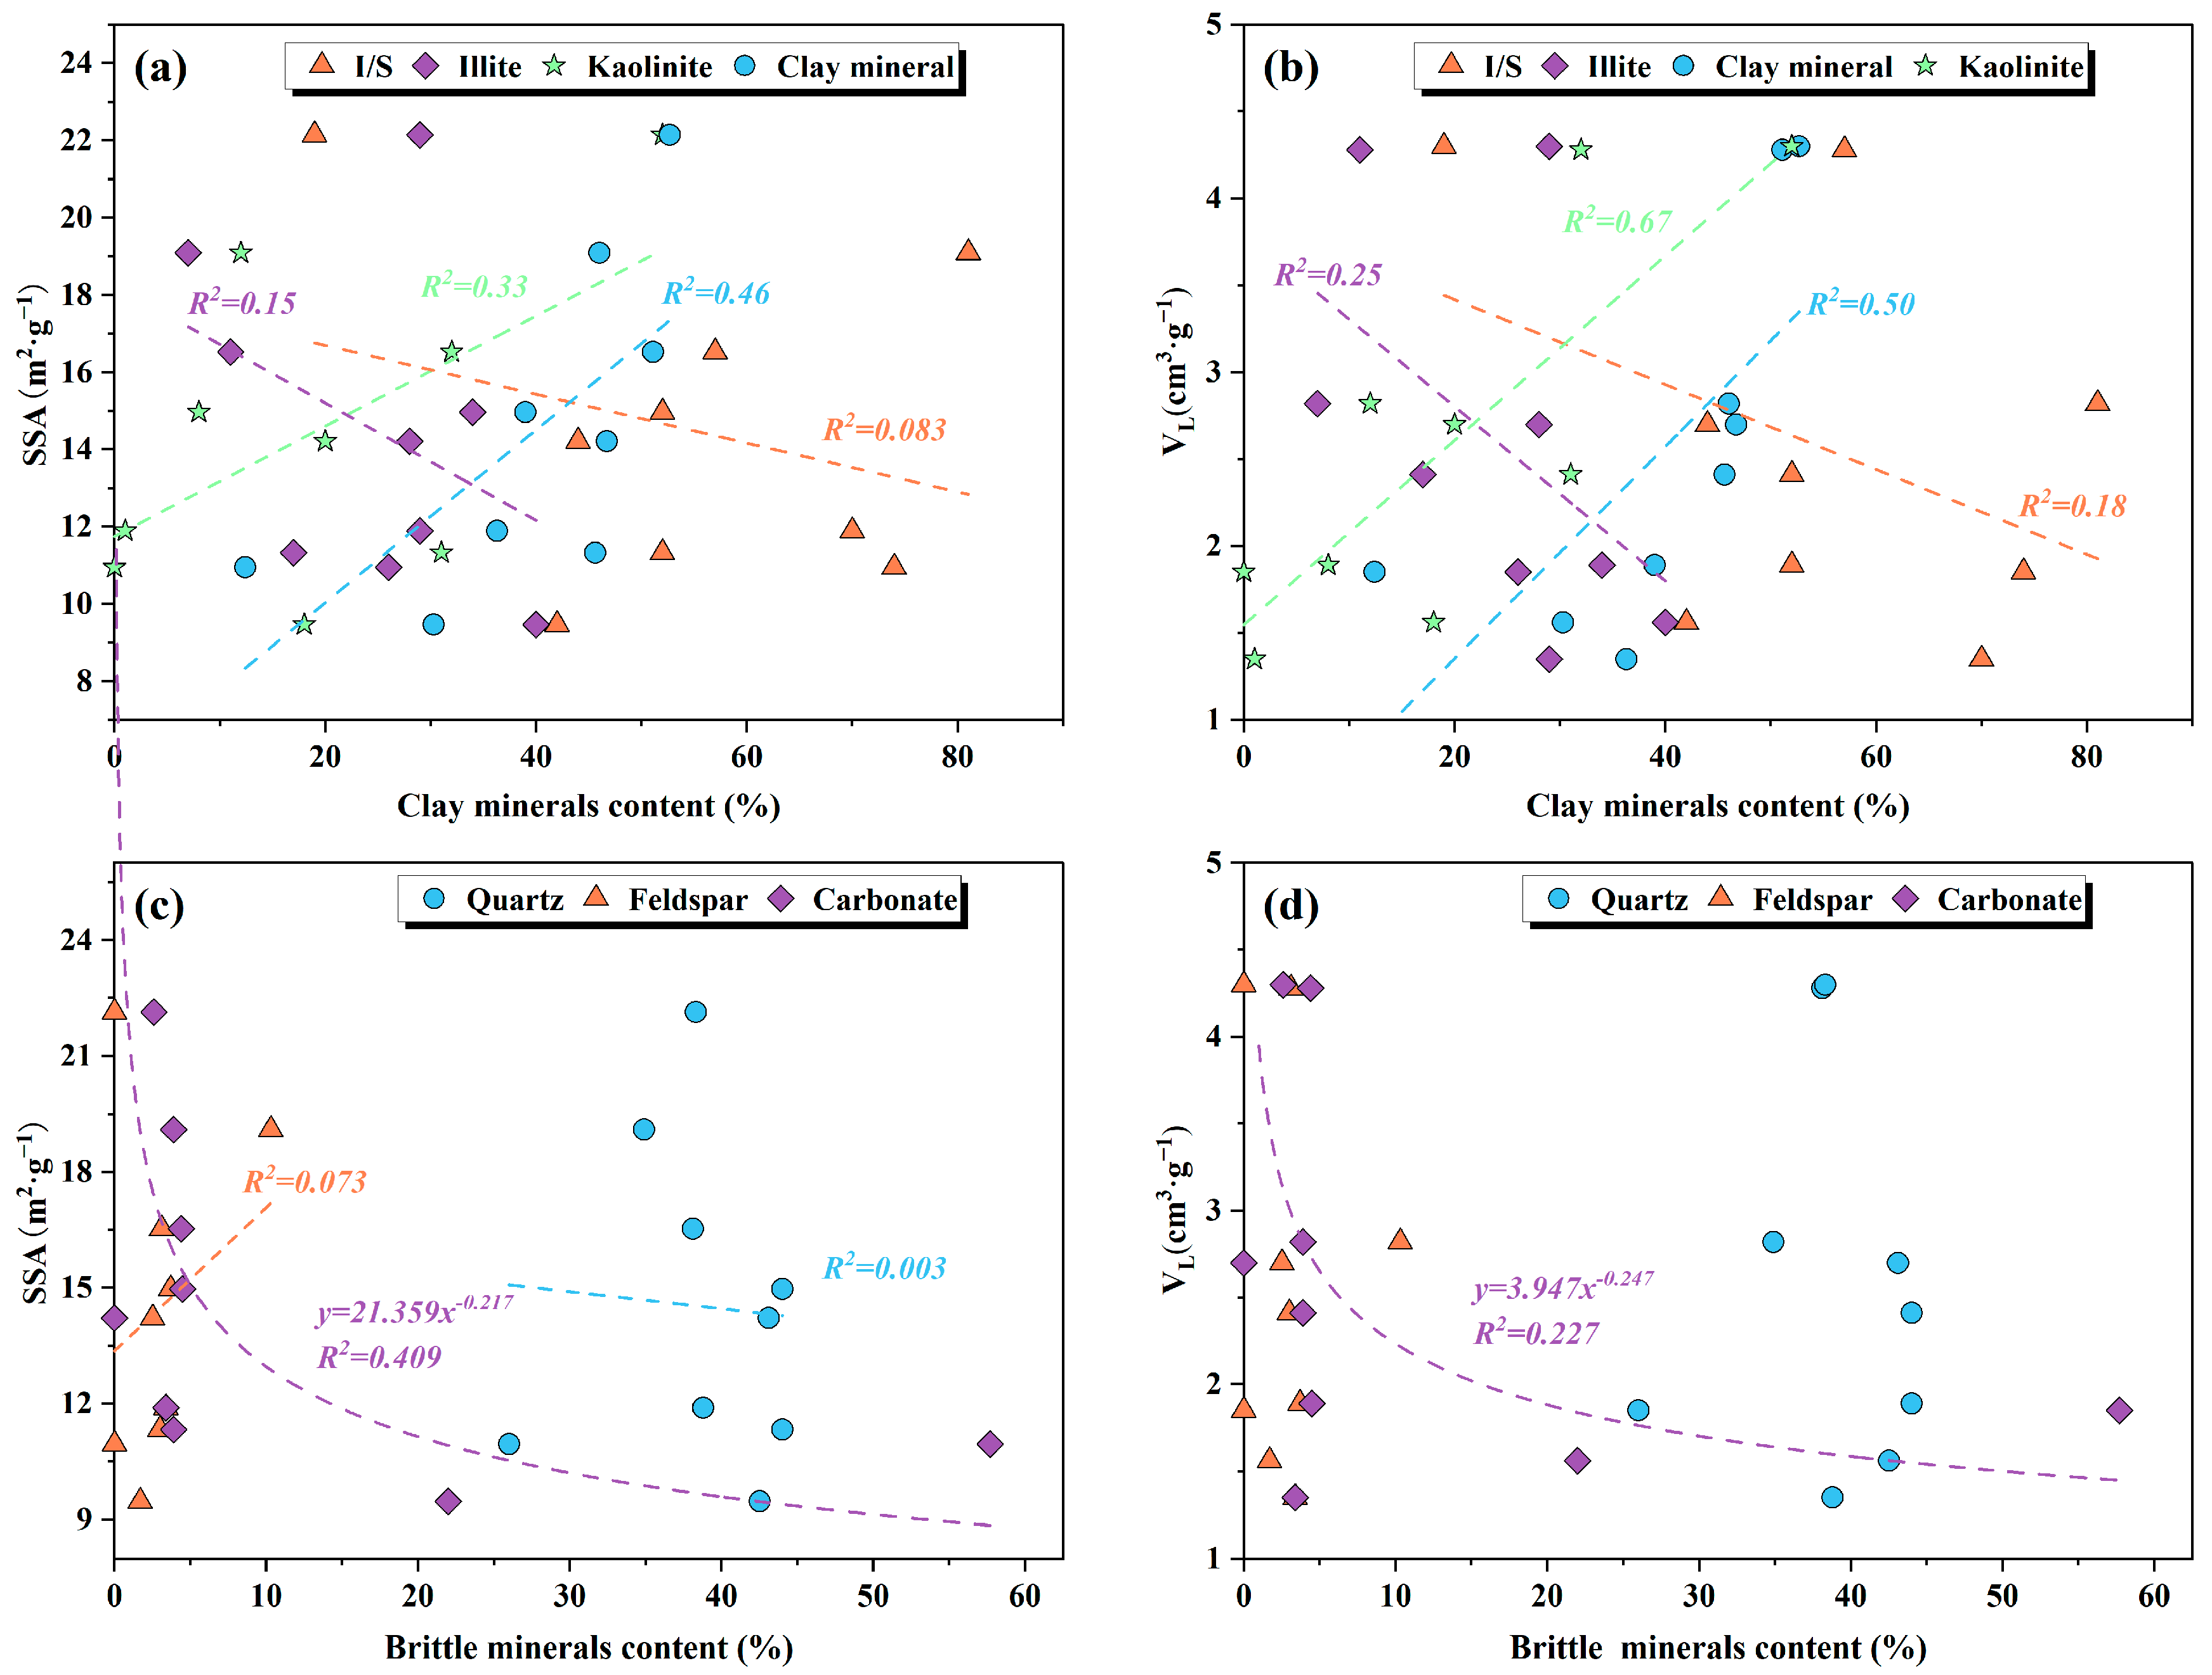
The inorganic minerals in shale mainly include clay minerals and brittle minerals. Different inorganic minerals have distinct differences in crystal structure and physical and chemical properties, which result in varying SSA of these minerals. Therefore, the variation in mineral composition and content leads to differences in the pore structure of shale and its impact on methane adsorption capacity [57]. The mineral composition of the Taiyuan Formation shale in the SNCB mainly consists of quartz and clay minerals, accounting for over 70%. Only sample Z-20 has a predominant mineral composition of carbonate minerals, which accounts for 57.7%. Therefore, quartz and clay minerals may have the most significant impact on shale pore structure and methane adsorption capacity. By analyzing the correlation between clay mineral content and pore SSA, it can be concluded that there is a positive correlation between the clay mineral content and pore SSA of shale, indicating that the clay minerals in Taiyuan Formation shale have a certain influence on its pore SSA (Figure 15a). Since there is a positive correlation between clay mineral content and pore SSA of shale, which further affects the methane adsorption capacity of clay minerals, it can be concluded that there is a significant positive correlation between clay mineral content and VL. The correlation coefficient is 0.50 (Figure 15b). This also indicates that the clay mineral content is the main factor determining the adsorption capacity of marine–continental transitional shale. The strong plasticity of clay minerals is the main reason. As their content increases, the compaction of the formation causes a closer arrangement of clay minerals, which promotes the deformation of large pores in shale. This leads to a decrease in pore size and an increase in the number of micropores and mesopores in shale, gradually increasing the pore SSA and improving methane adsorption capacity. However, due to the stronger hydrophilicity of clay minerals, the correlation between VL and clay minerals is significantly weaker than that with organic matter.
The main components of clay minerals in the Taiyuan Formation shale include I/S mixed layer, illite, and kaolinite. By analyzing the correlation between clay mineral composition and SSA and VL, it can be concluded (Figure 15a,b) that the kaolinite content in shale is positively correlated with SSA and VL, with correlation coefficients of 0.33 and 0.67, respectively. The illite content has a weak negative correlation with SSA and VL. The content of the I/S mixed layer shows no correlation with SSA but exhibits a weak negative correlation with VL. It indicates that an increase in the kaolinite content leads to a corresponding increase in the SSA of shale pore, and due to its weak hydrophilicity, kaolinite enhances the methane adsorption capacity of shale. However, an increase in illite content may lead to an increase in the large pore content of shale, which reduces the SSA of shale pore. Additionally, both illite and I/S mixed layers have strong hydrophilic abilities. Water molecules will adsorb onto their surfaces, occupying adsorption sites and blocking the pore throat, therefore reducing the methane adsorption capacity of shale [58]. Therefore, the influence of clay mineral composition on shale adsorption capacity is more complex.
Brittle minerals in shale primarily consist of quartz, feldspar, and carbonate minerals. By analyzing the correlation between brittle minerals and SSA and VL, it can be concluded that there is a weak negative correlation between carbonate mineral content in shale and SSA and VL (Figure 15c,d). There is no correlation between quartz and feldspar content with SSA and VL. The main reason is that the brittle minerals provide a limited pore SSA, and the methane adsorption is weak. Therefore, the content of quartz and feldspar minerals does not have an obvious effect on the shale adsorption capacity. However, due to the high content of carbonate minerals in individual shale samples, as the carbonate mineral content increases, the proportion of clay minerals may decrease. This results in a reduction in both the SSA and methane adsorption volume of shale, therefore decreasing the shale adsorption capacity [59].

6. Conclusions

The element geochemical characteristics indicate that the Taiyuan Formation shale in the SNCB was formed in a hydrostatic, poor oxygen, and anaerobic sedimentary environment. The average TOC content is 2.37%. The organic matter is mainly type III kerogen, and the Ro ranges from 3.11% to 3.50%, suggesting that the Taiyuan Formation shale possesses favorable sedimentary conditions for organic matter enrichment and serves as a material basis for shale gas generation.
The mineral composition of the Taiyuan Formation shale mainly consists of quartz and clay minerals, which can be classified into siliceous shale, clay-rich shale, and mixed shale. The clay mineral content varies significantly, with an average content of 40.7%. The average quartz content is 37.7%. Pyrite exhibits distinct enrichment zones vertically. The Taiyuan Formation shale has a high proportion of brittle minerals, indicating its good fracturability.
SEM and LNGA experiments reveal the development of organic pores, InterP pores, IntraP pores, dissolution pores, and microcracks in Taiyuan Formation shale. Among these, InterP pores are more prominently developed. The shale has a pore volume ranging from 0.0098 to 0.022 cm3/g, with an average value of 0.0176 cm3/g. Additionally, the SSA ranges from 9.47 to 22.14 m2/g, with an average value of 14.51 m2/g, indicating that the Taiyuan Formation shale possesses significant gas storage capacity.
The VL of Taiyuan Formation shale in the SNCB ranges from 1.35 to 4.30 cm3/g, indicating that the shale exhibits generally good adsorption capacity. The TOC is the main internal controlling factor of SSA and Langmuir volume of shale. With an increase in clay mineral and kaolinite content, there is a rising trend in the pore SSA of shale, which enhances its adsorption capacity to some extent. However, an increase in carbonate mineral content reduces the shale adsorption capacity.

Author Contributions

Conceptualization, W.J. and Y.H.; methodology, W.J.; software, W.J.; validation, W.J.; formal analysis, Y.H.; investigation, W.J.; resources, W.J.; data curation, Y.H.; writing—original draft preparation, W.J.; writing—review and editing, W.J.; visualization, W.J.; supervision, Y.H.; project administration, W.J.; funding acquisition, W.J. All authors have read and agreed to the published version of the manuscript.

Funding

This research was funded by the Doctoral Research Start-up Fund of Suzhou University (2019jb16) and the University Natural Science Research Project of Anhui Province (No. 2022AH051382, 2023AH052223). Research on predicting foundation pit deformation was based on the PSO-BP model (2023xhx074).

Data Availability Statement

The original contributions presented in the study are included in the article, further inquiries can be directed to the corresponding author.

Acknowledgments

This research is sponsored by the scientific research platform project of Suzhou University (2021XJPT54).

Conflicts of Interest

The authors declare no conflicts of interest.

References

  1. Dai, J.; Qin, S.; Hu, G.; Ni, Y.; Gan, L.; Huang, S.; Hong, F. Major progress in the natural gas exploration and development in the past seven decades in China. Pet. Explor. Dev. 2019, 46, 1100–1110. [Google Scholar] [CrossRef]
  2. Zou, C.; Pan, S.; Jin, Z.; Gao, J.; Yang, Z.; Wu, S.; Zhao, Q. Shale oil and gas revolution and its impact. Acta Pet. Sin. 2020, 41, 1–12. [Google Scholar]
  3. Qiu, Z.; Zou, C.; Mills, B.J.W.; Xiong, Y.; Tao, H.; Lu, B.; Liu, H.; Xiao, W.; Simon, W.P. A nutrient control on expanded anoxia and global cooling during the Late Ordovician mass extinction. Commun. Earth Environ. 2022, 39, 82. [Google Scholar] [CrossRef]
  4. Jiang, S.; Tang, X.; Cai, D.; Xue, G.; He, Z.; Long, S.; Peng, Y.; Gao, B.; Xu, Z.; Dahdah, N. Comparison of marine, transitional, and lacustrine shales: A case study from the Sichuan Basin in China. J. Pet. Sci. Eng. 2017, 150, 334–347. [Google Scholar] [CrossRef]
  5. Dong, D.; Wang, Y.; Li, X.; Zou, C.; Guan, Q.; Zhang, C.; Huang, J.; Wang, S.; Wang, H.; Liu, H.; et al. Breakthrough and prospect of shale gas exploration and development in China. Nat. Gas Ind. B 2016, 3, 12–26. [Google Scholar] [CrossRef]
  6. Zhang, L.; He, X.; Li, X.; Li, K.; He, J.; Zhang, Z.; Guo, J.; Chen, Y.; Liu, W. Shale gas exploration and development in the Sichuan Basin: Progress, challenge and countermeasures. Nat. Gas Ind. B 2021, 41, 143–152. [Google Scholar] [CrossRef]
  7. Zhang, J.; Shi, M.; Wang, D.; Tong, Z.; Hou, X.; Niu, J.; Li, X.; Li, Z.; Zhang, P.; Huang, Y. Fields and directions for shale gas exploration in China. Nat. Gas Ind. B 2022, 9, 20–32. [Google Scholar] [CrossRef]
  8. Dong, D.; Gao, S.; Huang, J. A discussion on the shale gas exploration and development prospect in the Sichuan Basin. Nat. Gas Ind. B 2014, 34, 12. [Google Scholar] [CrossRef]
  9. Zou, C.; Zhao, Q.; Dong, D.; Yang, Z.; Qiu, Z.; Liang, F.; Wang, N.; Huang, Y.; Duan, A.; Zhang, Q.; et al. Geological characteristics, main challenges and future prospect of shale gas. Nat. Gas Geosci. 2017, 28, 1781–1796. [Google Scholar] [CrossRef]
  10. Zhang, Q.; Grohmann, S.; Xu, X.; Littke, R. Depositional environment and thermal maturity of the coal-bearing Longtan Shale in southwest Guizhou, China: Implications for shale gas resource potential. Int. J. Coal Geol. 2020, 231, 103607. [Google Scholar] [CrossRef]
  11. Deng, E.; Zhang, Q.; Jin, Z.; Zhu, R.; Yan, Z.; Jiang, B.; Littke, R. Non-overmature equivalents confirmed a high initial hydrocarbon generation potential of the Permian Longtan Shale in southern China. Int. J. Coal Geol. 2022, 259, 104043. [Google Scholar] [CrossRef]
  12. Bowker, K.A. Barnett Shale gas production, Fort Worth Basin: Issues and discussion. AAPG Bull. 2007, 91, 523–533. [Google Scholar] [CrossRef]
  13. Ambrose, R.J.; Hartman, R.C.; Diaz-Campos, M.; Akkutlu, I.Y.; Sondergeld, C.H. Shale Gas-in-Place Calculations Part I: New Pore-Scale Considerations. SPE J. 2012, 17, 219–229. [Google Scholar] [CrossRef]
  14. Curtis, J.B. Fractured shale-gas systems. AAPG Bull. 2022, 86, 1921–1938. [Google Scholar]
  15. Montgomery, S.L.; Jarvie, D.M.; Bowker, K.A.; Pollastro, R.M. Mississippian Barnett shale, Fort Worth Basin, north-central Texasa: Gas-shale play with multitrillion cubic foot potential. AAPG Bull. 2005, 89, 155–175. [Google Scholar] [CrossRef]
  16. Yang, F.; Xie, C.J.; Ning, Z.; Krooss, B.M. High-pressure methane sorption on dry and moisturee-quilibrated shales. Energy Fuels 2017, 31, 482–492. [Google Scholar] [CrossRef]
  17. Pan, L.; Chen, L.; Cheng, P.; Gai, H. Methane storage capacity of Permian shales with type III kerogen in the Lower Yangtze area, Eastern China. Energies 2022, 15, 1875. [Google Scholar] [CrossRef]
  18. Yang, W.; He, S.; Su, A.; Zhai, G.; Zhou, Z.; Dong, T.; Tao, Z. Methane adsorption capacities investigation of the Ediacaran organic-rich Doushantuo shale in the Middle Yangtze Platform, South China. Energy Fuels 2021, 35, 16452–16464. [Google Scholar] [CrossRef]
  19. Zhang, T.; Ellis, G.; Ruppel, S.; Milliken, K.; Yang, R. Effect of organic-matter type and thermal maturity on methane adsorption in shale-gas systems. Org. Geochem. 2012, 47, 120–131. [Google Scholar] [CrossRef]
  20. Chen, G.; Li, C.; Lu, S.; Guo, T.; Wang, M.; Xue, Q.; Zhang, T.; Li, Z.; Sun, Y.; Liu, J.; et al. Critical factors controlling adsorption capacity of shale gas in Wufeng-Longmaxi formation, Sichuan Basin: Evidences from both experiments and molecular simulations. J. Nat. Gas Sci. Eng. 2021, 88, 103774. [Google Scholar] [CrossRef]
  21. Zhang, M.; Fu, X. Influence of reservoir properties on the adsorption capacity and fractal features of shales from Qinshui coalfield. J. Petro. Sci. Eng. 2019, 177, 650–662. [Google Scholar] [CrossRef]
  22. Ji, L.; Zhang, T.; Milliken, K.L.; Qu, J.; Zhang, X. Experimental investigation of main controls to methane adsorption in clay-rich rocks. Appl. Geochem. 2012, 27, 2533–2545. [Google Scholar] [CrossRef]
  23. Sun, Y.; Guo, S. Characterization of whole-aperture pore structure and its effect on methane adsorption capacity for transitional shales. Energy Fuels 2018, 32, 3176–3188. [Google Scholar] [CrossRef]
  24. Xing, Y.; Xiao, X.; Zhou, Q.; Liu, W.; Zhao, Y. Influence of water on the methane adsorption capacity of organic-rich shales and its controlling factors: A review. Energies 2023, 16, 3305. [Google Scholar] [CrossRef]
  25. Ju, Y.; Qi, Y.; Fang, L.; Zhu, H.; Wang, G.; Wang, G. Chinese shale gas reservoir types ant their controlling factors. Adv. Earth Sci. 2016, 31, 782–799. [Google Scholar]
  26. Guo, S.; Fu, D.; Gao, D.; Li, H.; Huang, J. Research status and prospects for marine-continental shale gases in China. Petrol. Geol. Exp. 2015, 37, 535–540. [Google Scholar]
  27. Xu, H.L.; Zhao, Z.J.; Lv, F.L.; Yang, Y.N.; Tang, Z.W.; Sun, G.Z.; Xu, Y.J. Tectonic evolution of the Nanhuabei area and analysis about its petroleum potential. Geotect. Metallog. 2004, 4, 450–463. [Google Scholar]
  28. Yu, H.Z.; Lv, F.L.; Guo, Q.X.; Lu, W.Z.; Wu, J.Y.; Han, S.H. Proto-sediment basin types and tectonic evolution in the southern edge of North China Plate. Petrol. Geol. Exp. 2005, 27, 111–117. [Google Scholar]
  29. Liu, Y.; Cheng, D.; Qiu, Q.; Weng, J.; Wang, X. Characteristics of pores and controlling factors of Lower Permian shales in Southern North China Basin. Nat. Gas Geosci. 2020, 31, 1501–1513. [Google Scholar]
  30. Wang, Y.; Cheng, X.; Fan, K.; Huo, Z.; Wei, L. The Paleoenvironment and Mechanisms of Organic Matter Enrichment of Shale in the Permian Taiyuan and Shanxi Formations in the Southern North China Basin. J. Mar. Sci. Eng. 2023, 11, 992. [Google Scholar] [CrossRef]
  31. Li, P.; Zhang, J.C.; Tang, X.; Huo, Z.P.; Li, Z.; Luo, K.Y.; Li, Z.M. Assessment of shale gas potential of the lower Permian transitional Shanxi-Taiyuan shales in the southern North China Basin. Aust. J. Earth Sci. 2021, 68, 262–284. [Google Scholar] [CrossRef]
  32. SY/T 6414-2014; Maceral Identification and Statistical Methods on Polished Surfaces of Whole Rocks. China Standard Press: Beijing, China, 2014.
  33. SY/T 5124-2012; Method of Determining Microscopically the Reflectance of Vitrinite in Sedimentary. China Standard Press: Beijing, China, 2012.
  34. SY/T 5163-2018; Analysis Method for Clay Minerals and Ordinary Non-Clay Minerals in Sedimentary Rocks by the X-ray Diffraction. China Standard Press: Beijing, China, 2018.
  35. Maslov, A.V.; Podkovyrov, V.N. Ocean redox state at 2500-500 Ma: Modern concepts. Lithol. Miner. Resour. 2018, 53, 190–211. [Google Scholar] [CrossRef]
  36. Alberdi-Genolet, M.; Tocco, R. Trace metals and organic geochemistry of the machiques member (aptian–albian) and la luna formation (cenomanian–campanian), venezuela. Chem. Geol. 1999, 160, 19–38. [Google Scholar] [CrossRef]
  37. Hatch, J.R.; Leventhal, J.S. Relationship between inferred redox potential of the depositional environment and geochemistry of the Upper Pennsylvanian (Missourian) Stark Shale Member of the Dennis Limestone, Wabaunsee County, Kansas, USA. Chem. Geol. 1992, 99, 65–82. [Google Scholar] [CrossRef]
  38. Jones, B.; Manning, D.A. Comparison of geochemical indices used for the interpretation of palaeoredox conditions in ancient mudstones. Chem. Geol. 1994, 111, 111–129. [Google Scholar] [CrossRef]
  39. Fan, Q.; Xia, G.; Li, G.; Yi, H. Analytical Methods and Research Progress of Redox Conditions in the Paleo-Ocean. Acta Sedimentol. Sin. 2022, 40, 1151–1171. [Google Scholar]
  40. Yan, J.; Xu, S.; Li, F. Geochemistry of the dysaerobic sedimentary environments of the Qixia Formationin Badong, Hubei. Sediment. Facies Palaeogeogr. 1998, 18, 27–32. [Google Scholar]
  41. Ma, B.; Xu, S.; Chen, M.; Zhang, J. An Overview of Influence Factors of Methane Adsorption Capacity in Shale. Mar. Orig. Pet. Geol. 2018, 23, 31–38. [Google Scholar]
  42. Ge, T.; Pan, J.; Wang, K.; Liu, W.; Mou, P.; Wang, X. Heterogeneity of pore structure of late Paleozoic transitional facies coal-bearing shale in the Southern North China and its main controlling factors. Mar. Petrol. Geol. 2020, 122, 104710. [Google Scholar] [CrossRef]
  43. Chen, K.; Chen, K.; Liu, X.; Liu, J.; Zhang, C.; Guan, M.; Zhou, S. Lithofacies and pore characterization of continental shale in the second Member of the Kongdian Formation in the Cangdong Sag, Bohai Bay Basin, China. J. Petrol. Sci. Eng. 2019, 177, 154–166. [Google Scholar] [CrossRef]
  44. Yang, W.; Zuo, R.; Jiang, Z.; Chen, D.; Song, Y.; Luo, Q.; Wang, Q.; Zhu, H. Effect of lithofacies on pore structure and new insights into pore-preserving mechanisms of the over-mature Qiongzhusi marine shales in Lower Cambrian of the southern Sichuan Basin, China. Mar. Petrol. Geol. 2018, 98, 746–762. [Google Scholar] [CrossRef]
  45. Clarkson, C.R.; Solano, N.; Bustin, R.M.; Bustin, A.M.M.; Chalmers, G.R.L.; He, L.; Melnichenko, Y.B.; Radliński, A.P.; Blach, T.P. Pore structure characterization of North American shale gas reservoirs using USANS/SANS, gas adsorption, and mercury intrusion. Fuel 2013, 103, 606–616. [Google Scholar] [CrossRef]
  46. Loucks, R.G.; Reed, R.M.; Ruppel, S.C.; Hammes, U. Spectrum of pore types and networks in mudrocks and a descriptive classification for matrix-related mudrock pores. AAPG Bull. 2012, 96, 1071–1098. [Google Scholar] [CrossRef]
  47. Chen, L.; Jiang, Z.; Liu, Q.; Jiang, S.; Liu, K.; Tan, J.; Gao, F. Mechanism of shale gas occurrence: Insights from comparative study on pore structures of marine and lacustrine shales. Mar. Petrol. Geol. 2019, 104, 200–216. [Google Scholar] [CrossRef]
  48. Wang, E.; Guo, T.; Li, M.; Li, C.; Dong, X.; Zhang, N.; Feng, Y. Exploration potential of different lithofacies of deep marine shale gas systems: Insight into organic matter accumulation and pore formation mechanisms. J. Nat. Gas Sci. Eng. 2022, 102, 104563. [Google Scholar] [CrossRef]
  49. Sing, K.S.W. Reporting physisorption data for gas/solid systems with special reference to the determination of surface area and porosity (Recommendations 1984). Pure Appl. Chem. 1985, 57, 603–619. [Google Scholar] [CrossRef]
  50. Rexer, T.F.; Benham, M.J.; Aplin, A.C.; Thomas, K.M. Methane adsorption on shale under simulated geological temperature and pressure conditions. Energy Fuels 2013, 27, 3099–3109. [Google Scholar] [CrossRef]
  51. Yang, Y. Application of bitumen and graptolite reflectance in the Silurian Longmaxi shale, southeastern Sichuan Basin. Petrol. Geol. Exp. 2016, 38, 466–472. [Google Scholar]
  52. He, Q.; Dong, T.; He, S.; Zhai, G. Methane adsorption capacity of marine-continental transitional facies shales: The case study of the Upper Permian Longtan Formation, northern Guizhou Province, Southwest China. J. Petrol. Sci. Eng. 2019, 183, 106406. [Google Scholar] [CrossRef]
  53. Yang, C.; Zhang, J.C.; Han, S.B.; Xue, B.; Zhao, Q.R. Classification and the developmental regularity of organic-associated pores (OAP) through a comparative study of marine, transitional, and terrestrial shales in China. J. Nat. Gas. Sci. Eng. 2016, 36, 358–368. [Google Scholar] [CrossRef]
  54. Tang, X.; Jiang, Z.; Jiang, S.; Wang, P.; Xiang, C. Effect of organic matter and maturity on pore size distribution and gas storage capacity in high-mature to post-mature shales. Energy Fuels 2016, 30, 8985–8996. [Google Scholar] [CrossRef]
  55. Li, Q.; Liu, Z.; Chen, F.; Zhang, K.; Tang, L. Behavior and controlling factors of methane adsorption in Jurassic continental shale, northeastern Sichuan Basin. Energy Geosci. 2023, 4, 83–92. [Google Scholar] [CrossRef]
  56. Pan, L.; Xiao, X.; Tian, H.; Zhou, Q.; Cheng, P. Geological models of gas in place of the Longmaxi shale in Southeast Chongqing, South China. Mar. Petrol. Geol. 2016, 73, 433–444. [Google Scholar] [CrossRef]
  57. Li, Q.; Pang, X.; Ling, T.; Chen, G.; Shao, X.; Jia, N. Occurrence features and gas content analysis of marine and continental shales: A comparative study of Longmaxi Formation and Yanchang Formation. J. Nat. Gas. Sci. Eng. 2018, 56, 504–522. [Google Scholar] [CrossRef]
  58. Ross, D.J.K.; Bustin, R.M. The importance of shale composition and pore structure upon gas storage potential of shale gas reservoirs. Mar. Petrol. Geol. 2009, 26, 916–927. [Google Scholar] [CrossRef]
  59. Jin, Z.; Hu, Z.; Gao, B.; Zhao, J. Controlling factors on the enrichment and high productivity of shale gas in the Wufeng-Longmaxi Formations, southeastern Sichuan Basin. Geosci. Front. 2020, 23, 1–10. [Google Scholar]
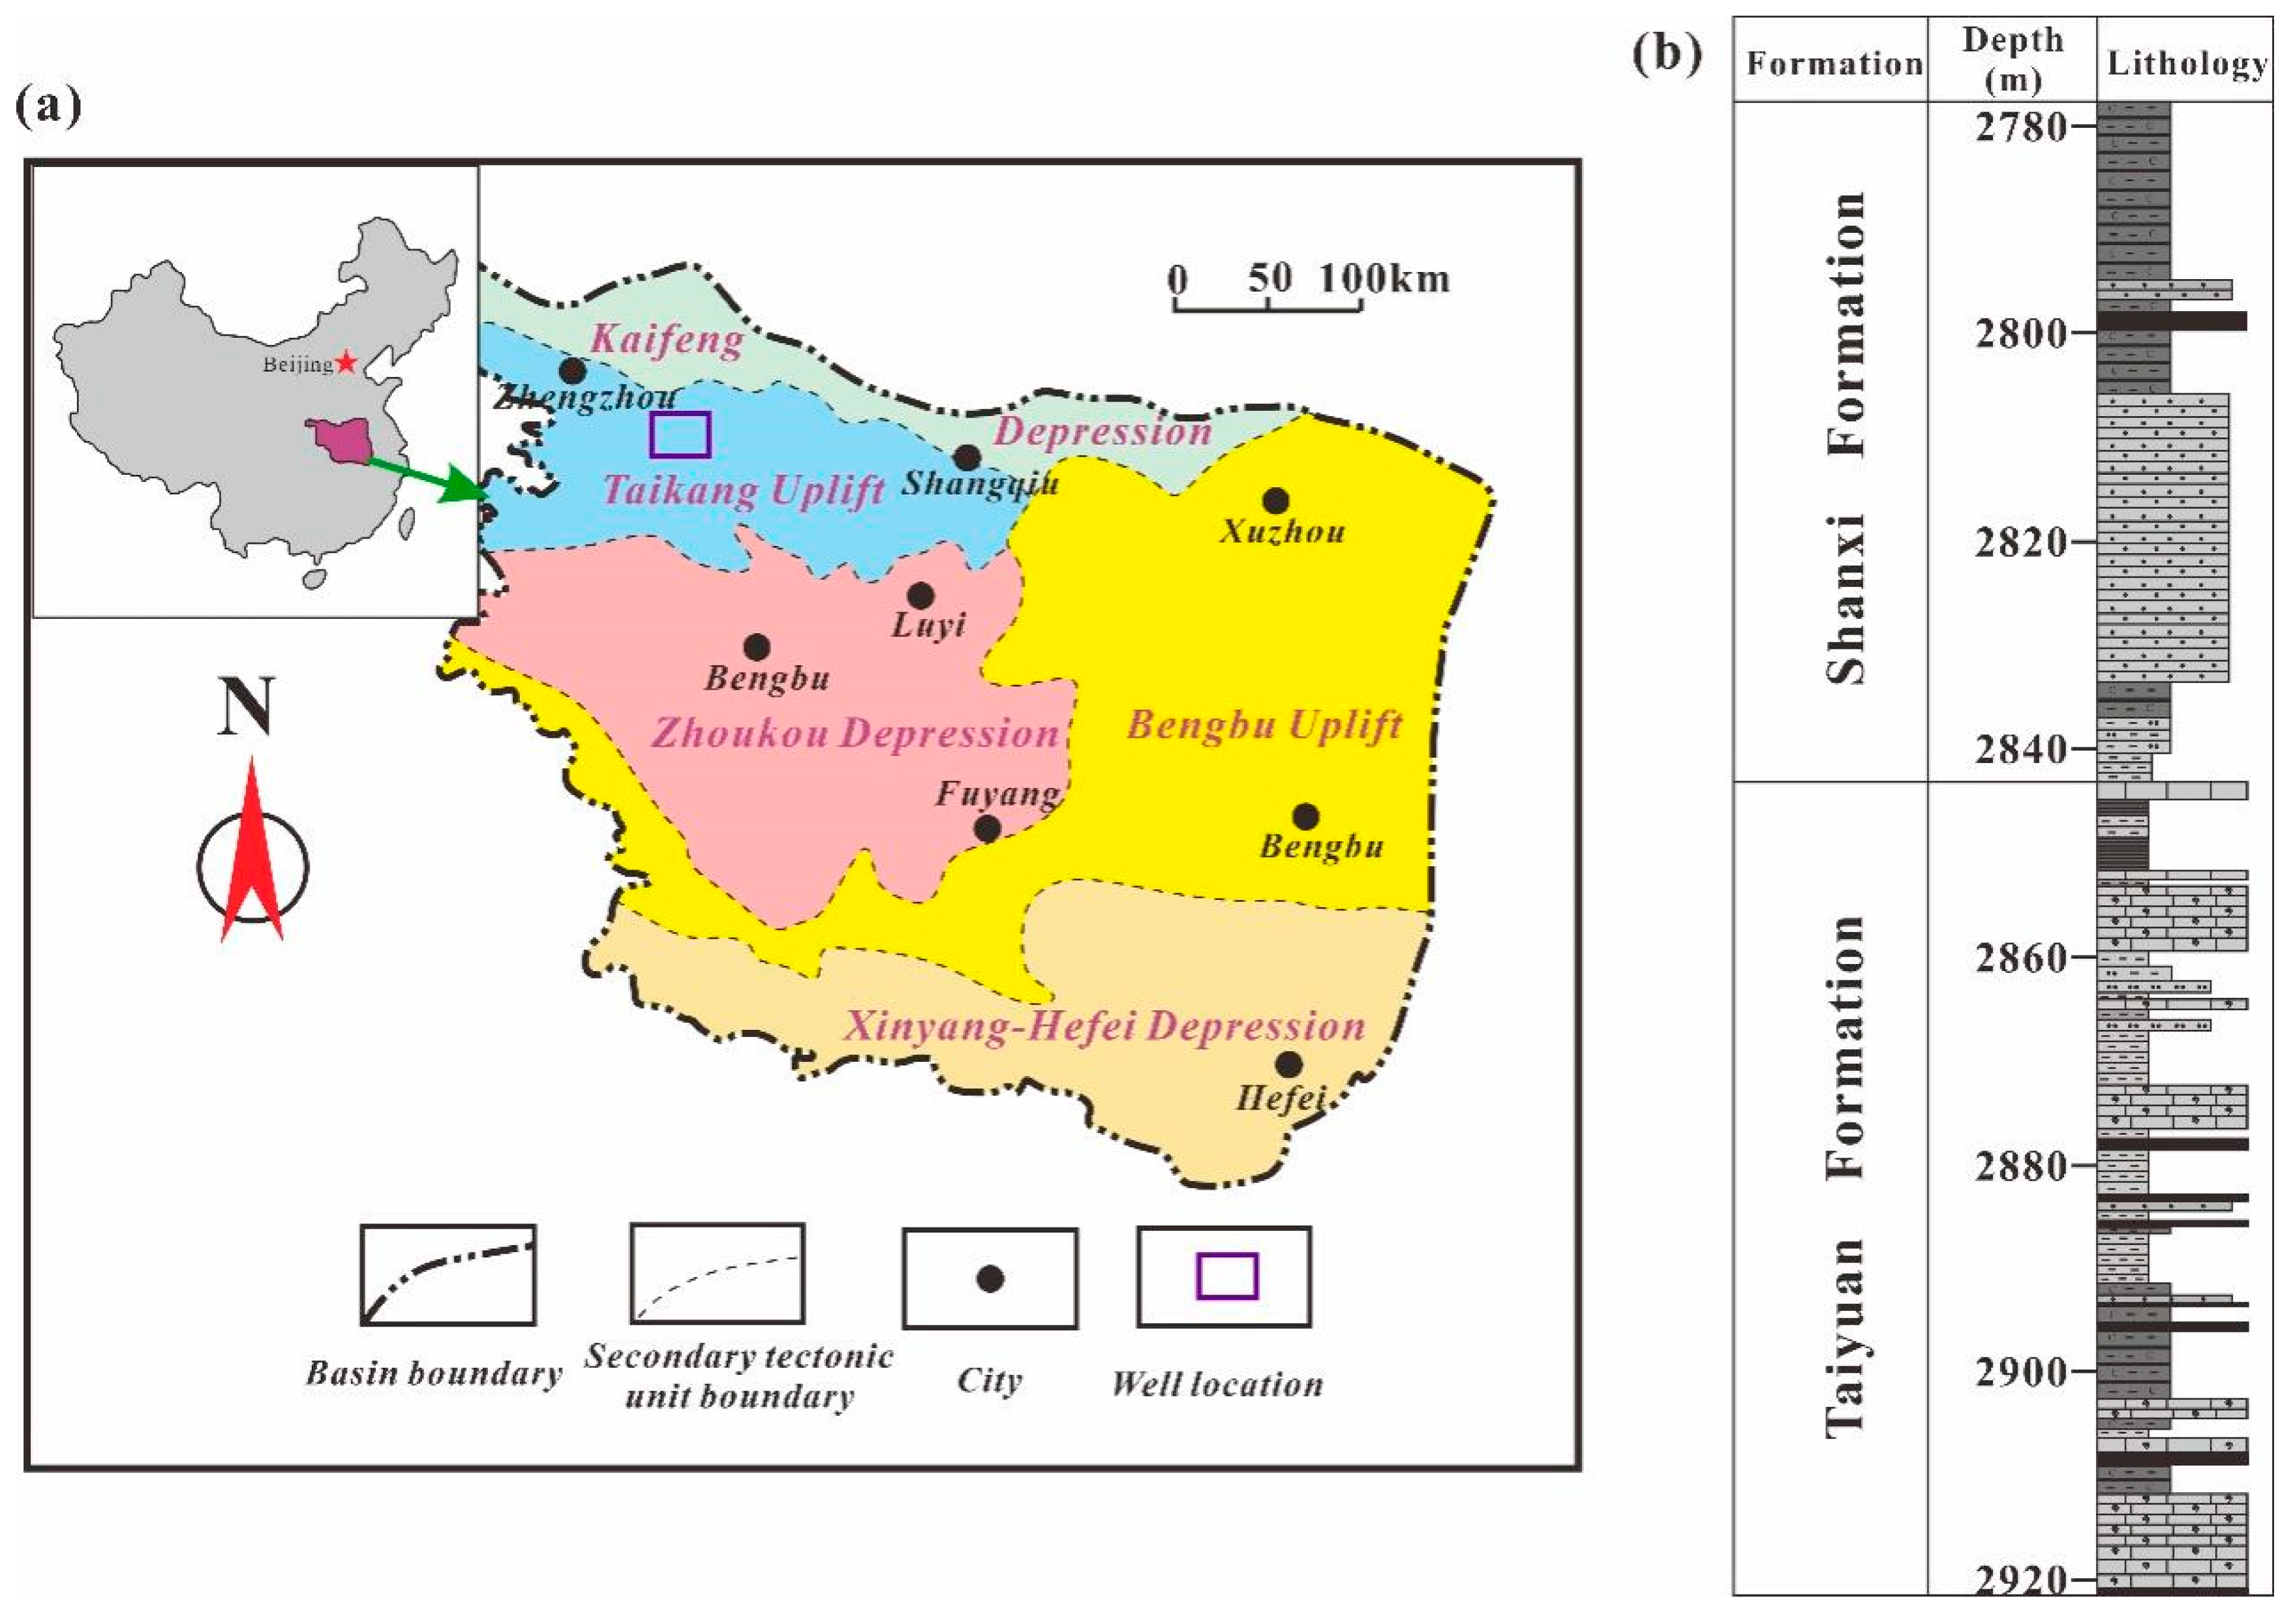
Figure 1. (a) Location map of the study area in the SNCB (modified after [30]); (b) Synthesis histogram of Lower Permian in z well of SNCB (modified after [31]).
Applsci 14 06577 g001
Figure 2. The TOC distribution of Taiyuan Formation shale in the SNCB.
Applsci 14 06577 g002
Figure 3. The XRD patterns of Taiyuan Formation shale in the SNCB (Z-10).
Applsci 14 06577 g003
Figure 4. The content of whole-rock minerals for Taiyuan Formation shale in the SNCB.
Applsci 14 06577 g004
Figure 5. The content of clay minerals for Taiyuan Formation shale in the SNCB.
Applsci 14 06577 g005
Figure 6. Triple graph of shale mineral compositions of Taiyuan Formation in the SNCB.
Applsci 14 06577 g006
Figure 7. The development characteristics of organic pores in the Taiyuan Formation shale in the SNCB. (a) Organic matter shrinkage joints and organic pores; (b) InterP pores, organic pores and organic matter shrinkage joints; (c) InterP pores and organic matter shrinkage joints; (d) Organic matter and pyrite.
Applsci 14 06577 g007
Figure 8. The development characteristics of mineral pores in the Taiyuan Formation shale in the SNCB. (a) InterP pores and IntraP pores; (b) InterP pores and IntraP pores; (c) InterP pores and organic matter; (d) InterP pores, IntraP pores, organic matter and calcite.
Applsci 14 06577 g008
Figure 9. LTNA curves of the Taiyuan Formation shale in the SNC.
Applsci 14 06577 g009
Figure 10. Pore size distribution of Taiyuan Formation shale in the SNCB.
Applsci 14 06577 g010
Figure 11. The methane adsorption curves for the Taiyuan Formation shale in the SNCB.
Applsci 14 06577 g011
Figure 12. The relationship between pore structure parameters and VL and TOC for the Taiyuan Formation shale in the SNCB. (a) TOC and VL; (b) TOC and SSA; (c) TOC and PV.
Applsci 14 06577 g012
Figure 13. The relationship between kerogen type and Ro and VL for the Taiyuan Formation shale in the SNCB. (a) kerogen type and VL; (b) Ro and VL.
Applsci 14 06577 g013
Figure 14. The relationship between pore structure parameters and VL for the Taiyuan Formation shale in the SNCB. (a) SSA and VL; (b) PV and VL.
Applsci 14 06577 g014
Figure 15. The relationship between brittle minerals, clay minerals, and VL for the Taiyuan Formation shale in the SNCB. (a) Clay minerals content and SSA; (b) Clay minerals content and VL; (c) Brittle minerals content and SSA; (d) Brittle minerals content and VL.
Applsci 14 06577 g015
Table 1. Organic geochemical characteristics and hydrocarbon generative potential of shale samples from the Taiyuan Formation in the SNCB.
Sample IDDepth (m)TOC
(%)
Ro
(%)
Sapropel-Inite (%)Exinite
(%)
Vitrinite
(%)
Inertinite
(%)
TIOM
Type
Z-12845.02.613.198466478.5II1
Z-42861.52.503.2420104228−34.5III
Z-62868.82.273.1928124020−16.0III
Z-72876.43.883.1134143616−2.0III
Z-82880.03.523.205016241030.0II2
Z-112886.61.793.178288278.0II1
Z-142897.11.323.502584423−27.0III
Z-172905.71.253.338428673.0II1
Z-202910.62.243.189242290.5I
Table 2. The content of some elements of the Taiyuan Formation shale and identifications for redox condition.
Sample
ID
Element Content/10−6Redox Proxies
VNiCuZnLaCeV/(V + Ni)Cu/ZnCe/La
Z-112018.416.173.349.3298.560.870.22 2.00
Z-39524.021.592.450.2887.980.800.23 1.75
Z-516428.022.899.247.5288.320.850.23 1.86
Z-75612.119.4120.258.0891.310.820.16 1.57
Z-139930.514.160.426.4049.800.760.23 1.89
Table 3. Experimental results of methane adsorption capacity for shale samples.
Sample IDBET SSA
(m2/g)
PV
(10−3m3/g)
APS
(nm)
Langmuir
Volume
(m3/t)
Langmuir
Pressure
(MPa)
Z-119.10 21.794.572.824.61
Z-414.21 19.215.412.704.45
Z-614.97 18.434.931.893.34
Z-716.53 20.284.914.285.21
Z-822.14 20.733.754.305.70
Z-1111.33 12.484.412.414.03
Z-149.47 14.926.301.564.42
Z-1711.89 16.895.681.353.63
Z-2010.96 9.8273.591.853.78
Disclaimer/Publisher’s Note: The statements, opinions and data contained in all publications are solely those of the individual author(s) and contributor(s) and not of MDPI and/or the editor(s). MDPI and/or the editor(s) disclaim responsibility for any injury to people or property resulting from any ideas, methods, instructions or products referred to in the content.