Article

Probabilistic Seismic Hazard Assessment of the Southwestern Region of Saudi Arabia

1
Department of Geology, Faculty of Science, Al-Azhar University, Assiut Branch, Assiut 71524, Egypt
2
Department of Physics and Technical Sciences, Western Caspian University, Baku AZ1072, Azerbaijan
3
Department of Geology, Faculty of Science, Assiut University, Assiut 71516, Egypt
4
Department of Physics, University of Jaén, 23071 Jaén, Spain
*
Author to whom correspondence should be addressed.
Appl. Sci. 2024, 14(15), 6600; https://doi.org/10.3390/app14156600 (registering DOI)
Submission received: 17 June 2024 / Revised: 23 July 2024 / Accepted: 24 July 2024 / Published: 28 July 2024
(This article belongs to the Section Earth Sciences)

Abstract

:
In relation to its rapid infrastructure expansion, exemplified by projects like the Najran Valley Dam or the rehabilitation of agricultural terraces, Saudi Arabia stands out among the Arabian Gulf nations. To mitigate the earthquake-related risks effectively, it is imperative to conduct an exhaustive analysis of its natural hazards. The southwesternmost region of Saudi Arabia is the main subject area of this study for the probabilistic seismic hazard assessment (PSHA), which aims to identify the peak ground acceleration (PGA) and spectral acceleration (SA) values. The investigation encompasses a 10% and 5% probability of occurrence over a 50-year exposure time for both B/C and C NEHRP soils. In order to take into account the earthquake activity that takes place in the vicinity of the Red Sea Rift, which in fact may have an impact on the seismic hazard in this active tectonic region, different seismic source zones were especially designed for this evaluation. Various characteristics such as the uncertainties related to the b-value, the expected maximum magnitude, and different ground motion prediction equations (GMPEs) were integrated using a logic tree scheme. Additionally, regression relationships between the computed ground motion values were established, and a novel design response spectrum was developed and recommended for several cities. Regarding the key findings, it is significant to highlight that the seismic hazard decreases towards the northeast, when moving away from the Red Sea Rift, confirming anticipated trends where proximity to the rift corresponds to increased seismic hazard. Notably, cities such as Farasan Island, Jazan, Al Qunfundhah, Al Lith and Al Birk present the highest observed hazard values among all the cities analyzed. For these cities, the obtained maximum SA values for both 475 and 975 years under B/C site conditions are as follows: 0.268 g and 0.412 g, 0.121 g and 0.167 g, 0.099 g and 0.150 g, 0.083 g and 0.135 g, and 0.066 g and 0.118 g, respectively. These results emphasize the crucial necessity of adequately evaluating and thoroughly updating the seismic hazard inherent to these particular areas to enhance the risk reduction and disaster readiness initiatives.

1. Introduction

An earthquake’s potential to cause fatalities and damage to infrastructure depends on a variety of local factors. The magnitude of the earthquake, the epicentral distance, the population density, the characteristics of the soil, any related amplifications, as well as the efficiency of the structural design and adherence to building codes, are all significant variables. Even seismic events of moderate or low-to-moderate magnitudes can escalate into catastrophic events in regions where seismic design regulations are deficient. Consequently, a pivotal strategy for mitigating future casualties, injuries, and property damage from earthquakes involves the meticulous assessment of reliable seismic hazard values and their inclusion in building regulations. These assessments, in turn, serve as the foundation for creating, refining, or amending seismic design codes in the region under consideration [1,2,3]. This approach aligns with the broader objective of enhancing the resilience of communities and infrastructures to seismic risk.
The Red Sea rifting, a very notable and active tectonic process along the boundary between the Nubian and Arabian Plates, significantly impacts the seismotectonic environment in southwest Saudi Arabia. From the Gulf of Aden and the Afar Triple Junction in the south to the Dead Sea Transform Fault in the north, this tectonic structure stretches [4] (Figure 1). This dynamic and geologically active region began to form around 30 million years ago (late Early Oligocene) in the eastern Gulf of Aden. The tectonic activity in this region was marked by significant volcanic activity and the formation of rift valleys, highlighting the ongoing process of seafloor spreading and continental rifting [5,6,7,8,9,10,11].
The Nubian and Arabian tectonic plates converge to form a seismically active and dynamic region. Prominent faults like the Najd Fault system are the outcome of the intricate current interaction between the Nubian Plate and the Arabian Plate. The western Gulf of Aden, the central and southern Red Sea, and the Arabian Shield surrounding activity all have an impact on the southwest, which includes places like Asir, Jazan, and Al-Bahah. Each of these geological characteristics adds to the region’s seismic hazard. The authors of [12] explore the seismicity and crustal deformation in the area, providing insight into the complex tectonic features that characterize the seismotectonic environment of southwest Saudi Arabia.
Despite their relative low occurrence, earthquakes are an important phenomenon in Saudi Arabia that needs to be studied due to the possible effects they could have on the population and infrastructures of the area. Due to the region under study’s location at the converging point of the Arabian and Nubian tectonic plates, faults like the well-known Najd Fault system are the main sites for seismic activity. Several studies have examined Saudi Arabia’s seismic past in an effort to comprehend the frequency, size, and distribution of earthquakes in the area [13,14,15,16,17].
In Saudi Arabia, seismic building codes (e.g., SBC 201 and 301) are essential for guaranteeing the structural stability of infrastructures and buildings in the event of an earthquake. The seismic design and construction requirements for different building types are discussed in [14] by the seismic rules of the Saudi Building Code. These codes take into consideration the seismic hazard assessments specific to the region, emphasizing the importance of site-specific considerations. The authors of [18] highlight the evolving nature of seismic codes in Saudi Arabia, emphasizing the need for continuous improvement to address emerging challenges. Compliance with these codes is crucial for architects, engineers, and construction professionals to ensure that new constructions and retrofitting of existing structures adhere to the latest seismic safety standards.
While research on this topic has been limited, studies such as [12,19] have made significant contributions in evaluating seismic hazards in this region. Refs. [12,19] carried out ground-breaking research on the seismic hazard near Saudi Arabia’s western coast, illuminating a previously unexplored region. Additionally, numerous research projects have looked into the seismic hazard on the Arabian Peninsula. Early research in the area by the authors of [17] established the foundation for further studies by estimating the peak ground acceleration PGA and the peak ground velocity (PGV) for stiff soils. Ref. [13] improved this research by developing seismic zonation maps for Saudi Arabia, providing essential information for seismic design and risk mitigation strategies. Recently, Ref. [20] introduced a framework for PSHA using the Monte Carlo Approach in Saudi Arabia. Accordingly, further research was needed to refine existing methodologies and improve our ability to assess and mitigate seismic risks effectively.
The Gulf nations, particularly Saudi Arabia, are undergoing rapid infrastructure growth with the initiation and execution of extensive national projects. This rapid development calls for critical comprehension, analysis, and evaluation of the seismic hazard in these areas. The expansion of population and development into areas prone to moderate or strong earthquakes has led to an escalating risk of damaged buildings and increased vulnerability. Unchecked urban development often correlates with the construction of structures and facilities susceptible to seismic hazard, primarily due to a lack of awareness about seismic risk in the construction zones. In regions where construction practices are inadequate, even minor seismic events can result in devastating consequences.
Given the earthquake activity in the Arabian Shield, the central and southern Red Sea, and the western Gulf of Aden, a comprehensive assessment of seismic hazard in the southwest of Saudi Arabia is critical. In the context of geohazard mitigation and risk management, knowing a region’s seismic hazard is essential for preserving the stability of its infrastructure and safeguarding the safety of its citizens. The assessment of seismic hazard holds significant importance in mitigating the impact of earthquakes and is crucial for purposes such as land-use planning, civil engineering endeavors, and emergency response, particularly for substantial projects within the study area such as the Najran Valley Dam, the restoration of agricultural terraces, and various urban expansion initiatives. Remarkable projects, including those in Al-Bahah, Asir, Jazan, Najran, and the Farasan Island Marine Sanctuary, fall within the research area. Al-Bahah, renowned as a premier tourist destination, is of particular interest.
Utilizing expected ground motion values derived from seismic hazard assessments becomes imperative for site evaluations, especially for significant constructions, aiding not only in infrastructure design but also in the development of urban expansion projects [1,2,21,22,23,24,25,26]. These findings are essential for the planning and construction of a wide range of infrastructure components, including gas pipelines, roads, bridges, water and power lines, and communication cables. Therefore, the main goal of this work is to reduce the risk that earthquakes pose in order to make it easier to develop buildings that have improved seismic resistance. This initiative aligns with the broader vision of the Kingdom 2030, ensuring that both current and future projects adhere to standards that prioritize earthquake resilience.
A novel seismic hazard assessment has been developed due to the shortcomings of the existing seismic design regulations and assessments, the absence of a thorough seismic hazard study for southwest Saudi Arabia, the unique population density, and socioeconomic dynamics of the region, among other factors. A new PSHA will be constructed as part of this initiative, tailored specifically for this region and taking into consideration two different soil conditions (B/C and C classes) in line with the National Earthquake Hazards Reduction (NEHRP) initiative [27]. PGA and SA values are highlighted in the assessment, which spans two distinct return periods (475 and 975 years).

2. Methodology

Our approach in this evaluation follows the established PSHA methodology outlined in previous works [28,29], further developed in [30], and refined in [31], commonly referred to as the classical approach by several authors [32]. A PSHA aims to determine the likelihood of experiencing a specified ground motion level at a particular site within a defined timeframe. Following the Cornell–McGuire approach [28,29,31], several key steps are necessary for conducting a PSHA: first, identifying and delineating seismic source boundaries, typically within a range of 300 to 400 km from the site, adjusted based on the tectonic setting; next, defining recurrence rates of earthquake frequency and magnitude for each identified seismic source; then, selecting an appropriate GMPE to probabilistically describe hazard parameters; finally, calculating hazard curves by integrating across all magnitudes and distances for all identified source zones. Here, the assessment procedure consisted of several key steps: (a) considering potential seismic sources in the region, as indicated by recent publications such as those by [33] for Ethiopia and [34] for the Arabian Peninsula; (b) choosing appropriate GMPEs; and (c) estimating hazard curves, which display the likelihood of exceeding specific ground motions at specific locations [35,36]. This was accomplished by using a tried-and-true logic tree approach.
Here, we employ the most widespread method for computing seismic hazard presently. As previously stated, our objective is to enhance previous seismic hazard assessments to inform updates to the earthquake load specifications within both local and national building codes in Saudi Arabia. This requires the use of a probabilistic approach rather than a deterministic one. This PSHA method aligns with the approach adopted in the International Building Code [37] and advocated in Eurocode 8 [38], alongside other standards. It is the methodology best suited to address uncertainties, as articulated by [39], making it the preferred method for handling uncertainty. Subsequent sections will delve into detailed explanations of each of these phases.

2.1. Earthquake and Focal Mechanism Catalogs

Assessing seismic hazards in the chosen region requires identifying and characterizing possible seismic sources [40,41]. In the initial stage of defining seismic sources, the earthquake catalog for the Arabian Peninsula and adjacent areas is used, as published by [42]. The data in this catalog were sourced from a variety of international, regional, and local agencies, as well as in the published literature. The authors of [42] reported that, in addition to local catalogs from Yemen, Oman, Saudi Arabia, and the United Arab Emirates, the compiled data mostly came from international sources, including the International Seismological Centre-Global Earthquake Model (ISC-GEM), ISC-EHB [43], the International Seismological Centre (ISC), and the National Earthquake Information Center of the United States Geological Survey (NEIC-USGS). According to their methodology, the data provided by [44] were prioritized for earthquakes happened before 1964. The most trustworthy data for earthquakes that happened between 1964 and 2015 came from [44,45] and information from specialized research [46,47]. Data from ISC-GEM, ISC-EHB, ISC, and NEIC-USGS were the next most reliable sources of information.
Regarding the magnitude used in the catalog, the moment magnitude (Mw) data from ISC-GEM were given preference for earthquakes that happened prior to 1964. This was followed by [44,45], ISC, and NEIC-USGS. For seismic events occurring after 1964, the following magnitudes were prioritized: Ref. [44] (using surface wave magnitude Ms), ISC, NEIC-USGS, and local magnitude (ML), respectively; Mw data from specialized studies, ISC-GEM, Global Centroid Moment Tensor (GCMT) (Mw), and the African Array Seismic Data, when accessible. The highest priority among the several magnitude types is Mw, which is followed in order by Ms, body wave magnitude (mb), and ML.
To ensure uniformity within the compiled earthquake catalog, Ref. [42] used empirical regression relationships for magnitude conversion, transforming reported magnitudes (mb, Ms, and ML) into an equivalent Moment Magnitude (Mw) scale. They used the formula given in [48] to convert mb to Mw for values up to mb 6.3 (Equation (1)), which mostly covered the Red Sea and a portion of the Gulf of Aden. Additionally, they applied empirical Equations (2)–(4)) derived in [49] for the Middle East to convert other magnitude scales (Ms, ML) into Mw. In our study region, these empirical regression relationships underwent rigorous validation against local seismic data and were cross-referenced with historical earthquake records. This validation process confirms the reliability and suitability of these formulas for accurately estimating Mw across a spectrum of earthquake magnitudes of our study area.
M W = 1.60 m b 2.89 3.6 m b 6.3
M W = 0.66 M S + 2.11 2.8 M S 6.1
M W = 0.93 M S + 0.45 6.2 M S 8.2
M W = 1.01 M L 0.05 4.0 M L 8.3
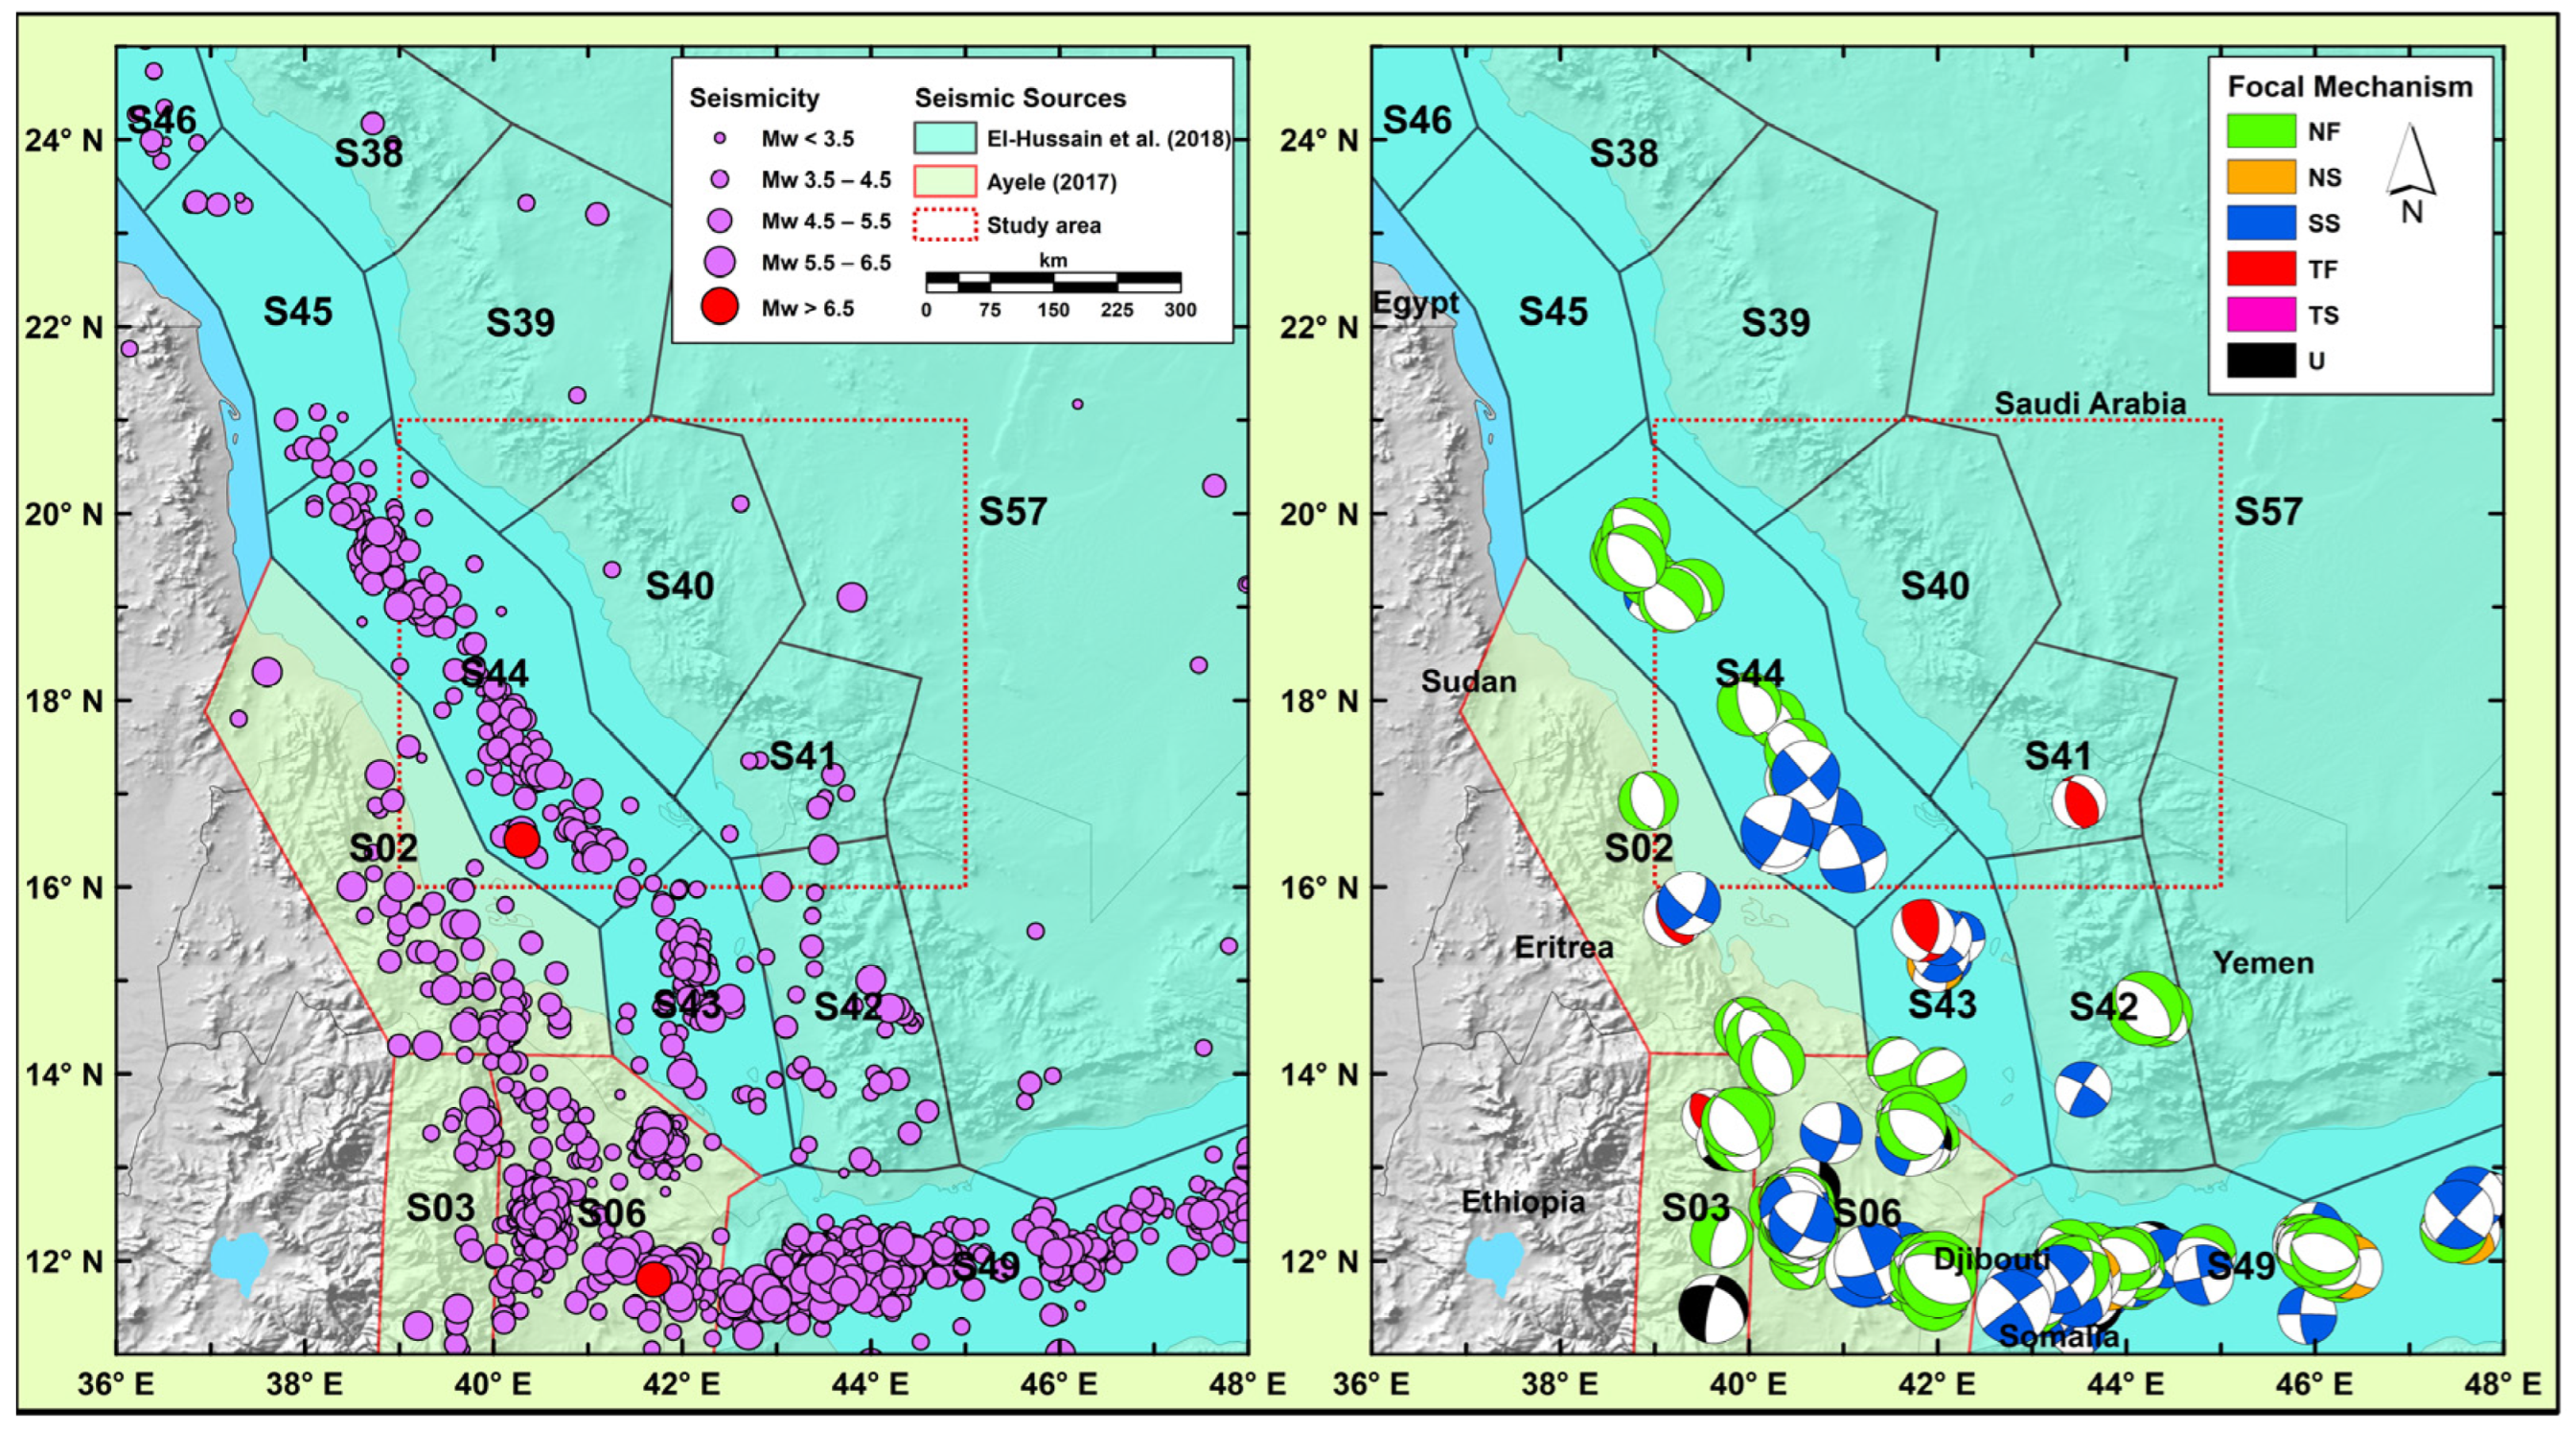
A declustered earthquake catalog was then compiled by identifying and eliminating seismic swarms, foreshocks and aftershocks, effectively filtering out all dependent events from the unified catalog [50,51]. In this study, declustering was carried out using three commonly employed algorithms, those designed in [52,53,54]. The first declustering method relies on a time window criterion to distinguish aftershocks from mainshocks based on a fixed temporal interval, often using parameters like the Omori law decay rate. The second one enhances this approach by incorporating spatial criteria in addition to temporal windows, considering both the time elapsed and spatial proximity to differentiate between mainshocks and aftershocks. In contrast, the last approach introduces a probabilistic model-based approach, utilizing statistical methods such as Bayesian frameworks to assess the conditional probability of earthquakes being aftershocks given the occurrence of a mainshock. Overall, these techniques are used to find earthquakes in the catalog that fall within the same temporal and spatial window, determining the window size based on the corresponding magnitude. The main event is defined as the largest earthquake found during the searching process. This declustering technique is essential since PSHA’s computations for any region frequently assumes that the earthquake occurrence follows a distinct distribution in both time and space (Poissonian distribution) [35]. The main rift of the Red Sea, situated between the Arabian and Nubian plates to the east and west, is where the declustered earthquakes shown in Figure 2 show a relatively greater concentration of seismic activity.
The seismic source model in this work was defined by employing data from focal mechanism solutions that were accessible until 2015. This was carried out to obtain indicative evidence of the seismotectonic conditions and the prevalent stress regime, in addition to aiding a better characterization of prospective seismic zones in the area. We primarily accessed the inventory of focal mechanisms created in [42]. Certain published studies [55,56] were given the greatest priority, followed by data from the Swiss Seismological Service for events with magnitudes above Mw 5.5 since 1976, the GCMT, and finally the NEIC-USGS catalog. The frequency of normal-faulting solutions along the Red Sea Rift between the Nubian and Arabian Plates is clearly observed in Figure 2. Strike-slip faulting processes, the second most prevalent type, are clearly visible at the transverse faults of the Red Sea Rift and are predominant in the Gulf of Aden area. Lastly, in a few cases, reverse-faulting mechanisms are observed; these may be connected to local tectonic processes.

2.2. Seismic Source Model

For this assessment, two previous source models were considered after carrying out some modifications, those in [33] for Ethiopia and those in [34] for the Arabian Peninsula. Given the two seismic source models mentioned above, we aimed to refine and adapt the boundaries of these sources based on our geological and structural understanding of the Red Sea Rift. Previous models were originally designed for regional assessments of the Arabian Peninsula and Ethiopia; therefore, we adjusted the boundaries of seismic sources on both sides of the rift and meticulously reviewed seismicity parameters to ensure accuracy and relevance to our specific study area. Leveraging a unified earthquake catalog [42] alongside additional geological, tectonic and seismic crustal data, Ref. [34] proposed and characterized a source model for the Arabian Peninsula. The current study’s focal area is between 16° and 21° N latitude and 39° and 45° E longitude. Eleven seismic sources previously identified in [34] were considered, modified, and included as potential contributors to hazard in southwest Saudi Arabia. These sources are shown in Figure 2 and described in Table 1. They are designated as S38 to S49 and S57. Additionally, three additional zones (S02, S03, and S06) were considered and modified based on [33], a study on seismic hazard in Ethiopia. This was carried out to account for potential seismic hazard resulting from activity west of the Red Sea Rift. Below, we offer an overview and characteristics of the seismic sources considered.
The majority of the Hijaz terrane, which is characterized by surface lineaments generally oriented in a NW-SE orientation parallel to the axis of the Red Sea, is included in the Hijaz seismic source, designated as S38. There have been recent as well as past seismic events in this region. Seismic activity in this source, including that which occurred during 1256, 1293, and 2009, is significantly associated with volcanic phenomena (e.g., volcanic activity at Harrat Lunier).
The Jeddah seismic source, named S39, is distinguished by its northeast-trending surface fault lines running parallel to the Red Sea’s transform faults. This northeast-trending structure is controlled by the Ad-Damm Fault, which reaches beyond Al-Taif from the coastal plain. Ref. [57] proposed that this fault has presented right-lateral movement since the Precambrian. The activity of the fault is supported by data from the Saudi National Seismic Network’s micro-earthquake records and the studies conducted in [15]. This fault has been linked to several past earthquakes with magnitudes close to M 5.0.
The S40 Tihama seismic zone covers a large portion of the Asir geological terrane and is located north of the Jizan seismic source (S41). It can be identified by its N- and NE-trending lineaments, which display complex strike-slip, normal, and reverse faulting patterns [58]. Delineating the northern boundary of this source is the Ad-Damm Fault.
The Yemen volcanic trap series and the Arabian Shield are split apart at their southern boundary by the Jizan seismic source, named as S41. Because of its relatively higher seismic activity, it differs from its nearby northern seismogenic zone. The Oligocene-Miocene rifting processes located in the Red Sea and volcanic events are responsible for the earthquake’s activity in this area. The most significant recorded earthquake in this region was on January 11, 1941 (Mw 6.2). Furthermore, this seismic source contains a seismic sequence that included an ML 5.1 event on 23 January 2014 [59].
Earthquake activity has occasionally been detected in the Red Sea and its coastal districts, as well as in inland areas, from the Yemen seismic source, designated as S42. The first known catastrophic occurrence in this source is the historic Ma’rib Dam earthquake, which happened in 460 AD [44]. The 1982 Dhamar earthquake (Mw 6.2), which occurred more recently, caused extensive damage, fatalities, and ground deformation. This event was followed by a significant number of aftershocks that lasted for around a month. Modeling the seismicity of the volcanic trap series is the goal considered in this seismic zone. Its borders to the west and south align with the lines dividing Yemen’s continental crust from the oceanic crusts of the Gulf of Aden and the Red Sea, respectively.
The Afar triple junction (zones S02 and S06), which is host to the Southern Red Sea source, S43, is distinguished by a relatively high seismic activity. The spatial distribution of the epicenters shows that there is a relationship between the locations of earthquakes and the axial trough and NE-trending faults; it also includes scattered seismic activity in the entire zone. A prominent transform fault-oriented northeast defines the northern border of this seismic source. The distribution of epicenters further highlights the alignment of NE-trending transform faults and the axial trough faults with earthquake locations, indicating activity within these fault systems.
An axial trough that is well-developed and resulting from seafloor spreading over the preceding 5 million years is a defining feature of the Central Red Sea source, here named S44 [60]. The axial trough is where the majority of the earthquake activity in this zone happens. The beginning of a transition zone dividing the continental crust to the north from the oceanic crust to the south coincides with the source’s northwest boundary. Interestingly, a large earthquake happened in this area in 1967 (mb 6.7).
Tectonically, a fractured axial trough made up of several shallow inter-trough areas and deeps is what identifies the Transition Red Sea source, named S45 [60]. The majority of the faults in this zone trend almost exactly north–south. Significantly, seismic activity has been reported to diminish north of latitude 21° N.
In contrast with the S45 zone, the Northern Transition Red Sea source, named S46, displays a different fault trend, with the majority of faults aligned northwest–southeast as opposed to north–south. The transform faults heading northeast, and the associated seismic activity are in line with the northern boundary, which is roughly located at the latitude 25° North. Compared to the central and southern zones, this zone has very little, scattered seismicity.
The Sheba Ridge spreading center, which reaches into Djibouti and approaches the Afar triple junction, is a defining feature of the Western Gulf of Aden source, named S49. The Alula Fartak Fault, which shifts the Sheba Ridge by around 160 km, is the most notable of the linear northeast-trending transform faults defining the Sheba Ridge. The Gulf of Aden’s central axis experiences the majority of its seismic activity, while there are also infrequent earthquakes occurring northeast of the Gulf. Block changes near the border of the Arabian and Nubian Plates may be the cause of these phases [47]. In 2006, the largest earthquake ever recorded in the Gulf of Aden occurred here (Mw 6.6). Tensile stress mechanism is the primary cause of earthquakes across the Gulf of Aden.
The Arabian Plate’s areas with comparatively low seismic activity are included in the seismicity background zone, named S57, as defined in [34]. The Arabian Peninsula’s regions not covered by other clearly defined seismic sources are mainly covered by it.
Moreover, to the west of the rift, three new seismic sources (designated as S02, S03, and S06) were proposed and revised, added to the sources already taken into consideration. Most of these sources are from the Ethiopian research conducted in [33], where seismic activity is mostly linked to the Afar Depression. Here, the diverging plate boundaries of the East African Rift, the Gulf of Aden and the Red Sea intersect to form a complex triple junction. Based on the work by [61], which identified and characterized seismic sources using regional geology, tectonics and seismicity data, is Ayele’s assessment for Ethiopia. In order to identify these extra seismic sources, these conclusions were further refined using fault plane solutions and additional seismic data.
A doubly bounded exponential model (Equation (5)), as suggested by [62], was used to model the magnitude recurrence relationship in these sources. As such, the recurrence parameters were evaluated using this relation. Considering the different degrees of completeness in the catalog under analysis [42], the method described in [63] was applied. By taking into consideration varying completion durations at different magnitude levels, this method determines the coefficients for every identified seismic source.
N M max M M min = N M min exp β M M min exp β M max M min 1 exp β M max M min
Here, Mmin denotes a chosen reference lower magnitude that can impact engineered structures, Mmax denotes the maximum expected earthquake that could be generated by the seismic source, and β is the coefficient b multiplied by ln10, b being the slope from the [64] model.
The maximum expected magnitudes (Mmax) were then calculated using the techniques described in the publications [65,66,67]. This is due to varying earthquake completeness levels in the used earthquake catalog [42]; thus, the coefficients of the [62] model cannot be accurately determined through direct regression. Therefore, we applied the approach proposed by [63], which considers different completeness times for various magnitude levels. Software based on methodologies in [65,66,67] was utilized for determining maximum earthquake magnitudes. Table 1 provides the seismicity parameters, which include the highest potential magnitudes, b-values, and annual rates of events exceeding Mw 4.0 for all the seismic sources under consideration.

2.3. Ground Motion Prediction Equations

In regions where data are limited, selecting appropriate GMPEs is not straightforward. Developing robust, region-specific GMPEs may not be feasible in such cases. Therefore, it becomes necessary to choose models developed for other regions while filtering out candidate models based on specific criteria [68]. Recently published GMPEs incorporate terms accounting for various factors beyond just magnitude and distance. Faulting style, site effects (both shallow and deep site effects), hanging wall effect, and an aleatory uncertainty model are some of these factors [69].
The selection of a GMPE should be closely aligned with the predominant seismotectonic conditions in the area under study [70,71]. In light of the seismotectonic setting, GMPEs that have been created globally can be broadly divided into three groups [72,73,74]: (i) models appropriate for locations with active crustal tectonics, such as [75,76,77] models, where shallow crustal earthquakes are common; (ii) models developed for regions with active subduction tectonics, [78,79,80,81] models, and (iii) models appropriate for stable continental regions, such as [82,83,84] models. In the present work, taking into account both the faulting mechanism data and the prevailing regional tectonic conditions, the proposed source models align with the first category, i.e., active shallow crustal sources.
For the current assessment, globally recognized GMPEs are essential because there are not locally developed GMPEs for the study area. Then, three models from the Next-Generation Attenuation (NGA) West 2 models were selected in accordance with the selection criteria for GMPEs as stated in [68,85]. This decision was taken to mitigate potential uncertainties stemming from incomplete knowledge of attenuation characteristics for shallow seismic sources. Several guidelines were proposed in [68] for selecting GMPEs in PSHA. The authors’ approach suggests that selection should not be influenced by familiarity with specific GMPEs or their creators, nor by personal preferences of the analyst. Instead, the hazard analyst should start with a comprehensive list of equations meeting standard scientific criteria from international peer-reviewed journals. Criteria for exclusion include the following: (a) models derived for inappropriate tectonic environments, (b) models not published in Thomson Reuters ISI-listed peer-reviewed journals, (c) lack of accessible datasets used in model derivation, (d) supersession by more recent publications, (e) inability to provide spectral predictions across adequate response periods, (f) absence of non-linear magnitude dependence or magnitude-dependent decay with distance, (g) models not derived using appropriate statistical approaches (one- or two-stage maximum likelihood or random effects), (h) inappropriate definitions of explanatory variables or neglect of site effects, (i) limited applicability range for necessary extrapolations in PSHA (magnitude and distance), and (j) constraints from insufficient dataset sizes (fewer than 10 earthquakes per magnitude unit or fewer than 100 records per 100 km distance). These criteria aim to ensure that the selected GMPEs are robust, suitable for the specific boundary conditions of the PSHA, and scientifically sound. Accordingly, the three selected models from NGA West 2 [75,76,77] were chosen for their robust datasets, statistical methodologies, and comprehensive predictive capabilities across varied response periods, aligning well with our study’s seismic hazard analysis needs. Taking into account such criteria, the selected attenuation models for modeling shallow crustal earthquakes, those of [75,76,77], were integrated into a logic tree scheme. It was determined that these models were the most suitable due to the incorporation of magnitude ranges, oscillation periods, distance intervals, and soil type classifications.
The attenuation model [75] is designed exclusively for shallow crustal earthquakes with magnitudes ranging from Mw 3.0 to 8.5. It is applicable to rupture distances (Rrup) of up to 300 km and oscillation durations of up to 10.0 s. The ground motion dataset was chosen from the NGA-West2 database [86]. This attenuation model was developed using a strong-motion dataset comprising 15,750 recordings derived from 326 earthquakes. Among these, 221 events are strike-slip, 79 are reverse events, encompassing the full range of magnitudes, and 26 are predominantly normal events falling within the magnitude range of 4.6 to 6.0. China, Japan, Taiwan, Europe, the Middle East, and California were among the regions from which the earthquake data were gathered. In this attenuation model, recordings from regions with limited sampling are restricted to a maximum distance of 80 km, whereas recordings from California, China, Taiwan, and Japan extend up to 400 km. Beyond 80 km, variations in crustal structure significantly influence ground motion, impacting attenuation over long distances. Accordingly, regional disparities are incorporated into the GMPE to accommodate these variations. The two parameters that this model employs to characterize the site conditions are the shear wave velocity (Vs,30) value and the depth to the Vs,30 value equal to 1.0 km/s. Although the largest magnitude in the NGA dataset is M 7.9, this selected GMPE model can be reliably applicable and extrapolated to M 8.5. Regarding site conditions, the model is considered suitable for Vs,30 values among 180 m/s and 1000 m/s.
In order to predict the horizontal ground motion amplitudes resulting from shallow crustal earthquakes, Ref. [77] introduced an NGA model. The empirical dataset used to generate this model was also chosen from the NGA-West2 ground motion database [86]. In order to account for fault dip and rupture directivity effects, it includes terms related to faulting style, scaling with sediment thickness, depth-dependent scaling to the rupture’s top, and extra terms. This second model is considered suitable for earthquakes with magnitudes between Mw 3.5 and 8.5 for the case of strike-slip events, and between Mw 3.5 and 8.0 in the case of reverse and normal faulting earthquakes. Additionally, it is appropriate for Vs,30 spanning from 180 to 1500 m/s, and Rrup up to 300 km. Concerning the applicability and limitations of this selected model, in comparison to the [87] model, the lower limit of the applicable magnitude range was reduced to M 3.5 due to the large number of small earthquakes included in this update; also, the upper limit of the applicable distance range was increased from 200 km to 300 km because of the extensive data available for distances between these two distances.
Using an extended Pacific Earthquake Engineering Research Center-NGA-West2 database, Ref. [76] created a novel GMPE for the average horizontally component of the PGA, PGV, and pseudo-absolute acceleration response spectra throughout 21 periods ranging from 0.01 s to 10 s. The employed ground motion database in this model is a subset of the PEER NGA-West2 database [86], which was updated to include earthquakes up to 2011. The NGA-West2 database contains over 21,000 three-component recordings from earthquakes in California and worldwide, with Mw ranging from 3.0 to 7.9. Most of the recordings used in the database represent free-field site conditions. In active tectonic environments, this attenuation model is thought to be appropriate for measuring horizontal ground motion caused by shallow crustal earthquakes. Depending on the underlying process, it encompasses Rrup up to 300 km and Mw values from 3.3 to 7.5–8.5. NEHRP site classifications B, C, D and E correspond to a range of Vs,30 values between 150 and 1500 m/s, for which the model is suitable. This ground motion model is considered valid under the following general conditions: maximum magnitudes of M ≤ 8.5 for strike-slip faults, M ≤ 8.0 for reverse and reverse-oblique faults, and M ≤ 7.5 for normal and normal-oblique faults.
The coherence and compatibility of the three selected GMPEs were systematically assessed through a structured approach. Initially, the chosen attenuation models were standardized to operate on the Mw scale consistently. Subsequently, all selected models were adjusted to utilize the same definition for the distance term (Rrup), thus obviating the need for additional conversions of magnitude or distance. Ultimately, using the Vs,30 value, two soil classes were developed to describe the characteristics of the soil conditions. These classifications, which represented average Vs,30 values of 760 and 560 m/s, respectively, correlate with the B/C and C NEHRP site classes. These classifications distinguish from dense soils to soft rocks (class C) and extremely dense soils (class B/C boundary). Crucially, every one of the chosen GMPEs describes the site conditions in terms of Vs,30; so, no additional adjustments to this parameter are required.

2.4. Estimation of Seismic Hazard by Using a Logic Tree

Following the methodology described by [88], contemporary earthquake hazard assessment procedures must take uncertainties in the location, magnitude, and frequency of seismic events into consideration because these variables have a direct impact on the ground shaking levels felt at a given location [89]. Logic trees, which give distinct subjective weights to various estimations for every input parameter, are used to handle some of these uncertainties. Using a logic tree approach makes it possible to include and measure what is referred to as epistemic uncertainty in the hazard estimation [90,91]. A lack of understanding about the inputs used in the hazard assessment gives rise to epistemic uncertainty.
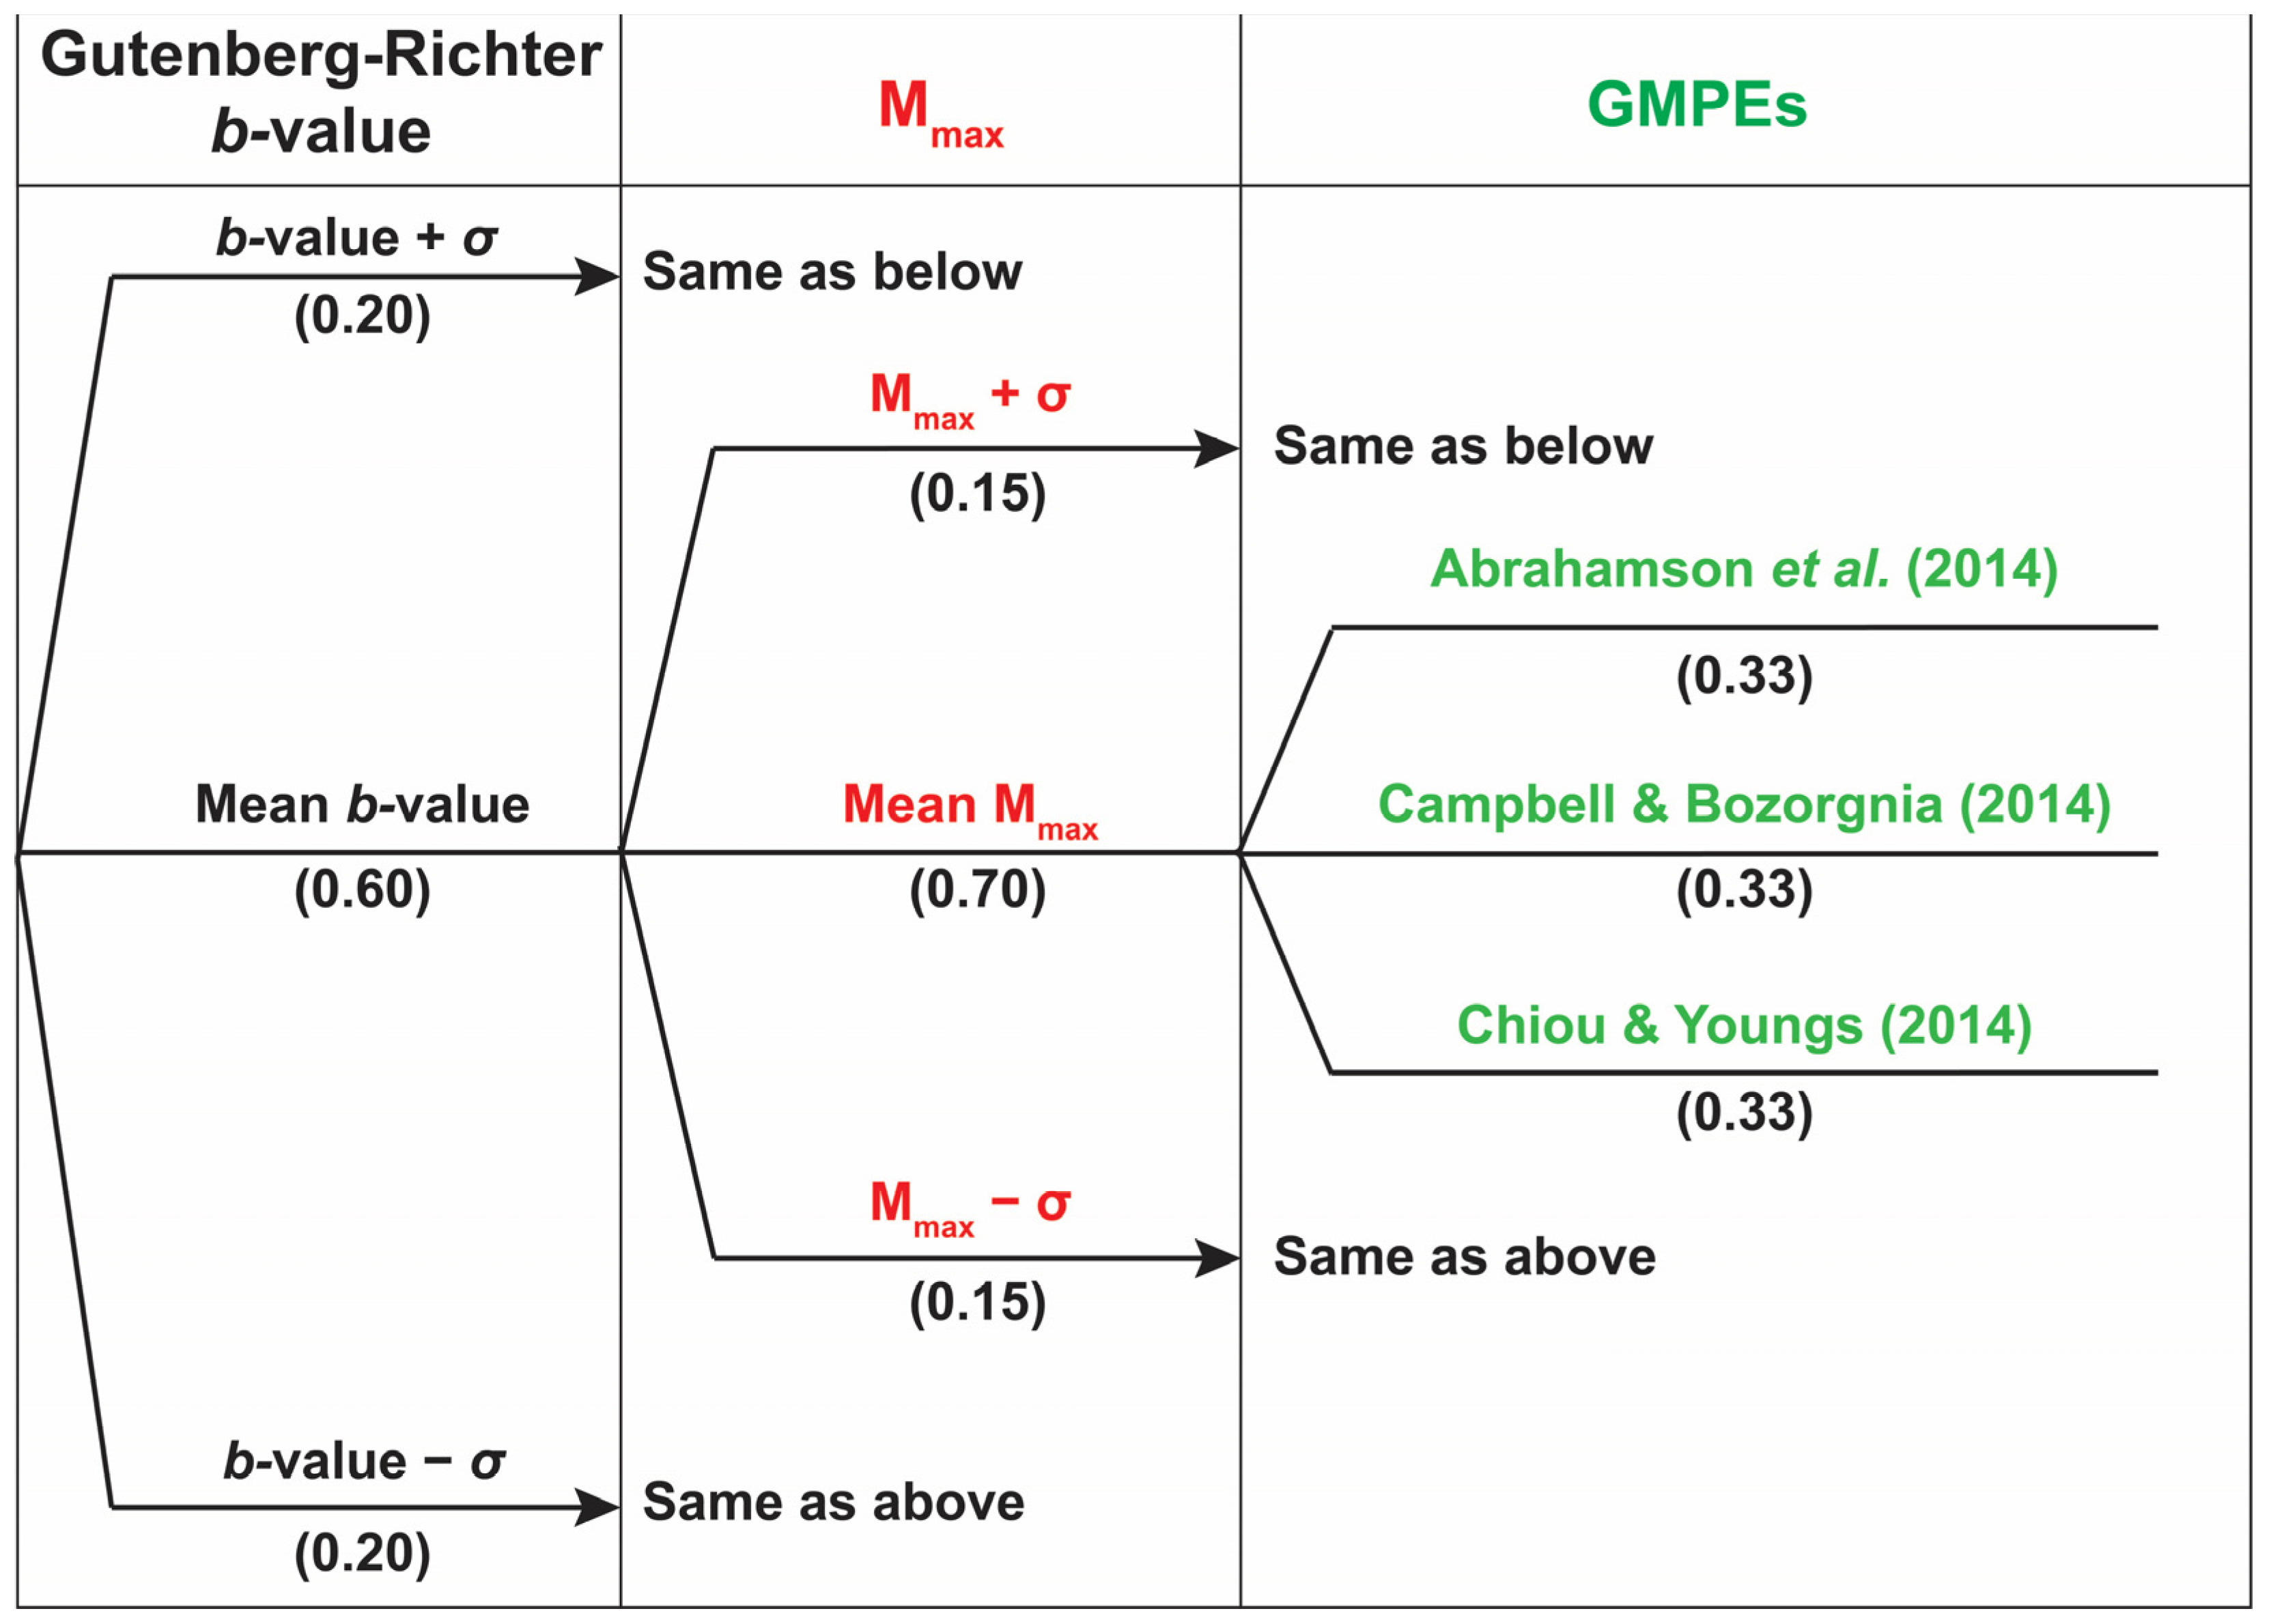
In this assessment for southwestern Saudi Arabia, addressing potential uncertainties associated with specific input parameters was paramount, leading to the adoption of a logic tree design (Figure 3). A sensitivity analysis was initially conducted to identify the most critical parameters and models for hazard computation and to understand their impact on the final PSHA results. To conduct this analysis and evaluate the parameters significant for PSHA, some sites were selected for a detailed inspection. For these selected sites, PGA values for a return period of 475 years were computed considering all the different input parameter options (Mmin, Mmax, λ-value, b-value, GMPEs). As a result, notable differences in the PGA results were observed, while the Mmax, b-values, and GMPEs were varied. This indicates that these three parameters are the most critical factors in the hazard assessment, based on the proposed seismic source model. Accordingly, three essential components for the logic tree scheme were found by this thorough sensitivity analysis of the input parameters: the chosen GMPEs, the expected maximum magnitude, and the Gutenberg–Richter b-value.
Here, the utilized logic tree comprises a total of 27 branches, each one representing a different seismic hazard scenario. For the Gutenberg–Richter b-value, three branches were established to consider the uncertainty linked to its estimation. The mean value carried a higher weight (0.6), while lower weights (0.2) were assigned to the other two branches (b + σ and b − σ values). Similarly, for the expected maximum magnitude, three branches with varying weights (0.7 for the mean estimated Mmax value, and 0.15 for both Mmax + σ and Mmax − σ values) were incorporated. The subjective weights were determined based on previous studies for consistency [70,71,72,73,74,92,93,94]. In the final node of the logic tree, three NGA-West2 attenuation equations [75,76,77] were selected for application alternately in the context of shallow crustal seismic sources. Equal weight (0.33) was assigned to each branch, in line with criteria from previous literature [70,71,72,95,96], indicating an equal level of user confidence. The rationale behind assigning equal weight to the selected NGA-West2 GMPEs follows practices in similar publications worldwide [70,71,72,95,96]. These GMPEs were chosen due to their strong scientific credibility, broad acceptance in the seismological community, and relevance to the tectonic setting of the study area. By weighting them equally, we aimed to ensure a balanced and unbiased representation of ground motion predictions, thereby enhancing the robustness of the PSHA results.
Considering that the weights assigned to the branches in the designed logic tree reflect our subjective confidence based on and following several published articles [70,71,72,95,96], assigning different weights to these branches in a seismic hazard assessment will directly impact the final hazard estimates. This adjustment will change the relative importance of various seismic source models, GMPEs, and other parameters, potentially resulting in variations in the calculated seismic hazard levels. Consequently, this can lead to different hazard results, influencing building design codes and risk mitigation strategies in the assessed region.
In the current investigation, the seismic hazard estimates were calculated using the well-known probability theorem as reported in [28]. The exceedance rates for a given quantity of ground motion were expressed for the site classes that were considered. The main output of a PSHA is the seismic hazard curve, which describes the annual frequency of exceedance for different values of a selected ground motion parameter. The fundamental concept behind the computations to obtain this curve is relatively straightforward. First, a target ground motion level (y) for a ground motion parameter (Y; usually PGA or SA) is chosen. Next, the probability of exceeding this target value is calculated for one of the magnitude–distance scenarios considered in the seismicity model and then multiplied by the probability that this specific scenario would occur, P(Y > y│M, r, ε). Finally, this probability is multiplied by the overall rate of earthquakes with magnitudes above the Mmin of interest in the seismic source corresponding to the magnitude–distance scenario. This process is repeated for all possible magnitude–distance scenarios in the seismicity model, and the associated rates of each scenario are summed. When this is carried out for different ground motion levels, a seismic hazard curve is generated. Therefore, the average rate of exceeding a specified ground motion level is represented by Equation (6).
γ Y > y = i = 1 N sources λ i M min M max r = 0 ε = f m i M f r i r f ε ε p Y > y | M , r , ε d M d r d ε
where P(Y > y│M, r,ε) is derived from the ground motion model, and fmi(M) and fri(r) represent the probability distributions for magnitude and distance, respectively. ε denotes the number of standard deviations in the ground motion model needed to achieve the target ground motion for a specific magnitude and distance, and λi denotes the earthquake occurrence rate for events with magnitudes equal to or greater than Mmin for source i. Events with magnitudes below Mmin are considered incapable of generating ground motions that could cause structural damage.
This theory underpins the computation of seismic hazard estimates through the integration of probabilistic elements including ground motion models, distributions of magnitude and distance and earthquake occurrence rates. It helps mitigate uncertainties in hazard estimation by quantifying the probability of various ground motion levels occurring over time, accounting for the variability in seismic sources and GMPEs.
The accessible visual interface of the Windows-based R-CRISIS software [97,98], a proven and verified tool with the help of ArcGIS, was utilized to execute the evaluation and implement all input data models. In order to conduct this evaluation, calculations were carried out using a grid covering the entire region of interest with a 0.1° × 0.1° spacing. The present study computes the seismic hazard for two different site classes, corresponding to the soil types NEHRP B/C and C.
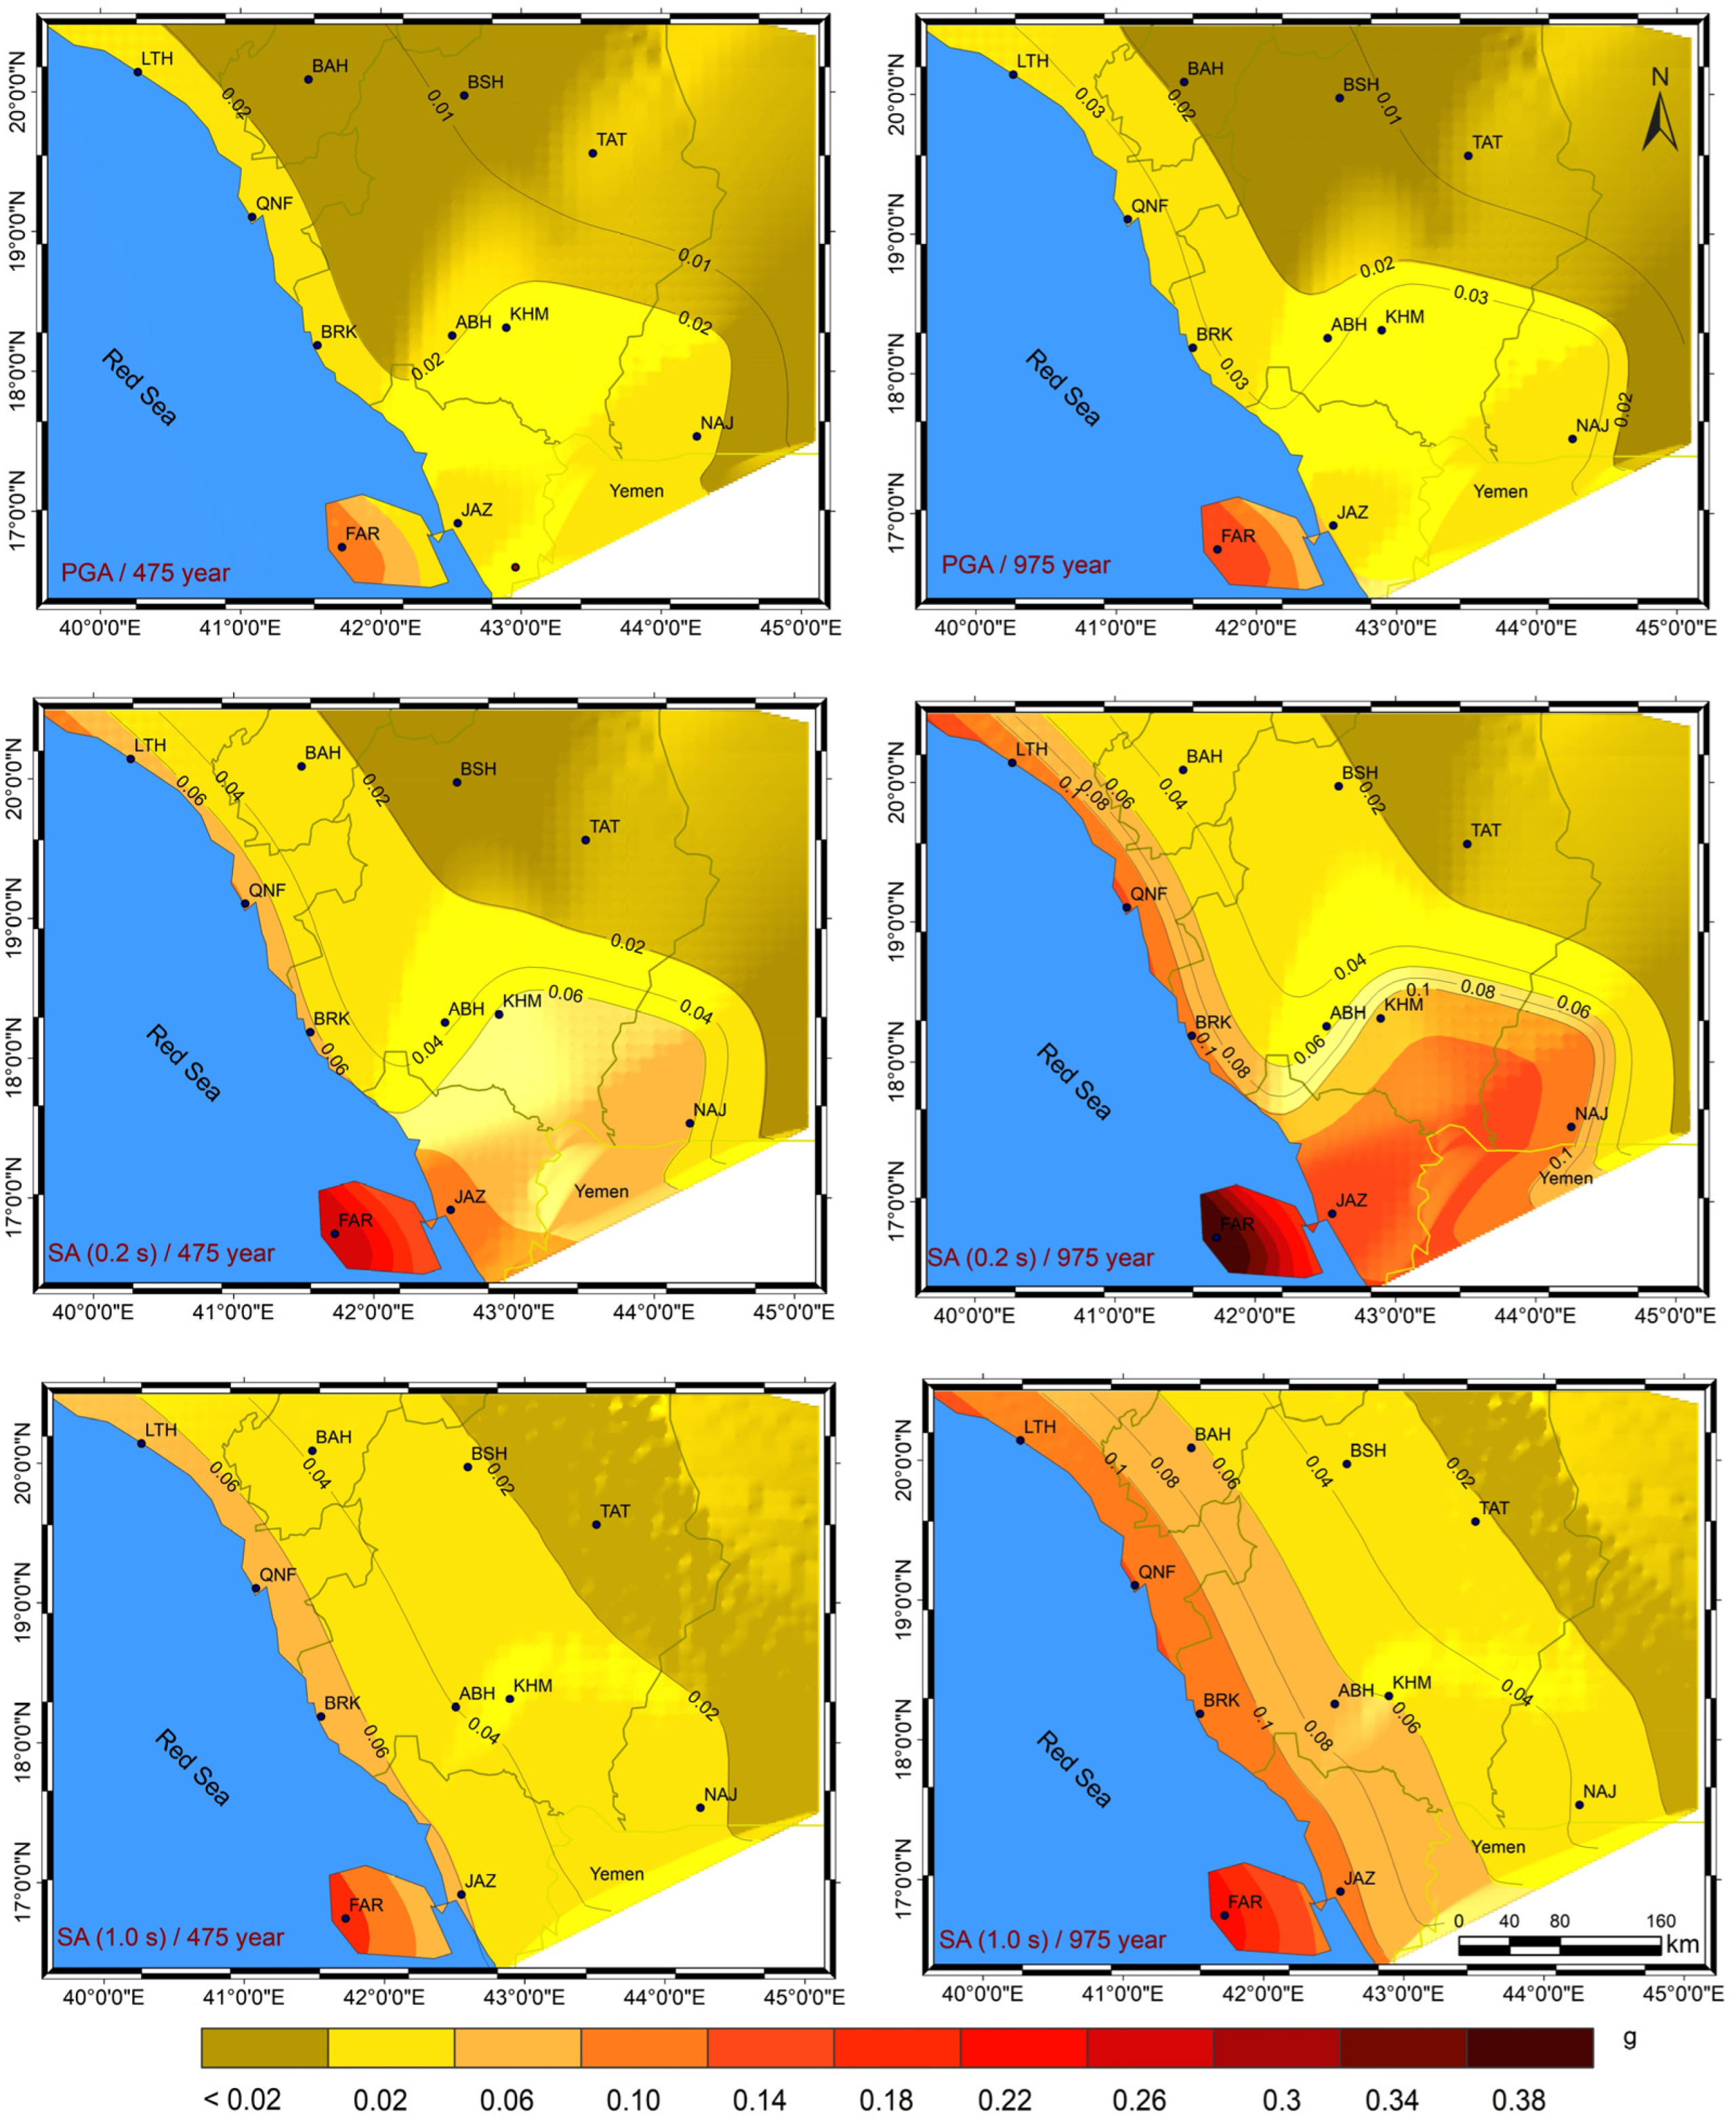
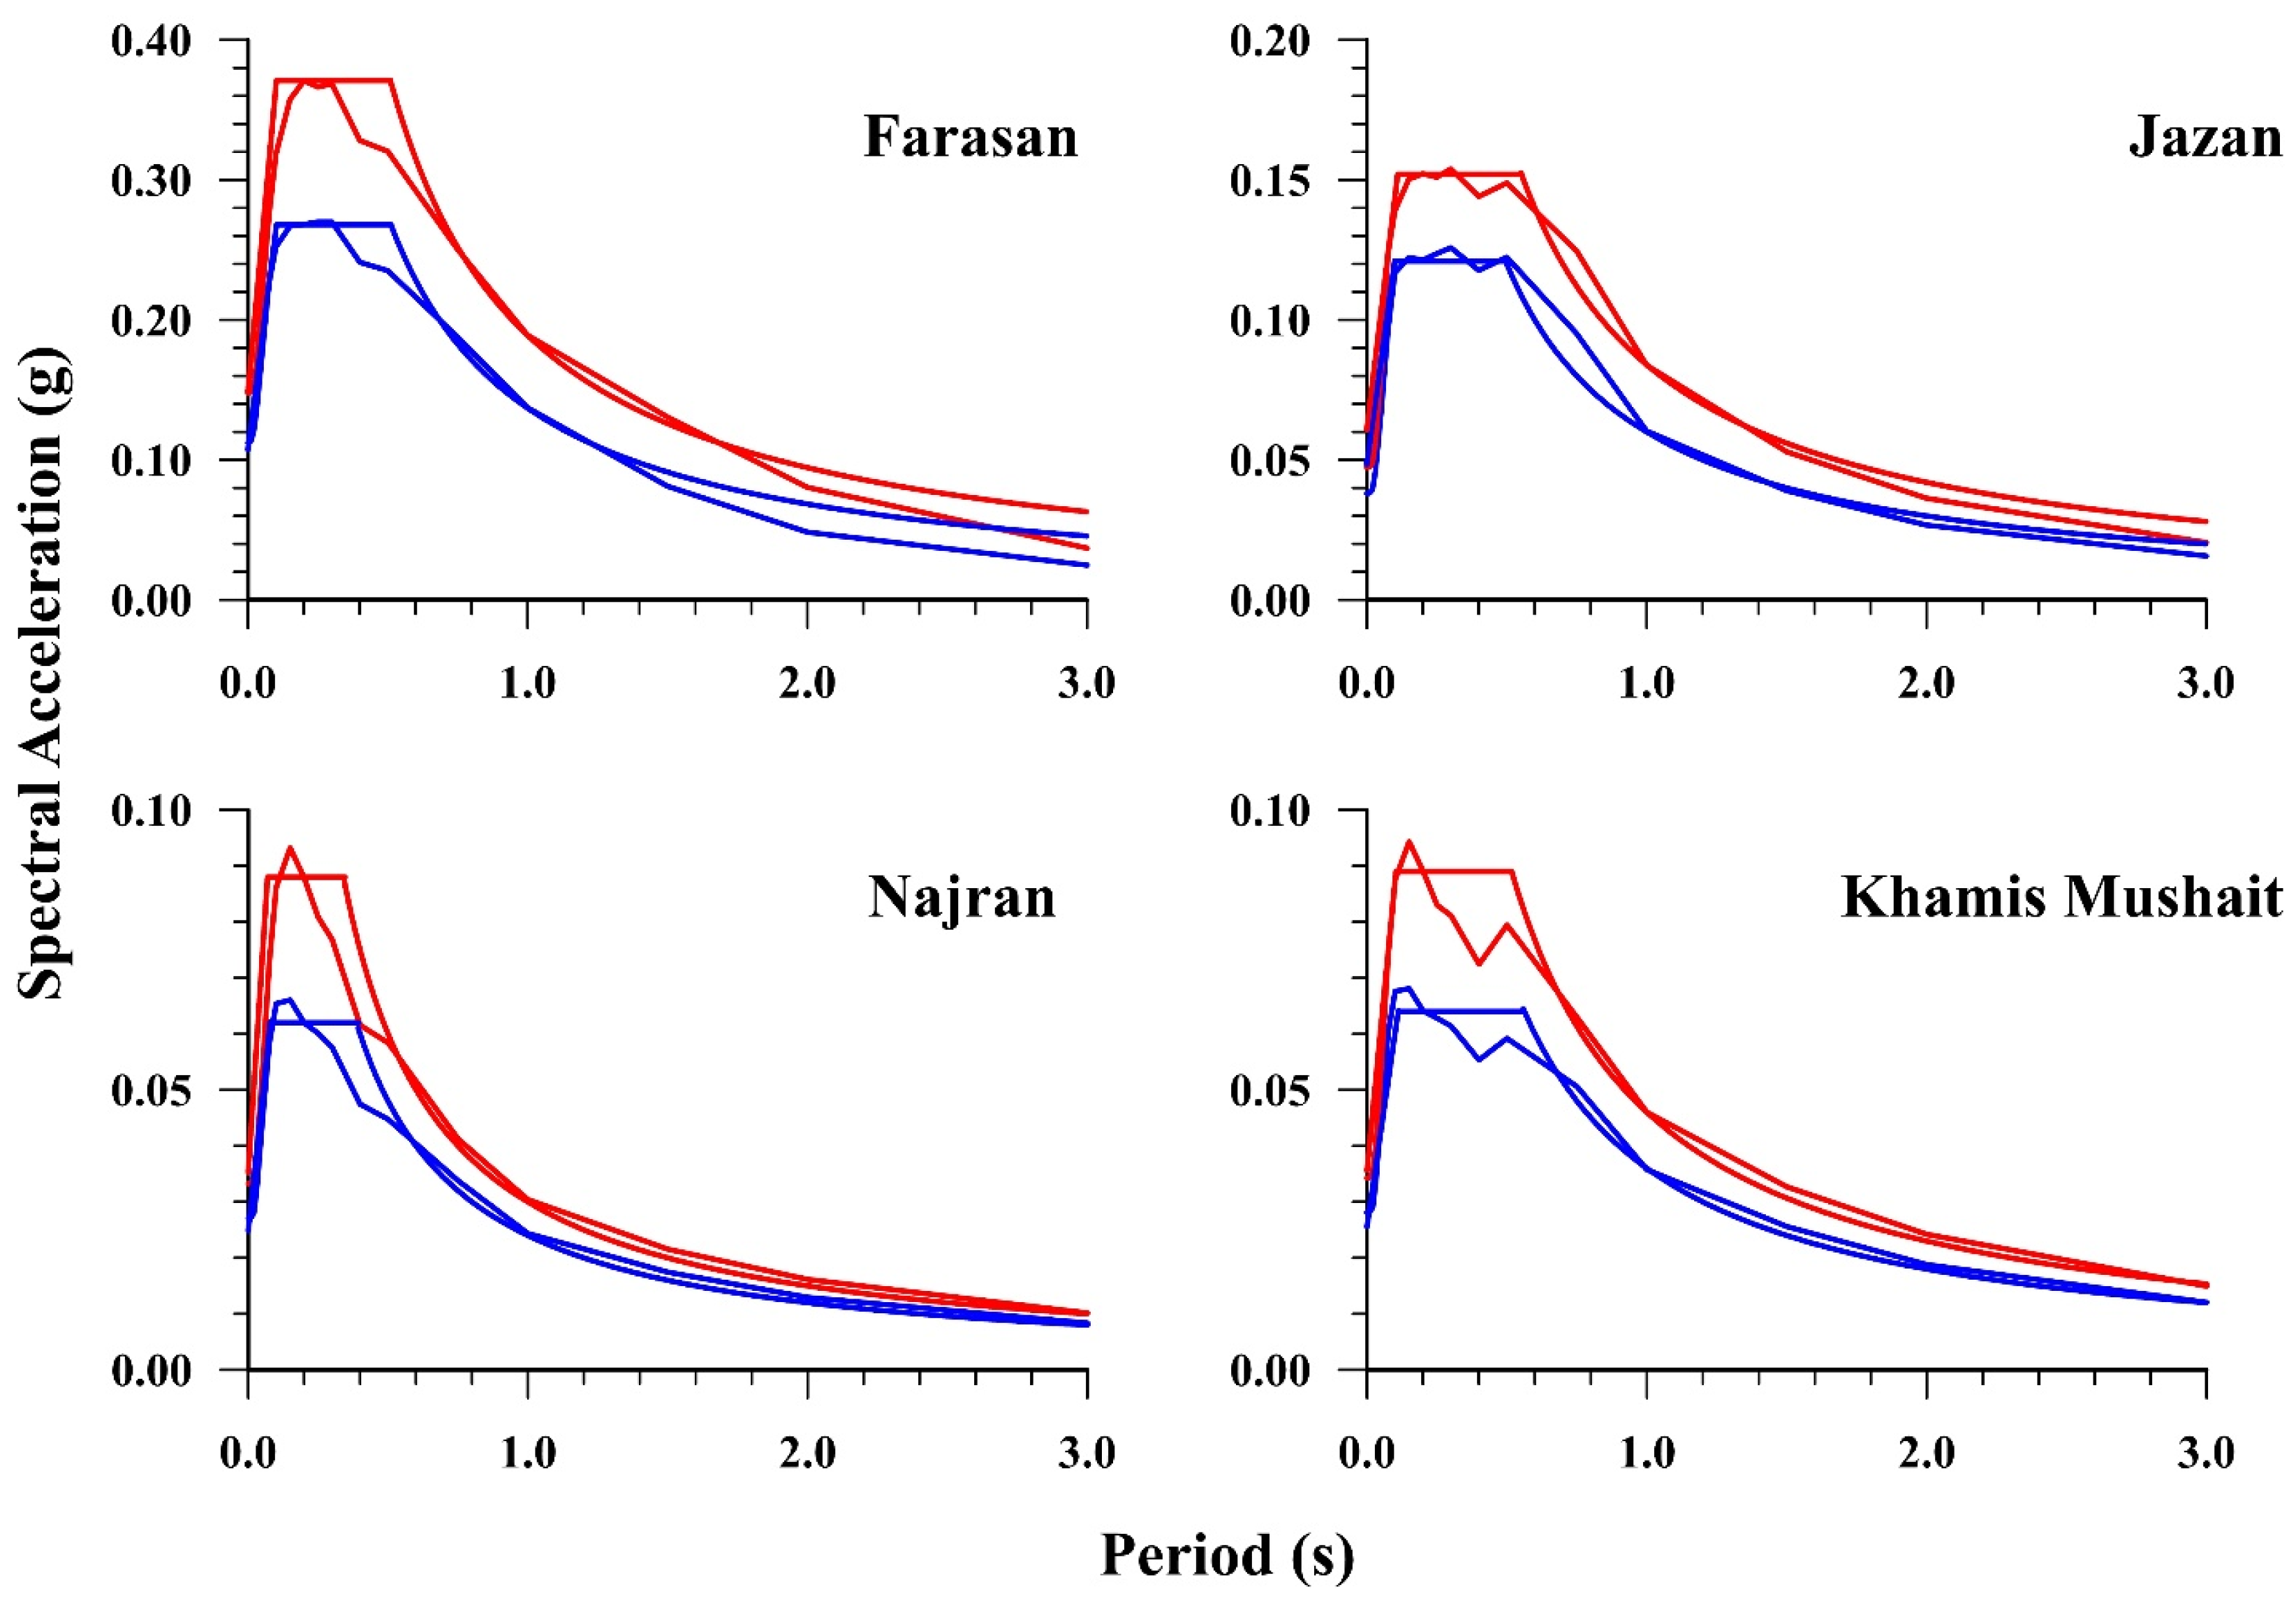
Seismic hazard values were calculated for mean PGA and SA for oscillation periods ranging from 0.01 to 10.0 s (0.01, 0.02, 0.03, 0.05, 0.075, 0.1, 0.15, 0.2, 0.25, 0.3, 0.4, 0.5, 0.75, 1.0, 1.5, 2.0, 3.0, 4.0, 5.0, 7.5, and 10.0 s). For a 50-year period, these computations were conducted at 10% and 5% exceedance rates, corresponding to 475- and 975-year return periods, respectively. Using ArcGIS© software, all ground motion variables were represented to create hazard maps to visualize the results. In particular, isoacceleration seismic hazard maps (for a Vs,30 value of 760 m/s) were created for the B/C NEHRP site class. These maps show the average PGA and SA values for the 475- and 975-year return periods at 0.2 and 1.0 s (assuming a 5% damping ratio). The uniform hazard spectrum (UHS)’s general shape was represented by the two oscillation periods (0.2 and 1.0 s). Furthermore, under various site conditions, hazard curves and UHS are provided for well-known cities in southwest Saudi Arabia. It has been suggested that a design response spectrum (based on both SA values for 0.2 and 1.0 s) might be used for some cities as an alternative to the present seismic design regulations, which only take into account PGA values. This method is based on the approach in [99] and is extensively explained in [100]. These suggested design spectra are outlined for the two site conditions taken into consideration.
The current seismic hazard assessment’s outputs provide designers and engineers with revised hazard data, such as PGA and SA, UHS, design spectra, and hazard curves for two distinct soil classes and return periods.

3. Results and Discussion

Within the boundaries of the Red Sea Rift, the computed hazard results (Figure 4) exhibit a continuous distribution with greater values, especially along the southern shore. Because it is located close to the border between the Nubian and the Arabian Plates, this area of study has the highest seismic hazard levels when compared to other areas. The contours maps (see Figure 4) that show PGA, SA at 0.2 s (SA (0.2 s)), and SA at 1.0 s (SA (1.0 s)) highlight the fact that regions close to the Red Sea shore have significantly higher hazard levels than those further inland. In other words, hazard decreases toward the northeastern perpendicularly to the Red Sea Rift. This is consistent with the hypothesis that higher seismic hazard values are obtained in the vicinity of the rift.
In this context, 11 significant cities were selected for a detailed computation (Figure 4 and Figure 5), guided primarily by factors such as their geographic distribution across the studied area, socioeconomic significance, population density, and proximity to the Red Sea Rift. Ground motion values up to 0.14, 0.26 and 0.18 g for mean PGA, SA (0.2 s) and SA (1.0 s), respectively, are shown in the southwest part of the studied region under B/C NEHRP site conditions and with a 10% probability of occurrence over 50 years (equivalent to a return period of 475 years) (see Figure 4). In particular, the obtained mean PGA values for the cities of Farasan (located on the Farasan Island) and Jazan are 0.11 and 0.04 g, respectively, obtaining 0.03 g in the cities of Al Qunfundhah, Al Lith and Al Birk (refer to Table 2).
Similarly, for these cities and soil conditions, the equivalent SA (0.2 s) values are 0.27, 0.12, 0.10, 0.08 and 0.07 g, respectively. On the other hand, cities farther northeast, like Tathleeth, Bisha and Al Bahah, exhibit even lower hazard levels. For example, the obtained PGA values for a 475-year return period under B/C soil conditions are below 0.02 g. Cities at intermediate distances from the rift zone, such as Khamis Mushait, Najran and Abha, display PGA values under B/C soil conditions for a 475-year return period of 0.03, 0.03 and 0.01 g, respectively, and SA (0.2 s) values of 0.06, 0.06 and 0.01 g, respectively. Table 2 provides additional ground motion values, estimated return periods, and site characteristics for these cities. These data become an important source for more in-depth local studies in the future.
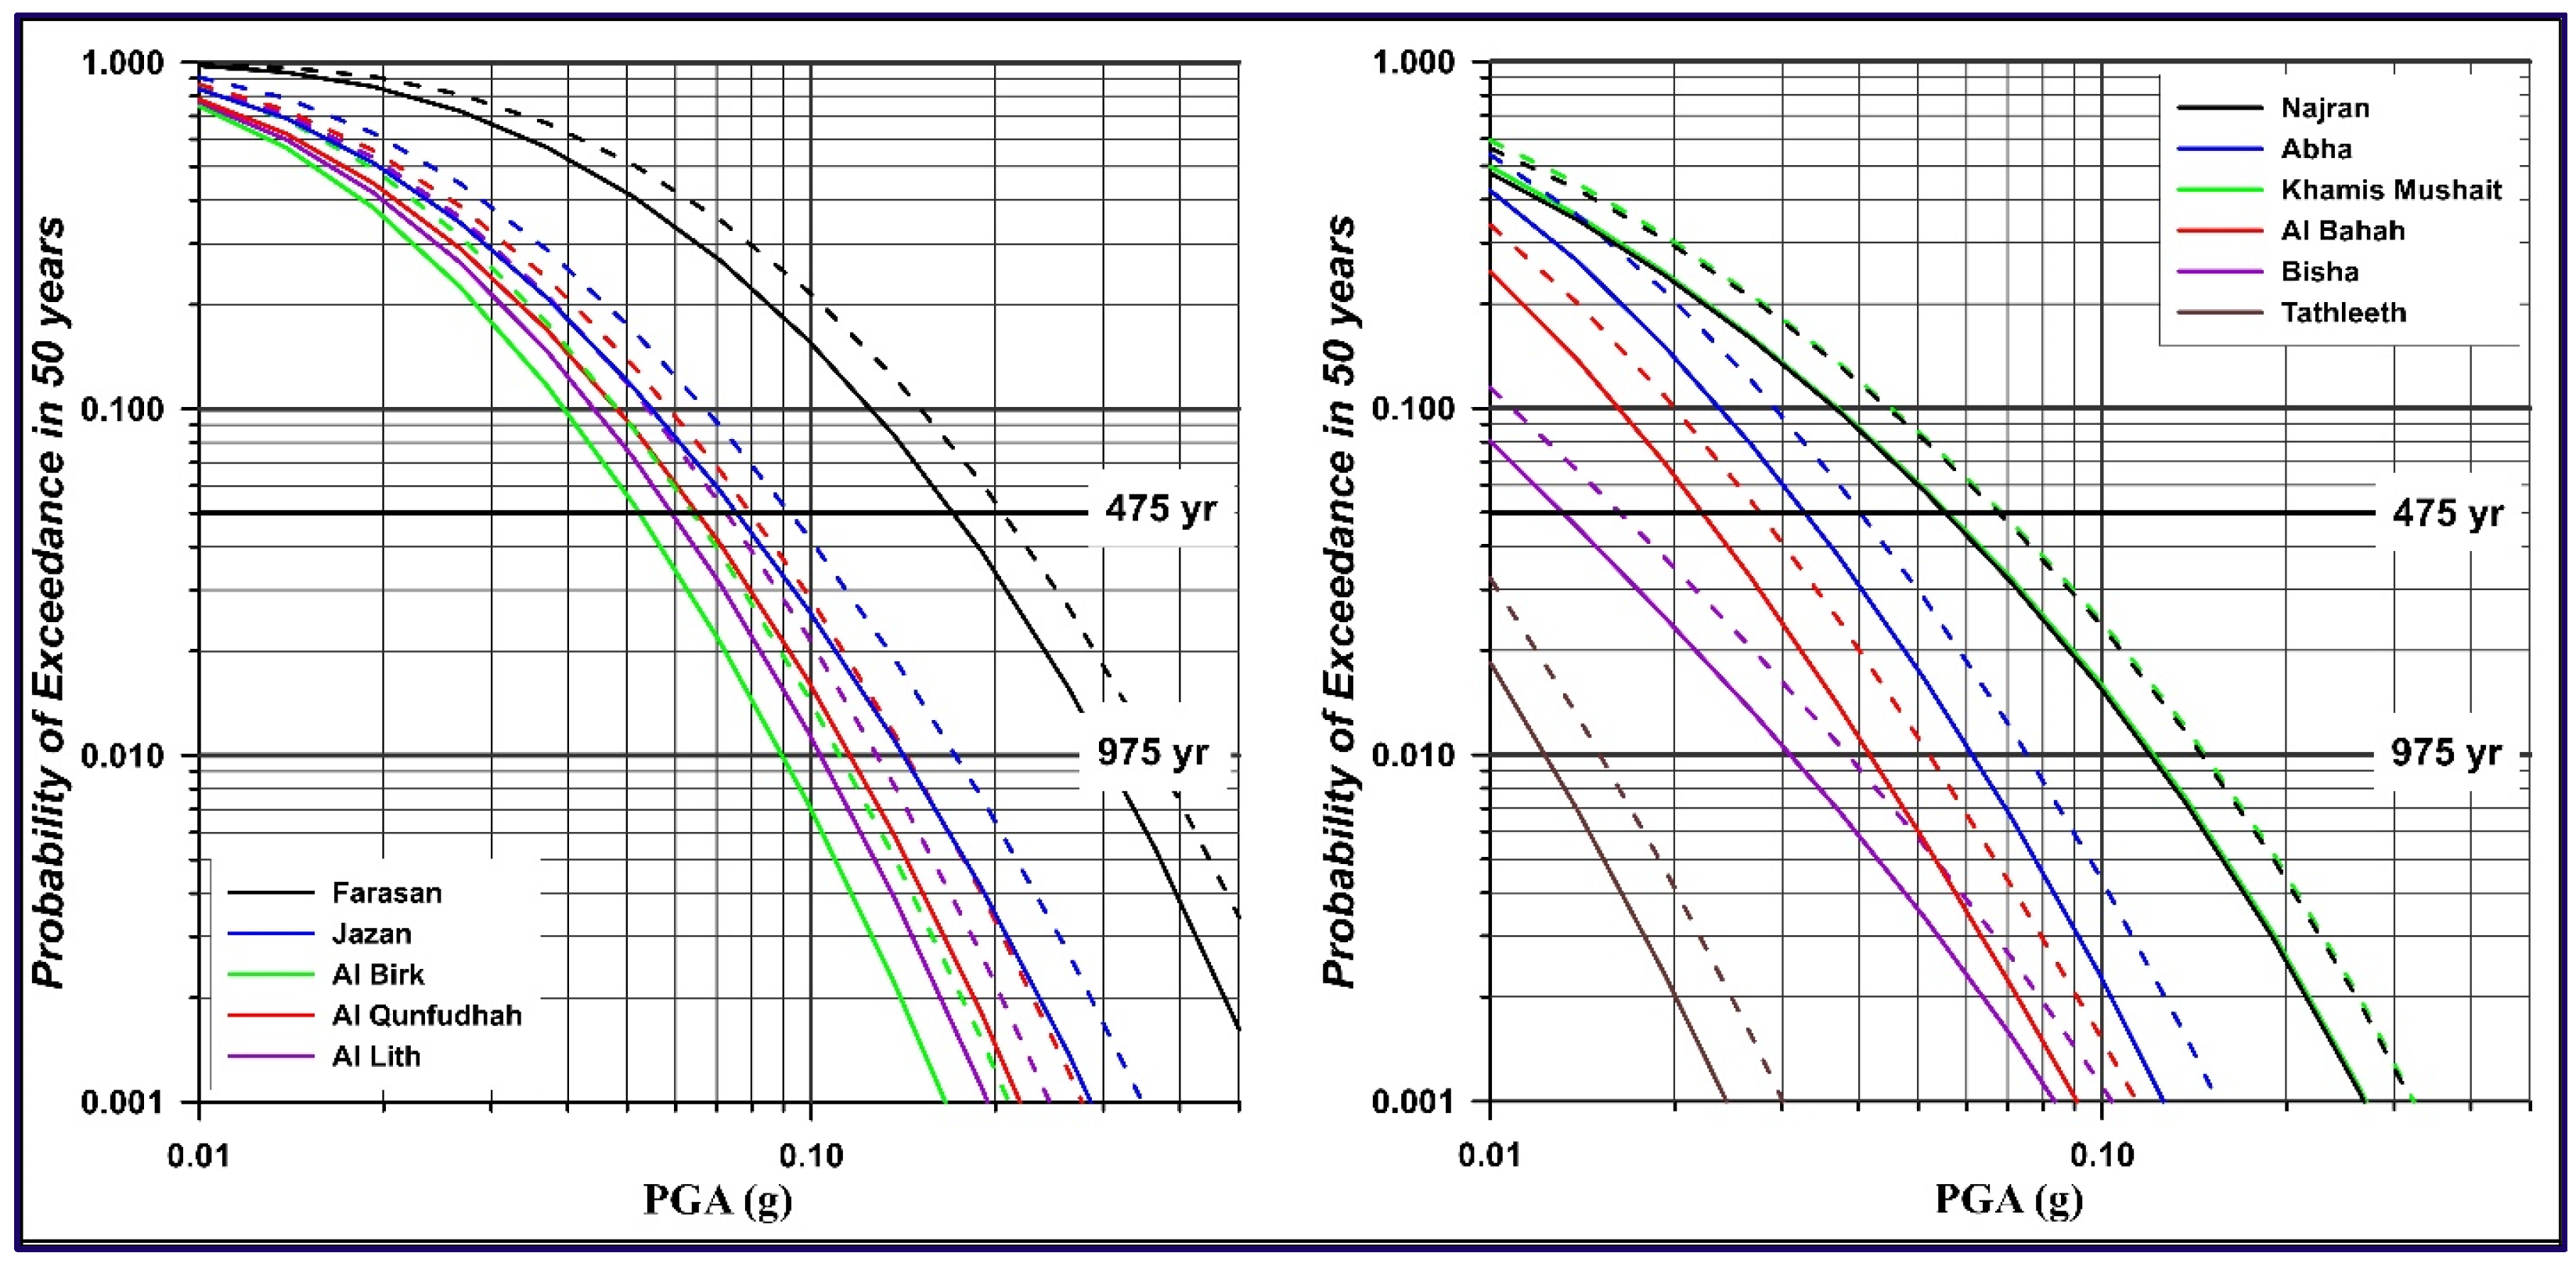
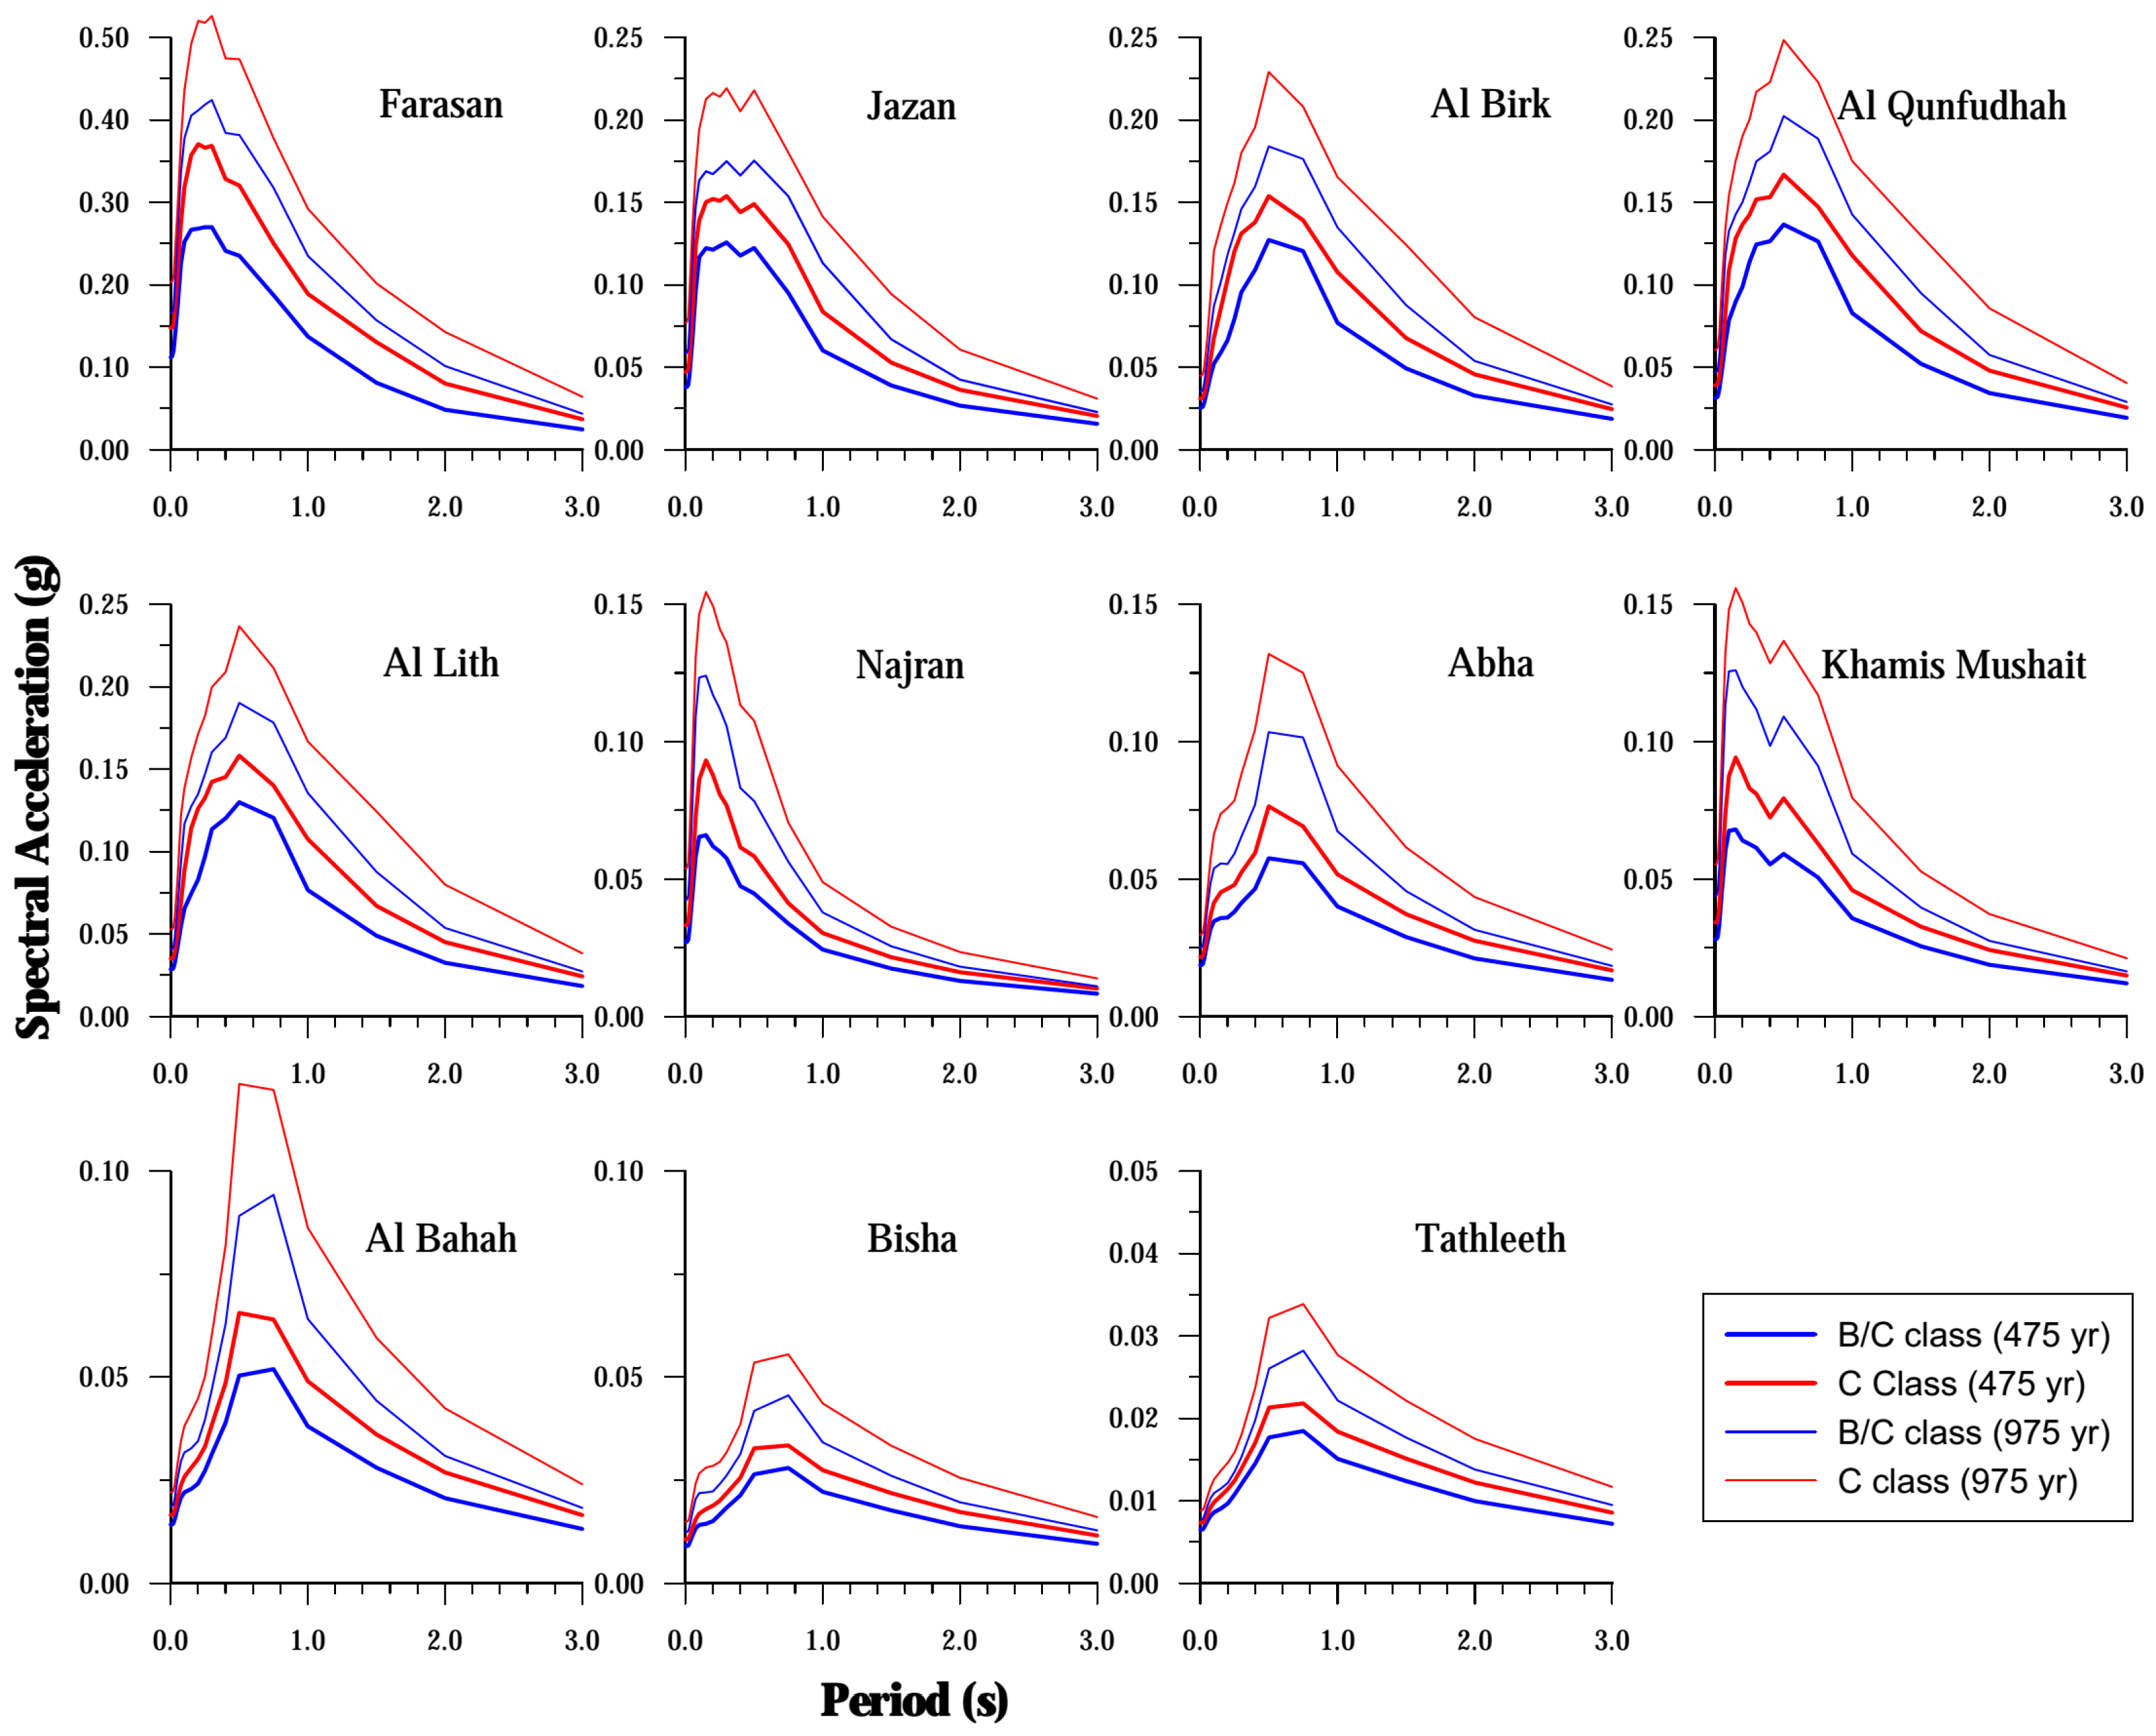
Another result derived from the present study is the computation of UHS and hazard curves for the chosen cities. These outcomes are helpful for formulating building codes, insurance policies, and financial risk management approaches focused on minimizing earthquake impacts on communities and infrastructures. They provide crucial information to engineers and architects regarding anticipated ground motions, assisting in the design of resilient structures capable of withstanding seismic events. In this regard, Figure 5 provides insightful seismic hazard findings, particularly the calculated hazard curves for the 11 cities under study and the two selected site conditions. Figure 6 depicts the UHS, including all considered site categories and return periods. This is a key component of seismic hazard analysis.
Farasan, Jazan, Al Qunfudhah, Al Lith, and Al Birk present the highest seismic hazard values out of all the cities under investigation according to both the graphical representation (Figure 6) and the hazard values listed in Table 2. The equivalent pairs of SAmax for these five cities are 0.27 and 0.41 g, 0.12 and 0.17 g, 0.10 and 0.15 g, 0.08 and 0.14 g, and 0.07 and 0.12 g, respectively, for both the 475 and 975 years under B/C site conditions. These cities display SAmax pair values for the same return periods of 0.37 and 0.52 g, 0.15 and 0.22 g, 0.14 and 0.19 g, 0.13 and 0.17 g, and 0.10 and 0.15 g, respectively, under the C soil classification. Notably, oscillation periods ranging from 0.10 to 0.75 s were observed for the SAmax hazard values for locations under examination (refer to Table 2).
A brief comparison of PGA values obtained from our research is given in Table 3 for some of the chosen cities, for B/C soil conditions and a 475-year return period. These results are compared to PGA values from earlier research by [20,101]. To be specific, the authors of [20] devised and validated a framework for conducting PSHA in the Kingdom of Saudi Arabia. Their approach employed Monte Carlo simulation and included the development of seismic source zone models encompassing 43 zones. They utilized four distinct GMPEs for active shallow crustal sources [80,102,103,104], while [101] conducted a seismic hazard analysis for Saudi Arabia using a Monte Carlo approach and a spatially smoothed seismicity model. They also employed the same four GMPEs for active shallow crustal sources [80,102,103,104], given equal weights in the established logic tree. Additionally, they used the model in [82] for stable continental regions, and the model in [105] for extensional zones in the Red Sea and Indian Ocean. Differences in the seismicity characteristics, the particular seismic source model(s) used, the GMPEs used, the final logic tree’s composition, and the weights associated with its components are the main causes of the observed discrepancies.
In light of these variations, we support an alternative strategy [99,100] to create a design spectrum specific for certain cities in this area. These design spectra use only two ground motion parameters: the SA (0.2 s) and SA (1.0 s) values. Several studies have previously used this approach to create a representative design spectrum (e.g., ref. [106] for Andaman, ref. [74] for Egypt, ref. [70] for Mexico, and [1] for Peru and Chile). This process is recommended for some chosen cities in the current study (see Figure 7) and two identified NEHRP soil classifications (B/C and C), with a 475-year return period. Interestingly, the design spectra obtained in this manner, as shown in Figure 7, show a significant degree of consistency and closer match with estimated UHS. This method typically produces conservative results, particularly when fitting the calculated UHS values.
Lastly, we want to shed light on any potential relationships between the seismic hazard estimates that has been obtained throughout our evaluation. Specifically, we examine the PGA values for the computed site classes (see Figure 8) and the average PGA and SAmax values that were obtained for the two computed return periods. The methods described in earlier research, including those in [107] for Algeria, ref. [74] for Egypt, and [70] for Mexico, were used to assess these correlations. A strong linear association can be seen in the regression studies between the calculated site conditions and the obtained PGA or SAmax values for the same return periods (Figure 8). This suggests that, regardless of soil conditions, the mean PGA or SAmax values for a 975-year return period are roughly 1.4 to 1.5 times the corresponding ones for a 475-year return period, which is in line with findings from the previously mentioned studies [70,74,107]. Furthermore, it has been determined that there are linear correlations between the PGA values for the two computed site conditions and the two studied return periods (Figure 8). This indicates that, within the given return periods, the PGA values for the C NEHRP soil class are approximately 1.25 times those values for the B/C NEHRP soil class. Thus, based on comparable parameters from different site classes or return periods, such fitting relationships could correctly infer or predict mean PGA and SAmax values for a particular situation, similar to the trends observed in Figure 8.

4. Summary and Conclusions

The current research assesses the southwest Arabian Shield’s seismic hazard, an area prone to earthquakes bordering the Red Sea, using the geophysical, geological, and seismological data that are currently available. Tectonic movements and volcanic activity are clearly visible in this area, with a particular relationship to the creation of the Red Sea and its subsequent geological changes. These elements raise the seismic hazard for significant infrastructure in this region’s urban areas, such as dams and power plants. The many topographic features in northern Yemen and southwest Saudi Arabia provide proof of this complexity.
Most of the earthquake activity is concentrated around the Red Sea Rift and related transform faults, according to an analysis of the available earthquake data and focal mechanism solutions. Evaluating seismic hazard is a crucial and practical step in reducing related risks. It is necessary to conduct a thorough and updated seismic hazard evaluation in order to support informed risk reduction and disaster preparedness efforts in the region, given the historical seismic activity and the significant implications for densely populated and economically crucial regions within the study area.
This study presents an updated PSHA with the goal of providing an exhaustive, well-coordinated, and trustworthy study. For accuracy and inclusivity, this evaluation uses a well-defined seismogenic source model. A logic tree technique is used to address any potential uncertainties about Gutenberg–Richter b-values and Mmax. Other recently published GMPEs are also taken into consideration. This assessment represents an overall improvement as it presents seismic hazard in a more realistic and complete way by incorporating a variety of models and allows for the inclusion of different uncertainties.
The seismic hazard results are shown here in terms of the ground motion parameters PGA and SA, corresponding to 475- and 975-year return periods, respectively (10% and 5% exceedance rates, within a 50-year exposure period). According to the NEHRP soil classes, two site conditions—B/C and C—are covered by these values. Two site conditions were taken into consideration while computing seismic hazard curves for a subset of 11 important cities over the whole study region. We also calculated the UHS for the two chosen soil types and the selected return periods.
As a result, it is recommended to include the suggested changes into the current Saudi Building Codes. These changes would involve adding the updated seismic design spectrum tailored for a specific location and updating the region’s seismic hazard zoning maps. By using recently published globally recognized GMPEs, applying a logic tree approach, and incorporating state-of-the-art methodologies to define and characterize potential seismic sources in the vicinity, we are confident that this assessment serves as an updated input for seismic regulations in southwestern Saudi Arabia. The format of the necessary ground motion data provided by this study complies with international and European construction rules.
The findings obtained here emphasize the need to update Saudi Building Codes to improve the seismic safety of critical infrastructures, including power plants and dams. These recommendations aim to enhance the resilience of structures against seismic events specific to Saudi Arabia’s geological context. The process for integrating these changes into the building codes would likely involve thorough consultation with experts in seismology and structural engineering, followed by rigorous testing and validation of the proposed design spectrum. This would ensure alignment with current seismic hazard assessments and international best practices in seismic design, ultimately enhancing the safety and durability of buildings across the region. To conclude, this study’s methodology, which takes into consideration current GMPEs and uses a logic tree structure to account for uncertainties, guarantees a trustworthy and realistic representation of seismic hazard. Crucially, new evaluations carried out in the area should be used to periodically modify seismic hazard values as new data on seismicity or seismotectonics become available.

Author Contributions

Conceptualization, M.A. and R.S.; methodology, M.A., R.S. and J.A.P.; software, M.A. and R.S.; validation, R.S. and J.A.P.; formal analysis, M.A. and R.S.; investigation, H.A.A. and H.A.; resources, M.A. and R.S.; data curation, R.S. and J.A.P.; writing—original draft preparation, R.S. and M.A.; writing—review and editing, R.S., H.A. and J.A.P.; visualization, M.A. and R.S.; supervision, R.S. and J.A.P.; project administration, R.S. All authors have read and agreed to the published version of the manuscript.

Funding

J.A.P. acknowledges support for his research from the Spanish Ministry of Science and Innovation under grant number PID2022-136678NB-I00AEI/FEDER, UE.

Institutional Review Board Statement

Not applicable.

Informed Consent Statement

Not applicable.

Data Availability Statement

The data presented in this study are available on request from the authors.

Acknowledgments

We would like to thank M.A. Santoyo (Institute of Geophysics, UNAM, Mexico), who reviewed the English language of the manuscript. We would also like to thank the editor and three anonymous reviewers for their thoughtful remarks and invaluable comments.

Conflicts of Interest

The authors declare no conflicts of interest.

References

  1. Das, R.; Gonzalez, G.; de la Llera, J.C.; Saez, E.; Salazar, P.; Gonzalez, J.; Meneses, C. A Probabilistic Seismic Hazard Assessment of Southern Peru and Northern Chile. Eng. Geol. 2020, 271, 105585. [Google Scholar] [CrossRef]
  2. Falcone, G.; Mendicelli, A.; Mori, F.; Fabozzi, S.; Moscatelli, M.; Occhipinti, G.; Peronace, E. A Simplified Analysis of the Total Seismic Hazard in Italy. Eng. Geol. 2020, 267, 105511. [Google Scholar] [CrossRef]
  3. Viveros, J.A.B.; Reynoso, G.S.; Schroeder, M.G.O. A Probabilistic Seismic Hazard Assessment of the Trans-Mexican Volcanic Belt, Mexico Based on Historical and Instrumentally Recorded Seismicity. Geofis. Int. 2017, 56, 87–101. [Google Scholar] [CrossRef]
  4. Johnson, P. Tectonic Map of Saudi Arabia and Adjacent Areas; Technical Report USGS-TR-98-3 (IR 948); United States Geological Survey: Reston, VA, USA, 1998.
  5. Reilinger, R.; McClusky, S.; Vernant, P.; Lawrence, S.; Ergintav, S.; Cakmak, R.; Ozener, H.; Kadirov, F.; Guliev, I.; Stepanyan, R.; et al. GPS Constraints on Continental Deformation in the Africa-Arabia-Eurasia Continental Collision Zone and Implications for the Dynamics of Plate Interactions. J. Geophys. Res. Solid. Earth 2006, 111, B05411. [Google Scholar] [CrossRef]
  6. ArRajehi, A.; McClusky, S.; Reilinger, R.; Daoud, M.; Alchalbi, A.; Ergintav, S.; Gomez, F.; Sholan, J.; Bou-Rabee, F.; Ogubazghi, G.; et al. Geodetic Constraints on Present-Day Motion of the Arabian Plate: Implications for Red Sea and Gulf of Aden Rifting. Tectonics 2010, 29, 2006–2010. [Google Scholar] [CrossRef]
  7. Bosworth, W.; Khalil, S.M.; Ligi, M.; Stockli, D.F.; McClay, K.R. Geology of Egypt: The Northern Red Sea. In The Geology of Egypt; Springer: Cham, Switzerland, 2020; pp. 343–374. [Google Scholar]
  8. Almalki, K.A.; Betts, P.G.; Ailleres, L. The Red Sea—50 Years of Geological and Geophysical Research. Earth-Sci. Rev. 2015, 147, 109–140. [Google Scholar] [CrossRef]
  9. Ghebreab, W. Tectonics of the Red Sea Region Reassessed. Earth-Sci. Rev. 1998, 45, 1–44. [Google Scholar] [CrossRef]
  10. Watchorn, F.; Nichols, G.J.; Bosence, D.W.J. Rift-Related Sedimentation and Stratigraphy, Southern Yemen (Gulf of Aden). In Sedimentation and Tectonics in Rift Basins Red Sea: Gulf of Aden; Springer: Dordrecht, The Netherlands, 1998; pp. 165–189. [Google Scholar]
  11. Hughes, G.W.; Varol, O.; Beydoun, Z.R. Evidence for Middle Oligocene Rifting of the Gulf of Aden and for Late Oligocene Rifting of the Southern Red Sea. Mar. Pet. Geol. 1991, 8, 354–358. [Google Scholar] [CrossRef]
  12. Al-Amri, A.M. Seismotectonics and Seismogenic Source Zones of the Arabian Platform. In Lithosphere Dynamics and Sedimentary Basins: The Arabian Plate and Analogues; Springer: Berlin/Heidelberg, Germany, 2013; pp. 295–316. [Google Scholar]
  13. Al-Haddad, M.; Siddiqi, G.; Al-Zaid, R.; Arafah, A.; Necioglu, A.; Turkelli, N. Seismic Hazard and Design Criteria for Saudi Arabia. In Proceedings of the 10th World Conference on Earthquake Engineering, Madrid, Spain, 19–24 July 1992; Balkema: Rotterdam, The Netherlands, 1992; pp. 449–454. [Google Scholar]
  14. Al-Haddad, M.; Siddiqi, G.H.; Al-Zaid, R.; Arafah, A.; Necioglu, A.; Turkelli, N. A Basis for Evaluation of Seismic Hazard and Design Criteria for Saudi Arabia. Earthq. Spectra 1994, 10, 231–258. [Google Scholar] [CrossRef]
  15. Merghelani, H.M. Seismicity of the Yanbu Region Kingdom of Saudi Arabia; Saudi Arabia Project Report 371; Technical Records 16; Ministry of Petroleum and Mineral Resources: Jiddah, Saudi Arabia, 1981.
  16. Fnais, M.S.; Abdelrahman, K.; E-Hady, S.; Abdel-Monem, E. Seismicity and Seismotectonics of the Jeddah Area, Saudi Arabia. In Proceedings of the WIT Transactions on the Built Environment; 2013; Volume 132, pp. 219–232. [Google Scholar]
  17. Thenhaus, P.; Algermissen, S.; Perkins, D.; Hanson, S.; Diment, W. Probabilistic Estimates of the Seismic Ground-Motion Hazard in Western Saudi Arabia; U.S. Geological Survey: Reston, VA, USA, 1989; Volume 42.
  18. Nahhas, T.M. A Comparison of Saudi Building Code with 1997 UBC for Provisions of Modal Response Spectrum Analysis Using a Real Building. Open J. Earthq. Res. 2017, 6, 98–116. [Google Scholar] [CrossRef]
  19. Al-Arifi, N.S.; Fat-Helbary, R.E.; Khalil, A.R.; Lashin, A.A. A New Evaluation of Seismic Hazard for the Northwestern Part of Saudi Arabia. Nat. Hazards 2013, 69, 1435–1457. [Google Scholar] [CrossRef]
  20. Zahran, H.M.; Sokolov, V.; Youssef, S.E.H.; Alraddadi, W.W. Preliminary Probabilistic Seismic Hazard Assessment for the Kingdom of Saudi Arabia Based on Combined Areal Source Model: Monte Carlo Approach and Sensitivity Analyses. Soil. Dyn. Earthq. Eng. 2015, 77, 453–468. [Google Scholar] [CrossRef]
  21. Anbazhagan, P.; Smitha, C.V.; Kumar, A. Representative Seismic Hazard Map of Coimbatore, India. Eng. Geol. 2014, 171, 81–95. [Google Scholar] [CrossRef]
  22. Gasperini, P.; Lolli, B.; Castellaro, S. Comparative Analysis of Regression Methods Used for Seismic Magnitude Conversions. Bull. Seismol. Soc. Am. 2015, 105, 1787–1791. [Google Scholar] [CrossRef]
  23. Liu, J.; Wang, Z.; Xie, F.; Lv, Y. Seismic Hazard Assessment for Greater North China from Historical Intensity Observations. Eng. Geol. 2013, 164, 117–130. [Google Scholar] [CrossRef]
  24. Petersen, M.D.; Shumway, A.M.; Powers, P.M.; Mueller, C.S.; Moschetti, M.P.; Frankel, A.D.; Rezaeian, S.; McNamara, D.E.; Luco, N.; Boyd, O.S.; et al. The 2018 Update of the US National Seismic Hazard Model: Overview of Model and Implications. Earthq. Spectra 2020, 36, 5–41. [Google Scholar] [CrossRef]
  25. Tselentis, G.A.; Danciu, L. Probabilistic Seismic Hazard Assessment in Greece—Part 3: Deaggregation. Nat. Hazards Earth Syst. Sci. 2010, 10, 51–59. [Google Scholar] [CrossRef]
  26. Yazdani, A.; Kowsari, M. A Probabilistic Procedure for Scenario-Based Seismic Hazard Maps of Greater Tehran. Eng. Geol. 2017, 218, 162–172. [Google Scholar] [CrossRef]
  27. FEMA—Federal Emergency Management Agency. NEHRP Recommended Seismic Provisions for New Buildings and Other Structures; Building Seismic Safety Council: Washington, DC, USA, 2015; Volume I, p. 515. [Google Scholar]
  28. Cornell, C.A. Engineering Seismic Risk Analysis. Bull. Seismol. Soc. Am. 1968, 58, 1583–1606. [Google Scholar] [CrossRef]
  29. Esteva, L.R. Regionalizacion Sismica de la Republica Mexicana. Rev. Soc. Mex. Ing. Sismica 1963, 1, 31–35. [Google Scholar]
  30. McGuire, R.K. FORTRAN Computer Program for Seismic Risk Analysis; U.S. Geological Survey: Lemoyne, PA, USA, 1976.
  31. SSHAC—Senior Seismic Hazard Analysis Committee. Recommendations for Probabilistic Recommendations for Probabilistic Seismic Hazard Analysis: Guidance on Uncertainty and Use of Experts; Report NUREG-CR-6372; U.S. Nuclear Regulatory Commission: Washington, DC, USA, 1997; Volume 2.
  32. Alamilla, J.L.; Rodriguez, J.A.; Vai, R. Unification of Different Approaches to Probabilistic Seismic Hazard Analysis. Bull. Seismol. Soc. Am. 2020, 110, 2816–2827. [Google Scholar] [CrossRef]
  33. Ayele, A. Probabilistic Seismic Hazard Analysis (PSHA) for Ethiopia and the Neighboring Region. J. Afr. Earth Sci. 2017, 134, 257–264. [Google Scholar] [CrossRef]
  34. El-Hussain, I.; Al-Shijbi, Y.; Deif, A.; Mohamed, A.M.E.; Ezzelarab, M. Developing a Seismic Source Model for the Arabian Plate. Arab. J. Geosci. 2018, 11, 11–435. [Google Scholar] [CrossRef]
  35. Reiter, L. Earthquake Hazard Analysis: Issues and Insights; Columbia University Press: New York City, NY, USA, 1990; ISBN 0-231-06534-5. [Google Scholar]
  36. United States Nuclear Regulatory Commission. Updated Implementation Guidelines for SSHAC Hazard Studies; NUREG-2213; US Nuclear Regulatory Commission: Washington, DC, USA, 2018; ISBN 1800553684.
  37. International Building Code (IBC). International Building Code; International Code Council, Inc.: Washington, DC, USA, 2009; ISBN 978-1-58001-725-1. [Google Scholar]
  38. EN-1998-1; Eurocode 8: Design of Structures for Earthquake Resistance. Part 1: General Rules, Seismic Actions and Rules for Buildings. European Committee for Standardization: Brussels, Belgium, 2003.
  39. Ordaz, M.; Arroyo, D. On Uncertainties in Probabilistic Seismic Hazard Analysis. Earthq. Spectra 2016, 32, 1405–1418. [Google Scholar] [CrossRef]
  40. Sawires, R.; Peláez, J.A.; AlHamaydeh, M.; Henares, J. A State-of-the-Art Seismic Source Model for the United Arab Emirates. J. Asian Earth Sci. 2019, 186, 104063. [Google Scholar] [CrossRef]
  41. Sawires, R.; Peláez, J.A.; Ibrahim, H.A.; Fat-Helbary, R.E.; Henares, J.; Hamdache, M. Delineation and Characterization of a New Seismic Source Model for Seismic Hazard Studies in Egypt. Nat. Hazards 2016, 80, 1823–1864. [Google Scholar] [CrossRef]
  42. Deif, A.; Al-Shijbi, Y.; El-Hussain, I.; Ezzelarab, M.; Mohamed, A.M.E. Compiling an Earthquake Catalogue for the Arabian Plate, Western Asia. J. Asian Earth Sci. 2017, 147, 345–357. [Google Scholar] [CrossRef]
  43. Engdahl, E.R.R.; van der Hilst, R.; Buland, R. Global Teleseismic Earthquake Relocation with Improved Travel Times and Procedures for Depth Determination. Bull. Seismol. Soc. Am. 1998, 88, 722–743. [Google Scholar] [CrossRef]
  44. Ambraseys, N.N.; Melville, C.P.; Adams, R.D. The Seismicity of Egypt, Arabia and the Red Sea: A Historical Review; Cambridge University Press: New York, NY, USA, 1994. [Google Scholar]
  45. Ambraseys, N.N. Far-Field Effects of Eastern Mediterranean Earthquakes in Lower Egypt. J. Seism. 2001, 5, 263–268. [Google Scholar] [CrossRef]
  46. Aldama-Bustos, G.; Bommer, J.J.; Fenton, C.H.; Staford, P.J. Probabilistic Seismic Hazard Analysis for Rock Sites in the Cities of Abu Dhbi, Dubai and Ra’s Al Khymah, United Arab Emirates. Georisk 2009, 3, 1–29. [Google Scholar]
  47. El-Hussain, I.; Deif, A.; Al-Jabri, K.; Toksoz, N.; El-Hady, S.; Al-Hashmi, S.; Al-Toubi, K.; Al-Shijbi, Y.; Al-saifi, M.; Kuleli, S. Probabilistic Seismic Hazard Maps for the Sultanate of Oman. Nat. Hazards 2012, 64, 173–210. [Google Scholar] [CrossRef]
  48. Babiker, N.; Mula, A.; El-Hadidy, S. A Unified Mw-Based Earthquake Catalogue and Seismic Source Zones for the Red Sea. J. Afr. Earth Sci. 2015, 109, 168–176. [Google Scholar] [CrossRef]
  49. Erdik, M.; Şeşetyan, K.; Demircioğlu, M.B.; Tüzün, C.; Giardini, D.; Gülen, L.; Akkar, D.S.; Zare, M. Assessment of Seismic Hazard in the Middle East and Caucasus: EMME (Earthquake Model of Middle East) Project. In Proceedings of the 15th World Conference on Earthquake Engineering, Lisbon, Portugal, 24–28 September 2012. [Google Scholar]
  50. Sawires, R.; Santoyo, M.A.; Peláez, J.A.; Fernández, R.D.C. An Updated and Unified Earthquake Catalog from 1787 to 2018 for Seismic Hazard Assessment Studies in Mexico. Sci. Data 2019, 6, 241. [Google Scholar] [CrossRef]
  51. Sawires, R.; Peláez, J.A.; AlHamaydeh, M.; Henares, J. Up-to-Date Earthquake and Focal Mechanism Solutions Datasets for the Assessment of Seismic Hazard in the Vicinity of the United Arab Emirates. Data Brief. 2020, 28, 104844. [Google Scholar] [CrossRef]
  52. Gardner, J.K.; Knopoff, L. Is the Sequence of Earthquakes in Southern California, with Aftershocks Removed, Poissonian? Bull. Seismol. Soc. Am. 1974, 64, 1363–1367. [Google Scholar] [CrossRef]
  53. Uhrhammer, R. Northern California Seismicity. In Neotectonics of North America; Burton Slemmons, D., Engdahl, E.R., Zoback, M.D., Blackwell, D.D., Eds.; GeoScienceWorld: McLean, VA, USA, 1991. [Google Scholar] [CrossRef]
  54. Burkhard, M.; Grünthal, G. Seismic Source Zone Characterization for the Seismic Hazard Assessment Project PEGASOS by the Expert Group 2 (EG1b). Swiss J. Geosci. 2009, 102, 149–188. [Google Scholar] [CrossRef]
  55. Fairhead, J.D.; Girdler, R.W. The Seismicity of the Red Sea, Gulf of Aden and Afar Triangle. Philos. Trans. R. Soc. Lond. Ser. A Math. Phys. Sci. 1970, 267, 49–74. [Google Scholar] [CrossRef]
  56. Huang, P.Y.; Solomon, S.C. Centroid Depths and Mechanisms of Mid-ocean Ridge Earthquakes in the Indian Ocean. Gulf of Aden, and Red Sea. J. Geophys. Res. Solid. Earth 1987, 92, 1361–1382. [Google Scholar] [CrossRef]
  57. Pallister, J.S. Explanatory Notes to the Geologic Map of Al Lith Quadrangle, Sheet 20 MD, Kingdom of Saudi Arabia: Saudi Arabia Deputy Ministry for Mineral Resources; Open File Report USGSOF-04-8; U.S. Geological Survey: Reston, VA, USA, 1984.
  58. Greenwood, W.R.; Anderson, R.E.; Fleck, R.J.; Roberts, R.J. Precambrian Geologic History and Plate Tectonic Evolution of the Arabian Shield; Bulletin 24; Saudi Arabian Directorate General of Mineral Resources: Jiddah, Saudi Arabia, 1980.
  59. Youssef, S.E.-H. Seismicity and Seismotectonic Setting of the Red Sea and Adjacent Areas. In The Red Sea: The Formation, Morphology, Oceanography and Environment of a Young Ocean Basin; Springer: Berlin/Heidelberg, Germany, 2015; pp. 151–159. [Google Scholar]
  60. Girdler, R.W.; Styles, P. Two Stages Red Sea Floor Spreading. Nature 1974, 247, 7–11. [Google Scholar] [CrossRef]
  61. Hofstetter, R.; Beyth, M. The Afar Depression: Interpretation of the 1960-2000 Earthquakes. Geophys. J. Int. 2003, 155, 715–732. [Google Scholar] [CrossRef]
  62. Cornell, C.A.; Vanmarcke, E.H. The Major Influences on Seismic Risk. In Proceedings of the Fourth World Conference of Earthquake Engineering, Santiago, Chile, 13–18 January 1969. [Google Scholar]
  63. Kijko, A.; Sellevoll, M.A. Estimation of Earthquake Hazard Parameters from Incomplete Data Files, Part II. Bull. Seismol. Soc. Am. 1992, 82, 120–134. [Google Scholar]
  64. Gutenberg, B.; Richter, C.F. Magnitude and Energy of Earthquakes. Ann. Geofis. 1956, 9, 1–15. [Google Scholar]
  65. Kijko, A. Estimation of the Maximum Earthquake Magnitude, mmax. Pure Appl. Geophys. 2004, 161, 1655–1681. [Google Scholar] [CrossRef]
  66. Kijko, A.; Singh, M. Statistical Tools for Maximum Possible Earthquake Magnitude Estimation. Acta Geophys. 2011, 59, 674–700. [Google Scholar] [CrossRef]
  67. Vermeulen, P.; Kijko, A. More Statistical Tools for Maximum Possible Earthquake Magnitude Estimation. Acta Geophys. 2017, 65, 579–587. [Google Scholar] [CrossRef]
  68. Bommer, J.J.; Douglas, J.; Scherbaum, F.; Cotton, F.; Bungum, H.; Fah, D. On the Selection of Ground-Motion Prediction Equations for Seismic Hazard Analysis. Seismol. Res. Lett. 2010, 81, 783–793. [Google Scholar] [CrossRef]
  69. Douglas, J. Ground Motion Prediction Equations 1964–2021. 2022. Available online: http://www.gmpe.org.uk (accessed on 1 September 2022).
  70. Sawires, R.; Peláez, J.A.; Santoyo, M.A. Probabilistic Seismic Hazard Assessment for Western Mexico. Eng. Geol. 2023, 313, 106959. [Google Scholar] [CrossRef]
  71. Sawires, R.; Peláez, J.A.; Hamdache, M. Probabilistic Seismic Hazard Assessment for United Arab Emirates, Qatar and Bahrain. Appl. Sci. 2020, 10, 7901. [Google Scholar] [CrossRef]
  72. Hamdache, M.; Peláez, J.A.; Henares, J.; Sawires, R. Seismic Hazard Assessment and Its Uncertainty for the Central Part of Northern Algeria. Pure Appl. Geophys. 2022, 179, 2083–2118. [Google Scholar] [CrossRef]
  73. Sawires, R.; Peláez, J.A.; Santoyo, M.A. Deaggregation of Probabilistic Seismic Hazard Results for Some Selected Cities in Western Mexico. Georisk Assess. Manag. Risk Eng. Syst. Geohazards 2023, 18, 491–512. [Google Scholar] [CrossRef]
  74. Sawires, R.; Peláez, J.A.; Fat-Helbary, R.E.; Ibrahim, H.A. Updated Probabilistic Seismic-Hazard Values for Egypt. Bull. Seismol. Soc. Am. 2016, 106, 1788–1801. [Google Scholar] [CrossRef]
  75. Abrahamson, N.A.; Silva, W.J.; Kamai, R. Summary of the ASK14 Ground Motion Relation for Active Crustal Regions. Earthq. Spectra 2014, 30, 1025–1055. [Google Scholar] [CrossRef]
  76. Campbell, K.W.; Bozorgnia, Y. NGA-West2 Ground Motion Model for the Average Horizontal Components of PGA, PGV, and 5% Damped Linear Acceleration Response Spectra. Earthq. Spectra 2014, 30, 1087–1115. [Google Scholar] [CrossRef]
  77. Chiou, B.S.-J.; Youngs, R.R. Update of the Chiou and Youngs NGA Model for the Average Horizontal Component of Peak Ground Motion and Response Spectra. Earthq. Spectra 2014, 30, 1117–1153. [Google Scholar] [CrossRef]
  78. Abrahamson, N.; Gregor, N.; Addo, K. BC Hydro Ground Motion Prediction Equations for Subduction Earthquakes. Earthq. Spectra 2016, 32, 23–44. [Google Scholar] [CrossRef]
  79. Parker, G.A.; Stewart, J.P.; Boore, D.M.; Atkinson, G.M.; Hassani, B. NGA-Subduction Global Ground Motion Models with Regional Adjustment Factors. Earthq. Spectra 2022, 38, 456–493. [Google Scholar] [CrossRef]
  80. Zhao, J.X.; Zhang, J.; Asano, A.; Ohno, Y.; Oouchi, T.; Takahashi, T.; Ogawa, H.; Irikura, K.; Thio, H.K.; Somerville, P.G.; et al. Attenuation Relations of Strong Ground Motion in Japan Using Site Classification Based on Predominant Period. Bull. Seismol. Soc. Am. 2006, 96, 898–913. [Google Scholar] [CrossRef]
  81. Atkinson, G.M.; Boore, D.M. Empirical Ground-Motion Relations for Subduction-Zone Earthquakes and Their Application to Cascadia and Other Regions. Bull. Seismol. Soc. Am. 2003, 93, 1703–1729. [Google Scholar] [CrossRef]
  82. Atkinson, G.M.; Boore, D.M. Earthquake Ground-Motion Prediction Equations for Eastern North America. Bull. Seismol. Soc. Am. 2006, 96, 2181–2205. [Google Scholar] [CrossRef]
  83. Campbell, K.W. Prediction of Strong Ground Motion Using the Hybrid Empirical Method and Its Use in the Development of Ground-Motion (Attenuation) Relations in Eastern North America. Bull. Seismol. Soc. Am. 2003, 93, 1012–1033. [Google Scholar] [CrossRef]
  84. Pezeshk, S.; Zandieh, A.; Tavakoli, B. Hybrid Empirical Ground-Motion Prediction Equations for Eastern North America Using NGA Models and Updated Seismological Parameters. Bull. Seism. Soc. Am. 2011, 101, 1859–1870. [Google Scholar] [CrossRef]
  85. Stewart, J.P.; Douglas, J.; Javanbarg, M.; Bozorgnia, Y.; Abrahamson, N.A.; Boore, D.M.; Campbell, K.W.; Delavaud, E.; Erdik, M.; Stafford, P.J. Selection of Ground Motion Prediction Equations for the Global Earthquake Model. Earthq. Spectra 2015, 31, 19–45. [Google Scholar] [CrossRef]
  86. Ancheta, T.D.; Darragh, R.B.; Stewart, J.P.; Silva, W.; Chiou, B.; Wooddell, K.; Graves, R.; Kottke, A.; Boore, D.; Kishida, T.; et al. PEER NGA-West2 Database. PEER Rep. 2014, 172. [Google Scholar] [CrossRef]
  87. Chiou, B.S.J.; Youngs, R.R. An NGA Model for the Average Horizontal Component of Peak Ground Motion and Response Spectra. Earthq. Spectra 2008, 24, 173–215. [Google Scholar] [CrossRef]
  88. McGuire, R.K. Probabilistic Seismic Hazard Analysis and Design Earthquakes: Closing the Loop. Bull. Seismol. Soc. Am. 1995, 85, 1275–1284. [Google Scholar] [CrossRef]
  89. Bommer, J.J. Earthquake Hazard and Risk Analysis for Natural and Induced Seismicity: Towards Objective Assessments in the Face of Uncertainty. Bull. Earthq. Eng. 2022, 20, 2825–3069. [Google Scholar] [CrossRef]
  90. Kulkarni, R.B.; Youngs, R.R.; Coppersmith, K.J. Assessment of Confidence Intervals for Results of Seismic Hazard Analysis. In Proceedings of the Eighth World Conference on Earthquake Engineering, San Francisco, CA, USA, 21–28 July 1984; Volume 1, pp. 263–270. [Google Scholar]
  91. Bommer, J.J.; Scherbaum, F. The Use and Misuse of Logic Trees in Probabilistic Seismic Hazard Analysis. Earthq. Spectra 2008, 24, 997–1009. [Google Scholar] [CrossRef]
  92. Al-Shijbi, Y.; El-Hussain, I.; Deif, A.; Al-Kalbani, A.; Mohamed, A.M.E. Probabilistic Seismic Hazard Assessment for the Arabian Peninsula. Pure Appl. Geophys. 2018, 176, 1503–1530. [Google Scholar] [CrossRef]
  93. Sawires, R.; Peláez, J.A.; Fat-Helbary, R.E.; Panzera, F.; Ibrahim, H.A.; Hamdache, M. Probabilistic Seismic Hazard Deaggregation for Selected Egyptian Cities. Pure Appl. Geophys. 2017, 174, 1581–1600. [Google Scholar] [CrossRef]
  94. Şeşetyan, K.; Danciu, L.; Tümsa, M.B.D.; Giardini, D.; Erdik, M.; Akkar, S.; Gülen, L.; Zare, M.; Adamia, S.; Ansari, A.; et al. The 2014 Seismic Hazard Model of the Middle East: Overview and Results. Bull. Earthq. Eng. 2018, 16, 3535–3566. [Google Scholar] [CrossRef]
  95. Kolathayar, S.; Sitharam, T.G. Characterization of Regional Seismic Source Zones in and around India. Seismol. Res. Lett. 2012, 83, 77–85. [Google Scholar] [CrossRef]
  96. Petersen, M.D.; Frankel, A.D.; Harmsen, S.C.; Mueller, C.S.; Haller, K.M.; Wheeler, R.L.; Wesson, R.L.; Zeng, Y.; Boyd, O.S.; Perkins, D.M.; et al. Documentation for the 2008 Update of the United States National Seismic Hazard Maps; Report 2008-1128; US Geological Survey: Reston, VA, USA, 2008; Volume 128.
  97. Ordaz, M.; Faccioli, E.; Martinelli, F.; Aguilar, A.; Arboleda, J.; Meletti, C.; D’Amico, V. R-CRISIS Ver 20.3.0. Program for Computing Seismic Hazard, Institute of Engineering; UNAM: Mexico City, Mexico, 2021. [Google Scholar]
  98. Ordaz, M.; Salgado-Galvez, M.A. R-CRISIS Validation and Verification Document: Program for Probabilistic Seismic Hazard Analysis; ERN Technical Report; Instituto de Ingeniería: Mexico City, Mexico, 2020. [Google Scholar]
  99. Newmark, N.M.; Hall, W.J. Earthquake Spectra and Design; Earthquake Engineering Research Institute: Oackland, CA, USA, 1982. [Google Scholar]
  100. Malhotra, P.K. Return Period of Design Ground Motions. Seismol. Res. Lett. 2005, 76, 693–699. [Google Scholar] [CrossRef]
  101. Sokolov, V.; Zahran, H.M.; Youssef, S.E.-H.; El-Hadidy, M.; Alraddadi, W.W. Probabilistic Seismic Hazard Assessment for Saudi Arabia Using Spatially Smoothed Seismicity and Analysis of Hazard Uncertainty. Bull. Earthq. Eng. 2017, 15, 2695–2735. [Google Scholar] [CrossRef]
  102. Akkar, S.; Sandıkkaya, M.A.; Bommer, J.J. Empirical Ground-Motion Models for Point- and Extended-Source Crustal Earthquake Scenarios in Europe and the Middle East. Bull. Earthq. Eng. 2014, 12, 359–387. [Google Scholar] [CrossRef]
  103. Boore, D.M.; Atkinson, G.M. Ground-Motion Prediction Equations for the Average Horizontal Component of PGA, PGV, and 5%-Damped PSA at Spectral Periods between 0.01 s and 10.0 s. Earthq. Spectra 2008, 24, 99–138. [Google Scholar] [CrossRef]
  104. Campbell, K.W.; Bozorgnia, Y. NGA Ground Motion Model for the Geometric Mean Horizontal Component of PGA, PGV, PGD and 5% Damped Linear Elastic Response Spectra for Periods Ranging from 0.01 to 10 s. Earthq. Spectra 2008, 24, 139–171. [Google Scholar] [CrossRef]
  105. Pankow, K.L. The SEA99 Ground-Motion Predictive Relations for Extensional Tectonic Regimes: Revisions and a New Peak Ground Velocity Relation. Bull. Seismol. Soc. Am. 2004, 94, 341–348. [Google Scholar] [CrossRef]
  106. Kataria, N.P.; Shrikhande, M.; Das, J.D. Deterministic Seismic Hazard Analysis of Andaman and Nicobar Islands. J. Earthq. Tsunami 2013, 7, 1350035. [Google Scholar] [CrossRef]
  107. Hamdache, M.; Peláez, J.A.; Talbi, A.; Mobarki, M.; Casado, C.L. Ground-Motion Hazard Values for Northern Algeria. Pure Appl. Geophys. 2012, 169, 711–723. [Google Scholar] [CrossRef]
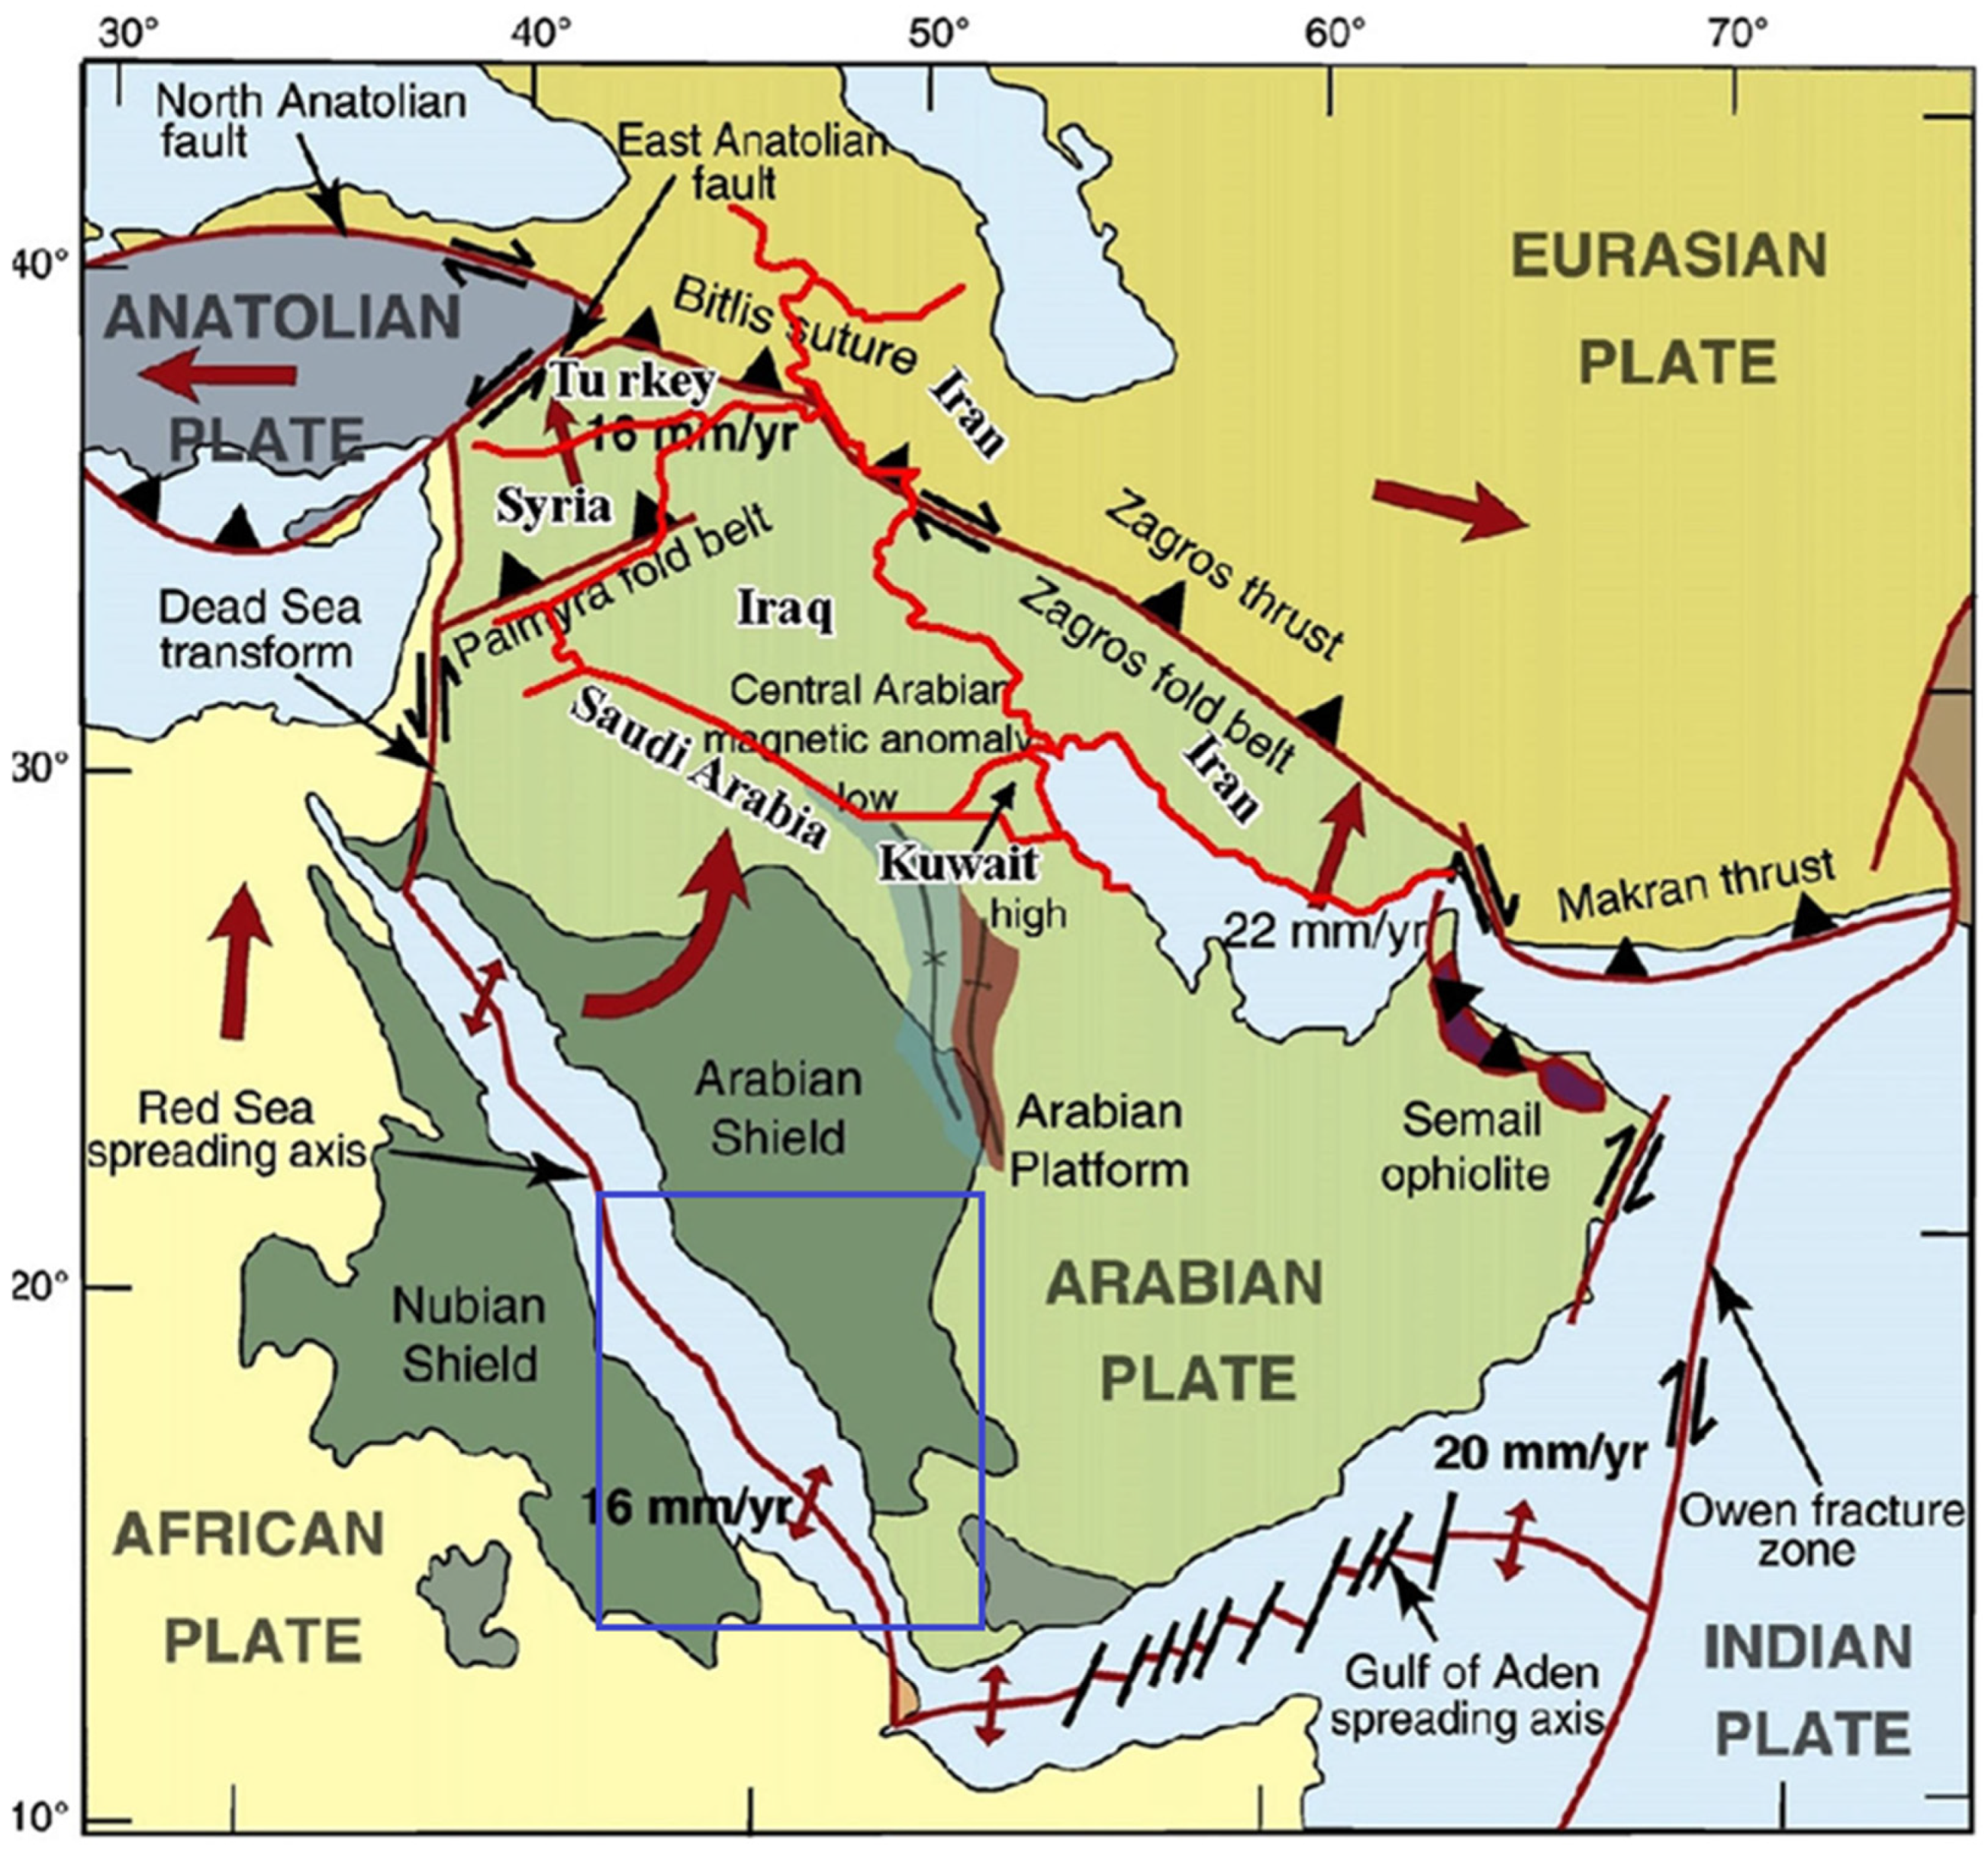
Figure 1. Tectonic setting for Saudi Arabia and surrounding areas after [4]. The studied area is marked by an open blue rectangle, and the arrows refer to the relative movements of the tectonic plates.
Applsci 14 06600 g001
Figure 2. Considered seismic source model, adapted from [33,34], illustrating seismic activity in the left plot and solutions for focal mechanisms in the right plot [42]. Labels “NF: pure normal, SS: pure strike-slip, TF: pure thrust, NS: pure normal with a strike-slip component, TS: thrust with a strike-slip component, and U: undefined” stand for the different focal mechanisms.
Applsci 14 06600 g002
Figure 3. Logic tree designed for the present hazard evaluation. References included here refer to the considered NGA-West2 attenuation equations [75,76,77].
Applsci 14 06600 g003
Figure 4. Isoacceleration maps depicting hazard values for B/C NEHRP site condition. The studied cities’ locations (ABH: Abha, BAH: Al Bahah, BRK: Al Birk, BSH: Bisha, FAR: Farasan Island, JAZ: Jazan, KHM: Khamis Mushait, LTH: Al Lith, NAJ: Najran, QNF: Al Qunfundhah, TAT: Tathleeth) are marked with solid black circles.
Applsci 14 06600 g004
Figure 5. Hazard curves, under B/C (continuous lines) and C (dashed lines) site conditions, for the selected cities.
Applsci 14 06600 g005
Figure 6. UHS, for return periods of 475 and 975 years, taking into account B/C and C NEHRP soil classes, and for a 5% damping ratio.
Applsci 14 06600 g006
Figure 7. The estimated design spectra (for a 5% damping ratio) for several cities using the [100] criteria, compared to the UHS for the B/C and C classes, both for a 475-year return period.
Applsci 14 06600 g007
Figure 8. Fit of obtained ground motion data to a straight line passing through the origin (s stands for the slope).
Applsci 14 06600 g008
Table 1. Recurrence parameters for earthquakes in the model imported from [33,34], including the maximum expected magnitude, b-value, and the yearly rate of earthquakes (λ) over Mw 4.0.
Sourceλ (≥Mw 4.0)b-ValueMmax
S021.21 ± 0.270.78 ± 0.057.20 ± 0.18
S030.54 ± 0.120.55 ± 0.045.88 ± 0.13
S061.59 ± 0.100.69 ± 0.056.55 ± 0.16
S380.10 ± 0.000.78 ± 0.106.20 ± 0.30
S390.06 ± 0.000.78 ± 0.105.10 ± 0.30
S400.05 ± 0.000.78 ± 0.104.90 ± 0.30
S410.21 ± 0.000.78 ± 0.105.70 ± 0.30
S420.52 ± 0.130.86 ± 0.086.40 ± 0.31
S430.44 ± 0.100.83 ± 0.086.40 ± 0.32
S441.54 ± 0.320.69 ± 0.067.30 ± 0.34
S450.10 ± 0.000.70 ± 0.105.70 ± 0.30
S460.03 ± 0.030.72 ± 0.076.90 ± 0.31
S496.22 ± 1.060.67 ± 0.046.70 ± 0.31
S572.00 ± 0.340.99 ± 0.066.60 ± 0.31
Table 2. Seismic hazard values, including PGA, SA (0.2 s), SA (1.0 s), maximum spectral acceleration (SAmax), and spectral period (Tmax) related to the SAmax, computed for 475- and 975-year return periods, and for B/C and C classes.
City *Site
Class
475 Years975 Years
PGA
(g)
SA (0.2 s)
(g)
SA (1.0 s)
(g)
SAmax
(g)
Tmax
(s)
PGA
(g)
SA (0.2 s)
(g)
SA (1.0 s)
(g)
SAmax
(g)
Tmax
(s)
ABHB/C0.0190.0360.0400.0580.500.0250.0550.0670.1040.50
C0.0220.0460.0520.0770.500.0300.0760.0910.1320.50
BAHB/C0.0140.0240.0380.0520.750.0190.0340.0640.0940.75
C0.0170.0300.0490.0660.500.0220.0450.0860.1210.50
BRKB/C0.0260.0660.0770.1270.500.0350.1180.1350.1840.50
C0.0310.1030.1080.1540.500.0450.1500.1650.2290.50
LTHB/C0.0290.0830.0770.1300.500.0410.1350.1360.1900.50
C0.0350.1260.1080.1580.500.0530.1710.1670.2370.50
QNFB/C0.0320.0990.0830.1370.500.0470.1500.1430.2020.50
C0.0390.1370.1180.1670.500.0610.1900.1750.2480.50
BSHB/C<0.010.0150.0220.0280.750.0120.0220.0340.0460.75
C0.0110.0190.0270.0330.500.0150.0290.0440.0560.75
FARB/C0.1120.2680.1370.2700.25/
0.30
0.1660.4120.2350.4240.30
C0.1480.3710.1890.3710.200.2030.5200.2920.5260.30
JAZB/C0.0380.1210.0600.1260.300.0590.1670.1130.1750.30
C0.0470.1520.0840.1540.300.0770.2160.1410.2190.30
KHMB/C0.0280.0640.0360.0680.10/
0.15
0.0440.1200.0590.1260.10/
0.15
C0.0340.0890.0460.0940.150.0550.1510.0800.1560.15
NJRB/C0.0270.0620.0240.0660.150.0420.1170.0380.1240.15
C0.0330.0880.0300.0930.150.0540.1490.0490.1550.15
TATB/C<0.010.0100.0150.0180.50/
0.75
< 0.010.0120.0220.0280.75
C<0.010.0110.0180.0220.75< 0.010.0150.0280.0340.75
* ABH: Abha, BAH: Al Bahah, BRK: Al Birk, BSH: Bisha, FAR: Farasan Island, JAZ: Jazan, KHM: Khamis Mushait, LTH: Al Lith, NAJ: Najran, QNF: Al Qunfundhah, TAT: Tathleeth.
Table 3. The results obtained (PGA (g) for B/C boundary site class over a 475-year return period) in comparison with two previous published studies.
Studied CityCurrent Assessment[20][101]
Abha0.0190.0400.010–0.025
Al Birk0.0260.10–0.150.075–0.100
Al Lith0.0290.0750.075–0.100
Al Qunfundhah0.0320.075~0.100
Farasan Island0.112>0.150>0.150
Jazan0.0380.0800.075–0.100
Najran0.0270.0650.025
Disclaimer/Publisher’s Note: The statements, opinions and data contained in all publications are solely those of the individual author(s) and contributor(s) and not of MDPI and/or the editor(s). MDPI and/or the editor(s) disclaim responsibility for any injury to people or property resulting from any ideas, methods, instructions or products referred to in the content.