Article

Geological Modeling of Shale Oil in Member 7 of the Yanchang Formation, Heshui South Area, Ordos Basin

College of Geosciences, Yangtze University, Wuhan 430100, China
*
Author to whom correspondence should be addressed.
Appl. Sci. 2024, 14(15), 6602; https://doi.org/10.3390/app14156602 (registering DOI)
Submission received: 26 June 2024 / Revised: 25 July 2024 / Accepted: 26 July 2024 / Published: 28 July 2024
(This article belongs to the Special Issue Advances in Geosciences: Techniques, Applications, and Challenges)

Abstract

:
In recent years, the Chang 7 member of the Mesozoic Triassic Yanchang Formation in the Ordos Basin has emerged as a significant repository of abundant and distinctive unconventional oil resources. The Heshui area boasts substantial shale oil reserves, with reported third-level reserves surpassing 600 million tons. However, the region in the southern part of Heshui is marked by pronounced variability in reservoir quality, intricate oil–water dynamics, low formation energy, and suboptimal fluid properties, leading to divergent development outcomes for horizontal wells. There is an imperative need to devise and refine new geological models to underpin the efficient exploitation of shale oil in the southern Heshui area. This study focuses on the shale oil reservoir of the Chang 7 member in the southern Heshui area of the Ordos Basin, conducting detailed stratigraphic correlation and establishing a refined isochronous stratigraphic framework. Utilizing PetrelTM modeling software (version 2018), we integrate deterministic and stochastic modeling approaches, adhering to the principles of isochronous and phased modeling. By assessing the thickness of sand and mudstone layers and the overall stratigraphic sequence, we derive a geological probability surface. Subsequently, this surface is harnessed to constrain the lithofacies, yielding a constrained lithofacies model. Employing sequential indicator simulation and sequential Gaussian stochastic simulation, we develop a reservoir attribute model that is anchored in the lithofacies model and its controls, culminating in a robust and dependable static model. Employing the geological probability surface constraint method, we meticulously construct the reservoir matrix model, amalgamating individual well data with the inherent certainty and randomness of reservoir plane thickness. This approach further enhances the model’s accuracy and mitigates the uncertainty and randomness associated with inter-well interpolation to a significant degree.

1. Introduction

In recent years, China’s rapid economic development has been accompanied by a sharp increase in the consumption of oil and gas, leading to a growing dependence on imports for these resources. In 2018, the figures for oil and natural gas imports reached 69.8% and 45.3%, respectively [1]. The urgent need to discover new types of oil and gas resources, coupled with the necessity for theoretical and technological breakthroughs to bolster domestic production, has become an industry consensus. Among the new resource types, shale oil stands out as one of the most viable options to explore. The swift advancement in oil and gas geology theory [2,3,4,5,6] and horizontal well volume fracturing technology [7,8,9,10,11,12,13,14,15,16,17,18] has positioned shale oil as a primary target for unconventional oil and gas exploration and exploitation [19,20,21,22]. Its vast reserves have secured a pivotal role in global energy strategies [23,24]. Thus, achieving a breakthrough in China’s shale oil research is of strategic importance, not only for maintaining the industry’s technical leadership but also for safeguarding national energy security [25,26].
The Ordos, Junggar, Bohai Bay, and Songliao basins are endowed with substantial shale oil resources [27,28,29]. According to the CNPC’s assessment in 2016, the total shale oil reserves in these areas have exceeded 14.5 billion tons. However, due to the relatively late start of shale oil exploration in China, it is faced with many difficulties and high costs in the development process. At present, only parts of the Junggar Basin and Ordos Basin have achieved breakthrough progress [30,31]. With the continuous improvement of shale oil exploitation technology in China, shale oil is expected to play a key role in China’s future energy supply system [32,33,34,35].
In this paper, the geological characteristics and distribution of shale oil in Member 7 (Chang 7) of the Yanchang Formation in the southern Heshui area of the Ordos Basin are deeply studied and analyzed, and the geological probability surface is obtained by comparing the thickness of sand and mud bodies with that of the target layer. By comparing the thickness of sand and mud bodies with that of the target layer, a geological probability surface is derived. Utilizing multiple information co-constraints, a reservoir attribute model is established based on the lithofacies model and lithofacies control through sequential indicator simulation and sequential Gaussian stochastic simulation, thereby providing a stable and reliable static model. To enhance the accuracy of the geological model further, this study integrates the sedimentary environment of the Ordos Basin. Guided by the stratigraphic structure pattern and using the marker layer, sedimentary cycle, and lithology combination as the basis for comparison, detailed stratigraphic correlation is conducted, and a refined isochronous stratigraphic framework is established. This approach adheres to the principle of isochronous modeling and employs a comprehensive combination of deterministic and stochastic modeling techniques to improve the precision of geological modeling.
Overall, this study posits that the shale oil in the Chang 7 member of the Yanchang Formation in the southern Heshui area of the Ordos Basin could potentially stimulate an increase in oil and natural gas storage and production within the basin, heralding a new model for exploration and development. Furthermore, the breakthrough achievements made by the Changqing Oilfield in shale oil exploration and development of the Chang 7 block have not only bolstered the company’s confidence in further exploration but have also played a critically important role in guiding extensive exploration and development efforts for continental shale oil across China. A systematic collation of the core technologies in shale oil exploration and development within the Chang 7 block is expected to offer valuable insights for the broader endeavor of shale oil exploration and development in China.

2. Basic Geological Overview

The Ordos Basin is a large and structurally simple cyclic craton basin located at the intersection of five provinces: Shaanxi, Gansu, Ningxia, Inner Mongolia, and Shanxi. The geomorphic structure of this region encompasses the Tianhuan Depression along with five additional tectonic units. These consist of six distinct tectonic units: the Jinxi flexural fold belt and Yishan slope to the east, the marginal thrust belt to the west, the Yimeng uplift to the north, and the Weibei uplift to the south, covering an area of approximately 37 × 104 km2 [36]. Notably, the Heshui area, which is positioned on the southwest side of the Yishan slope (Figure 1), serves as the principal oil-producing base for the Changqing Oilfield in the Changdong region. As the main oil-producing reservoir in the Heshui area, the Mesozoic Triassic Yanchang Formation is divided into the Chang 10–Chang 1 members from bottom to top. The maximum Mesozoic lake-flooding period in the basin was the Chang 7 sedimentary period, during which the semi-deep–deep lake area covered a wide area, and a large area of organic-rich mud shale and delta-front gravity flow deposits was developed, mainly distributed in the southwest of the basin. According to the depositional cycle, the Chang 7 member can be further subdivided into five sublayers from bottom to top, namely, the Chang 73, Chang 722, Chang 721, Chang 712, and Chang 711 sublayers [37]. The study area is located in the southern Heshui area of the Qingcheng Oilfield. The structure is gentle, and the inclination is less than 1°. The area is predominantly underlain by a lacustrine gravity flow sedimentary system. The sedimentary microfacies present include sandy clastic flows, turbidity flow deposits, and deep lacustrine mud facies. Within the turbidite sand bodies, Bouma sequences and flame-like equal gravity flow structures are observable, which constitute the primary exploration targets for interbedded shale oil in this region.

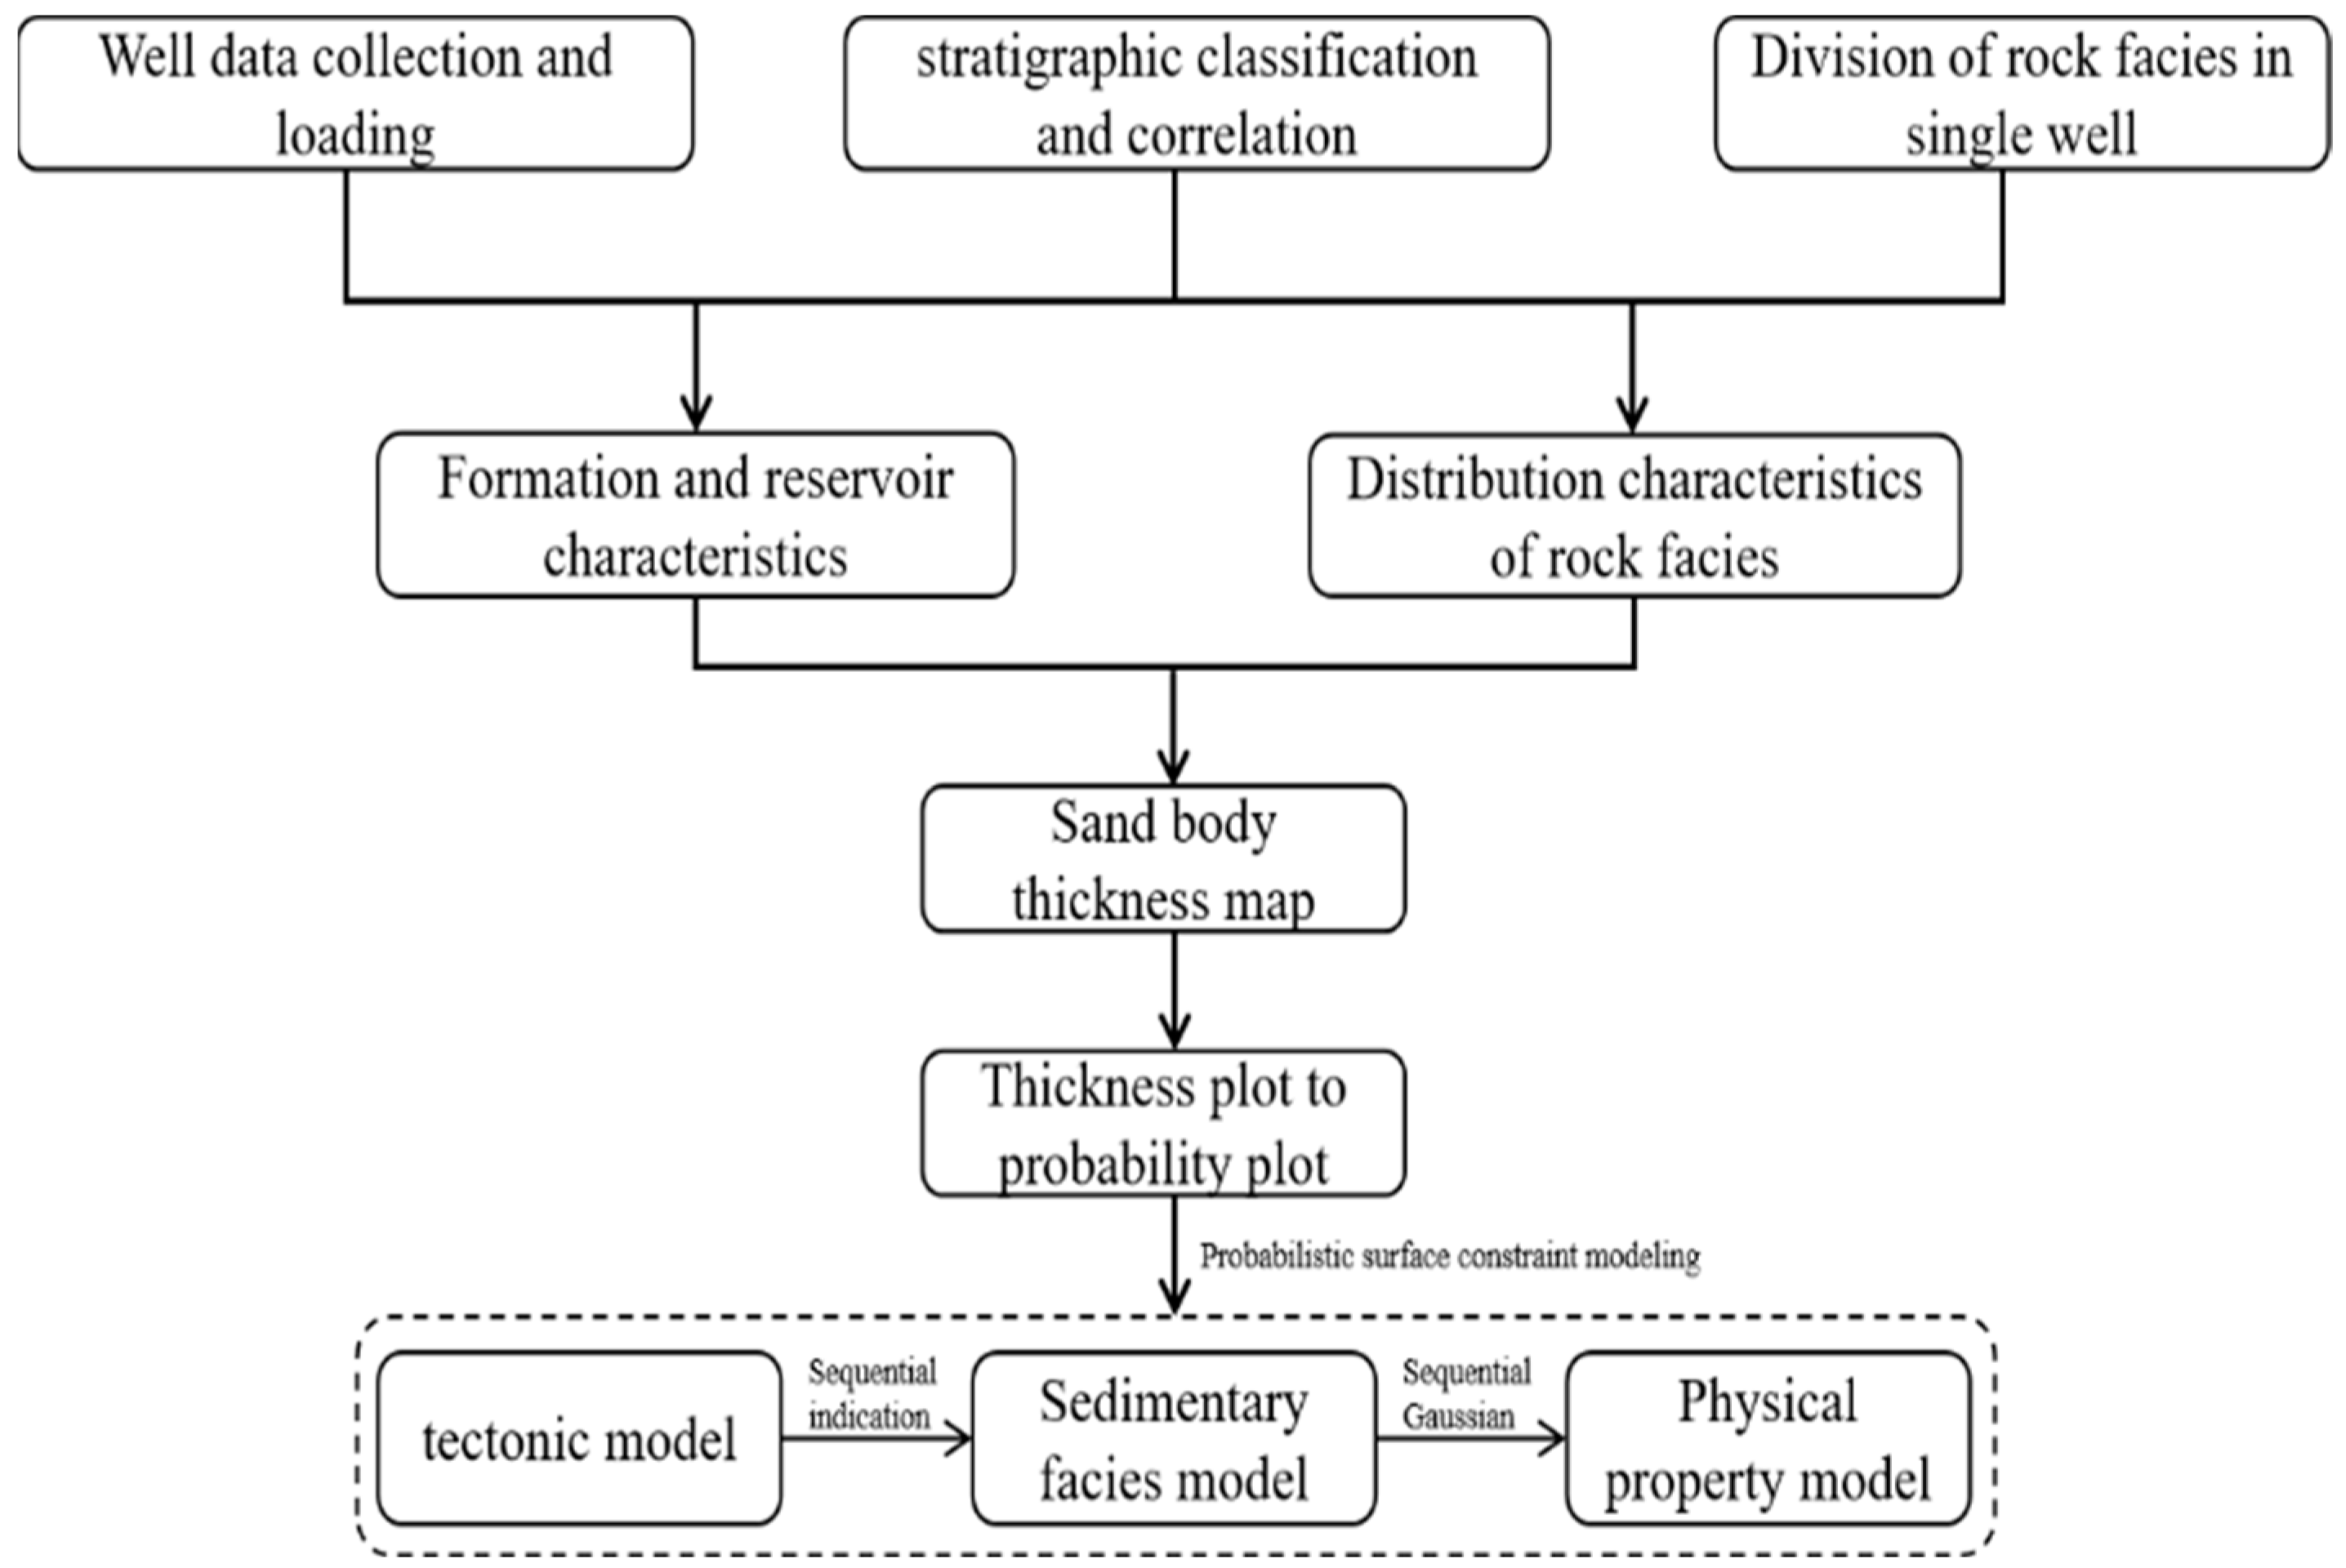
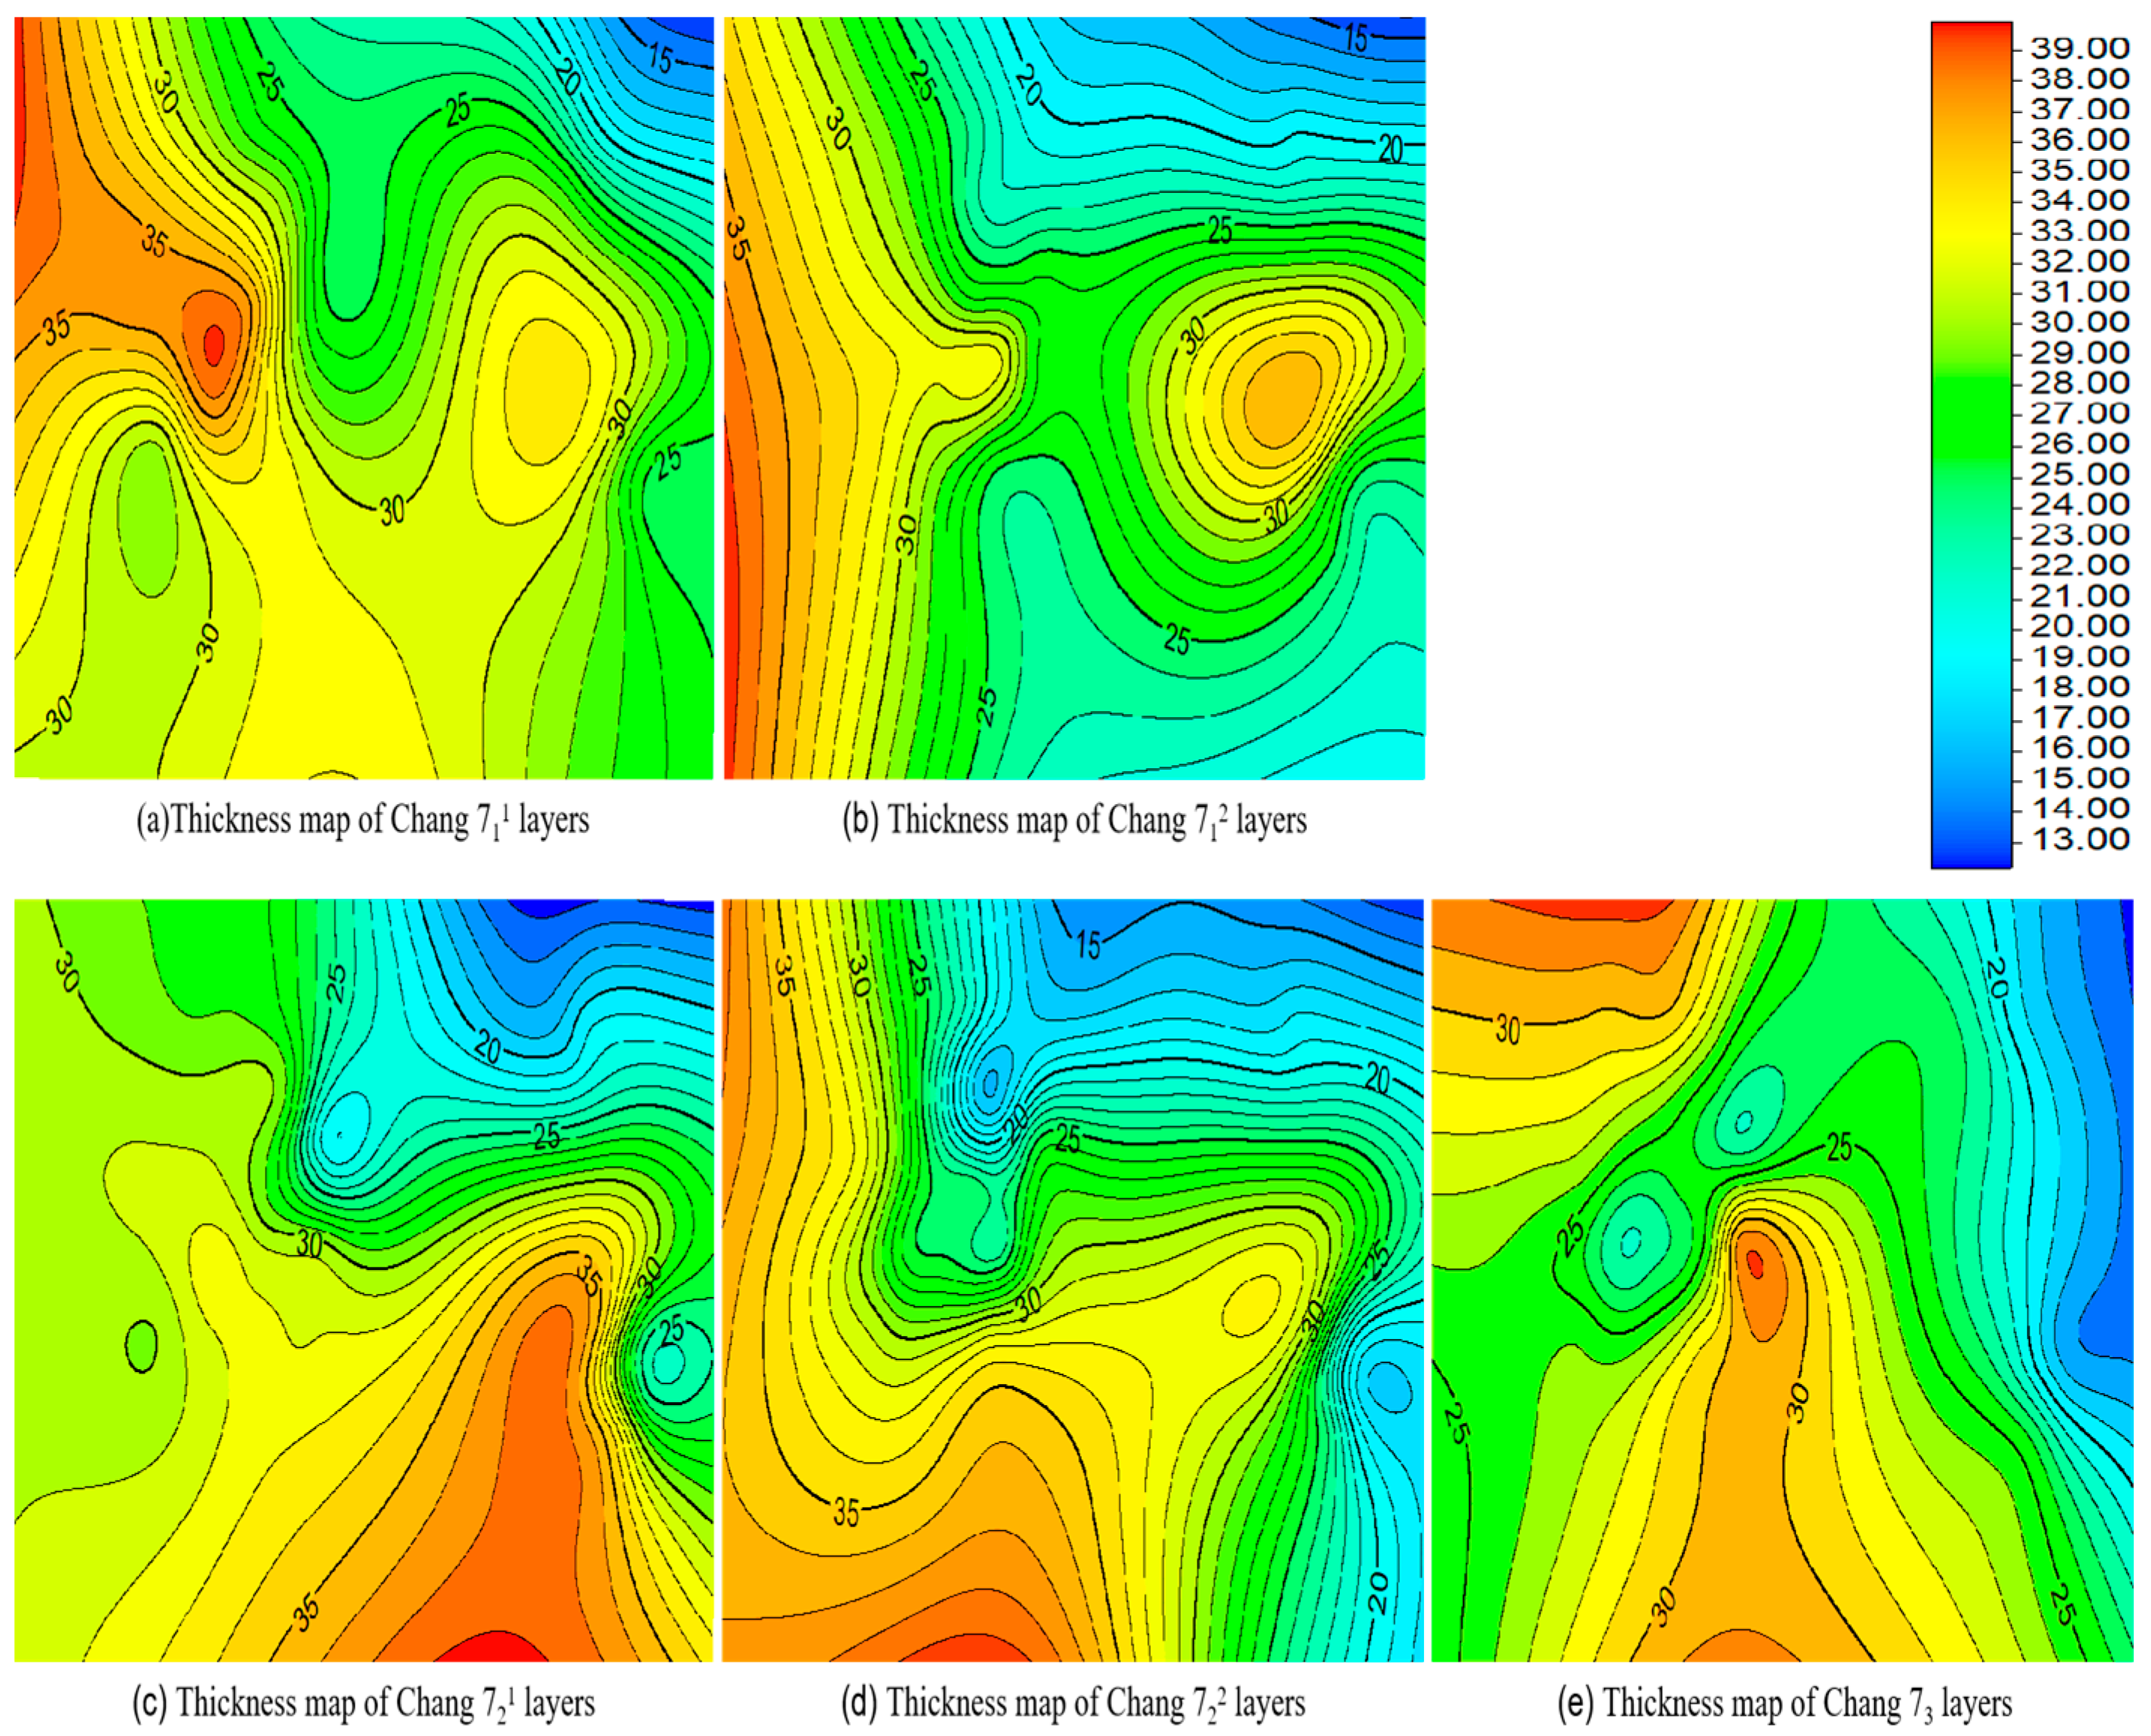
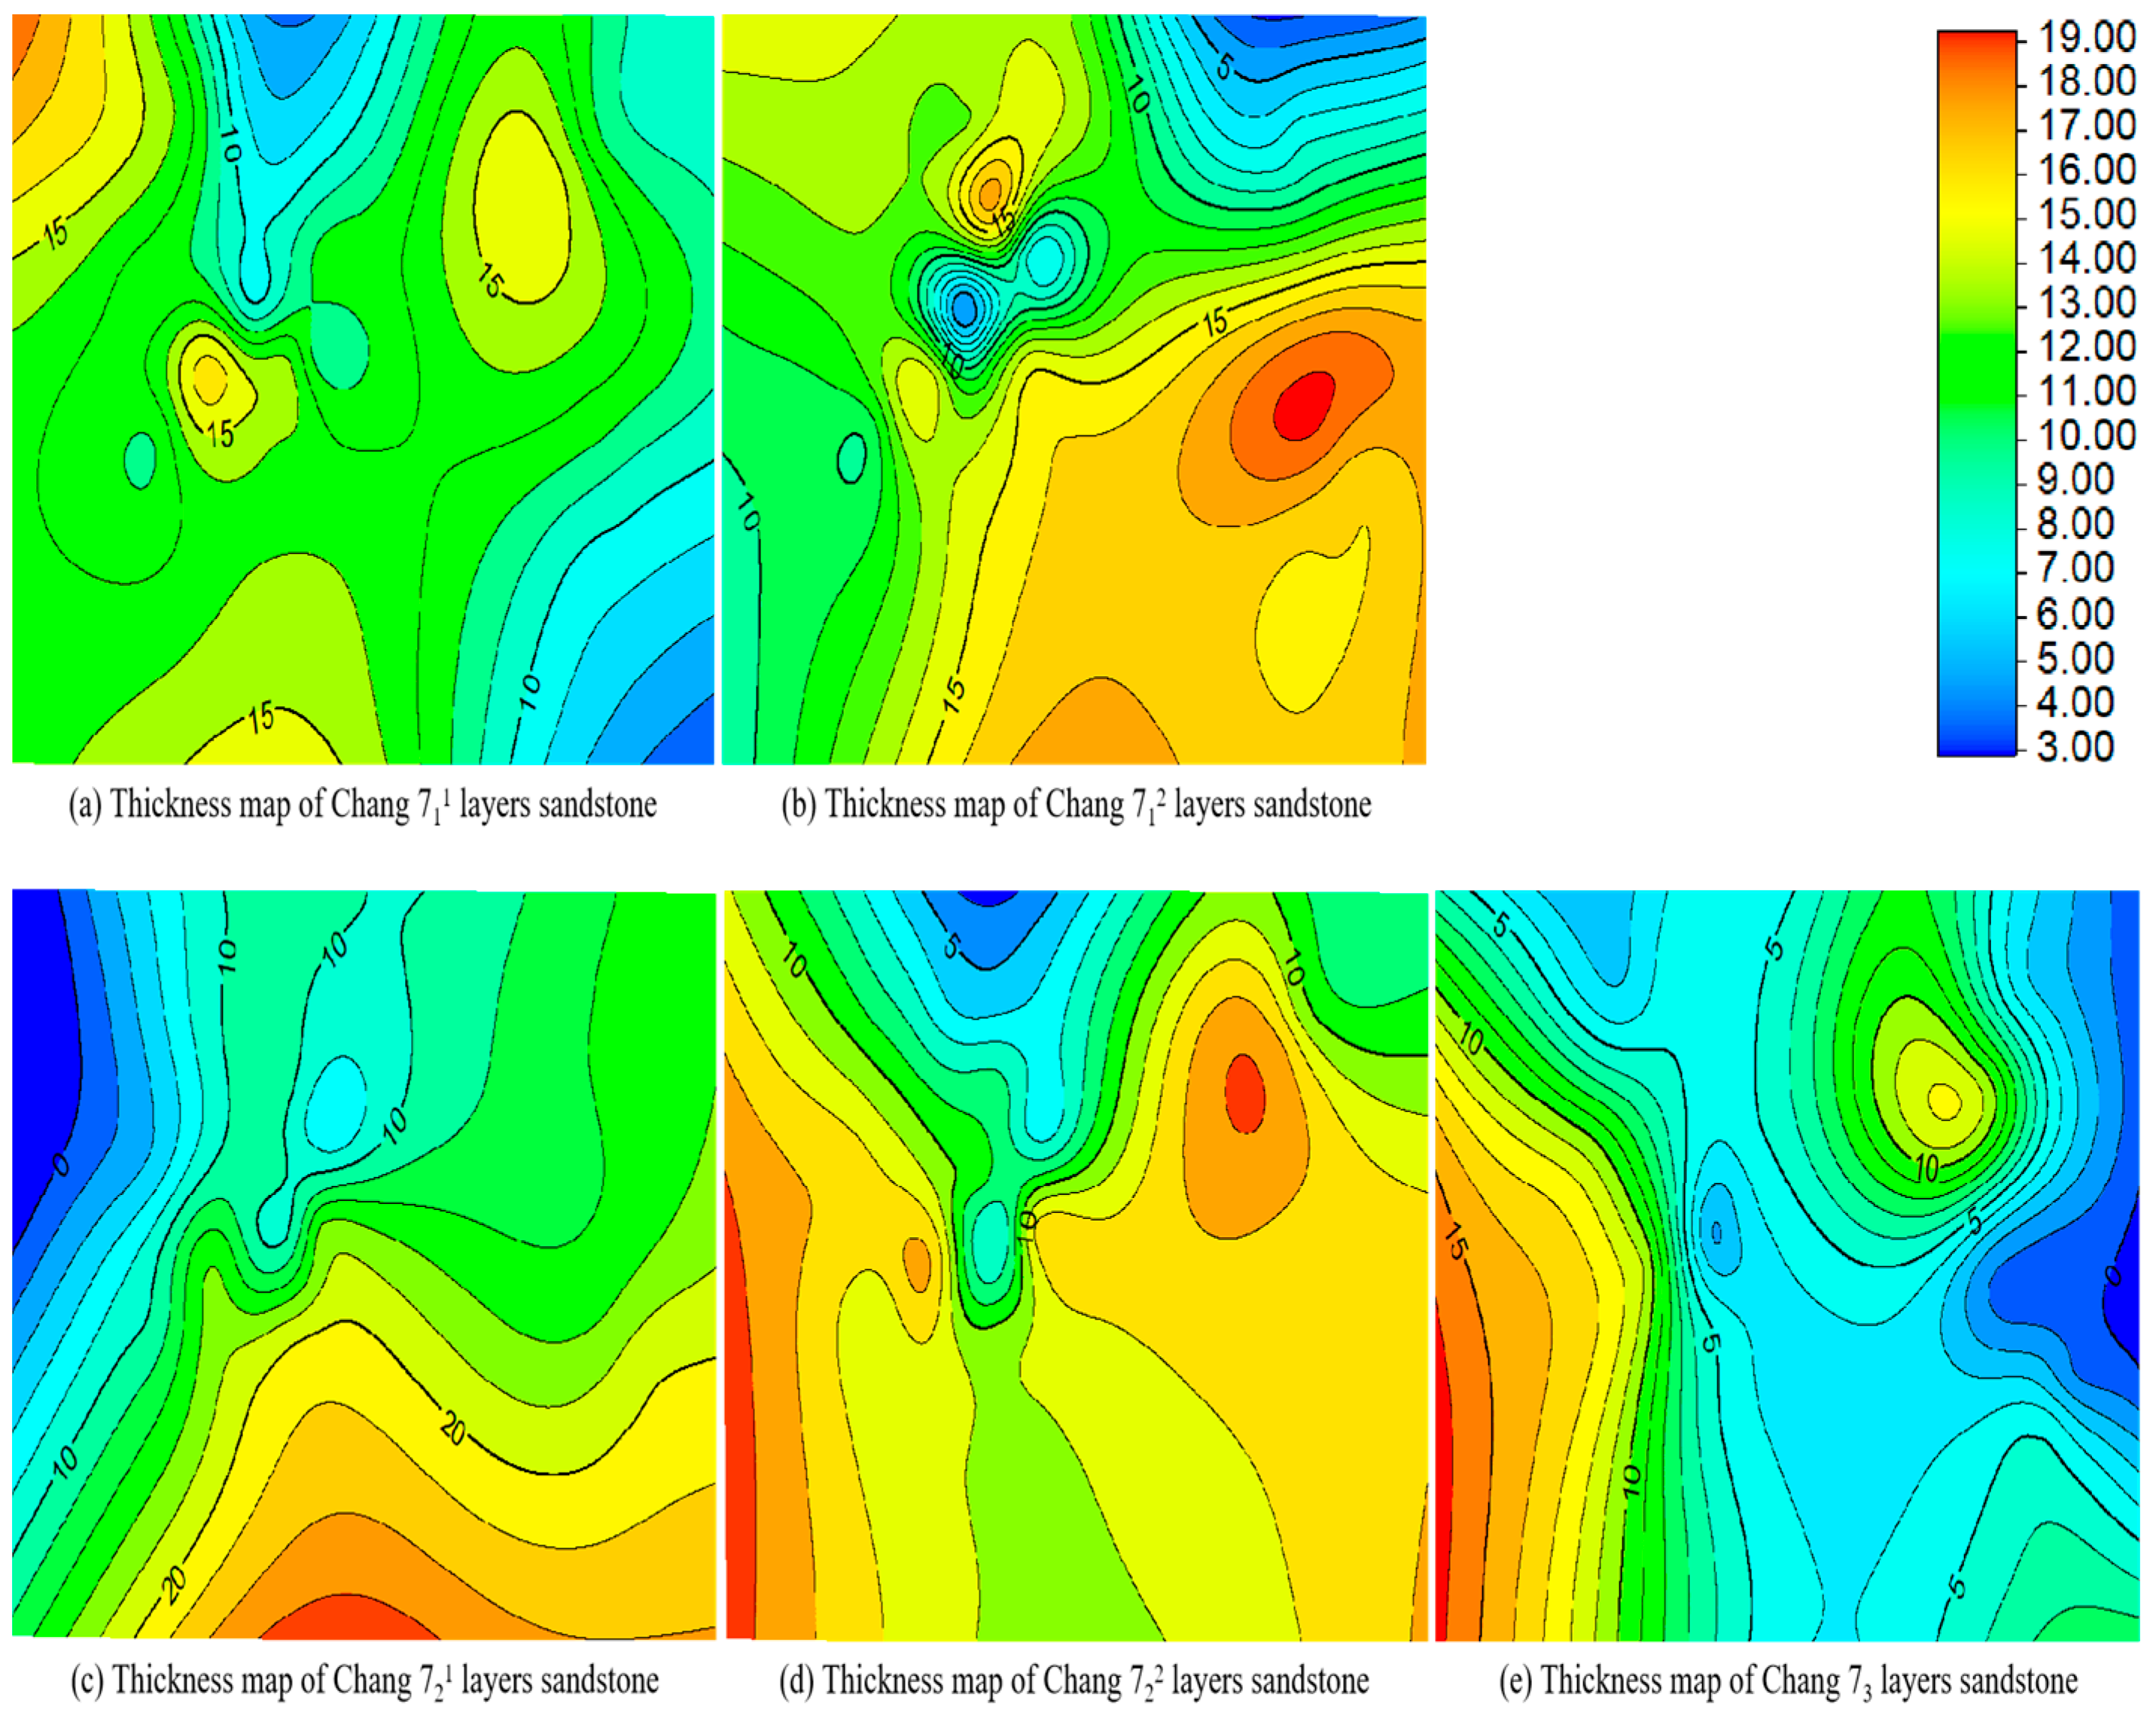
3. Research Methods and Processes

The construction of 3D geological models is a complex endeavor that necessitates a plethora of foundational data, including well position coordinate information, well inclination data, well logging data, seismic data, and drilling-related data. The data loading process is fundamental to establishing a comprehensive database. PetrelTM [38], Schlumberger’s software (version 2018), is an integrated tool for exploration and development, featuring the ability to quickly build geological models, providing a shared information platform for geologists, geophysicists, petrophysicists, and reservoir engineers, and offering free versions for academic purposes. It amalgamates geological analysis with seismic, well logging, and drilling data, creating an integrated geoscience platform. This platform facilitates in-depth research on geological elements, enabling the execution of formation correlation and data analysis. It allows for the creation of well models and planar models, culminating in the development of three-dimensional geological models. These models provide insights into the planar distribution laws of lithofacies, the direction of provenance, and the planar distribution patterns of various reservoir parameters [39,40,41,42,43]. In the study area, more than 20 wells have been drilled into the target layer. Utilizing the PetrelTM modeling software (version 2018), the primary data for this modeling exercise encompass well location coordinate data, well logging data, well inclination data, stratification data, log interpretation conclusions, and lithology data. Upon meticulous sorting and organization of these data, a three-dimensional geological model of the target layer for the study area was constructed. The structural model of the target layer was established using well stratification data and structural maps. Subsequently, the lithofacies model was formulated based on the distribution maps of sand and mudstone, as well as lithology data. With the lithofacies model as a foundation, the attribute model was developed, incorporating data from logging interpretation, curves, porosity, and permeability distribution maps. The detailed methodology is depicted in the subsequent figure (Figure 2).

4. Study of Sedimentary Microfacies

The Chang 7 reservoir in the Heshui area, as the epicenter of sedimentation during the period of maximum lake flooding, was deposited within a semi-deep–deep-lake sedimentary environment characterized by typical reducing conditions. This environment fostered the development of a deep-water gravity flow sedimentary system, shaped by the supply of terrigenous debris and gravitational slumping, marking a key phase in the formation and evolution of sandy debris flows and turbidite sand bodies. The sedimentary system can be categorized into inner fan, middle fan, and outer fan subphases, encompassing a variety of microfacies types such as sandy clastic flows, turbidity currents, muddy clastic flows, and deep lake mud [44]. The region of the lake basin in the study area is predominantly characterized by deep lake plain deposits. The lithology of the Chang 7 Member in the southern Heshui area is primarily composed of fine sandstone, siltstone, argillaceous siltstone, and mudstone. These deposits are notable for their substantial thickness, well-developed horizontal bedding, and richness in biological fossils. The sedimentary microfacies of the Chang 71 to Chang 72 strata are mainly sandy clastic flows, turbidite flows, and deep lacustrine mud facies. The lithofacies associated with sandy clastic flows consist of gray, massive, oil-bearing fine sandstone, parallel-stratified fine sandstone, sand-laminated fine sandstone, gravelly fine sandstone, and irregular mudstone with torn clasts. These lithofacies exhibit good rounding and sorting. The sedimentary structures include massive bedding, abrupt contact structures, and basement shear structures. The turbidite facies are predominantly gray, massive argillaceous siltstone, channelized argillaceous siltstone, and fine sandstone containing Bouma sequences (BCs). The sedimentary structures are seal structures (channel model, heavy load model), deformed bedding structures, incomplete Bouma sequences, and flame structures. The lithofacies of the deep lake mudstone is black mud shale, which is well sorted and produced in a banded form. At the same time, there are small amounts of mica and plant debris, along with abundant animal remains fossils. The maximum thickness of the single-layer sand body is only 5 m, and the coverage area is relatively limited, which can make it a favorable reservoir.

5. Establishment of 3D Geological Model

The construction of a 3D geological model is an integral component of reservoir modeling and simulation, initiated by developing a lithofacies model [45]. Subsequently, under the guidance of this lithofacies model, a reservoir parameter model is formulated to anticipate the physical attributes of inter-well reservoirs. To enhance the precision of geological modeling, the stratigraphic structure pattern was utilized as a reference framework. The marker layer, sedimentary cycle, and lithology combination served as the foundation for comparative analysis, enabling the execution of detailed stratigraphic correlation and the establishment of an accurate isochronous stratigraphic framework. According to the sedimentary cycle and lithology combination, the interior of the Chang 7 member was divided into three sand groups and five small layers. The lithology of Chang 72 and Chang 73 is different, the characteristics are obvious, and the boundary is easy to identify. Chang 71 and Chang 72 are divided according to the sedimentary cycle, and the top of the cycle is argillaceous and carbonaceous mudstone. The precise isochronous stratigraphic framework aims to follow the principle of isochronous modeling and apply the combination of deterministic modeling and stochastic modeling in geological modeling. Considering the dominant control of lithofacies on the distribution of sand bodies and reservoir physical properties in the area, the authors established the lithofacies model for the target layer within the study area prior to constructing the reservoir physical properties model.

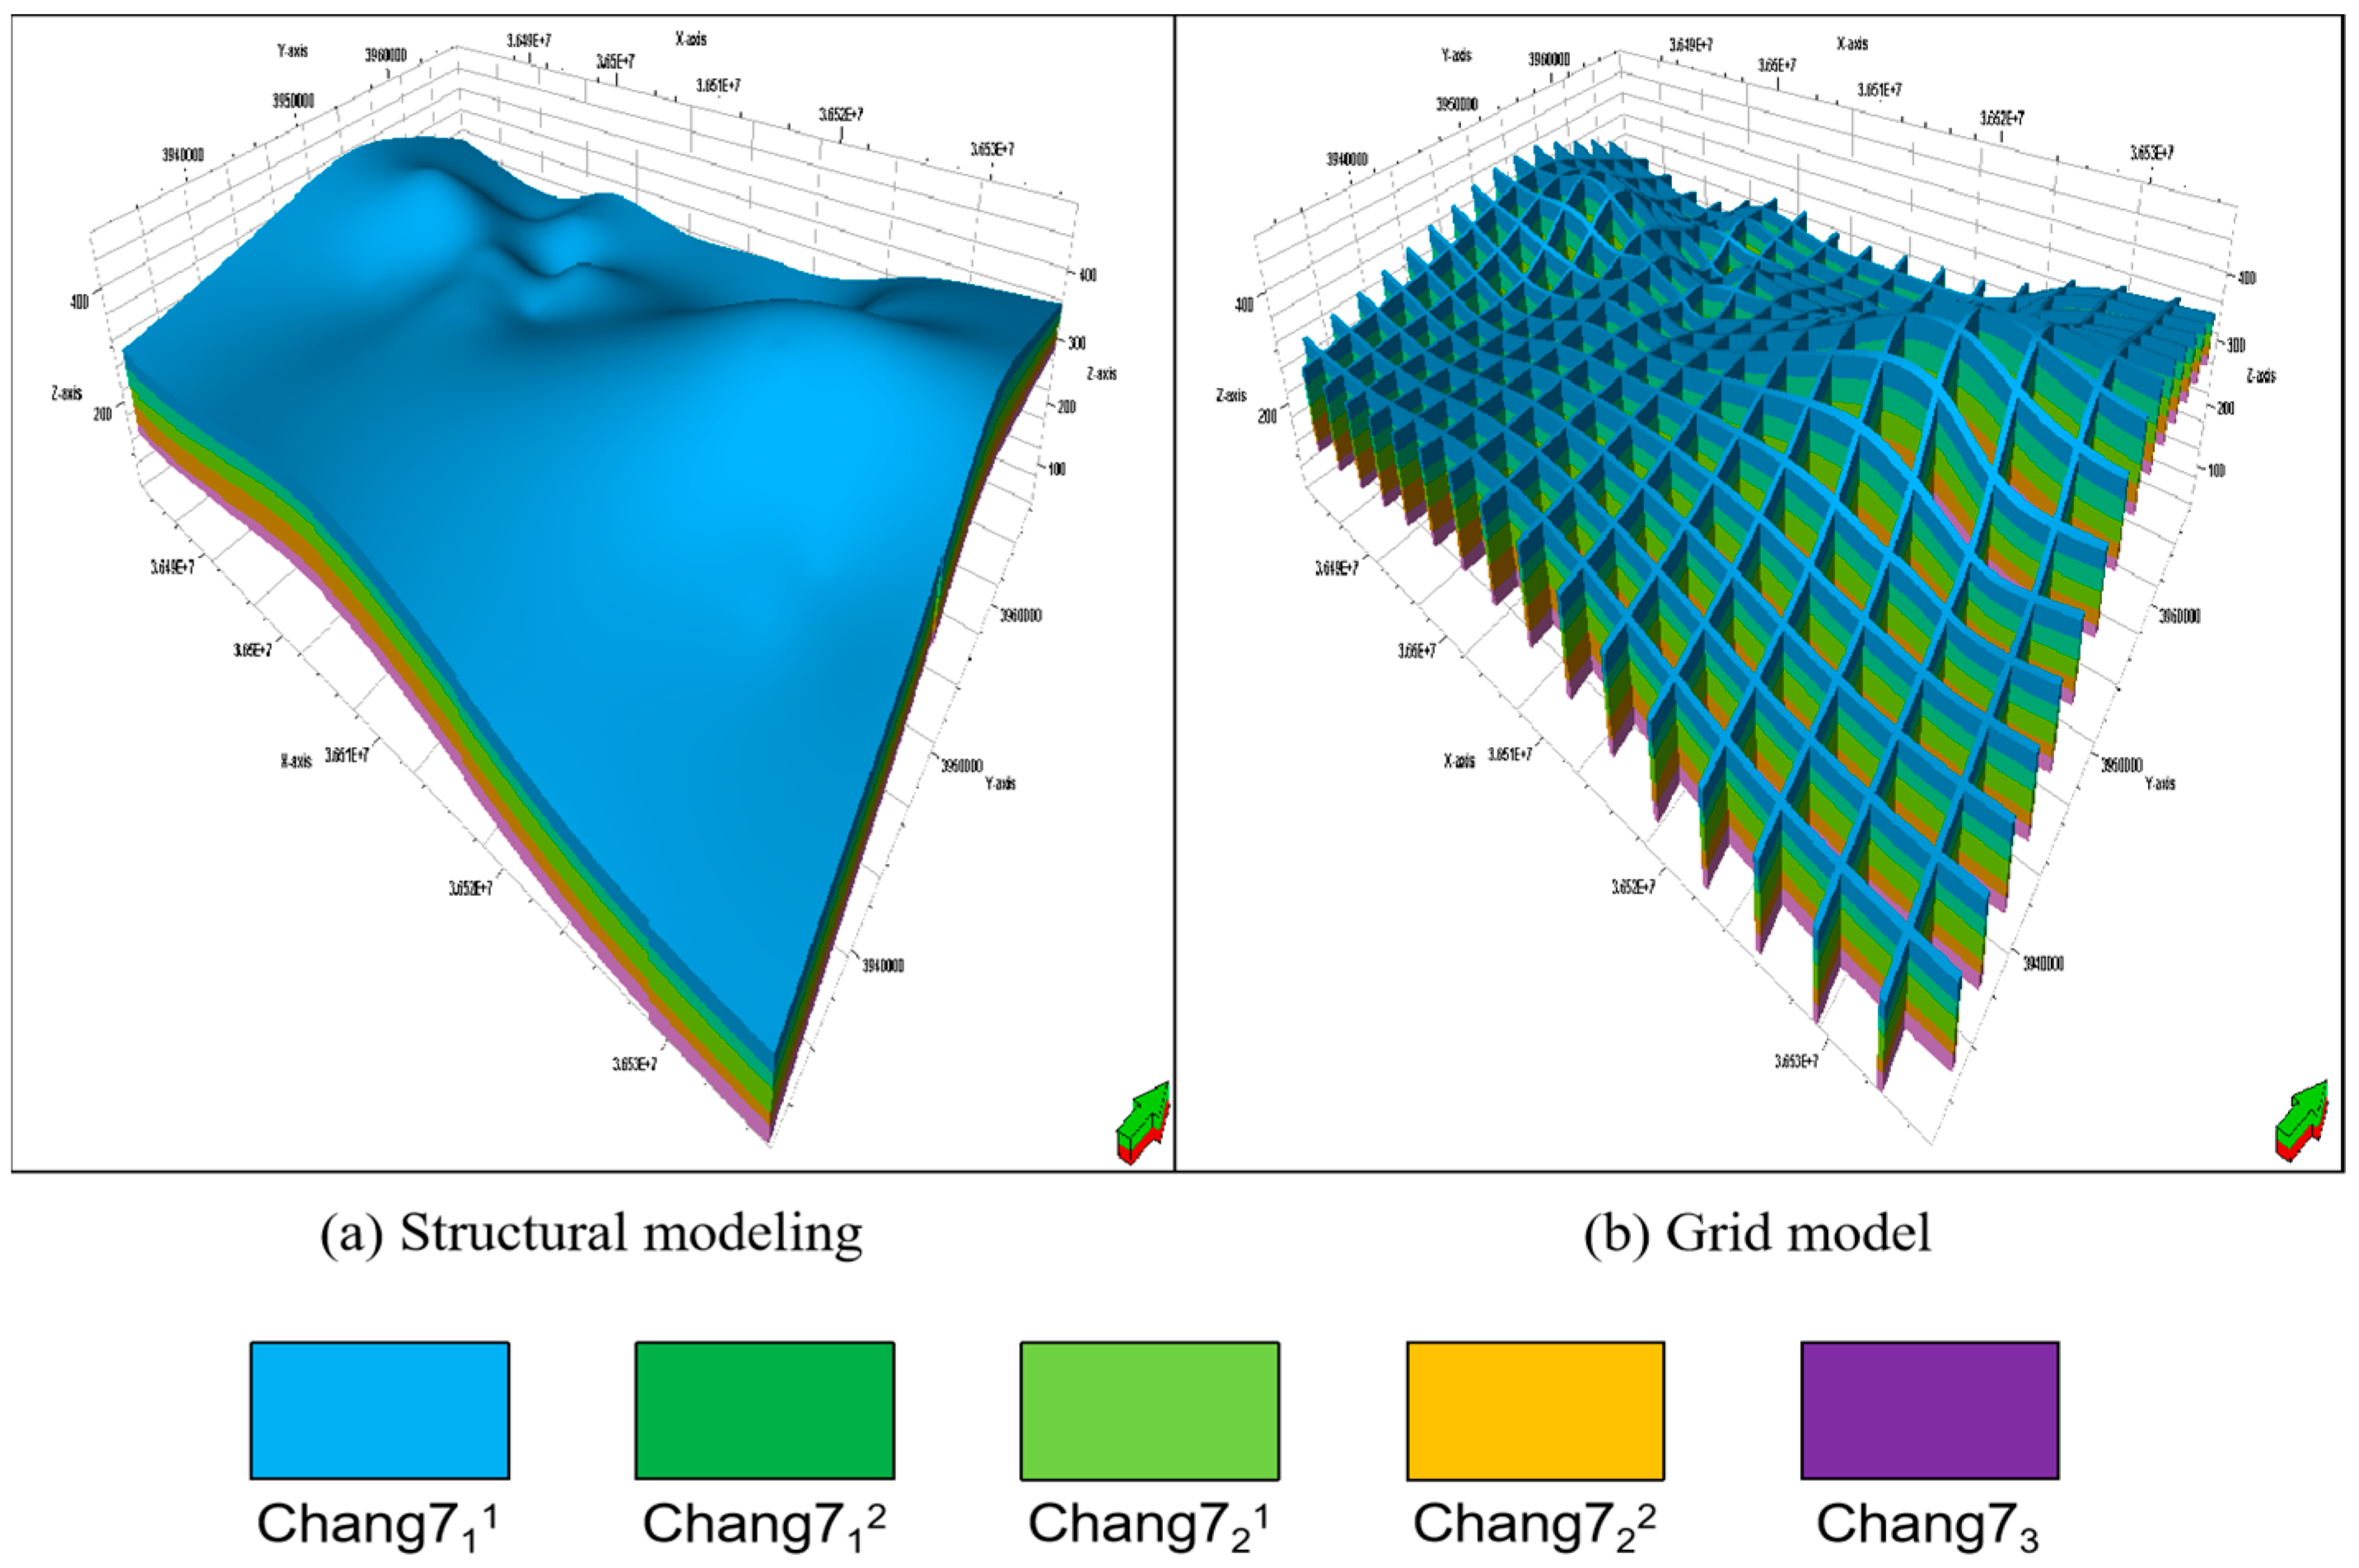
5.1. Structural Model

Structural modeling is founded on well logging data and a meticulously established fine stratigraphic framework. The modeling software employed in this research was PetrelTM, and the single-layer three-dimensional formation structure model conforming to the principle of isochronous modeling was initially constructed. Since no faults are developed in this area, stratification data, log data as hard data, structural isocontours as trend surfaces, and formation thickness data were used to calibrate the volume. On this basis, using the method of curvature minimization and thickness superposition, combined with Kriging interpolation, the layer models of the top and bottom layers of the Chang 711, Chang 712, Chang 721, Chang 722, and Chang 73 layers were constructed. The 3D model was composed of 100 layers longitudinally, the vertical grid accuracy was 0.5 m, the horizontal geographical unit size was 50 × 50 m, the number of I, J, K direction grids was 120 × 120 × 100, and the total number of grids was 144,000, ensuring a high-resolution model that captures the intricate geological features of the study area. After spatial combination, a complete three-dimensional stratigraphic structure model was built (Figure 3). Analysis of the resulting model revealed that the overall structural configuration of the area is relatively subdued, predominantly characterized by a topography that is higher in the east and lower in the west. Some regions exhibit depressions, yet there are no extensive fault zones. Within the study area’s target layer, the Chang 7 member is devoid of faults, and the occurrence of fractures is exceedingly rare. The strata are gently inclined, demonstrating a strong inheritability among the various sublayers.

5.2. Analysis of Variation Function

The variation function serves as a metric for quantifying the variability of regional variables within three-dimensional space. It captures the extent to which variables fluctuate with changes in distance, thereby delineating the spatial correlation among variables. This method is instrumental in precisely articulating the spatial variation patterns and attributes of geological parameters. There are three main types: spherical models, exponential models, and Gaussian models, which are generally used to describe geological parameters. In the assessment of the variation function, it is imperative to identify the predominant direction based on the sedimentary environment’s characteristics, the orientation of material sources, and the distribution of sedimentary sand bodies. Once the primary direction is established, the search radius and step size must be adjusted to align the variation function curve with the experimental regression curve, ensuring their fundamental consistency or convergence. The secondary direction, orthogonal to the primary one, is ascertained subsequent to the analysis of the main direction’s variation function. The scope of variation for the secondary direction is set by replicating the aforementioned analytical process for the primary direction. The two rock facies types, mudstone and sandstone, are assigned values of 0 and 1, respectively, thus converting continuous parameters into discrete parameters (Table 1). Then, the attribute variation function under phase control is fitted hierarchically, and the characteristic parameters of the variation function (direction, variation range, nugget value, and base value) are adjusted until the actual variation function essentially conforms to the theoretical variation function. Subsequently, a three-dimensional spatial model for each rock facies in the southern Heshui area is formulated using the sequential Gaussian simulation method, complemented by the fitting of the variation function.

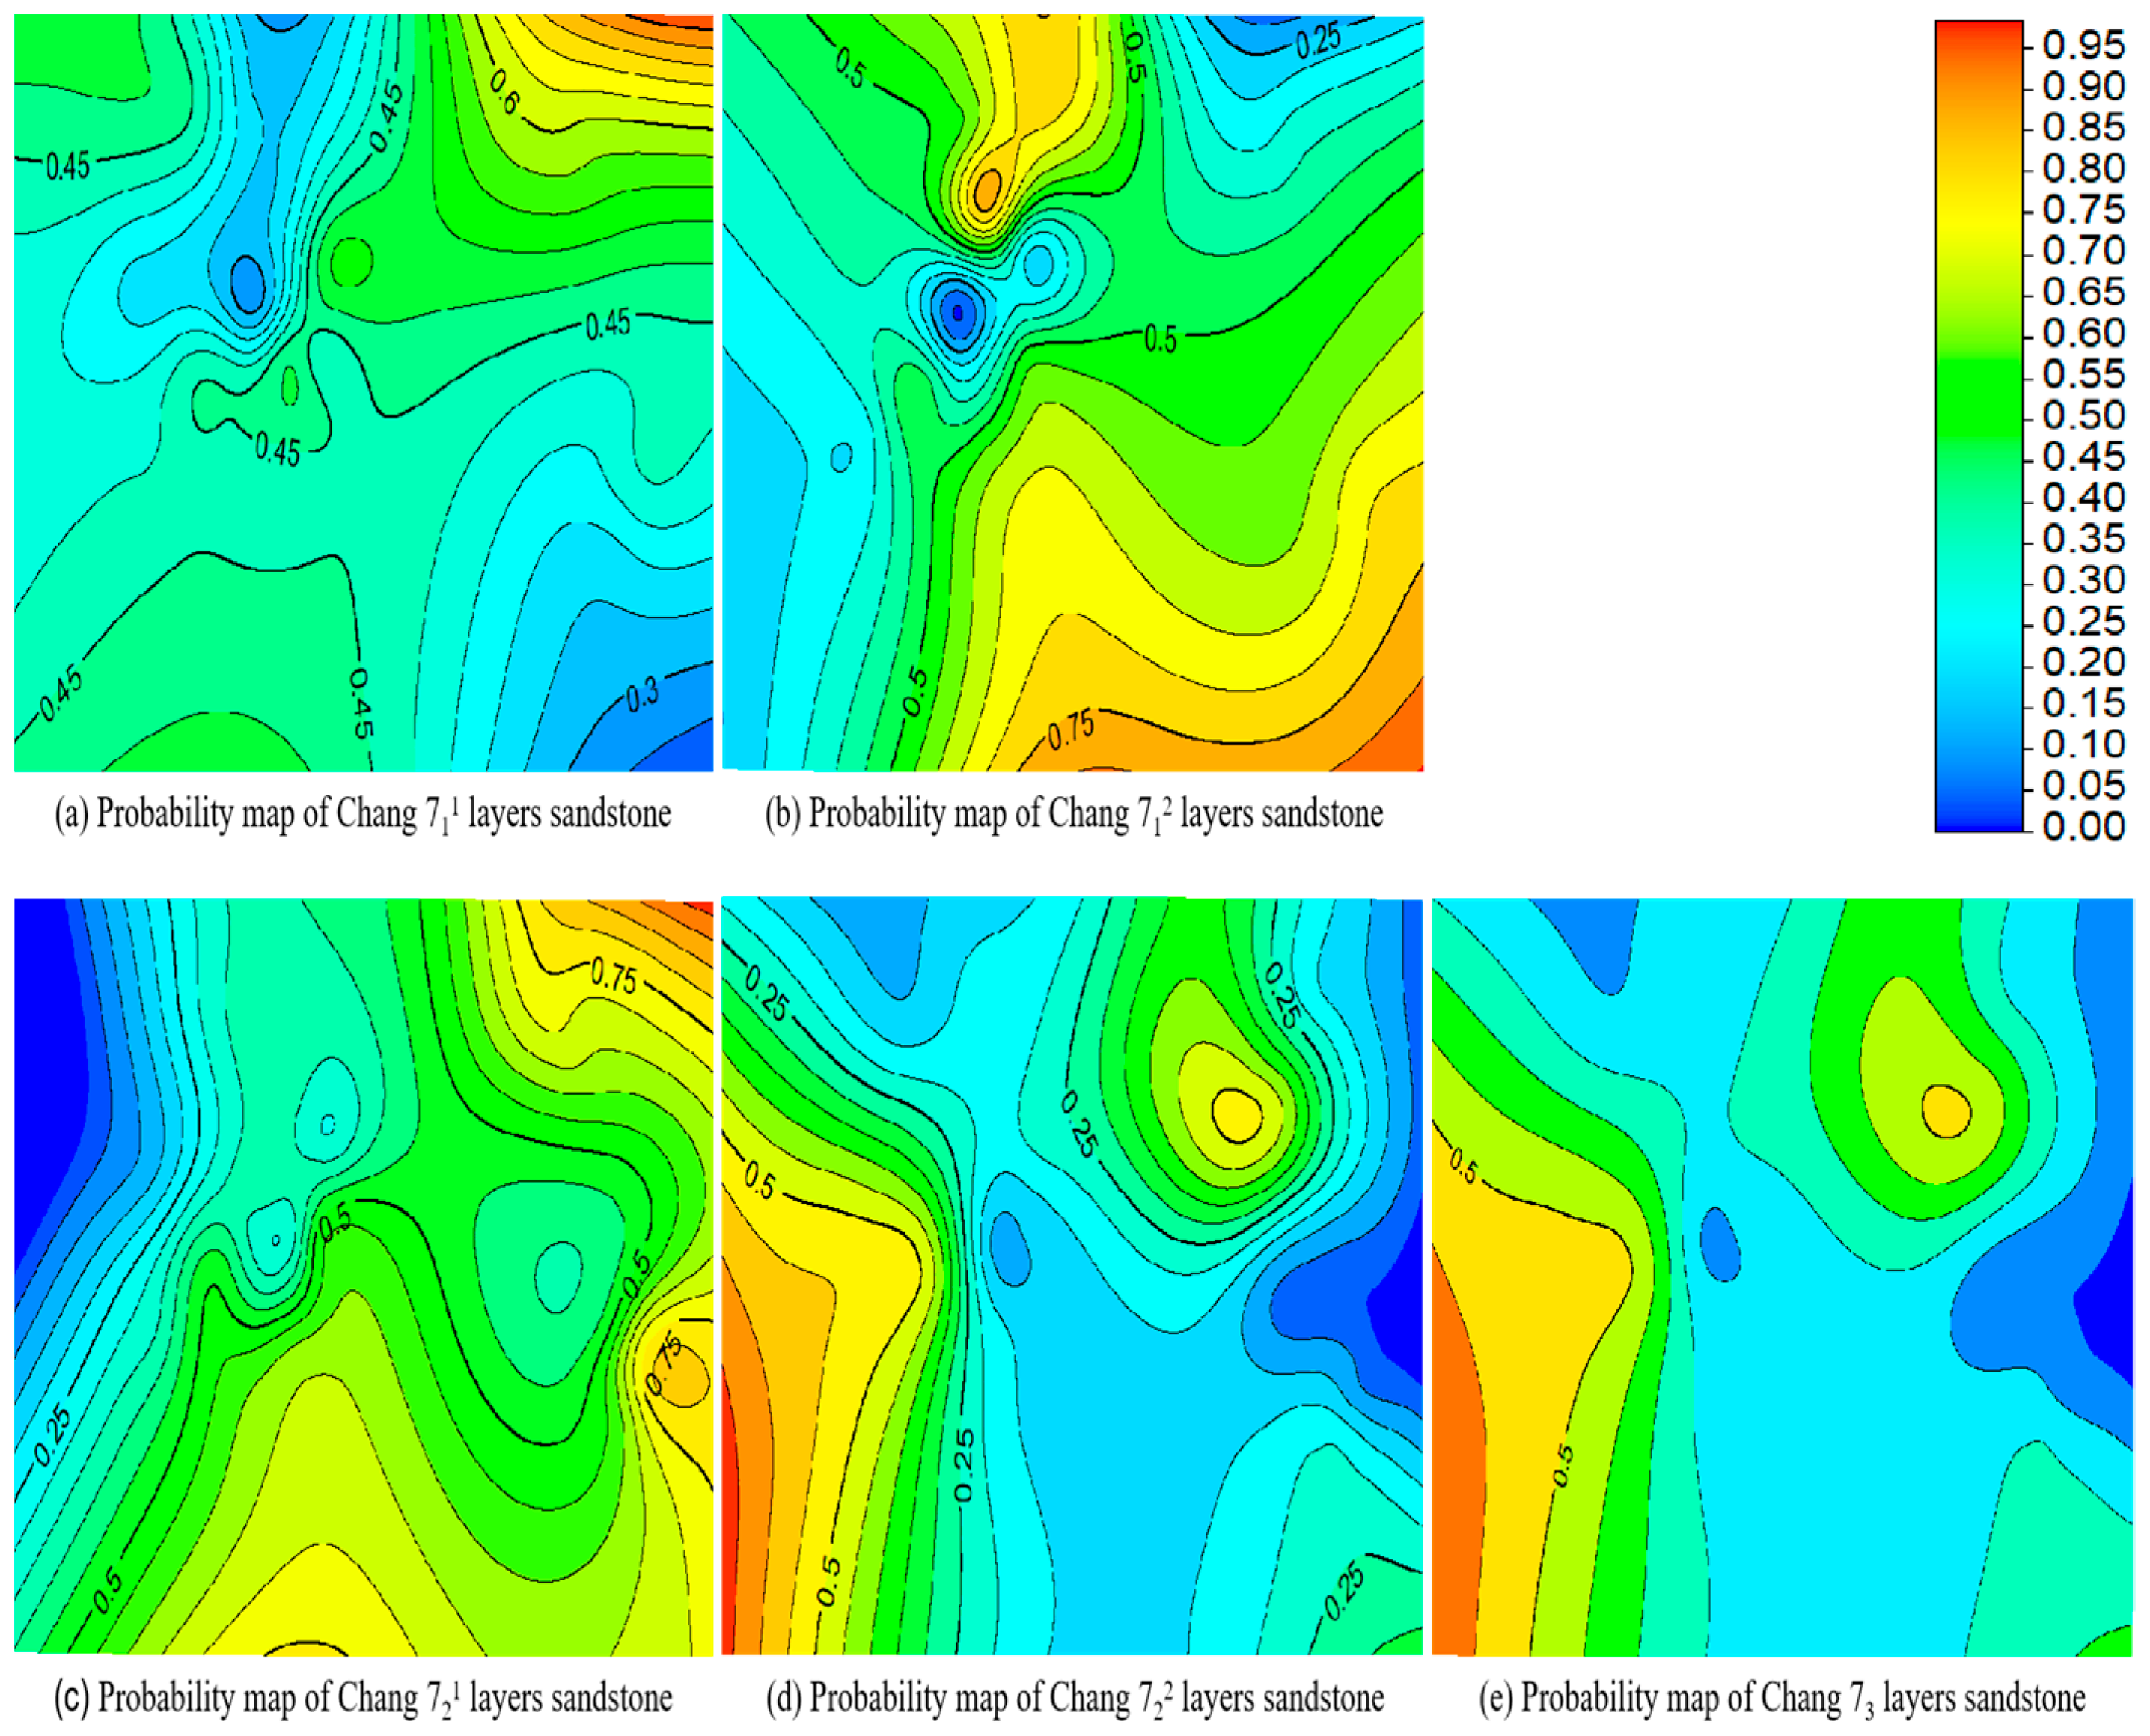
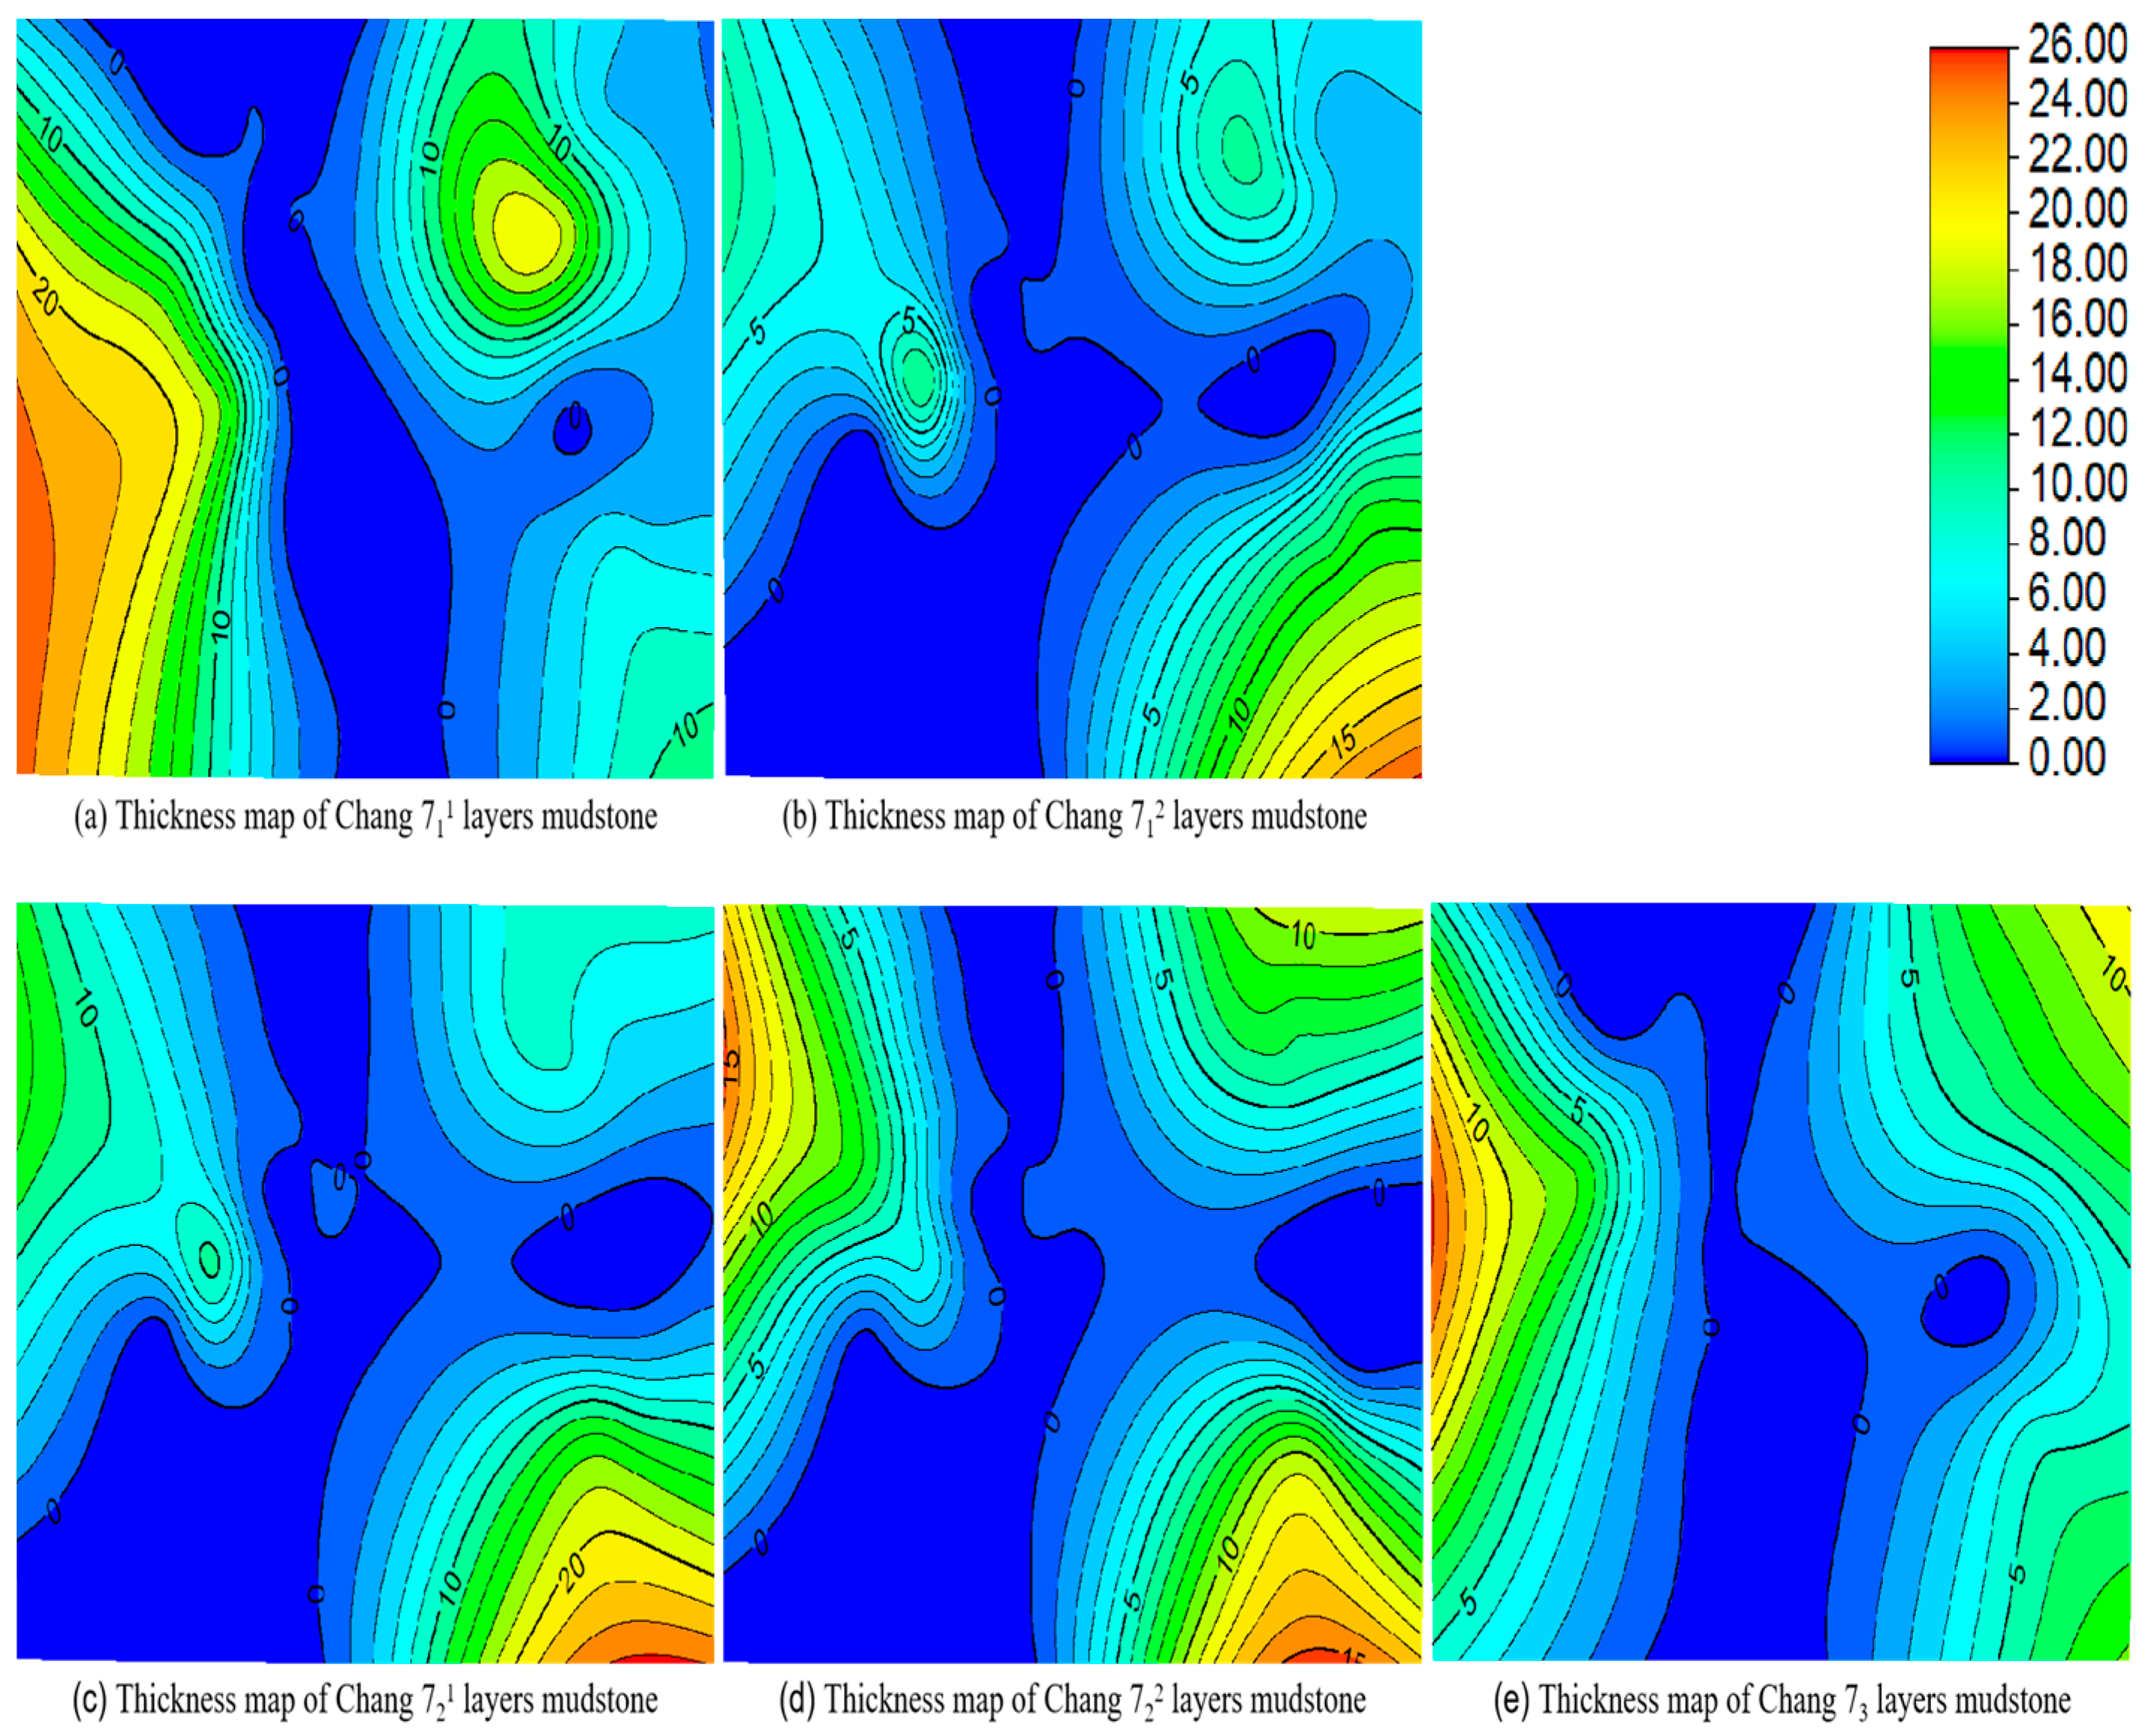
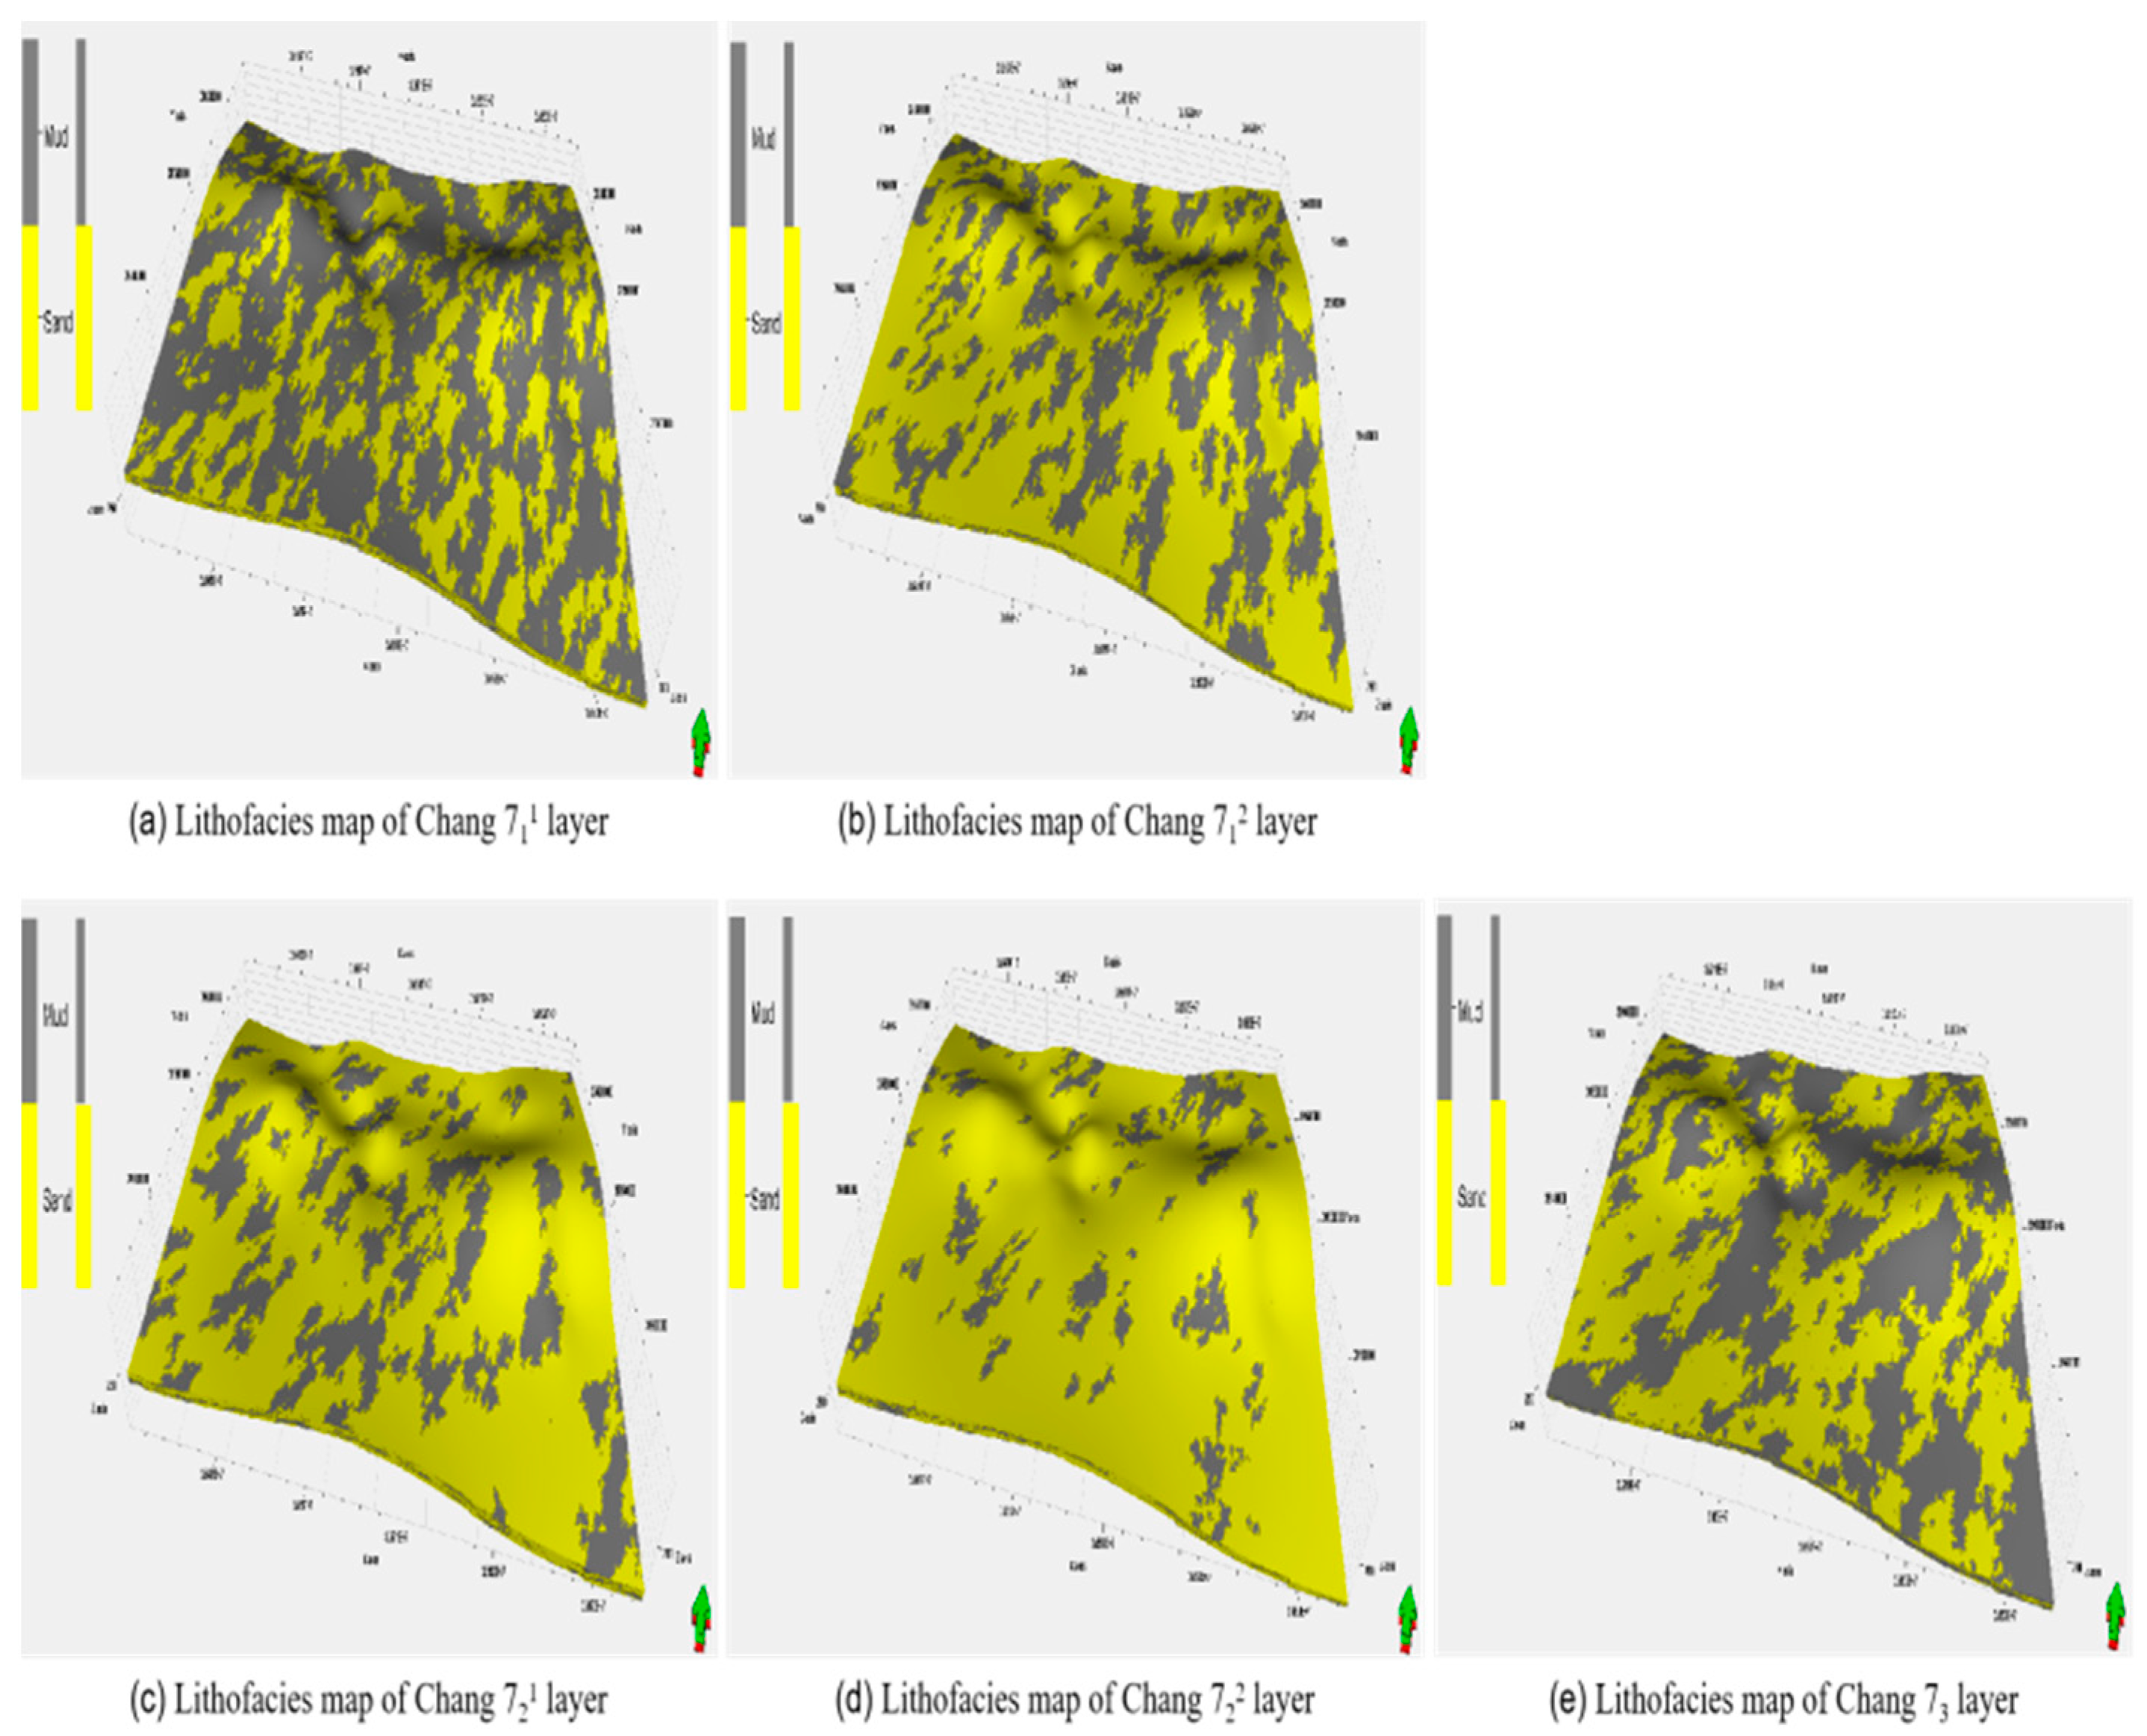
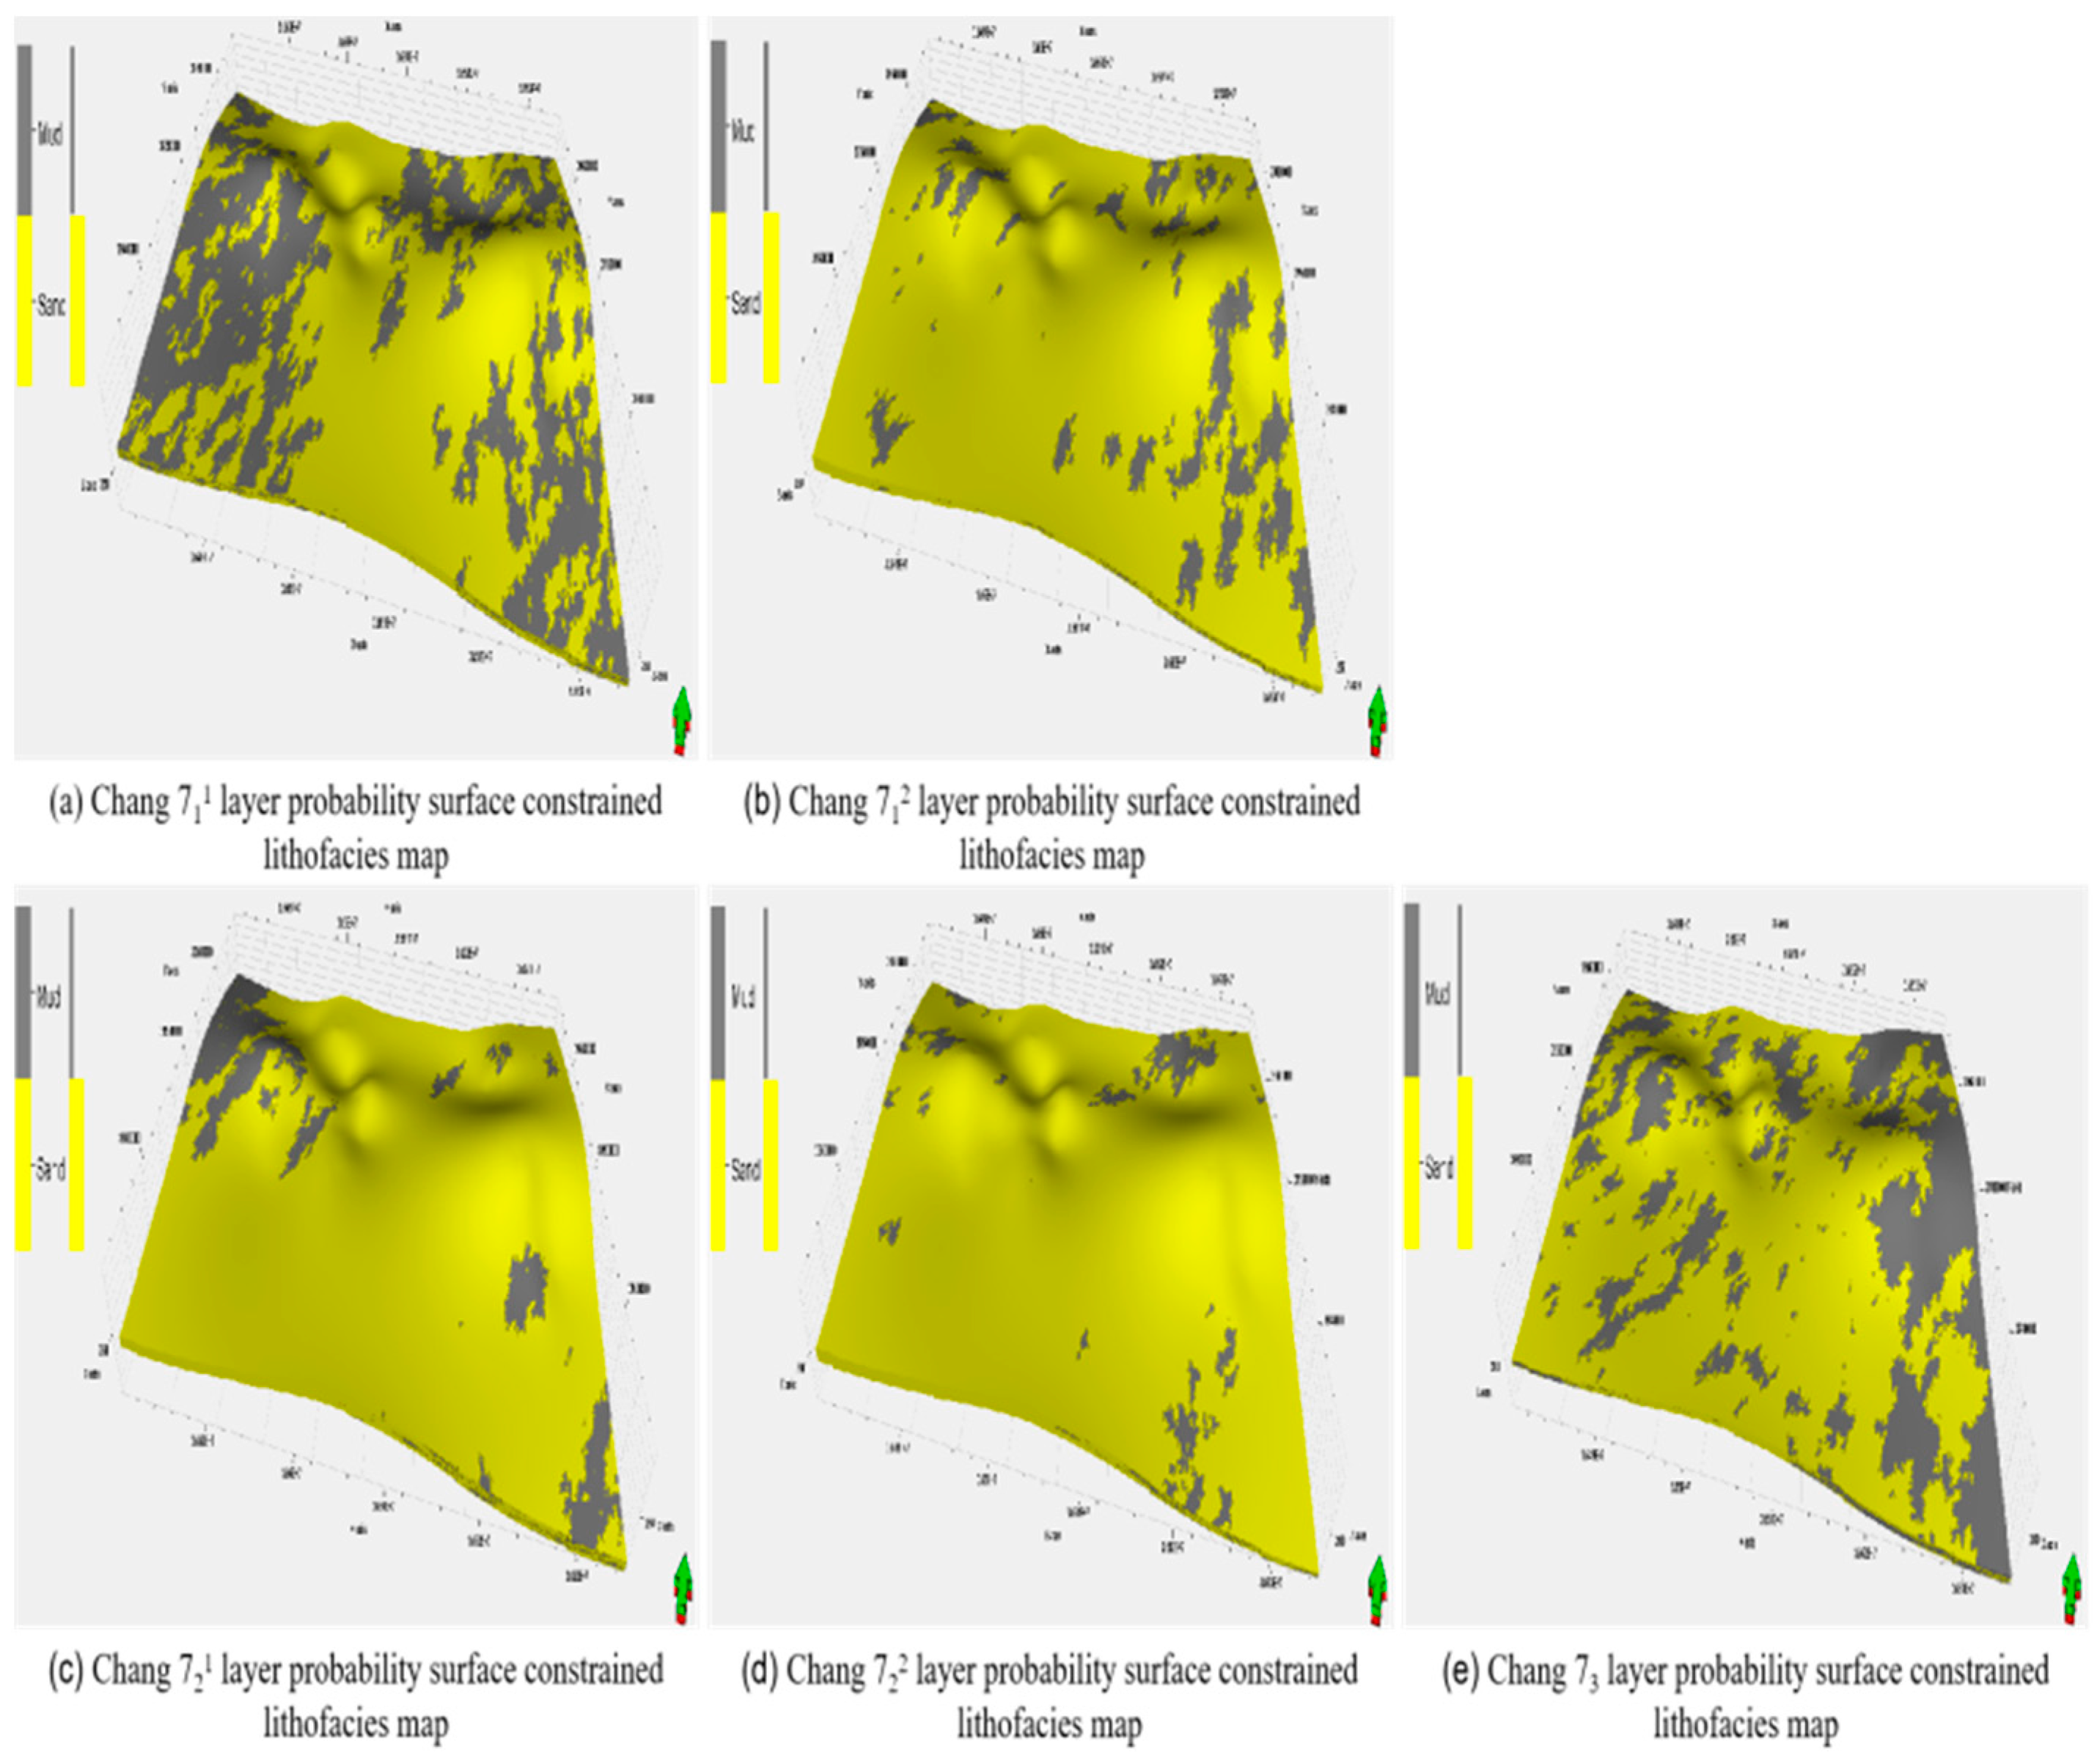
5.2.1. Geological Probability Surface-Constrained Lithofacies Model

The geological probability surface is a sophisticated tool developed based on single-well logging interpretation results, which serve as empirical data. It is guided by the reservoir development model and constrained by various parameters, including reservoir configuration, formation thickness percentage maps, and vertical reservoir probability distributions. This surface is instrumental in establishing a geological lithofacies probability surface that aids in reservoir development. It is created by juxtaposing the thicknesses of sandstone and mudstone with the overall formation thickness.
A probability surface is a three-dimensional parameter surface composed of probability values (0~1) that directly assigns a value to each grid in the form of a probability. This approach differs from traditional boundary constraints and two-dimensional trend surface constraints, as it extends across the entire spatial distribution of the model. It circumvents the in-layer homogenization that can arise from human bias, thereby preserving detailed constraints both vertically and within boundaries. This method effectively captures the inherent variability of reservoir parameters.
In the lithofacies modeling of the target layer in the research area, the calculated percentages of the thickness maps of layers 711, 712, 721, 722, and 73 (Figure 4) were projected onto a plane, and then the sandstone thickness map (Figure 5) was compared with the formation thickness map to obtain the sandstone probability map (Figure 6). Meanwhile, by comparing the mudstone thickness map (Figure 7) with the stratigraphic thickness map, a mudstone probability map (Figure 8) was obtained and used as a condition for controlling and constraining lithology modeling. The constraint conditions for vertical application were the thickness distribution curve interpreted by the sedimentary facies of a single well and the vertical proportion curve of a single well. The projected lithofacies thickness percentage was used on the plane. Finally, the random modeling sequential indication method was used to carry out random simulations. Two lithologies (mudstone and sandstone) are listed in the research area. Thus, the three-dimensional lithofacies model of each small layer of the Chang 7 member in the study area (Figure 9) and the three-dimensional lithofacies model of each small layer after the probability surface constraints (Figure 10) were obtained. The method of geological probability surface constraint, combining individual well data, sand and mudstone thickness, and reservoir plane thickness, and combining certainty and randomness to accurately construct the reservoir matrix lithofacies model, further improved the accuracy of the model.
Utilizing logging data and prior geological insights to collate trends is a pivotal strategy for modelers to assimilate geological knowledge. However, the complexity and variability of subsurface geological phenomena present significant challenges. Conventional methods, such as variation function fitting and sequential indication of lithology data, often result in a channel sand body that exhibits poor regularity in the physical property changes at its center and edges (as shown in Figure 9). This simulation outcome suggests that the constraint of a single-phase zone boundary is insufficient to capture the distribution characteristics of the physical properties of channel sediments and may not fully represent the objective rationality of the reservoir.
The employment of the geological probability surface constraint method offers an enhanced approach. It allows for a more vivid demonstration of the regularity in physical property changes at the center and edges of the sand body (Figure 10). This method more directly reflects the distribution characteristics of channel sediments. The incorporation of additional constraint conditions not only improves the accuracy of the geological model but also mitigates the uncertainty and randomness inherent in inter-well interpolation to a substantial extent.
It can be seen from the lithofacies model established that, during the Chang 7 sedimentary period, the sand body was distributed in a belt from north to south, the provenance direction developed in the southwest direction and gradually diverged to the northeast direction, and large amounts of dark mudstone and sandstone were developed. The continuity is relatively good in the direction along the provenance, but it is not satisfactory in the direction perpendicular to the provenance, which is mainly caused by the mudstone obstruction formed in the depressions between divergences.
From a planar perspective, the Chang 7 sand body covers a large area, exhibiting large-scale continuous distribution on the southern and northeast sides of the study area. This indicates that the lateral contact relationship of the sand body predominantly takes the form of lateral tangential substitution. In the vertical dimension, the presence of large box-shaped sand bodies in the five sublayers is indicative of the overlapping accumulation of multi-stage channel sand bodies. The intercalated mudstone layers are modestly developed, with somewhat poor continuity in the longitudinal direction. These observations are fundamentally consistent with the sedimentary microfacies discussed earlier, substantiating the success of the lithofacies modeling in accurately representing the geological conditions of the study area.

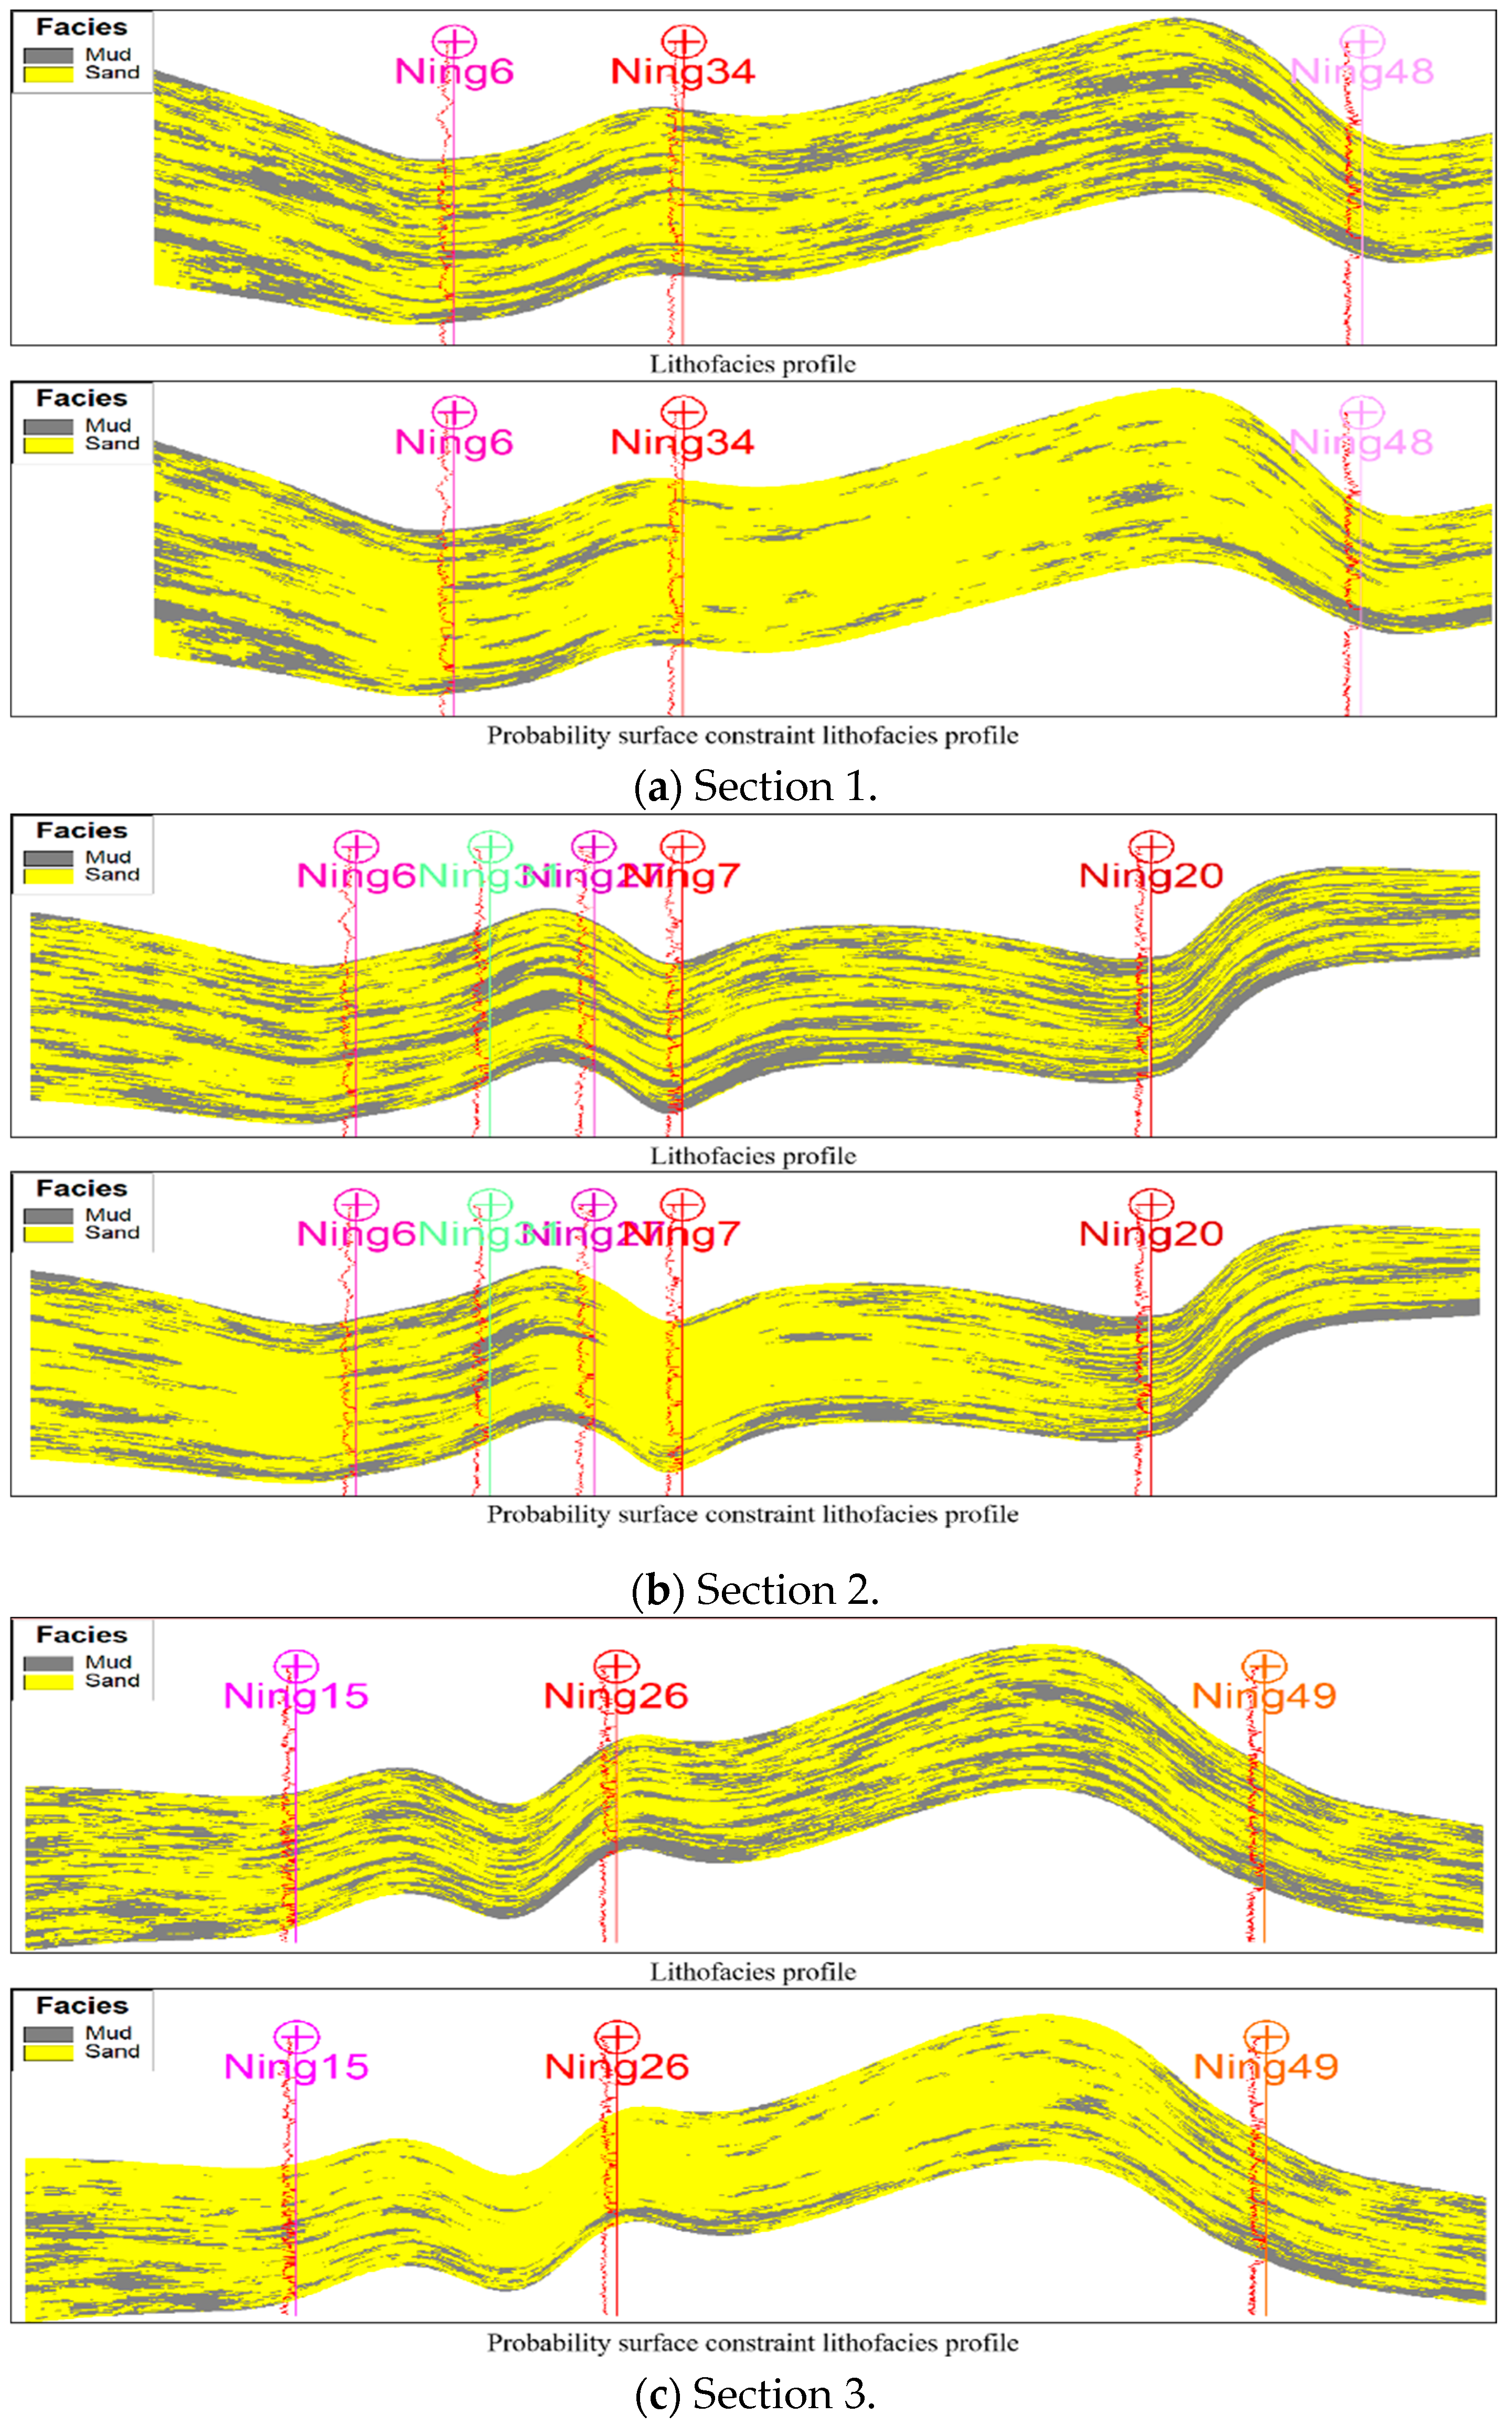
5.2.2. Correlation of Lithofacies Profile

The fidelity of modeling results is assessed not only by their alignment with the modeling log data but also by their accordance with established geological comprehension. The simulation’s efficacy in replicating sedimentary characteristics is gauged by the consistency between the lithofacies of a single well and the surrounding modeling outcomes. As depicted in Figure 11a, the lithofacies section of each minor layer, after the probability plane constraint, exhibits a notably higher proportion of sandstone relative to mudstone. This indicates superior continuity of the sand body, manifesting in extensive, continuous distributions. The gamma ray (GR) curve of the Ning 6 well demonstrates an upward-thinning sequence, with values increasing from low to high, characteristic of a positive rhythm indicative of lake basin sedimentation. A thinner, less continuous mudstone caps this sequence. As can be seen in Figure 11b, sandstone and mudstone alternately develop in the lithofacies profiles of each small layer after the probability plane constraint, and the continuity is better than that of the lithofacies profiles without constraint. The sandstones on the west and east sides of the Ning 7 well have good continuity, and mudstone rarely appears. The GR curve in the lower part of the Ning 7 well has a positive rhythm from low to high values from bottom to top, while the GR curve in the upper part has a negative rhythm from high to low values from bottom to top, indicating upward coarsening. The poor continuity line of the Ning 20 well sand body is caused by the obstruction caused by more mudstone. As shown in Figure 11c, the probability-plane-constrained sections have a greater prevalence of sandstone over mudstone, with enhanced continuity and an absence of abrupt changes. The Ning 26 well, centrally located within the lithofacies section, displays a gradation from coarse to fine lithology, with a thin underlying mudstone. The GR curve of this well traces a positive rhythm, with values escalating from bottom to top.
The application of geological probability surface constraints more vividly elucidates the continuity and physical property variations at the center and edges of the sand bodies. It offers a more direct representation of the distribution characteristics of channel sediments and enhances the precision of the geological model. This methodological advancement ensures that the model more closely mirrors the actual geological conditions, providing a robust framework for subsequent analysis and interpretation.

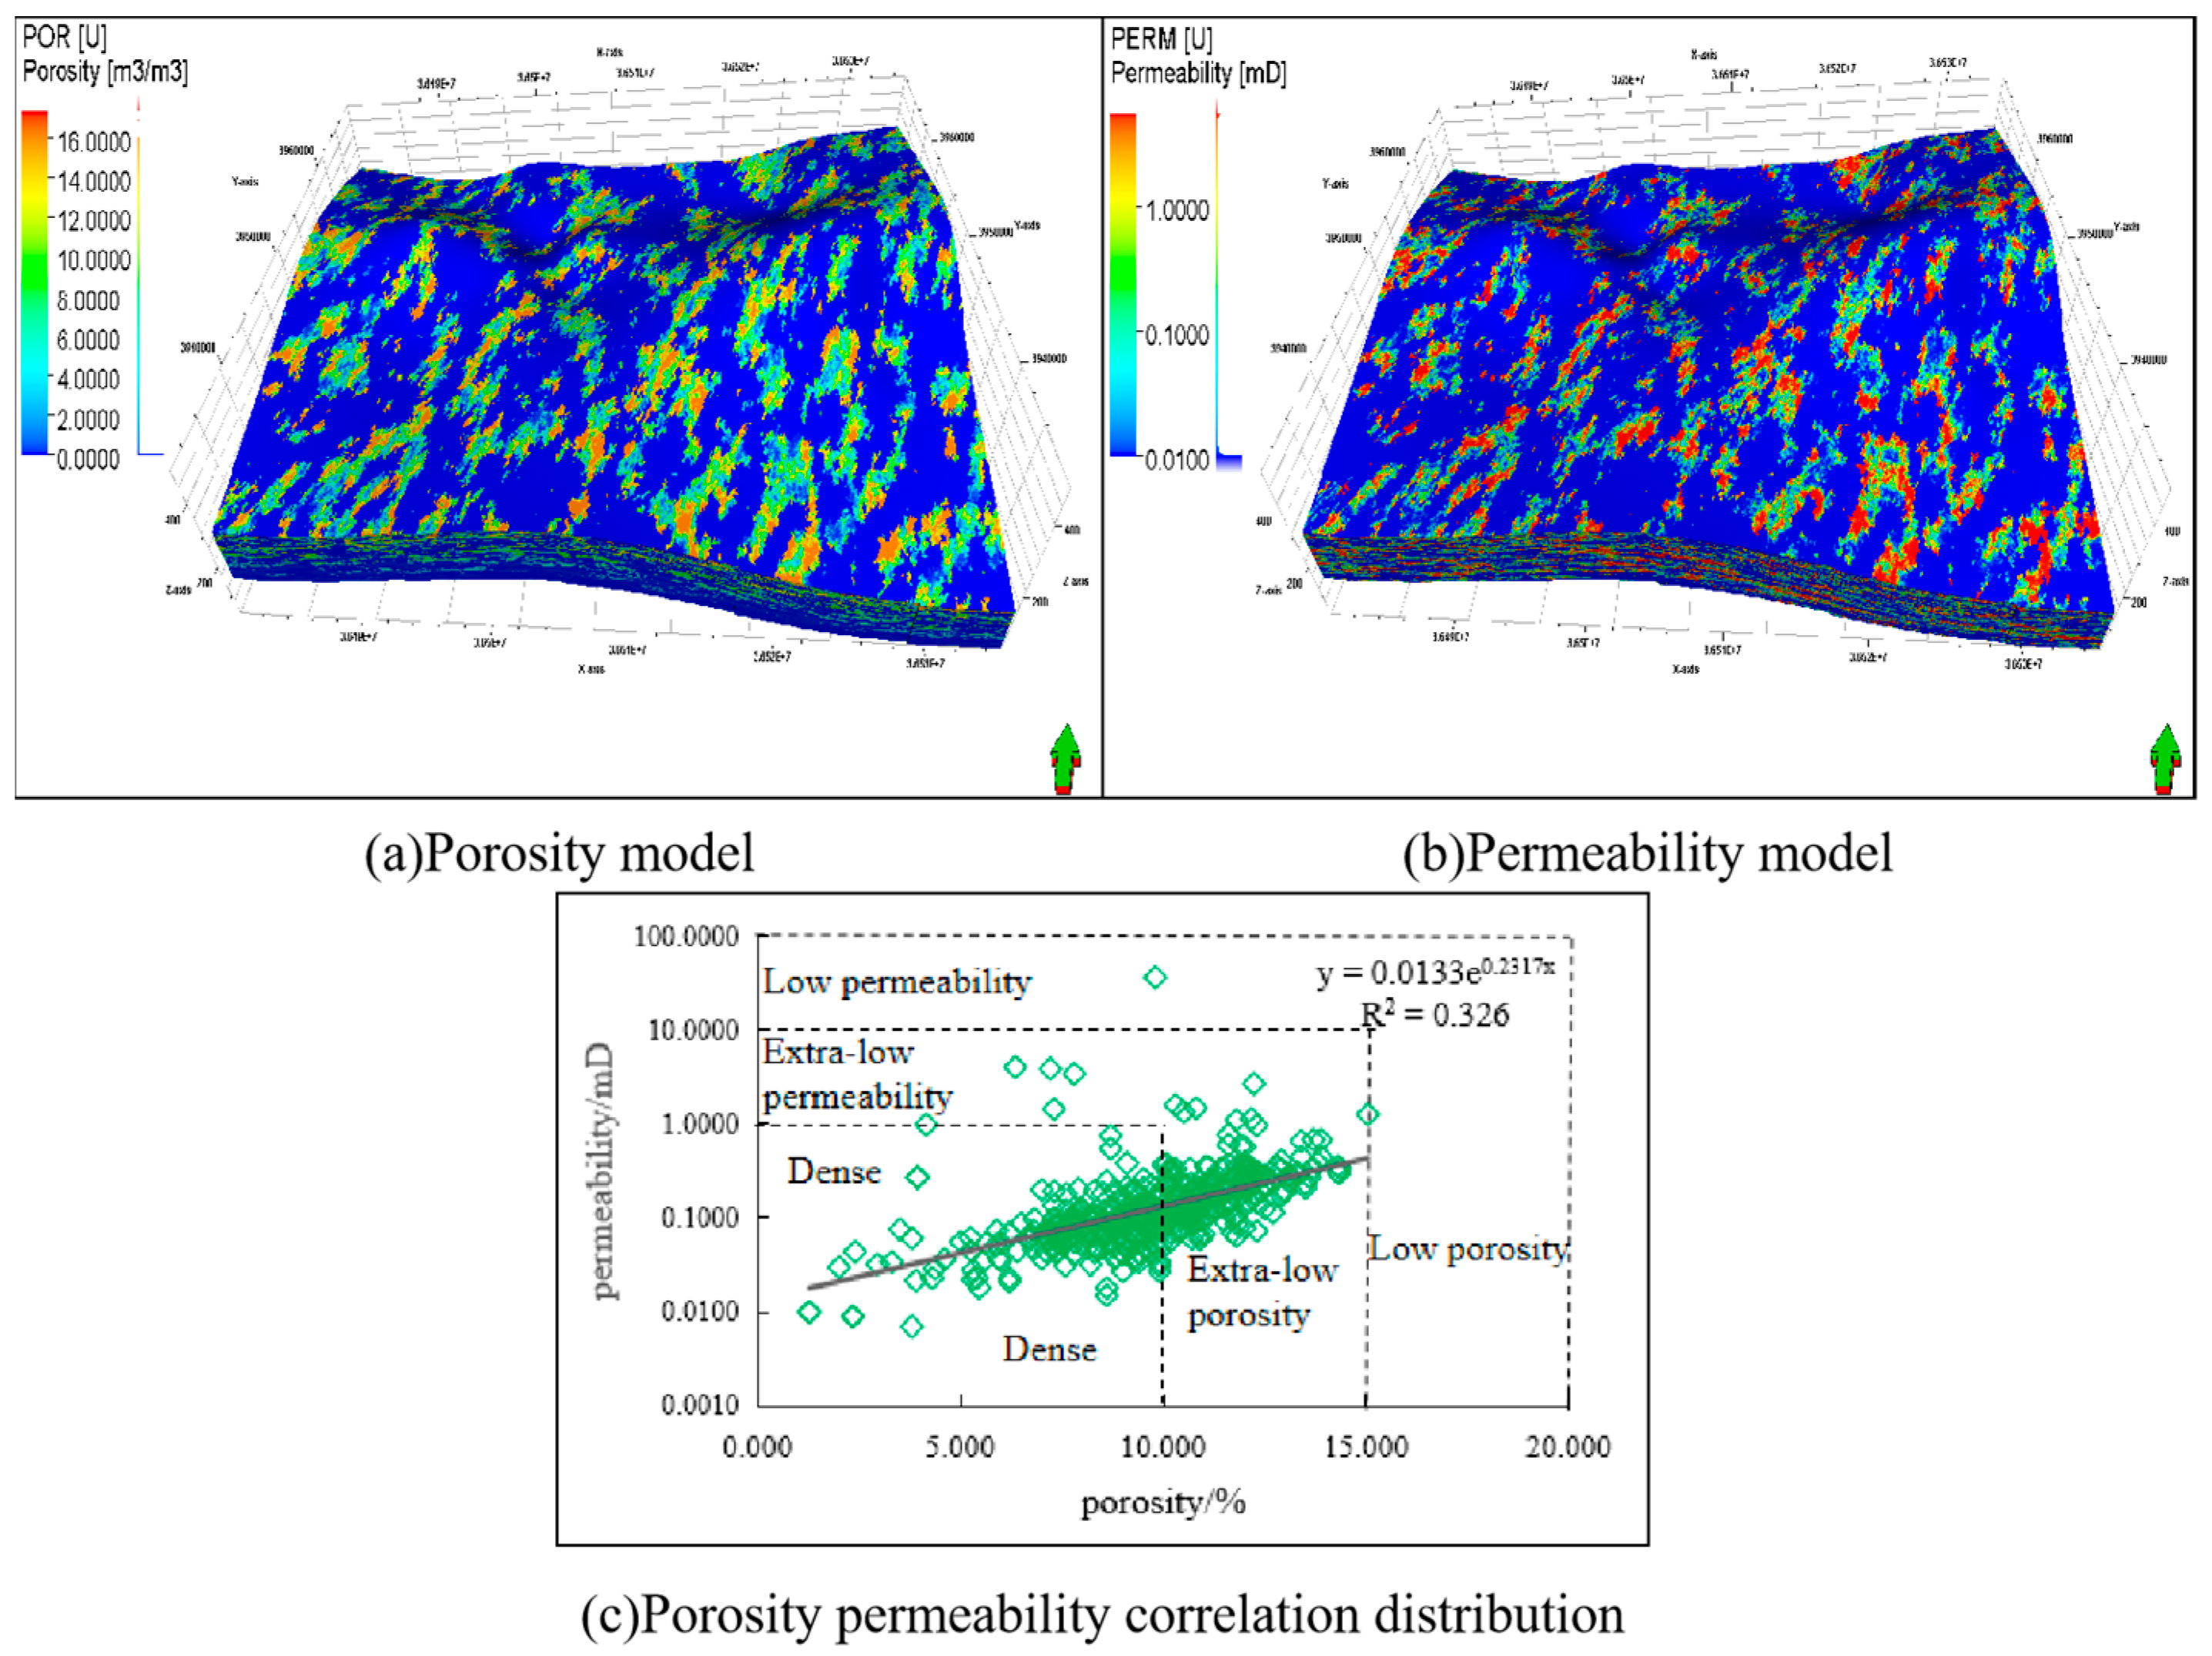
5.3. Reservoir Parameter Model

The culmination of geological reservoir modeling is the creation of a physical property parameter model that encapsulates the characteristics of the reservoir, including but not limited to porosity, permeability, and saturation. The spatial distribution of lithofacies within the reservoir is a pivotal attribute, fundamentally influencing the distribution and flow dynamics of fluids within the reservoir. Building upon the previously established lithofacies model, stochastic modeling is executed utilizing phase-controlled attribute parameters.
The stochastic simulation of the lake basin structure in the southern Heshui region predominantly employs the sequential Gaussian stochastic simulation method [46]. This method, grounded in Gaussian probability theory and sequential simulation algorithms, generates the spatial distribution of continuous variables. The simulation proceeds pixel by pixel, constructing a local cumulative conditional probability function (ccdf) by taking the simulated data into account. Such simulation data generation not only includes the original conditional data but also takes into account the existing simulation data. This method is widely used in practice, and the input parameters mainly include statistical parameters of variables (mean value, standard deviation), variable function parameters (bullion effect, variable range, etc.), and conditional data.
Firstly, experimental fitting of the variation function is conducted using data from single-well analyses, which is then followed by random simulation of the reservoir’s physical property parameters. The 3D spatial model of the reservoir’s physical properties in the study area is finally established by using permeability-phase-controlled Gaussian stochastic simulation, sequential Gaussian stochastic simulation, and porosity collaborative stochastic simulation. Sequential Gaussian simulation is a kind of algorithm for continuous variables, which is mature and widely used. The simulation results can reflect the continuous changes in physical parameters in the reservoir and are consistent with the sedimentary microfacies model. By adjusting the filtering parameters, the difference functions of each material property at various levels and phases, along with the results of Gaussian transformation, are recorded. The reservoir in the study area is characterized by typically low porosity and permeability. Based on the well-point discretization data as the basic constraint conditions, and the lithofacies model constrained by the probability plane as the trend constraint control, the sequential Gaussian simulation method is used to build a 3D geological reservoir attribute model (Figure 12). Comparative results demonstrate that the lithofacies phase-controlled constraint modeling method significantly enhances the modeling accuracy.
According to the statistical analysis of reservoir attributes, the porosity of sandstone shale oil reservoirs in the Chang 7 member ranges from 1.27% to 15.04%, with an average of 8.47%. The normal distribution features are obvious, and the majority of ultra-low pores account for more than 88%. The permeability was mainly distributed in the range of 0.001–1 mD, with an average of 0.74 mD, and the correlation between porosity and permeability in the same layer was good. Among them, the porosity of the Chang 7 member was 70% below 8 m3, and the porosity of 6~12 m3 was 30%. It can be considered that the Chang 711, Chang 712, Chang 721, Chang 722, and Chang 73 shale reservoirs in the study area are extremely low-porosity reservoirs. According to the observation of the numerical porosity model (Figure 12a), the porosity is mainly distributed from northeast to southwest along the extension direction of the sandstone in the lithofacies model. The high-value parts correspond to areas with thicker sand bodies, and they are concentrated in the south–central and west–central parts of the study area, but the distribution area is small and relatively dispersed. According to the data distribution of the permeability model (Figure 12b), 30% are smaller than 0.1 mD, and 70% are larger than 0.1 mD. According to this, the shale reservoirs of Chang 711, 712, Chang 721, Chang 722, and Chang 73 sands in the study area belong to extremely low-permeability reservoirs. The permeability model reflects that, under the cooperative constraints of the porosity model, the two attribute models have a good correlation (Figure 12c). Both models are in concordance with the sandstone distribution in the distributary channel of the petrographic model, thereby reflecting the phase-controlled characteristics of the reservoir’s physical properties.
In conjunction with the structural and sedimentary environmental attributes of the Chang 7 member of the Yanchang Formation in the southern Heshui area, the single-well lithofacies interpretation data derived from logging were discretized and coarsened into longitudinal lithofacies data. Following this transformation, the parameters of the variation function were calculated. The geological probability surface was delineated by comparing the thickness map of the sand and mud bodies with the stratum thickness map of the target layer, employing this comparison as the constraint condition. According to sequential indication and sequential Gaussian stochastic simulation, a reservoir attribute model based on the lithofacies model and phase-controlled constraints was established, providing a stable and reliable static model. The resulting 3D geological model of the reservoir provides a more precise depiction of the spatial distribution characteristics of each lithofacies. This enhanced precision enables the utilization of sophisticated data analysis and simulation algorithms to uncover the macroscopic statistical patterns of various parameters. Consequently, lithofacies modeling transitions from an approach grounded in “mathematical reality” to one that is anchored in “geological reality”, taking into account a multitude of geological conditions. This transition significantly augments the precision of predictions made between wells. Furthermore, the model effectively diminishes the uncertainty and randomness associated with inter-well interpolation to a considerable extent.

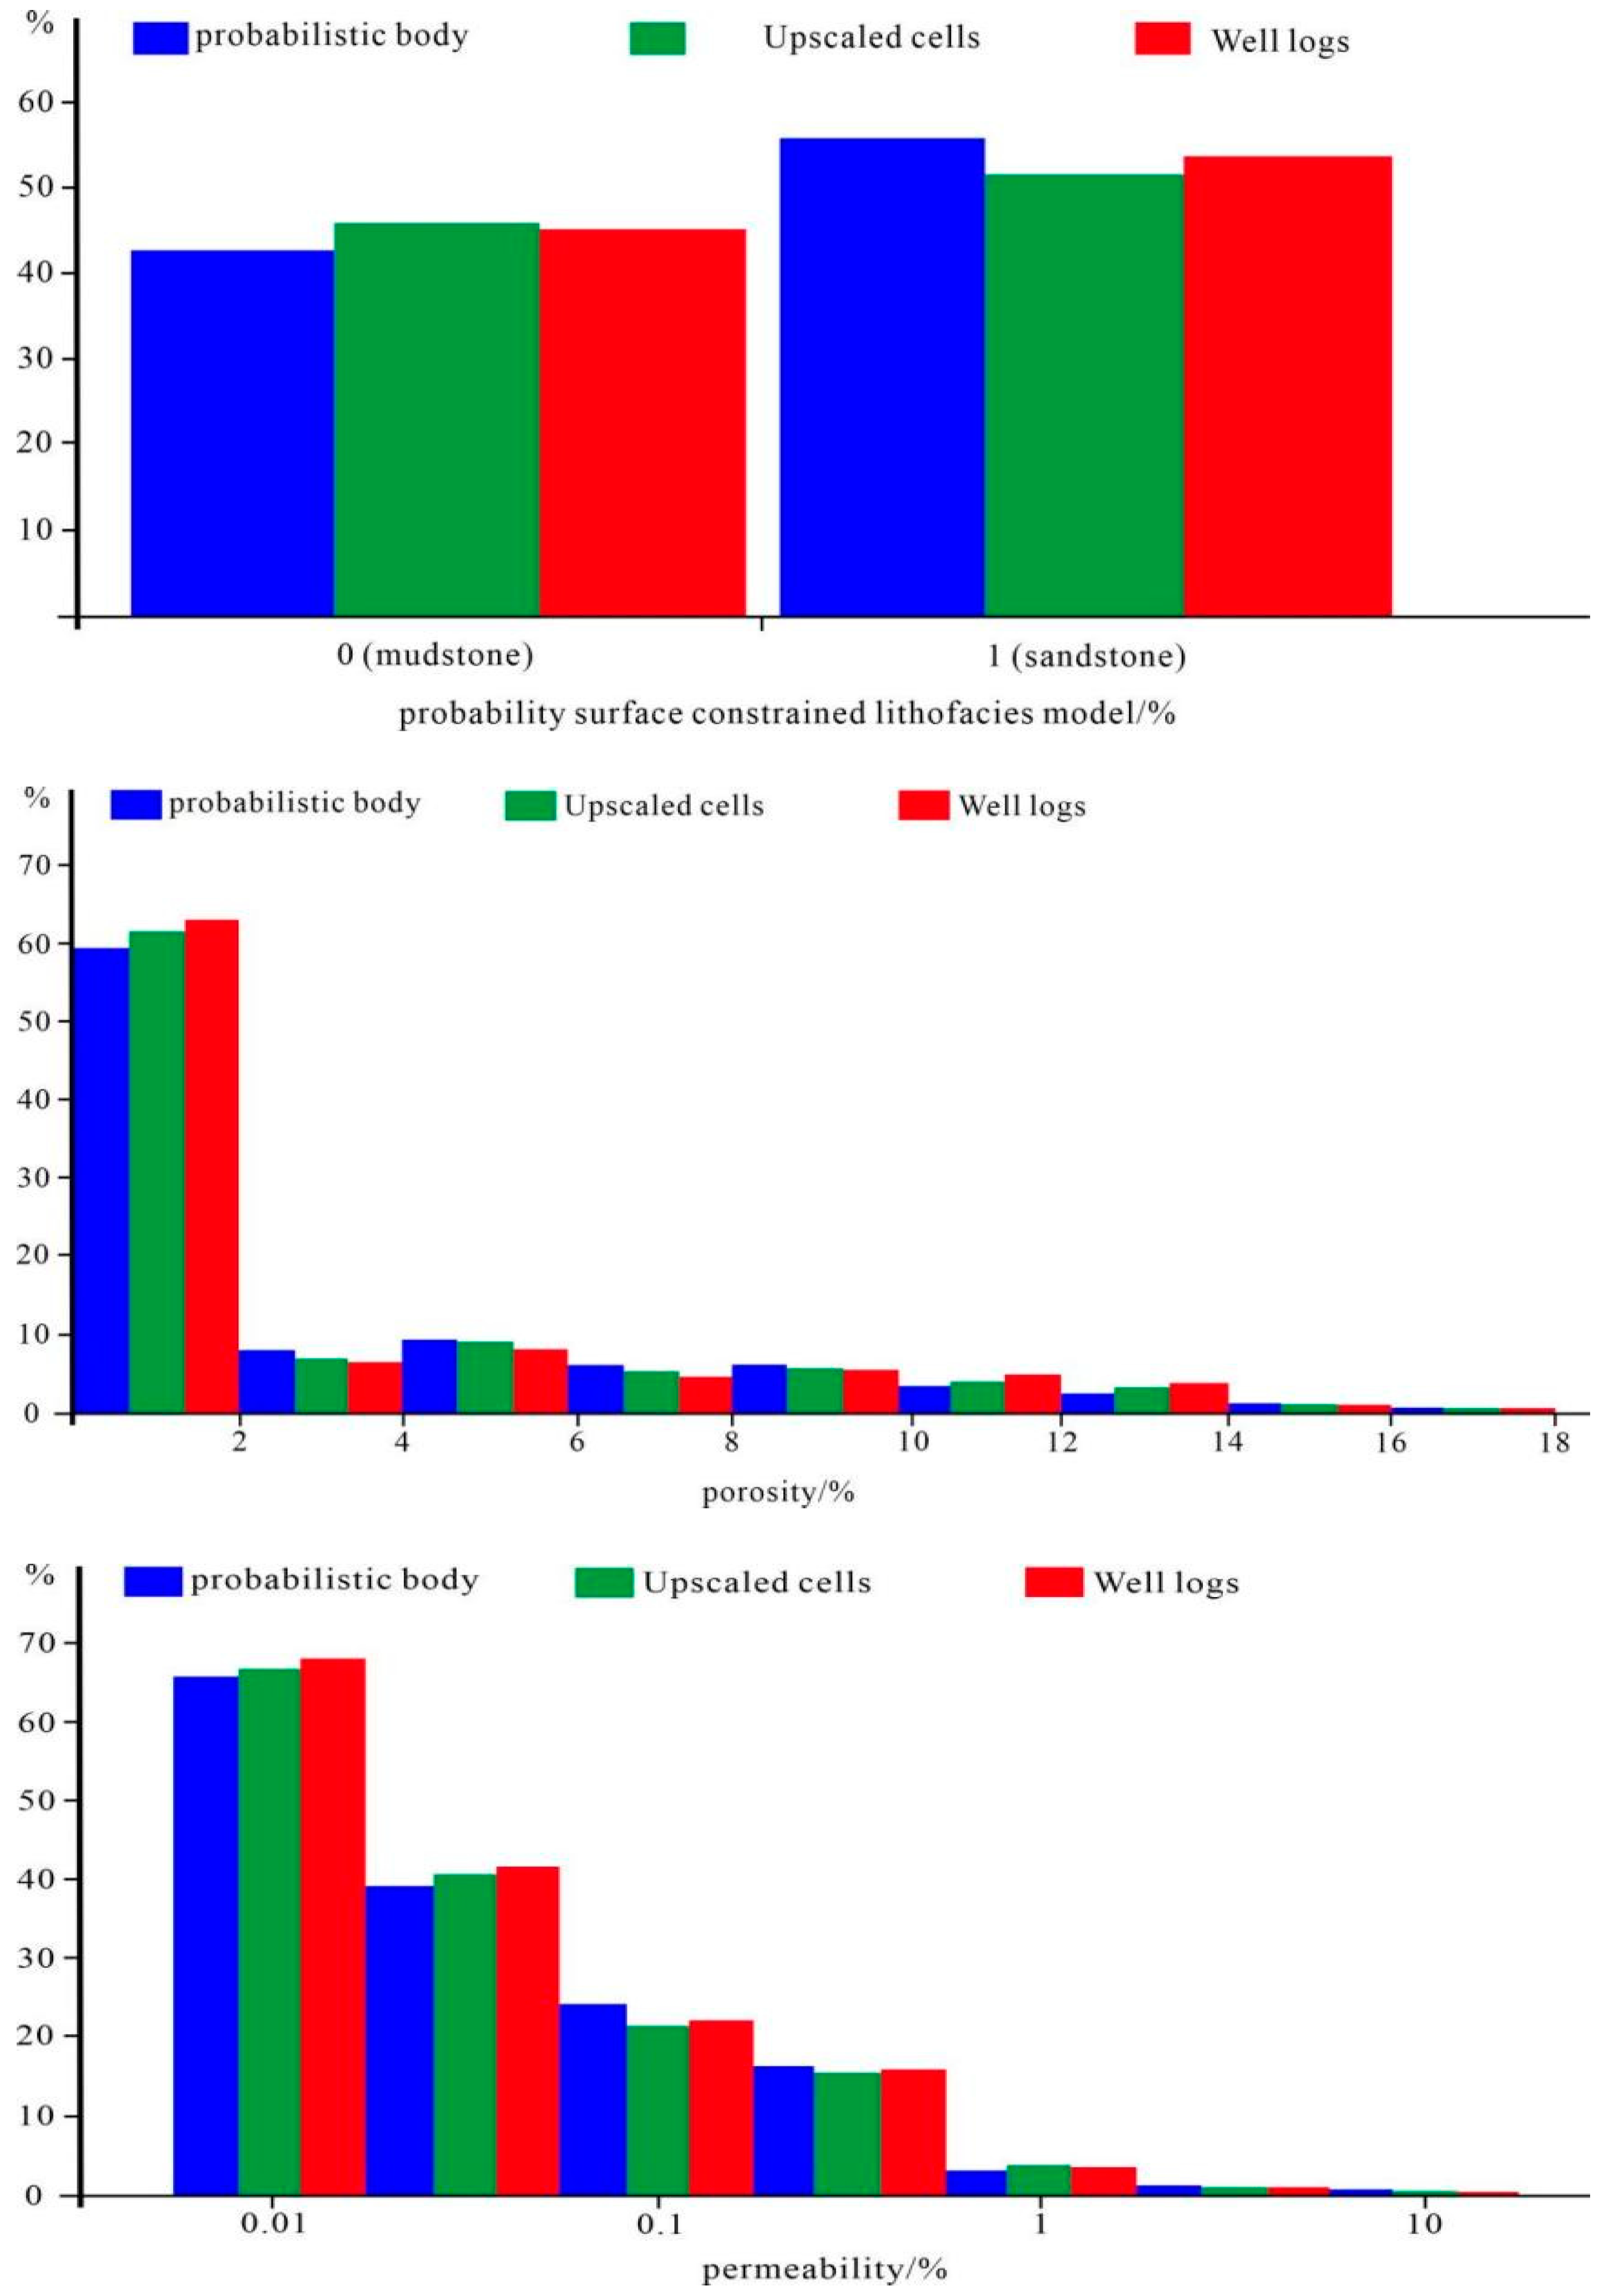
6. Model Verification

In the preceding sections of this paper, we utilized well location data, detailed stratigraphic division, and log interpretation data to construct the geological model. This model was further constrained by trend surfaces and geological probability surfaces, allowing for the seamless integration of geological knowledge. Such an approach maximized the enhancement of the model’s accuracy. However, to ascertain the model’s suitability as the foundational data for numerical simulation analysis, further validation is imperative. The consistency of probability distribution was adopted for verification. By comparing the original and simulated values of porosity and permeability in the petrographic model and attribute model, as well as the results of the distribution histogram of the log data (Figure 13), the simulated data and the original data were essentially consistent in their distribution trend. These findings collectively suggest that the 3D geological model of the Chang 7 member’s shale oil group in the southern Heshui block is of high precision and capable of more accurately mirroring the actual geological conditions. The verification process, therefore, substantiates that the model can furnish reliable data, which is essential for subsequent numerical simulation analyses. This validation is a critical step in ensuring the model’s predictive capabilities and its applicability in the field of reservoir geology, underpinning the model’s utility for informed decision-making in exploration and development strategies.

7. Conclusions

Utilizing reservoir geological modeling technology, this study constructed a physical parameter model that captures the intrinsic characteristics of the reservoir. The adoption of PetrelTM 3D geological modeling software(version 2018) was instrumental in enhancing the model’s precision. The employment of sedimentary facies control techniques, alongside sequential indicator simulation and sequential Gaussian simulation, enabled a more accurate depiction of the lithofacies and properties. The geological probability surface constraint method was used to better show the regularity of physical property changes in the center and edge of the sand body, and to more directly reflect the distribution characteristics of channel sediments. The increase in constraint conditions further improved the accuracy of the model and reduced the uncertainty and randomness of inter-well interpolation to a certain extent. Especially when the reaction of the reservoir’s physical properties is changed, the advantages of phase-controlled modeling are reflected, and it can better meet the needs of the next stage of oilfield development.
The lithofacies model reveals that the continuity of sand bodies within the Chang 7 member is more pronounced in the direction of provenance than perpendicular to it. Influenced by the microfacies control of the distributary channels, these sand bodies exhibit extensive, continuous distributions in the mid-northwest and southwest regions. In the vertical plane, the presence of large box-shaped sand bodies, formed by the stacked accumulation of multi-stage distributary channel sands, is notable. However, the intercalated mudstone layers are modestly developed, exhibiting slightly poorer continuity in the longitudinal direction.
The attribute model shows that the Chang 7 member reservoir is a typical type of extremely low porosity and permeability. The porosity of the Chang 7 sandstone shale oil reservoir ranges from 1.27% to 15.04%, with an average of 8.47%. The normal distribution is obvious, and the majority of ultra-low pores account for more than 88%. The permeability is mainly distributed in the range of 0.001–1 mD, with an average of 0.74 mD, and the correlation between porosity and permeability in the same layer is good. The porosity is primarily distributed from the southwest to the northeast, aligning with the extension direction of the sandstone in the lithofacies model. High-value areas of porosity are concentrated in the south and west of the central study area, although they are relatively small and dispersed. These high-value zones correspond well with regions of thicker sand bodies, indicating favorable zones for development within the study area.

Author Contributions

Conceptualization, L.W.; Methodology, L.W. and S.L.; Formal analysis, S.L.; Writing—original draft, L.W.; Writing—review & editing, L.W. All authors have read and agreed to the published version of the manuscript.

Funding

This research received no external funding.

Institutional Review Board Statement

Not applicable.

Informed Consent Statement

Not applicable.

Data Availability Statement

Embargo on data due to commercial restrictions.The data presented in this study are available on request from the corresponding author.

Conflicts of Interest

The authors declare no conflict of interest.

References

  1. Jin, Z.; Bai, Z.; Gao, B.; Li, M. Has China ushered in the shale oil and Gas revolution? Oil Gas Geol. 2019, 40, 451–458. [Google Scholar]
  2. Zou, C.; Zhu, R.; Bai, B.; Yang, Z.; Hou, L.; Zha, M.; Fu, J.; Shao, Y.; Liu, K. Connotation, characteristics, potential and challenges of tight oil and shale oil. Bull. Mineral. Petrol. Geochem. 2015, 34, 3–16. [Google Scholar]
  3. Jia, C.; Zheng, M.; Zhang, Y. Important theoretical Issues in unconventional oil and gas geology. Acta Pet. Sin. 2014, 35, 1–10. [Google Scholar]
  4. Jia, C. Breakthrough and significance of unconventional oil and gas to classical petroleum geological theory. Pet. Explor. Dev. 2017, 44, 1–11. [Google Scholar] [CrossRef]
  5. Yang, Z.; Zou, C. “Oil exploration into source rock”: Connotation and prospect of source rock oil and gas. Pet. Explor. Dev. 2019, 46, 1–12. [Google Scholar] [CrossRef]
  6. Zou, C.; Yang, Z.; Zhang, G.; Hou, L.; Zhu, R.; Tao, S.; Yuan, X.; Dong, D.; Wang, Y.; Guo, Q.; et al. Theoretical understanding and practical significance of orderly accumulation of conventional and unconventional oil and gas. Pet. Explor. Dev. 2014, 41, 14–27. [Google Scholar] [CrossRef]
  7. Li, J.; Wu, B.; Zhao, H.; Cheng, N.; Huang, J. Adaptability analysis of horizontal well volume fracturing technology in Mahu tight conglomerate reservoir. China Pet. Explor. 2019, 24, 250–259. [Google Scholar]
  8. Zhang, Q.; Li, M.; Zhang, Z.; Chen, Y.; Zhang, L.; Li, A. Application of volume fracturing technology and application of tight oil reservoir in Shengli Oilfield. China Pet. Explor. 2019, 24, 233–240. [Google Scholar]
  9. Mu, L.; Zhao, Z.; Li, X.; Zhang, J.; Tang, M.; Du, X.; Bai, X. Fine cut volumetric fracturing technology for shale oil horizontal Wells in Ordos Basin. Oil Gas Geol. 2019, 40, 626–635. (In Chinese) [Google Scholar]
  10. Shi, D.; Zhang, B.; He, J.; Jiang, T.; Pu, C. Feasibility evaluation of volumetric fracturing of Chang 7 tight sandstone reservoir in Ordos Basin. J. Xi’an Shiyou Univ. Nat. Sci. Ed. 2014, 29, 52–55. [Google Scholar]
  11. Jin, C.; He, J.; Lin, Q.; Mei, J.; Duan, Y. Fracturing stimulation based on geology-engineering integration to tight oil reservoirs in Block Fang 19833northern Songliao Basin. China Pet. Explor. 2019, 24, 218–225. [Google Scholar]
  12. Bai, X.; Qi, Y.; Lu, H.; Duan, P.; Gu, Y.; Wu, F. Optimization design for volume fracturing of horizontal wells in tight oil reservoir of Ordos Basin. Oil Drill. Prod. Technol. 2015, 37, 83–86. [Google Scholar]
  13. Niu, X.; Feng, S.; You, Y.; Liang, X.; Xin, H.; Dan, W.; Li, Y.; Ren, J. Fracture extension and distribution pattem of volume fracturing in tight reservoir:an analysis based on actual coring data after fracturing. Oil Gas Geol. 2019, 40, 669–677. [Google Scholar]
  14. Niu, X.; Feng, S.; You, Y.; Liang, X.; Wang, F.; Li, W.; Hao, B. Practice and experience in geological research and test of tight oil in Ordos Basin. Oil Forum 2016, 35, 38–45. [Google Scholar]
  15. Zhang, J.; Lin, L.; Li, Y.; Tang, X.; Zhu, L.; Xing, Y.; Jiang, S.; Jin, T.; Yang, S. Classification and evaluation of shale oil. Earth Sci. Front. 2012, 19, 322–331. [Google Scholar]
  16. Niu, X.; Feng, S.; Liu, F.; Wang, C.; Zheng, Q.; Yang, X.; You, Y. Microscopic occurrence of oil in tight sandstones and its relation with oil sources a case study from the Upper Triassic Yanchang Formation, Ordos Basin. Oil Gas Geol. 2013, 34, 288–293. [Google Scholar]
  17. Yao, J.; Deng, X.; Zhao, Y.; Han, T.; Chu, M.; Pang, J. Characteristics of tight oil in Triassic Yanchang Formation, Ordos Basin. Pet. Explor. Dev. 2013, 40, 150–158. [Google Scholar] [CrossRef]
  18. You, Y.; Niu, X.; Feng, S.; Wang, F.; Wang, C.; Li, W. Study of pore features in Chang 7 tight oil reservoir, Yanchang layer, Ordos Basin. J. China Univ. Pet. Ed. Nat. Sci. 2014, 38, 18–23. [Google Scholar]
  19. Li, X.; Fan, F.; Yang, H.; Zhang, Y.; Ma, B. Volumetric fracturing technology of low-pressure tight oil reservoirs horizontal wells under different development conditions in Ordos Basin. Oil Drill. Prod. Technol. 2016, 39, 34–36. [Google Scholar]
  20. Zou, C.; Ding, Y.; Lu, Y.; Liu, X.; Chen, J.; Wang, X.; Yang, Z.; Cai, B.; Yang, Z.; He, C.; et al. Concept, technology and practice of “man-made reservoirs” development. Pet. Explor. Dev. 2017, 44, 144–154. [Google Scholar] [CrossRef]
  21. Pang, J.; Dan, W.; Sun, B.; Deng, J.; Shi, Z. The microscopic reservoir features of tight oil in Chang 7 reservoir of Longdong Chenghao area in Ordos Basin. J. Oil Gas Technol. 2015, 37, 1–6. [Google Scholar]
  22. Yang, H.; Niu, X.; Luo, S.; Feng, S.; Lv, Q. Research of simulated experiment on gravity flow deposits of tight sand bodies of Chang7 Formation in Longdong area, Ordos Basin. Earth Sci. Front. 2014, 21, 322–332. [Google Scholar]
  23. Zhou, Q.; Jin, Z.; Yang, G.; Dong, N.; Shang, Z. Shale oil exploration and production in the U.S.: Status and outlook. Oil Gas Geol. 2019, 40, 469–477. [Google Scholar]
  24. Zhang, L.; Li, J.; Li, Z.; Zhang, J.; Zhu, R.; Bao, Y. Advances in shale oil/gas research in North America and considerations on exploration for continental shale oil/gas in China. Adv. Earth Sci. 2014, 29, 700–711. [Google Scholar]
  25. Jia, C.; Zheng, M.; Zhang, Y. Unconventional hydrocarbon resource in China and the prospect of exploration and development. Pet. Explor. Dev. 2012, 39, 129–136. [Google Scholar] [CrossRef]
  26. Hu, W. Development and potential of unconventional oil and gas resources in China national petroleum corporation. Nat. Gas Ind. 2008, 28, 5–7. [Google Scholar]
  27. Pu, X.; Jin, F.; Han, W.; Shi, Z.; Cai, A.; Wang, A.; Guan, Q.; Jiang, W.; Zhang, W. Geological characteristics and key exploration technologies of continental shale oil dessert: A case study of the second member of Kongdian Formation in Cangdong Sag. Acta Pet. Sin. 2019, 40, 997–1012. [Google Scholar]
  28. Wang, X.; Yang, Z.; Guo, X.; Wang, X.; Feng, Y.; Huang, L. Shale oil exploration practice and prospect in Jimsar Sag, Junggar Basin. Xinjiang Pet. Geol. 2019, 40, 402–413. [Google Scholar]
  29. Zhou, L.; Chen, C.; Han, G.; Yang, F.; Ma, J.; Zhou, K.; Zhang, W.; Huang, C. Geological characteristics and shale oil exploration potential of Shaxia sub-member in Qikou Sag, Bohai Bay Basin. Earth Sci. 2019, 44, 2736–2750. [Google Scholar]
  30. Liang, S.; Luo, Q.; Wang, R.; Chen, X.; Yang, B.; Ma, Q.; Liang, H. Geological characteristics and exploration practice of Permian unconventional petroleum in Santanghu Basin. China Pet. Explor. 2019, 24, 624–635. [Google Scholar]
  31. Yang, Z.; Hou, L.; Lin, S.; Luo, X.; Zhang, L.; Wu, S.; Cui, J. Geological characteristics and exploration potential of tight oil and shale oil in Lusaogou Formation, Jimsar Sag. China Pet. Explor. 2018, 23, 76–85. [Google Scholar]
  32. Du, J.; Hu, S.; Pang, Z.; Lin, S.; Hou, L.; Zhu, R. Types, potential and prospect of continental shale oil in China. China Pet. Explor. 2019, 24, 560–568. [Google Scholar]
  33. Guo, J.; Wang, J.; Meng, F. Promoting the high-quality development of China’s shale oil upstream industry by following international first-class standard. China Pet. Explor. 2019, 24, 547–552. [Google Scholar]
  34. Zou, C.; Yang, Z.; Wang, H.; Dong, D.; Liu, H.; Shi, Z.; Zhang, B.; Sun, S.; Liu, D.; Li, G.; et al. “Exploring petroleum inside source kitchen”: Jurassic unconventional continental giant shale oil & gas field in Sichuan basin, China. Acta Geol. Sin. 2019, 93, 1551–1562. [Google Scholar]
  35. Fu, J.; Li, S.; Hou, Y.; Zhou, X.; Liu, J.; Li, S. Risk exploration breakthrough of Class II shale oil in Member 7 of Yanchang Formation, Ordos Basin and its significance. China Pet. Explor. 2020, 25, 78–92. [Google Scholar]
  36. Shao, X.; Wang, M.; Qi, Y.; He, T.; Zhang, X.; Pang, J.; Guo, Y. Characteristics and main controlling factors of Chang 8 reservoir in northern Pingliang area, Ordos Basin. Lithol. Reserv. 2021, 33, 59–69. [Google Scholar]
  37. Pu, B.; Wang, F.; Wang, K.; Sun, J.; Li, Y.; Shi, B.; Zhao, W.; Guo, X. Shale gas accumulation and enrichment conditions and development model of Chang 7 Member in Yan’an area. Geol. China 2023, 50, 1285–1298. [Google Scholar]
  38. PetrelTM, version 2018; Schlumberger Software Co.: Houston, TX, USA, 1927. Available online: https://www.slb-sis.com.cn/(accessed on 12 May 2024).
  39. Wang, J. Research on Reservoir Inter Layer Model. Master’s Thesis, China University of Petroleum, Qingdao, China, 2010. [Google Scholar]
  40. Cong, S.; Zhou, H.; Zhao, Y.; Jin, H.; Liu, P.; Wu, R.; Chen, Y. Study on 3D geological modeling technology of Shenshui 501 geothermal field in Damintun Depression. Oil Gas Reserv. Eval. Dev. 2023, 13, 741–748. [Google Scholar] [CrossRef]
  41. Zhang, R.; Wen, Q.; Ye, L.; Zhang, H.; Wang, J. Application of 3D geological modeling software in domestic mineral resources development. Sichuan Nonferr. Met. 2021, 4, 12–14. [Google Scholar]
  42. Huang, C.; Jiang, K.; Li, L.; Li, C.; Zeng, F.; He, Q. Research progress of three-dimensional geological modeling of mines. J. Sichuan Geol. 2020, 40, 323–326. [Google Scholar]
  43. Zhang, P.; Zhang, C.; Liu, X.; Li, J.; Du, K. Big LuGou two district 6 JingAn oilfield reservoir geological model. J. Reserv. Eval. Dev. 2016, 6, 1–6. [Google Scholar] [CrossRef]
  44. Cao, J.; Wang, X.; Fan, L.; Yuan, X.; Wei, F. Deep water tight sandstone reservoir characteristics and diagenetic facies analysis: A case study of Chang 7 oil-bearing formation in Xifengarea, Ordos Basin, NW China. J. Northwest Univ. Nat. Sci. Ed. 2021, 51, 80–94. [Google Scholar]
  45. Li, S.; Zhang, C.; Lin, K.; Yin, T.; Zhang, C. Establishment of several prototype models in reservoir modeling. Sediment. Tethys Geol. 2004, 24, 102–107. [Google Scholar]
  46. Xu, K. Comparative analysis of stochastic modeling and deterministic modeling of sedimentary facies. Inn. Mong. Petrochem. Ind. 2019, 46, 114–117. [Google Scholar]
Figure 1. Structure location in the Heshui area of the Ordos Basin.
Applsci 14 06602 g001
Figure 2. Modeling flow of shale rock facies in the southern Heshui area.
Applsci 14 06602 g002
Figure 3. Three-dimensional (3D) structure model of each sublayer of the target layer: (a) structural model; (b) grid model.
Applsci 14 06602 g003
Figure 4. Thickness map of the Chang 7 member of the target formation.
Applsci 14 06602 g004
Figure 5. Thickness map of sandstone in the Chang 7 member of the target formation.
Applsci 14 06602 g005
Figure 6. Probability map of sandstone in the Chang 7 member of the target formation.
Applsci 14 06602 g006
Figure 7. Mudstone thickness map of the Chang 7 member of the target formation.
Applsci 14 06602 g007
Figure 8. Probability map of mudstone in the Chang 7 member of the target formation.
Applsci 14 06602 g008
Figure 9. Lithofacies of each small layer in the Chang 7 member of the target formation.
Applsci 14 06602 g009
Figure 10. Lithofacies maps of each small layer constrained by the probability surface in the Chang 7 member of the target formation.
Applsci 14 06602 g010
Figure 11. Probability-surface-constrained rock’s relative ratio profile.
Applsci 14 06602 g011
Figure 12. Reservoir attribute model.
Applsci 14 06602 g012
Figure 13. Histogram of frequency distribution of lithofacies, porosity, and permeability of the Chang 7 member in the southern Heshui block.
Applsci 14 06602 g013
Table 1. Fitting parameter table of variation function of long 7 segments in Heshui South block.
Sub-
Layers
ModelMajor RangeMinor RangeVertical Range
Azimuth/°Range/mNugget/mAzimuth/°Range/mNugget/mRange/mNugget/m
Chang
711
Lithofacies model30320003001700040
Chang
712
Lithofacies model35400003052050050
Chang
721
Lithofacies model40450003102300060
Chang
722
Lithofacies model45510003152650070
Chang
73
Lithofacies model50550003203000080
Chang711Porosity model3013000300750040
Chang712Porosity model35160003051050050
Chang
721
Porosity model40190003101400060
Chang
722
Porosity model45220003151750070
Chang
73
Porosity model50260003202000080
Chang
711
Permeability model3012000300850040
Chang
712
Permeability model35145003051200050
Chang
721
Permeability model40180003101450060
Chang
722
Permeability model45210003151700070
Chang
73
Permeability model50240003202000080
Disclaimer/Publisher’s Note: The statements, opinions and data contained in all publications are solely those of the individual author(s) and contributor(s) and not of MDPI and/or the editor(s). MDPI and/or the editor(s) disclaim responsibility for any injury to people or property resulting from any ideas, methods, instructions or products referred to in the content.

