1. Introduction
The lifespan of functional surfaces of components determines the lifespan of the entire apparatus. One method of extending the lifespan is the deposition of thin layers using vacuum technologies on the functional surfaces of components. This leads to an improvement in properties such as hardness, coefficient of hardness, and wear resistance. The mentioned properties should be identical on the entire surface of a thin layer and are also dependent on the structure of said thin layer. The structure of a thin layer can be influenced by technological parameters of the thin layer’s deposition, such as pressure in the vacuum chamber, voltage on the cathode (bias), density of the current, and temperature on the surface of the functional area. Another factor is the position of the coated functional area in relation to the falling particles.
Thin layers, their preparation, and their properties become the main subject of research for disciplines such as mechanical engineering, electronics, optics, devices working on the basis of electric, magnetic, and superconducting phenomena, protection of materials against the effects of the surrounding environment, etc. Thin layers can also be deposited using vacuum technologies. [
1]. Nowadays, PVD (physical vapor deposition) methods are frequently used, specifically sputtering and evaporation. Electron beam PVD is an evaporated material out of a crucible that can then react with a gas (often N
2, C
4H
4, etc.), creating a nitride, carbide, or carbonitride coating of the evaporated material (often Cr, Ti, Al, V, and W) on the functional surface. PVD methods can be used to deposit a coating at temperatures up to 400 °C. That is beneficial for the deposition of coatings on steel components that were heat -pretreated.
The properties of thin layers (hardness, Young’s modulus, roughness, coefficient of friction, etc.) can influence technological factors of the deposition—bias, density of the current, pressure in the vacuum chamber, and the position of the coated surface in the vacuum chamber. The Thornton diagram shows that the ratio of the substrates’ temperature to the melting point of the material of the coating is up to 0.3 (the deposition temperature is up to 300 °C) [
2]. The structure of the thin layer is made up of columnar-structured grains and nano, micro, and macro gaps (empty areas/gaps) [
3]. The columns can grow perpendicular to the surface; however, they often grow at an angle that is lower than 90°. When coating the inner surface of the cylinder with a diameter equal to 200 cm, the incidence angle is oblique. The coating therefore has a columnar structure, with columns growing at an angle that is less than 90° [
4,
5]. We can perhaps conclude that the structure of the deposited coating has an impact on the mechanical and tribological properties of the coating.
Wu H. et al. [
6] deposited a Cr film using the HiPIMS method (high-power impulse magnetron sputtering—HiPIMS) with a planar cathode target and auxiliary anode on the inner surface of the cylinder. The thickness of the Cr film-deposited auxiliary anode voltage of 60 V has decreased from 1.6 µm to 0.1 µm. On the other hand, hardness has increased from 7 GPa to 9.6 GPa [
6]. The tube did not rotate during the coating deposition process. Michau et al. [
7] have deposited CrC
x coating on the inner surface of the cylinder using liquid-injection metal-organic chemical vapor deposition. The technological parameters of the process were as follows: the temperature of the deposition was 450 °C to 400 °C, the pressure in the vacuum chamber was 7 × 10
3 Pa, the gas H
2 flow rate was 500 cm
3/min, the reactive gas C
7H
8 flow rate was 250 cm
3/min, and the reactive gas BBC bis(benzene) of chrome flow rate was 0.8 cm
3/min.). They have obtained a CrC coating with a thickness equal to circa 1 µm. The velocity of growth with a deposition temperature of 400 °C has decreased in a linear manner from 3.6 µm/h to 0.5 µm/h. At a temperature of 450 °C, the decrease was from 7.5 µm/hour to 0.5 µm/hour. Pillaca et al. [
8] have deposited a DLC coating on the inner surface of a steel cylinder using a hybrid pulse DC PECVD method [
8]. A steel tube had a diameter equal to 10 cm and a length equal to 200 cm. Firstly, the Si coating was deposited for 0.5 h (used silane SiH
4) to improve adhesion of the DLC coating (used C
2H
2), which was subsequently deposited for 2 h. The technological parameters of the deposition process were constant: pressure ranging from 5 mTorr to 70 mTorr; bias from 350 V to 650 V; gas flow of 5 cm
3/min; length of an impulse equal to 15 µs; and frequency equal to 21 kHz. The thickness of the DLC coating has decreased in a linear manner from 0.75 µm (the start of the cylinder) to 0.05 µm (the end of the cylinder) [
8]. Precursors did flow through the tube, always in one direction. Kong et al. [
9] deposited the DLC coating on the inner surface with a diameter equal to 3 cm and a length equal to 40 cm. They evaluated the thickness and hardness of the coatings. They also changed the frequency of the power supply. At 0.1 kHz, an equal thickness of ca. 5 µm [
9] was achieved. Wang et al. [
10] used plasma immersion ion implantation into a cylindrical bore. The tube had an inner radius equal to 4.8 cm and a length equal to 20 cm. Zhao et al. [
11] used an arc-evaporated Ti and a N
2 reactive gas for the deposition of a TiN PVD coating on the inner surface of a steel tube. The thickness of the coating changed from 2.3 μm (in the center of the tube) to 2.7 μm (at the ends of the tube). The tube did rotate around an axis perpendicular to the axis of the tube during the TiN coatings’ deposition.
Ma et al. [
12] and Yukimura et al. [
13] used an electric arc to melt Ti and N
2 gas for the TiN PVD coatings’ deposition on the inner surface of the steel tube. Regression analysis and correlation analysis are statistical methods generally commonly used to evaluate and assess the results of experimental measurements. These methods are used by many authors in their works, which are devoted to the coating of various materials. Datta et al. [
14] used them in the evaluation of the plasma spray coating process. Regression equations for the prediction of adhesion of sprayed coatings were used by Song et al. [
15]. To estimate the critical load for the adhesion of 75% WC-Co + 25% Ni alloy by plasma spraying, statistical analysis was used in the paper [
16]. To determine the weight of the coating, the multiple regression method was successfully applied in the work [
17]. Regression analysis is used in [
18] to investigate the coating process aimed at protecting the photolithographic matrix from silicon contamination. The accuracy of neural network predictions is compared with regression analysis in the design and development of shielded fluxes for depositing electrode coatings for arc welding [
19,
20]. Long et al. [
21] investigated the chemical composition of coatings from quaternary metal oxides RuIrSnLa deposited on Ti. The relationship between process input parameters and output response sensitivity analysis was investigated in the work of authors Zhang et al. [
22].
Kumar and Chhibber [
23] investigated the physicochemical and thermophysical characteristics of deposited coatings and developed a regression model. In [
24], the authors, Policastro et al., monitored the coatings using electrochemical impedance spectroscopy. Among other things, they used regression procedures to evaluate the data.
The creation of thin layers is a complex process that has an impact on the properties of the layer. The aim of this article is to use appropriate statistical methods (statistical hypothesis testing, ANOVA method, regression, and correlation analysis) to determine the dependence of the observed variables (angle of grain growth, thickness of the deposited layer, adhesion in the direction of grain growth, adhesion against the direction of grain growth, roughness of the deposited layer) on the selected input variables (height of the measured location above the target and radius of the tube) when depositing the Ti layer by the EB PVD method.
3. Theory/Calculation
3.1. Ti Layer
Titan, of 99.99% purity, was the material of the coating. The chosen properties of the Ti coating are listed in
Table 2.
The following information was observed during the experiment:
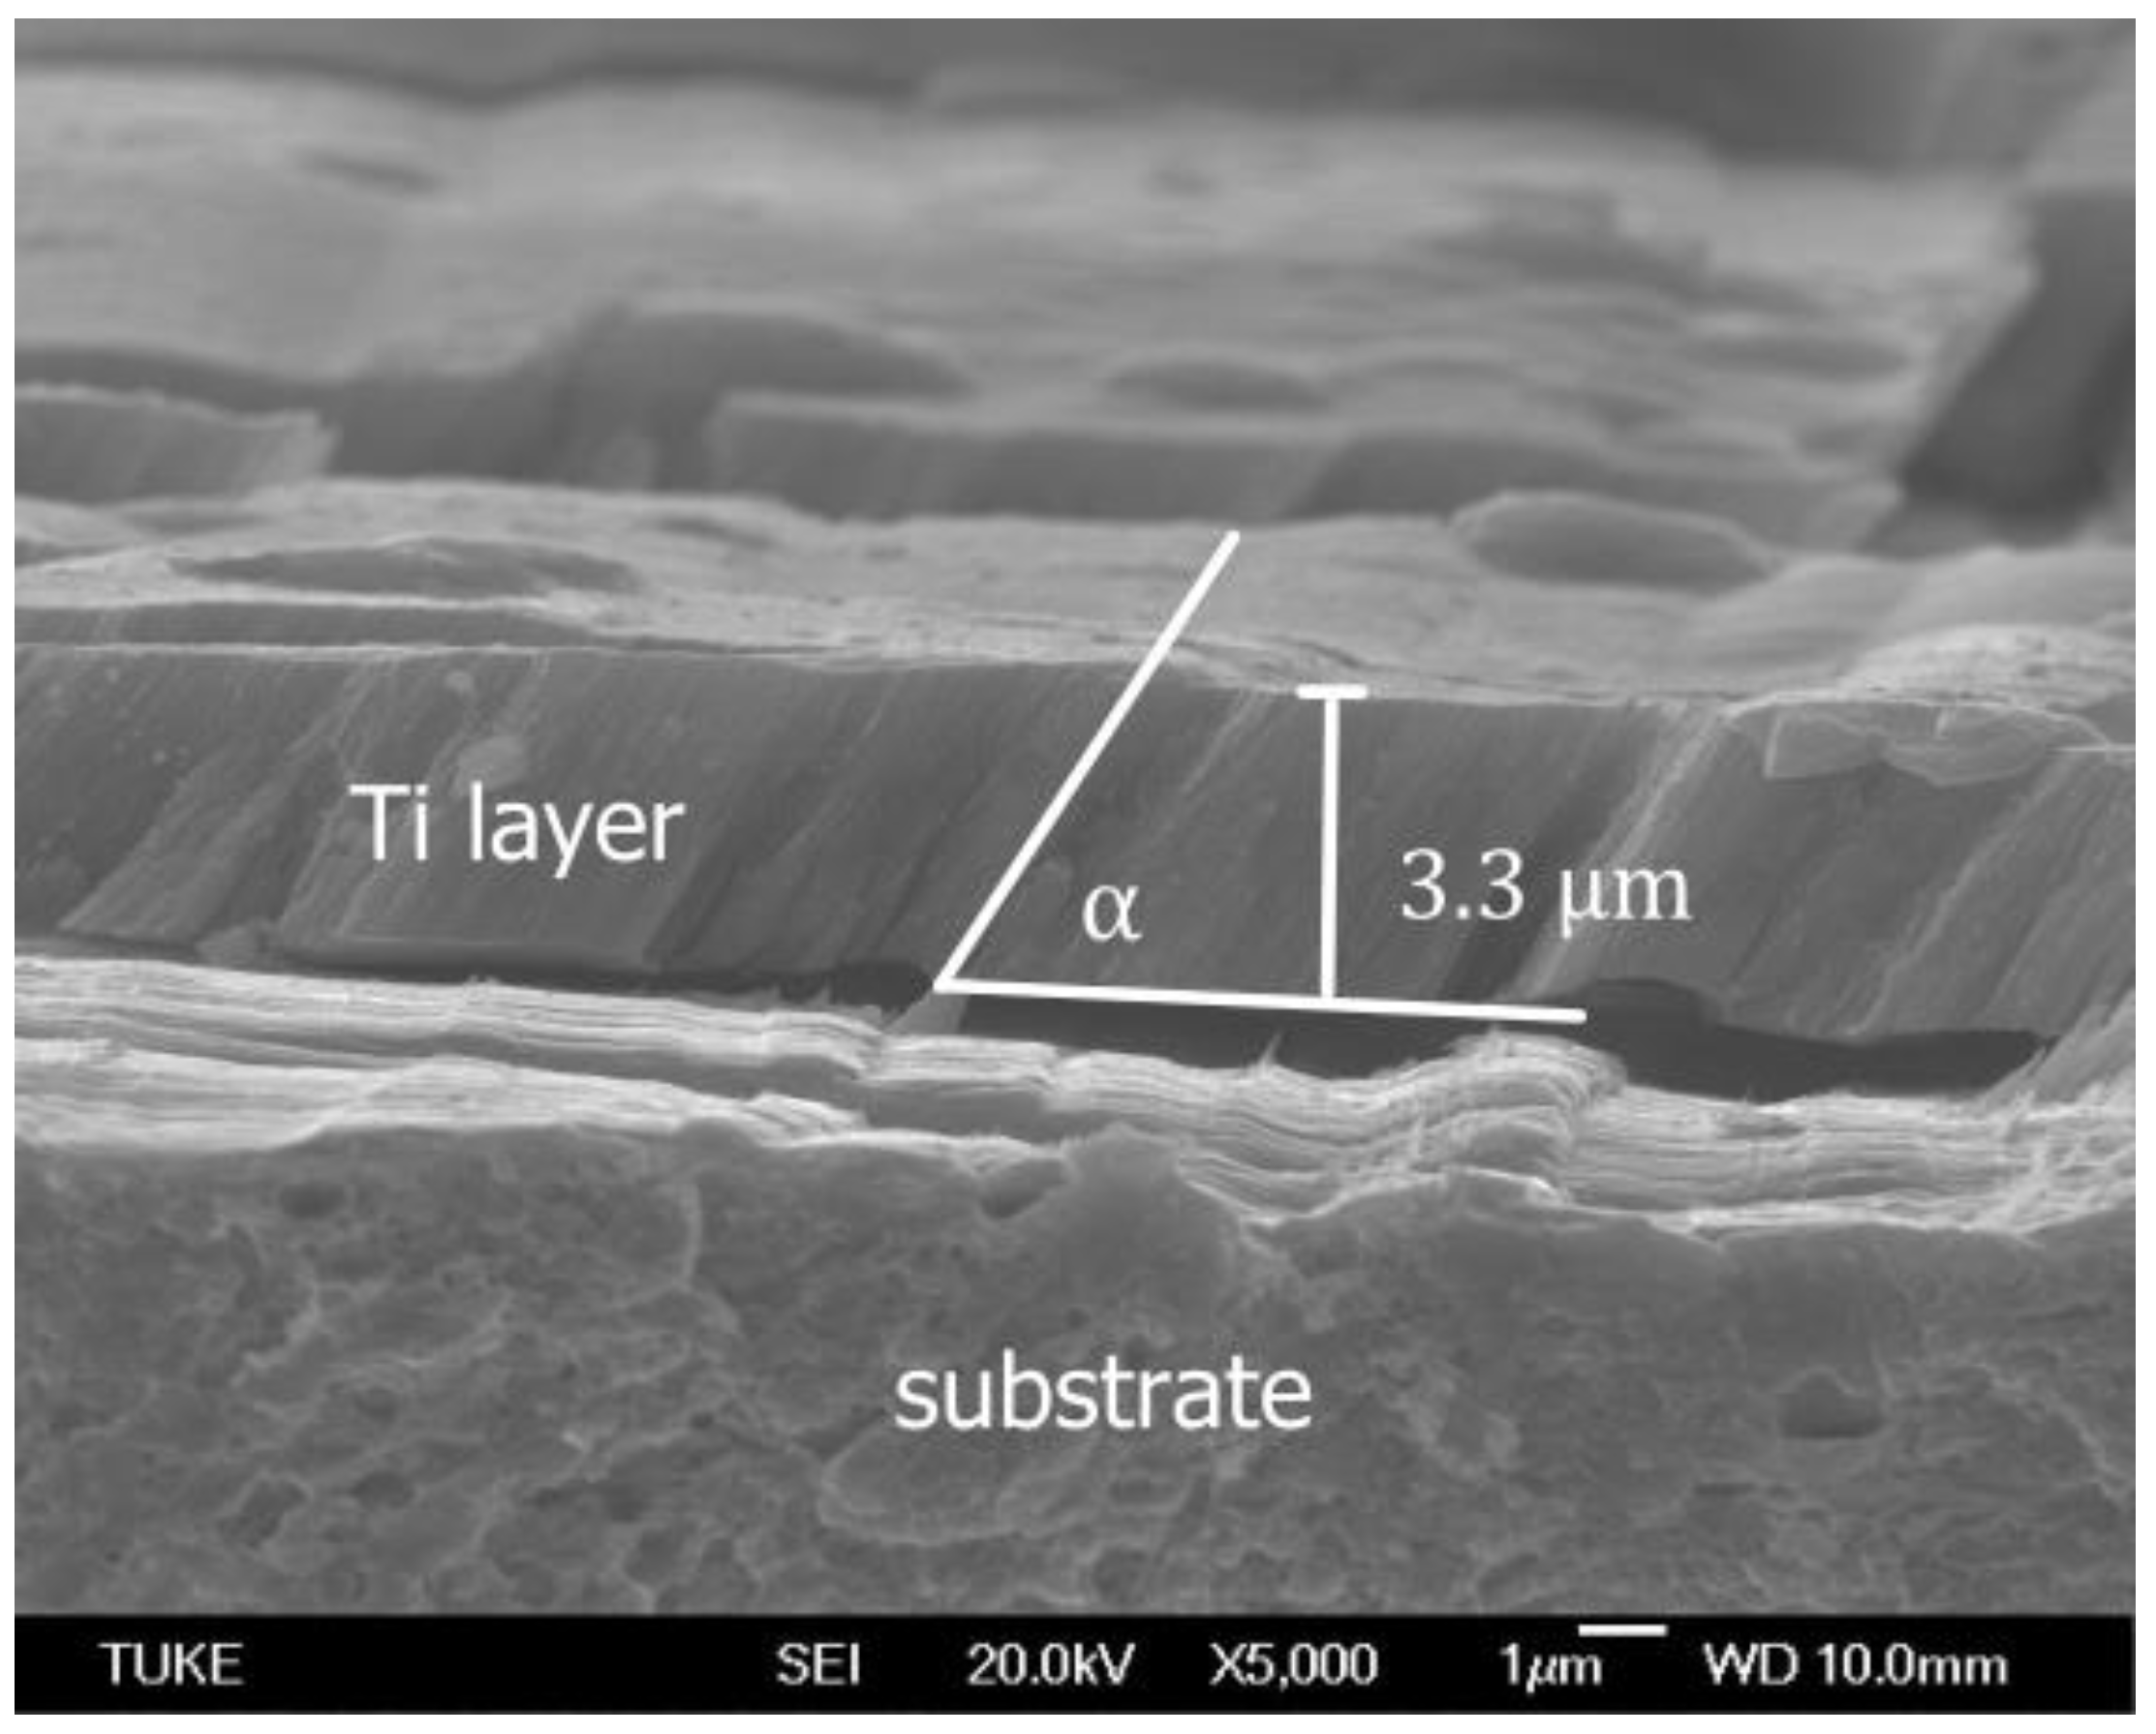
The texture of the Ti layer (the dependence of the grain growth angle α on the particle impact angle β and the height of the measured spot above the target) was evaluated on a Jeol 7000F electron microscope (Jeol, Tokyo, Japan). A brittle fracture perpendicular to the surface of the evaluated layer was evaluated at magnifications of 5000 times. The film separated from the substrate due to the fracture of the sample cooled on liquid nitrogen. A cross-sectional view shows the structure (the grain growth) of the deposited Ti film.
The thickness of the Ti layer was measured on a Jeol 7000F electron microscope at the Institute of Material Research in Košice.
Figure 6 shows an example of the created Ti layer at a height of the measured spot above the target of 305 mm and a tube radius of 110 mm at a 5000-fold magnification.
Adhesion is an important property of layers. Adhesion measurement was carried out on a Scratch tester provided by a company called CSM Instruments (Needham Heights, MA, USA) under the following conditions: load force 0 to 120 N (macro), indenter movement speed 10 mm/min., maximum indenter travel 120 mm.
The roughness of the evaluated surface was measured on a touch roughness meter (Surftest 301) from Mitutoyo (Kawasaki, Japan) before and after the formation of the Ti layer. Each roughness value was created as an arithmetic mean of five measurements.
3.2. Statistical Methods
When modeling the dependence of selected variables, we used two basic statistical methods: the ANOVA method and multiple regression analysis. Statistical evaluation of the data is carried out in the R programming language.
When testing statistical hypotheses, non-rejection (or rejection) of the hypothesis H0 is realized using the p-value. If the p-value ≥ α, we do not reject the null hypothesis H0 (α is the significance level). ANOVA is a method that allows you to compare the mean values of k independent basic sets. Its goal is to reveal whether the differences in the mean values of individual files are statistically significant or random. ANOVA examines the dependence of the quantitative variable Y on one or more qualitative variables (factors). Individual variants of the factor are referred to as factor levels.
The basic assumptions for the ANOVA include normality and homoscedasticity.
In practice, statistical tests are used to assess normality (e.g., the Shapiro–Wilk normality test, the Kolmogorov–Smirnov test, and others). If we want to compare the homogeneity (agreement) of variances of k-independent sets (Bartlett’s test, Cochran’s test, Hartley’s test, and others).
Let us consider two variables (factors)
A and
B and examine their influence on the variable
Y. If factor
A has
I levels and factor
B has
J levels (1 ≤
i ≤
I, 1 ≤
j ≤
J), then the number of all independent observations is
I.
J. In the case of a two-factor analysis of variance without interactions, we will start with a model in the following form
for
i = 1, 2, ⋯,
I,
j = 1, 2, ⋯,
J, where
μ represents the overall mean of the monitored variable,
is the influence (effect) of factor A on the
i-th level, the so-called line effects,
is the influence (effect) of factor
B on the
j-th level, so-called column effect and
is the implementation of random error, where
We test the influence of factor
A with the hypothesis
against the alternative hypothesis
In an analogous way, we test the influence of factor
B, i.e., we test the hypothesis
against
As a measure of the size (magnitude, intensity) of the effect of Factor A, the coefficient
η2 can be used in the dispersion analysis, which is similar to the coefficient of determination
, which is used in the regression analysis. The following relation applies to the coefficient
η2.
where
SSA represents the variability between the groups and
SST the total variability. The closer the value of the coefficient is to 1, the greater the influence of the investigated factor A.
When examining the output variable from the selected input variables, regression and correlation analysis are used. We will consider a classical linear regression model in the form
where
and
for
are model parameters,
Y is the dependent variable, variables
,
represent
k-independent input variables and
ε is a random error. We used the least squares method for parameter estimation of the selected regression model. The statistical significance of the regression model i.e., parameters of the regression model is verified using tests of statistical significance.
The assessment of the degree of dependence between quantitative variables was carried out using correlation analysis. The degree of the effect of the Y variable and the effects of the k variables were expressed by means of the coefficient of multiple determination , .
4. Results
Experimental tests and subsequent processing of the results were carried out with the following goals:
monitor the influence of selected variables (height of the measured location above the target, tube radius) on variables (angle of grain growth, thickness of the deposited layer, adhesion in the direction of grain growth, adhesion against the direction of grain growth, roughness of the deposited layer) through a two-factor variance analysis,
determine the dependence of monitored variables (angle of grain growth, thickness of the deposited layer, adhesion in the direction of grain growth, adhesion against the direction of grain growth, roughness of the deposited layer) on selected variables (height of the measured place above the target X1, tube radius X2) through multiple regression analysis.
4.1. Characteristics of Variables
The variables of the height of the measured place above the target (X
1) and the tube radius (X
2) are independent discrete variables. The variable X
1 takes on values from 305 mm to 425 mm with a difference of 30 mm (X
11 = 305 mm, X
12 = 335 mm, X
13 = 365 mm, X
14 = 395 mm, X
15 = 425 mm). The variable X
2 takes on values from 100 to 140 mm with a difference of 10 mm (X
21 = 100 mm, X
22 = 110 mm, X
23 = 120 mm, X
24 = 130 mm, X
25 = 140 mm). The variables (angle of grain growth, thickness of the deposited layer, adhesion in the direction of grain growth, adhesion against the direction of grain growth, and roughness of the deposited layer) are continuous variables. The resulting values are the arithmetic mean of five measurements. The description of the variables is in
Table 2.
When analyzing the variables, we first of all determined whether there was a dependency between them, i.e., whether the variables were correlated. Since the variables were measured in different units, the relationships between them were identified using a correlation matrix (
Table 3), while the relationship between two variables was determined through the correlation coefficient r.
The resulting correlation matrix shows that there is a very strong positive correlation between variables Y4 and Y2 (r = 0.97) and a strong negative correlation between variables Y2 and X1 (r = −0.963). Moderate negative correlation is, for example, between variables X1 and Y1 (r = −0.755), Y1 and Y3 (r = −0.779), X2 and Y3 (r = −0.623).
The measured values show that an increase in the height of the measured place above the target leads to a decrease in the grain growth angle (negative correlation, r = −0.755) and, conversely, an increase in the tube radius leads to an increase in the grain growth angle (positive correlation, r = 0.602). A graphic representation of the values using a boxplot is shown in
Figure 7.
By increasing the height of the measured location above the target, the value of the grain growth angle (Y1) decreases, and the thickness of the deposited layer (Y2) decreases.
By increasing the radius of the tube, on the one hand, the grain growth angle increases; on the other hand, the thickness of the deposited layer decreases, and adhesion decreases in both directions.
It follows from the correlation matrix that as the height of the measured location above the target increases, the value of the thickness of the deposited layer decreases (Y1, r = −0.963). The correlation (dependence) between roughness and other variables is not confirmed by the correlation matrix (in all cases, |r| < 0.29).
4.2. Effect of Factors on Monitored Variables (Two-Factor ANOVA)
Let us consider two factors (variables) X1 and X2 and examine their influence on the observed result. Variable X1 is the height of the measured place above the target, which has five levels (X11 = 305 mm, X12 = 335 mm, X13 = 365 mm, X14 = 395 mm, X15 = 425 mm), factor X2 is the tube radius, which also has five levels (X21 = 100 mm, X22 = 110 mm, X23 = 120 mm, X24 = 130 mm, X25 = 140 mm).
In the first step, we monitored whether the factors X
1 and X
2 affected the variable Y
1, which represents the grain growth angle. The verification of the normality of the samples is realized using the Shapiro-Wilk normality test. For the case of the grain growth angle at the height of the measured place above the target of 305 mm, the
p-value is 0.979. Testing results for each height of the measured location above the target, or for each tube radius, are listed in
Table 4.
Since the p-value > α for each sample set, we do not reject the hypothesis H0 about the normality of the individual base sets. We can state that all the samples exhibited a normal distribution.
We will verify the condition of homogeneity of variances using the Bartlett test. The H0 hypothesis is that “the variances are equal across all groups”. In the case of factor A, the p-value is 0.896, and in the case of factor B, the p-value is 0.987. The results of the test show that we do not reject the hypothesis of a coincidence of variances (p-value > α). In an analogous way, the fulfillment of the assumptions of variance analysis is verified for all samples.
The prerequisites for using analysis of variance are met; therefore, a two-factor analysis of variance will be performed. We can formulate two hypotheses for the given problem. The null hypothesis is H
0: the influence of factor X
1 (or X
2) is insignificant on the value of variable Y
1, against H
1: there is an influence of factor X
1 (or X
2) on the value of variable Y
1. The results of the variance analysis are in
Table 5.
Since the resulting p-values are significantly lower than the significance level (p-value (X1) = 4.3 × 10⁻¹², p-value (X1) =3.2 × 10⁻¹⁰, α = 0.05), the hypothesis H0 was rejected.
The results of the analysis show that there is a demonstrable influence of both factors on the grain growth angle. We will use the coefficient η
2 as a measure of the effect size of the factor. The influence of the height of the measured place above the target (factor X
1) on the variability of the grain growth angle is 62.5%, and the influence of the tube radius (factor X
2) is 35.6%. In an analogous way, the influence of factors X
1 and X
2 on other variables Y
2 to Y
5 was monitored. The results of the variance analysis are presented in
Table 6.
In the case of the thickness of the deposited layer (Y2), a significant effect is shown only in the case of factor X1, i.e., the influence of the height of the measured place above the target. The value of the coefficient η2 is equal to 95.3%. This means that the thickness of the deposited layer depends, up to 95.3%, on the height of the measured place above the target. On the other hand, the influence of the tube radius on the thickness of the deposited layer was not demonstrated (p-value ≥ α).
The results of the analysis show that there is a demonstrable influence of both factors on adhesion in the direction (Y3) and, respectively, in the opposite direction of grain growth (Y4). The influence of the height of the measured spot above the target on adhesion expressed by the coefficient η2 is very similar (28.3%—in the direction of grain growth, 29.8%—against the direction of grain growth). It is similar in the case of the influence of the tube radius on adhesion (40.4%—in the direction of grain growth, 42.6%—against the direction of grain growth).
The results of the testing did not show a statistically significant effect of the height of the measured place above the target and the radius of the tube on the variable Y5, i.e., the roughness of the deposited layer (p-values are in both cases greater than or equal to the level of significance α).
4.3. Tracking the Dependence of Variables (Regression and Correlation Analysis)
When monitoring the dependence of a variable (angle of grain growth, thickness of the Ti layer, roughness of the deposited layer, adhesion in the direction of grain growth, or adhesion against the direction of grain growth) on the height of the measured location above the target (
X1) and the tube radius (
X2), it will be based on a regression model in the form
where
,
are dependent variables (
Table 1),
,
a
are parameters of the regression model a
is a random error.
4.4. Angle of Grain Growth
Point and interval estimates of the parameters of the regression model (Model I) for the variable Y
1 (angle of grain growth) are presented in
Table 7.
To verify the statistical significance of the model, we used the F-test of the statistical significance of the model. The result of the testing shows that the regression model Model I is statistically significant (
p-value = 1.4 × 10
−13 < α). The results show that both independent variables are statistically significant, which means that they significantly affect the grain growth angle. The coefficient of determination is 0.932. A graphic representation of experimental (empirical) values and theoretical (model) values of the angle of grain growth depending on the height of the measured place above the target and the radius of the tube is shown in
Figure 8.
4.5. Thickness of the Deposited Layer
Point and interval estimates of the parameters of the regression model (Model II) for the variable Y
2 (layer thickness) are shown in
Table 8.
The result of the testing shows that the regression model Model II is statistically significant (
p-value = 4 × 10
−14 < α). It turns out that only the variable X
1 (the height of the measured location above the target) significantly affects the thickness of the deposited layer. The value of the multiple coefficient of determination is 0.939. A graphic representation of the experimental (empirical) values and theoretical (model) values of the thickness of the deposited layer depending on the height of the measured place above the target and the radius of the tube is in
Figure 9.
4.6. Adhesion
Point and interval estimates of the parameters of the regression model (Model III or Model IV) for the variables Y
3 and Y
4 are shown in
Table 9.
The results of the testing show that the regression model Model III (or Model IV) is statistically significant (p-value = 3 × 10⁻⁵ < α, or p-value = 5 × 10⁻⁵ < α). The results show that both independent variables are statistically significant and significantly affect adhesion. The value of the multiple coefficient of determination is 0.718 (or 0.759).
4.7. Roughness of the Deposited Layer
Point and interval estimates of the parameters of the regression model (Model V) for the variable Y
5 are shown in
Table 10.
The result of the testing shows that the regression model Model V is not statistically significant (p-value = 0.789 > α), and both independent variables are statistically insignificant.


