
Potentiation with Overspeed for Jump Height Enhancement: An Analysis of Factors Distinguishing Responders from Non-Responders


Abstract
:Featured Application
Abstract
1. Introduction
2. Materials and Methods
2.1. Sample Size Calculations
2.2. Participants
2.3. Study Design
2.4. Measurements
2.4.1. Body Morphology
2.4.2. Jump Testing
2.4.3. Eccentric Utilization Ratio (EUR)
2.4.4. Limb Symmetry Index (LSI)
2.4.5. One-Repetition Max in the Back Squat
2.5. Conditioning Activity
2.6. Statistical Analysis
3. Results
4. Discussion
5. Conclusions
Author Contributions
Funding
Institutional Review Board Statement
Informed Consent Statement
Data Availability Statement
Conflicts of Interest
References
- Blazevich, A.J.; Babault, N. Post-activation potentiation versus post activation performance enhancement in humans: Historical perspective under lying mechanisms, and current issues. Front. Physiol. 2019, 10, 1359. [Google Scholar] [CrossRef]
- Prieske, O.; Behrens, M.; Chaabene, H.; Granacher, U.; Maffiuletti, N.A. Time to differentiate postactivation “potentiation” from “performance enhancement” in the strength and conditioning community. Sports Med. 2020, 50, 1559–1565. [Google Scholar] [CrossRef] [PubMed]
- Boullosa, D. Post-activation performance enhancement strategies in sport: A brief review for practitioners. Hum. Mov. 2021, 22, 101–109. [Google Scholar] [CrossRef]
- Dobbs, W.C.; Tolusso, D.V.; Fedewa, M.V.; Esco, M.R. Effect of postactivation potentiation on explosive vertical jump: A systematic review and meta-analysis. J. Strength Cond. Res. 2019, 33, 2009–2018. [Google Scholar] [CrossRef] [PubMed]
- Rassier, D.E.; Macintosh, B.R. Coexistence of potentiation and fatigue in skeletal muscle. Braz. J. Med. Biol. Res. 2000, 33, 499–508. [Google Scholar] [CrossRef] [PubMed]
- dos Santos Silva, D.; Boullosa, D.; Moura Pereira, E.V.; de Jesus Alves, M.D.; de Sousa Fernandes, M.S.; Badicu, G.; de Souza, R.F. Post-activation performance enhancement effect of drop jump on long jump performance during competition. Sci. Rep. 2023, 13, 16993. [Google Scholar] [CrossRef]
- Garbisu-Hualde, A.; Santos-Concejero, J. Post-activation potentiation in strength training: A systematic review of the scientific literature. J. Hum. Kinet. 2021, 78, 141–150. [Google Scholar] [CrossRef]
- Seitz, L.B.; Haff, G.G. Factors modulating post-activation potentiation of jump, sprint, throw, and upper-body ballistic performances: A systematic review with meta-analysis. Sports Med. 2016, 46, 231–240. [Google Scholar] [CrossRef]
- Formiglio, E.; Patti, A.; Fernández-Peña, E.; Giustino, V.; Vicari, D.S.S.; Tamassia, A.; Gervasi, M. The effects of multiple factors on post-activation potentiation and performance enhancement: A narrative review: Factors affecting potentiation in post-activation. Acta Kinesiol. 2024, 18, 75–91. [Google Scholar] [CrossRef]
- Đurović, M.; Stojanović, N.; Stojiljković, N.; Karaula, D.; Okičić, T. The effectsof post-activation performance enhancement and different warm-up protocols on swim start performance. Sci. Rep. 2022, 12, 9038. [Google Scholar] [CrossRef]
- Harat, I.; Clark, N.W.; Boffey, D.; Herring, C.H.; Goldstein, E.R.; Redd, M.J.; Wells, A.J.; Stout, J.R.; Fukuda, D.H. Dynamic post-activation potentiation protocol improves rowing performance in experienced female rowers. J. Sports Sci. 2020, 38, 1615–1623. [Google Scholar] [CrossRef] [PubMed]
- Koźlenia, D.; Domaradzki, J. Postsubmaximal Isometric Full Squat Jump Potentiation in Trained Men. J. Strength Cond. Res. 2024, 38, 459–464. [Google Scholar] [CrossRef] [PubMed]
- Wilson, J.M.; Duncan, N.M.; Marin, P.J.; Brown, L.E.; Loenneke, J.P.; Wilson, S.M.; Jo, E.; Lowery, R.P.; Ugrinowitsch, C. Meta-analysis of postactivation potentiation and power: Effects of conditioning activity, volume, gender, rest periods, and training status. J. Strength Cond. Res. 2013, 27, 854–859. [Google Scholar] [CrossRef] [PubMed]
- Krzysztofik, M.; Wilk, M. The effects of plyometric conditioning on post-activation bench press performance. J. Hum. Kinet. 2020, 74, 99–108. [Google Scholar] [CrossRef] [PubMed]
- Stien, N.; Strate, M.; Andersen, V.; Saeterbakken, A.H. Effects of Overspeed or Overload Plyometric Training on Jump Height and Lifting Velocity. Sports Med. Int. Open. 2020, 4, E32–E38. [Google Scholar] [CrossRef] [PubMed] [PubMed Central]
- Sheppard, J.M.; Dingley, A.A.; Janssen, I.; Spratford, W.; Chapman, D.W.; Newton, R.U. The effect of assisted jumping on vertical jump height in high-performance volleyball players. J. Sci. Med. Sport. 2011, 14, 85–89. [Google Scholar] [CrossRef] [PubMed]
- Makaruk, H.; Starzak, M.; Suchecki, B.; Czaplicki, M.; Stojiljković, N. The Effects of Assisted and Resisted Plyometric Training Programs on Vertical Jump Performance in Adults: A Systematic Review and Meta-Analysis. J. Sports Sci. Med. 2020, 19, 347–357. [Google Scholar] [PubMed] [PubMed Central]
- Markovic, S.; Mirkov, D.M.; Knezevic, O.M.; Jaric, S. Jump training with different loads: Effects on jumping performance and power output. Eur. J. Appl. Physiol. 2013, 113, 2511–2521. [Google Scholar] [CrossRef] [PubMed]
- Chiu, L.Z.; Fry, A.C.; Weiss, L.W.; Schilling, B.K.; Brown, L.E.; Smith, S.L. Postactivation potentiation response in athletic and recreationally trained individuals. J. Strength Cond. Res. 2003, 17, 671–677. [Google Scholar]
- Sañudo, B.; De Hoyo, M.; Haff, G.G.; Muñoz-López, A. Influence of strength level on the acute post-activation performance enhancement following flywheel and free weight resistance training. Sensors 2020, 20, 7156. [Google Scholar] [CrossRef]
- Krzysztofik, M.; Wilk, M.; Pisz, A.; Kolinger, D.; Bichowska, M.; Zajac, A.; Stastny, P. Acute Effects of High-Load vs. Plyometric Conditioning Activity on Jumping Performance and the Muscle-Tendon Mechanical Properties. J. Strength Cond. Res. 2023, 37, 1397–1403. [Google Scholar] [CrossRef] [PubMed]
- Poulos, N.; Chaouachi, A.; Buchheit, M.; Slimani, D.; Haff, G.G.; Newton, R.U. Complex training and countermovement jump performance across multiple sets: Effect of back squat intensity. Kinesiology 2018, 50, 75–89. [Google Scholar]
- Kozinc, Ž.; Smajla, D.; Šarabon, N. Is larger eccentric utilization ratio associated with poorer rate of force development in squat jump? An exploratory study. Int. Biomech. 2024, 11, 1–5. [Google Scholar] [CrossRef] [PubMed]
- Whiteley, I.; Sideris, V.; Kotsifaki, R.; King, E.; Whiteley, R. The MyJump App is a Valid Method of Assessing and Classifying Limb Symmetry During Recovery from Anterior Cruciate Ligament Reconstruction. Int. J. Sports Phys. Ther. 2023, 18, 1156–1165. [Google Scholar] [CrossRef] [PubMed] [PubMed Central]
- Sergi, T.E.; Bode, K.B.; Hildebrand, D.A.; Dawes, J.J.; Joyce, J.M. Relationship between body mass index and health and occupational performance among law enforcement officers, firefighters, and military personnel: A systematic review. Curr. Dev. Nutr. 2023, 7, 100020. [Google Scholar] [CrossRef] [PubMed]
- Jiménez, J.; Morera, M.; Salazar, W.; Gabbard, C. Relationship between fundamental motor skill ability and body mass index in young adults. J. Mot. Learn. Dev. 2016, 4, 236–247. [Google Scholar] [CrossRef]
- Ciocca, G.; Tschan, H.; Tessitore, A. Effects of Post-Activation Performance Enhancement (PAPE) Induced by a Plyometric Protocol on Deceleration Performance. J. Hum. Kinet. 2021, 80, 5–16. [Google Scholar] [CrossRef]
- Staniszewski, M.; Tkaczyk, J.; Kęska, A.; Zybko, P.; Mróz, A. Effect of rest duration between sets on fatigue and recovery after short intense plyometric exercise. Sci. Rep. 2024, 14, 15080. [Google Scholar] [CrossRef] [PubMed]
- Faul, F.; Erdfelder, E.; Lang, A.G.; Buchner, A. G*Power 3: A flexible statistical power analysis program for the social, behavioral, and biomedical sciences. Behav. Res. Methods 2007, 39, 175–191. [Google Scholar] [CrossRef]
- Andrade, C. Sample Size and its Importance in Research. Indian. J. Psychol. Med. 2020, 42, 102–103. [Google Scholar] [CrossRef] [PubMed] [PubMed Central]
- Silva VS, D.; Vieira MF, S. International society for the advancement of kinanthropometry (ISAK) global: International accreditation scheme of the competent anthropometrist. Rev. Bras. Cineantropometria Desempenho Hum. 2020, 22, e70517. [Google Scholar] [CrossRef]
- Holmes, C.J.; Racette, S.B. The utility of body composition assessment in nutrition and clinical practice: An overview of current methodology. Nutrients 2021, 13, 2493. [Google Scholar] [CrossRef]
- McLester, C.N.; Nickerson, B.S.; Kliszczewicz, B.M.; McLester, J.R. Reliability and agreement of various inbody body composition analyzers as compared to dual-energy X-ray absorptiometry in healthy men and women. J. Clin. Densitom. 2020, 23, 443–450. [Google Scholar] [CrossRef] [PubMed]
- Comfort, P.; Jones, P.A.; McMahon, J.J. (Eds.) Performance Assessment in Strength and Conditioning; Routledge: London, UK, 2018. [Google Scholar]
- Petronijevic, M.S.; Garcia Ramos, A.; Mirkov, D.M.; Jaric, S.; Valdevit, Z.; Knezevic, O.M. Self-Preferred Initial Position Could Be a Viable Alternative to the Standard Squat Jump Testing Procedure. J. Strength Cond. Res. 2018, 32, 3267–3275. [Google Scholar] [CrossRef]
- Pueo, B.; Penichet-Tomas, A.; Jimenez-Olmedo, J.M. Reliability and validity of the Chronojump open-source jump mat system. Biol. Sport. 2020, 37, 255–259. [Google Scholar] [CrossRef] [PubMed] [PubMed Central]
- Jidovtseff, B.; Harris, N.K.; Crielaard, J.M.; Cronin, J.B. Using the load-velocity relationship for 1RM prediction. J. Strength Cond. Res. 2011, 25, 267–270. [Google Scholar] [CrossRef]
- Martínez-Cava, A.; Hernández-Belmonte, A.; Courel-Ibáñez, J.; Morán-Navarro, R.; González-Badillo, J.J.; Pallarés, J.G. Reliability of technologies to measure the barbell velocity: Implications for monitoring resistance training. PLoS ONE 2020, 15, e0232465. [Google Scholar]
- Signore, N. Calculating a one-rep max. In Velocity-Based Training: How to Apply Science, Technology, and Data to Maximize Performance; Human Kinetics: Champaign, IL, USA, 2021; pp. 73–74. [Google Scholar]
- Tran, T.T.; Brown, L.E.; Coburn, J.W.; Lynn, S.K.; Dabbs, N.C. Effects of assisted jumping on vertical jump parameters. Curr. Sports Med. Rep. 2012, 11, 155–159. [Google Scholar] [CrossRef]
- Markovic, G.; Vuk, S.; Jaric, S. Effects of jump training with negative versus positive loading on jumping mechanics. Int. J. Sports Med. 2011, 32, 365–372. [Google Scholar] [CrossRef]
- Wilson, J.; Kritz, M. Practical guidelines and considerations for the use of elastic bands in strength and conditioning. Strength Cond. J. 2014, 36, 1–9. [Google Scholar] [CrossRef]
- Cohen, J. Statistical Power Analysis for the Behavioral Sciences, 2nd ed.; Lawrence Erlbaum Associates: Mahwah, NJ, USA, 1988. [Google Scholar]
- Domaradzki, J.; Koźlenia, D.; Popowczak, M. The Prevalence of Responders and Non-Responders for Body Composition, Resting Blood Pressure, Musculoskeletal, and Cardiorespiratory Fitness after Ten Weeks of School-Based High-Intensity Interval Training in Adolescents. J. Clin. Med. 2023, 12, 4204. [Google Scholar] [CrossRef] [PubMed]
- Barreto MV, C.; Telles JF, D.S.; de Castro, M.R.; Mendes, T.T.; Rodrigues, C.P.; de Freitas, V.H. Temporal response of post-activation performance enhancement induced by a plyometric conditioning activity. Front. Sports Act. Living 2023, 5, 1209960. [Google Scholar] [CrossRef] [PubMed]
- Tobin, D.P.; Delahunt, E. The acute effect of a plyometric stimulus on jump performance in professional rugby players. J. Strength Cond. Res. 2014, 28, 367–372. [Google Scholar] [CrossRef] [PubMed]
- Sharma, S.K.; Raza, S.; Moiz, J.A.; Verma, S.; Naqvi, I.H.; Anwer, S.; Alghadir, A.H. Postactivation Potentiation Following Acute Bouts of Plyometric versus Heavy-Resistance Exercise in Collegiate Soccer Players. Biomed. Res. Int. 2018, 2018, 3719039. [Google Scholar] [CrossRef] [PubMed]
- Bogdanis, G.C.; Tsoukos, A.; Veligekas, P. Improvement of Long-Jump Performance During Competition Using a Plyometric Exercise. Int. J. Sports Physiol. Perform. 2017, 12, 235–240. [Google Scholar] [CrossRef] [PubMed]
- Berryman, N.; Maurel, D.B.; Bosquet, L. Effect of plyometric vs. dynamic weight training on the energy cost of running. J. Strength Cond. Res. 2010, 24, 1818–1825. [Google Scholar] [CrossRef] [PubMed]
- Guo, W.; Liang, M.; Lin, J.; Zhou, R.; Zhao, N.; Aidar, F.J.; Badicu, G. Time duration of post-activation performance enhancement (PAPE) in elite male sprinters with different strength levels. Children 2022, 10, 53. [Google Scholar] [CrossRef] [PubMed]
- Tillin, N.A.; Bishop, D. Factors modulating post-activation potentiation and its effect on performance of subsequent explosive activities. Sports Med. 2009, 39, 147–166. [Google Scholar] [CrossRef]
- Masel, S.; Maciejczyk, M. Effects of post-activation performance enhancement on jump performance in elite volleyball players. Appl. Sci. 2022, 12, 9054. [Google Scholar] [CrossRef]
- Berning, J.M.; Adams, K.J.; DeBeliso, M.; Sevene-Adams, P.G.; Harris, C.; Stamford, B.A. Effect of Functional Isometric Squats on Vertical Jump in Trained and Untrained Men. J. Strength Cond. Res. 2010, 24, 2285–2289. [Google Scholar] [CrossRef]
- Liossis, L.D.; Forsyth, J.; Liossis, C.; Tsolakis, C. The acute effect of upper-body complex training on power output of martial art athletes as measured by the bench press throw exercise. J. Hum. Kinet. 2013, 39, 167–175. [Google Scholar] [CrossRef]
- Koźlenia, D.; Struzik, A.; Domaradzki, J. Force, power, and morphology asymmetries as injury risk factors in physically active men and women. Symmetry 2022, 14, 787. [Google Scholar] [CrossRef]
- Aagaard, P. Training-induced changes in neural function. Exerc. Sport Sci. Rev. 2003, 31, 61–67. [Google Scholar] [CrossRef]
- Ebben, W.P. Complex training: A brief review. J. Sports Sci. Med. 2002, 1, 42–46. [Google Scholar]
- Abidin, N.Z.; Adam, M.B. Prediction of vertical jump height from anthropometric factors in male and female martial arts athletes. Malays. J. Med. Sci. MJMS 2013, 20, 39. [Google Scholar]
- Puthoff, M.L. The relationship between lower body strength and obesity in older adults. Obesity 2008, 16, 1199–1203. [Google Scholar]
- Oja, P.; Titze, S.; Kokko, S.; Kujala, U.M.; Heinonen, A.; Kelly, P.; Foster, C. Health benefits of different sport disciplines for adults: Systematic review of observational and intervention studies with meta-analysis. Br. J. Sports Med. 2013, 49, 434–440. [Google Scholar] [CrossRef] [PubMed]


| Variable | Mean ± SD (95% CI) |
|---|---|
| Body height (cm) | 183.9 ± 25.3 (165.7–202) |
| Body weight (kg) | 74.2 ± 12.1 (65.6–82.8) |
| BMI (kg/m2) | 22.4 ± 4 (19.6–25.2) |
| Back squat 1 repetition max (kg) | 117.4 ± 31.4 (94.9–139.9) |
| Relative strength (1 RM/body weight; kg) | 156.2 ± 26.7 (137.1–175.2) |
| Gym experience (years) | 3.5 ± 1.8 (2.2–4.8) |
| Training volume/week (minute) | 321 ± 118.4 (236.3–405.7) |
| Countermovement jump (cm) | 35.3 ± 6.3 (30.8–39.8) |
| Eccentric utilization ratio (cm) | 1.0 ± 0.1 (0.9–1.1) |
| Limb symmetry index (%) | 97.1 ± 8 (91.4–102.8) |
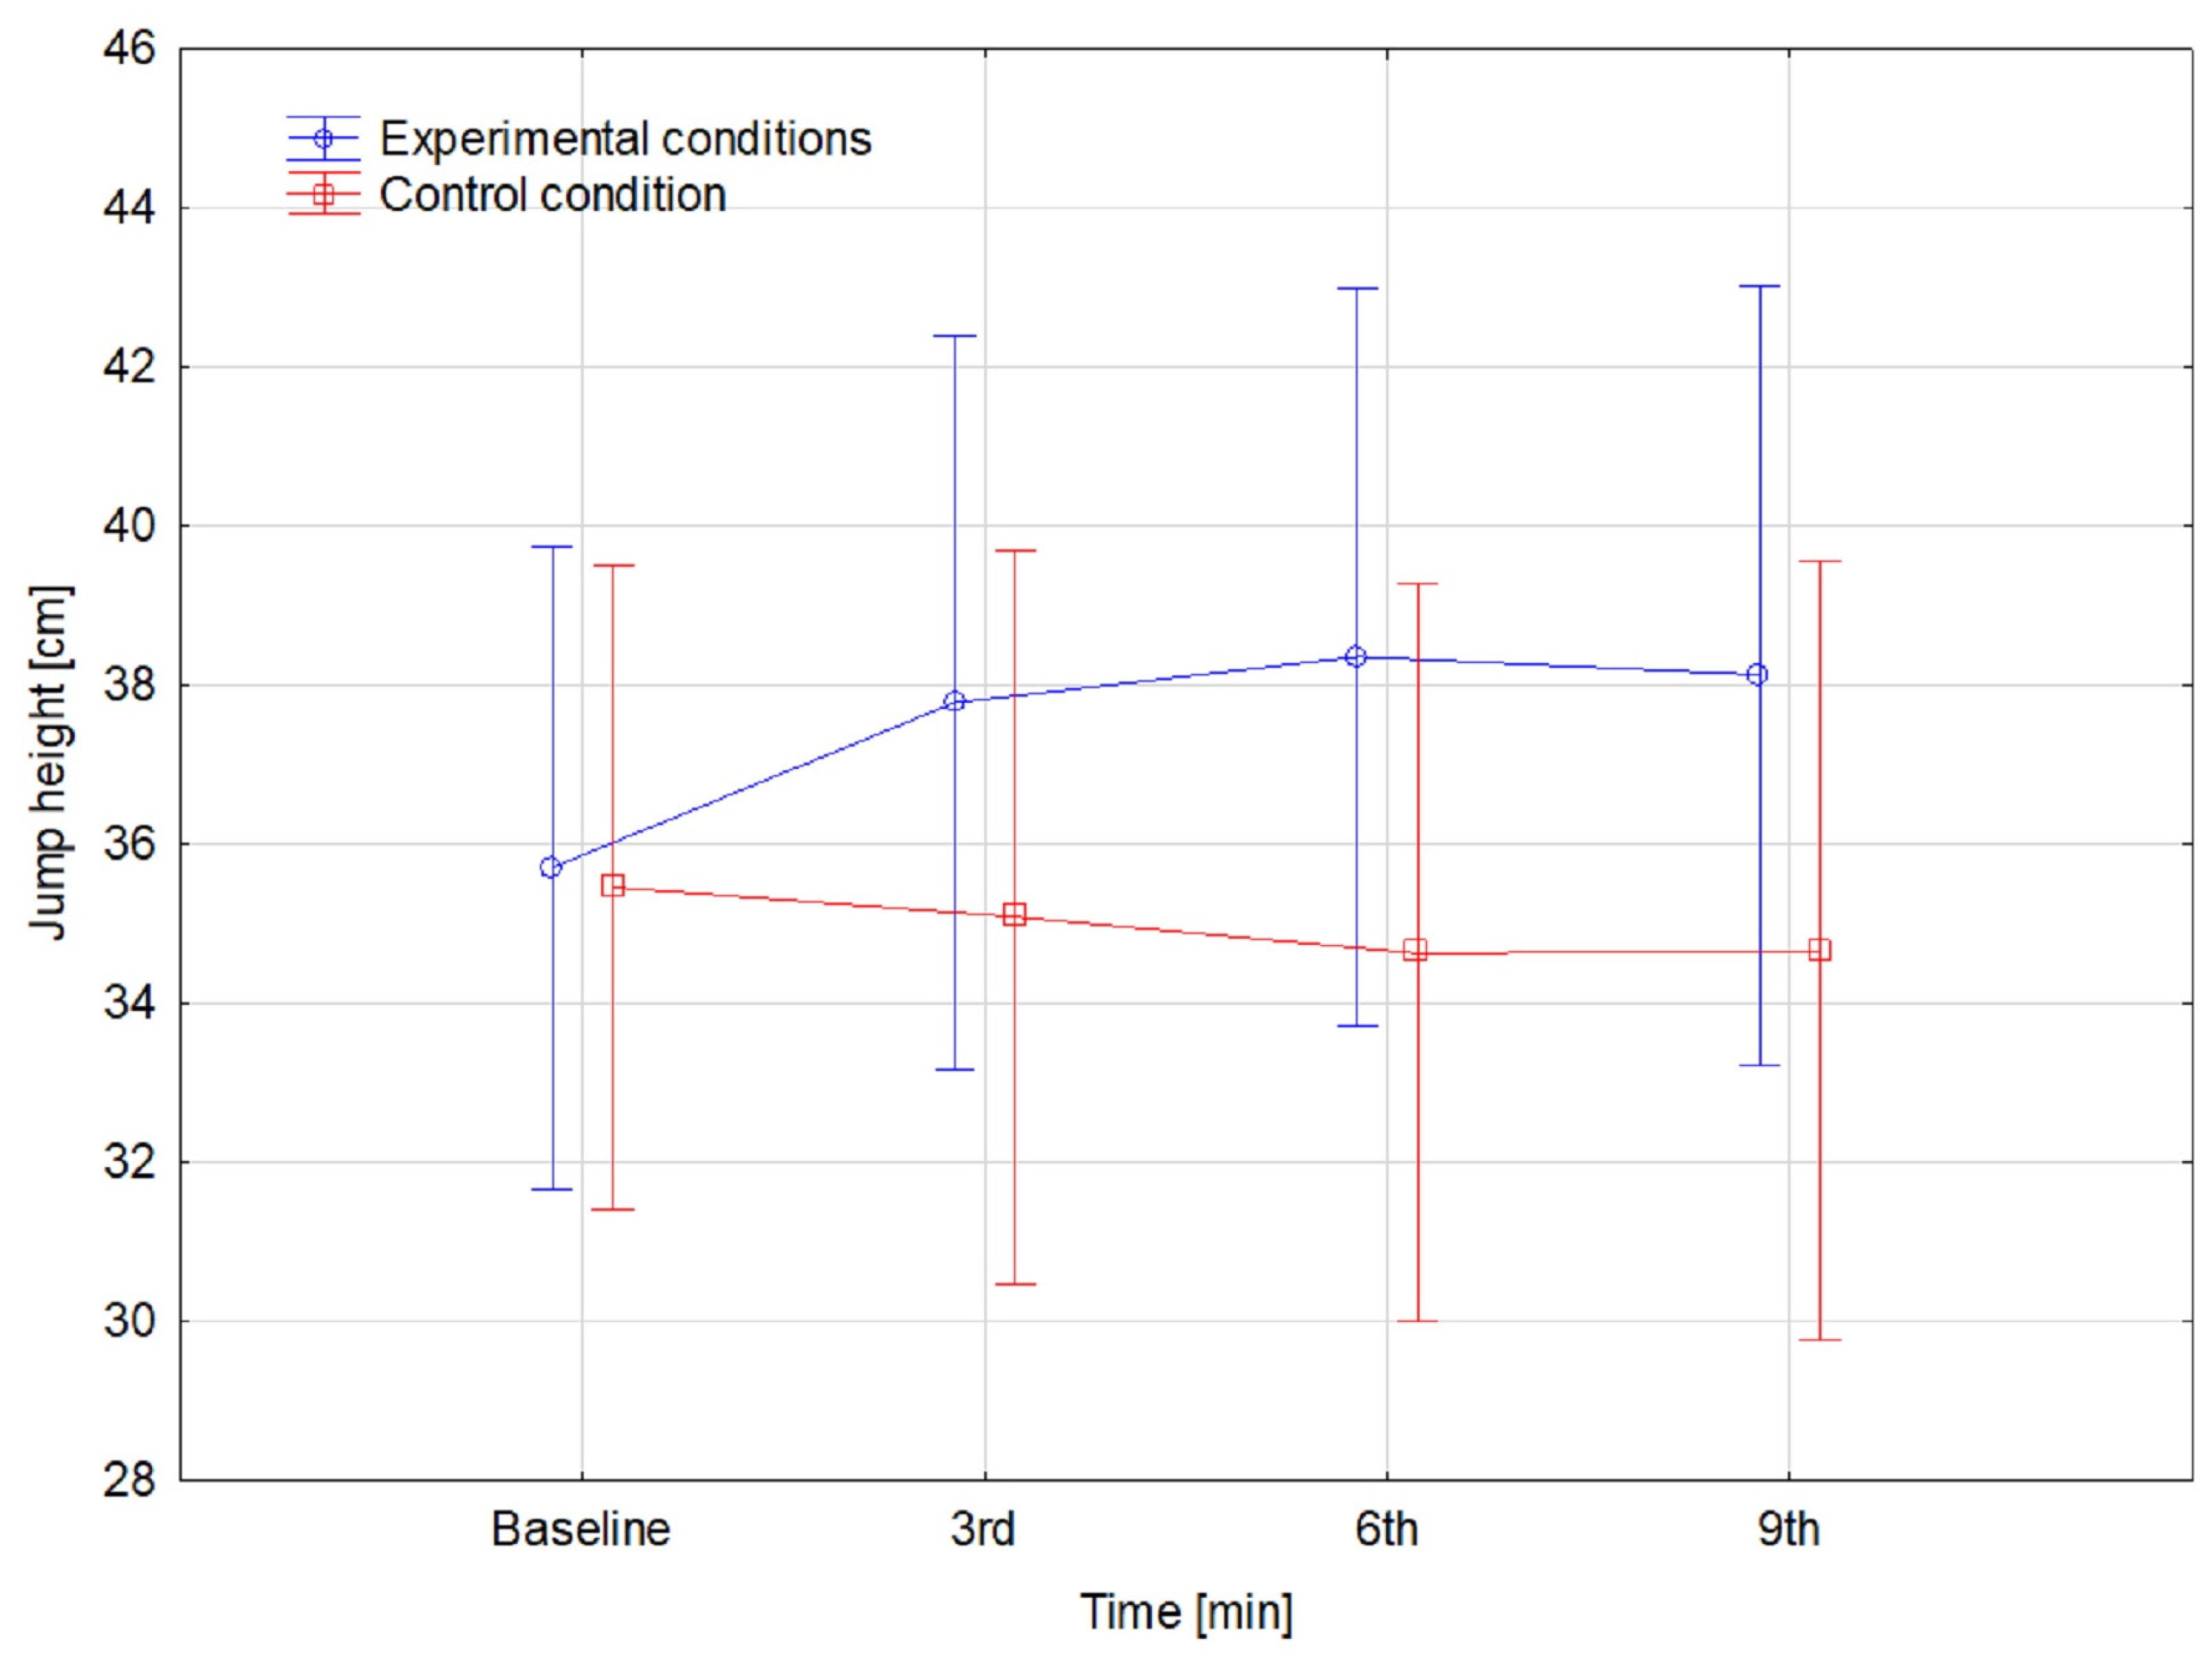
| Time (min) | Experimental | Control |
|---|---|---|
| Mean ± SD (95% CI) | ||
| Baseline (cm) | 35.7 ± 6.1 (31.3–40.1) | 35.5 ± 6.1 (31.1–39.8) |
| 3rd (cm) | 37.8 ± 7.8 (32.2–43.4) | 35.1 ± 6 (30.8–39.4) |
| 6th (cm) | 38.4 ± 7.4 (33.1–43.6) | 34.6 ± 6.5 (29.9–39.3) |
| 9th (cm) | 38.1 ± 8.6 (32–44.3) | 34.7 ± 6 (30.4–38.9) |
| Variable | Responders | Non-Responders | ES | t | p |
|---|---|---|---|---|---|
| Mean ± SD (95% CI) | |||||
| BMI (kg/m2) | 21 ± 5.4 (14.3–27.6) | 23.9 ± 1 (22.6–25.1) | 0.75 | 1.19 | 0.27 |
| Back squat 1 repetition max (kg) | 122.4 ± 33.6 (80.7–164.1) | 112.4 ± 32.1 (72.6–152.2) | −0.30 | −0.48 | 0.64 |
| Relative strength (1 RM/body weight; kg) | 166.5 ± 27 (133.1–200) | 145.8 ± 24.6 (115.3–176.3) | −0.80 | −1.27 | 0.24 |
| Gym experience (years) | 4 ± 2 (1.5–6.5) | 3.0 ± 1.7 (0.8–5.2) | −0.53 | −0.85 | 0.42 |
| Training volume/week (minute) | 336 ± 131.5 (172.8–499.2) | 306 ± 117 (160.8–451.2) | −0.24 | −0.38 | 0.71 |
| Countermovement jump (cm) | 37.6 ± 7.8 (28–47.2) | 33.1 ± 3.9 (28.2–37.9) | −0.74 | −1.17 | 0.28 |
| Squat jump baseline (cm) | 37.5 ± 6.5 (29.5–45.6) | 33.9 ± 5.8 (26.7–41.1) | −0.59 | −0.94 | 0.37 |
| Eccentric utilization ratio (units) | 1 ± 0.1 (0.9–1.1) | 1 ± 0.1 (0.8–1.2) | −0.08 | −0.13 | 0.9 |
| Limb symmetry index (%) | 99.4 ± 10.8 (85.9–112.8) | 94.8 ± 3.7 (90.2–99.5) | −0.56 | −0.89 | 0.4 |
Disclaimer/Publisher’s Note: The statements, opinions and data contained in all publications are solely those of the individual author(s) and contributor(s) and not of MDPI and/or the editor(s). MDPI and/or the editor(s) disclaim responsibility for any injury to people or property resulting from any ideas, methods, instructions or products referred to in the content. |
© 2024 by the authors. Licensee MDPI, Basel, Switzerland. This article is an open access article distributed under the terms and conditions of the Creative Commons Attribution (CC BY) license (https://creativecommons.org/licenses/by/4.0/).
Share and Cite
Koźlenia, D.; Domaradzki, J. Potentiation with Overspeed for Jump Height Enhancement: An Analysis of Factors Distinguishing Responders from Non-Responders. Appl. Sci. 2024, 14, 6618. https://doi.org/10.3390/app14156618
Koźlenia D, Domaradzki J. Potentiation with Overspeed for Jump Height Enhancement: An Analysis of Factors Distinguishing Responders from Non-Responders. Applied Sciences. 2024; 14(15):6618. https://doi.org/10.3390/app14156618
Chicago/Turabian StyleKoźlenia, Dawid, and Jarosław Domaradzki. 2024. "Potentiation with Overspeed for Jump Height Enhancement: An Analysis of Factors Distinguishing Responders from Non-Responders" Applied Sciences 14, no. 15: 6618. https://doi.org/10.3390/app14156618