Abstract
In the field of handling, storage and transportation, chutes are used to transfer bulk solids between conveyors and warehouses. In these systems, traditional analytical methods based on the principles of continuum mechanics approximate an accelerated flow that contains the physical body solid properties obtained from standardized tests. Because it is difficult to physically observe the flow inside the transfer structure, there have been few studies to validate the method at full scale. In contrast, discrete element modeling (DEM) allows flow visualization through a transfer chute and qualitative and quantitative analysis if accurate simulation parameters are selected. In order to adapt to the needs of modern intelligent warehousing, we reduced the grain crushing and damage in the process of grain storage. To design and investigate the motion performance of grain particles in a sliding dustpan, this paper utilizes rocky simulation technology, combined with the corresponding bench experiments, to study the impact of the angle arrangement of the dustpan, and to verify the results of the simulation analysis based on the stress–strain analysis of the particle impact. It was found that when the angle of the dustpan arrangement was 40 degrees, the flow of all particles had a better performance in terms of pass ability and energy loss. In the continuous cycle obtained from the simulation, the particle group state at each moment is almost the same as the particle characteristics in the experiment, indicating that the angle of the bucket has an effect on the particle permeability. In this paper, the results of the study on the state of the grain group on the silo device will provide a useful reference for the design of a grain silo device.
1. Introduction
With the development of silo construction, the demand for large silos is also increasing. When the size of silos continues to increase, the vertical drop of grain particles in the process of loading and unloading of silos is large, the extrusion collision between particles and particles and silos is large, and the grain particles will be broken to a certain extent, especially the large particles of corn and soybeans, and the crushing rate can even reach 20–30%. Due to the small footprint of silos, large capacity convenient mechanized and automated operations, low circulation costs and good sealing performance, it is widely used in food, chemical, building materials, metallurgy, coal and other fields.
This study found that before harvest, the damage to grain mainly came from irresistible factors such as insect pests and bad weather, which accounted for a small amount of the total damage to grain, while after receiving, the main source of grain damage was the mechanical damage caused by the harvest process and the transportation process. The chute device is used to transport bulk solids between conveyors, based on the principle of continuum mechanics to transfer materials from the standard conveying state [1], and to analyze the flow state of materials and grain crushing in grain transportation [2]. The causes of corn crushing were studied and analyzed. The most effective measures to reduce the crushing of corn grains in the silo were to set buffer devices in the silo and control the decline rate of grain. Simulation analysis of material handling used DEM [3]. The influence of oblique conveys the angle and section size on a material conveying track. The transport behavior of bulk solid materials during discharge is directly affected by the interaction of material properties and the shape of the transport transition area [4]. Specification customization of material handling boundaries requires consideration of the wear and life-related sensitivities of the device [5,6], flow analysis of material transport [7], a state analysis under the chute loading device [8], a numerical analysis of particle groups in collective motion [9] and the conveying flow capacity and accuracy of the conveying chute [10]. The method of testing and modeling the device [11] analyzes the vertical conveying portion [12,13] of the conveying silo device after the conveyor. At present, intelligent transportation for grain and other particle structures’ structural mechanical characteristics and crushing mechanism research cannot meet the increasing intelligent equipment development status. Therefore, it is of great significance that we carry out research with related devices and their influencing factors.
In this paper, a combination of theory, simulation and experiment is used to analyze the anti-crushing impact of grain warehousing, study the impact load of free fall into the material, design the multi-stage bucket to slow down, effectively control the material speed and further optimize the selection of the angle arrangement of the bucket under the action of the multi-stage sliding bucket on the impact load. A theoretical analysis of multi-stage collision slow-down theory, slowing down and extending the conveying path, combined with simulation and experimental analysis, effectively controls the material conveying collision, to achieve the steady-state slow-down goal. The impact characteristics and influencing factors of grain warehousing were further studied, in order to explore the movement of grain in the process of warehousing on the folding roller.
2. Theoretical Analysis of Grain Crushing
2.1. Extension of the Material Transportation Path to Prevent Crushing
In recent years, the experimental research and practice of grain engineering technicians have found that setting buffer equipment on the warehousing path to reduce particle speed and impact can greatly reduce the crushing rate of grain, and the experiment has verified that the intervention of mechanical equipment with reasonable structure can reduce the crushing rate of grain to less than 3%. The methods used in the industry are as follows: the method of reducing the height of food free fall by grabbing or lifting, the method of reducing the flow rate and impact of food by buffering and the method of using part of the gravitational potential energy through friction to reduce the impact.
Crushing during grain conveying is related to the variety of grain, the drying process of the grain and the conveying equipment. A few of the important factors are breakage by force and particle collisions within the grain group.
According to Newton’s equation of motion, the external force on an object is as follows:
where m is the weight of the object; dv is the change in the velocity of the object; and dt is the change in the time of application of the force.
As shown in Figure 1’s comparison analysis, the comparative analysis shows that the impact velocity of particle groups can be reduced by extracting from EDEM2019 software, and the energy loss can be 60% to reduce the kinetic energy impact crushing. In the case of ensuring transportation efficiency, the transportation path can be extended by about 25% by using soft ruler measurement. Assuming that the collision between particles and particles or with the warehouse for the complete inelastic collision, the collision of particles after the motion velocity is zero. The formula can be seen, and the particle force is proportional to its speed of movement and inversely proportional to the time of collision. Therefore, the problem of controlling particle crushing can be decomposed into controlling the flow velocity of particles and extending the collision time between particles and warehouses.
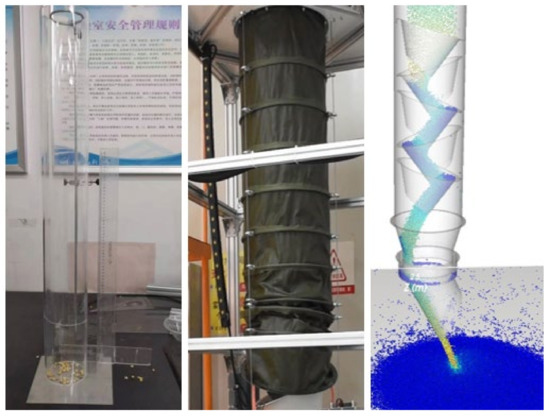
Figure 1.
Acrylic cylinder, skid and simulation path lengths.
2.2. Theoretical Analysis of Multi-Stage Collision for Particle Transportation
The key factors affecting the rheological properties of particle groups are particle size composition and volume. The continuum mechanical description of particle groups is studied by establishing the relationship between stress and strain. It is found that with the decrease in particle size and the increase in volume, the velocity profile of particle flow changes from linear to nonlinear. The shear rate also increases significantly with the increase in conveying particle depth. It is found that the formation of a force chain network in the conveying process can reduce the breakage to some extent.
The relationship between cyclic stress and strain for steady-state cyclic deformation under multi-stage collisions of particles can be approximated by the power function of the following equation:
where is the cyclic stress amplitude; is the cyclic strain amplitude; is the cyclic strength coefficient; is the cyclic strain index. From this, we can obtain the approximate expression of the multi-stage steady-state cycling curve in the grain transportation process, as follows:
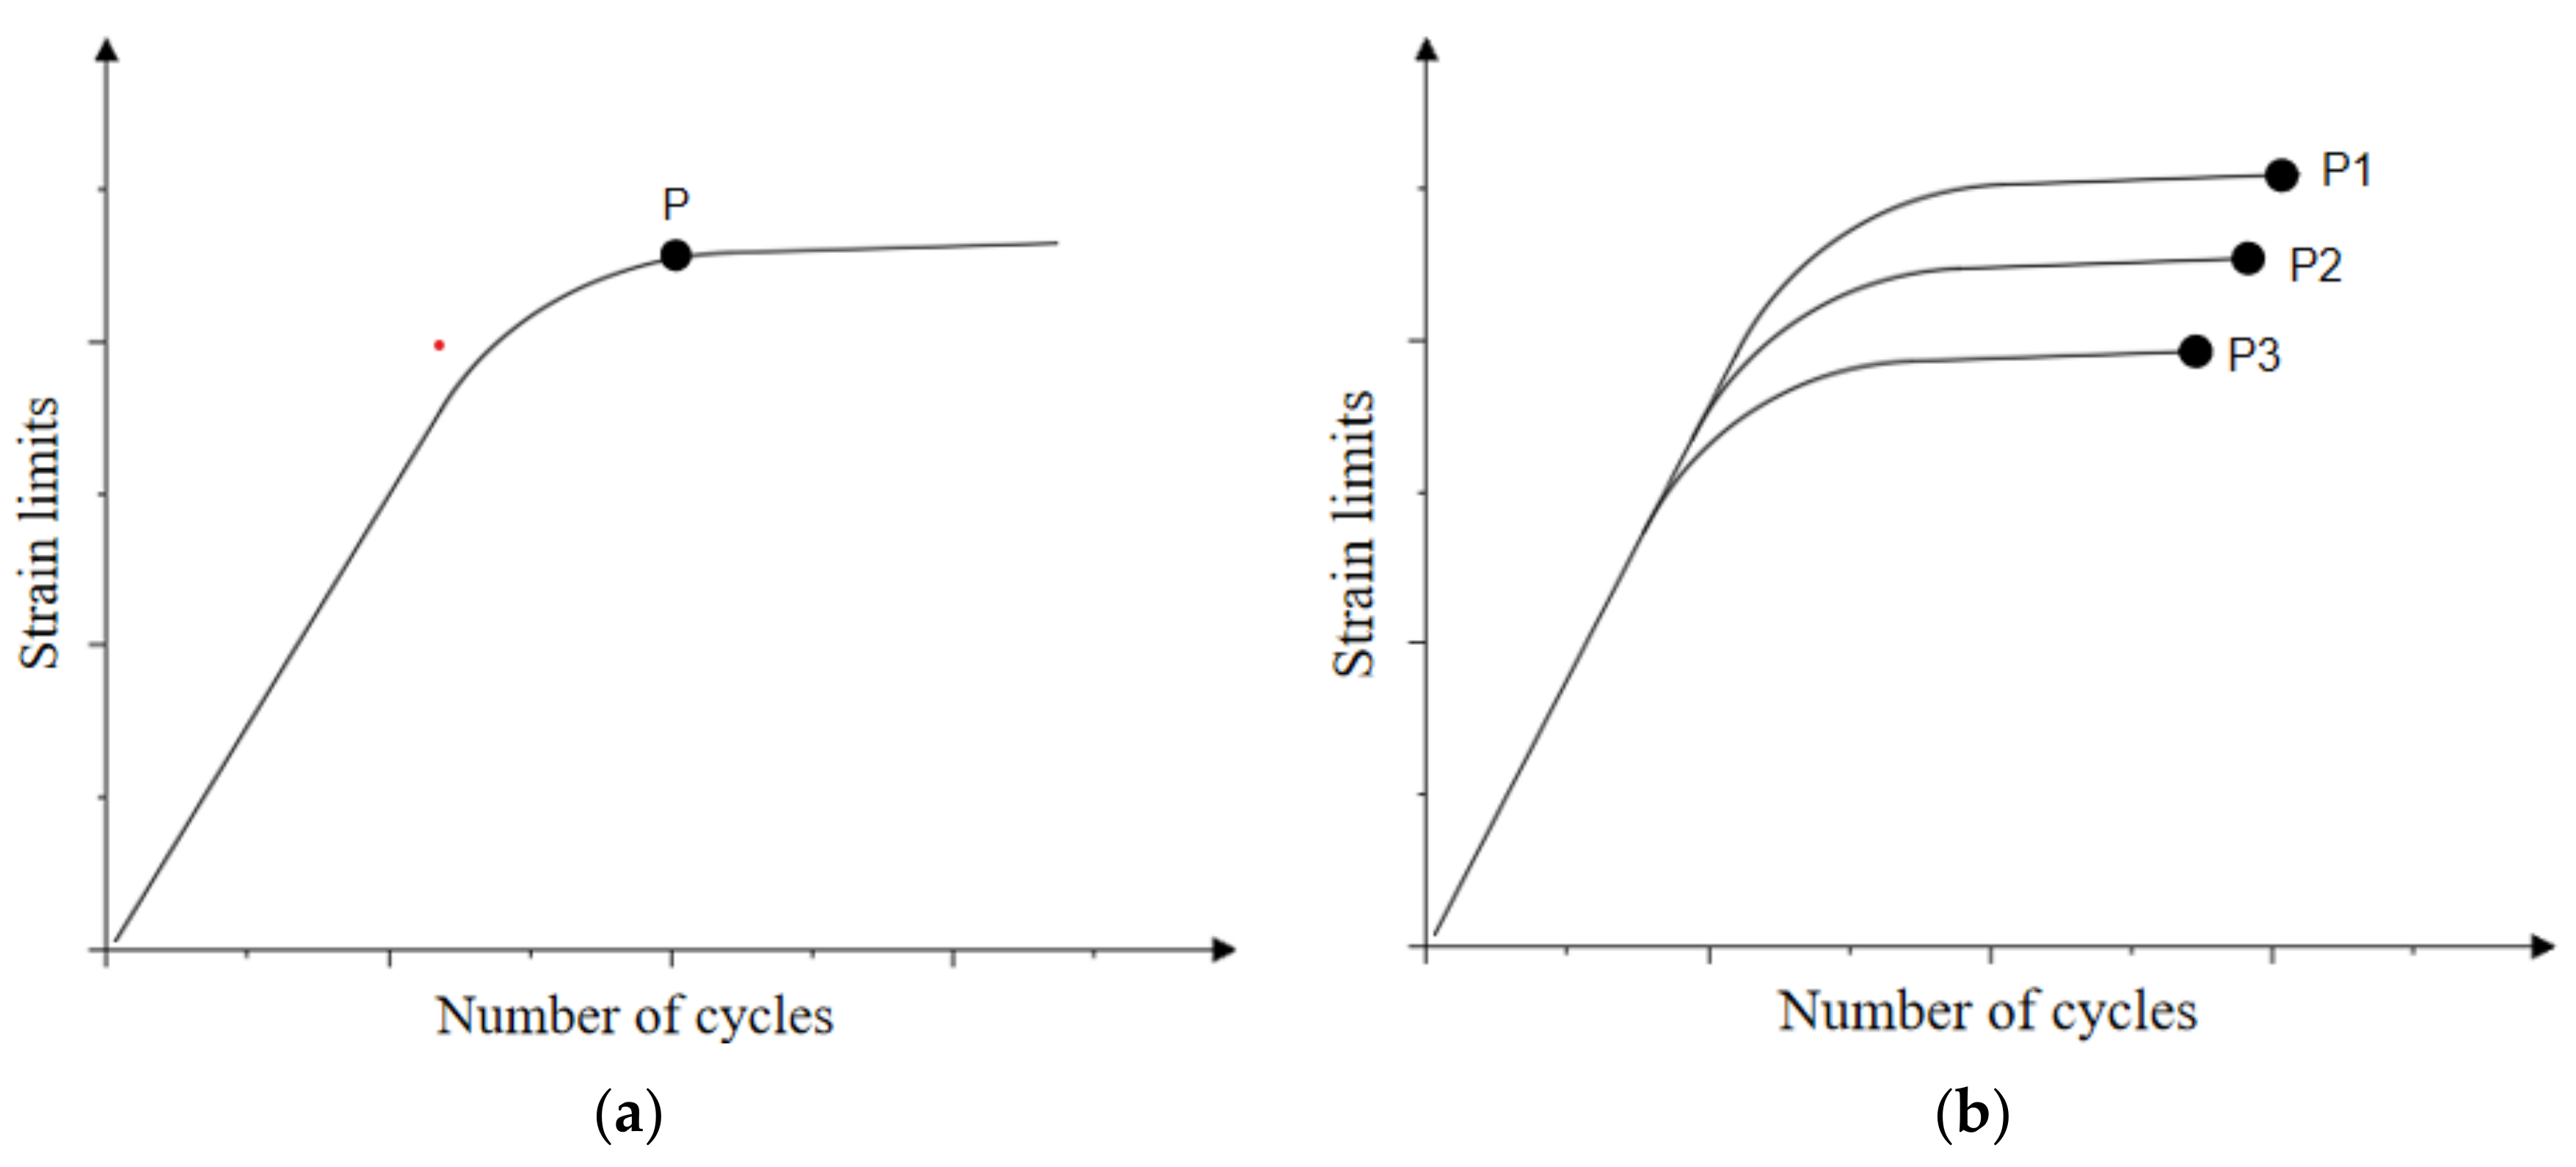
After the cycle reaches stability, the transient cyclic stress–strain relationship tends to stabilize in the study of dynamic cycling in this stable form to achieve an adjustable conveying effect. The linear deformation of cyclic transient morphology is different, and the crushing damage limit is slightly different in multiple deformations and different moisture content, different temperature and humidity states. Laboratory measurements show that after multiple cyclic transient collisions, with the increase in the number of cycles, the particle energy accumulation reaches the P-point saturation state, resulting in rupture or fragmentation. As shown in Figure 2 below:
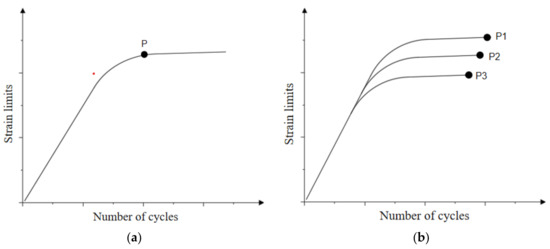
Figure 2.
Stress–strain curve for cumulative transient impact damage crushing. (a) Under different states of water content; (b) under temperature and humidity differences.
According to the rheological characteristics of the particle group, in the state of the material flow to form a stable flow of power chain, the particle group is stable through the skid dustpan into the silo micro-cluster cohesion. Thus, multi-stage collision cumulative fatigue crushing theory can be used to prevent crushing of the device angle parameter design and device layout to provide a reference guide, and can be analyzed through the formation of the force chain between the particles, the interaction of wall friction and other factors to predict the control conditions of the particle damage and the control parameters for stabilized conveying.
2.3. Theoretical Analysis of Particle Collision Behavior
The oblique collision of grain particles with the wall surface is shown in Figure 3. Due to the irregular shape of grain particles, non-spherical particles and dustpan surface contact with the actual normal direction and the normal direction of the dustpan surface deviation, from the deviation of the wall of the extension of the virtual wall, assuming that the angle with the original wall is β, the particles and the collision process of the wall are in line with the collision process of the spherical particles, which satisfies the following equation:
where is the kinetic friction factor between the particle and the pipe wall; is the radius of the particle, mm; is the corrected tangential rebound velocity, m/s; is the corrected normal rebound velocity, m/s; ω is the particle rebound rotational velocity, rad/s; is the corrected particle rebound rotational velocity, rad/s; is the judgment function of the direction of the particle’s relative velocity to the wall, writing Equation (7); is the corrected after tangential initial velocity, m/s, writing Equation (8); is the corrected normal initial velocity, m/s, writing Equation (9).
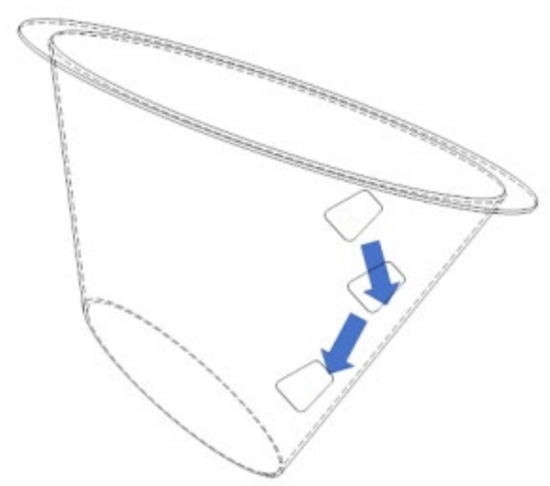
Figure 3.
Collision trajectories of grain particles with dustpan walls.
3. Discrete Element Simulation Analysis of Grain Crushing
3.1. Discrete Element Analysis
Bulk particles use Newton’s second law, which describes particle motion, and particle translation and rotation are described by the translational and rotational equations of the control, respectively.
where m is the particle mass; v is the particle velocity; F is the force; I is the rotational moment of inertia; ω is the angular velocity; r is the vector distance from the particle center; M is the moment; the subscripts i and j represent the particle serial number; the subscripts n and t represent the normal and tangential directions, respectively; and the subscripts g and e represent the gravitational force and the non-contact force, respectively. The particle–particle and particle–wall interaction forces and moments are calculated by the contact model. In this paper, the Hertz–Mindlin no-slip contact model is used for the study. The Hertz–Mindlin model is more accurate, simple and robust, and is more common in bulk particle analysis. This model excludes surface forces such as van der Waals interaction attraction, so it is a reasonable assumption for the particle study of the current simulation because compared to the dielectric contact force, any cohesive force is considered sufficiently small. The normal force in the contact model includes the normal elastic force and the normal damping force , as in the following equation:
where are equivalent-like modulus, equivalent diameter and equivalent mass, respectively; and are normal overlap and normal damping coefficient, respectively; n is normal unit vector, defined as shown in Figure 4. Figure 4 shows the schematic diagram of the collision between the material and the wall, only considering the motion collision analysis in the advection state.
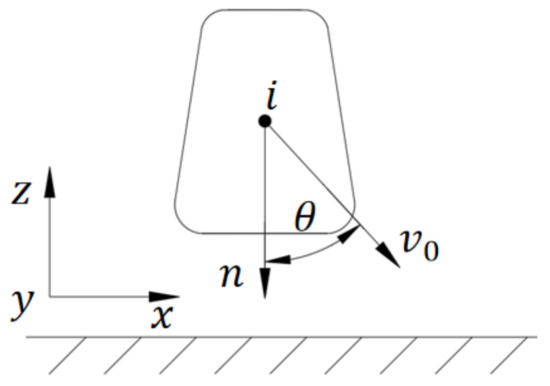
Figure 4.
Schematic diagram of the collision of corn particles with the wall surface.
3.2. Simulation Analysis
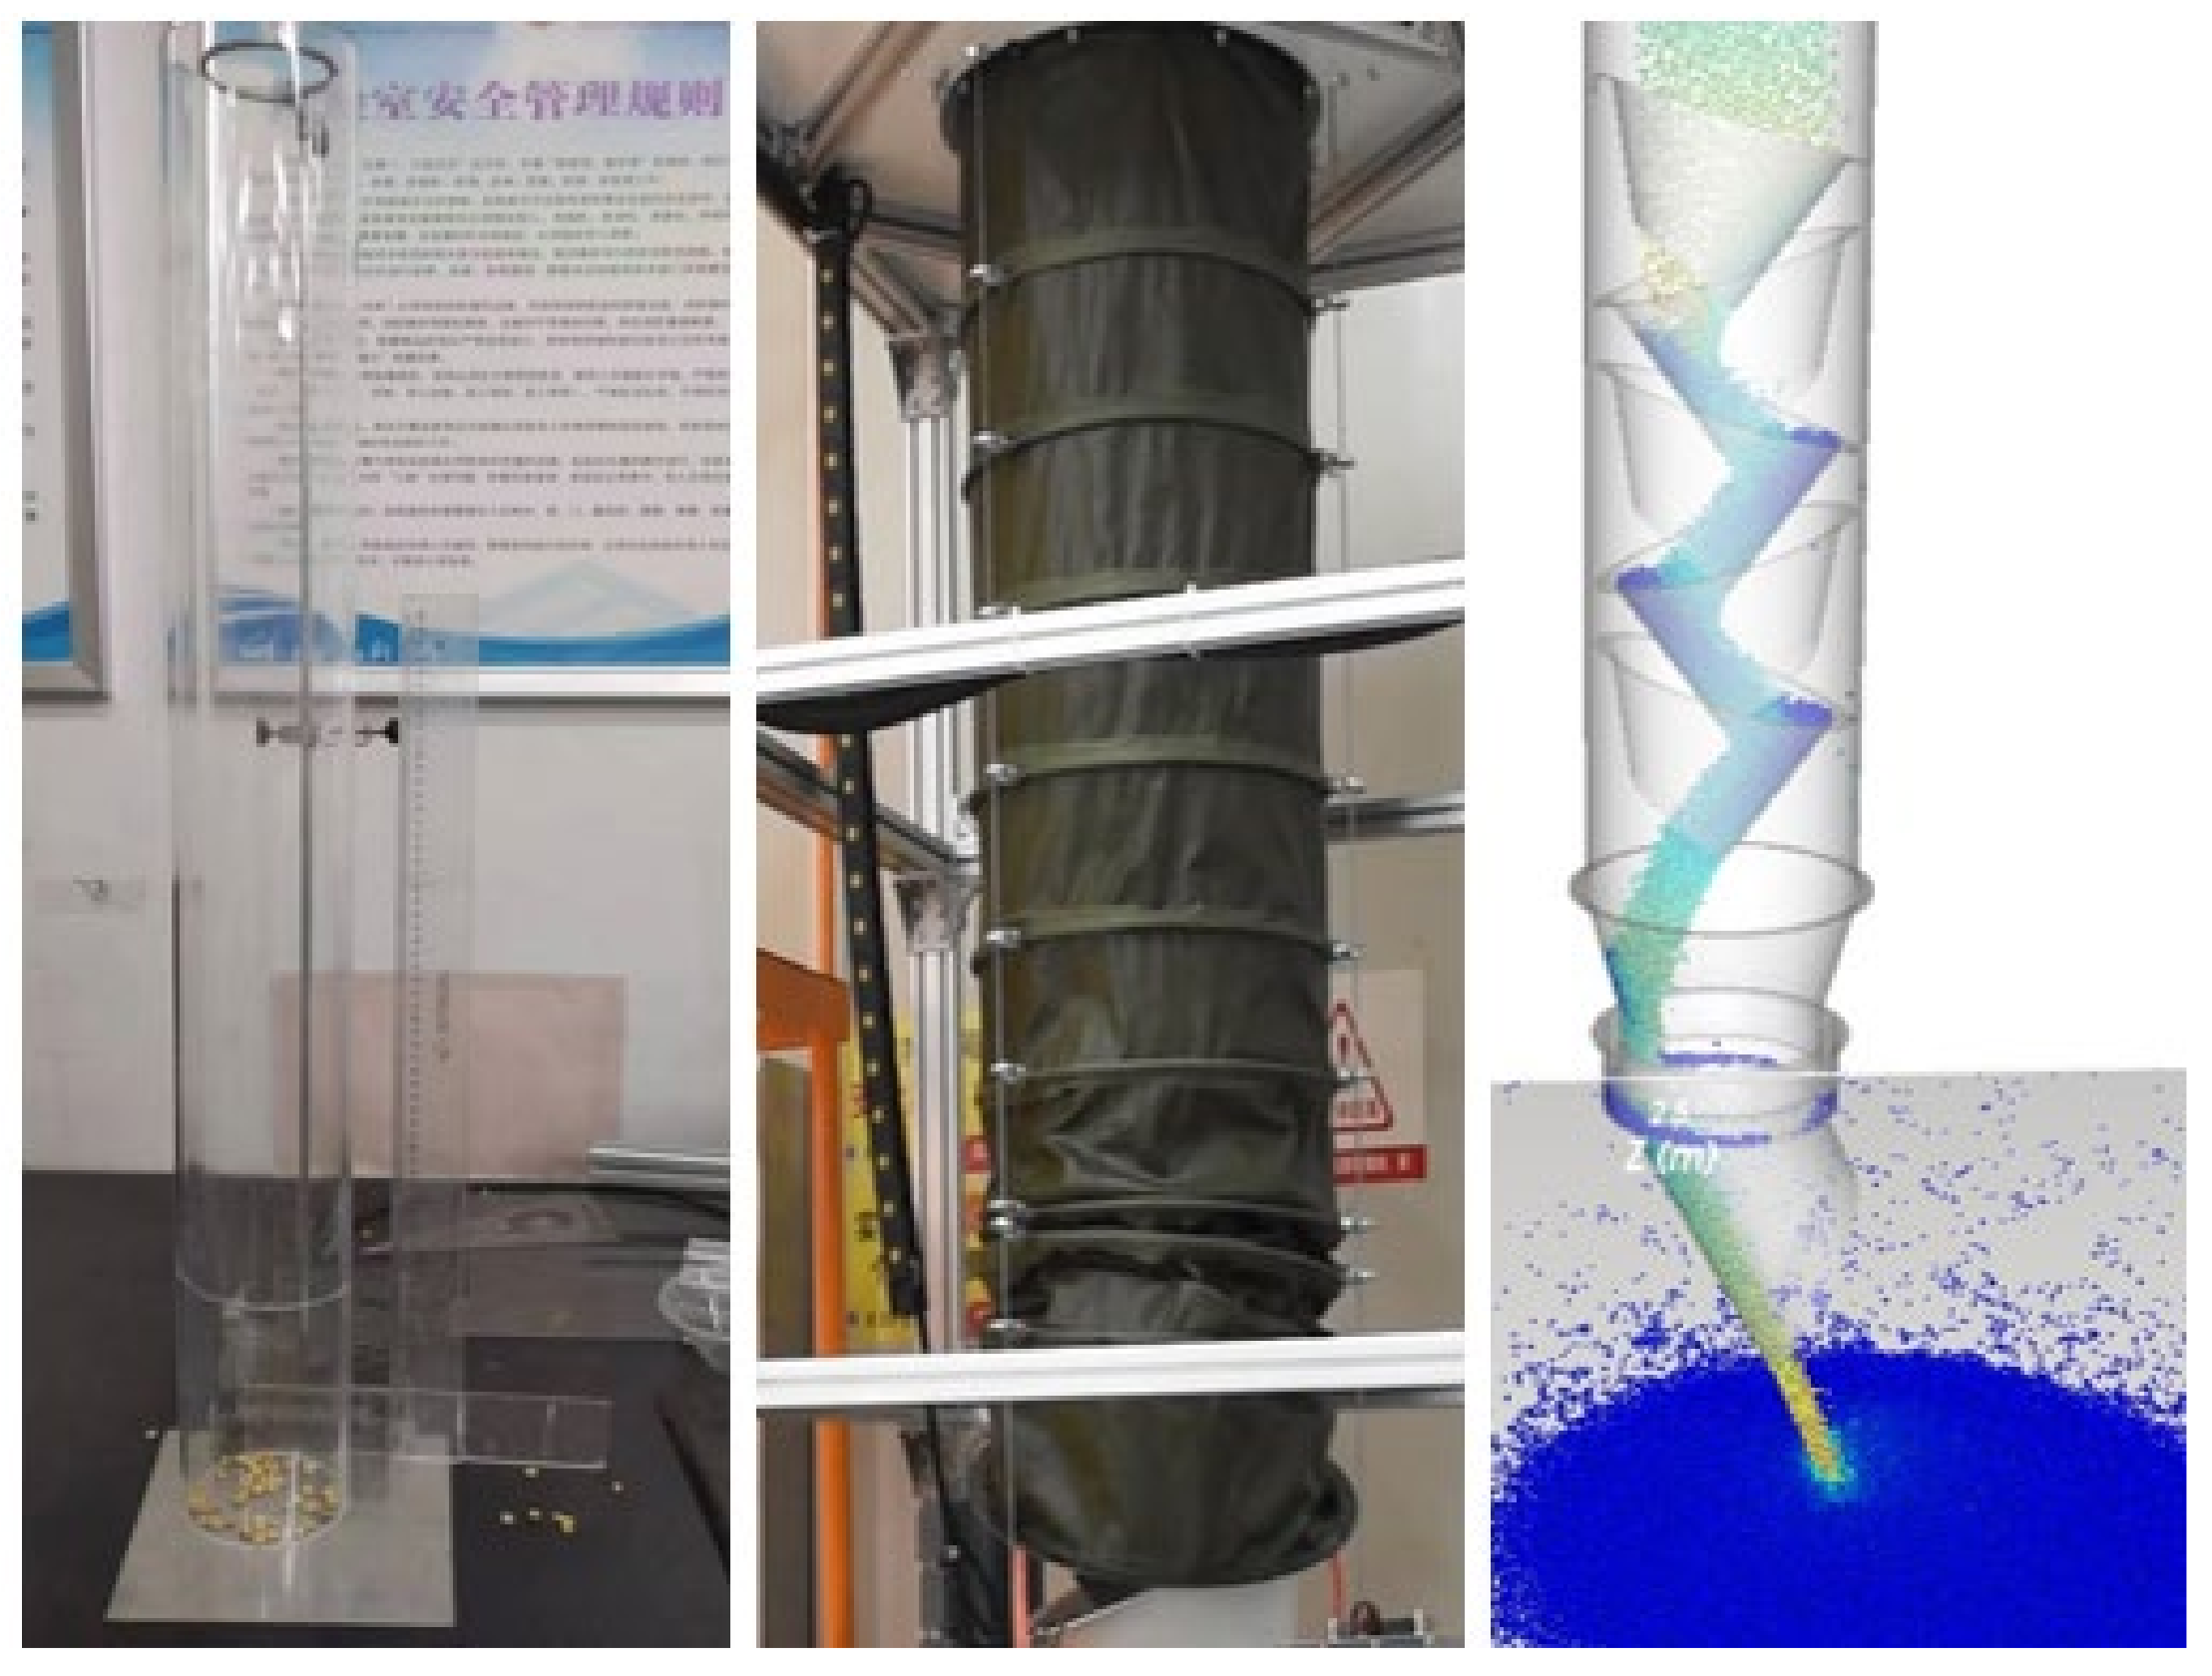
The simulation analysis takes the simplified model of the chute as the boundary, and the left and right folding dustpan as the conveying track. The total height of the model is 3200 mm, the inner diameter of the chute is 500 mm, the inner diameter of the upper bucket surface of the dustpan is 420 mm, the lower bucket surface of the dustpan is 280 mm, and the commonly used degree of 45° is selected for the bucket angle opening as shown in the following figure, which is combined with the stress analysis of the bucket impact by researchers, and it is found that the numerical difference in the reduction of the maximum equivalent stress is more significant at 45° than at 40°. In order to ensure the numerical simulation of the difference, the selection of the dustpan arrangement opening degrees is 30°, 35°, 40°, 45° and 50°. The particles in the silo take corn material. The silo, dustpan and corn particles are shown in Figure 5.
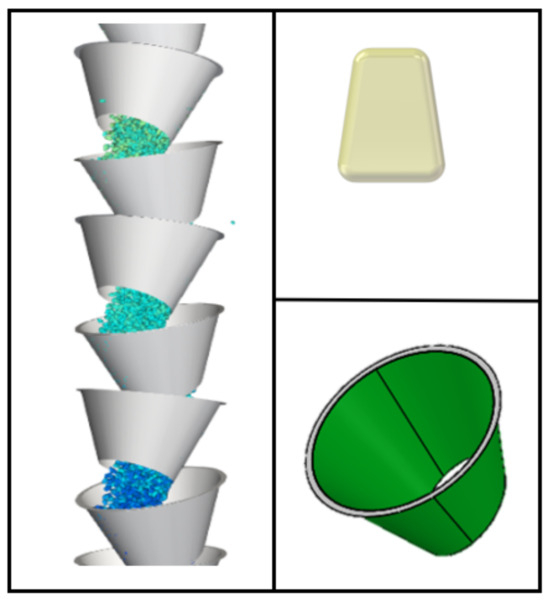
Figure 5.
Simulation model.
The numerical simulation software is rocky. In order to ensure the entry of particles into the warehouse and avoid the outflow of particles from the boundary during the conveying process, a particle factory with specified corn-simulated particles is added above the inlet to dynamically generate corn particles and form a coherent particle group into the sluice device to complete the conveying process. Table 1 shows the boundary simulation conditions of particles and walls.

Table 1.
DEM numerical simulation parameters.
4. Experimental Analysis
In order to ensure the accuracy of numerical simulation, comparative test verification was carried out on the self-constructed test platform. The inner diameter of the physical model of the chute is 500 mm, the angle between the dustpan wall and the horizontal plane is set to 14 degrees, and the tilt opening is 45 degrees. The six-stage dustpan is arranged uniformly and symmetrically interacts with each other, the materials are selected from soybeans and corn, and the conveying height is defined as from the upper edge of the inlet to the lower edge of the discharge port, which is 3000 mm; the parameters of the chute and the material particles of the numerical simulation are consistent with those of the physical experiments. In the test, in order to ensure the accuracy of the test, the sensors are arranged in different collection locations for multiple sets of test verification. The test setup is shown in Figure 6.
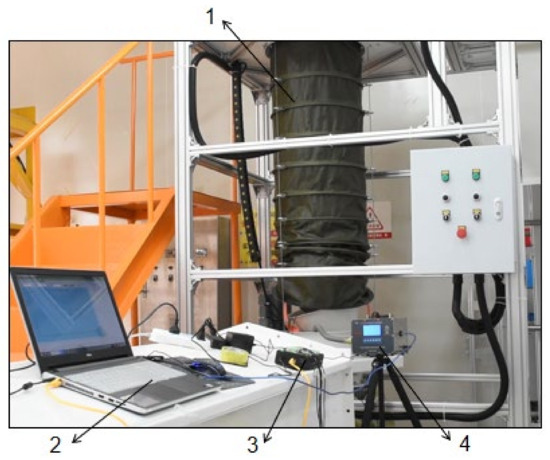
Figure 6.
Structure and working principle of the test device. 1—Multi-stage chute dustpan; 2—acquisition software; 3—multi-channel stress–strain sensors; 4—material handling timer.
As realized by setting parameters and simulation, the force chain formation contributes positively to conveying, and after the material leaves the outlet, it is assumed that it continues to flow at an internal friction angle of 50° until it flows out of the outlet. The corresponding loading speed of the outlet is calculated as 1.9 m/s internal flow line, 1.7 m/s center flow line and 1.4 m/s external flow line in the direction of the travel of the material flow accumulation. With loading speeds of 1.4 m/s and 1.9 m/s, the corresponding velocity normal components are calculated to be 2.6 m/s and 3.6 m/s, respectively. The internal impact flow changes, as shown in Figure 7 below, realized the expected effect of the slow-down state. Combined with the change of impact energy of the material flow as shown in Figure 8 and the vibration velocity as shown in Figure 9, the goal of steady-state slow-drop conveying of the particle population can be realized.
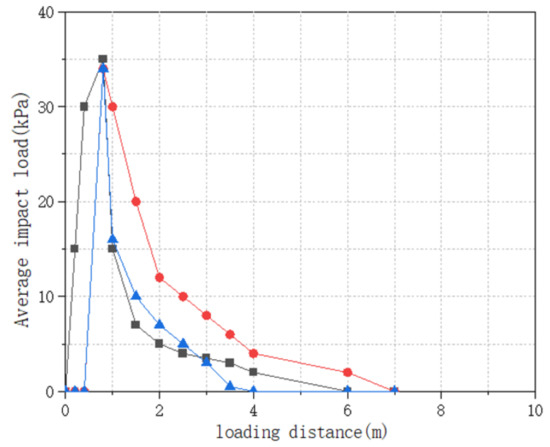
Figure 7.
Shock load variation.
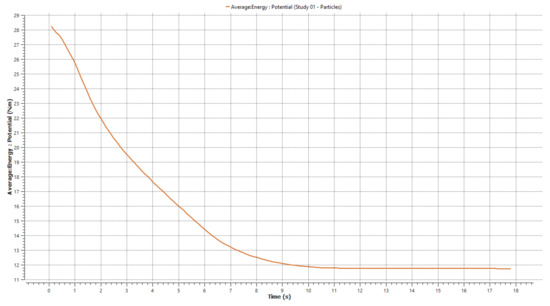
Figure 8.
Energy simulation variation.

Figure 9.
Vibration velocity variation in XYZ direction.
As shown in Figure 7, the impact load rapidly rises to 35 kpa in the vertical free conveying section of 0.45 m. The three conveying heights of 4 m, 6 m and 8 m sections are simulated, and the simulation results show similar effects.
As shown in Figure 8, during the conveying process, the average internal energy of the material group is 0–10 s, which slowly decreases from 28 N.m to below 12 N.m, effectively achieving a slow material drop.
As shown in Figure 9, in the confined space where the material is transported in the rink, the tremor frequency in the XYZ direction gradually moves from disorder to regular movement, conforming to the set flow trajectory.
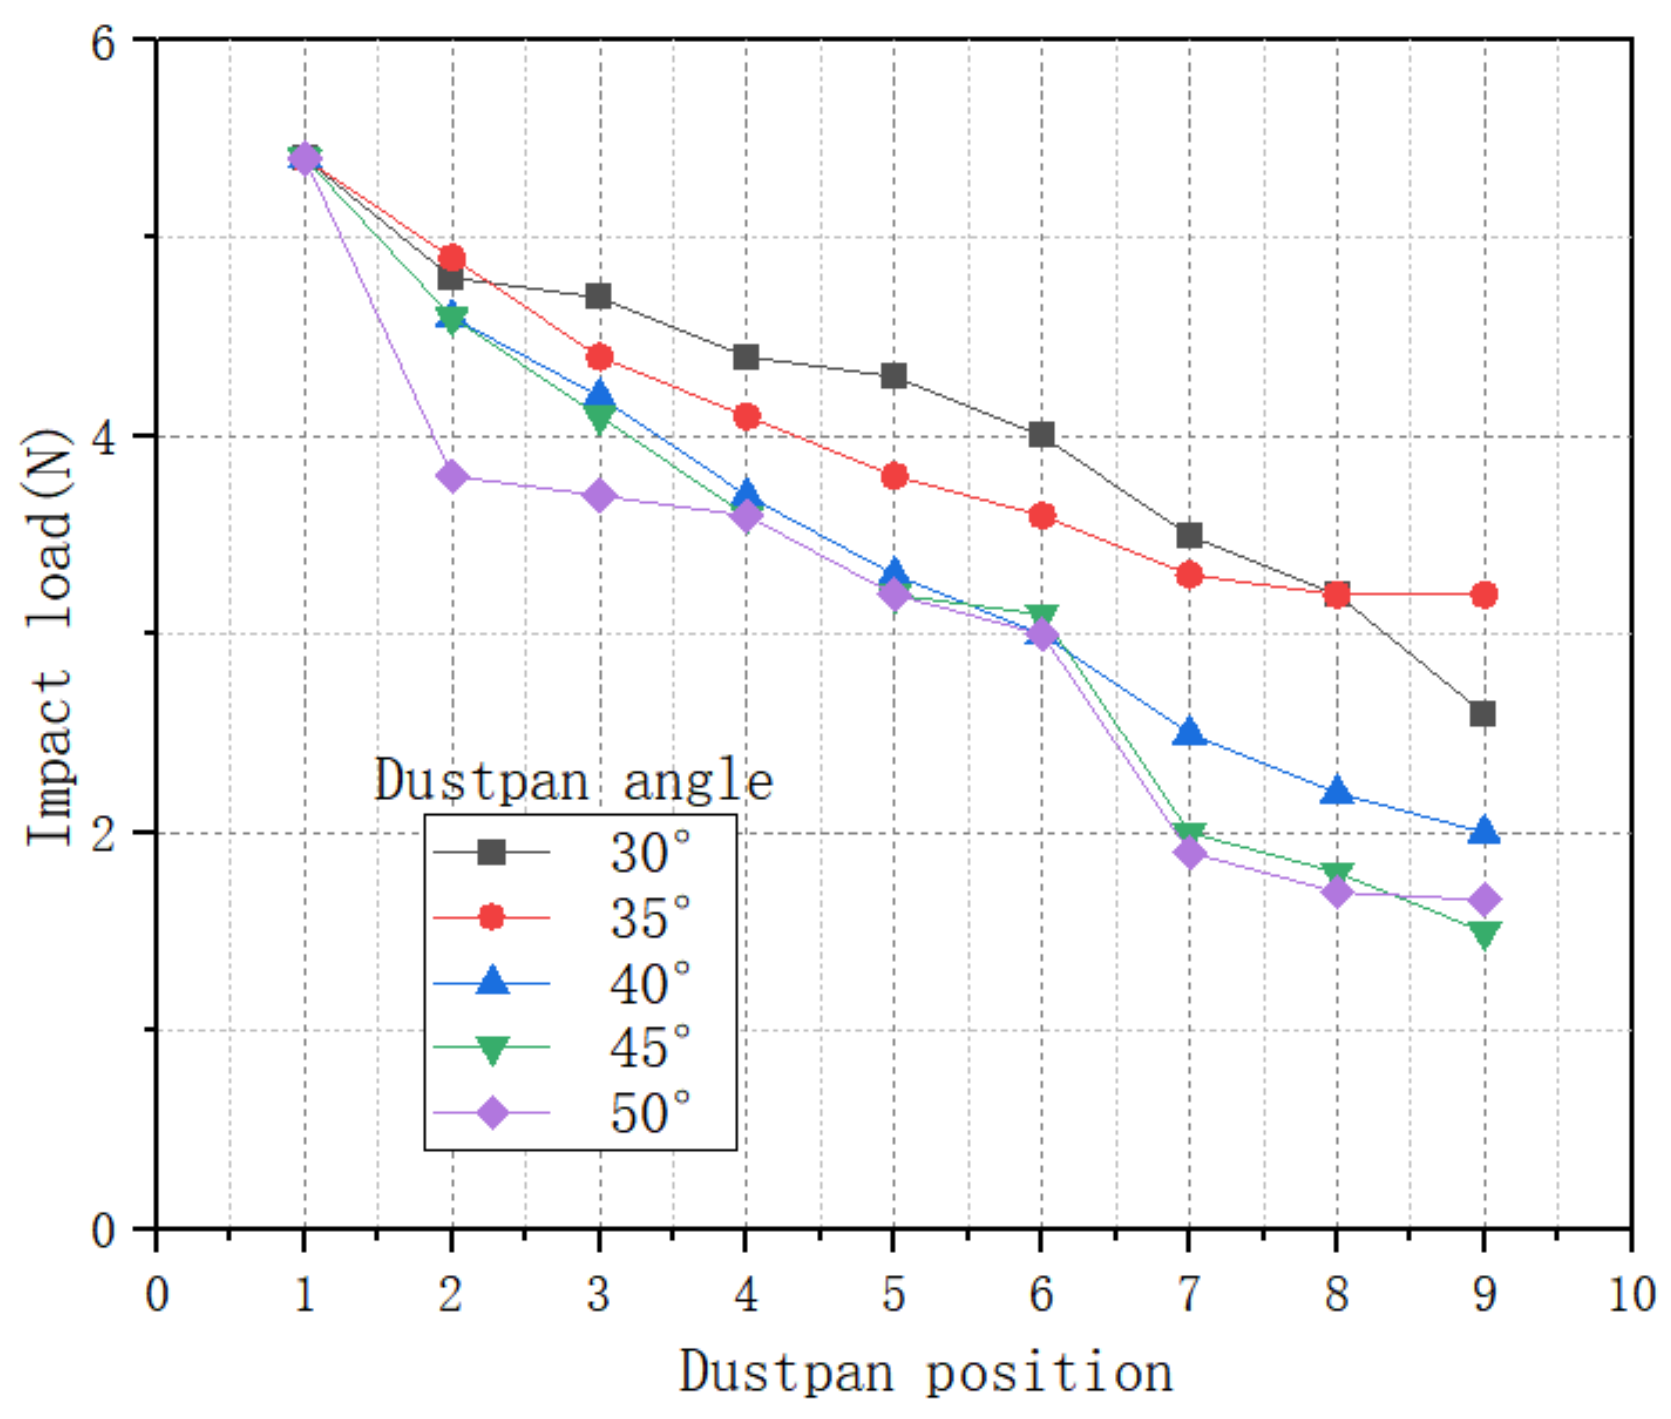
As shown in Figure 10, different angles of multiple points of collision strength of the collection of information in the 30–50 degree arrangement state dustpan impact load presents a step-by-step trend of slowing down; in the 40 degrees after the arrangement of the program, the material conveying efficiency is greatly reduced, and the average feeding time compared to the following 40 degrees of the program increased by 16%. A comprehensive analysis of the choice of a 40-degree dustpan is more reasonable.
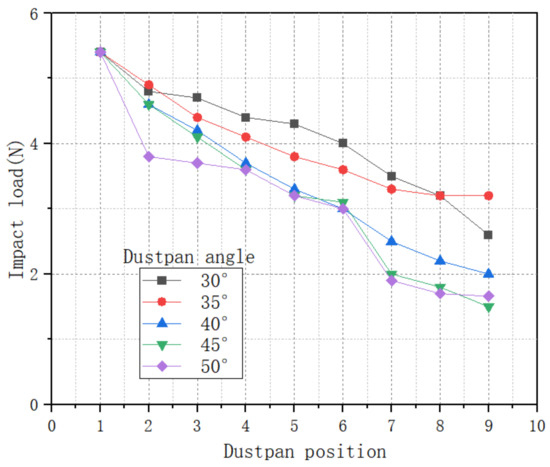
Figure 10.
Crash load acquisition diagram.
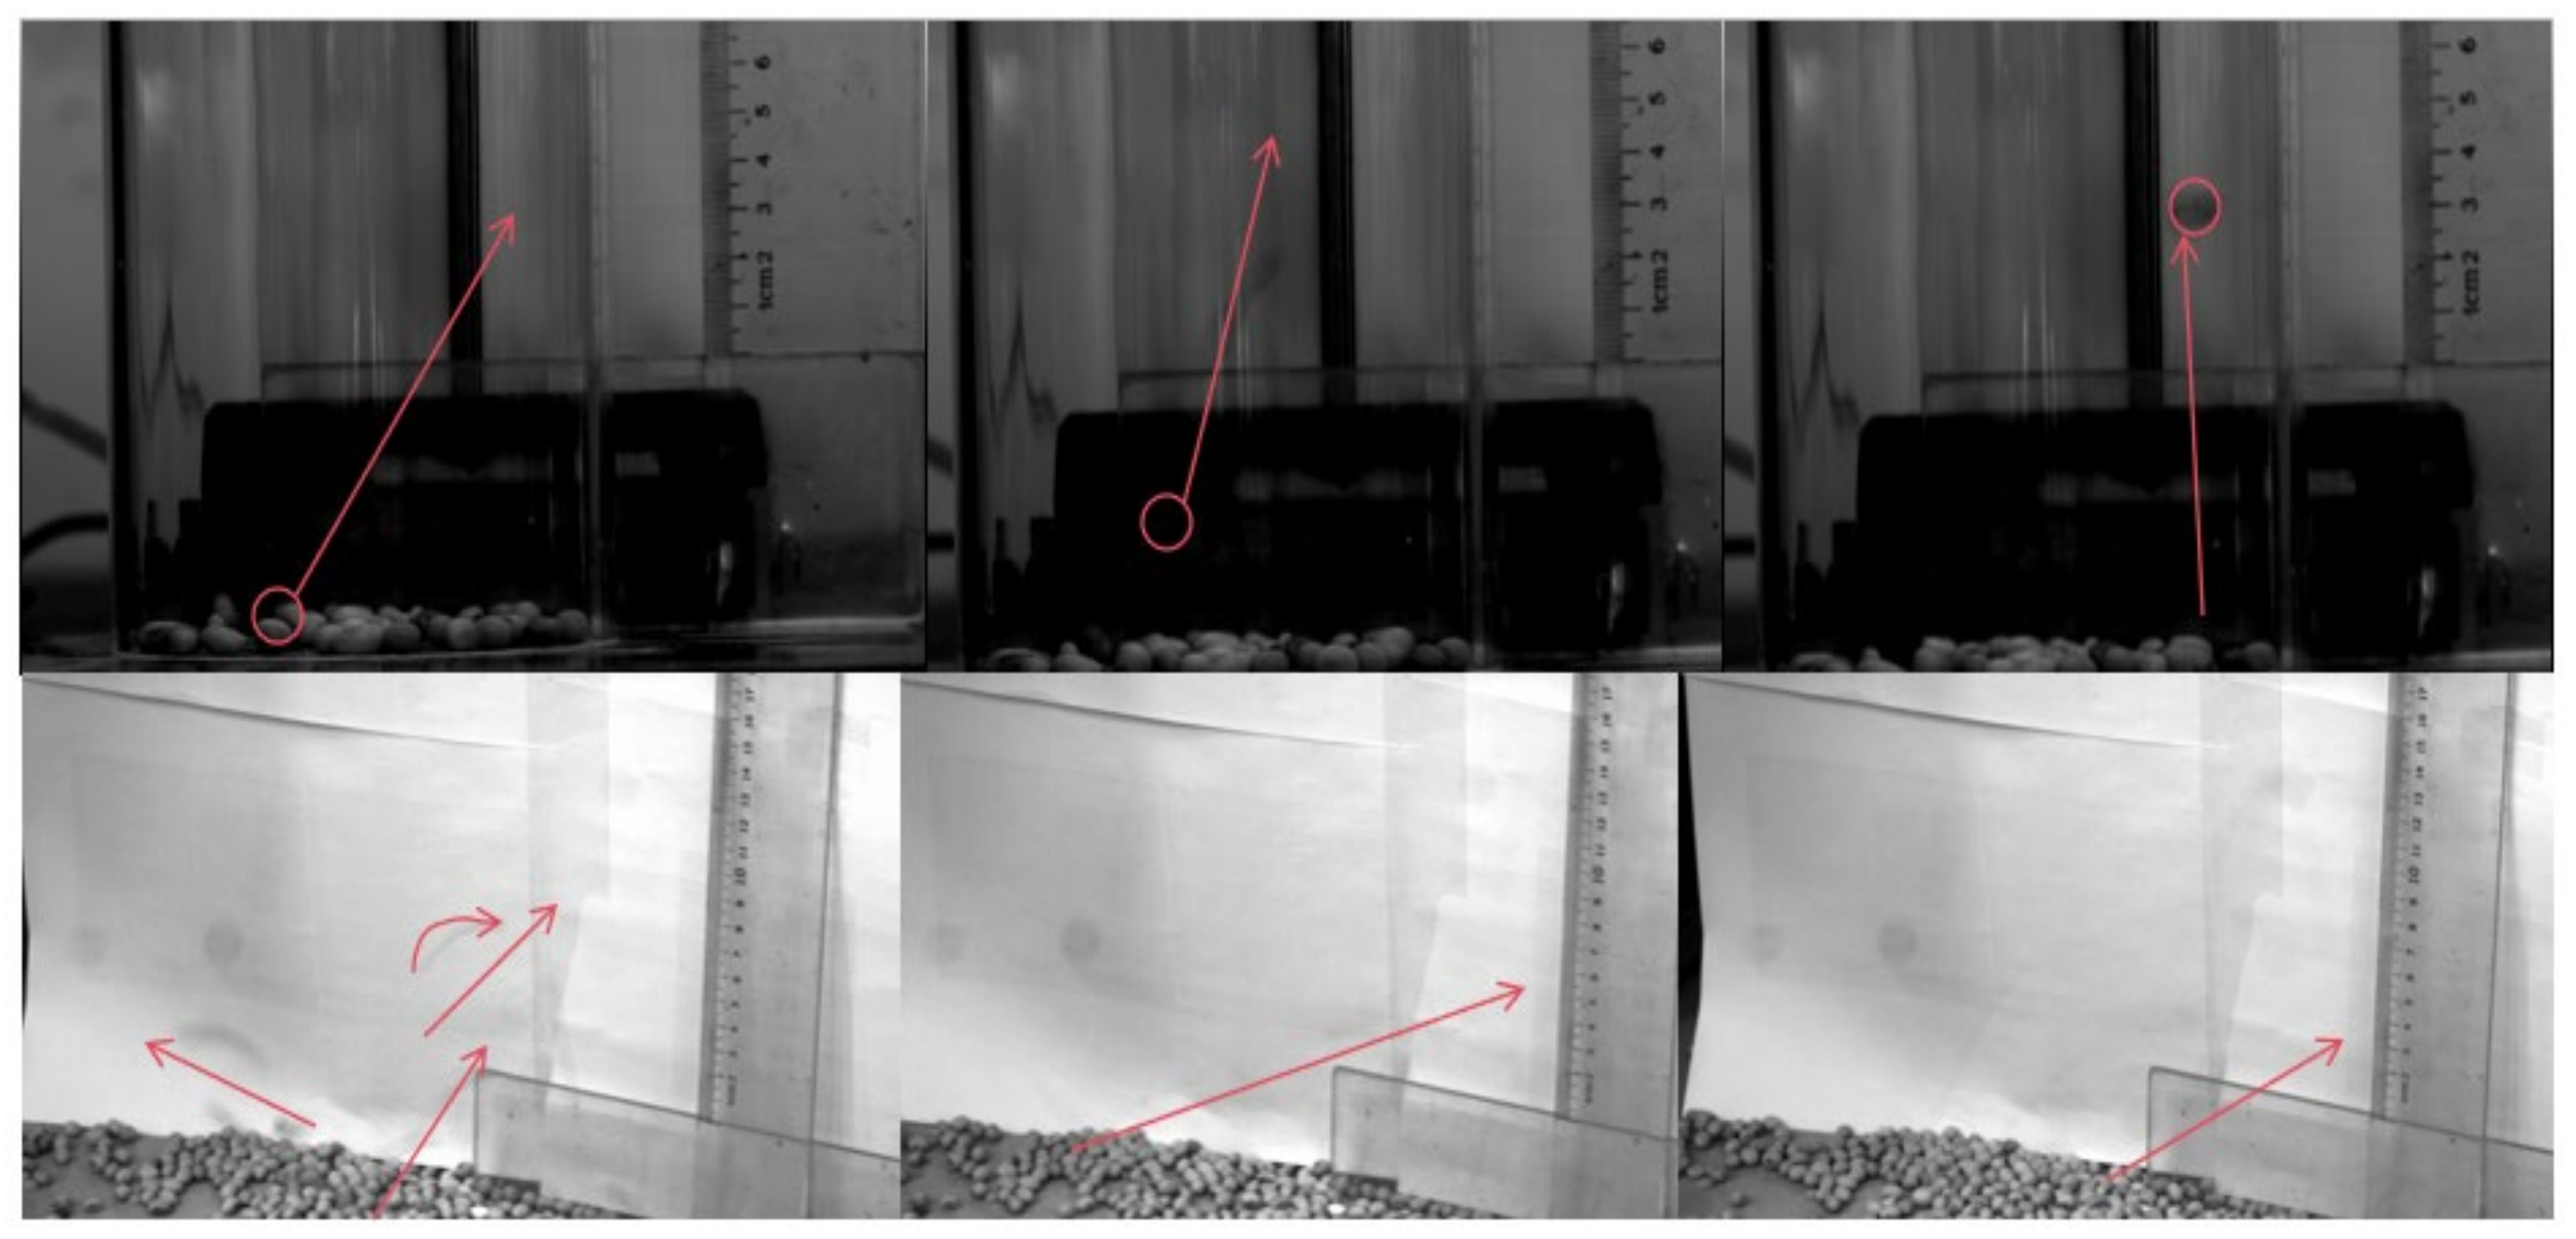
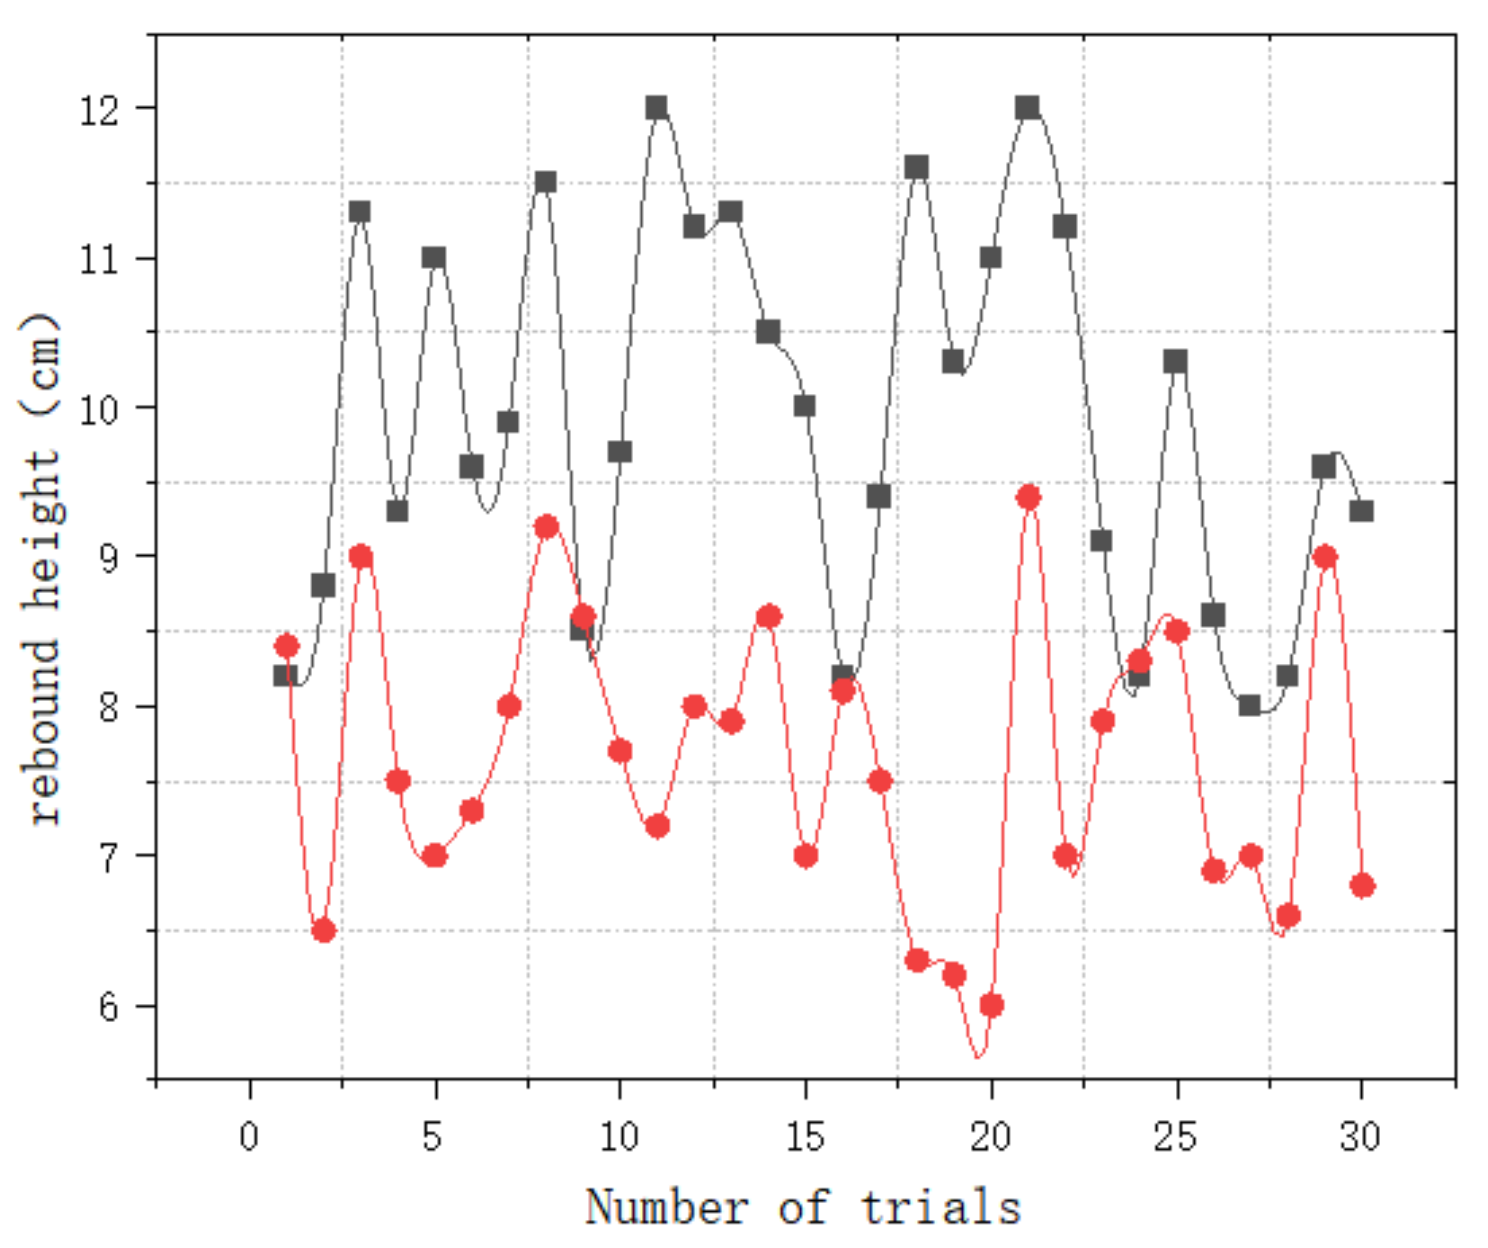
Using a high-speed camera to capture the metropolis particles and corn particles for comparison, as shown in Figure 11, the same drop, the rebound height in the free-fall pipeline in 8–12 cm, after passing through the multi-stage dustpan buffer, the overall conveying attitude slows down, and the particle group rebound height is between 6–9 cm. The test data are shown in Figure 12. Laboratory low height state of the slowing effect is significant and can provide good guidance for engineering applications.
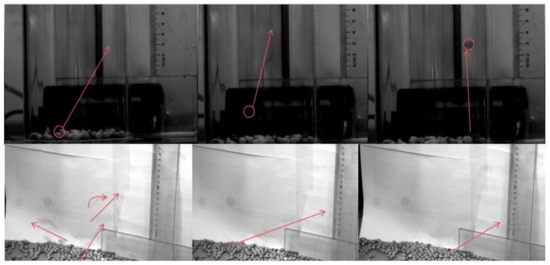
Figure 11.
Test acquisition diagram.

Figure 12.
Collision data map.
5. Conclusions
This analysis reveals that the normal contact process is self-adaptive within the range of parameters studied in this paper. The initial conveying velocity is in the range of 1.4 m/s–1.9 m/s, both the normal elastic force and the normal recombination amounts gradually increase with the collision contact duration, and the particle motion decelerates. When the normal elastic force and the normal amount of coincidence reach the maximum value, the trajectory of the particles changes direction. When the motion velocity of the particle group is within 1.9 m/s, the normal contact force decreases with the increase in the dustpan opening, and the reduction characteristics gradually become smaller when the inclination arrangement is larger than 45° and the inclination angle is too large. It can be seen that when the initial conveying speed is unchanged, changing the angle of the dustpan arrangement reduces the collision stress, which is conducive to reducing the possibility of the wear and tear of particles and crushing caused by the normal collision. Multi-stage dustpan intervention for material conveying effectively extends the conveying path and slows down the conveying impact collision, and the multi-stage collision on the bucket surface further controls the collision damage, abrasion and crushing.
In this paper, we studied the impact load of free-fall incoming material, which is effectively controlled under the action of multi-stage dustpan easing, and the influence of the angular arrangement on the impact load under the action of multi-stage skidding dustpan is further realized to optimize the selection of the easing dustpan arrangement angle.
Author Contributions
Conceptualization, M.W.; methodology, M.W.; software, S.L.; validation, H.Z.; formal analysis, S.L.; investigation, Z.S.; resources, Z.S.; data curation, K.L.;writing—original draft preparation, S.L.; writing—review and editing, S.L.; visualization, J.W.; supervision, M.W.; project administration, Z.S.; funding acquisition, Z.S. All authors have read and agreed to the published version of the manuscript.
Funding
This research received no external funding.
Institutional Review Board Statement
Not applicable.
Informed Consent Statement
Not applicable.
Data Availability Statement
The raw data supporting the conclusions of this article will be made available by the authors on request.
Conflicts of Interest
Author Zhijie Song was employed by the company Jiaozuo Creation Heavy Industry Co., Ltd. The remaining authors declare that the research was conducted in the absence of any commercial or financial relationships that could be construed as a potential conflict of interest.
References
- Ilic, D.; Roberts, A.; Wheeler, C.; Katterfeld, A. Modelling bulk solid flow interactions in transfer chutes: Shearing flow. Powder Technol. 2019, 354, 30–44. [Google Scholar] [CrossRef]
- Mwaro, W.B.; Ikua, B.W.; Maranga, S.M.; Kanali, C.L. Modeling Maize Grain Breakage in the Drag Chain Conveyor Handling Systems; Springer: Berlin/Heidelberg, Germany, 2014. [Google Scholar]
- Roessler, T.; Katterfeld, A. DEM parameter calibration of cohesive bulk materials using a simple angle of repose test. Particuology 2019, 45, 105–115. [Google Scholar] [CrossRef]
- Ilic, D.; Wheeler, C.A. Transverse Bulk Solid Behaviour during Discharge from Troughed Belt Conveyors. Adv. Powder Technol. 2017, 28, 2410–2430. [Google Scholar] [CrossRef]
- Ilic, D. Development of design criteria for reducing wear in iron ore transfer chutes. Wear 2019, 434–435, 202986. [Google Scholar] [CrossRef]
- Karwat, B.; Machnik, R.; Niedzwiedzki, J.; Nogaj, M.; Rubacha, P.; Stańczyk, E. Calibration of bulk material model in discrete element method on example of perlite D18-D. Eksploat. Niezawodn. 2019, 21, 351–357. [Google Scholar] [CrossRef]
- Ding, H.; Shen, J.; Williams, K.; Chen, B.; Yuan, J. Experimental analysis on flow characteristics of particulate materials conveyed by airslides. Chem. Eng. Res. Des. 2024, 203, 560–572. [Google Scholar] [CrossRef]
- Roessler, T.; Katterfeld, A. Scaling of the angle of repose test and its influence on the calibration of DEM parameters using upscaled particles. Powder Technol. 2018, 330, 58–66. [Google Scholar] [CrossRef]
- Servin, M.; Wang, D. Adaptive model reduction for nonsmooth discrete element simulation. Comput. Part. Mech. 2016, 3, 107–121. [Google Scholar] [CrossRef]
- Rossow, J.; Coetzee, C. Discrete element modelling of a chevron patterned conveyor belt and a transfer chute. Powder Technol. 2021, 391, 77–96. [Google Scholar] [CrossRef]
- Shen, J.; Wheeler, C.; O’Shea, J.; Ilic, D. Investigation of the dynamic deflection of conveyor belts via experimental and modelling methods. Measurement 2018, 127, 210–220. [Google Scholar] [CrossRef]
- Hrabovský, L.; Blata, J.; Hrabec, L.; Fries, J. The detection of forces acting on conveyor rollers of a laboratory device simulating the vertical section of a Sandwich Belt Conveyor. Measurement 2023, 207, 112376. [Google Scholar] [CrossRef]
- Zhao, Z.; Li, Y.; Chen, Y. Study on the collision mechanics characteristics of rice grains. J. Agric. Mach. 2013, 44, 88–92. [Google Scholar]


Disclaimer/Publisher’s Note: The statements, opinions and data contained in all publications are solely those of the individual author(s) and contributor(s) and not of MDPI and/or the editor(s). MDPI and/or the editor(s) disclaim responsibility for any injury to people or property resulting from any ideas, methods, instructions or products referred to in the content. |
© 2024 by the authors. Licensee MDPI, Basel, Switzerland. This article is an open access article distributed under the terms and conditions of the Creative Commons Attribution (CC BY) license (https://creativecommons.org/licenses/by/4.0/).