Article

Mechanical Properties of Cement Concrete with Waste Rubber Powder

1
School of Architectural Engineering, Yiwu Industrial & Commercial College, Yiwu 322000, China
2
School of Civil Engineering and Transportation, Hebei University of Technology, Tianjin 300401, China
*
Author to whom correspondence should be addressed.
Appl. Sci. 2024, 14(15), 6636; https://doi.org/10.3390/app14156636
Submission received: 27 June 2024 / Revised: 19 July 2024 / Accepted: 24 July 2024 / Published: 30 July 2024

Abstract

:
To investigate the mechanical properties of cement concrete incorporating waste rubber powder, the response surface methodology was employed. The Box–Behnken central composite design was applied to analyze the three primary factors influencing the road performance of cement concrete containing waste rubber powder: the water–cement ratio, sand ratio, and waste rubber powder content. The study determined the impact of these factors on the flexural strength of waste rubber powder cement concrete at both 7 and 28 days. Additionally, the effects of the water–cement ratio, sand ratio, and waste rubber powder content on the performance of cement concrete were analyzed. To investigate the impact of waste rubber powder on cement concrete, various mechanical property tests were conducted, including compressive, flexural, dynamic elastic modulus, and impact performance tests. Furthermore, the study explored the influence of waste rubber powder on the noise reduction capacity of cement concrete using both the rubber ball impact method and ultrasonic method. Lastly, the durability of cement concrete with added rubber powder was assessed through shrinkage tests, frost resistance tests, and chloride ion penetration tests.

1. Introduction

The construction industry is one of the largest consumers of resources and energy [1], and concrete is the second most widely used construction material after water [2]. Due to its cost efficiency and ease of manufacturing, concrete can be molded into various forms to meet a wide range of specifications [3]. The incorporation of waste rubber powder into concrete can decrease landfill and incineration volumes, while also minimizing the extraction of raw materials [4,5].
Since the early 1990s, scholars have investigated waste tire rubber powder in cement concrete. Most studies suggest that the mechanical strength of concrete typically decreases with the addition of rubber, and this trend exacerbates as rubber content increases [6,7,8,9]. Adding rubber powder tends to reduce the strength and other mechanical properties of cement concrete, but this effect can be mitigated by the inclusion of silica fume [10,11]. Additionally, Shengtian Zhai et al. [12] noted that the interface between rubber and cement, along with the distribution of rubber particles, play pivotal roles in shaping the mechanical properties of rubber aggregate concrete.
Crumb rubber concrete demonstrates notable resistance to chloride ion erosion [13]. According to most studies, rubberized concrete treated with NaOH shows enhanced mechanical properties [13,14]. Experimental results conducted by Ruizhe Si et al. [15] showed that the durability of rubberized concrete or mortar samples with 15% or 25% NaOH-treated rubber replacement is enhanced. Danyang Su et al. [16] discovered that incorporating rubber into concrete enhances both its compressive strength and compactness in chloride salt-corroded environments. Yang Li et al. [17] concluded that employing a low W/C ratio in crumb rubber concrete significantly enhances resistance to chloride penetration.
The study by Iker Bekr Topcu and Abdullah Demir [18] revealed that the inclusion of waste rubber powder reduces the elastic modulus of cement concrete, with a lesser impact on compressive strength observed with larger mesh sizes of waste rubber powder. Following this, J. Retama and A. G. Ayala [19] noted the influence of crumb rubber size on concrete’s elastic modulus, observing a decrease in concrete with fine crumb rubber while enhancing its ductility. Tran Van Cuong et al. [20] demonstrated that incorporating rubber flakes or granules to partially replace the aggregate effectively lowers the static elastic modulus of concrete. Ttilok Gupta et al. [21] proposed that utilizing rubber as aggregate could notably improve concrete durability. Shengtain Zhai et al. [22] observed that the increase in abrasion resistance of crumb rubber concrete is primarily due to the absorption of wear energy by the rubber particles. Wrya A. Abdullah et al. [23] determined that rubberized concrete mixes were functional up to a certain sand replacement level, yielding lighter concrete. Consequently, rubberized concrete presents advantages for lightweight building construction [6].
It has been observed that concrete incorporating elastic materials like crumb rubber exhibits a high fracture toughness. Aijiu Chen et al. [24] demonstrated that pretreating rubber particles enhances the strength, ductility, and crack resistance of rubberized concrete. Moataz Badawi et al. [25] discovered that rubber-treated concrete samples display increased ductility under pressure testing compared to ordinary concrete, and they exhibit slower fracture rates. Research indicates that the addition of waste rubber powder substantially reduces the thermal conductivity of concrete and significantly improves its sound absorption [26].
In summary, although numerous studies have delved into rubber concrete, the bulk of them center on mechanical properties. However, research on the durability of rubber concrete remains inadequately thorough, yielding divergent and inconclusive outcomes. The introduction of rubber powder may reduce the strength of concrete. The shape and surface characteristics of rubber powder may affect the workability of concrete. The aging and decomposition of rubber powder may impact the service life of concrete. Currently, the application of rubber concrete lacks unified specifications and standards, hindering its promotion and application. This discrepancy impedes the practical utilization of waste rubber concrete in engineering applications. This study conducted indoor experiments to select materials meeting specifications and designed the mix proportions for cement concrete. Utilizing response surface methodology, the Box–Behnken central composite design was employed to optimize the water–cement ratio, sand ratio, and waste rubber powder, each at three levels. Subsequently, response surface analysis was performed to elucidate the influence of the water–cement ratio, sand ratio, and waste rubber powder on the flexural strength of cement concrete at 7 and 28 days. Finally, the mechanical properties of cement concrete mixed with waste rubber powder were experimentally evaluated, providing a reference for design purposes.

2. Materials and Methods

2.1. Materials

The materials used in the tests included rubber powder, cement, coarse aggregate, sand, and superplasticizer. The rubber powder particle sizes were categorized into four groups: 10-mesh, 20-mesh, 30-mesh, and 60-mesh, as illustrated in Figure 1. Portland cement (Type P.O. 42.5) was utilized in the tests. The coarse aggregate particle sizes were classified into three grades: 5–10 mm, 10–20 mm, and 20–30 mm, mixed at a ratio of 2:5:3. The fineness modulus of the medium sand was determined to be 2.74. The grain size distribution curve of the coarse aggregate and medium sand are shown in Figure 2 and Figure 3. The technical specifications of the superplasticizer are provided in Table 1. And, the concrete mixtures used in the tests are given in Table 2.

2.2. Response Surface Methodology (RSM)

Response surface methodology (RSM) is an optimization technique that aims to find the optimal experimental design with a minimal number of samples. Despite the limited sample size, RSM effectively captures the complex non-linear relationships between the response and parameters with satisfactory precision [27]. RSM can optimize multiple responses or fulfill specific requirements [28,29,30]. The Box–Behnken design (BBD) is a quadratic response surface design that operates independently. The BBD necessitates three levels for each factor and yields fewer experimental runs compared to the central composite design, with an equivalent number of factors [31,32]. All combinations in the BBD are contained within the region of interest. While less costly than the central composite design, the BBD is unsuitable for sequential experiments [33]. The Box–Behnken design, with its absence of axis points, ensures that all design points remain within their boundaries and prevents the simultaneous elevation of all factors to high levels. This unique characteristic makes it a suitable choice for optimizing the mix ratio of waste rubber powder cement concrete.
Design-Expert software (version 12) was employed in this study to identify the optimal conditions. Three independent variables—the water–cement ratio (A), sand ratio (B), and 10-mesh waste rubber powder content (C)—were investigated using a three-level, full-factorial Box–Behnken design. A total of 17 experiments were conducted, and the factors and their levels are detailed in Table 3. Using a three-factor, three-level Box–Behnken central composite design of the water–cement ratio, sand ratio, and 10-mesh waste rubber powder dosage, 17 groups of experimental schemes were obtained, as shown in Table 4.

2.3. Methods

2.3.1. Specimens Preparation

It can be inferred from the Testing Methods of Cement and Concrete for Highway Engineering that cubic specimens measuring 150 mm × 150 mm × 150 mm were utilized for the compression strength, impact resistance, and noise reduction tests. Cylindrical specimens with a diameter of 100 mm and a length of 200 mm were employed for the impermeability tests. Cuboid specimens measuring 100 mm × 100 mm × 400 mm were used for the flexural strength, elastic modulus, and freezing resistance tests. Another set of cuboid specimens measuring 100 mm × 100 mm × 515 mm was designated for the shrinkage testing. All specimens, except those for shrinkage testing, were demolded after 24 h and cured in a standard curing room.
The compressive strength, flexural strength, and dynamic modulus of the mixes were determined at the concrete ages of 7, 14, 21, and 28 days, with the impact resistance, noise reduction, and impermeability tests conducted at 28 days. Each specimen underwent three replicates, and the average strength values were reported.

2.3.2. Impact Resistance

The study replaced 5%, 10%, and 15% of the cement mass with waste rubber powder of four different particle sizes and incorporated them into the concrete mix. Impact tests were performed on 60 mm concrete slabs obtained by cutting standard compressive test specimens, using a self-made drop hammer impact test device. Finally, regression analysis was conducted on the initial and final crack times using the Weibull distribution. The cast concrete specimens were sliced into 60 mm thick test samples, resulting in two pieces from each standard specimen, yielding 10 specimens in each group. A custom-made impact testing apparatus, as illustrated in Figure 4, was employed to release a 1.2 kg steel ball from a vertical height of 80 cm. The impact times, N1 and N2, were then recorded when the initial crack appeared and the final failure occurred, respectively.
The initial crack impact energy and final crack impact energy of the test piece are represented by E1 and E2, respectively. The calculation formula is as follows:
E 1 = N 1 m g h
E 2 = N 2 m g h
where E1 = the initial crack impact energy of the test piece, J; E2 = the final crack impact energy of the test piece, J; N1 = the impact times of the initial crack, times; N2 = the impact times of final crack, times; m = the mass of the falling hammer, 1.2 kg; g = the gravitational acceleration, 9.8 m/s2; and h = the height of the falling hammer, 0.8 m.

2.3.3. Noise Reduction
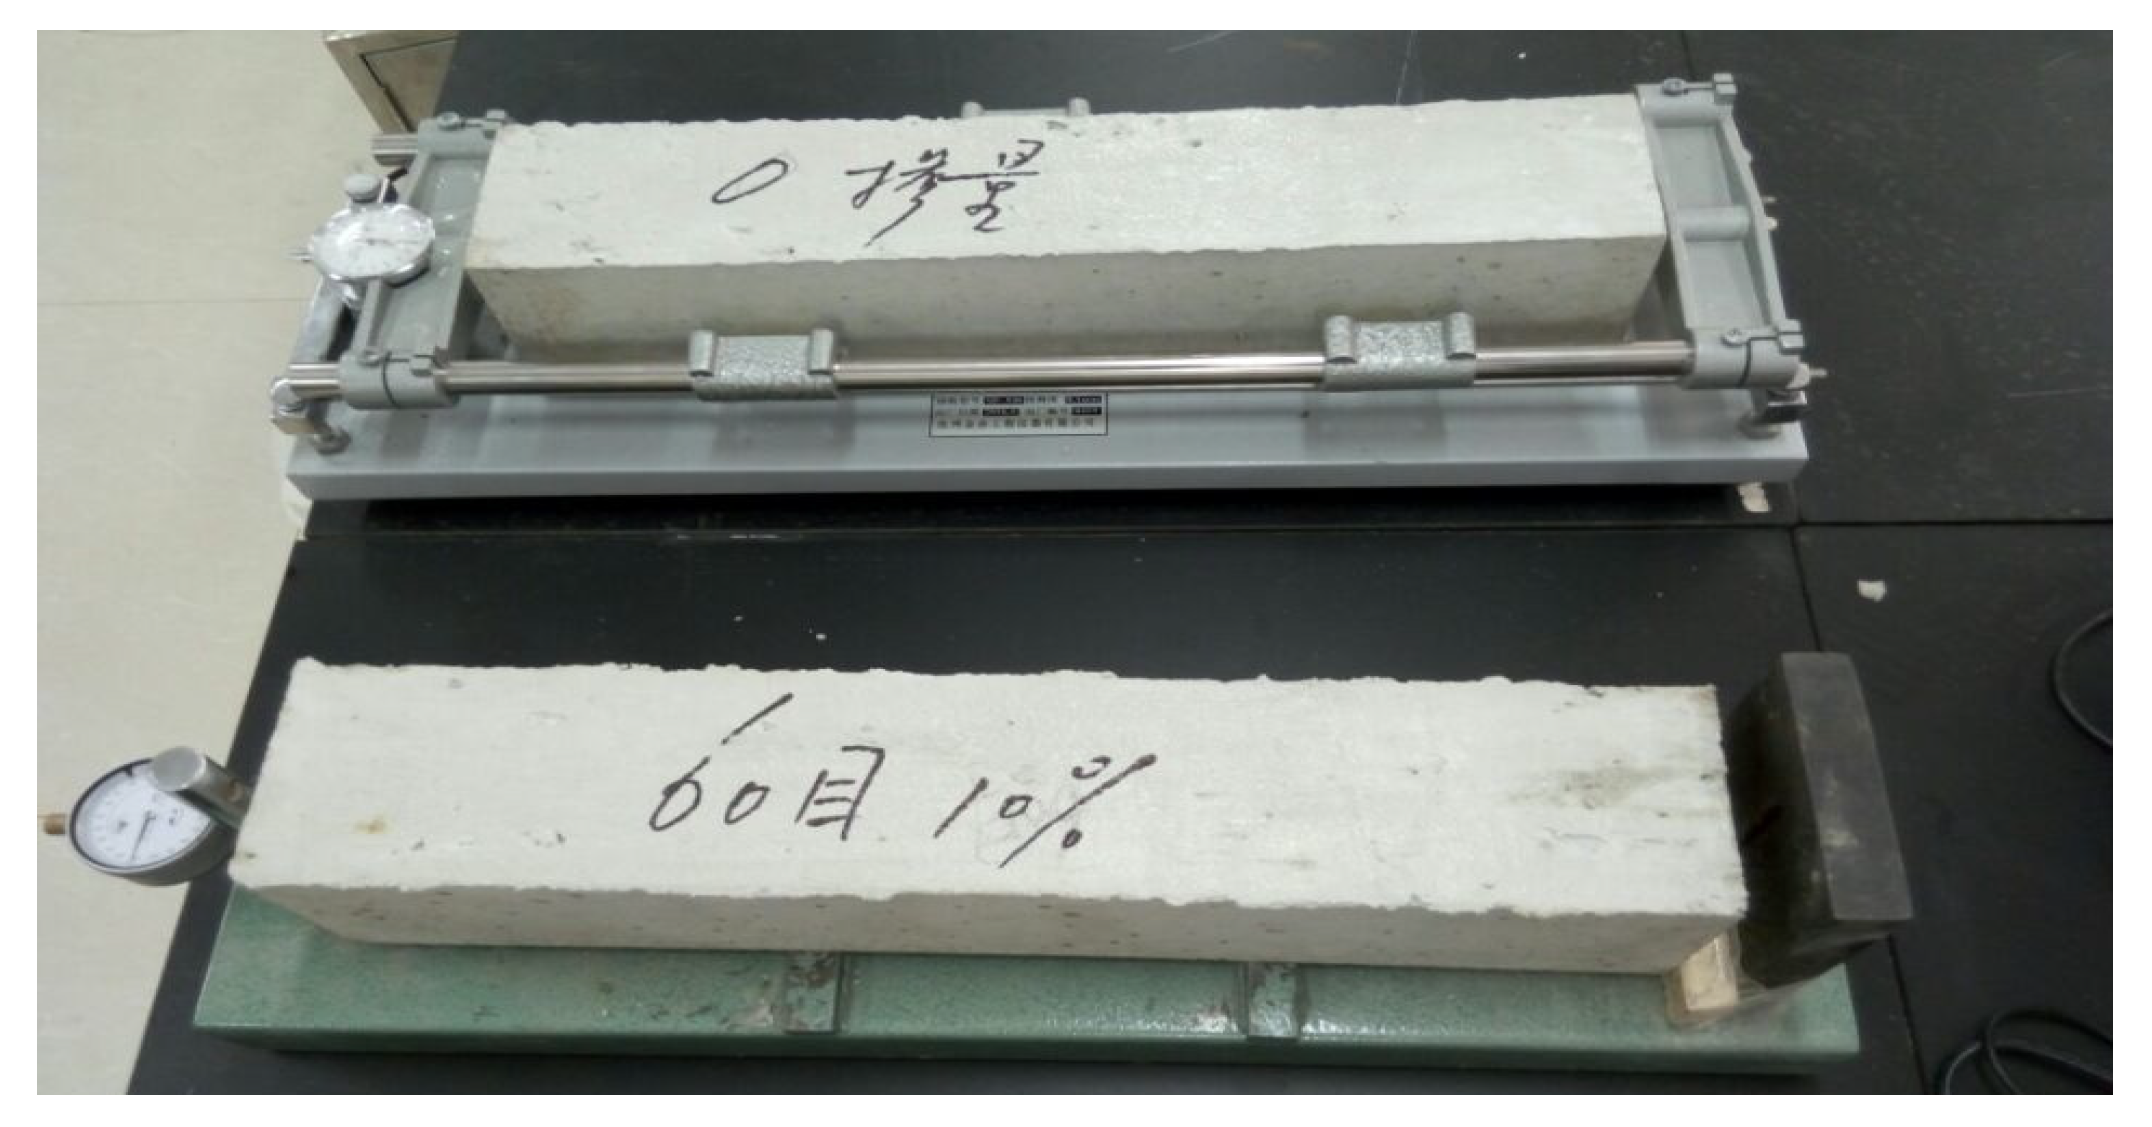
The rubber ball impact test assessed the noise reduction capabilities of the waste rubber powder cement concrete. A 1 kg rubber ball was released vertically from a 1 m distance above the test specimen, and the noise level was gauged using a noise detector positioned 1.5 m horizontally from the test piece. The schematic diagram of this test is illustrated in Figure 5.

2.3.4. Shrinkage

Three standard specimens were cured in the curing room for one day before demolding. Subsequently, they were transferred to the drying shrinkage chamber after three days, and their initial lengths were measured. Length measurements were taken on days 1, 3, 7, 14, 28, 45, 60, 90, and 120 post placement in the drying shrinkage chamber. The drying shrinkage rate was calculated with a precision of 0.0001%. Figure 6 depicts the drying shrinkage test of the waste rubber powder cement concrete.

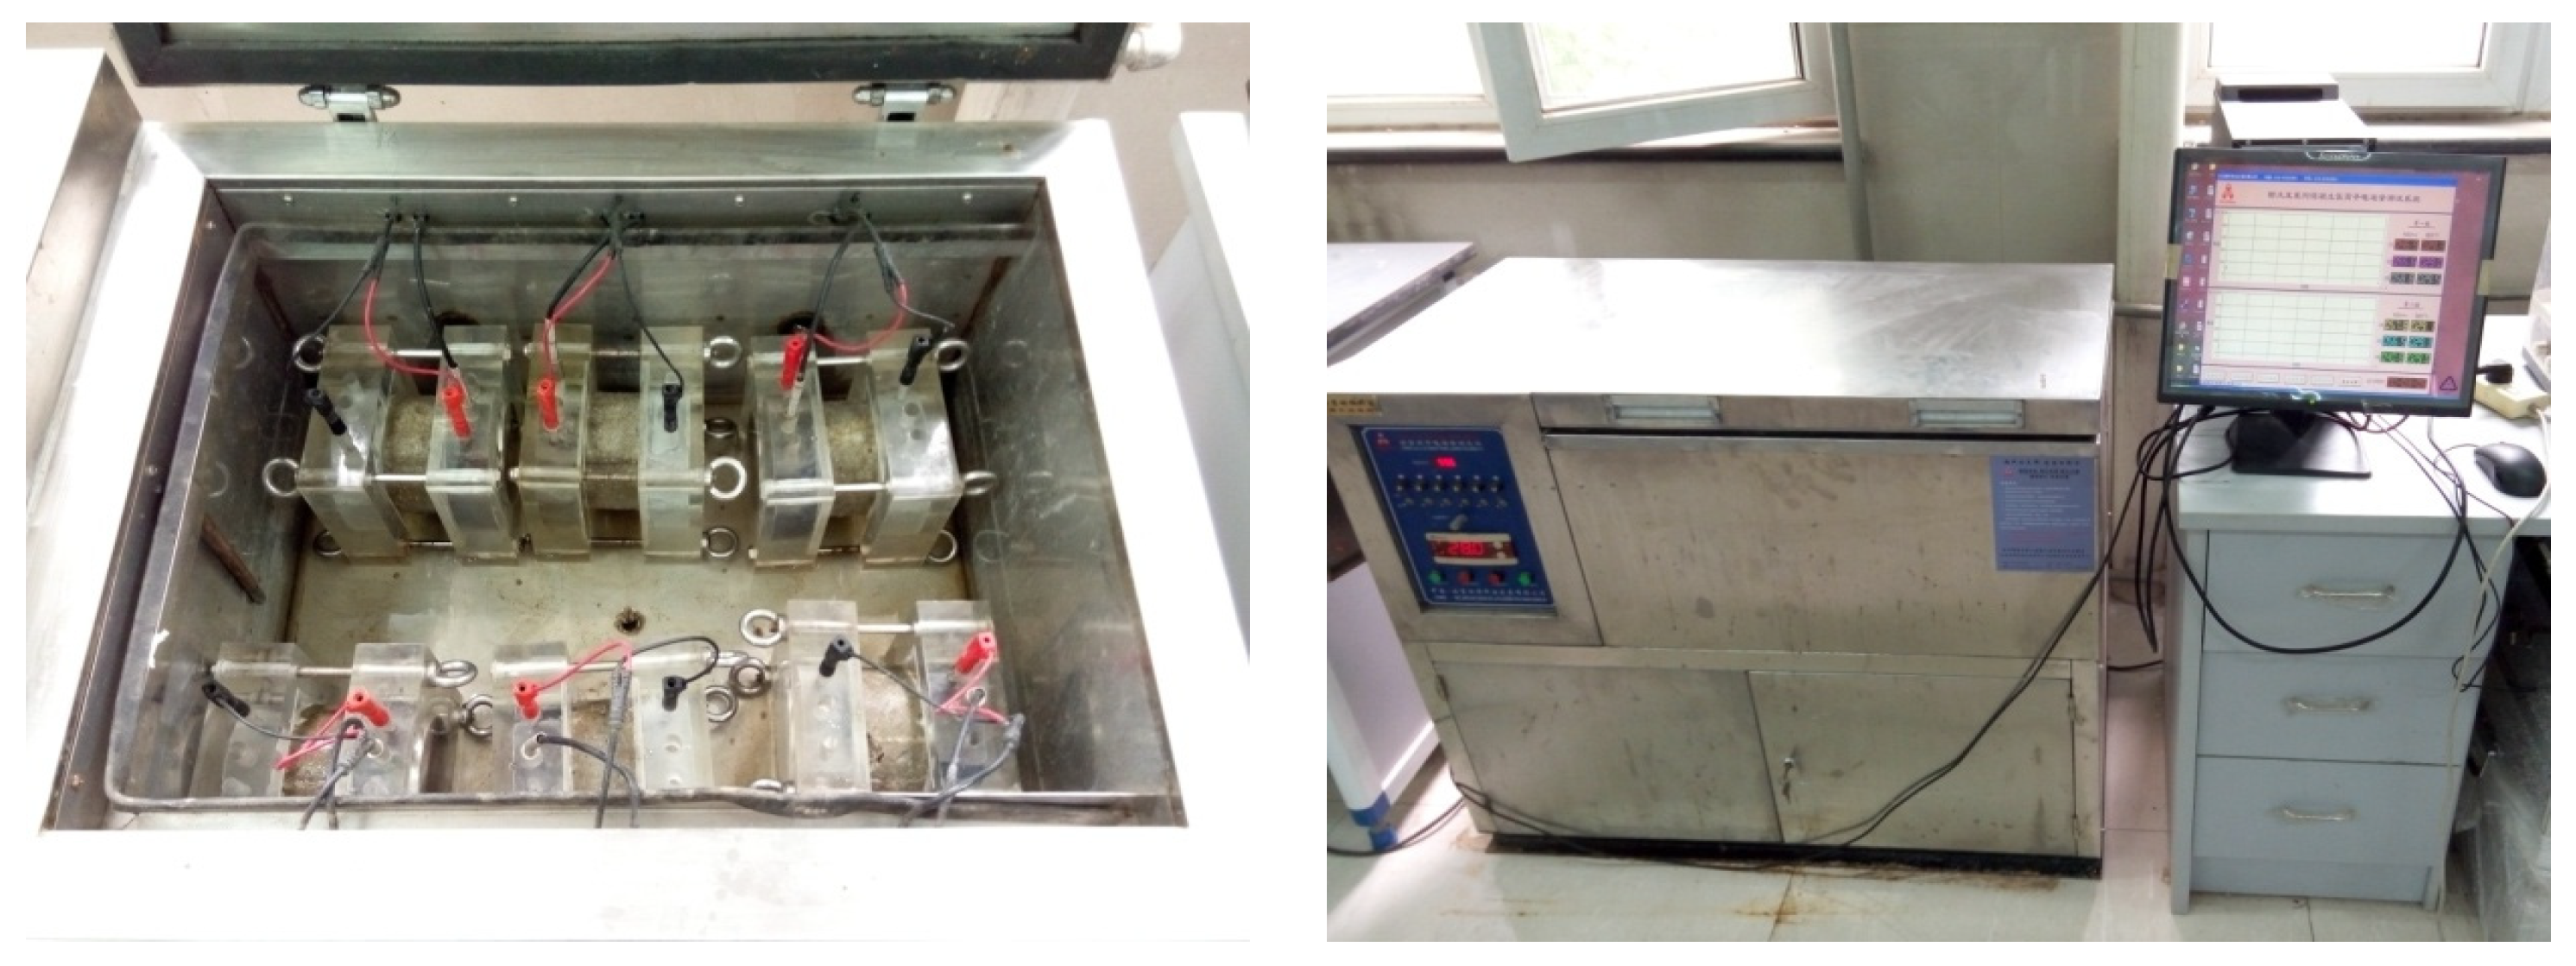
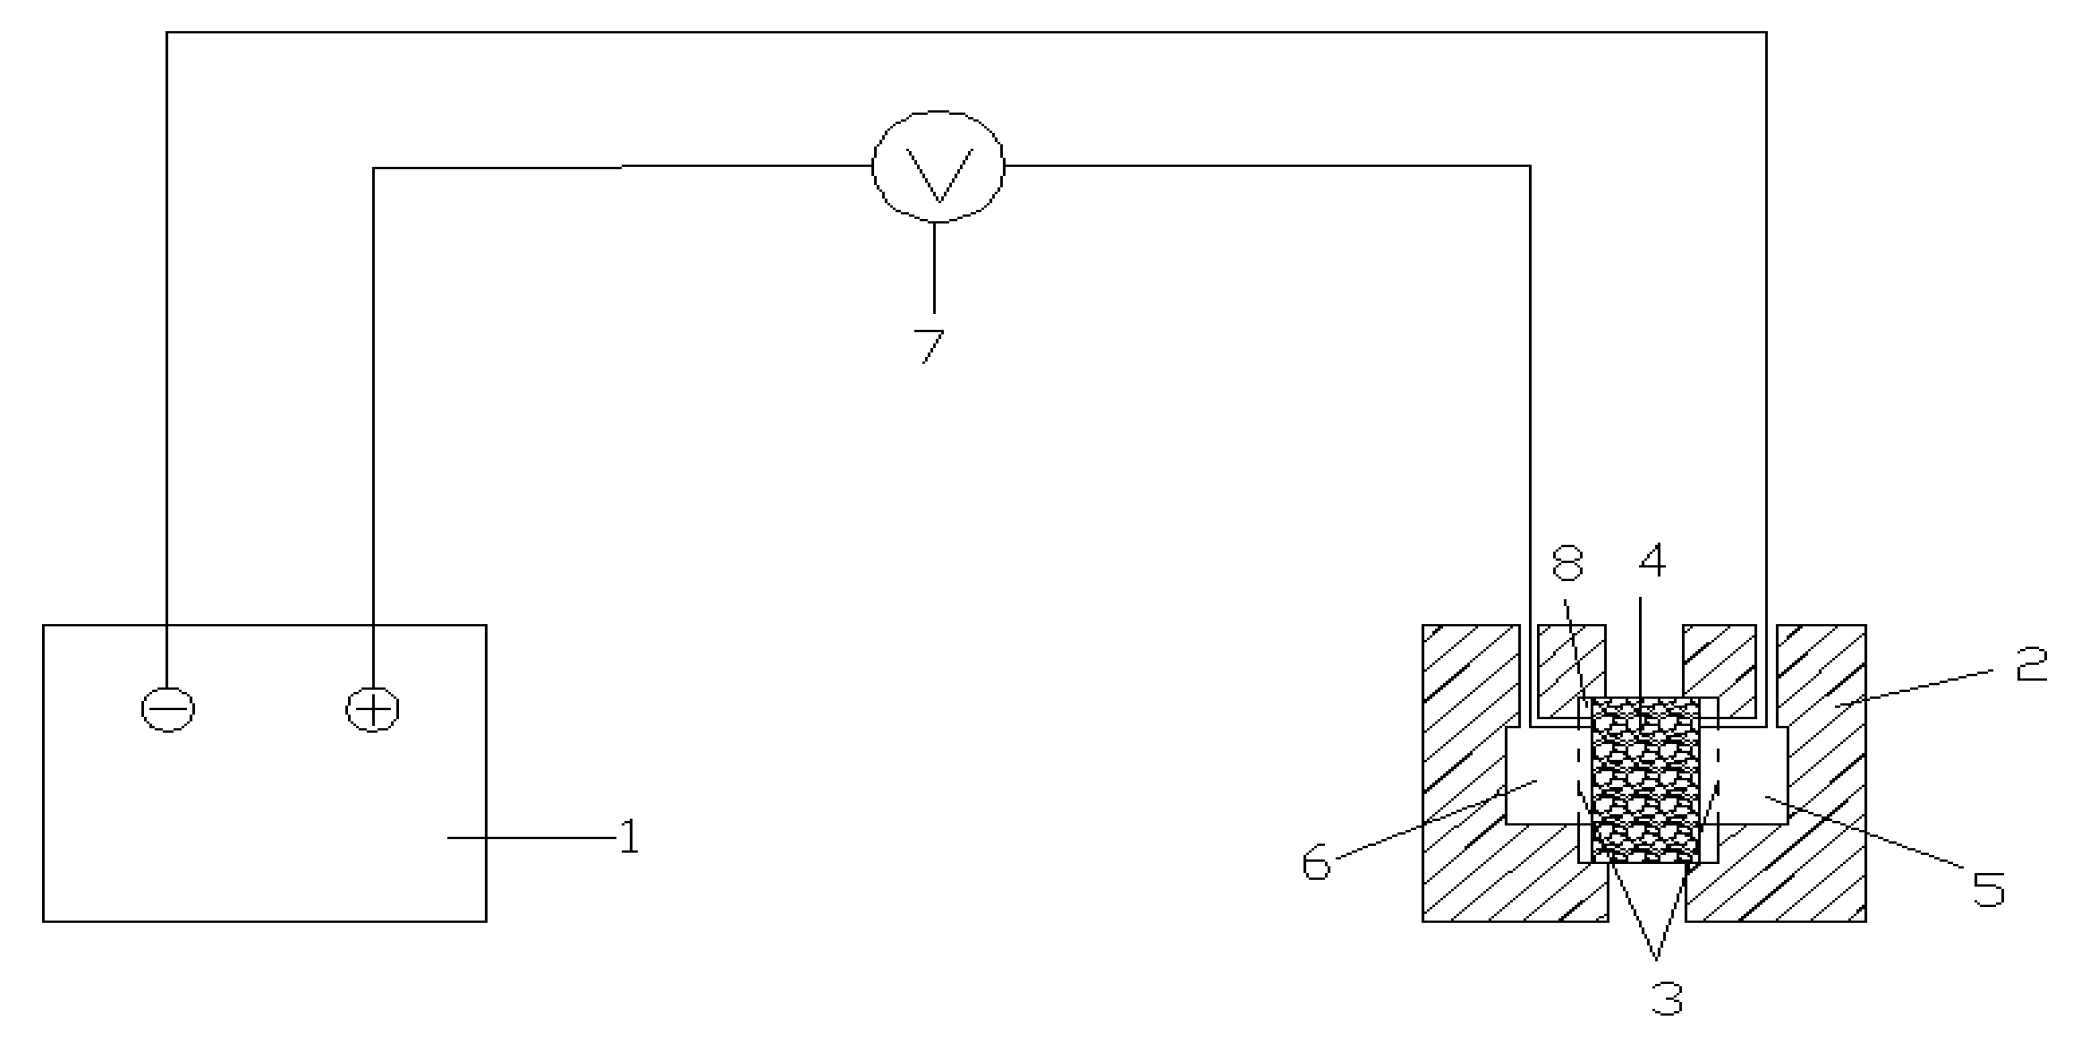
2.3.5. Impermeability

To assess the impermeability of the waste rubber powder cement concrete, the electrical flux method was deployed. Chloride ion permeability testing was conducted using an NJW-AB computer-controlled vacuum water absorption machine (Figure 7) and an NJW-RCP-6B concrete chloride ion electrical flux determination device (Figure 8). The test principle relied on the migration of chloride ions from the negative to the positive electrode through the waste rubber powder concrete under the influence of direct current. The quantity of chloride ions penetrating the waste rubber powder concrete was assessed by measuring the electric charge within the material. Figure 9 depicts the schematic diagram of the chloride ion penetration test device.

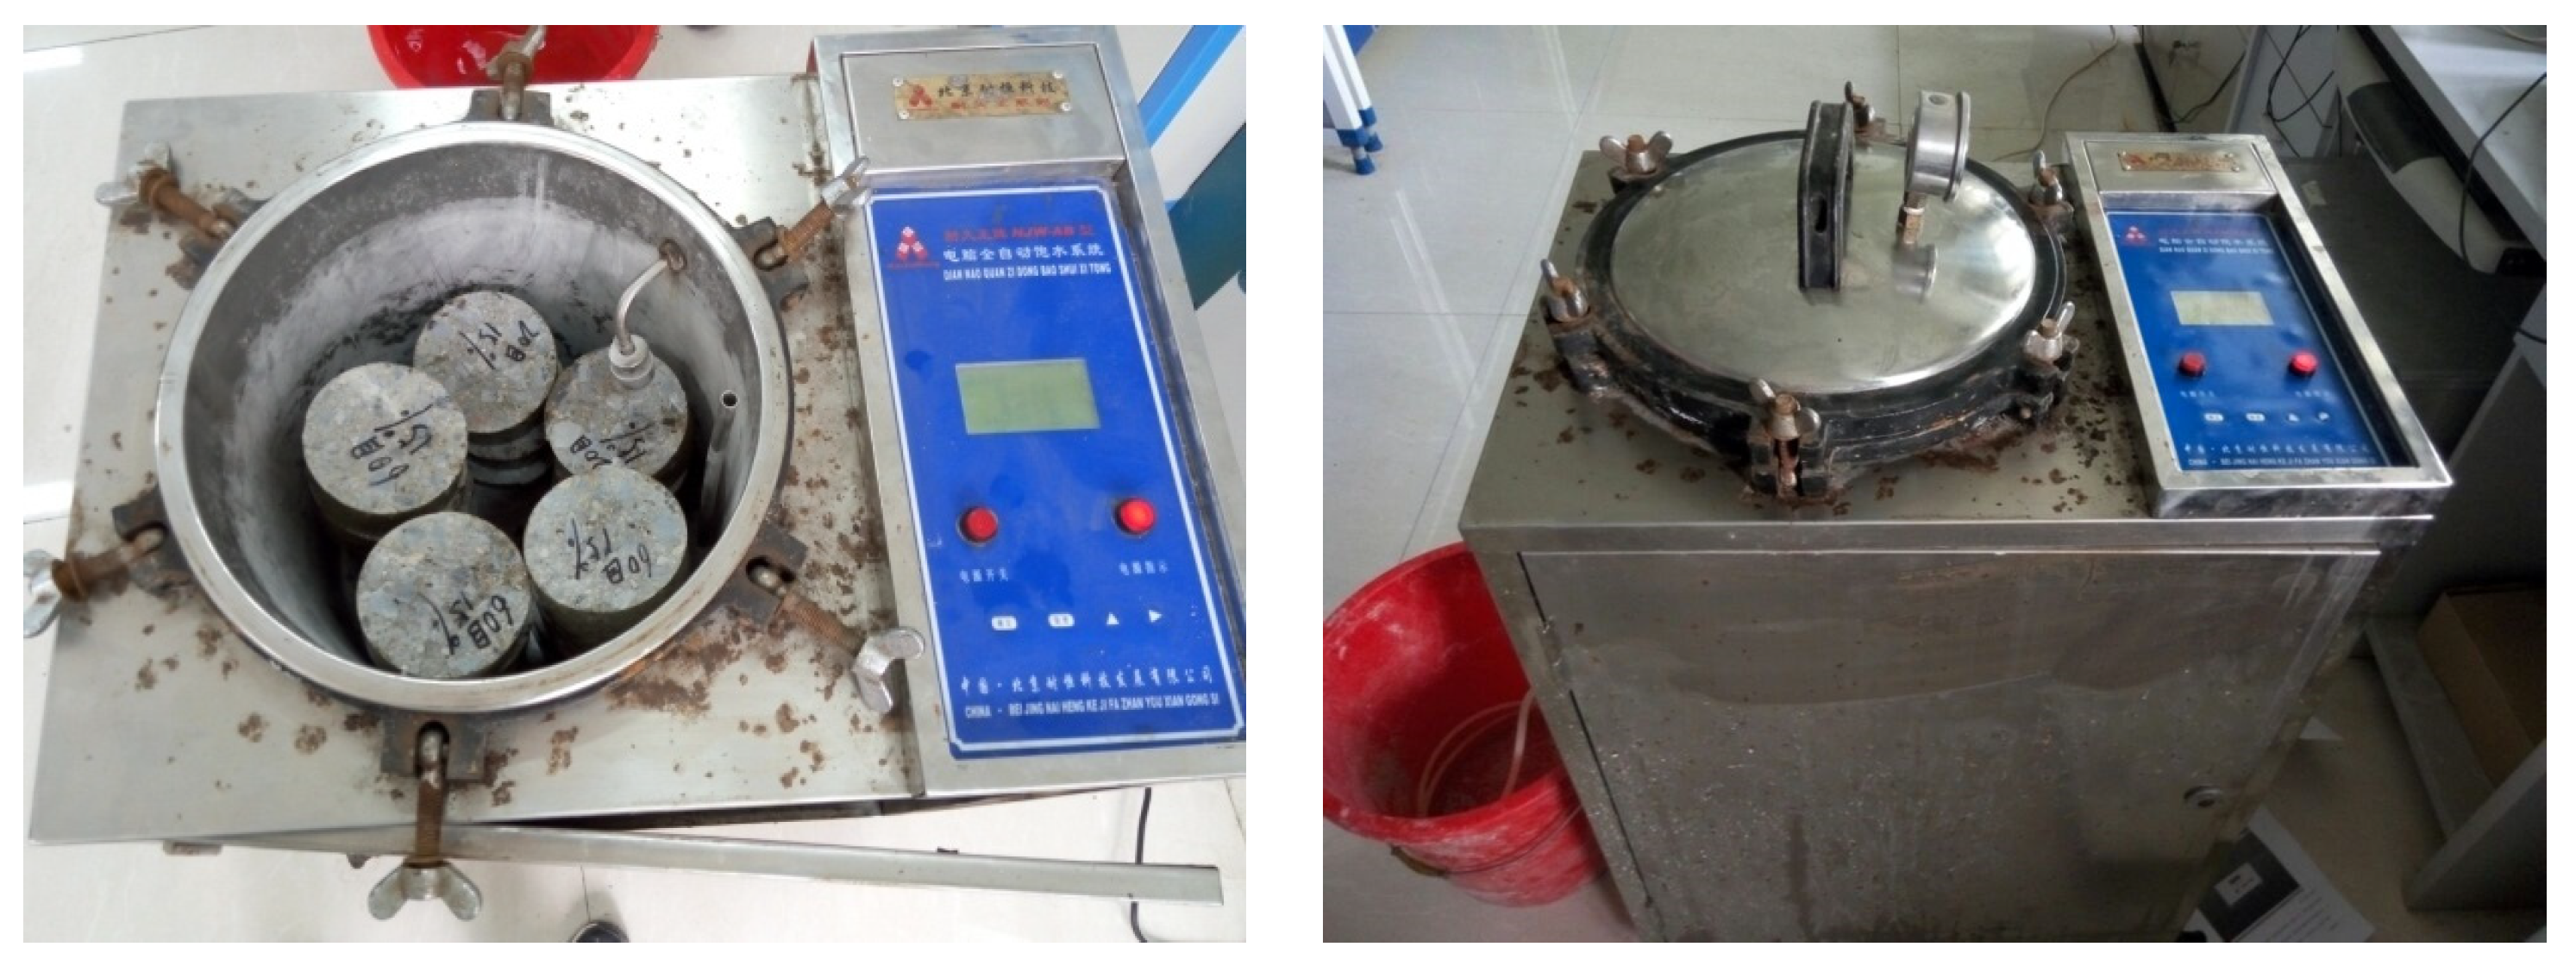
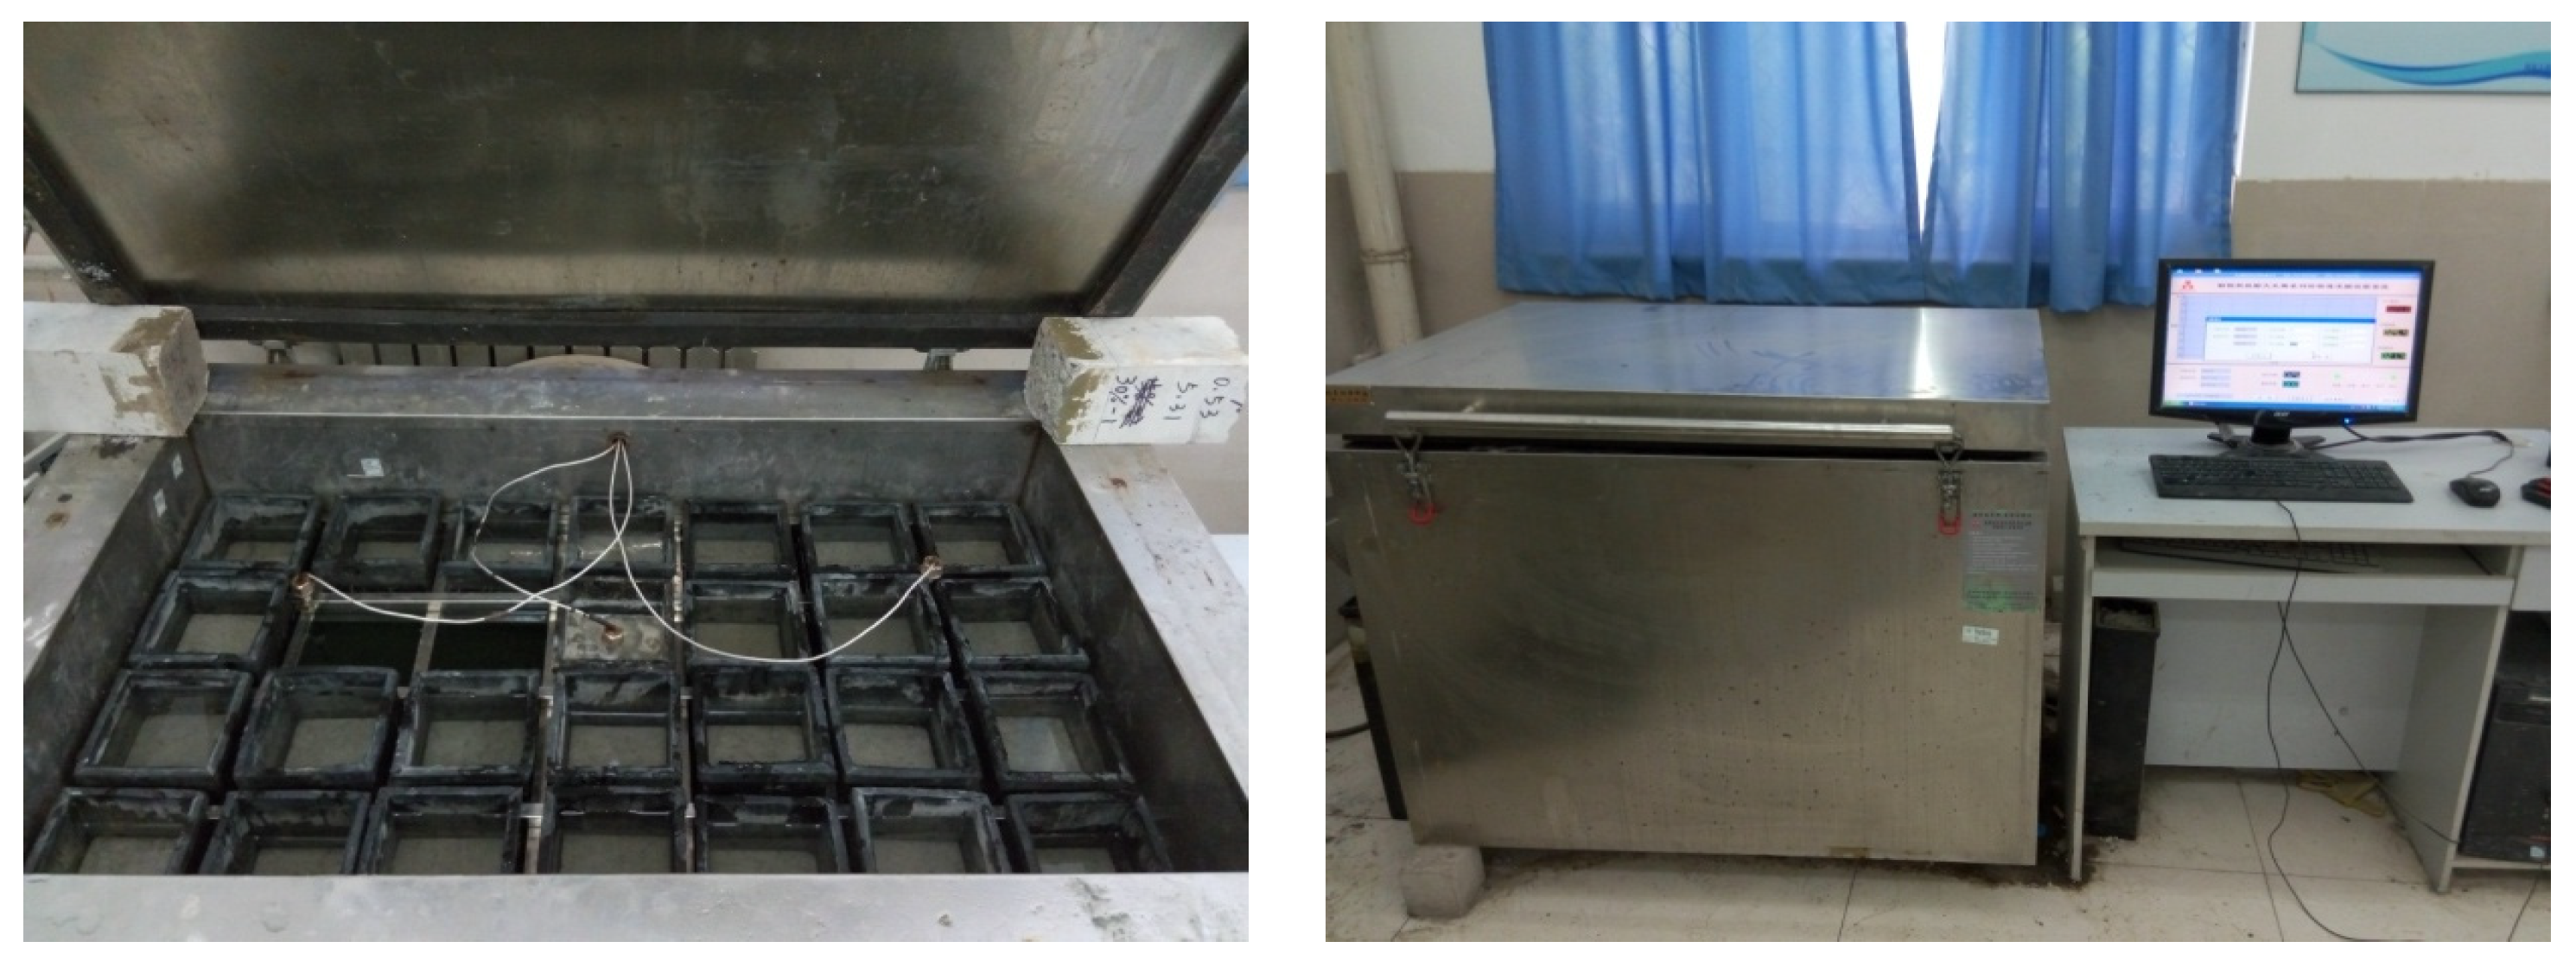
2.3.6. Freezing Resistance

Following a 24-day standard maintenance period, the specimens were immersed in water for four days. After removal, the surface moisture was wiped off, and the specimens were weighed and measured for transverse fundamental frequency using a D7-16 dynamic meter. Subsequently, they underwent concrete rapid freezing-thawing tests, with mass and dynamic modulus measurements recorded after every 25 freeze-thaw cycles. The experiment ceased if the mass loss exceeded 5%, after 300 freeze-thaw cycles, or if the threshold was met after 200 cycles. Figure 10 illustrates the D7-16 dynamic modulus tester and the concrete rapid freezing-thawing test machine utilized in this research. Formula (3) shows the calculation of the mass loss rate.
Mess   loss   rate   ( % ) = m 0 m n m 0 × 100 %
where m0 = the mass of the sample before freeze-thaw cycles and mn = the mass of the sample after n freeze-thaw cycles.

3. Results and Discussion

3.1. Optimal Design Based on the Mix Design of the RSM

The experimental and predicted responses of the 17 runs of experiments on 7 d and 28 d flexural strength are provided in Table 5. The flexural strength was correlated with the water–cement ratio, sand ratio, and 10-mesh waste rubber powder content. The obtained quadratic regression models are given in Formulas (4) and (5).
7   d   flexural   strength = 34.13 + 17.55 A + 2.13 B + 0.34 C 0.38 A B 0.14 A C 6.00 × 10 3 B C 11.9 A 2 0.03 B 2 6.49 × 10 3 C 2
28   d   flexural   strength = 28.46 + 13.25 A + 1.88 B + 0.32 C 0.3 A B 0.07 A C 6.25 × 10 3 B C 10.4 A 2 0.03 B 2 6.74 × 10 3 C 2
where A = water-cement ratio; B = sand ratio; and C = 10-mesh waste rubber powder content.
Diagnostic plots were employed to assess the adequacy of the chosen model [33]. The model volatility was illustrated through residuals, indicating the variance between the predicted and calculated values. The association among the model residuals, calculated values, and predicted values is illustrated in Figure 11 and Figure 12.
Figure 11 and Figure 12 illustrate the residuals of each experimental scheme in the model, showing consistently small deviations. Both the experimental and predicted results followed a similar pattern, displaying a predominantly linear distribution. This uniformity indicates the model’s high accuracy and its suitability for predicting and optimizing flexural strength at 7 and 28 days. Utilizing the constraints outlined in Formula (6), the optimal mix proportion of waste rubber powder cement concrete was derived from the model. Subsequently, 10 sets of optimized schemes were chosen and are detailed in Table 6.
{ 0.35 Water-cement   ratio 0.45 32 % sand   ratio 36 % 5 % 10 mesh   waste   rubber   powder   content   15 % 4.47 7 d   flexural   strength 5.6 5.01 28 d   flexural   strength 6.18
Analysis of the optimization design results in Table 6 revealed that with a constant water–cement ratio and a sand ratio within the range of 33% to 36%, the waste rubber powder content should not surpass 10%.

3.2. Influence of Waste Rubber Powder Concrete Composition Materials

The response surface analysis elucidated the response behavior concerning variable alterations [29]. The 7-day and 28-day flexural strength were scrutinized concerning variations in the input variables, namely the water–cement ratio (A), sand ratio (B), and waste rubber powder content (C). Figure 13, Figure 14 and Figure 15 depict the response surface plots delineating the concrete strength derived from the multivariate regression equations (Formulas (4) and (5)). These plots facilitated discerning the influence of any two factors on the 7-day and 28-day flexural strength, thereby identifying the optimal range of component materials based on these strengths.
Figure 13 and Figure 14 indicate that as the water–cement ratio decreased, there was a steady rise in both the 7-day and 28-day flexural strengths of the cement concrete. Meanwhile, adjustments in the sand ratio had a limited impact on these strengths, with a tendency to initially rise before declining.
According to Figure 15 and Figure 16, the 7-day and 28-day flexural strengths of cement concrete decreased progressively with an escalation in the waste rubber powder content. This trend stemmed from the compromised interfacial bonding between the cementitious elements induced by the presence of the waste rubber powder and the consequent reduction in flexural strength.
The data presented in Figure 17 and Figure 18 indicate that changes in sand ratio minimally affected the 7-day and 28-day flexural strengths. In contrast, an increase in waste rubber powder content resulted in a gradual decrease in both the 7-day and 28-day flexural strengths of the cement concrete. Notably, among the three influencing factors, the water–cement ratio demonstrated the most significant impact on flexural strength, while the sand ratio exhibited the least effect.

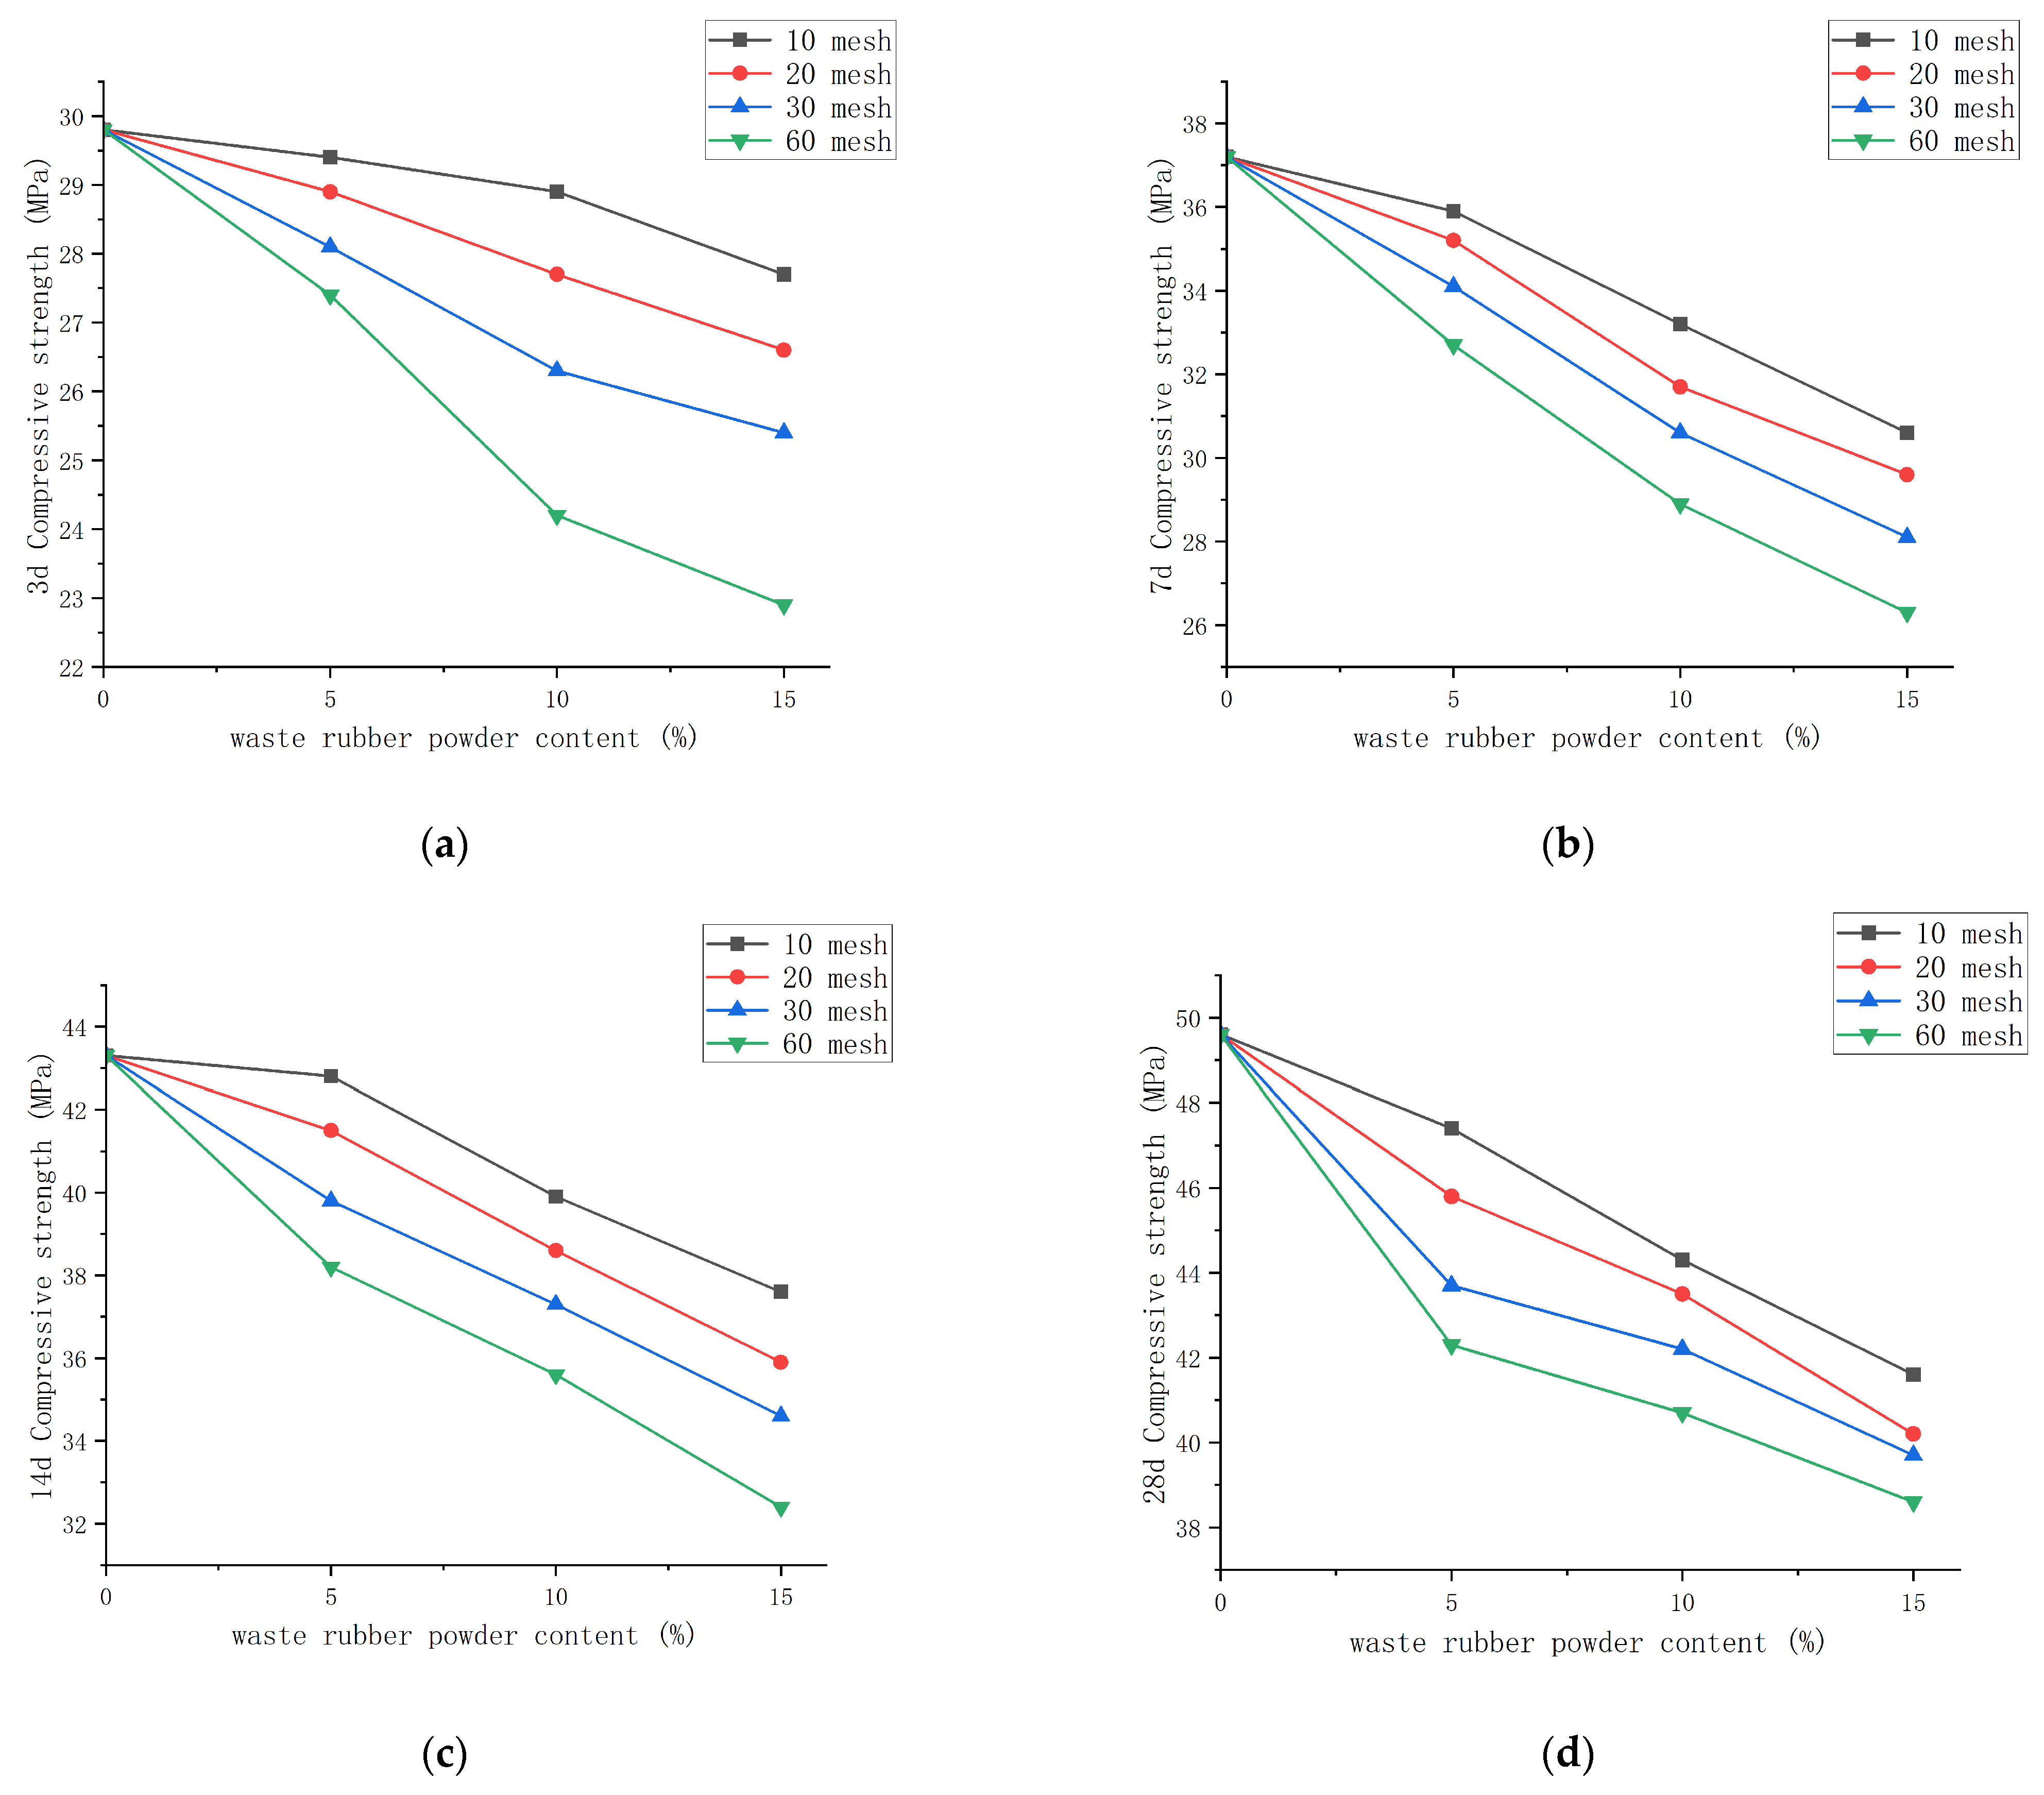
3.3. Compressive Strength

The results depicted in Figure 19 revealed a noticeable impact of waste rubber powder quantity on the compressive strength of waste rubber powder cement concrete. Specifically, when the particle size remained constant, the compressive strength decreased as the waste rubber powder content increased. Additionally, particle size played a role in influencing the compressive strength, with larger particles causing more pronounced reductions in strength at equivalent contents.

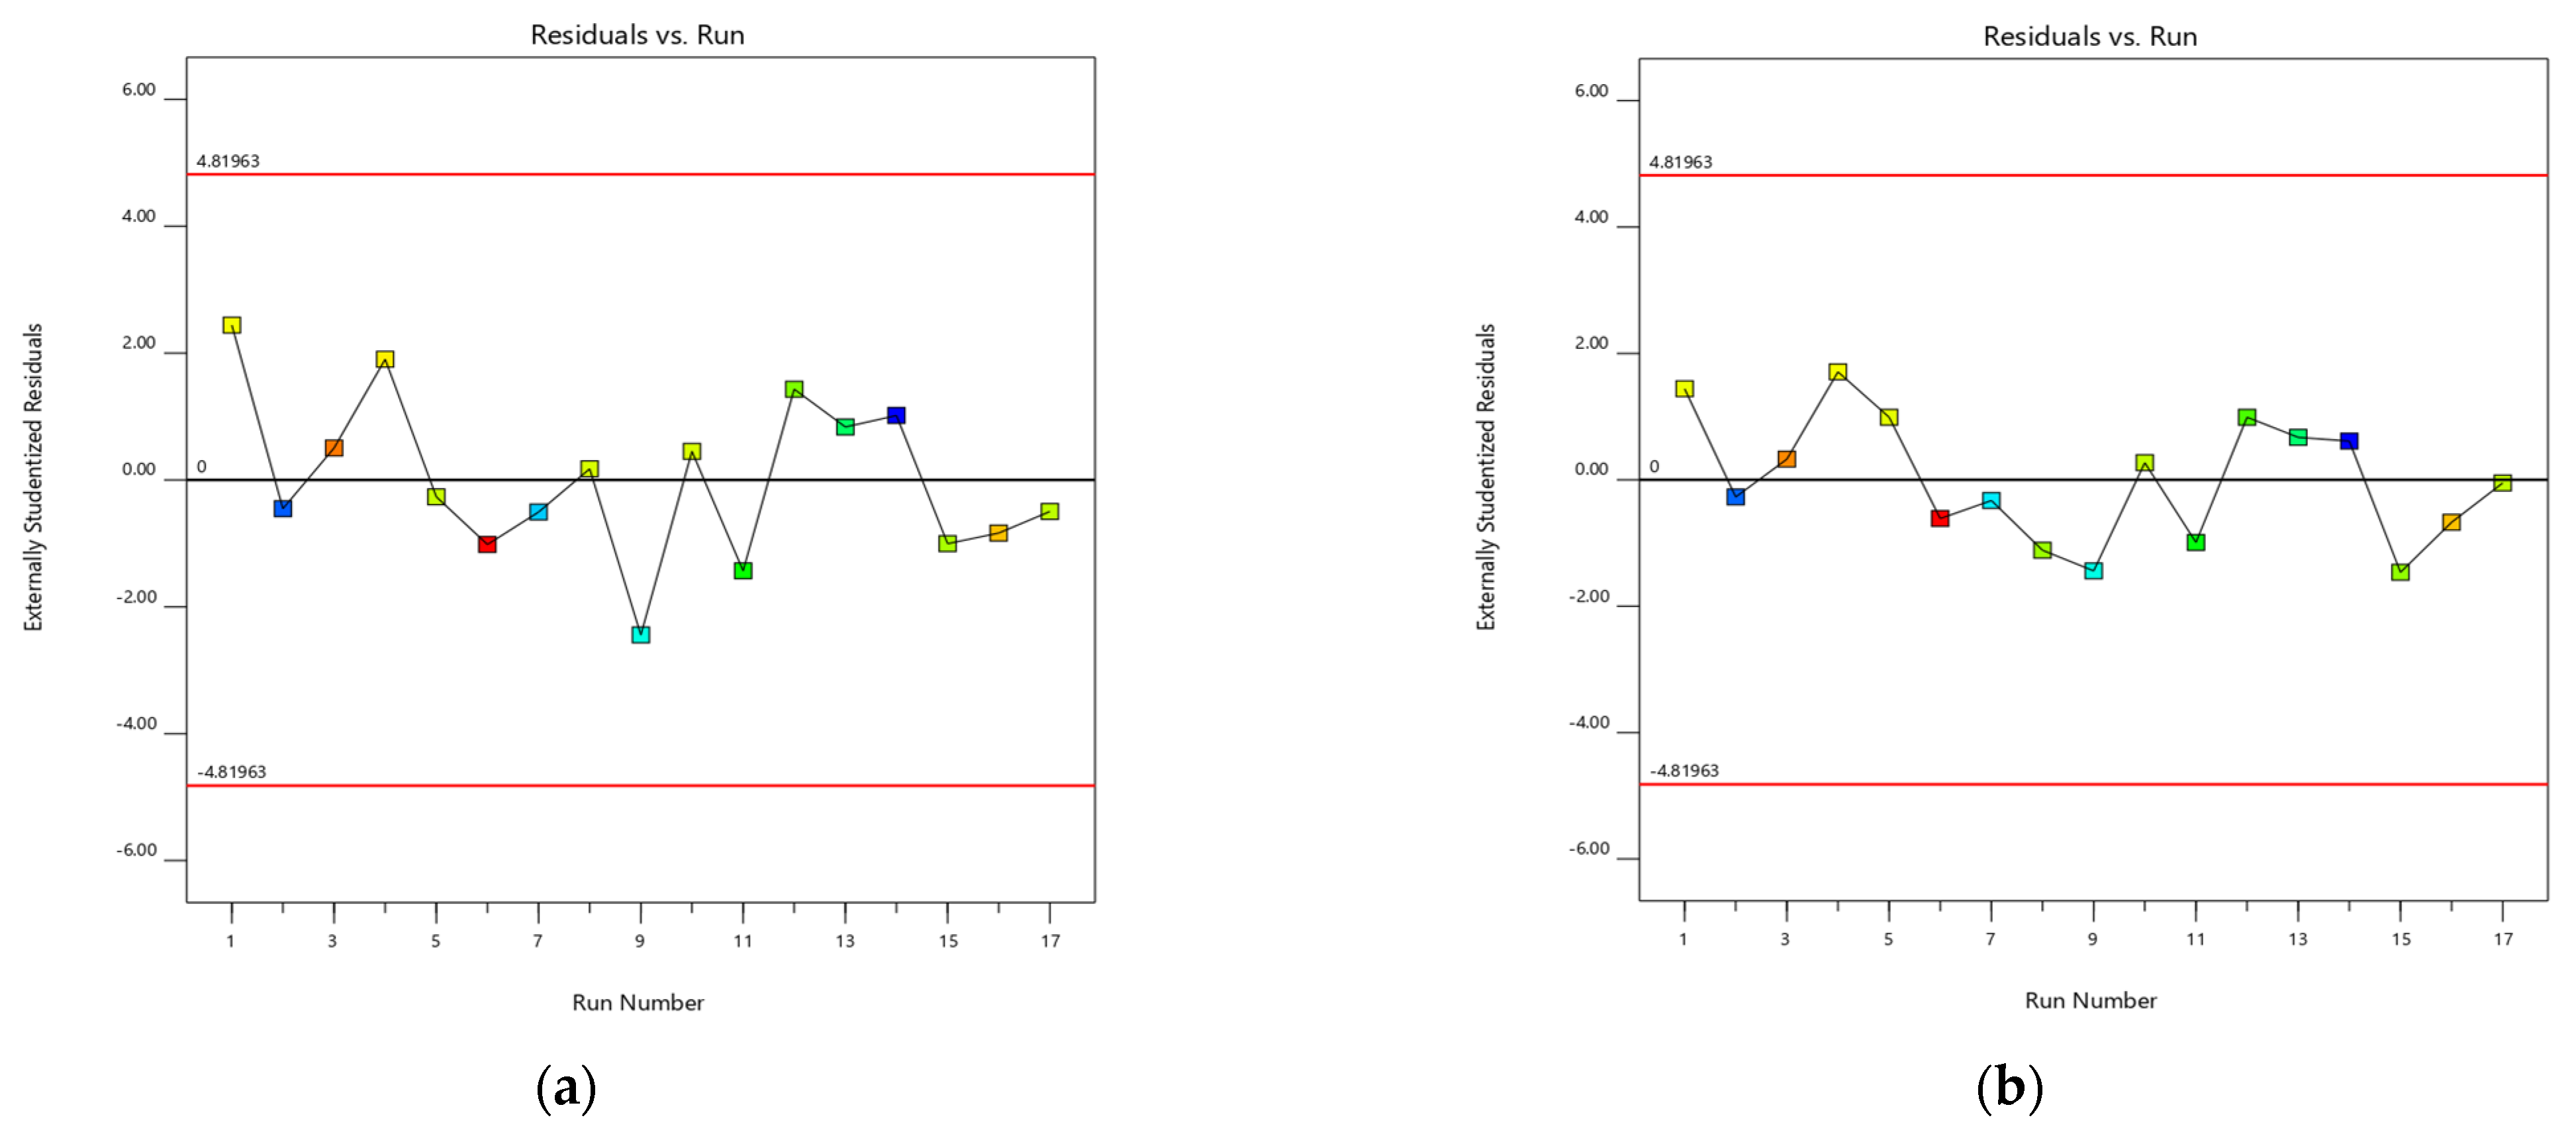
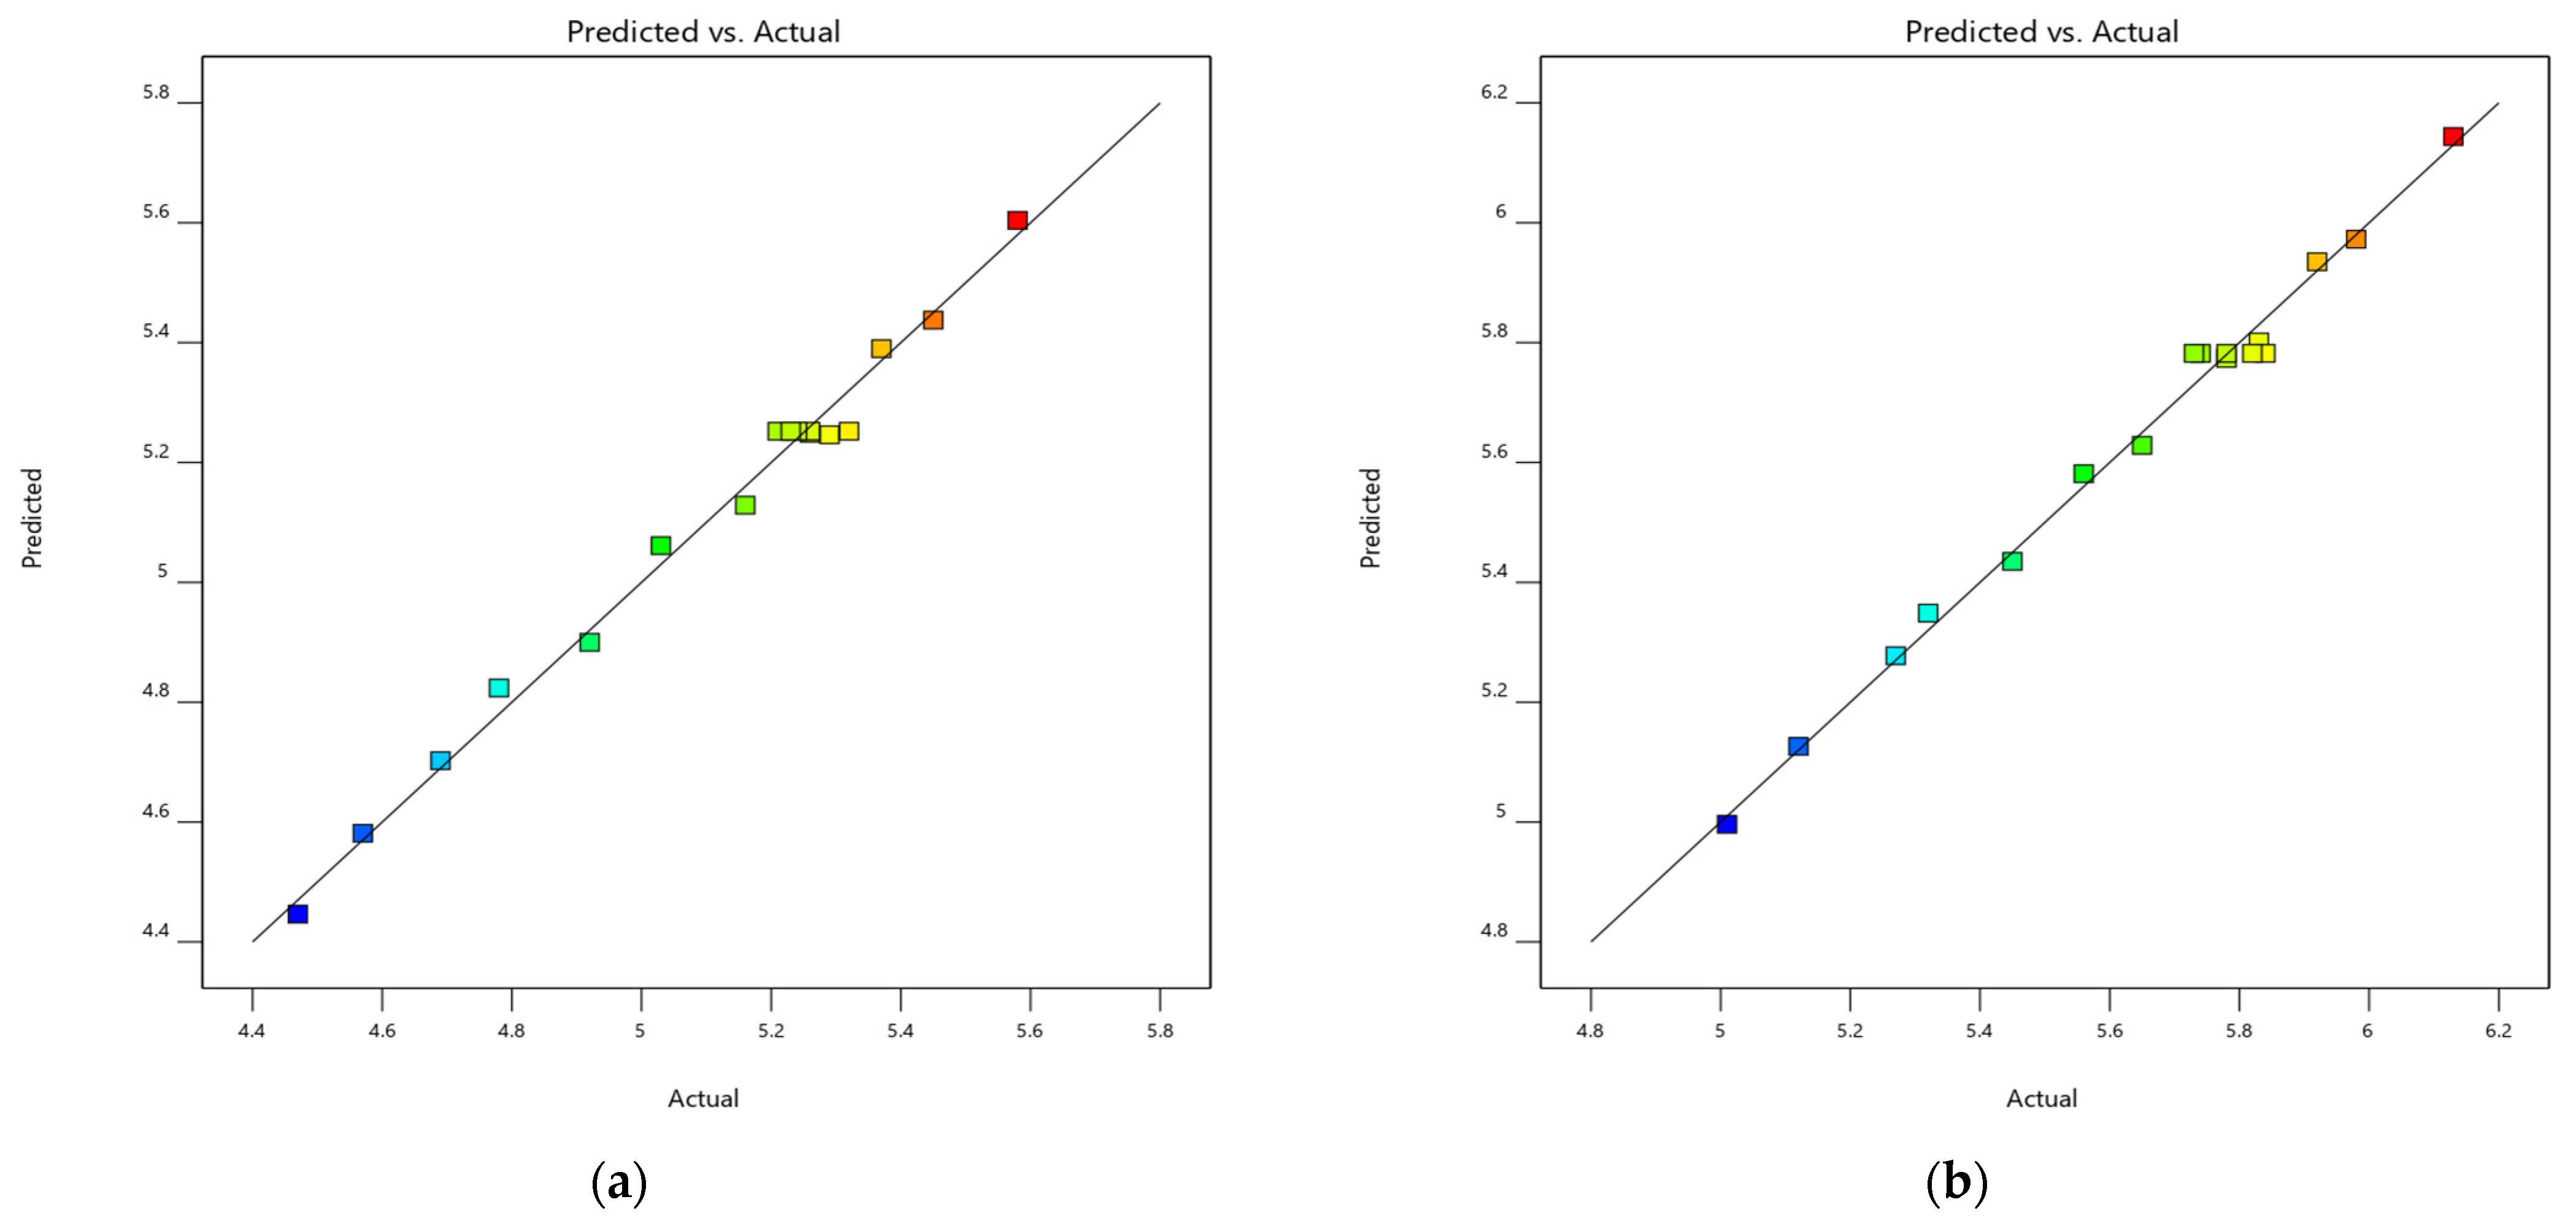
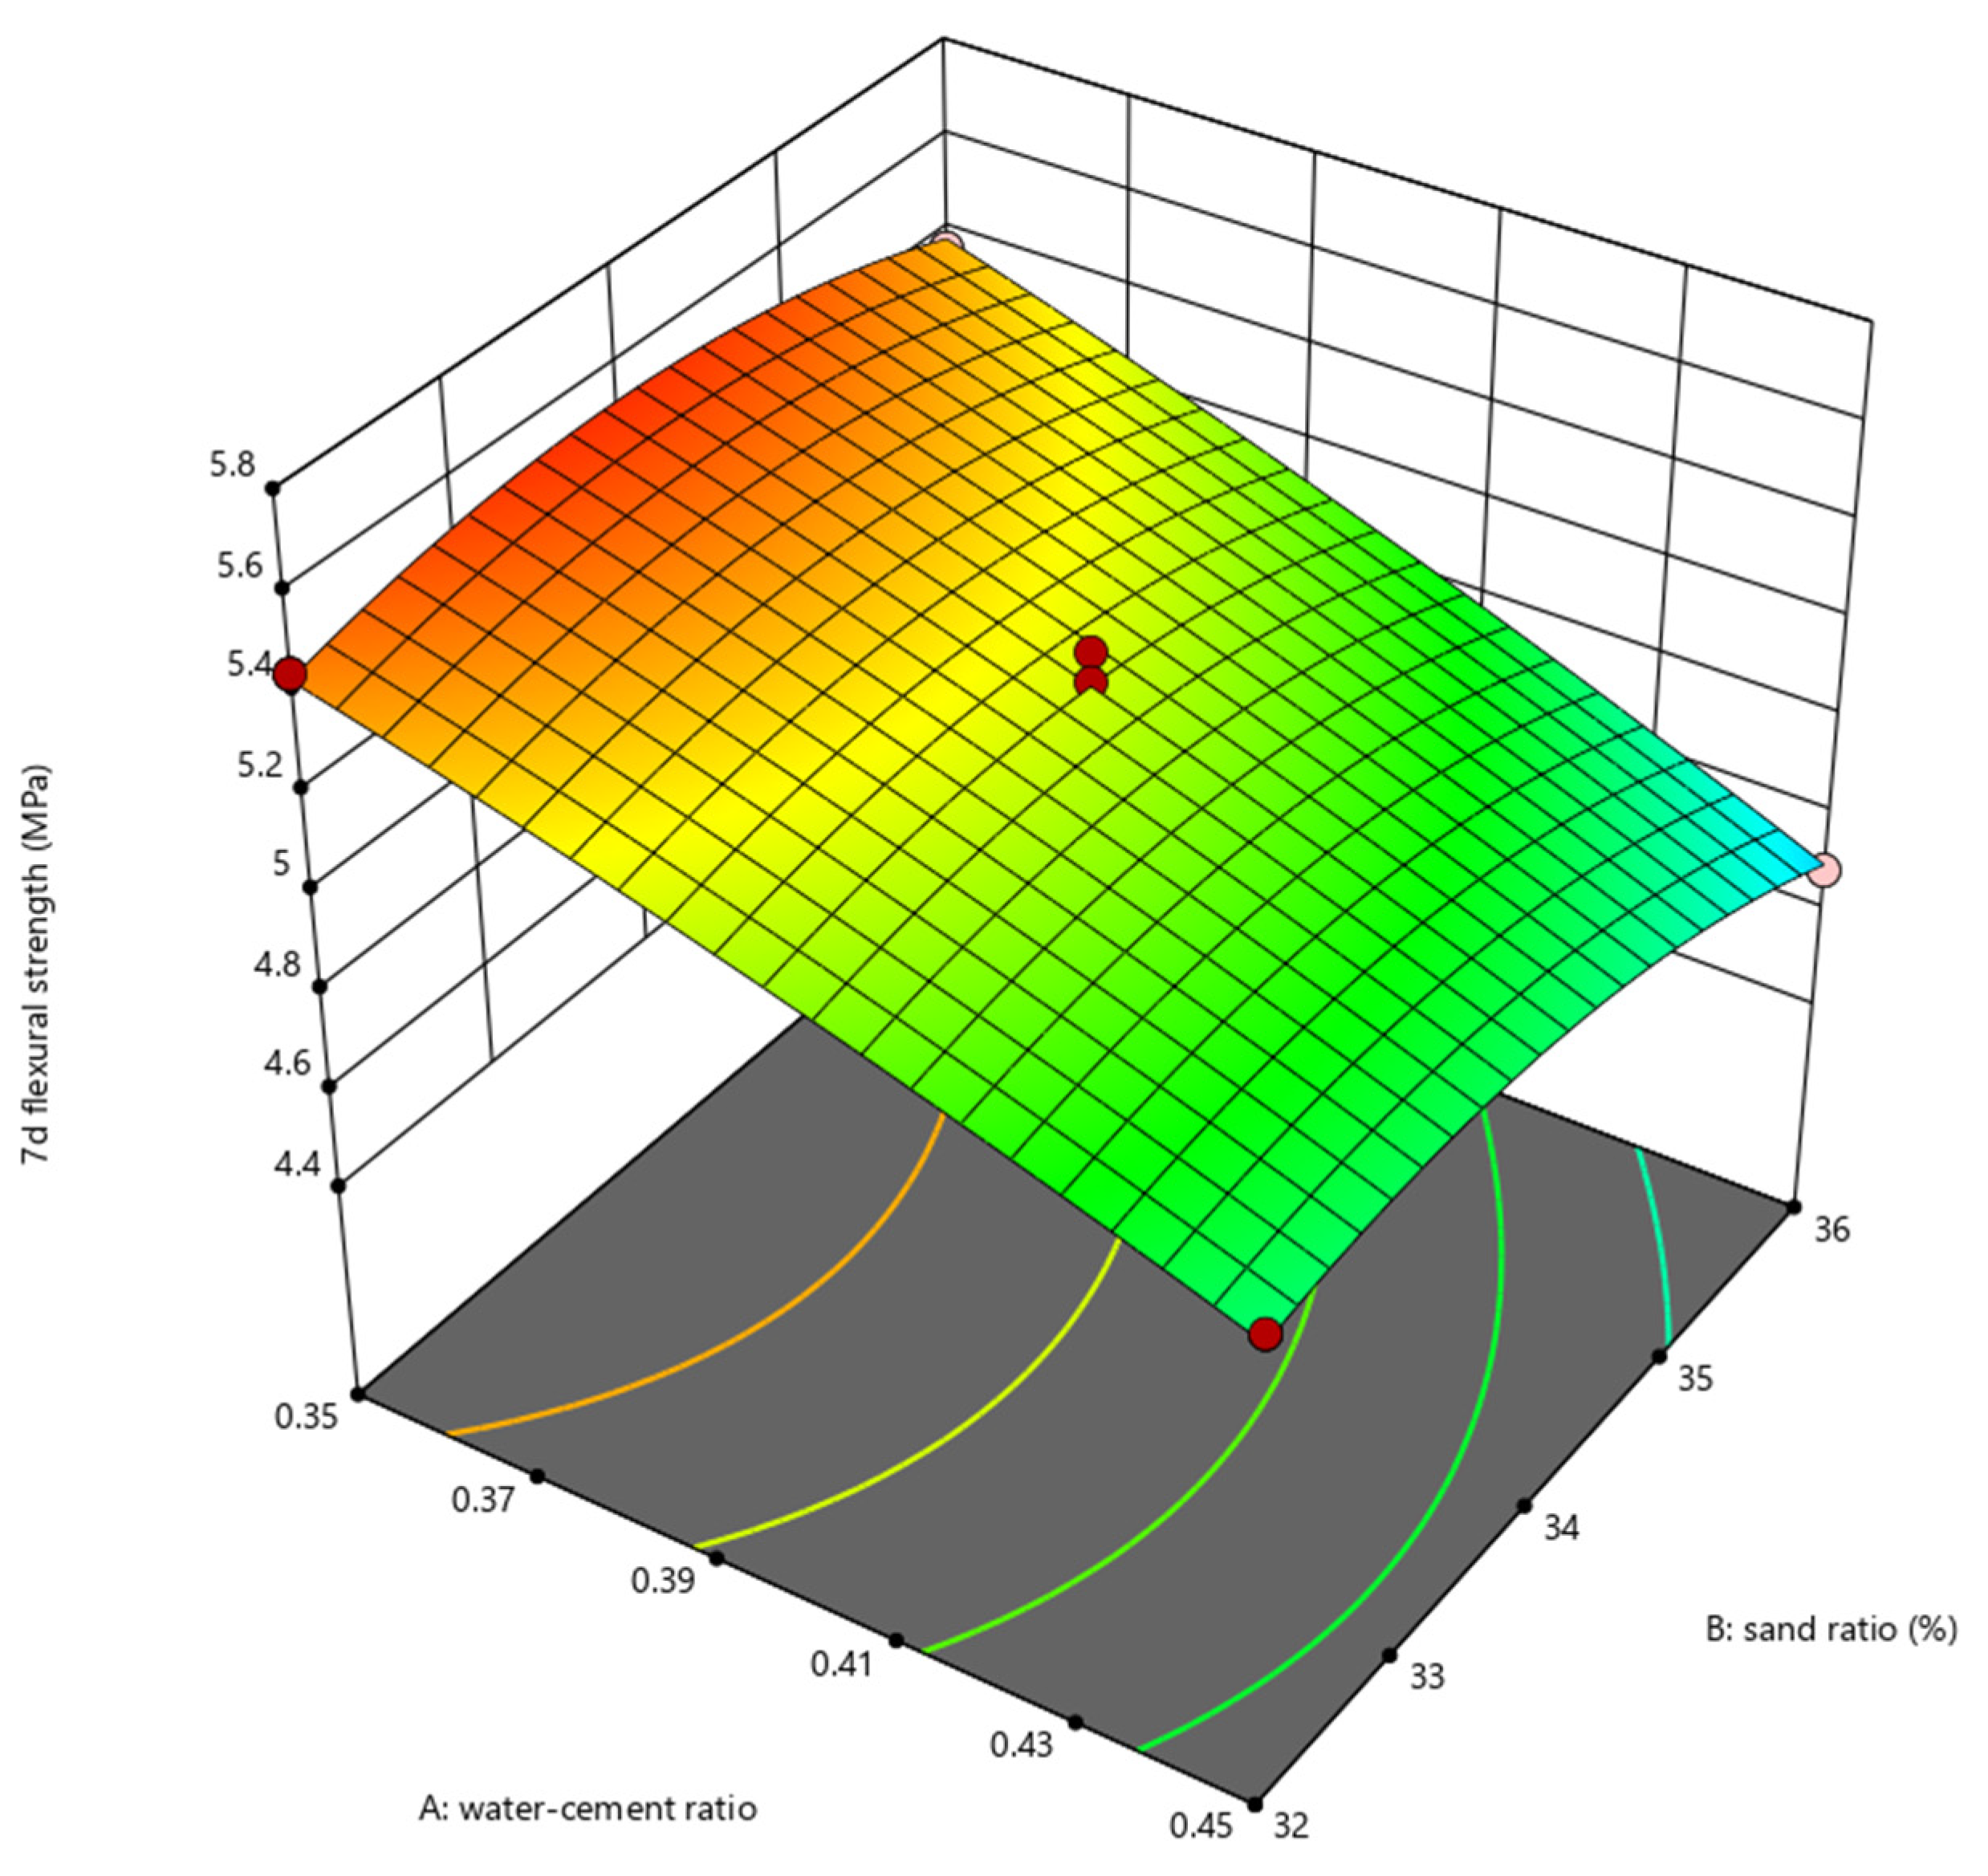
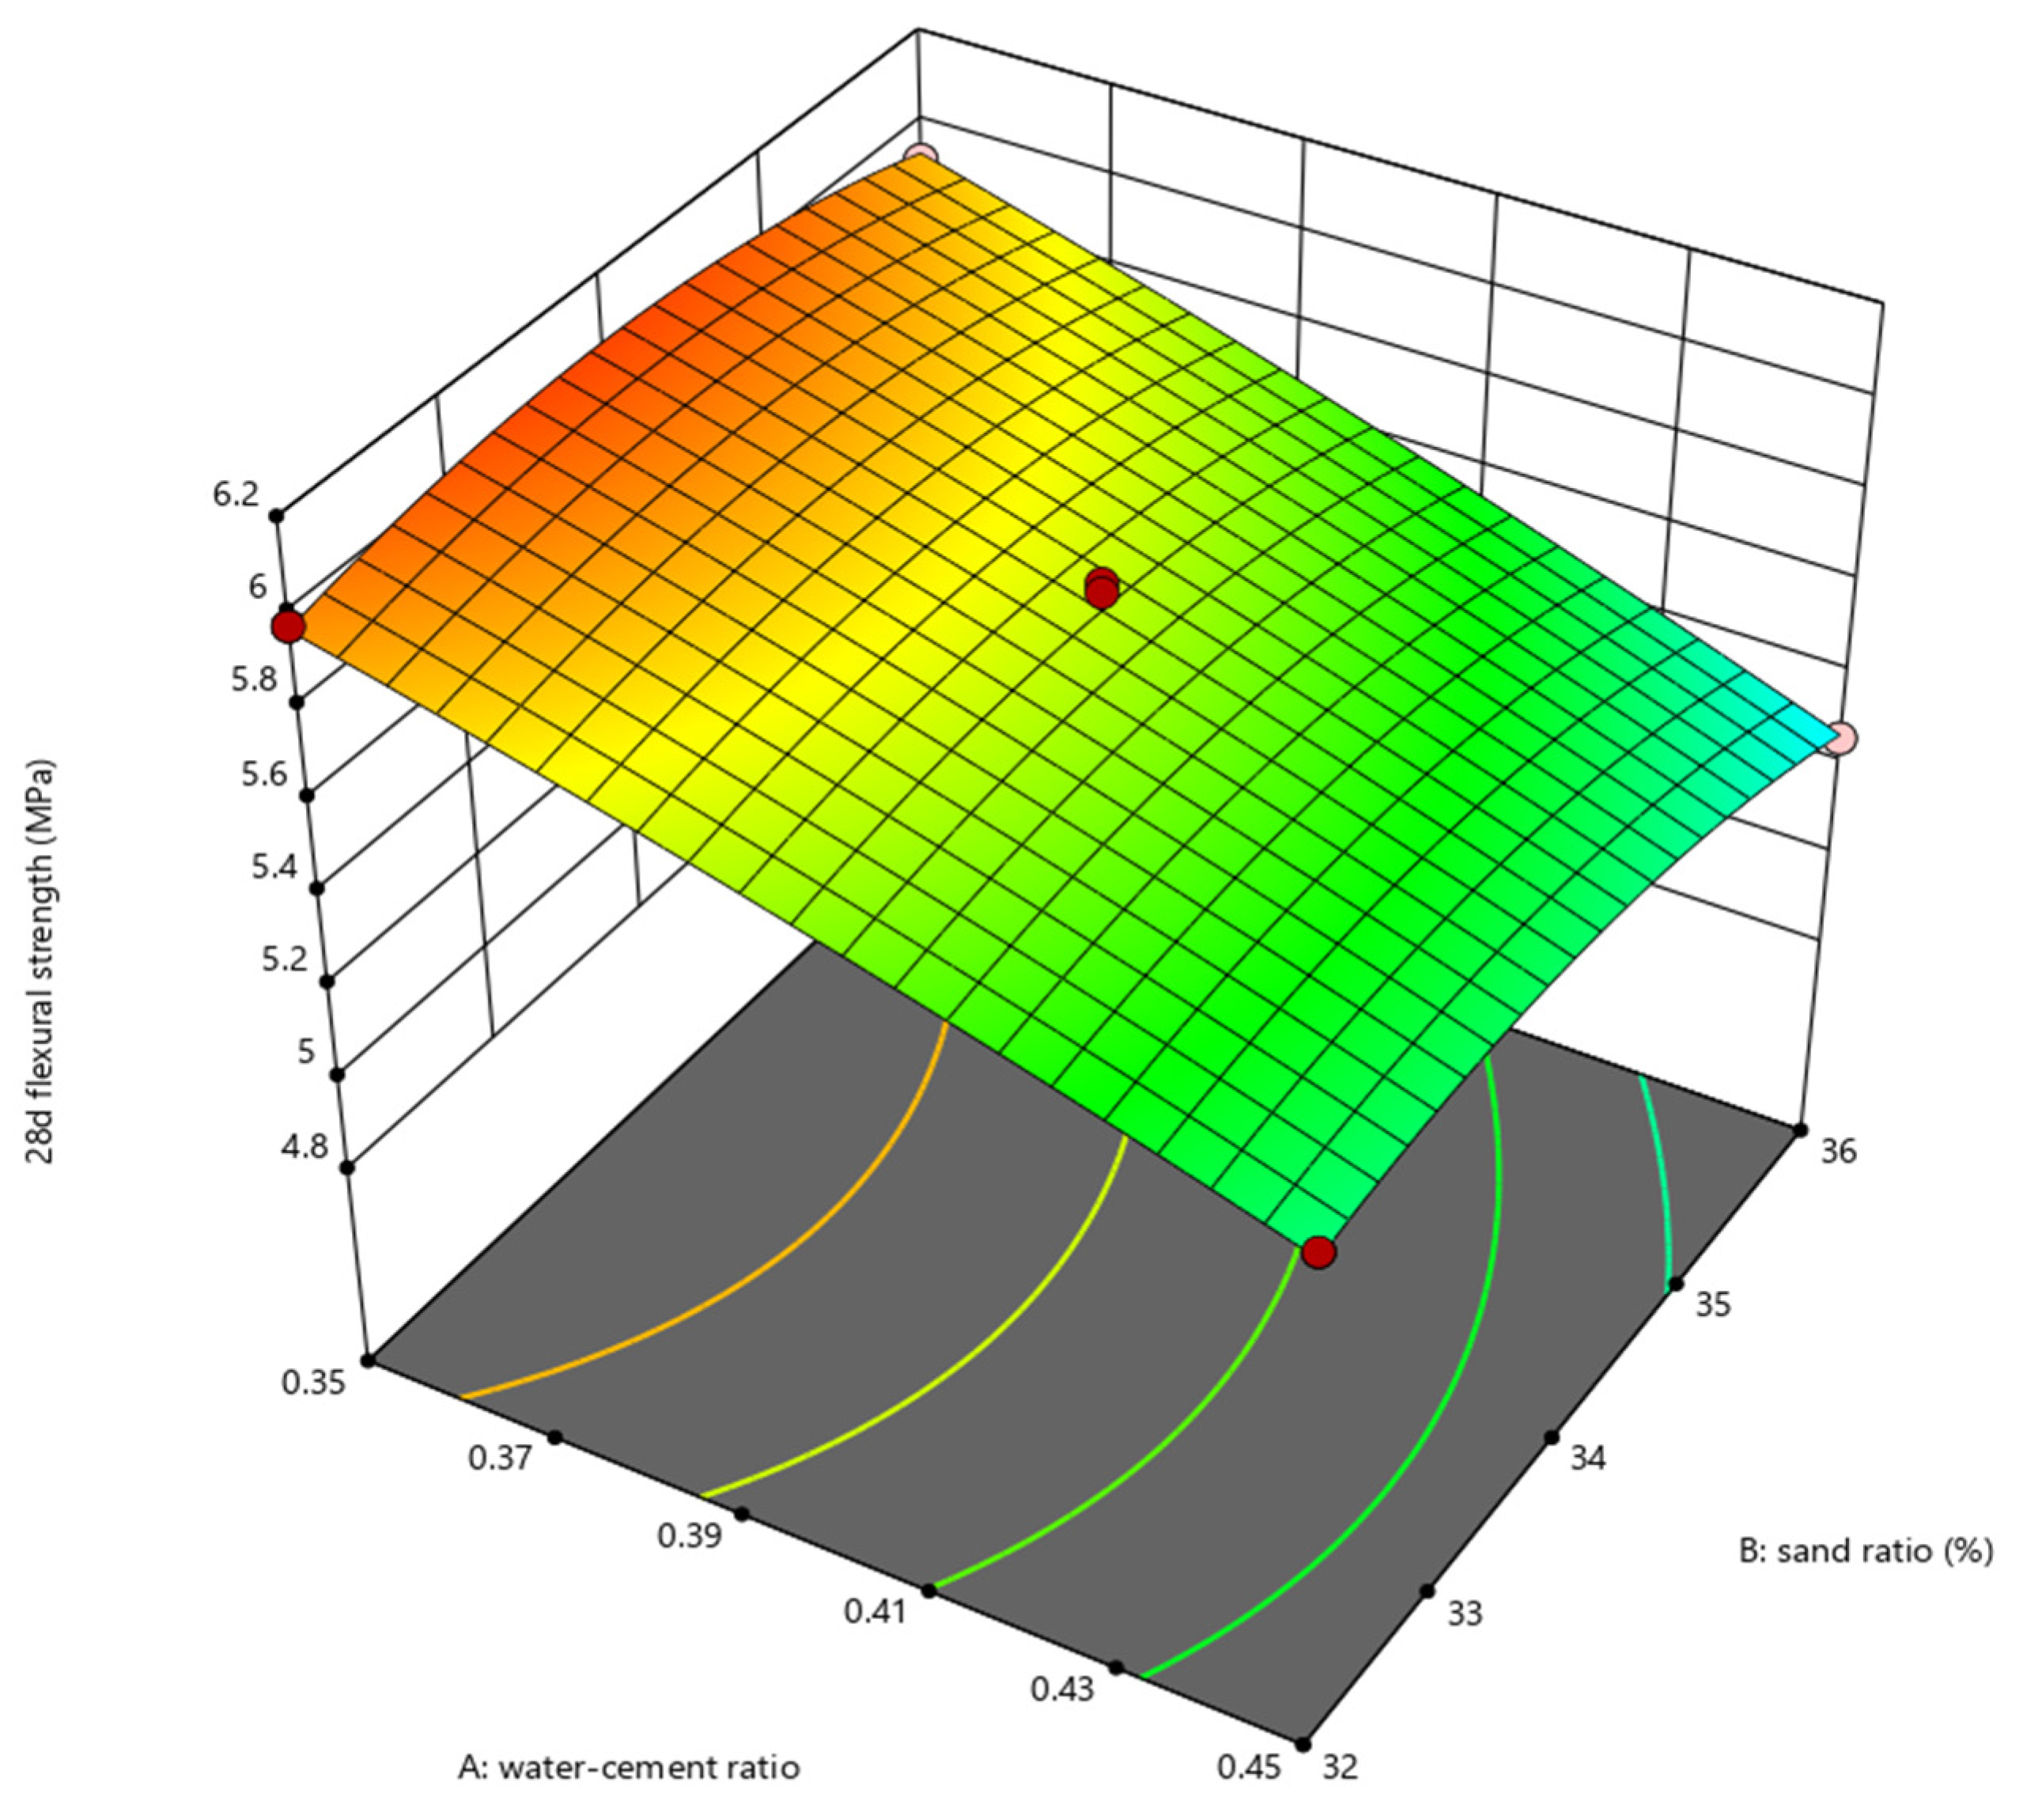
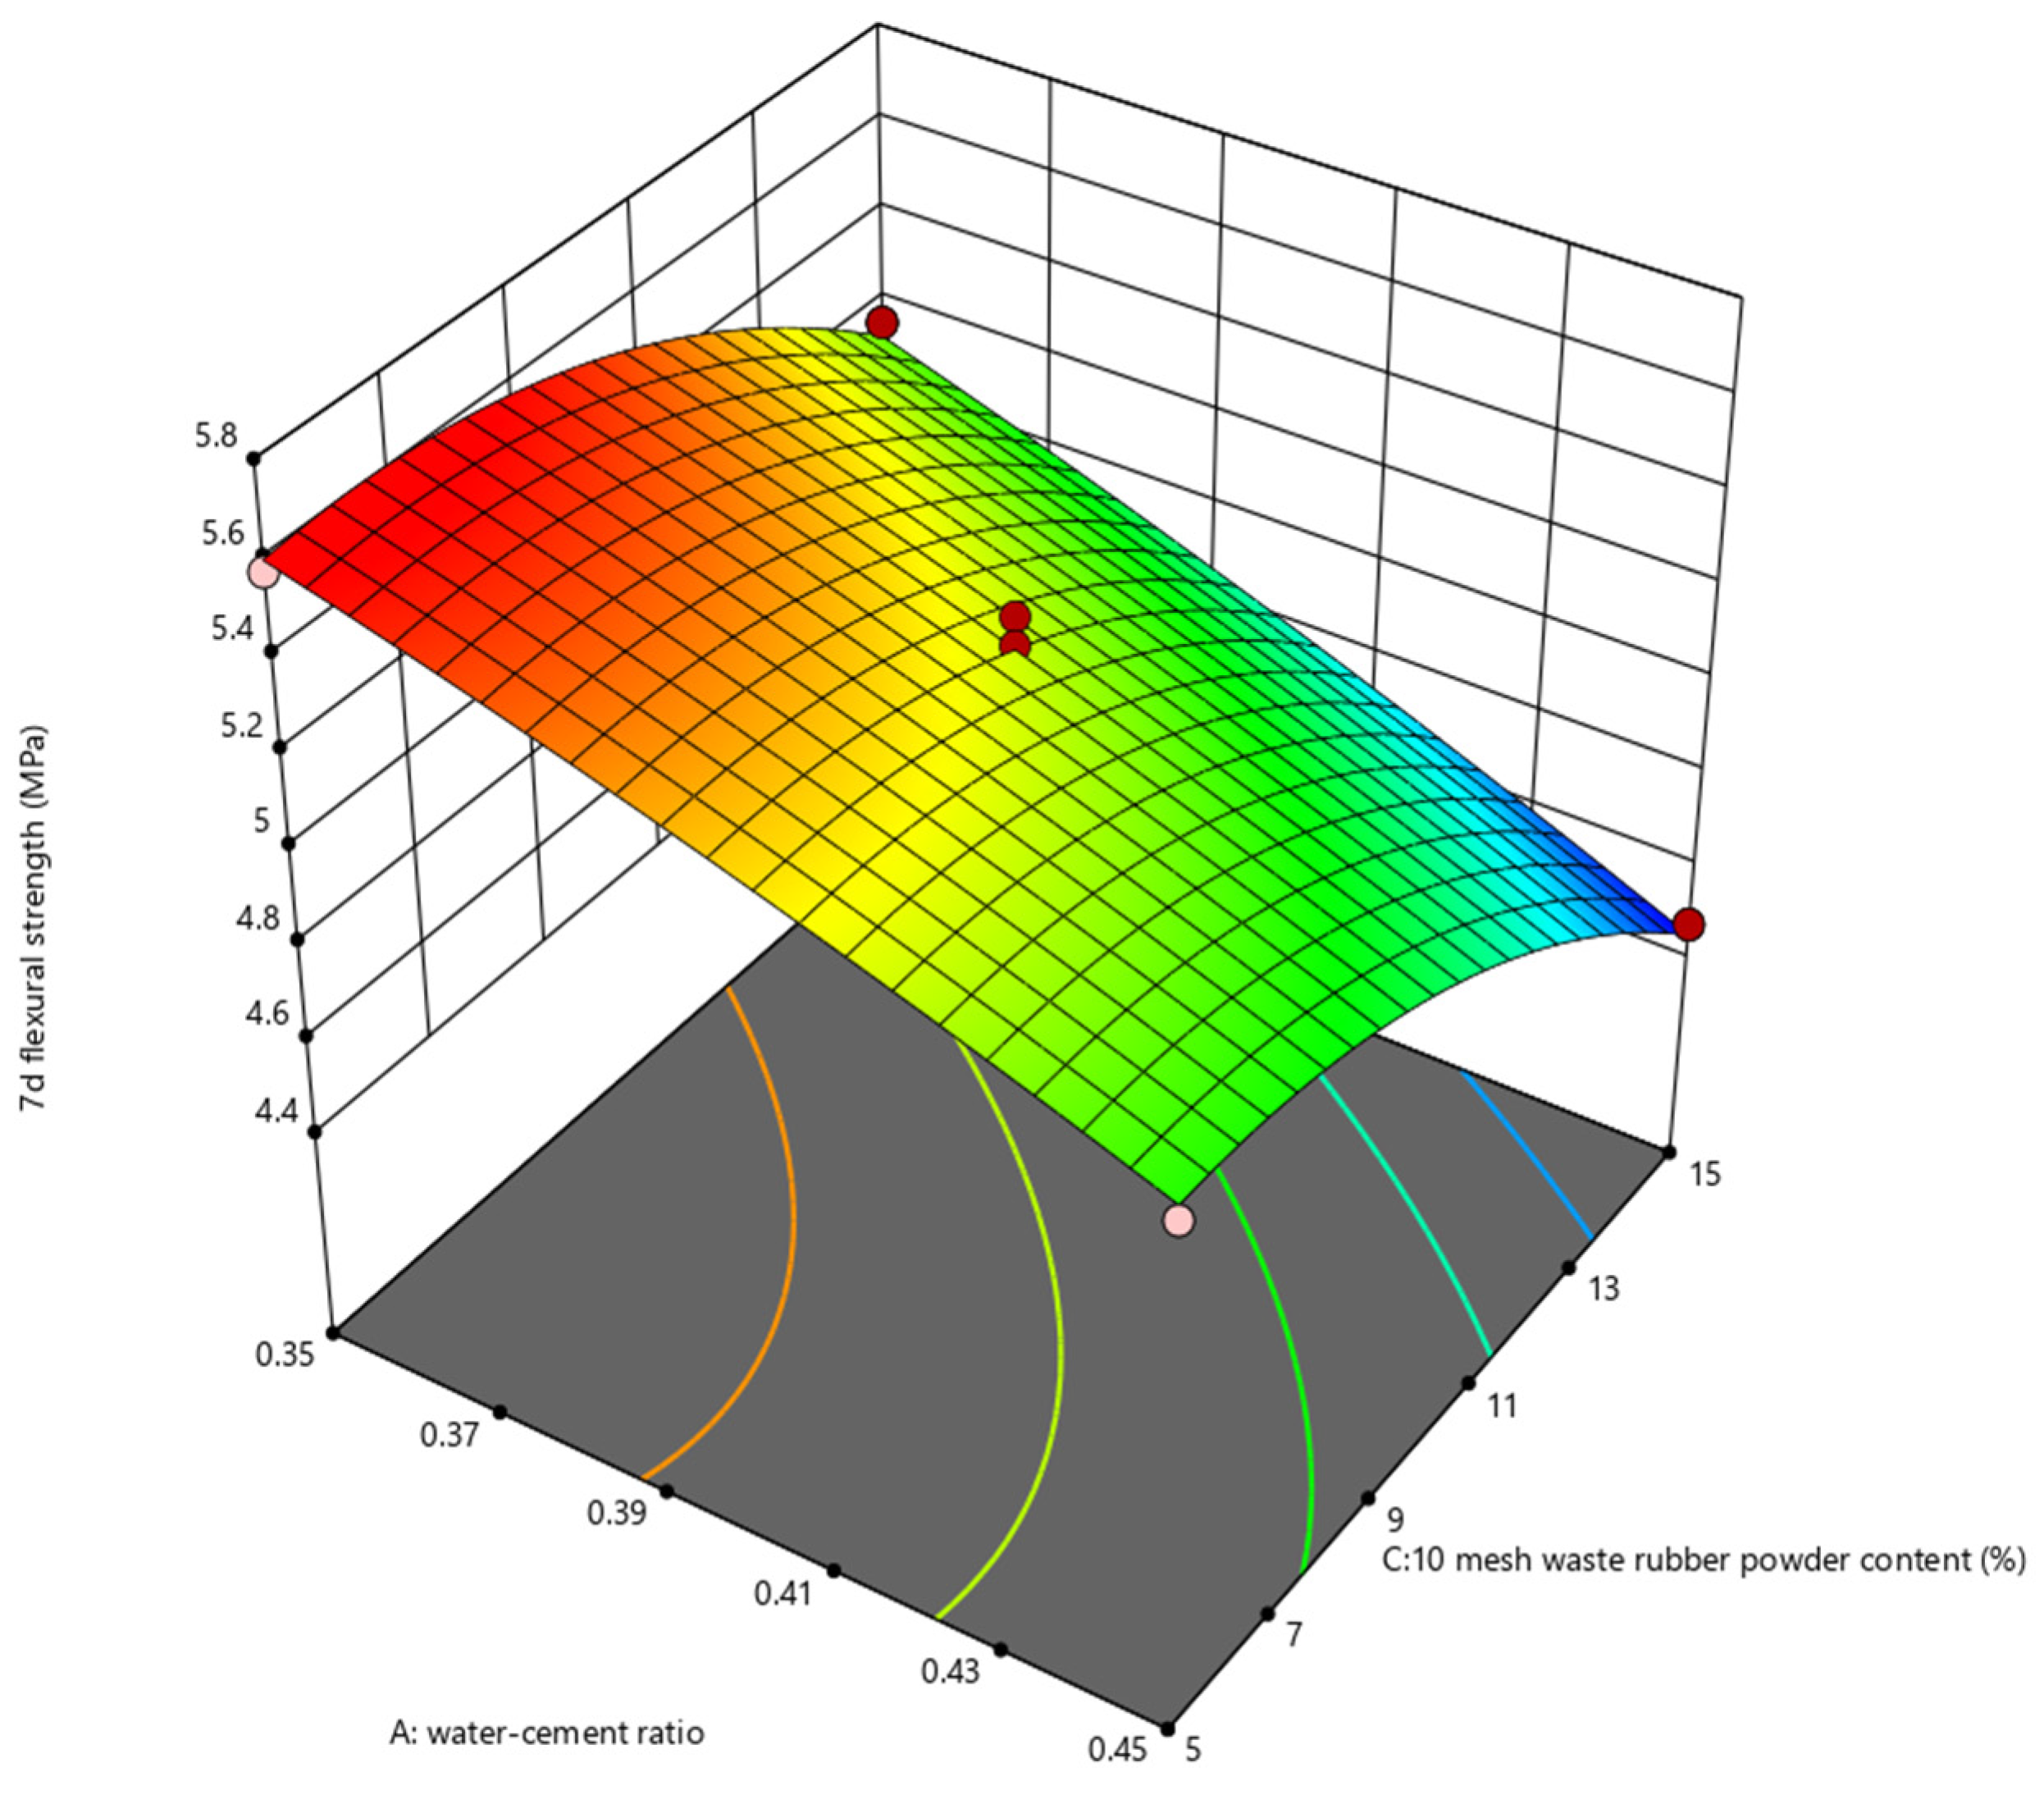
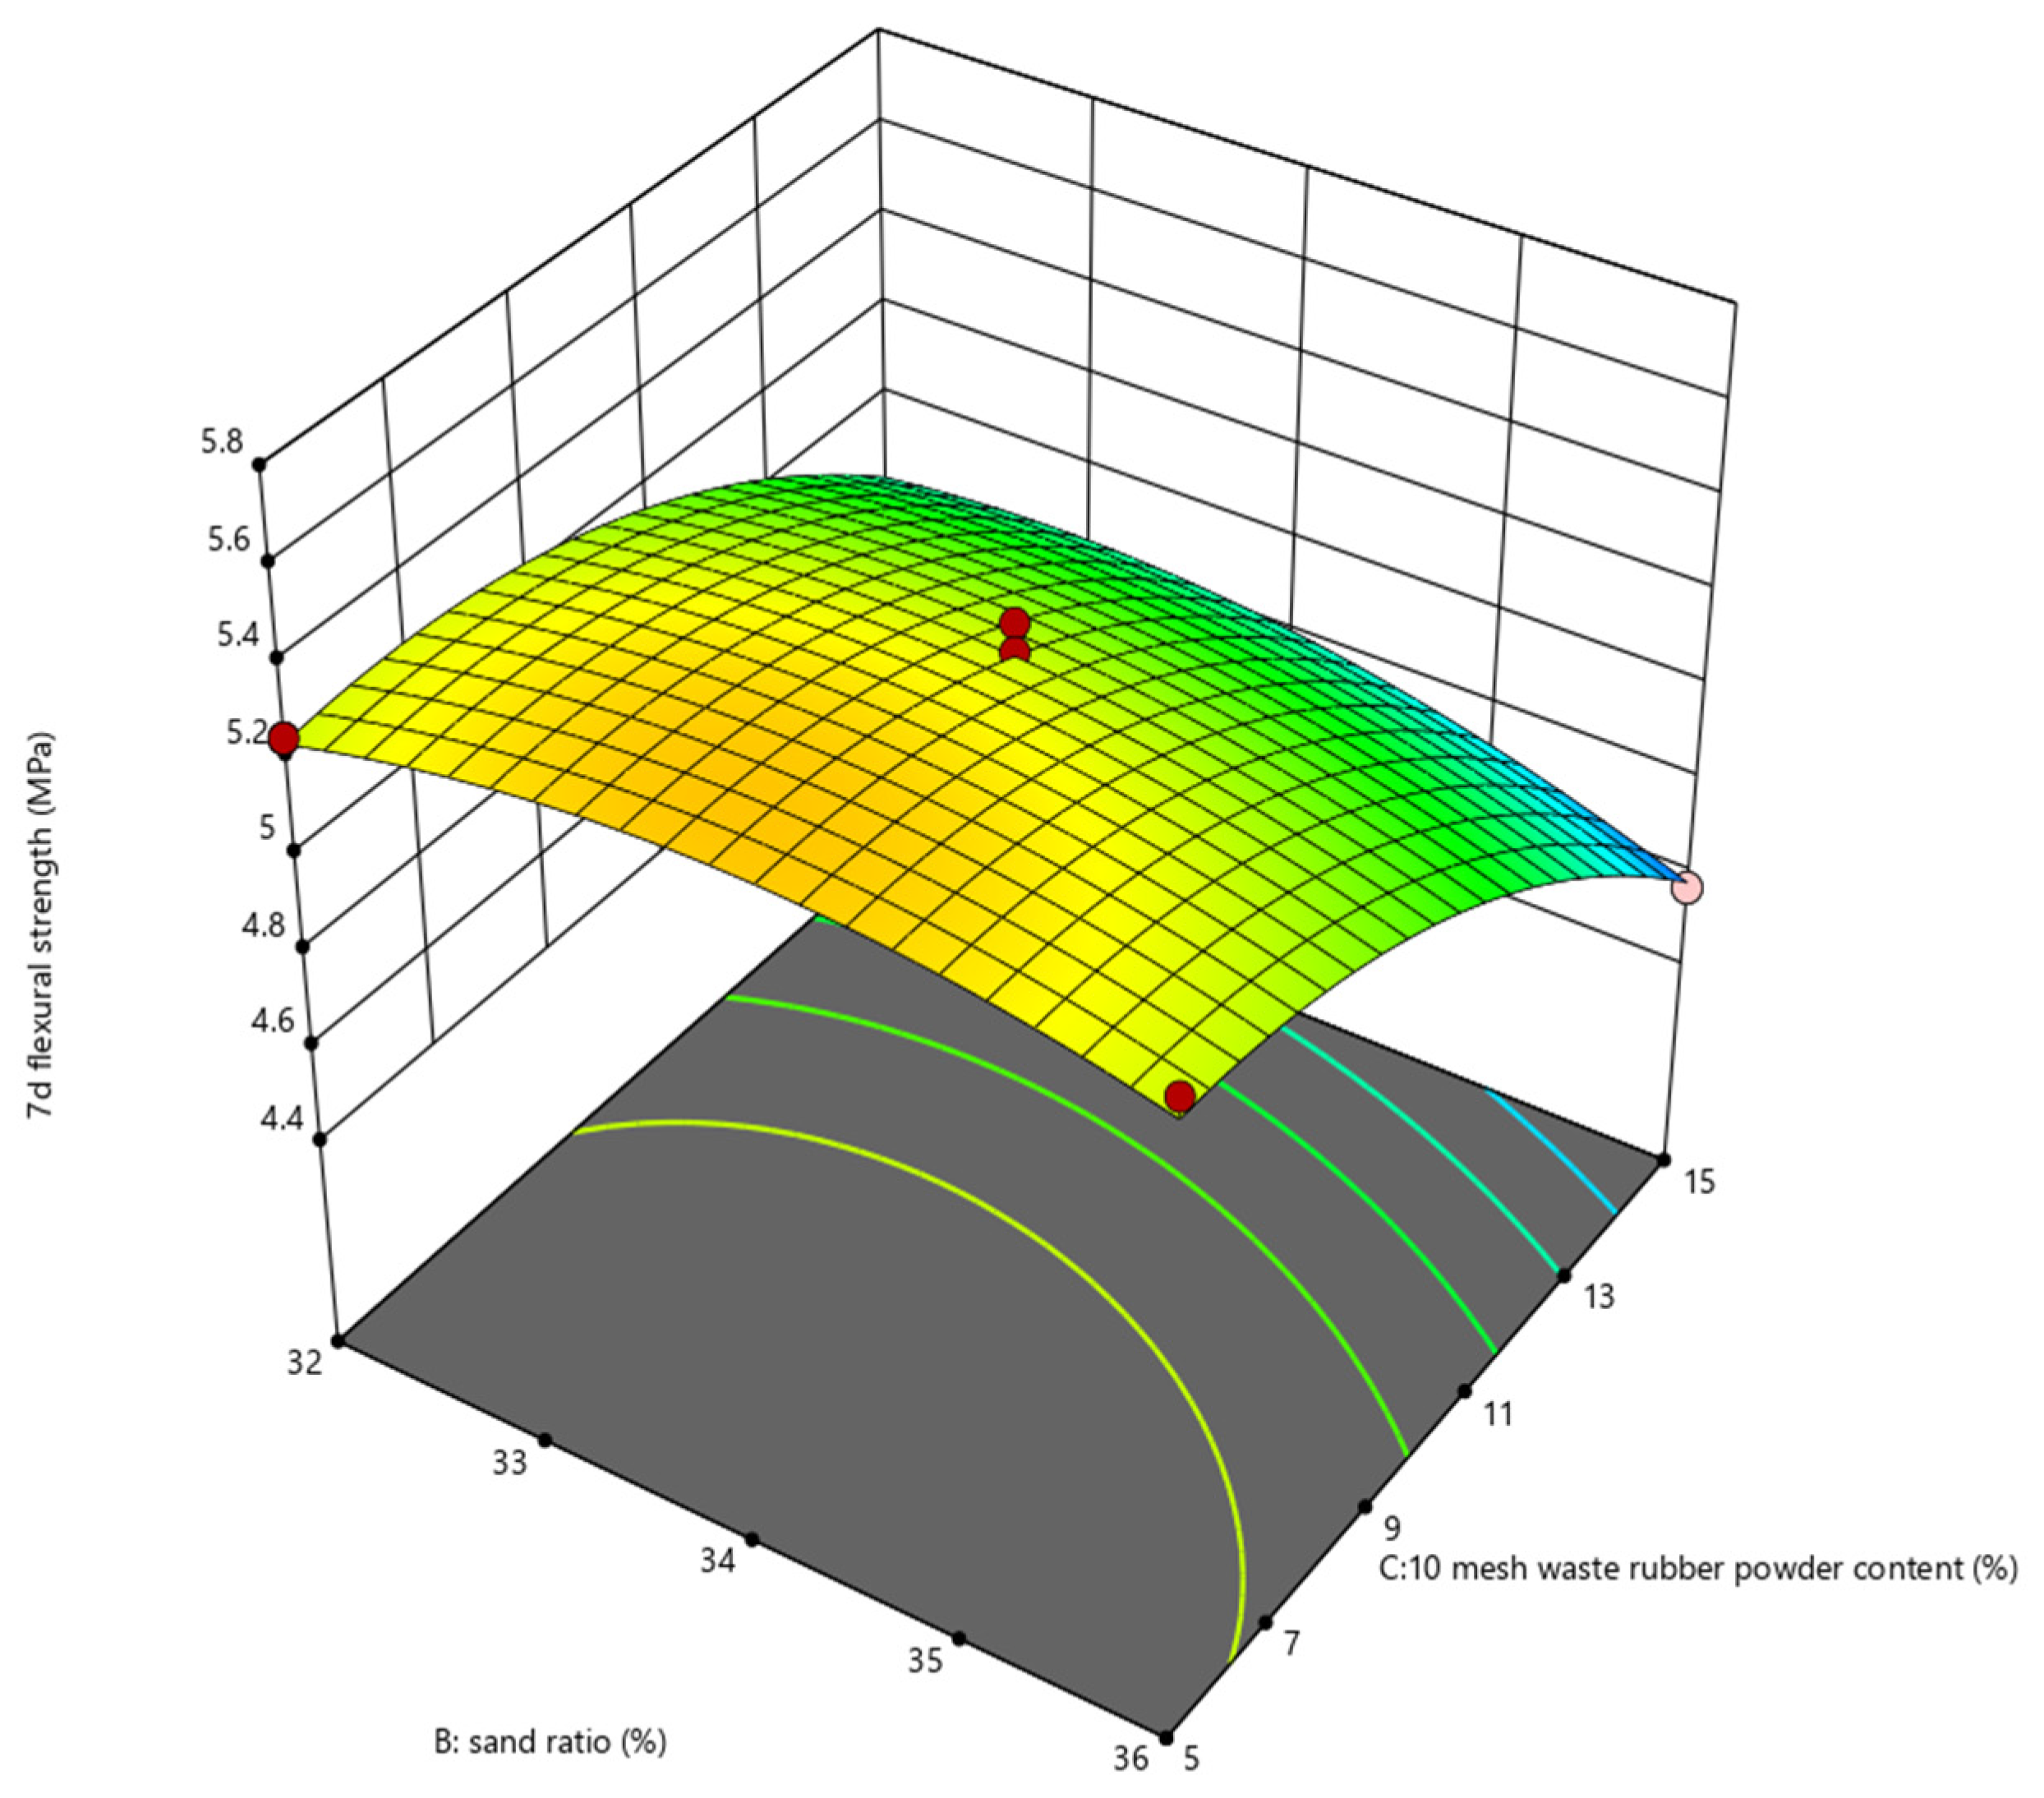
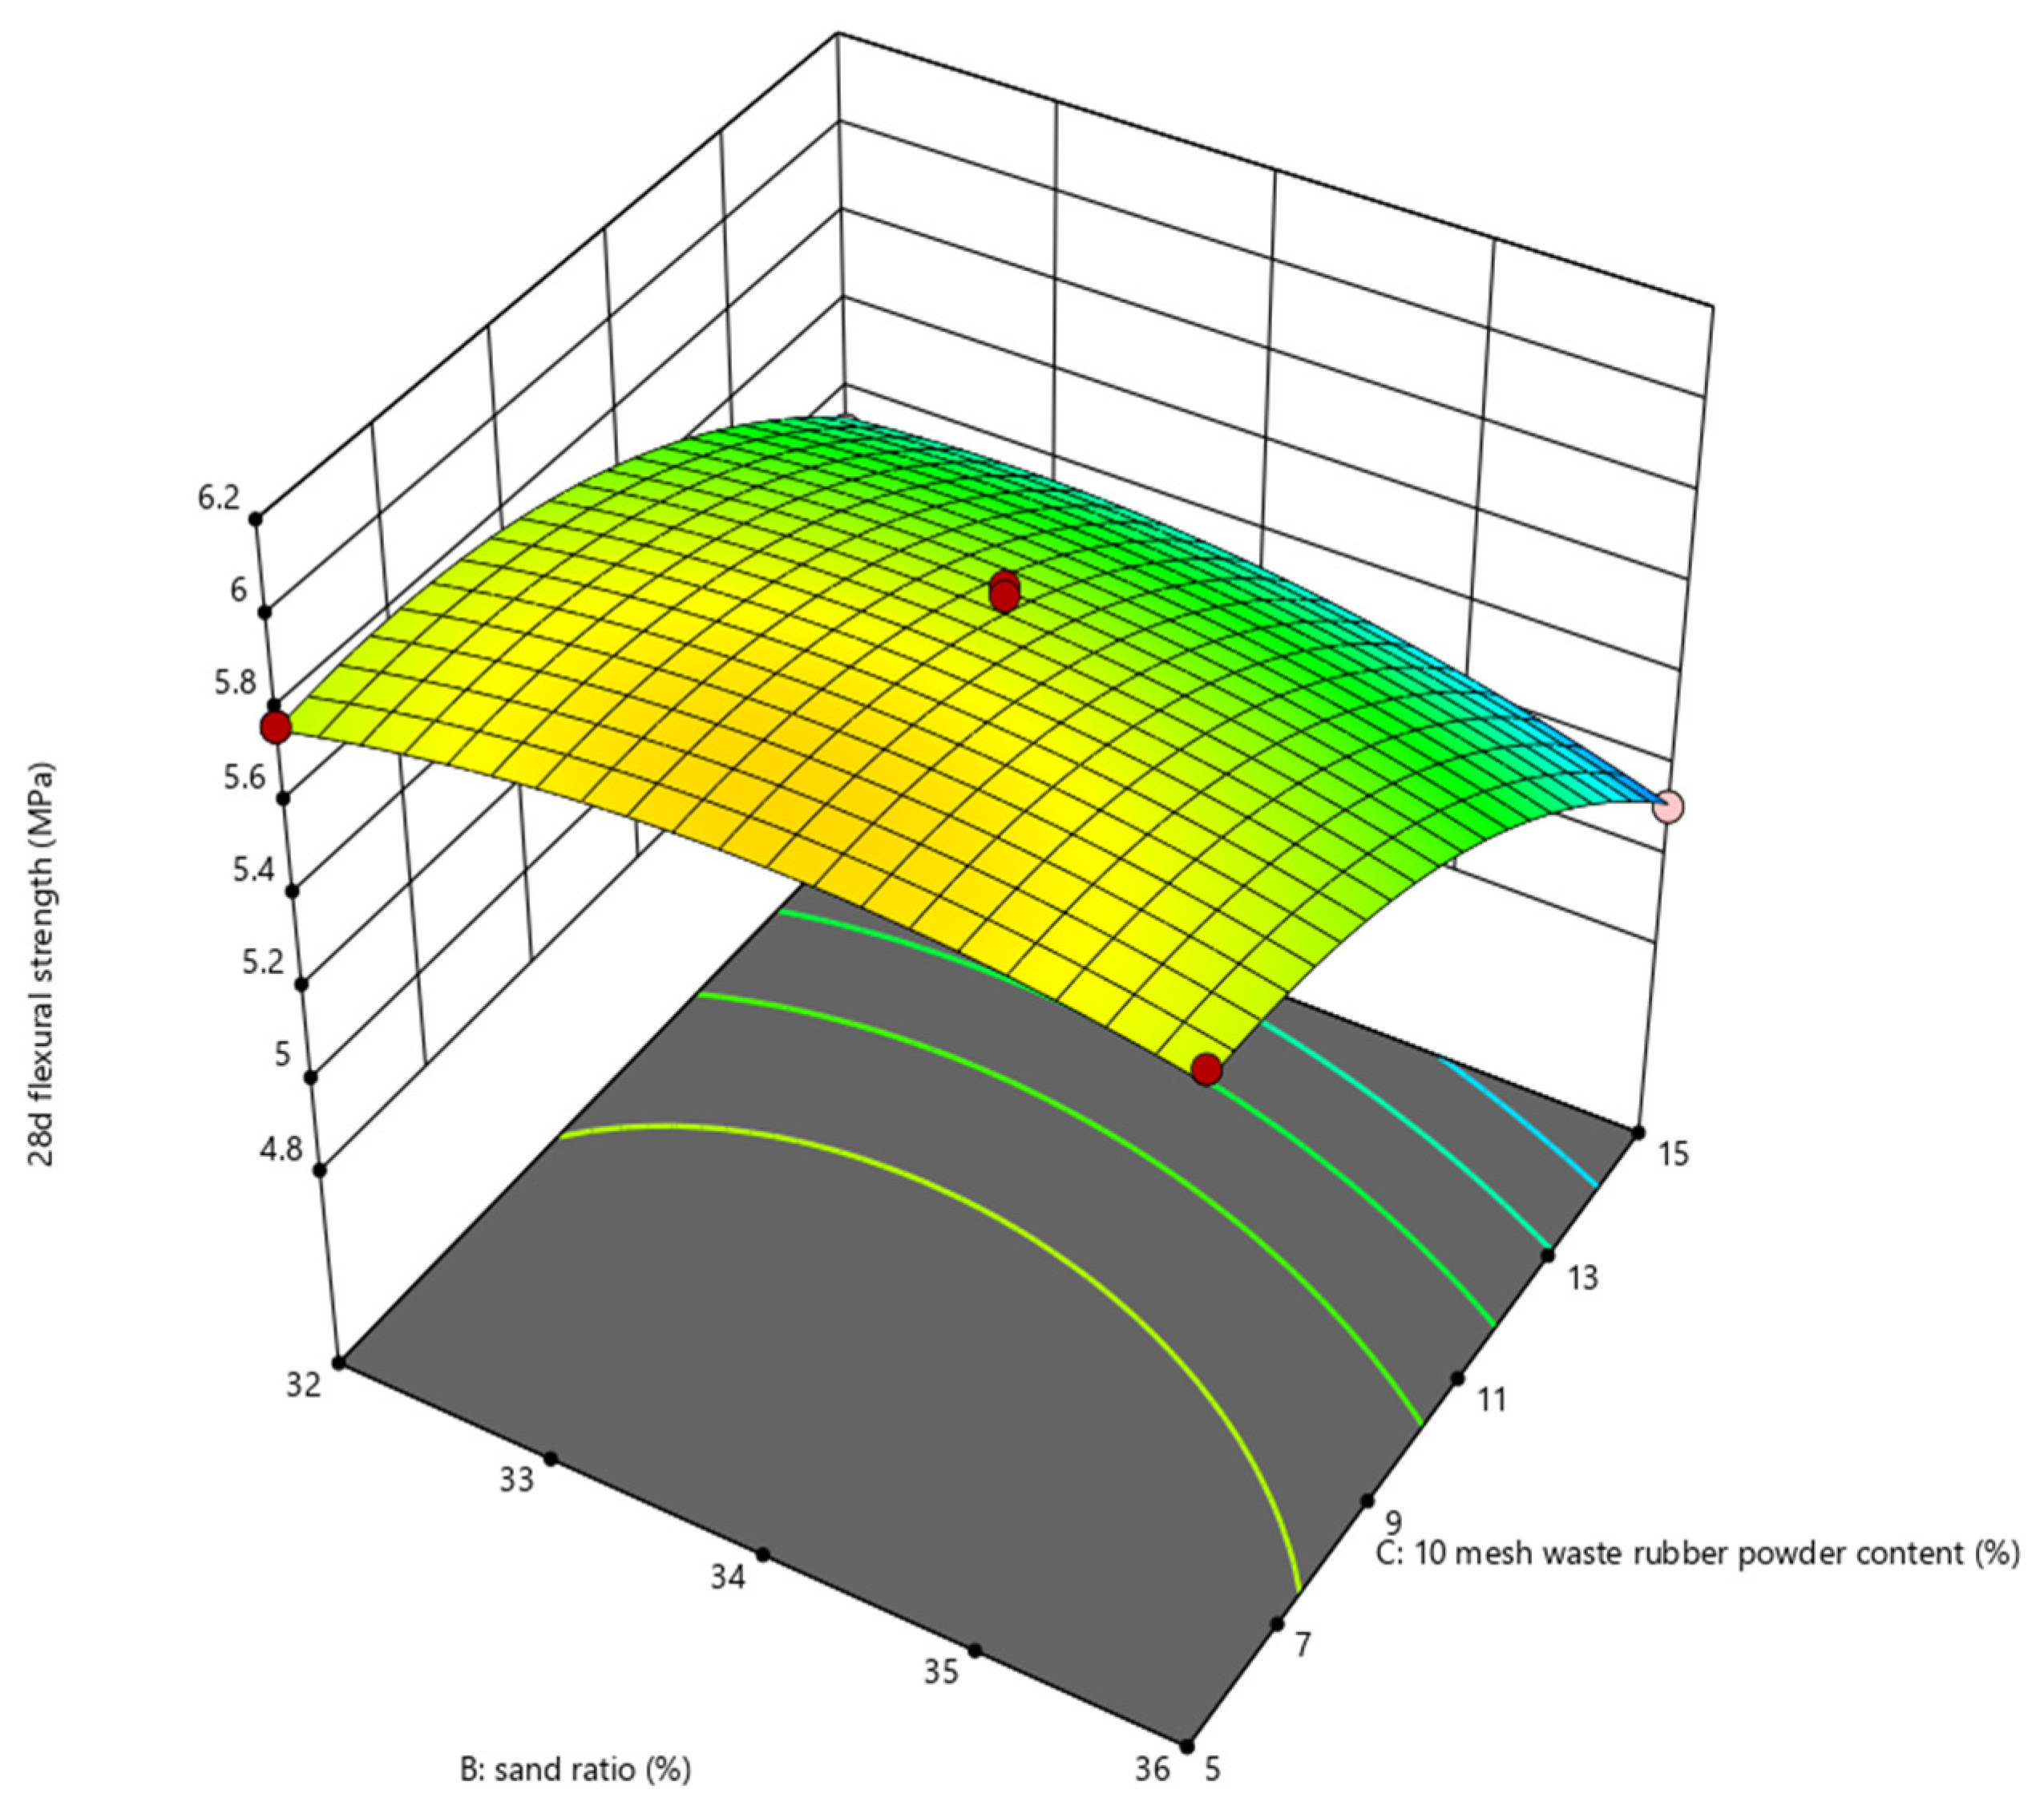
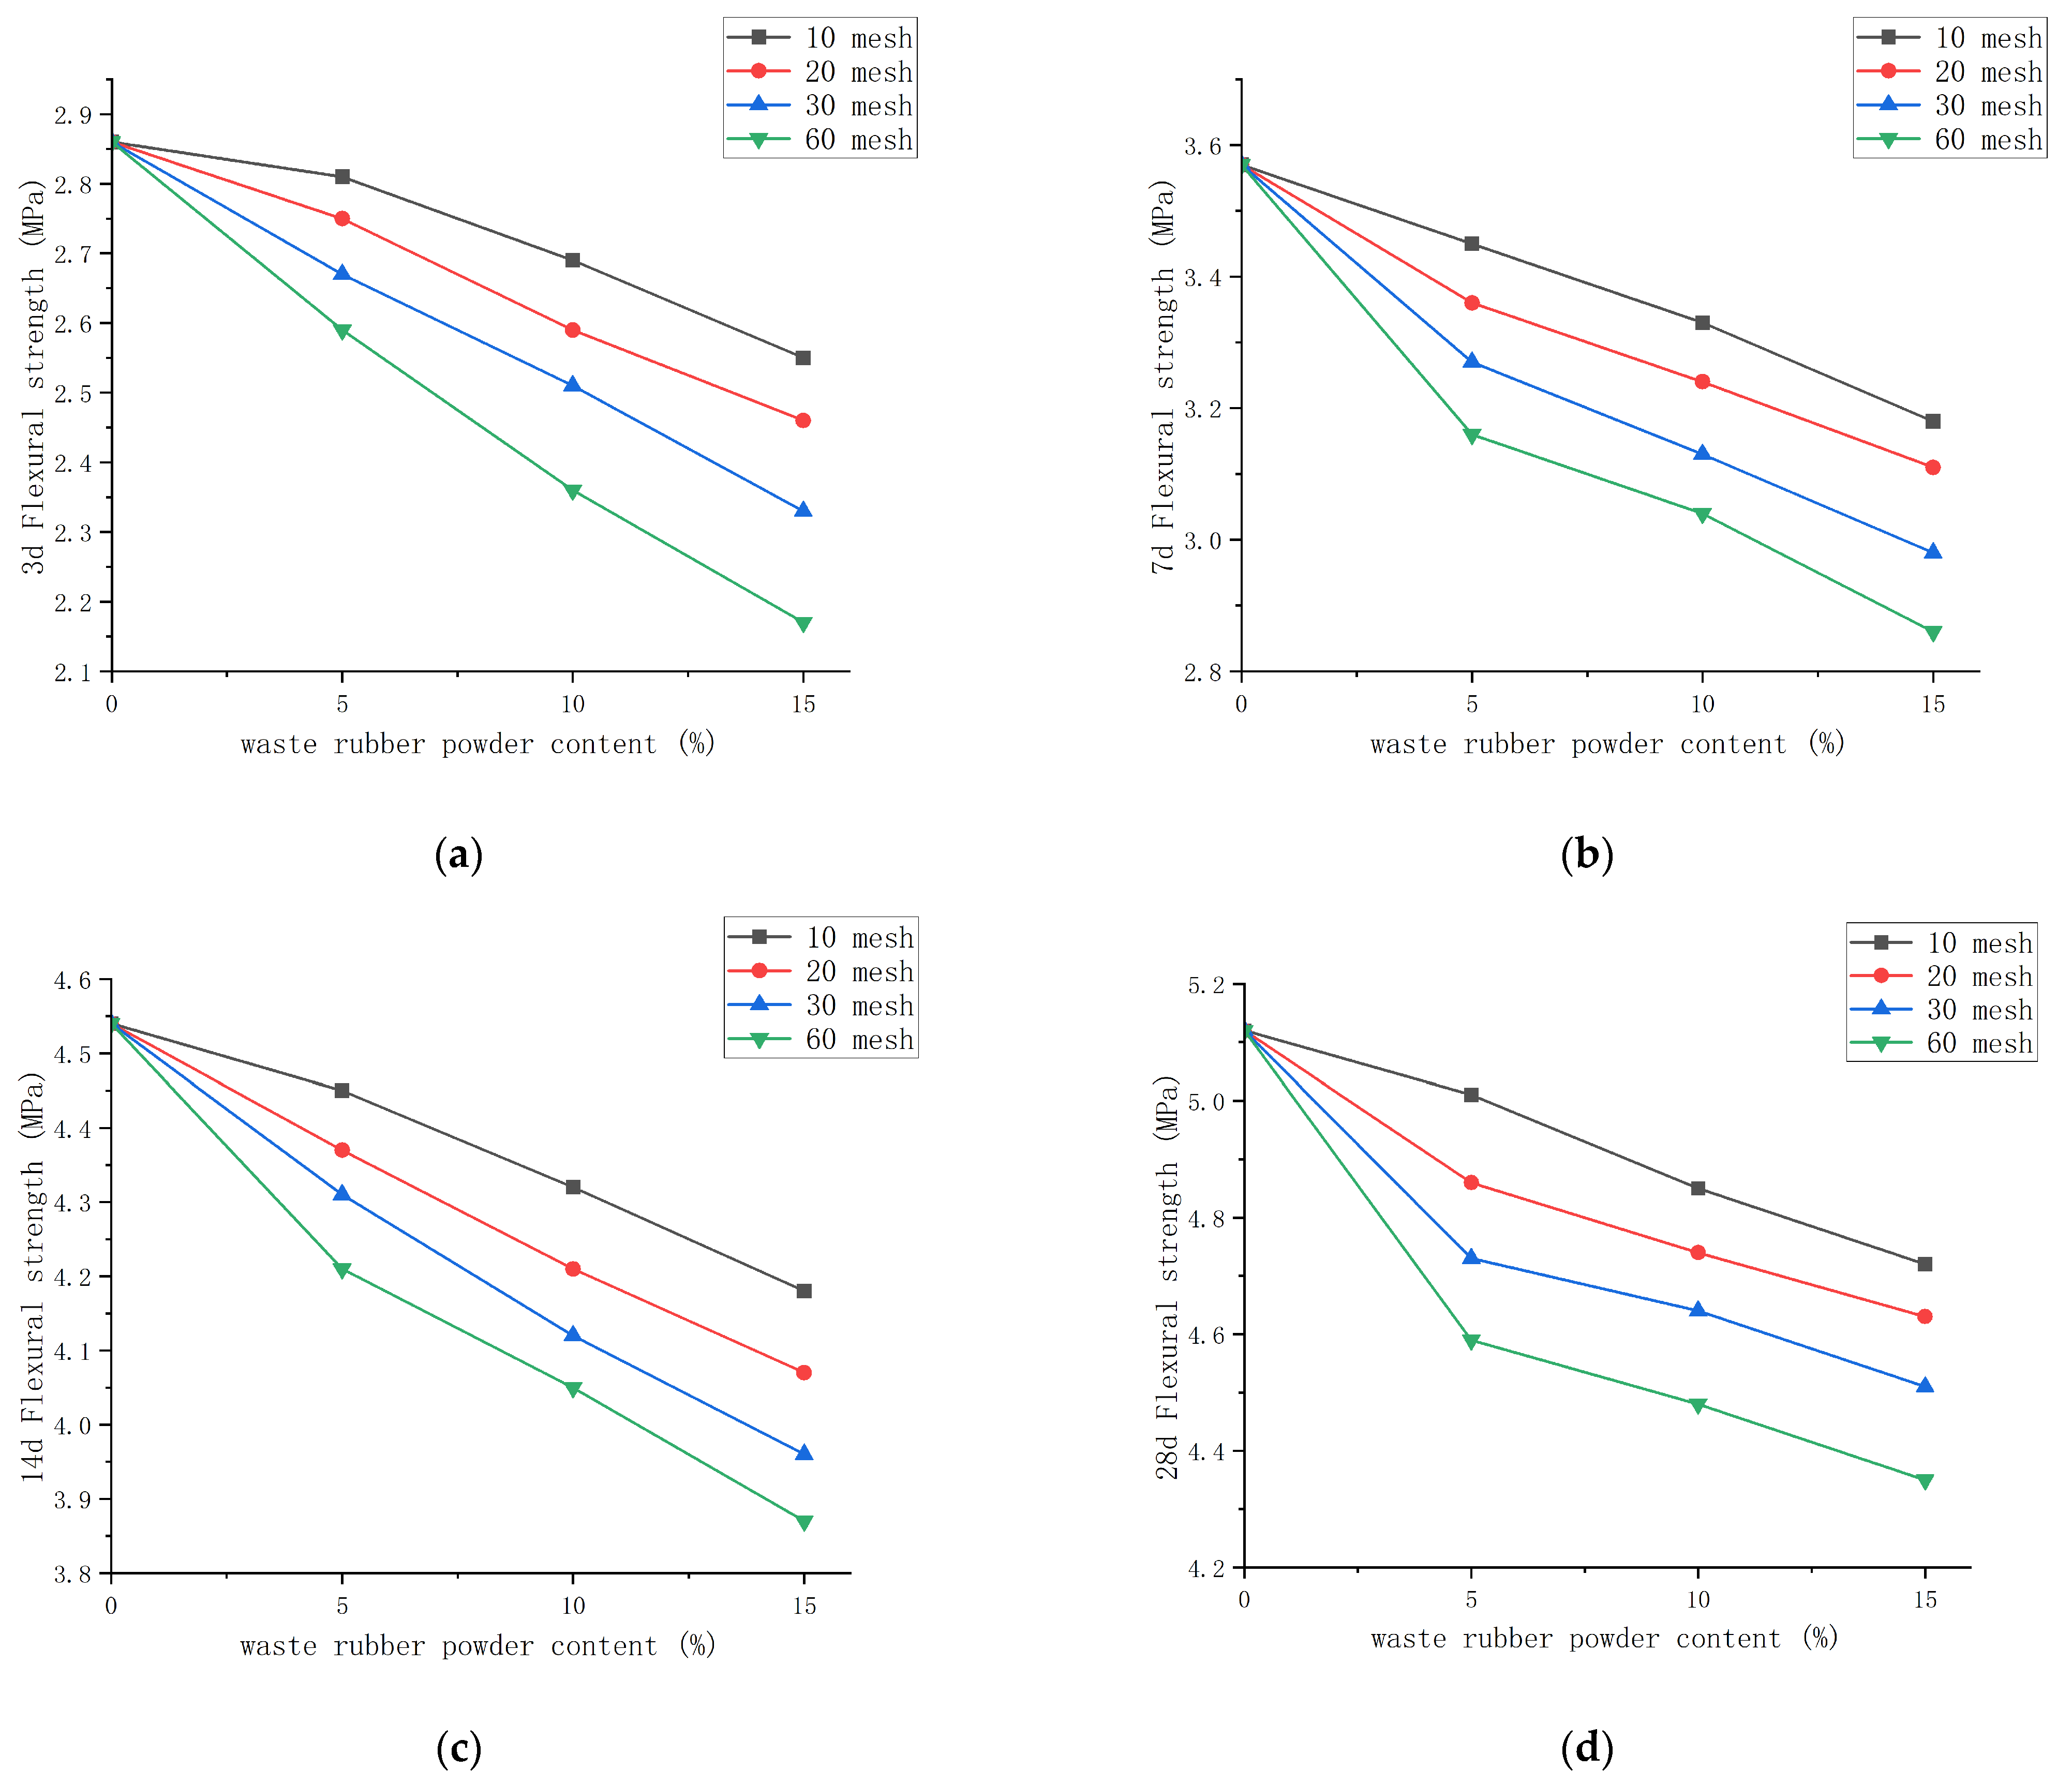
3.4. Flexural Strength

Figure 20 illustrates that the change in flexural strength mirrored that of the compressive strength. As the amount of waste rubber powder increased, the flexural strength of waste rubber powder cement concrete decreased, with larger mesh sizes amplifying this decline. Moreover, the augmentation in weak points within the concrete, induced by higher waste rubber powder quantities, reduced the actual bearing area, thus diminishing the concrete’s bearing capacity.

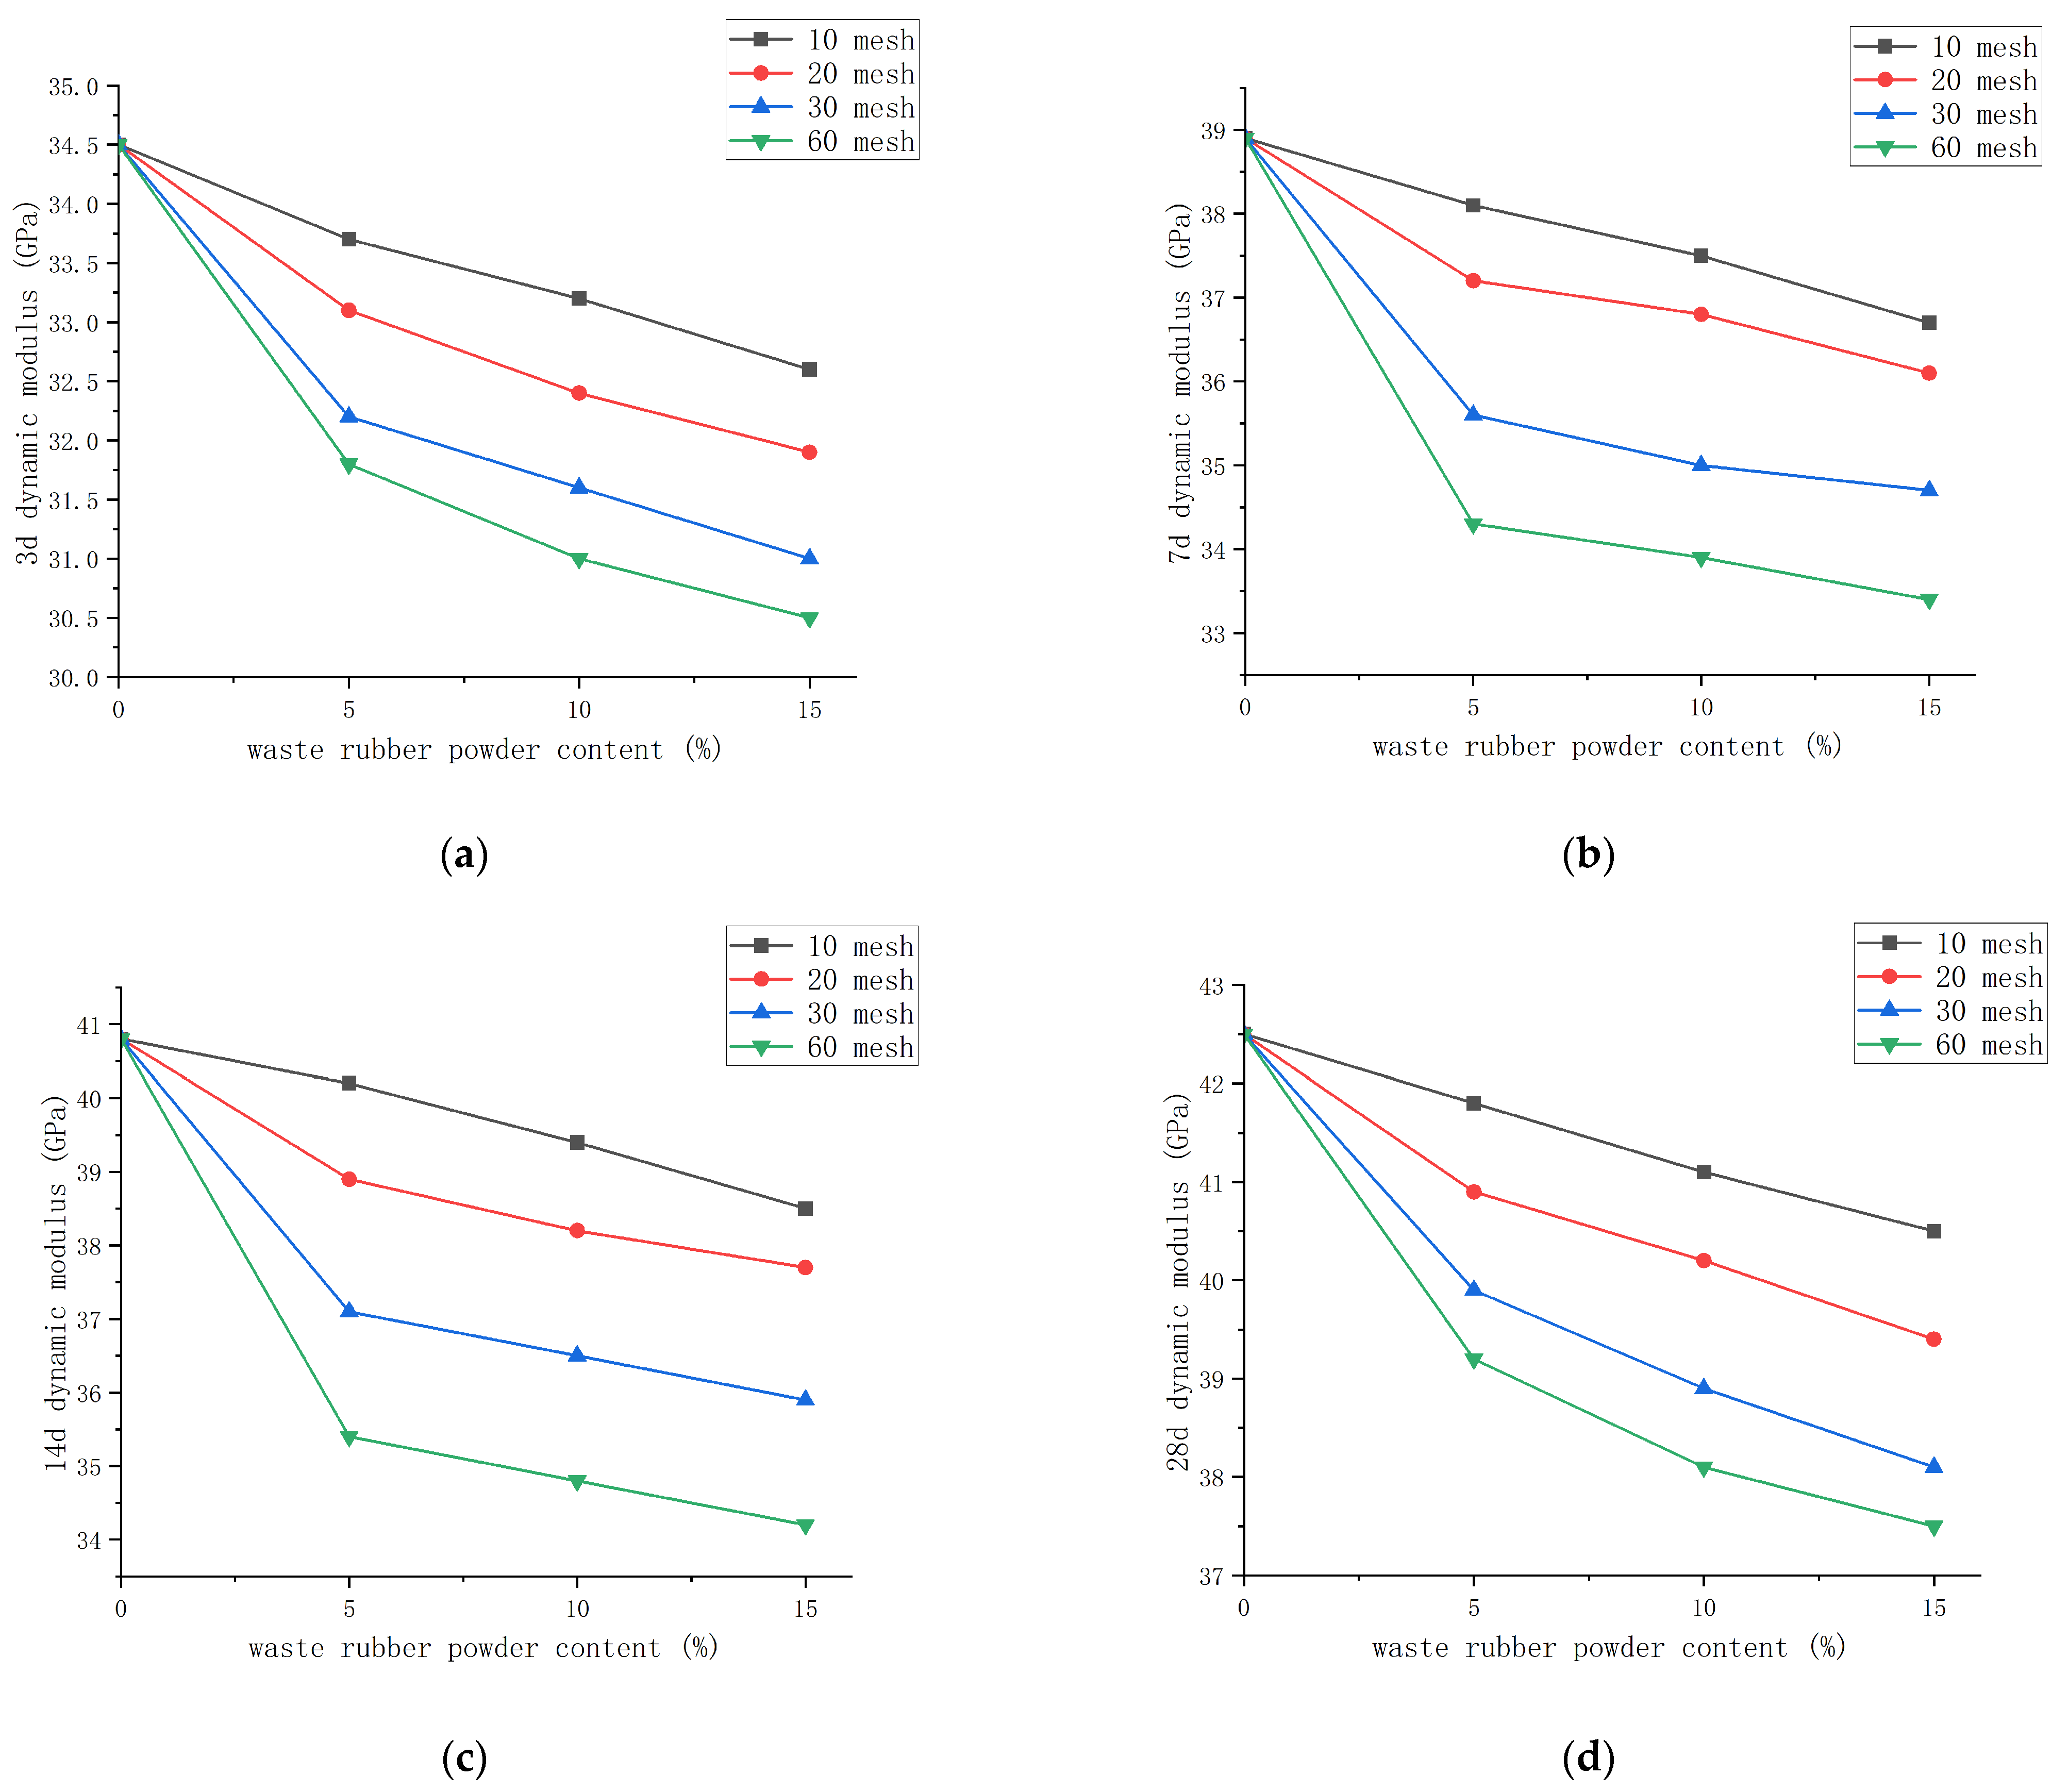
3.5. Dynamic Modulus

Figure 21 illustrates a consistent trend: as the quantity of rubber powder increased, the mic elastic modulus of the rubber powder concrete gradually diminished, with larger mesh sizes exacerbating this decline. This phenomenon was more pronounced with higher rubber powder amounts. Increased rubber powder content corresponded to greater deformation when the concrete was subjected to pressure. Consequently, larger mesh sizes and higher rubber powder quantities corresponded to a lower dynamic elastic modulus of the rubber powder concrete.

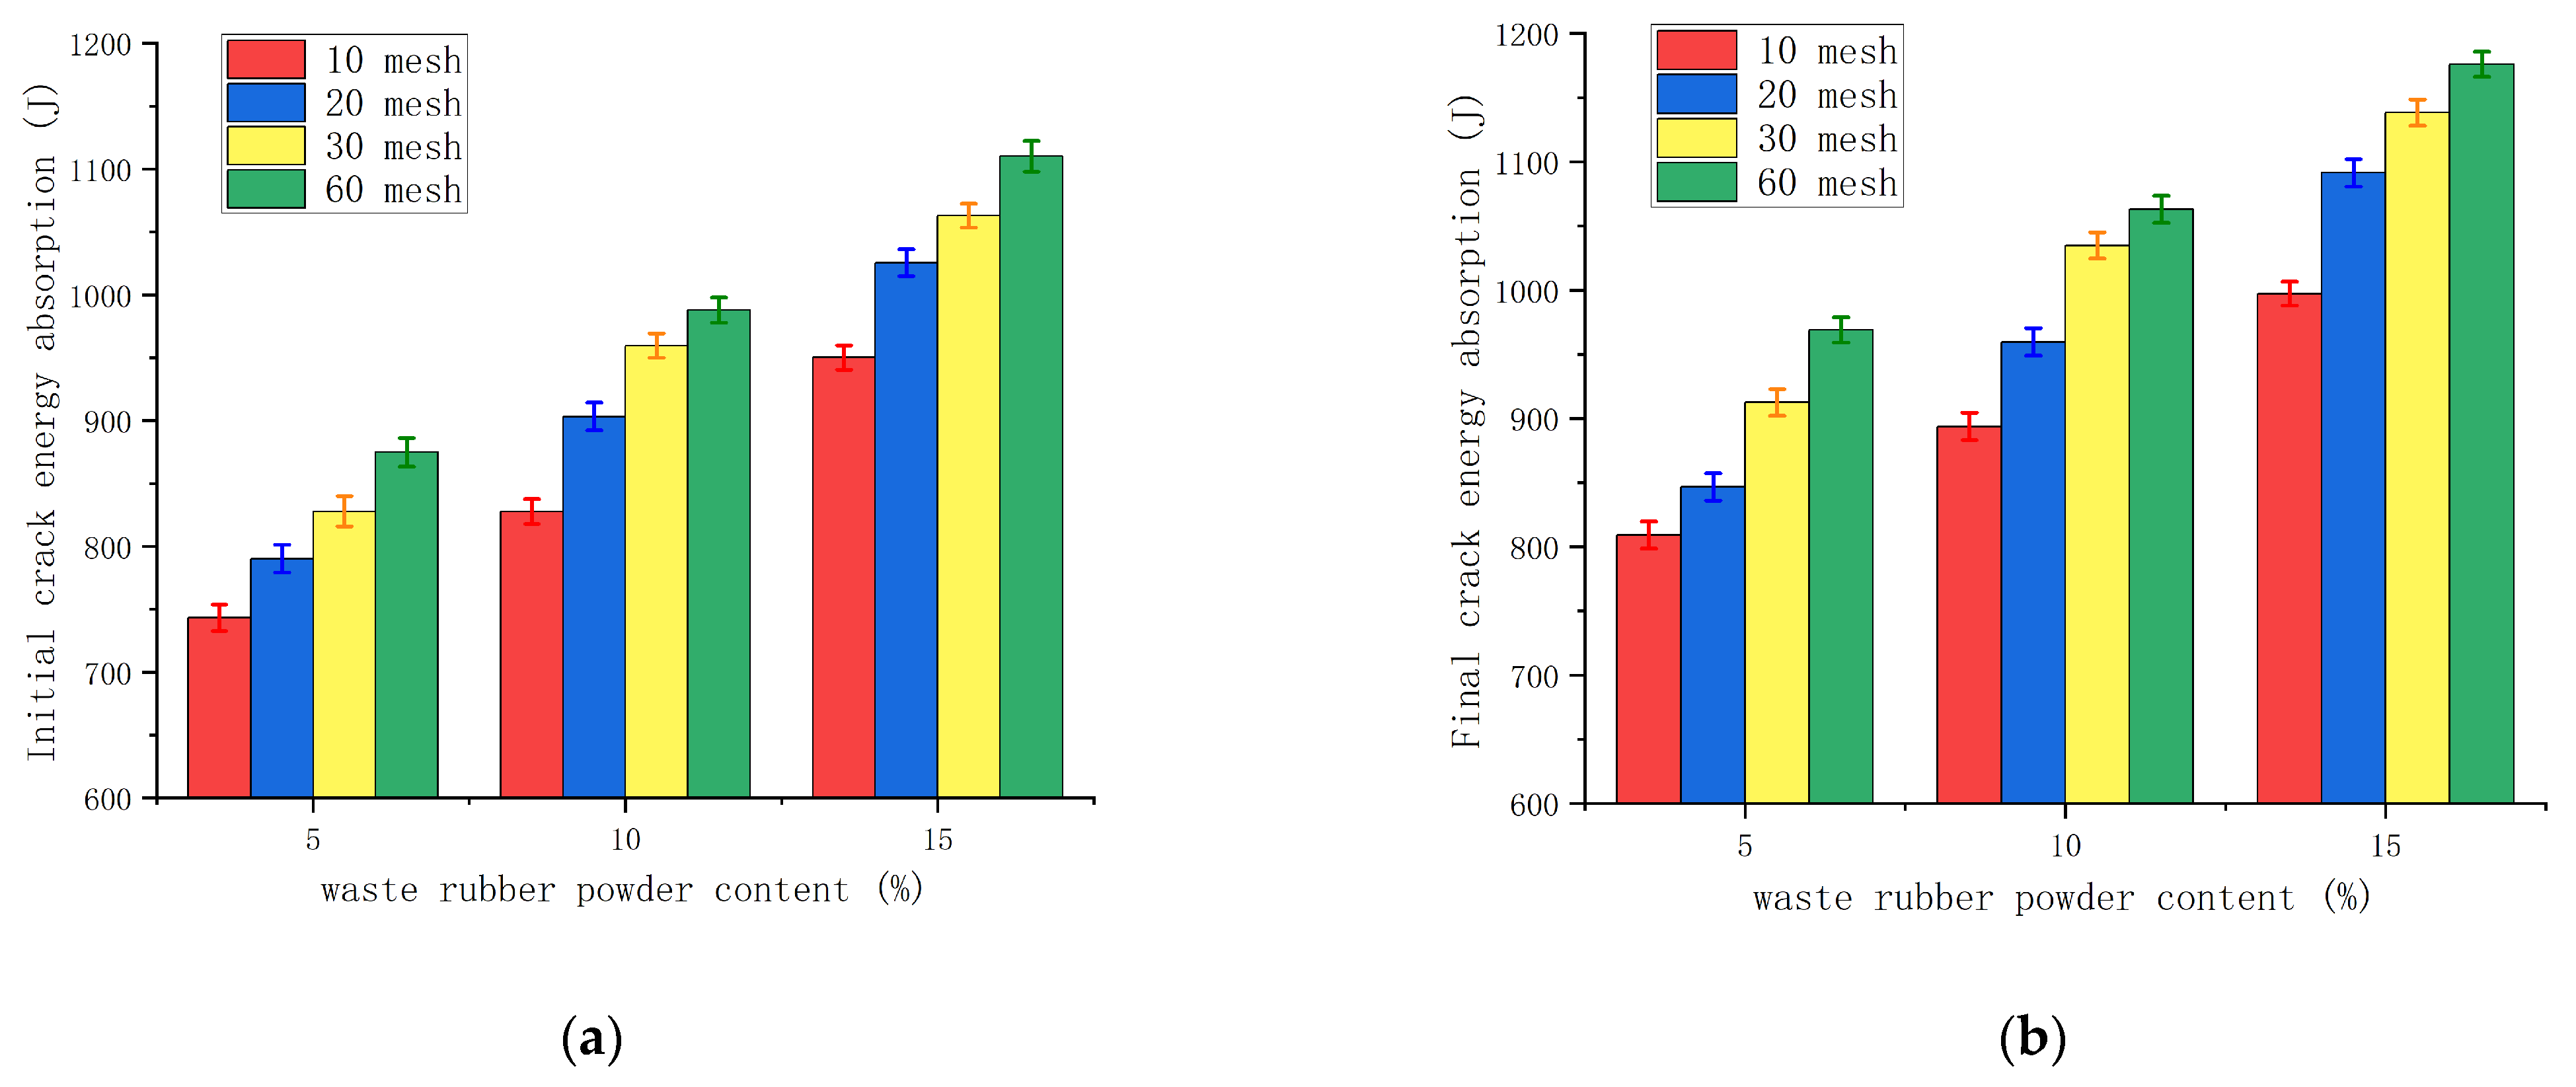
3.6. Impact Resistance

Formulas (1) and (2) were employed to determine the initial crack and final crack impact energy absorption of the test piece. For the test piece lacking waste rubber powder, the initial crack energy absorption and final crack energy absorption stood at 696.19 J and 752.64 J, respectively. The corresponding values for the test piece incorporating waste rubber powder are depicted in Figure 22. The increased waste rubber powder content, coupled with a smaller particle size, correlated with a higher frequency of initial and final cracks in concrete, thereby augmenting both the initial crack energy absorption and the final crack energy absorption. Notably, a higher rubber powder content and a smaller particle size promoted enhanced dispersion of rubber particles, bolstering the impact resistance.

3.7. Noise Reduction
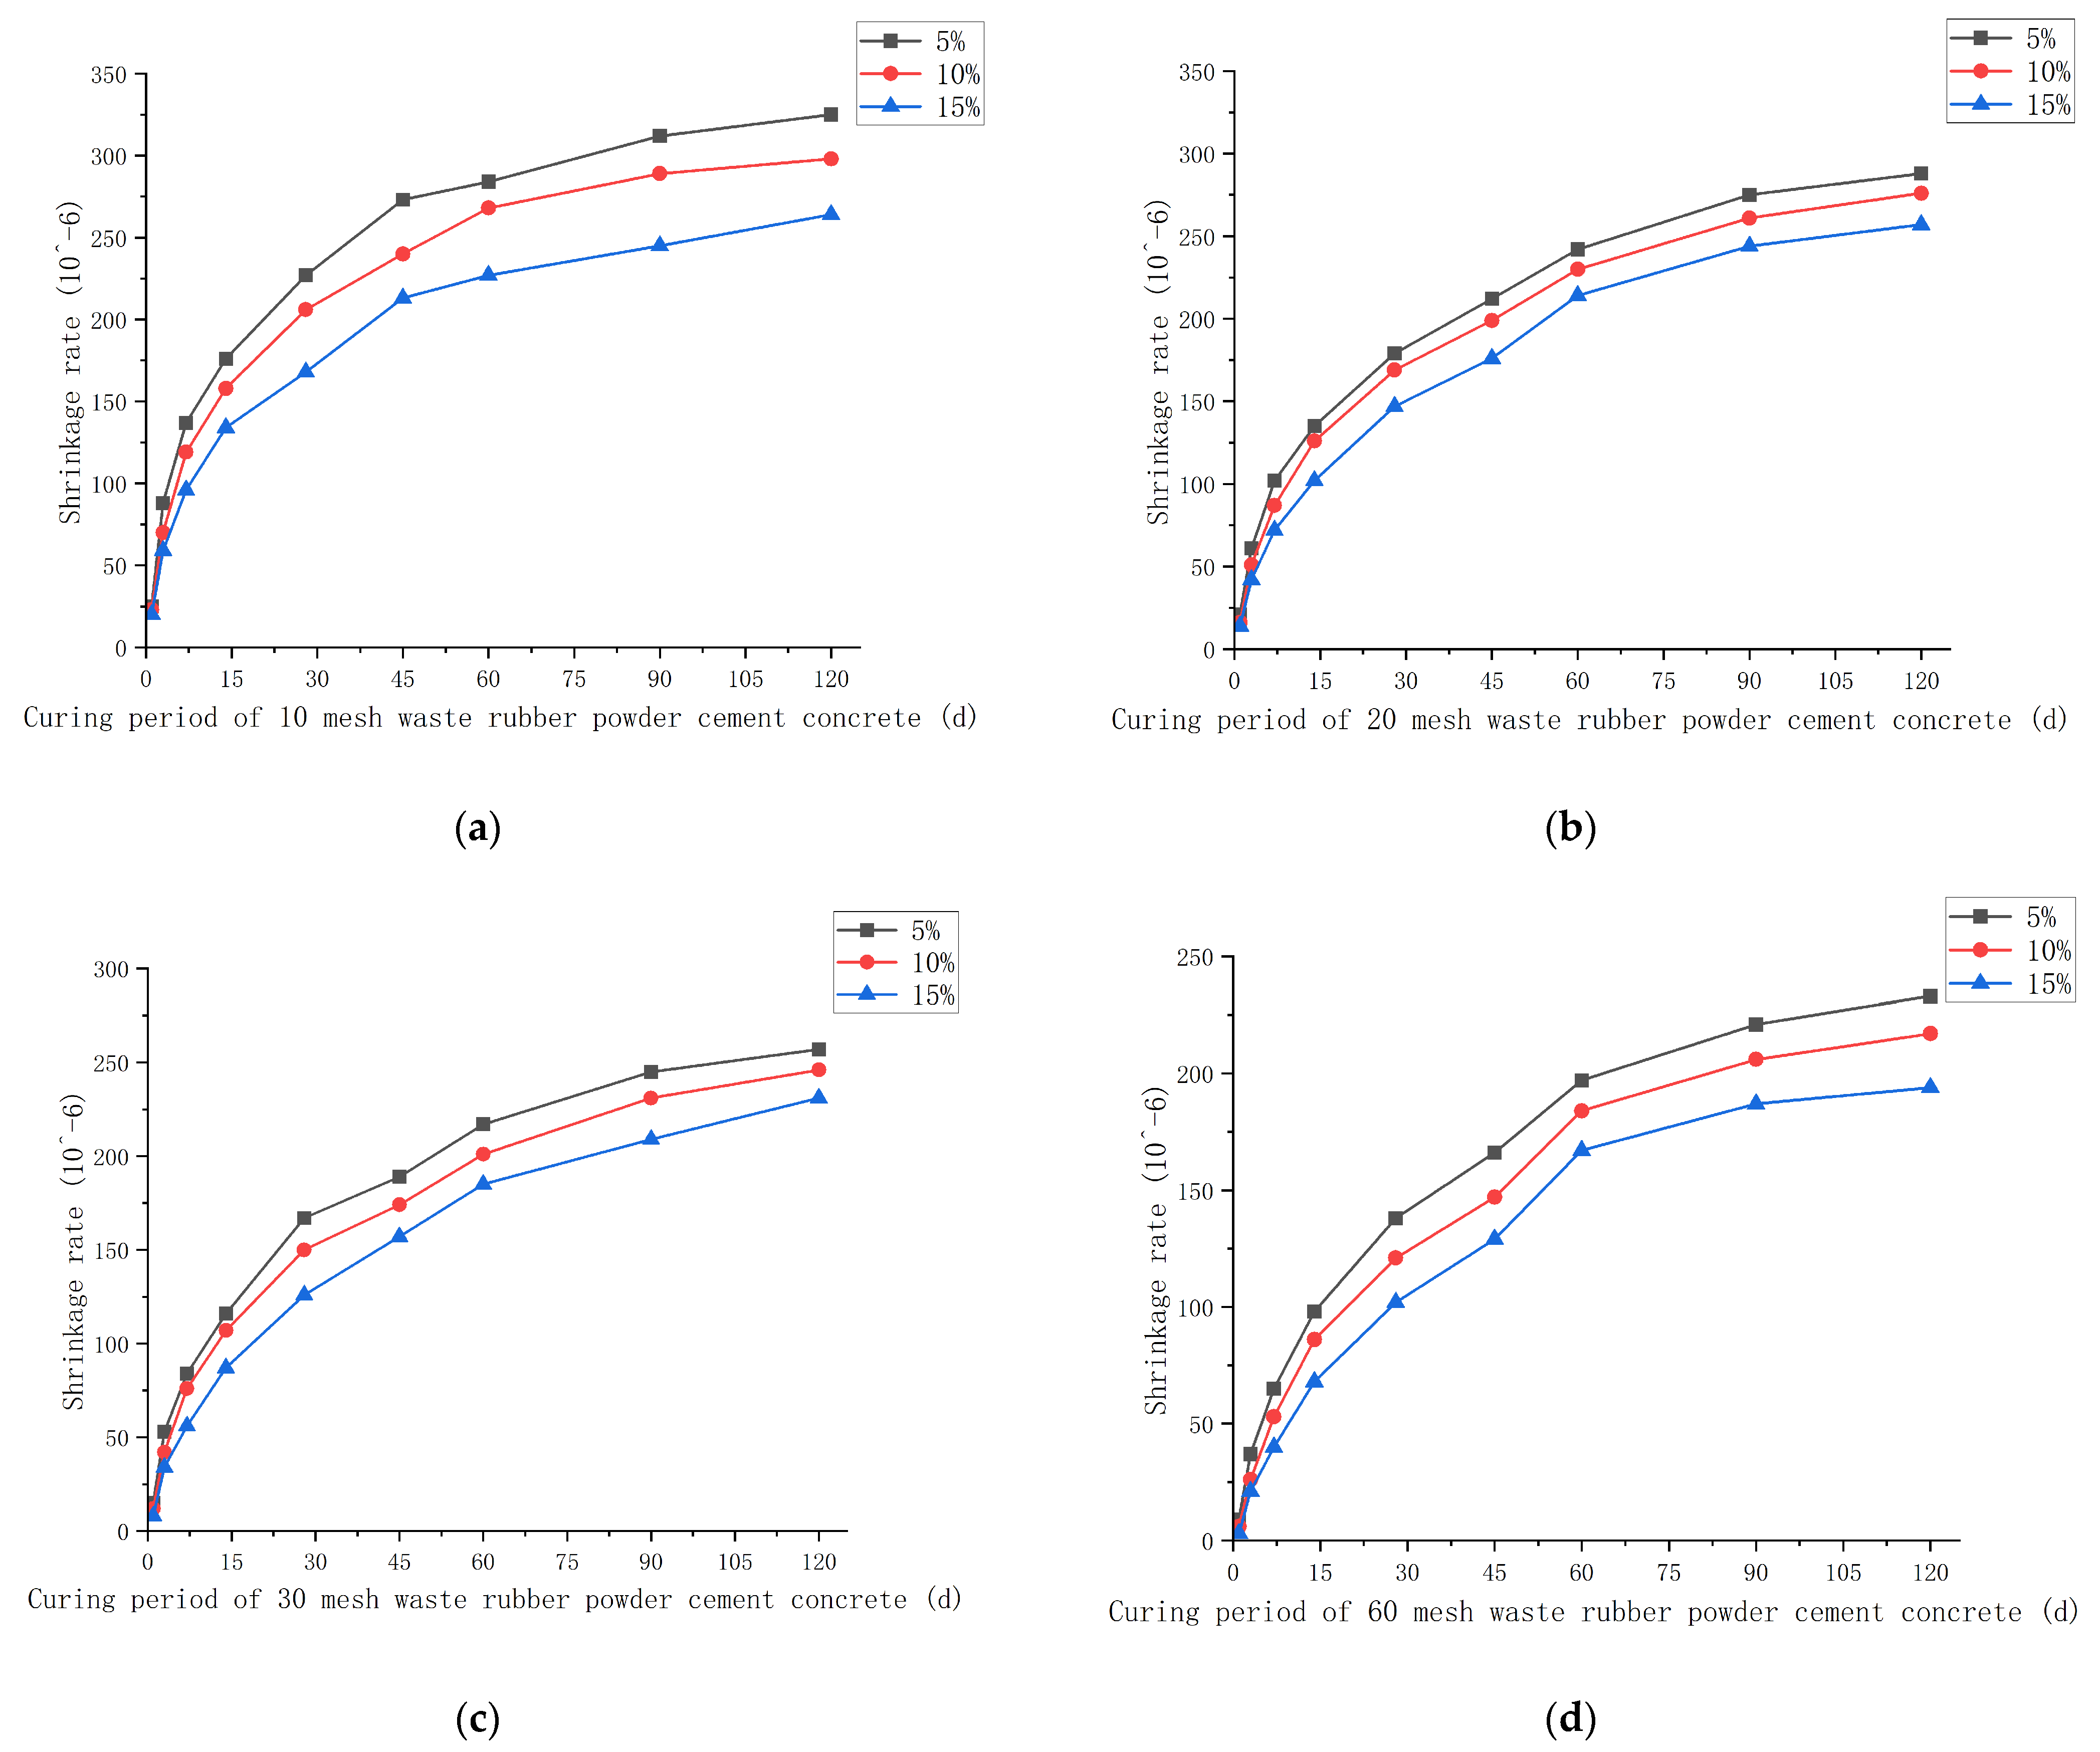
Figure 23 illustrates that the addition of waste rubber powder resulted in a reduction in the decibel level of cement concrete upon impact by rubber balls. Furthermore, an incremental increase in waste rubber powder content corresponded to a more pronounced decrease in concrete decibel levels post impact. Remarkably, concrete containing 10-mesh waste rubber powder exhibited the lowest decibel level post impact, while those with 20-mesh, 30-mesh, and 60-mesh waste rubber powder demonstrated similar decibel levels.

3.8. Shrinkage

Analysis of the drying shrinkage test results (Figure 24) revealed a reduction in the drying shrinkage rate of cement concrete upon the addition of waste rubber powder. Notably, higher waste rubber powder content corresponded to a smaller drying shrinkage rate, while an increase in mesh number was also associated with a decreased drying shrinkage rate. Hence, waste rubber powder exhibits potential for mitigating crack formation, rendering it suitable for road applications.

3.9. Impermeability

The electrical flux test results are depicted in Figure 25. The results indicate that impermeability improved with the addition of waste rubber powder. The impermeability of concrete increased as the mesh number of waste rubber powder rose while at constant content levels. Similarly, at consistent mesh numbers, impermeability rose with increasing content. However, the impact of content variation on concrete impermeability was more pronounced. Consequently, higher mesh numbers of waste rubber powder corresponded to increased concrete resistance against chloride ion penetration, while higher waste rubber powder content further bolstered concrete’s ability to resist chloride ion penetration.

3.10. Freezing Resistance

Figure 26 illustrates a decrease in the mass loss rate of cement concrete upon the addition of waste rubber powder. Likewise, the mass loss rate of waste rubber cement concrete decreased with the increasing mesh size of the waste rubber powder, and a higher quantity of waste rubber powder led to a proportionally smaller mass loss rate. These findings suggest that the freezing resistance of waste rubber cement concrete improved as both the mesh size and quantity of waste rubber powder increased. In frozen concrete conditions, waste rubber powder functioned to impede crack formation and development. Moreover, the significance of these effects increased with the quantity of waste rubber powder added.

4. Conclusions

This study used response surface methodology to design the mix proportion of waste rubber powder cement concrete. Subsequently, this study investigated the mechanical properties of waste rubber powder cement concrete using traditional mechanical property tests and impact resistance tests. It also explored its noise reduction performance through rubber ball impact and ultrasonic methods. Moreover, the durability properties of waste rubber powder cement concrete were examined through shrinkage performance tests, chloride ion flux tests, and freeze-thaw resistance tests. The following conclusions are presented:
(1)
Among the three influencing factors—the water–cement ratio, sand ratio, and waste rubber powder content—the optimization design results indicate that when the water-cement ratio was held constant and the sand ratio was maintained between 33% and 36%, the waste rubber powder content should not exceed 10%. Additionally, it was observed that the water–cement ratio exerted the most significant influence on the flexural strength of cement concrete, whereas the sand ratio had the least impact.
(2)
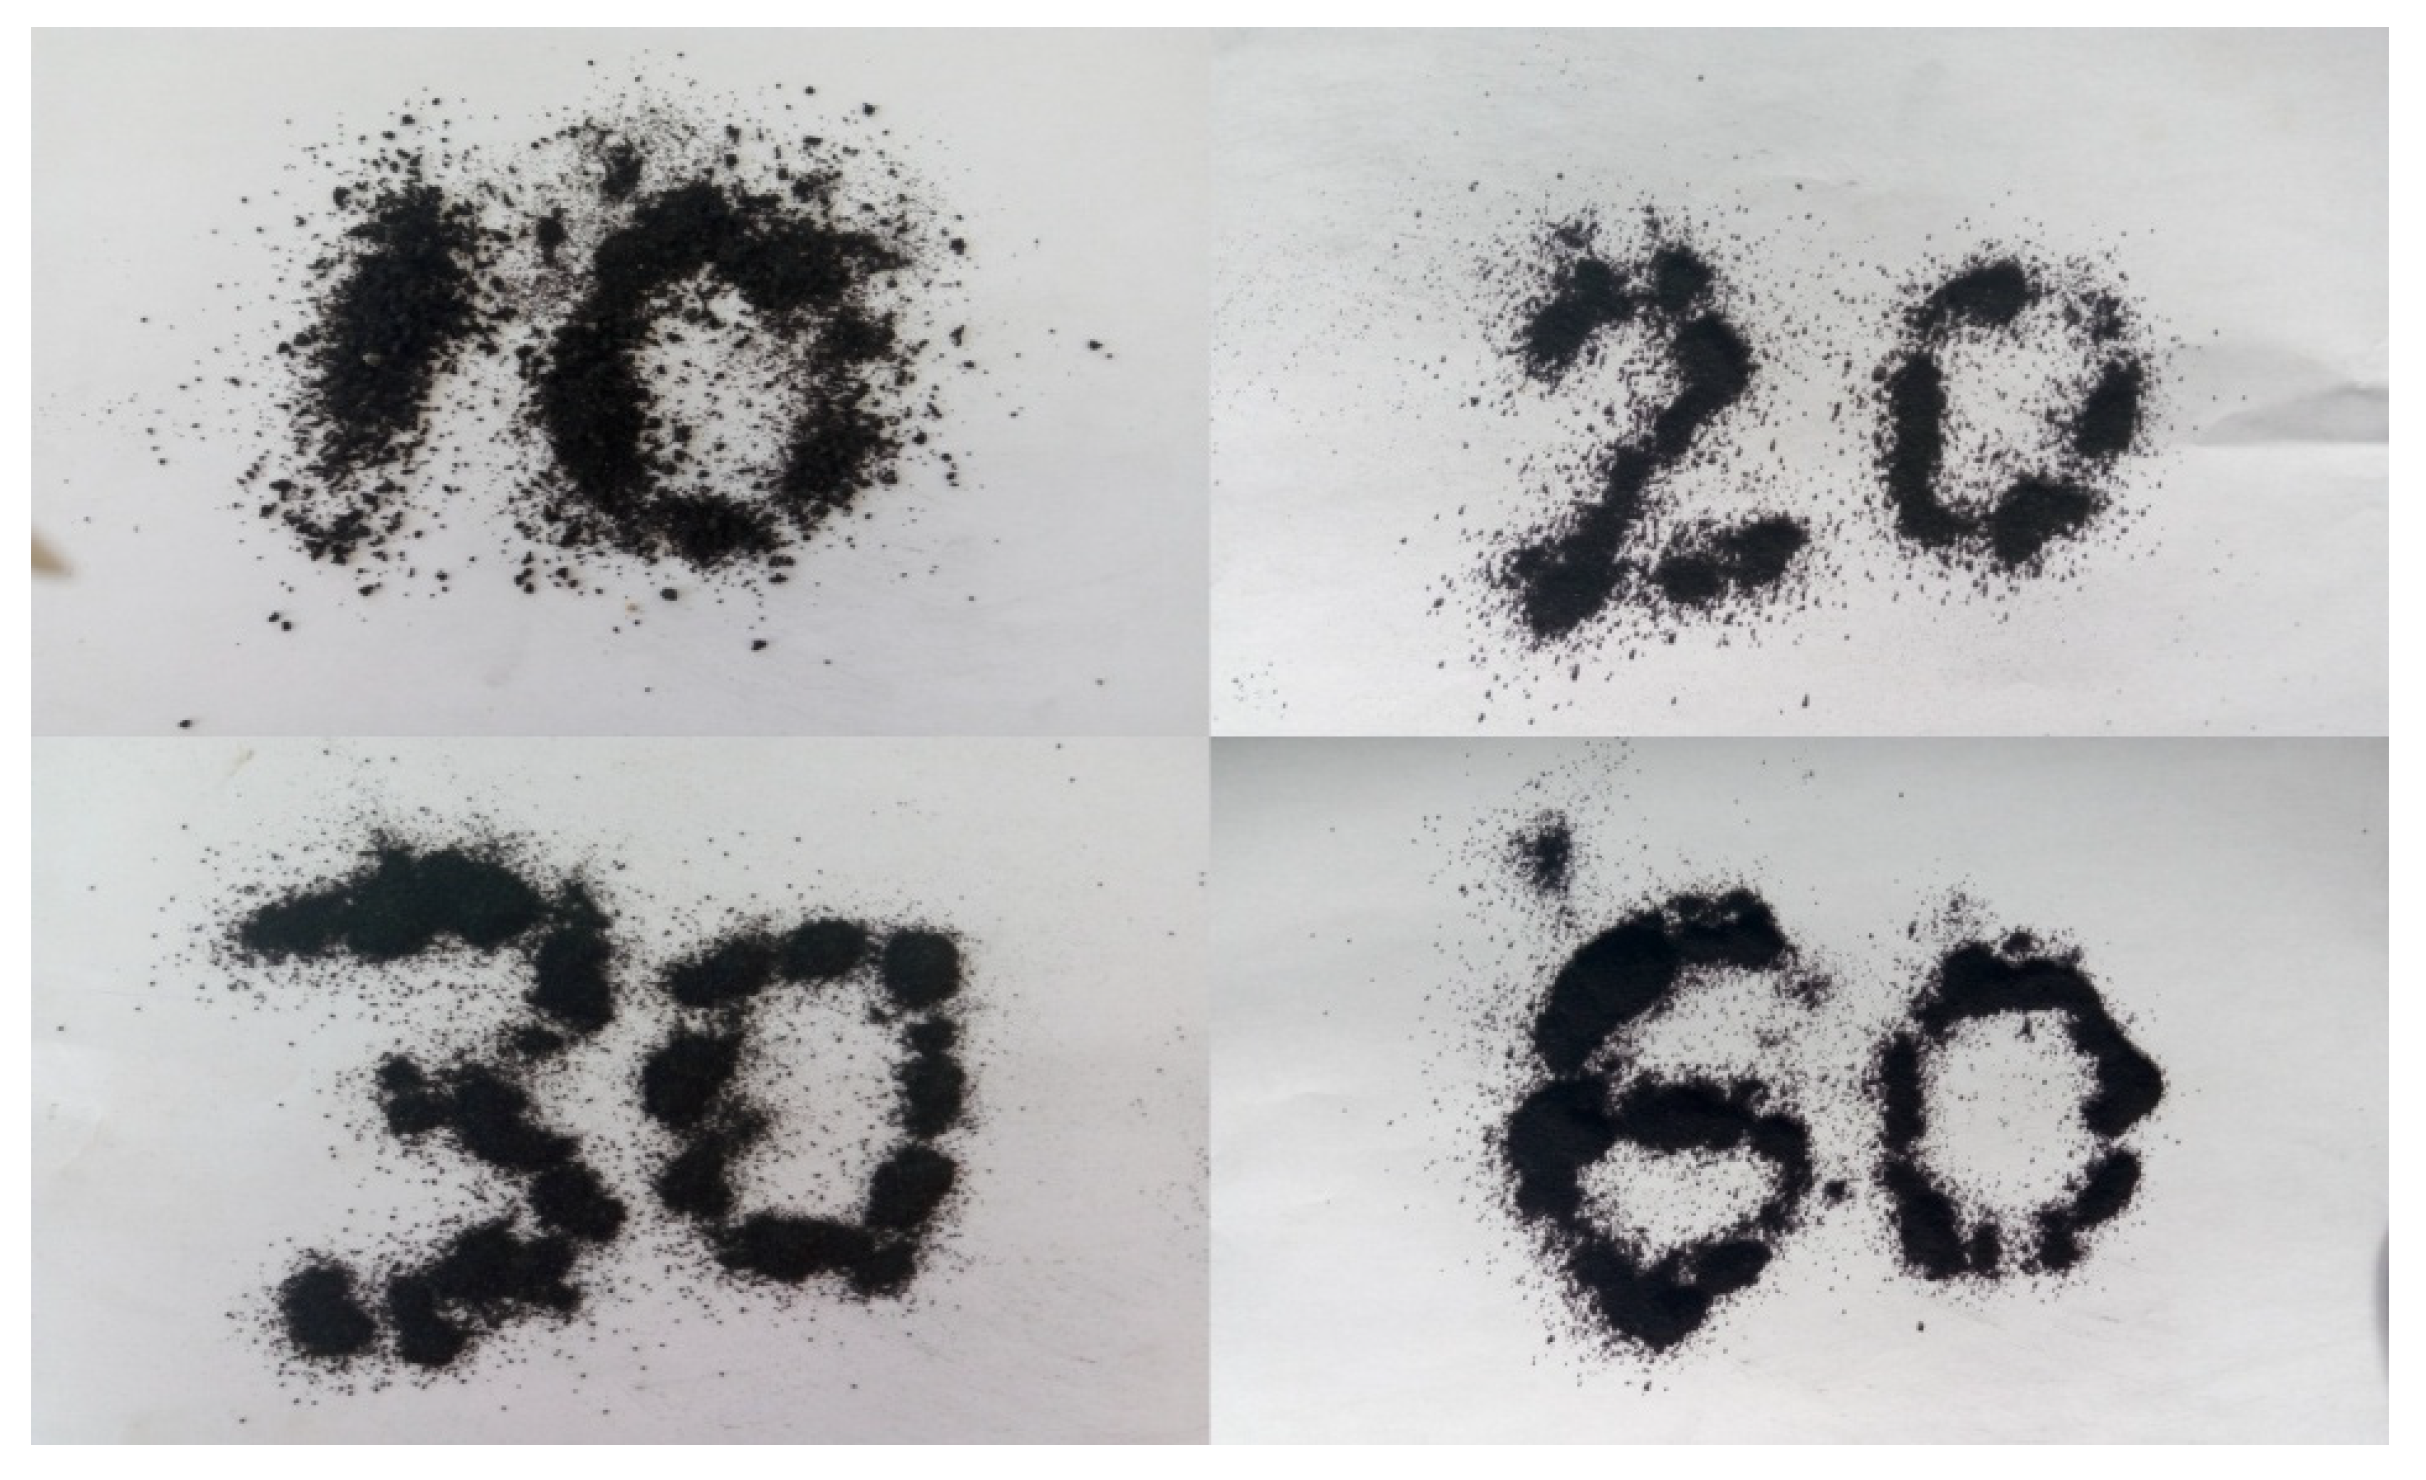
Both the particle size and content of waste rubber powder significantly influenced the mechanical properties of cement concrete. Specifically, under consistent mesh sizes, increasing content led to a decline in compressive strength, flexural strength, and dynamic elastic modulus; conversely, at constant content levels, larger mesh sizes corresponded to lower compressive strength, flexural strength, and dynamic elastic modulus. Furthermore, impact resistance tests revealed that higher content and smaller particle sizes of waste rubber powder enhanced the concrete’s crack resistance. Statistical analysis utilizing the two-parameter Weibull distribution can be employed to assess the initial crack impact number (N1) and final crack impact number (N2) of waste rubber powder cement concrete.
(3)
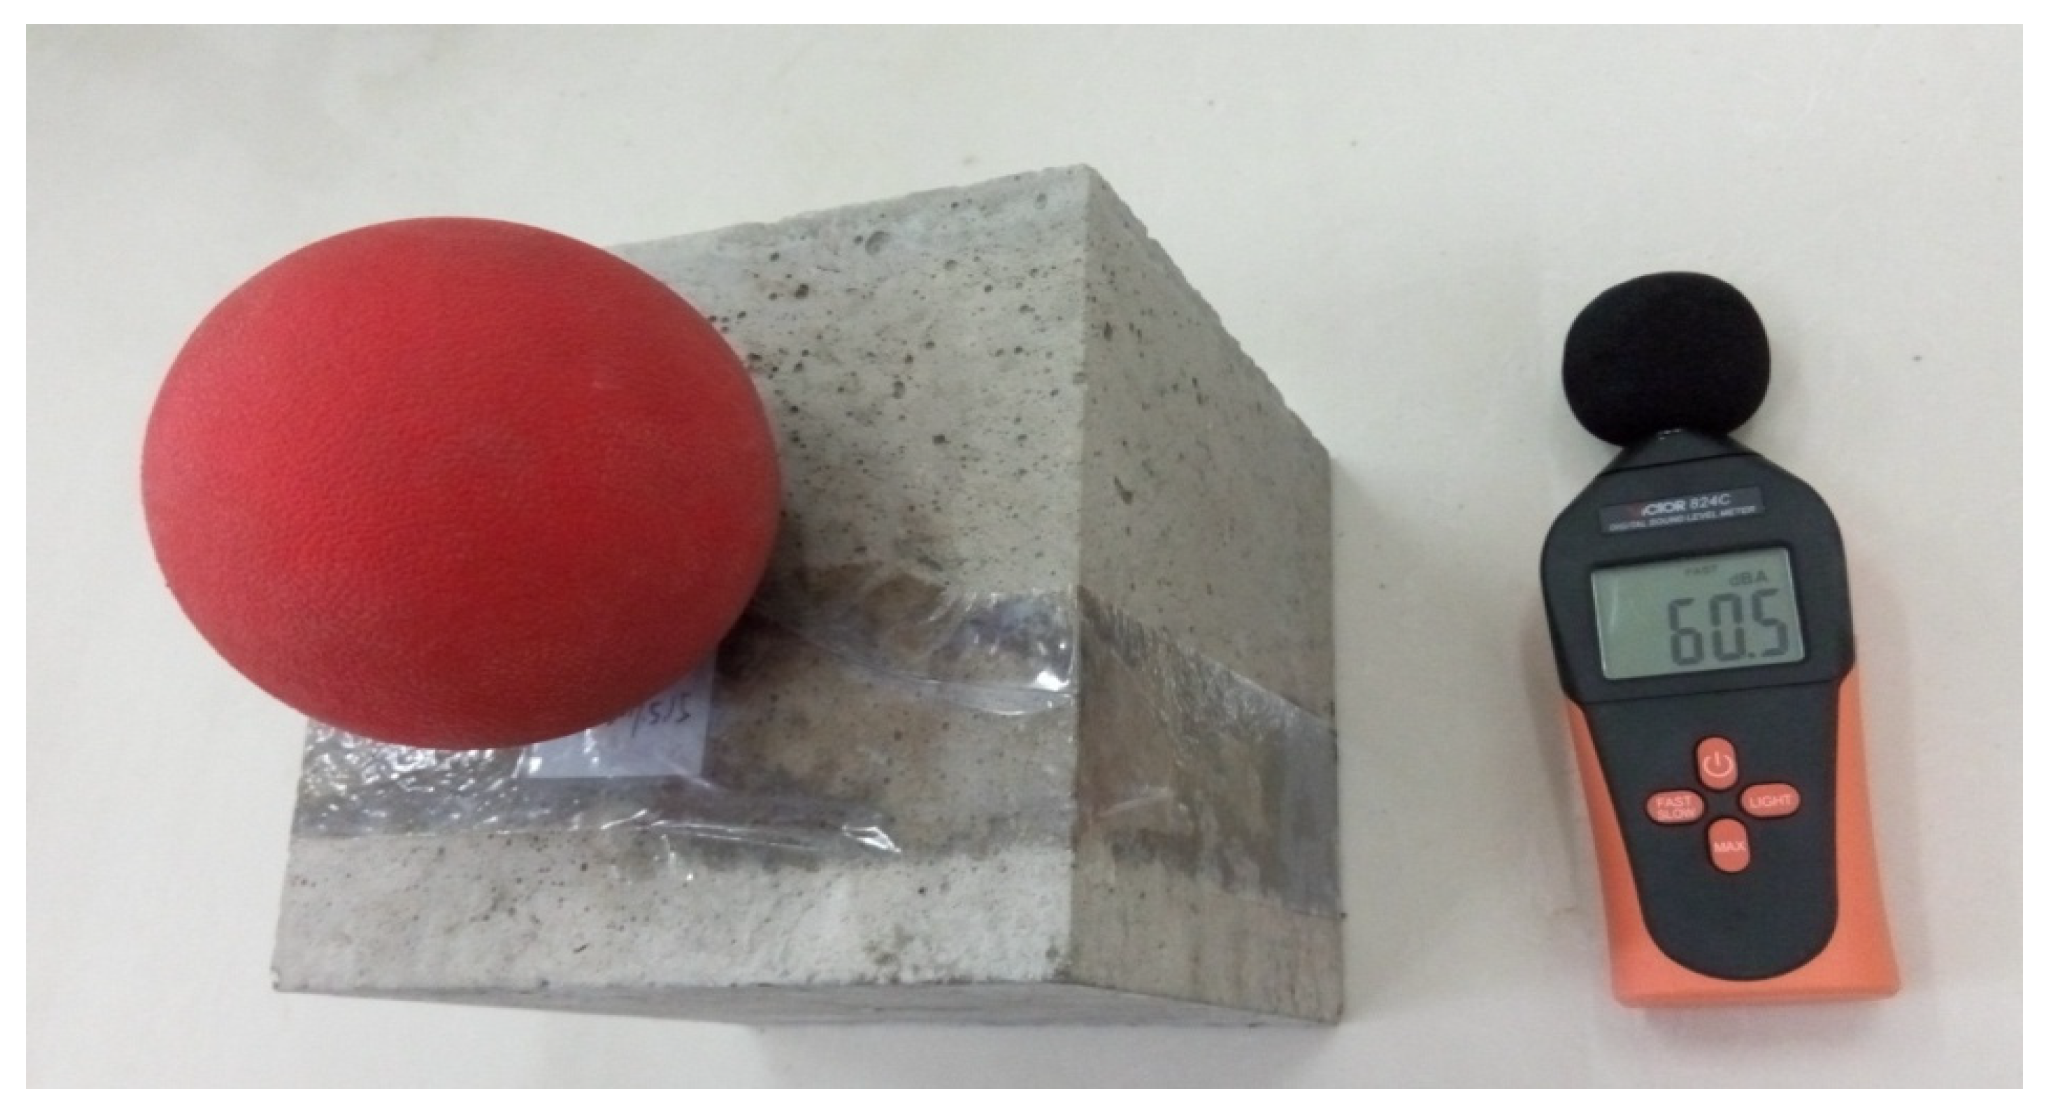
Among the waste rubber powders, the 10-mesh variant exhibited the most pronounced noise reduction effect, whereas the 20-mesh, 30-mesh, and 60-mesh varieties showed comparable noise reduction effects in concrete. Moreover, an increase in waste rubber powder content correlated with improved noise reduction capability.
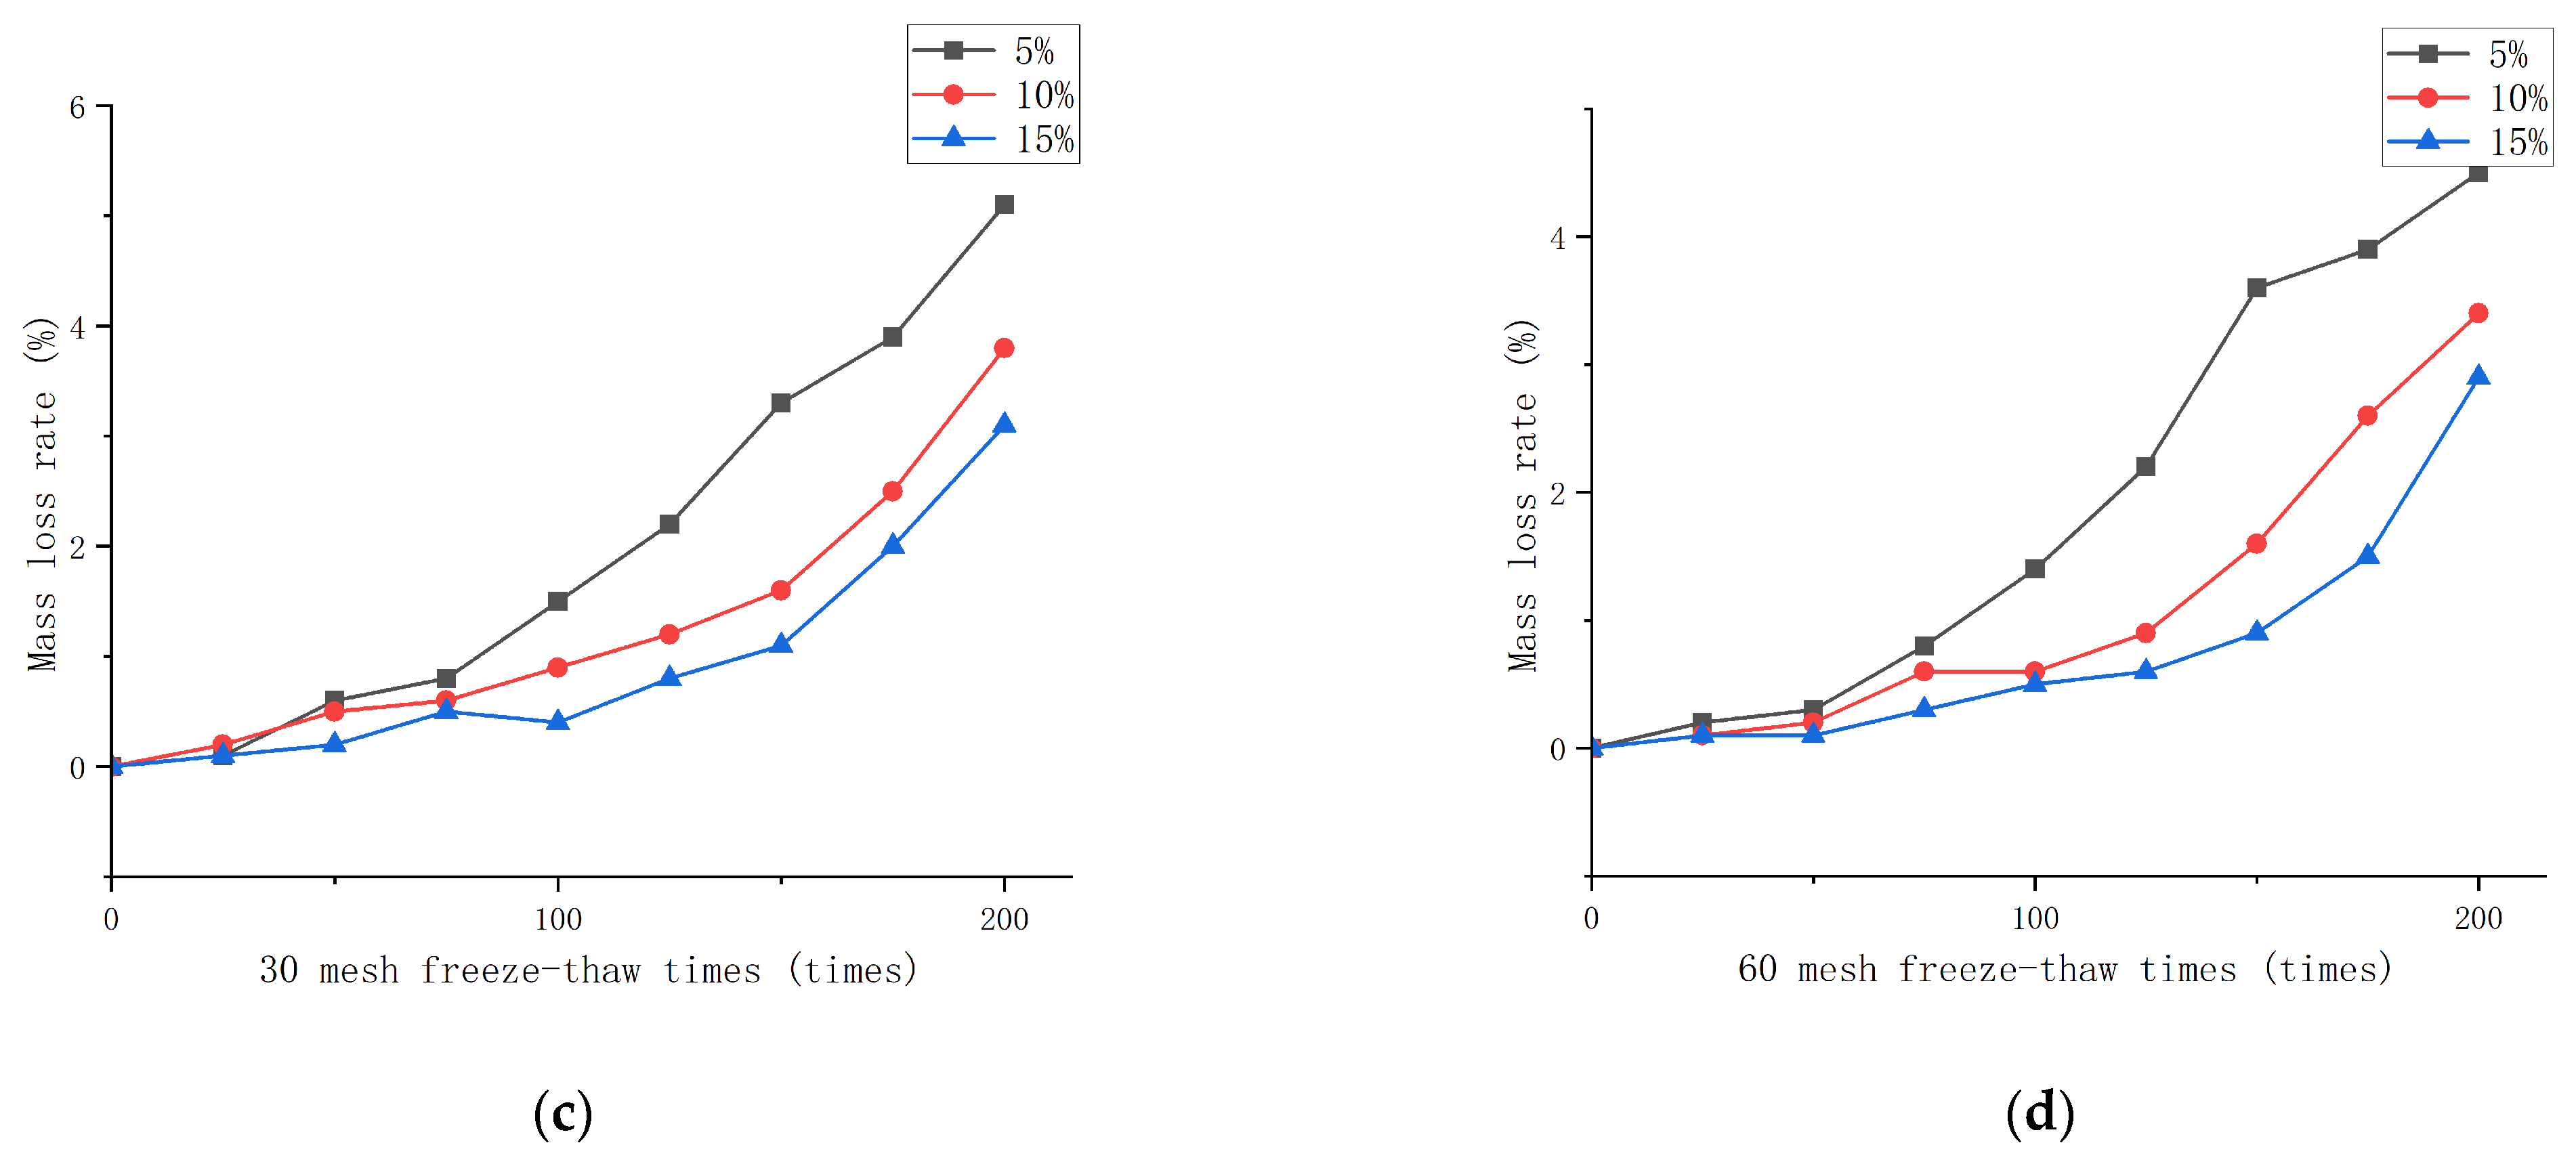
(4)
Waste rubber powder addition resulted in decreased drying shrinkage of cement concrete. Moreover, larger content and mesh size led to reduced drying shrinkage. Conversely, under constant content, impermeability increased with higher mesh sizes of waste rubber powder; meanwhile, with consistent mesh size, impermeability rose with increasing content, although the impact on concrete impermeability was more pronounced. Additionally, the mass loss rate of waste rubber powder cement concrete decreased with greater mesh size of waste rubber powder, and higher content correlated with lower mass loss rates.
This study delivers a thorough examination of the mechanical properties of waste rubber powder cement concrete, offering a fresh perspective for concrete research and application. It can not only decrease waste rubber pollution of the environment, while also increasing the recycling rate of raw materials, but also potentially broaden the application scope of cement concrete and alleviate its limitations.

Author Contributions

Conceptualization, S.M.; data curation, Y.X.; formal analysis, S.M.; funding acquisition, J.L. (Junqin Liu); investigation, J.L. (Junqin Liu); methodology, Y.X.; project administration, J.L. (Junqin Liu); resources, J.L. (Junqin Liu); software, Y.X.; supervision, S.M.; validation, J.L. (Jiyue Li); writing—original draft, J.L. (Jiyue Li); writing—review & editing, S.M. All authors have read and agreed to the published version of the manuscript.

Funding

This research was funded by the 2022 Construction of Scientific Research Projects in Zhejiang Province of China, grant number 2022K212.

Institutional Review Board Statement

Not applicable.

Informed Consent Statement

Not applicable.

Data Availability Statement

The raw data supporting the conclusions of this article will be made available by the authors on request.

Conflicts of Interest

The authors declare no conflicts of interest.

References

  1. Ming, X.; Cao, M. Development of Eco-Efficient Cementitious Composites with High Fire Resistance and Self-Healing Abilities-a Review. Resour. Conserv. Recycl. 2020, 162, 105017. [Google Scholar] [CrossRef]
  2. Bhardwaj, B.; Kumar, P. Waste Foundry Sand in Concrete: A Review. Constr. Build. Mater. 2017, 156, 661–674. [Google Scholar] [CrossRef]
  3. Aprianti, S.E. A Huge Number of Artificial Waste Material Can Be Supplementary Cementitious Material (SCM) for Concrete Production—A Review Part II. J. Clean. Prod. 2017, 142, 4178–4194. [Google Scholar] [CrossRef]
  4. Marinelli, S.; Marinello, S.; Lolli, F.; Gamberini, R.; Coruzzolo, A.M. Waste Plastic and Rubber in Concrete and Cement Mortar: A Tertiary Literature Review. Sustainability 2023, 15, 7232. [Google Scholar] [CrossRef]
  5. Marques, B.; António, J.; Almeida, J.; Tadeu, A.; de Brito, J.; Dias, S.; Pedro, F.; Sena, J.D. Vibro-Acoustic Behaviour of Polymer-Based Composite Materials Produced with Rice Husk and Recycled Rubber Granules. Constr. Build. Mater. 2020, 264, 120221. [Google Scholar] [CrossRef]
  6. Ahmad, J.; Zhou, Z.; Majdi, A.; Alqurashi, M.; Deifalla, A.F. Overview of Concrete Performance Made with Waste Rubber Tires: A Step toward Sustainable Concrete. Materials 2022, 15, 5518. [Google Scholar] [CrossRef]
  7. Nasir, N.A.M.; Bakar, N.B.; Safiee, N.A.; Aziz, F.N.A.A.; Archnaah, N. Mechanical Properties of Blended-Rubberized Concrete. J. Phys. Conf. Ser. 2023, 2521, 012016. [Google Scholar] [CrossRef]
  8. Wu, Y.-F.; Kazmi, S.M.S.; Munir, M.J.; Zhou, Y.; Xing, F. Effect of Compression Casting Method on the Compressive Strength, Elastic Modulus and Microstructure of Rubber Concrete. J. Clean. Prod. 2020, 264, 121746. [Google Scholar] [CrossRef]
  9. Soren, A.K. A Laboratory Study of Use of Crumb Rubber as Partial Replacement of Fine Aggregate in Concrete. Int. J. Res. Appl. Sci. Eng. Technol. 2023, 11, 1631–1651. [Google Scholar] [CrossRef]
  10. Chicoma, A.; Quiroz, R.; Muñoz, S.; Villena, L. Influence of the Physical and Mechanical Properties of Concrete by Adding Rubber Powder and Silica Fume. J. Sustain. Archit. Civ. Eng. 2023, 32, 205–223. [Google Scholar] [CrossRef]
  11. Lakhiar, M.T.; Kong, S.Y.; Bai, Y.; Susilawati, S.; Zahidi, I.; Paul, S.C.; Raghunandan, M.E. Thermal and Mechanical Properties of Concrete Incorporating Silica Fume and Waste Rubber Powder. Polymers 2022, 14, 4858. [Google Scholar] [CrossRef]
  12. Zhai, S.; Liu, C.; Liu, G.; Pang, B.; Zhang, L.; Liu, Z.; Liu, L.; Zhang, Y. Effect of Modified Rubber Powder on the Mechanical Properties of Cement-Based Materials. J. Mater. Res. Technol. 2022, 19, 4141–4153. [Google Scholar] [CrossRef]
  13. Zhu, H.; Liang, J.; Xu, J.; Bo, M.; Li, J.; Tang, B. Research on Anti-Chloride Ion Penetration Property of Crumb Rubber Concrete at Different Ambient Temperatures. Constr. Build. Mater. 2018, 189, 42–53. [Google Scholar] [CrossRef]
  14. Han, Q.; Wang, N.; Zhang, J.; Yu, J.; Hou, D.; Dong, B. Experimental and Computational Study on Chloride Ion Transport and Corrosion Inhibition Mechanism of Rubber Concrete. Constr. Build. Mater. 2021, 268, 121105. [Google Scholar] [CrossRef]
  15. Si, R.; Guo, S.; Dai, Q. Durability Performance of Rubberized Mortar and Concrete with NaOH-Solution Treated Rubber Particles. Constr. Build. Mater. 2017, 153, 496–505. [Google Scholar] [CrossRef]
  16. Su, D.; Pang, J.; Huang, X. Experimental Study on the Influence of Rubber Content on Chloride Salt Corrosion Resistance Performance of Concrete. Materials 2021, 14, 4706. [Google Scholar] [CrossRef] [PubMed]
  17. Li, Y.; Zhang, S.; Wang, R.; Dang, F. Potential Use of Waste Tire Rubber as Aggregate in Cement Concrete—A Comprehensive Review. Constr. Build. Mater. 2019, 225, 1183–1201. [Google Scholar] [CrossRef]
  18. Topçu, İ.B.; Demir, A. Durability of Rubberized Mortar and Concrete. J. Mater. Civ. Eng. 2007, 19, 173–178. [Google Scholar] [CrossRef]
  19. Retama, J.; Ayala, A.G. Influence of Crumb-Rubber in the Mechanical Response of Modified Portland Cement Concrete. Adv. Civ. Eng. 2017, 2017, 3040818. [Google Scholar] [CrossRef]
  20. Tran, V.C.; Dinh, Q.T.; Nguyen, C.N. Study on using grinding products from waste rubber to replace a part of the aggregate in cement concrete production. J. Sci. Tech. Sect. Spec. Constr. Eng. 2021, 4, 37–47. [Google Scholar] [CrossRef]
  21. Gupta, T.; Siddique, S.; Sharma, R.K.; Chaudhary, S. Behaviour of Waste Rubber Powder and Hybrid Rubber Concrete in Aggressive Environment. Constr. Build. Mater. 2019, 217, 283–291. [Google Scholar] [CrossRef]
  22. Zhai, S.; Liu, G.; Pang, B.; Liu, C.; Zhang, Z.; Zhang, L.; Liu, L.; Yang, Y.; Liu, Z.; Zhang, Y. Investigation on the Influence of Modified Waste Rubber Powder on the Abrasion Resistance of Concrete. Constr. Build. Mater. 2022, 357, 129409. [Google Scholar] [CrossRef]
  23. Abdullah, W.A.; Muhammad, M.A.; Abdulkadir, M.R. Experimental investigation of some mechanical properties of rubberized concrete with highest possible rubber content. J. Duhok Univ. 2020, 23, 509–522. [Google Scholar] [CrossRef]
  24. Chen, A.; Han, X.; Wang, Z.; Guo, T. Dynamic Properties of Pretreated Rubberized Concrete under Incremental Loading. Materials 2021, 14, 2183. [Google Scholar] [CrossRef] [PubMed]
  25. Badawi, M.; Ahmed, A.G.; Eldamaty, T.A.; Helal, M.M. Properties of Recycled Concrete Utilizing Waste Rubber. Eng. Technol. Appl. Sci. Res. 2023, 13, 11451–11458. [Google Scholar] [CrossRef]
  26. Alyousef, R.; Ahmad, W.; Ahmad, A.; Aslam, F.; Joyklad, P.; Alabduljabbar, H. Potential Use of Recycled Plastic and Rubber Aggregate in Cementitious Materials for Sustainable Construction: A Review. J. Clean. Prod. 2021, 329, 129736. [Google Scholar] [CrossRef]
  27. Deng, L.; Cai, C.S. Bridge Model Updating Using Response Surface Method. In Earth and Space 2010: Engineering, Science, Construction, and Operations in Challenging Environments; American Society of Civil Engineers: Honolulu, HI, USA, 2010; pp. 2311–2320. [Google Scholar]
  28. Azizmohammadi, M.; Toufigh, V.; Ghaemian, M. Experimental and Analytical Investigation on the Interlayer of Roller Compacted Concrete. J. Mater. Civ. Eng. 2021, 33, 04021090. [Google Scholar] [CrossRef]
  29. Khan, A.; Do, J.; Kim, D. Experimental Optimization of High-Strength Self-Compacting Concrete Based on D-Optimal Design. J. Constr. Eng. Manag. 2017, 143, 04016108. [Google Scholar] [CrossRef]
  30. Kosarimovahhed, M.; Toufigh, V. Sustainable Usage of Waste Materials as Stabilizer in Rammed Earth Structures. J. Clean. Prod. 2020, 277, 123279. [Google Scholar] [CrossRef]
  31. Elnakar, H.; Buchanan, I. Treatment of Bypass Wastewater Using Novel Integrated Potassium Ferrate(VI) and Iron Electrocoagulation System. J. Environ. Eng. 2020, 146, 04020075. [Google Scholar] [CrossRef]
  32. Raychaudhuri, A.; Behera, M. Review of the Process Optimization in Microbial Fuel Cell Using Design of Experiment Methodology. J. Hazard. Toxic Radioact. Waste 2020, 24, 04020013. [Google Scholar] [CrossRef]
  33. Pathak, A.; Khandegar, V.; Kumar, A. Statistical Investigation in Conjunction with a Box–Behnken Design for the Removal of Dyes Using Electrocoagulation. J. Hazard. Toxic Radioact. Waste 2021, 26, 04022001. [Google Scholar] [CrossRef]
Figure 1. Waste tire rubber powder.
Applsci 14 06636 g001
Figure 2. The grain size distribution curve of the coarse aggregate.
Applsci 14 06636 g002
Figure 3. The grain size distribution curve of the medium sand.
Applsci 14 06636 g003
Figure 4. Schematic diagram of hammer impact test device.
Applsci 14 06636 g004
Figure 5. Rubber ball impact test.
Applsci 14 06636 g005
Figure 6. Drying shrinkage test of waste rubber powder cement concrete.
Applsci 14 06636 g006
Figure 7. Vacuum saturation device.
Applsci 14 06636 g007
Figure 8. Measurement device of chloride ion electrical flux of waste rubber powder concrete.
Applsci 14 06636 g008
Figure 9. Schematic diagram of chloride ion penetration test device (1—direct current stabilized voltage power supply; 2—test flume; 3—copper electrode; 4—concrete sample; 5—3.0%NaCl solution; 6—0.3%mol/L NaOH solution; 7—direct current digital voltmeter; 8—specimen washer).
Applsci 14 06636 g009
Figure 10. Anti-freezing test of waste rubber powder cement concrete.
Applsci 14 06636 g010
Figure 11. Residual plot of test (a) residual plot of 7 d flexural strength and (b) residual plot of 28 d flexural strength.
Applsci 14 06636 g011
Figure 12. Predicted versus actual (a) ratio of 7 d predicted flexural strength to actual flexural strength and (b) ratio of 28 d predicted flexural strength to actual flexural strength.
Applsci 14 06636 g012
Figure 13. 3D plots illustrating the impact of the water–cement ratio and sand ratio on 7 d flexural strength.
Applsci 14 06636 g013
Figure 14. 3D plots illustrating the impact of the water–cement ratio and sand ratio on 28 d flexural strength.
Applsci 14 06636 g014
Figure 15. 3D plots illustrating the impact of the water–cement ratio and 10-mesh waste rubber powder content on 7 d flexural strength.
Applsci 14 06636 g015
Figure 16. 3D plots illustrating the impact of the water–cement ratio and 10-mesh waste rubber powder content on 28 d flexural strength.
Applsci 14 06636 g016
Figure 17. 3D plots illustrating the impact of the sand ratio and 10-mesh waste rubber powder content on 7 d flexural strength.
Applsci 14 06636 g017
Figure 18. 3D plots illustrating the impact of the sand ratio and 10-mesh waste rubber powder content on 28 d flexural strength.
Applsci 14 06636 g018
Figure 19. The results of the compressive strength test (a) 3 d compressive strength, (b) 7 d compressive strength, (c) 14 d compressive strength, and (d) 28 d compressive strength.
Applsci 14 06636 g019
Figure 20. The results of the flexural strength test (a) 3 d flexural strength, (b) 7 d flexural strength, (c) 14 d flexural strength, and (d) 28 d flexural strength.
Applsci 14 06636 g020
Figure 21. The results of the dynamic modulus test (a) 3 d dynamic modulus, (b) 7 d dynamic modulus, (c) 14 d dynamic modulus, and (d) 28 d dynamic modulus.
Applsci 14 06636 g021
Figure 22. The results of the hammer impact test: (a) the initial crack energy absorption and (b) the final crack energy absorption.
Applsci 14 06636 g022
Figure 23. The results of the rubber ball impact test.
Applsci 14 06636 g023
Figure 24. The results of the drying shrinkage test (a) the shrinkage rate of 10-mesh waste rubber powder cement, (b) the shrinkage rate of 20-mesh waste rubber powder cement, (c) the shrinkage rate of 30-mesh waste rubber powder cement, and (d) the shrinkage rate of 10-mesh waste rubber powder cement.
Applsci 14 06636 g024
Figure 25. The results of electrical flux test.
Applsci 14 06636 g025
Figure 26. The results of the drying shrinkage test (a) the mass loss rate of 10-mesh waste rubber powder cement, (b) the mass loss rate of 20-mesh waste rubber powder cement, (c) the mass loss rate of 30-mesh waste rubber powder cement, and (d) the mass loss rate of 10-mesh waste rubber powder cement.
Applsci 14 06636 g026aApplsci 14 06636 g026b
Table 1. Technical indexes of superplasticizer.
ItemsPlasticizer
Water-reducing rate (%)25.6
Shrinking percentage72
Chloridion content (%)0.01
Total alkali content (%)0.36
Sodium sulfate content (%)1.232
PH7.1
Table 2. The concrete mixtures of the tests.
ItemsContent
Water–cement ratio0.38
Cement (kg/m3)375
Water (kg/m3)150
Sand ratio (%)34
Aggregate quantity (kg/m3)1925
Superplasticizer (%)1.28
Table 3. The factors of Box–Behnken design.
FactorsFactor Levels and Ranges
−101
A water–cement ratio0.350.400.45
B sand ratio (%)323436
C 10 mesh waste rubber powder content (%)51015
Table 4. Response surface test design mix design scheme (kg/m³).
NumberCementWater5∼10 mm10∼20 mm20∼30 mmSandPlasticizerCrumb Rubber
1375131.25385962.5577.56164.837.5
2375168.75385962.5577.56164.837.5
3375150385962.5577.5654.54.837.5
4375131.25385962.5577.56934.837.5
5375168.75385962.5577.56934.837.5
6375150385962.5577.5654.54.837.5
7375131.25385962.5577.5654.54.818.75
8375150385962.5577.5654.54.837.5
9375168.75385962.5577.5654.54.818.75
10375131.25385962.5577.5654.54.856.25
11375150385962.5577.5654.54.837.5
12375168.75385962.5577.5654.54.856.25
13375150385962.5577.56164.818.75
14375150385962.5577.5654.54.837.5
15375150385962.5577.56164.856.25
16375150385962.5577.56934.856.25
17375150385962.5577.56934.818.75
Table 5. The results of Box–Behnken design.
NumberWater–Cement RatioSand Ratio (%)10-Mesh Waste
Rubber Powder
Cement (%)
Flexural Strength (MPa)
7 d28 d
10.3532105.455.98
20.4532104.925.45
30.434105.325.84
40.3536105.375.92
50.4536104.695.27
60.434105.245.82
70.353455.586.13
80.434105.265.74
90.453455.035.56
100.3534155.165.65
110.434105.215.73
120.4534154.475.01
130.43255.265.78
140.434105.235.78
150.432154.785.32
160.436154.575.12
170.43655.295.83
Table 6. Response surface optimization scheme table.
NumberWater–Cement RatioSand Ratio (%)10-Mesh Waste Rubber Powder Content (%)7 d Flexural Strength (MPa)28 d Flexural Strength (MPa)
10.353455.66.18
20.353385.576.14
30.363375.566.12
40.353385.556.12
50.353585.566.10
60.373555.536.07
70.363495.516.04
80.373395.476.01
90.363695.476.00
100.3535105.455.98
Disclaimer/Publisher’s Note: The statements, opinions and data contained in all publications are solely those of the individual author(s) and contributor(s) and not of MDPI and/or the editor(s). MDPI and/or the editor(s) disclaim responsibility for any injury to people or property resulting from any ideas, methods, instructions or products referred to in the content.

