Project Report

Fuel–Water Emulsions as an Alternative Fuel for Gas Turbines: A Project Summary

1
Department of Composite Aviation Structures, Air Force Institute of Technology, 01-494 Warsaw, Poland
2
Department of Division of Aircraft Engines, Warsaw University of Technology, 00-661 Warsaw, Poland
*
Author to whom correspondence should be addressed.
Appl. Sci. 2024, 14(15), 6686; https://doi.org/10.3390/app14156686
Submission received: 16 June 2024 / Revised: 18 July 2024 / Accepted: 24 July 2024 / Published: 31 July 2024

Abstract

:
The paper presents conclusions from research conducted at the Warsaw University of Technology in 2019–2023 regarding the combustion of fuel–water emulsions in a miniature gas turbine. The presented conclusions were made taking the current state of knowledge available in the literature into account. Particular emphasis was placed on explaining the discrepancies in the results of the experimental studies available in the literature. The main aspects of the combustion of the fuel–water emulsions that were analyzed were their impact on the emissions of NOx and CO, as well as the impact of the surfactant included in the fuel mixture on the combustion process, emissions and the formation of deposits on the walls of the combustion chamber. The impact of the emulsion fuel on fuel consumption was also discussed. In order to explain the changes occurring in the combustion chamber as a result of adding water to the fuel, numerical methods and methods of fluid mechanics were used. Studies have shown a positive impact of the use of fuel–water emulsions on CO and NOx emissions and fuel consumption. It was also demonstrated that fuel additives used for emulsification can create deposits on the walls of the hot engine section.

1. Introduction

A fuel–water emulsion is a mixture of at least two liquids, one of which is in the form of drops that is dispersed in the other. The dispersed droplets have microscopic or ultramicroscopic dimensions [1]. In issues related to the combustion process in engines, two-phase emulsions are most often used, in which the continuous phase is fuel, and the dispersed phase is water. Although research is also being carried out on the use of three-phase emulsions, they differ from two-phase emulsions in that inside the drops of the discrete phase, there are even smaller drops of liquid constituting the internal phase [2,3,4].
Water is a polar liquid, and hydrocarbon fuels are non-polar liquids, which means that they do not mix with each other. The process of mixing this type of liquid destroys the surface tension between them, which leads to the breakdown of the dispersed phase into drops. The resulting drops tend to combine with each other and separate from the continuous phase. This effect can be eliminated by adding a surfactant to the mixture, which reduces both the thermodynamic instability of the emulsion and the surface tension between liquids. It also limits the increase in interfacial free energy [5,6,7].
During the combustion process of emulsion fuels, secondary atomization of droplets may occur. These phenomena are called micro-explosion and puffing. The phenomenon of micro-explosion involves the sudden bursting of a fuel drop, while the puffing phenomenon is characterized by the separation of part of the liquid from the original drop of the fuel mixture [8,9]. These phenomena are commonly observed in studies conducted on single drops of emulsion fuels [10,11,12,13]. The quality of the atomization of emulsion fuel drops is influenced by factors such as temperature, the size of the water drops constituting the discrete phase and the position of the water drop in the emulsion fuel drop. Moreover, the influence of each of the two variables can be compensated for by modifying the third one [14]. Mathematical models of the course of micro-explosions are being developed [15]. One of their representatives is the membrane model, in which attempts have been made to develop relationships that enable the calculation of the force of micro-explosions in a unified way for various types of emulsions [16,17].
The emulsifier can take an active part in the combustion process, as proven by tests carried out on single fuel drops; for example, in the tests conducted on a fast compression machine, in which the continuous fuel phase was n-decane and the discrete phase was water with a share from 10% to 30%. Moreover, the mixture was enriched with sorbitan monooleate (emulsifier) in an amount of 2% [12]. As a result of these studies, it was observed that in emulsions containing up to 20% of water in their composition, after heating the drops, classic combustion and micro-explosions occur. The combustion stage of fuel drops, in which the emulsifier is burned, was also recorded in studies in which fuel drops with the addition of aluminum nanoparticles and sorbitan oleate (emulsifier) were burned [11]. Moreover, it was noticed that increasing the amount of emulsifier extends its combustion time.
Apart from the research conducted on single drops of emulsion fuel, there have been very few studies on the combustion of fuel–water emulsions in gas turbines [4]. The objects of the research were the J79-GE-10 (General Electric) [18], 9000B (Alstom) [19], V94.V3 GT and V84.V3 GT (Siemens) [20,21,22] and C60 (Capstone Green Energy) turbines [23].
In all cases, apart from the one in which the test object was the C60 turbine, a reduction in NOx emissions was recorded as a result of replacing the traditional fuel with a fuel–water emulsion. In the case of the C60 turbine, an increase in NOx emissions was recorded compared with the reference case following the use of a fuel mixture containing up to 37.5% water in its composition. After increasing the amount of water to 50%, the NOx emissions changed to a decreasing trend [23]. Moreover, studies conducted on test stands of gas turbine combustion chambers have also led to the conclusion that the addition of water to fuel reduces NOx emissions. In cases where the opposite effect was noted, the determining parameter was the type of fuel or its additive [4], as in [24], where the continuous phase of the emulsion was Redwood 650, which contains more than 10 times more nitrogen than is found in Oil No. 2.
Changes in CO emissions resulting from the use of fuel–water emulsions are less predictable than in the case of NOx emissions. In the case of the V94.V3 GT, V84.V3 GT and 9000B turbines, no significant changes in CO emissions were recorded after replacing the classic fuel with emulsion fuel [19,20,21,22]. However, in the J79-GE-10 and C60 turbines, this addition resulted in an increase in emissions [18,23]. Research carried out at gas turbine combustion chambers also does not provide a clear answer as to the impact of emulsion fuel on CO emissions. Most often, an increase in CO emissions was recorded as a result of adding water to the fuel [4], although there were also cases in which a reduction in emissions was recorded; for example, in [25].
In the process of producing fuel–water emulsions, the addition of a surfactant is often used [2,4,26]. The amount of emulsifier in the mixture influences, among other things, the droplet size of the discrete phase of the emulsion [27], which may be a variable affecting the combustion process on a macroscopic scale [28]. The literature emphasizes the paucity of research on the influence of the emulsifier on operating parameters and emissions from the engines [2,26] and notes that discrepancies in the tested CO and HC emissions may result from the quality of emulsions or be caused by additives [29,30]. Therefore, understanding the impact of the addition of an emulsifier on the combustion process is particularly important, especially in the context of the previously mentioned research results conducted on single fuel drops.
In publications on the combustion of fuel–water emulsions, there is only limited information on the impact of emulsion fuel combustion on the hot section of engines. In tests in which the emulsifier constituted up to 20% of the volume of the fuel mixture, the presence of a “varnish-type” coating on the walls of the combustion chamber was found after the tests. In this case, the authors attributed the cause of the precipitate to the emulsifier [31]. In another study, upon completion of testing on a piston engine, a deposit resembling white dust was found in the area of the intake valve after inspection. The tests lasted 500 h, during which the unit was powered by an emulsion fuel with a water content of 13% to 17%, and no engine damage or operational problems were found. In this case, it was also concluded that the cause of the deposit was the presence of an emulsifier in the fuel mixture [32].
Based on the authors’ own research conducted on the GTM120 miniature gas turbine engine and literature studies, a lot of effort was made to explain the discrepancies in the literature regarding the results of tests on the combustion of fuel–water emulsions in gas turbines. Although, in general, the change in NOx emissions resulting from the addition of water to the fuel is characterized by a high degree of convergence of the observed change trends, in the case of the tests conducted on the C60 turbine, which is the only small turbine (60 kW) on which this type of research was carried out, a different tendency was shown. Therefore, NOx emission studies conducted on a miniature gas turbine can make a decisive contribution to our understanding of the impact of emulsion fuels on NOx emissions from small units. Moreover, based on experimental research and numerical calculations, an analysis of the impact of the presence of water in the fuel on CO emissions was carried out, which may also contribute to explaining the reasons for the divergent emission results found in the literature.
Another aspect analyzed due to the paucity of literature data was the influence of the emulsifier on the combustion process. The aim of this research campaign was to check whether the surfactant in the amounts standardly used in research affects the combustion process so much that its inclusion in the analysis of the combustion process is indispensable. Moreover, the manuscript presents the results of an inspection of a miniature gas turbine after a series of tests in which an emulsifier was burned together with the fuel. The results of this inspection contribute to understanding the causes of deposits in the combustion chamber resulting from the combustion of emulsion fuels. The aspect of the impact of adding water to fuel on thrust-specific fuel consumption and fuel consumption was also discussed.

2. Subject and Methodology of Research

2.1. Miniature Gas Turbine

The research campaign that is the subject of this study was conducted on the test stand of the GTM120 miniature gas turbine engine manufactured by JetPol from Poznań (Poland). This is a type of gas turbine characterized by a system of evaporators replacing the injectors. Representatives of this type of structures include the miniature turbines P80-SE (JetCat, Ballrechten-Dottingen, Germany), Wren 180K Pro (Wren Turbines Limited, Norwich, UK) and Hawk 100R (Hawk Turbine AB, Västerås, Sweden) and the entire series of GTM turbines [33,34,35,36,37]. The mentioned gas turbines are characterized by a similar structure in all cases. These are single-shaft units equipped with a single-stage radial compressor and a single-stage axial turbine located at the opposite end of the shaft. A characteristic feature of this type of turbine is their quasi-reverse flow—part of the air from behind the compressor flows to the end of the external engine channel and then flows through evaporators to which liquid fuel is applied; that is, to the primary combustion zone (Figure 1). For greater clarity, the diagram omits the shaft and shaft cover located in the engine axis.
This type of engine is characterized by an open lubrication system. Part of the fuel pumped through the fuel pump is separated from the main flow that powers the turbine and is redirected through additional lines to the vicinity of two bearings with which these turbines are equipped. The front bearing is located in the plane of the diffuser disc (Figure 2a), and the rear bearing is in the plane of the turbine guide bar (Figure 2b). In order to improve its lubricating properties, the fuel is enriched with oil. In the case of the research conducted by the authors, this was Aeroshell Turbine Oil 500, which constituted 5% of the weight of the Jet A1 and oil mixture. 2.5% of the total fuel mixture flow is used to lubricate the bearings in the GTM120 turbine. The flow is divided using a separating orifice.
The GTM120 miniature gas turbine has an anachronistic starting system. In more modern turbines of this type, starting is performed using liquid fuel and an ignition system adapted to it, which is able to evaporate the fuel before ignition (for a cold engine). In the case of the GTM120, which does not have this system, the cold unit is started using gaseous fuel. In this case, it is commercial propane–butane. In the first phase of reaching the idle speed, gas is fed into the combustion chamber and ignited by a glow plug. The burning gas fuel heats the combustion chamber, which allows the application of liquid fuel, which can evaporate and burn. During the start-up phase, the gas fuel supply is cut off and the gas turbine, after reaching idle speed, runs only on liquid fuel. Opening and shutting off the flow of each fuel is carried out via solenoid valves.
The GTM120 gas turbine engine is characterized by the ability to achieve a shaft rotation of 120 krpm; at this rotational speed, it is able to generate 120N of thrust, while consuming just over 500 mL of fuel per minute. For the maximum shaft rotation speed, the mass flow of air flowing through the engine is approximately 0.35 kg/s. The average temperature behind the combustion chamber reaches approximately 720 °C, and at the engine outlet, to almost 600 °C. A single-stage radial compressor with a diameter of 70 mm is able to compress the flowing air to 2.2 bar (absolute pressure). The pressure mentioned is the static pressure measured behind the diffuser disk at a shaft rotation speed of 120 krpm. For these parameters, the measured temperature in the same plane reaches 120–130 °C. The weight of this unit is 1.5 kg, its maximum diameter is 110 mm and the total length is 265 mm [38,39].

2.2. Research Stand

On the test stand, the GTM120 gas turbine was placed on a platform, allowing it to move together with the turbine relative to the base in the direction opposite to the thrust vector. This movement was made possible by linear bearings and two guides. Mounting the engine on the stand in the manner described enables the measurement of thrust, which was carried out with the NS-6 strain gauge beam from Mavin (the WDT-1 strain gauge sensor amplifier from WObit was used) (Figure 3). In the engine inlet, in a 2′ characteristic cross-section (Figure 4), the static temperature (Czaki TP-202, NiCr-NiAl), static pressure (Kobold SEN-8701/2 B045) and dynamic pressure (Honeywell ASDX030D44R) were measured. Temperatures (Czaki TP-202 and TP-203) and static pressures (Kobold SEN-8701/2 B055 and Kobold SEN-8701/2 B045) were measured in sections 3′ and 4′. Behind the engine, in a 9′ cross-section, there is a Testo 350 exhaust gas analyzer probe and a Czaki TP-203 thermocouple attached to it. Fuel consumption is measured indirectly by measuring the change in the pressure of the liquid column in the tank, which occurs with the consumption of fuel by the engine. The Dudek P400U differential pressure transmitter was used for the measurement. Data acquisition from the sensors was performed via a National Instruments USB-6259 BNC measurement card. The measurement uncertainties (catalogs) of the sensors used are presented in Table 1 and Table 2.
Due to the concern that the addition of water or other additives may adversely affect the lubricating properties of the mixture, it was decided to modify the factory lubrication system (Figure 5a) in such a way that a standard fuel mixture was used to lubricate the bearings (Figure 5b). In the factory fuel system, after being pumped through the fuel pump, the fuel with oil added is divided into two flows using a tee and an orifice installed in the fuel system. About 97.5% of the fuel mixture is directed to the combustion chamber, while the remaining part is used in the open lubrication system. For the purposes of testing, the fuel system was separated from the lubrication system. The lines responsible for supplying the mixture to the bearings were disconnected from the system and then connected to an additional fuel tank, which contained a standard mixture of fuel and oil, regardless of the type of mixture being burned. The mixture was pumped from it to the lubrication system using an additional fuel pump. The fuel pump was voltage-controlled by pulse width modulation. During the preliminary tests, there was no impact of the mass flow of the lubricating mixture on the measured parameters.

2.3. The Course of Experiments

Regardless of the type of fuel mixture, the general nature of the experiment was as follows: Before the tests, the fuel tank was filled with the appropriate mixture. The fuel mixture was prepared immediately before the experiment in an amount allowing for a maximum of two experimental tests, which were carried out immediately one after another in the shortest possible time. Reference tests and tests with the mixture with the additives being tested were carried out in an identical manner in a given series.
The first phase of each test was the start-up of a miniature gas turbine engine. It involved providing the initial rotational speed through an electric starter attached to the inlet port (Figure 6). During this time, gaseous fuel was introduced into the combustion chamber and ignited, which led to a further increase in engine speed. Then, the application of liquid fuel was started, and the gas fuel supply was cut off. In this configuration, the revolutions were increased to 33 krpm, and then the shaft speed was increased manually using the control panel to 40 krpm. After reaching this rotational speed, the engine was held at this speed for a specified time, and then the rotational speed was increased by 20 rpm as quickly as possible. This procedure was repeated up to 120 krpm, as shown in Figure 6. After the time for the engine operation at a shaft speed of 120 krpm had elapsed, it was reduced to 80 krpm in order to reduce the temperature in the combustion chamber, and then the fuel supply was cut off. Data recording from the sensors started before the starting procedure and ended after the engine stopped completely.
In the case of a series of tests involving fuel–water emulsions, a modified bearing lubrication system was used (Figure 5b). This was done both in reference tests with a standard fuel mixture and in tests in which only a surfactant was added [40,41]. However, in a series of tests that focused on the impact of adding an emulsifier to the fuel, a standard configuration of the lubrication system was used (Figure 5a) [42].

2.4. Numerical Calculations

The numerical calculations described in this chapter were performed in the Ansys Fluent 15 program, while the computational mesh was created using the ICEM CFD program.

2.4.1. Combustion and Turbulence Model

To perform numerical calculations, the Steady Diffusion Flamelet combustion model was used, which assumes that the turbulent flame is composed of a finite number of laminar, thin, local one-dimensional flames [43,44]. Using this combustion model, the temperature field and mass fraction of individual combustion products depend on the mass fraction of the fuel and the strain rate expressed by the dissipation coefficient [43,45]. Turbulence was modeled using a two-equation k-ε model with the Scalable Wall Function. This model is based on the equations of turbulence kinetic energy transport and kinetic energy dissipation [46].

2.4.2. Geometry

For numerical calculations, the geometry of the GTM120 gas turbine was used, which was simplified for this purpose. The simplified model was devoid of moving elements, i.e., the compressor and turbine. The model, therefore, included the volume from the inlet to the compressor diffuser to the outlet from the turbine vanes (Figure 7). An analogous approach to modeling the flow and combustion process in miniature gas turbines is widely represented in the literature [37,47,48,49,50]. The model used for simulation covered 360°, because due to the different number of compressor blades, diffuser blades, glow tube holes and turbine guide blades, the geometry does not show signs of cyclic periodicity.

2.4.3. Boundary Conditions

The amount of air leaving the compressor was determined by the mass flow inlet condition (Figure 7). The set amount of air was varied depending on the simulated turbine rotational speed. Its quantity was determined based on the results of experimental tests obtained from the values of static pressure, dynamic pressure and temperature in the turbine inlet, assuming that air is an ideal gas. The direction of air flow onto the diffuser blades was given in the form of a velocity vector in a cylindrical system, which was calculated based on velocity triangles. Both the circumferential and radial components of this vector were set individually for each of the considered rotational speeds. However, the outlet condition from the calculation volume was the pressure condition. The value of the pressure set at the outlet was selected interactively and individually for each of the modeled turbine rotational speeds. It was selected so that the pressure calculated in the characteristic sections 3′ and 4′ (Figure 4) coincided with the experimental results with an accuracy of ±5%.
The reaction mechanism presented in [19] was used to model the combustion of Jet A1 fuel. It is a mechanism consisting of 38 chemical reactions and contains 24 chemical compounds. The Discrete Phase Model was used to model fuel injection. In this model, the motion trajectories of the fuel mixture particles are calculated by solving the equation of forces acting on the fuel particle. Stochastic tracking is used to model the turbulent dispersion of fuel particles. The amount of liquid fuel dosed in each case was based on the results of experimental tests. The application of both Jet A1 and water was simulated using the Discrete Phase Model.
The Discrete Ordinates Model was used to model radiative heat transfer. This model works by solving energy transport equations in the form of thermal radiation for a finite number of solid angles. The walls of the combustion chamber and evaporators (blue in Figure 7) were modeled as coupled walls. This approach to wall modeling allows the physical wall thickness to be omitted from the model. The actual combustion chamber and evaporators are made of 0.5mm thick Inconel 713C sheet metal. The walls of the housing and the compressor diffuser were given a constant temperature of 315K. This was selected based on the temperature measurement of the turbine casing during its operation. The remaining walls in the model were defined as adiabatic.

2.4.4. Numerical Grid

The model used a numerical mesh composed of tetrahedral elements, which was enriched with denser prismatic elements near the walls. The density of elements near the walls was intended to increase the accuracy of mapping the near-wall flow. The size of the boundary layer elements was made according to [51] and, if necessary, corrected so that the dimensionless distance from the wall was within the range corresponding to the turbulence model used.
Tests aimed at determining the relationship between the size of the numerical grid and the accuracy of calculations were carried out for cold flow with flow parameters corresponding to a rotational speed of 80 krpm. The observed parameter was the maximum flow velocity in the computational domain. Ultimately, it was decided to use a numerical grid consisting of ~2.5 million elements in the calculations. A mesh of this density was chosen because almost doubling the size of the numerical mesh (to ~4.7 million elements) resulted in a change in the observed parameter by less than 1%; hence, the use of a mesh consisting of ~2.5 million elements was considered acceptable, this was also chosen with a view to reducing the computation time.

2.5. Fuel Mixtures

2.5.1. Surfactant

The surfactant used during the tests was a mixture of five substances: one of them was demineralized water, and the remaining four were emulsifiers produced by the PCC Group (Table 3).
The mixture was prepared in several stages. In the first stage, Rokafenol N8 was mixed with demineralized water and the mixing process was carried out. After this treatment, the resulting mixture was rested for 24 h. After this time, Rokanol DB3 was added to the resulting mixture, and the mixing process was repeated. Then Rokwin 80 and Rokanol RZ4P11 were applied, and the emulsifier ingredients were mixed once again. Each time, the mixing process took 5 min. Details of the equipment used to prepare the surfactant are described in [52].

2.5.2. Fuel–Water Emulsion

The fuel–water emulsions used in the tests consisted of a standard mixture of Jet A-1 and oil, surfactant and demineralized water. All of them contained 2% (by weight) of emulsifier. The percentages of ingredients in the emulsion refer to the total weight of the emulsion mixture. The emulsion was prepared in two stages. In the first stage, a surfactant was added to the mixture of kerosene and oil, followed by a 5 min mixing process with a mechanical mixer. In the second stage, demineralized water was added to the mixture and the mixing process was repeated. The fuel–water emulsion obtained in this way is macroscopically milky-white in color (Figure 8a), while microscopically, it is a mixture, with clearly visible water drops constituting the discrete phase of the emulsion fuel (Figure 8b). More microscopic photos of the emulsion prepared by the described method are available in [52,53].
An emulsion containing from 3% to 12% water (by mass) was used to study combustion in a miniature gas turbine. The emulsions used were characterized by approximately no SMD (Sauter Mean Diameter) sensitivity to changes in the amount of water included in their composition. Moreover, there was no significant impact of the turbine fuel system on the microstructure of the fuel–water emulsion used [27].

3. Research Results and Discussion

Presentation of the research results was limited to the upper range of operating rotational speeds of the GTM120 miniature gas turbine. This was done in order to present data as transparently as possible regarding the unit’s load, where emulsion fuels have the greatest prospects for use. The validity of this thesis is proven by the system already developed by Siemens, which proposed the use of emulsion fuel for output powers exceeding 50% in order to reduce NOx emissions and to increase the achievable output power without exceeding emission standards [20].
When analyzing the data presented below, one should bear in mind the limited capacity of the fuel pump used during the experimental tests. This limitation affected the tests carried out at the planned rotational speed of 120 krpm and resulted in the inability to achieve the expected rotational speed, and this effect increased with the increase in the amount of water in the emulsion. This resulted in the fact that in the extreme case, with maximum flow of the fuel pump and the addition of 12% of water, 86.6% of the thrust was achieved in comparison with the base fuel test.

3.1. NOx Emissions

In the combustion process in turbojet engine combustors, among the nitrogen oxides produced (generally designated as NOx), nitrogen oxide NO is the most important. There are three basic mechanisms of nitrogen oxide formation: thermal (thermal NO), over-equilibrium (prompt) and fuel (fuel NO). Most NOx in the combustion process in gas turbines is produced according to the thermal mechanism. It involves the oxidation of molecular nitrogen by atomic oxygen. The condition enabling the formation of NO according to this mechanism is the dissociation of molecular oxygen at high temperature [54,55,56,57].
The use of a fuel–water emulsion leads to a reduction in the temperature behind the combustion chamber with a simultaneous reduction in NOx emissions in the exhaust gases (Figure 9). In the graph, the measuring points represent water contents of 0%, 3%, 6%, 9% and 12%. In the GTM120 miniature gas turbine, NOx concentration reduction with the smallest temperature reduction after the combustion chamber occurs at a shaft rotation speed of 100 krpm. Increasing the turbine load to the maximum significantly increases the possibility of NOx reduction but at the same time leads to the intensification of the temperature reduction process. It was also observed that as the turbine load increases, a lower water content is required to achieve a given NOx reduction level. Moreover, the NOx concentration reduction occurs intensively in all the cases presented when the temperature drop does not exceed 4%. After exceeding this value, the nature of changes in the reduction process becomes more complex, which suggests that the drop in this temperature cannot be directly linked to the drop in temperature in the primary combustion zone characterized by the highest temperatures, where most nitrogen oxides are produced according to the thermal mechanism.
Based on the above, the reasons for the intensive reduction of NOx emissions in exhaust gases should be sought in changes in the flame structure in the primary combustion zone. Computer numerical calculations prove that the addition of water to fuel, even in the smallest amounts, causes a more even temperature distribution in the primary combustion zone with a reduced volume of maximum temperatures. This translates into a reduction in the area where NOx is formed most intensively and an increase in the area where the intensity of NOx formation is lower (Figure 10). These changes in the flame structure contribute to a significant reduction in NOx with a relatively small reduction in the temperature behind the combustion chamber. Details regarding the experimental studies and numerical calculations have been presented in full detail in [40,41]. Also noteworthy is the fact that the effects shown in Figure 10 remain valid even when a simpler equilibrium model is used for the numerical calculations, which does not take into account the chemical imbalance resulting from aerodynamic flame stresses under turbulence [58].
When analyzing the combustion process of emulsion fuels, attention should be paid to the combustion of emulsions whose continuous phase consists of fuels containing significant amounts of nitrogen in their composition. In these cases, the use of a fuel–water emulsion as a way to reduce NOx emissions may have the opposite effect. This is proven by the previously mentioned study, in which the continuous phase of the emulsion was Redwood 650 [24]; the study is described in [31,59,60]. In the second case, the fuel constituting the continuous phase was JP-8, but the additive was the surfactant Clindrol 100CG, containing 4.37% nitrogen. Moreover, the fuel–water emulsions used contained up to 20% water and up to 20% emulsifier, which resulted in an increase in water content and increased NOx emissions for each simulated engine load.

3.2. CO Emissions

Tests of the GTM120 gas turbine showed a decrease in CO emissions due to the addition of water to the fuel (Figure 11). This effect was more intense the more the miniature gas turbine operated at a higher rotational speed. For a revolution of 100 krpm and 12% water addition, a 10% emission reduction was achieved compared with the case in which the turbine was powered by the reference fuel, while at a revolution of 120 krpm and the same water addition, emissions were reduced by over 15%. Considering that the use of fuel–water emulsion reduces the temperature at the outlet of the combustion chamber and reduces NOx emissions (Figure 9), reducing CO emissions is unintuitive.
The possibility of oxidizing CO to CO2 strongly depends on the temperature and the residence time of the molecule in the high-temperature region. High temperature and the longest possible stay of the particle in its area favor this process. In areas where the temperature exceeds 1270 K, CO oxidation dominates according to reaction (1), and at lower temperatures, reaction (2) plays the main role [56,57]:
C O + O H C O 2 + H ,
C O + H 2 O C O 2 + H 2
Therefore, increasing the area in the high-temperature combustion chamber at the expense of reducing the areas with maximum temperatures does not necessarily result in a deterioration of the oxidation process of CO to CO2. Numerical calculations of the flow with emulsion combustion through the GTM120 gas turbine showed just such an effect (Figure 12). A reduction in the areas of maximum temperature is observed, combined with an expansion and uniformity of the area of relatively high temperatures. In Figure 12, the arrow indicates the direction of the most intense expansion of the reaction area resulting from the addition of 12% water to the fuel mixture. Moreover, two vertical lines mark the area in the central zone of the combustion chamber, where, when comparing two cases, it is easy to see the extension of the high-temperature area of the primary combustion zone and the reduction in the lower-temperature areas.
The factor that hinders the oxidation of CO is the contact of CO molecules with the cooled engine walls. If a CO particle is placed in the area affected by the cold wall, further oxidation processes will be frozen due to the reduced enthalpy of the medium [61]. In the case where the GTM120 turbine is fed with a fuel–water emulsion, there is a tendency to increase the average temperature of the combustion chamber walls with an increase in the share of water in the fuel. However, it was increased by a maximum of 11K, which means that this factor was not likely to be decisive in the recorded CO emissions. The numerical calculations leading to this conclusion are described in [41].
Based on the research results presented so far in the literature, it is difficult to formulate a clear hypothesis regarding the reasons for the discrepancies occurring in research on the impact of fueling a gas turbine with a fuel–water emulsion. In six of the fourteen groups of studies described in the literature so far, an increase in CO emissions was noted after adding water to the fuel, in five, there were no significant changes, and in three, changing the fuel mixture resulted in a decrease in emissions (Figure 13). In Figure 13, the grouping of studies is taken from [4], while the year corresponds to the date of the earliest publication in a given group. It includes research conducted on gas turbines and combustion chamber test stands. Research conducted on gas turbines is additionally marked with an arrow and the name of the unit. Since 1989, research on the 9000B turbine has been dominated by observations showing no negative impact of the fuel–water emulsion on CO emissions, but despite this, it is difficult to find a common denominator in these studies that translates into such results. It is worth emphasizing that in none of the analyzed studies was the entire combustion chamber designed to be optimized in order to maximize the combustion efficiency of the emulsion fuel. Therefore, the vast majority of experiments concerned determining the impact of water addition on the operation of units in a configuration adapted to the combustion of the base fuel. Taking into account the research conducted on the GTM120 gas turbine [40,41] and the experimental research conducted on the combustion chamber test stand where the flame was observed through optical windows [62], as a result of which significant changes in the distribution of the reaction zone in the combustion chamber were found, it can be concluded that similar situations could also occur in other cases. However, considering that the combustion chambers were not adapted to this type of change, it can be concluded that their impact on CO emissions was largely accidental, and that the use of emulsion fuel does not have to worsen CO emissions, as long as the design of the combustion chamber does not result in the reaction zone being in an unfavorable position from the point of view of CO emissions. As the size of the turbine (combustion chamber) increases, it can be expected that this effect (improving the uniformity of temperature distribution) will have less and less impact on changes in CO emissions due to a more effective mixing process and, therefore, a more uniform combustion process.

3.3. Fuel Consumption

The effect of adding water to the fuel on thrust-specific fuel consumption (TFSC), where the total mass of the emulsion mixture is understood as fuel, is negative (Figure 14). Figure 14 shows that for rotational speeds of 100 krpm and 120 krpm, the increase in TFSC with increasing water content in the mixture is more intense than for a rotational speed of 80 krpm. For these two rotational speeds and 12% water addition, the increase in TFSC is approximately 15%. For a rotational speed of 80 krpm, the increase in TFSC is approximately 8.8%.
The addition of water to the fuel reduces the consumption of the base fuel (without water and emulsifier) contained in the emulsion (Figure 15). For a rotational speed of 80 krpm and 12% water addition, a reduction in the consumption of the base fuel by ~5.5% was recorded, which was approximately linear as a function of water content. However, for a rotational speed of 100 krpm, a clear minimum was recorded for 6% water addition. At this point, the fuel consumption reduction was 2.45%. For a similar addition of water at 80 krpm, the reduction in the consumption of the base fuel was approximately 2.94%. After increasing the water content in the emulsion above 6%, for 100 krpm, the downward trend was reversed, which resulted in a reduction in the consumption of the base fuel with 12% water addition by only about 0.6%. Values recorded at a rotational speed of 120 krpm have been omitted from the graph for the reasons presented in the introduction to this section.

3.4. The Influence of the Presence of an Emulsifier

3.4.1. Combustion Process

The research conducted on the effect of adding a surfactant to the base fuel on NOx emissions shows that with increasing amounts of emulsifier, NOx emissions decrease (Figure 16). Due to the nature of the data obtained from individual experimental trials, a statistical analysis of the results was performed. For this purpose, the Student’s t-test was used, and it was checked whether the mean results obtained after adding the emulsifier came from the same population as the means obtained in the reference test. The significance level of p = 0.05 was adopted in the analysis. As a result of this analysisit is concluded that statistically significant differences occur only between the case in which the turbine was fed with standard fuel and fuel with the addition of a 5% emulsifier. Details regarding the entire study and the statistical analysis are described in detail in [42].
Analogously to the NOx emission results, research was carried out on the impact of changes in CO emissions resulting from the addition of a surfactant to the base fuel (Figure 17). In this case, it was shown that statistically significant differences in the results occurred only between the cases in which the gas turbine operated at a rotational speed of 80 krpm and 120 krpm and in which it was fed with base fuel and fuel with a 2% addition of surfactant. The mixture with 2% emulsifier added was characterized by increased CO emissions.
There was no effect of the addition of 2% surfactant on the thrust generated by the GTM120 gas turbine, on fuel consumption or on the temperature behind the combustion chamber. However, in the case of 5% emulsifier addition, a statistically significant slight decrease in the temperature behind the combustion chamber was noted for a rotational speed of 120 krpm.
It should be noted that the 2% addition of a surfactant, which was also used in studies on fuel–water emulsion combustion (although when it is directly added to the fuel, it increases CO emissions), does not have a decisive impact on CO emissions during emulsion combustion. During the tests, it was found that the addition of the lowest percentage of water to the fuel showed a dominant tendency to reduce CO emissions (Figure 11), despite the simultaneous addition of 2% emulsifier to the fuel. This proves that when the amount of emulsifier is 2% in the emulsion, the addition of water has a decisive impact on emissions and engine operating parameters.

3.4.2. Deposits in the Engine

As a result of the combustion process of fuel–water emulsion enriched with surfactant in engines, two types of deposits were identified. The first of them is a deposit resembling varnish, while the second type of deposit is accretions resembling white chalk dust [31,32]. In both cases, the formation of deposits was attributed to the emulsifier. In order to verify these hypotheses, an inspection of the GTM120 gas turbine was carried out after tests in which an emulsifier was added to the base fuel, and a visual observation of the unit was carried out during tests in which it was fed with a fuel–water emulsion.
After a series of tests in which fuel with the addition of a surfactant in an amount of up to 5% of the mixture mass was burned, numerous, clearly visible, mostly glassy green deposits were recorded. They were visible, among others, on the outside of the lower part of the engine exhaust nozzle (Figure 18). The most likely reason for their occurrence in this place was that excess fuel had accumulated in this area during a failed start of the unit. Apart from the outlet nozzle, similar deposits formed on the turbine blades and its guide as well as on the walls of the combustion chamber and evaporators. Their formation should be attributed entirely to the presence of a surfactant because in the test series in which they were created, water was not used as a fuel additive. No deposits resembling chalk dust or other deposits were recorded. More extensive photographic documentation of the mentioned sediments can be found in [63].
Chalk-dust-like deposits were observed on turbine blades and turbine guides after a series of tests in which a fuel–water emulsion was burned. There is no photographic documentation of these elements with the characteristic white deposit.
Based on the above, it is hypothesized that the surfactant is responsible for the glassy “varnish-type” deposits, while the characteristic white deposits resembling chalk dust are caused by the presence of water. Perhaps they are created through the synergistic interaction of water and an emulsifier, but without the presence of water, they are not produced.

4. Conclusions

The manuscript presents the results of experimental and numerical studies on the combustion of a fuel–water emulsion with a water content of up to 12% with the addition of a 2% active agent in a miniature gas turbine. The influence of the addition of an emulsifier in an amount of up to 5% on the combustion process and emissions from the gas turbine was also examined. The possibility of an emulsion fuel creating deposits on engine components was also discussed.
Based on the presented results of experimental and numerical tests, their analysis and literature studies, the following main conclusions regarding the combustion of fuel–water emulsions in gas turbines are made:
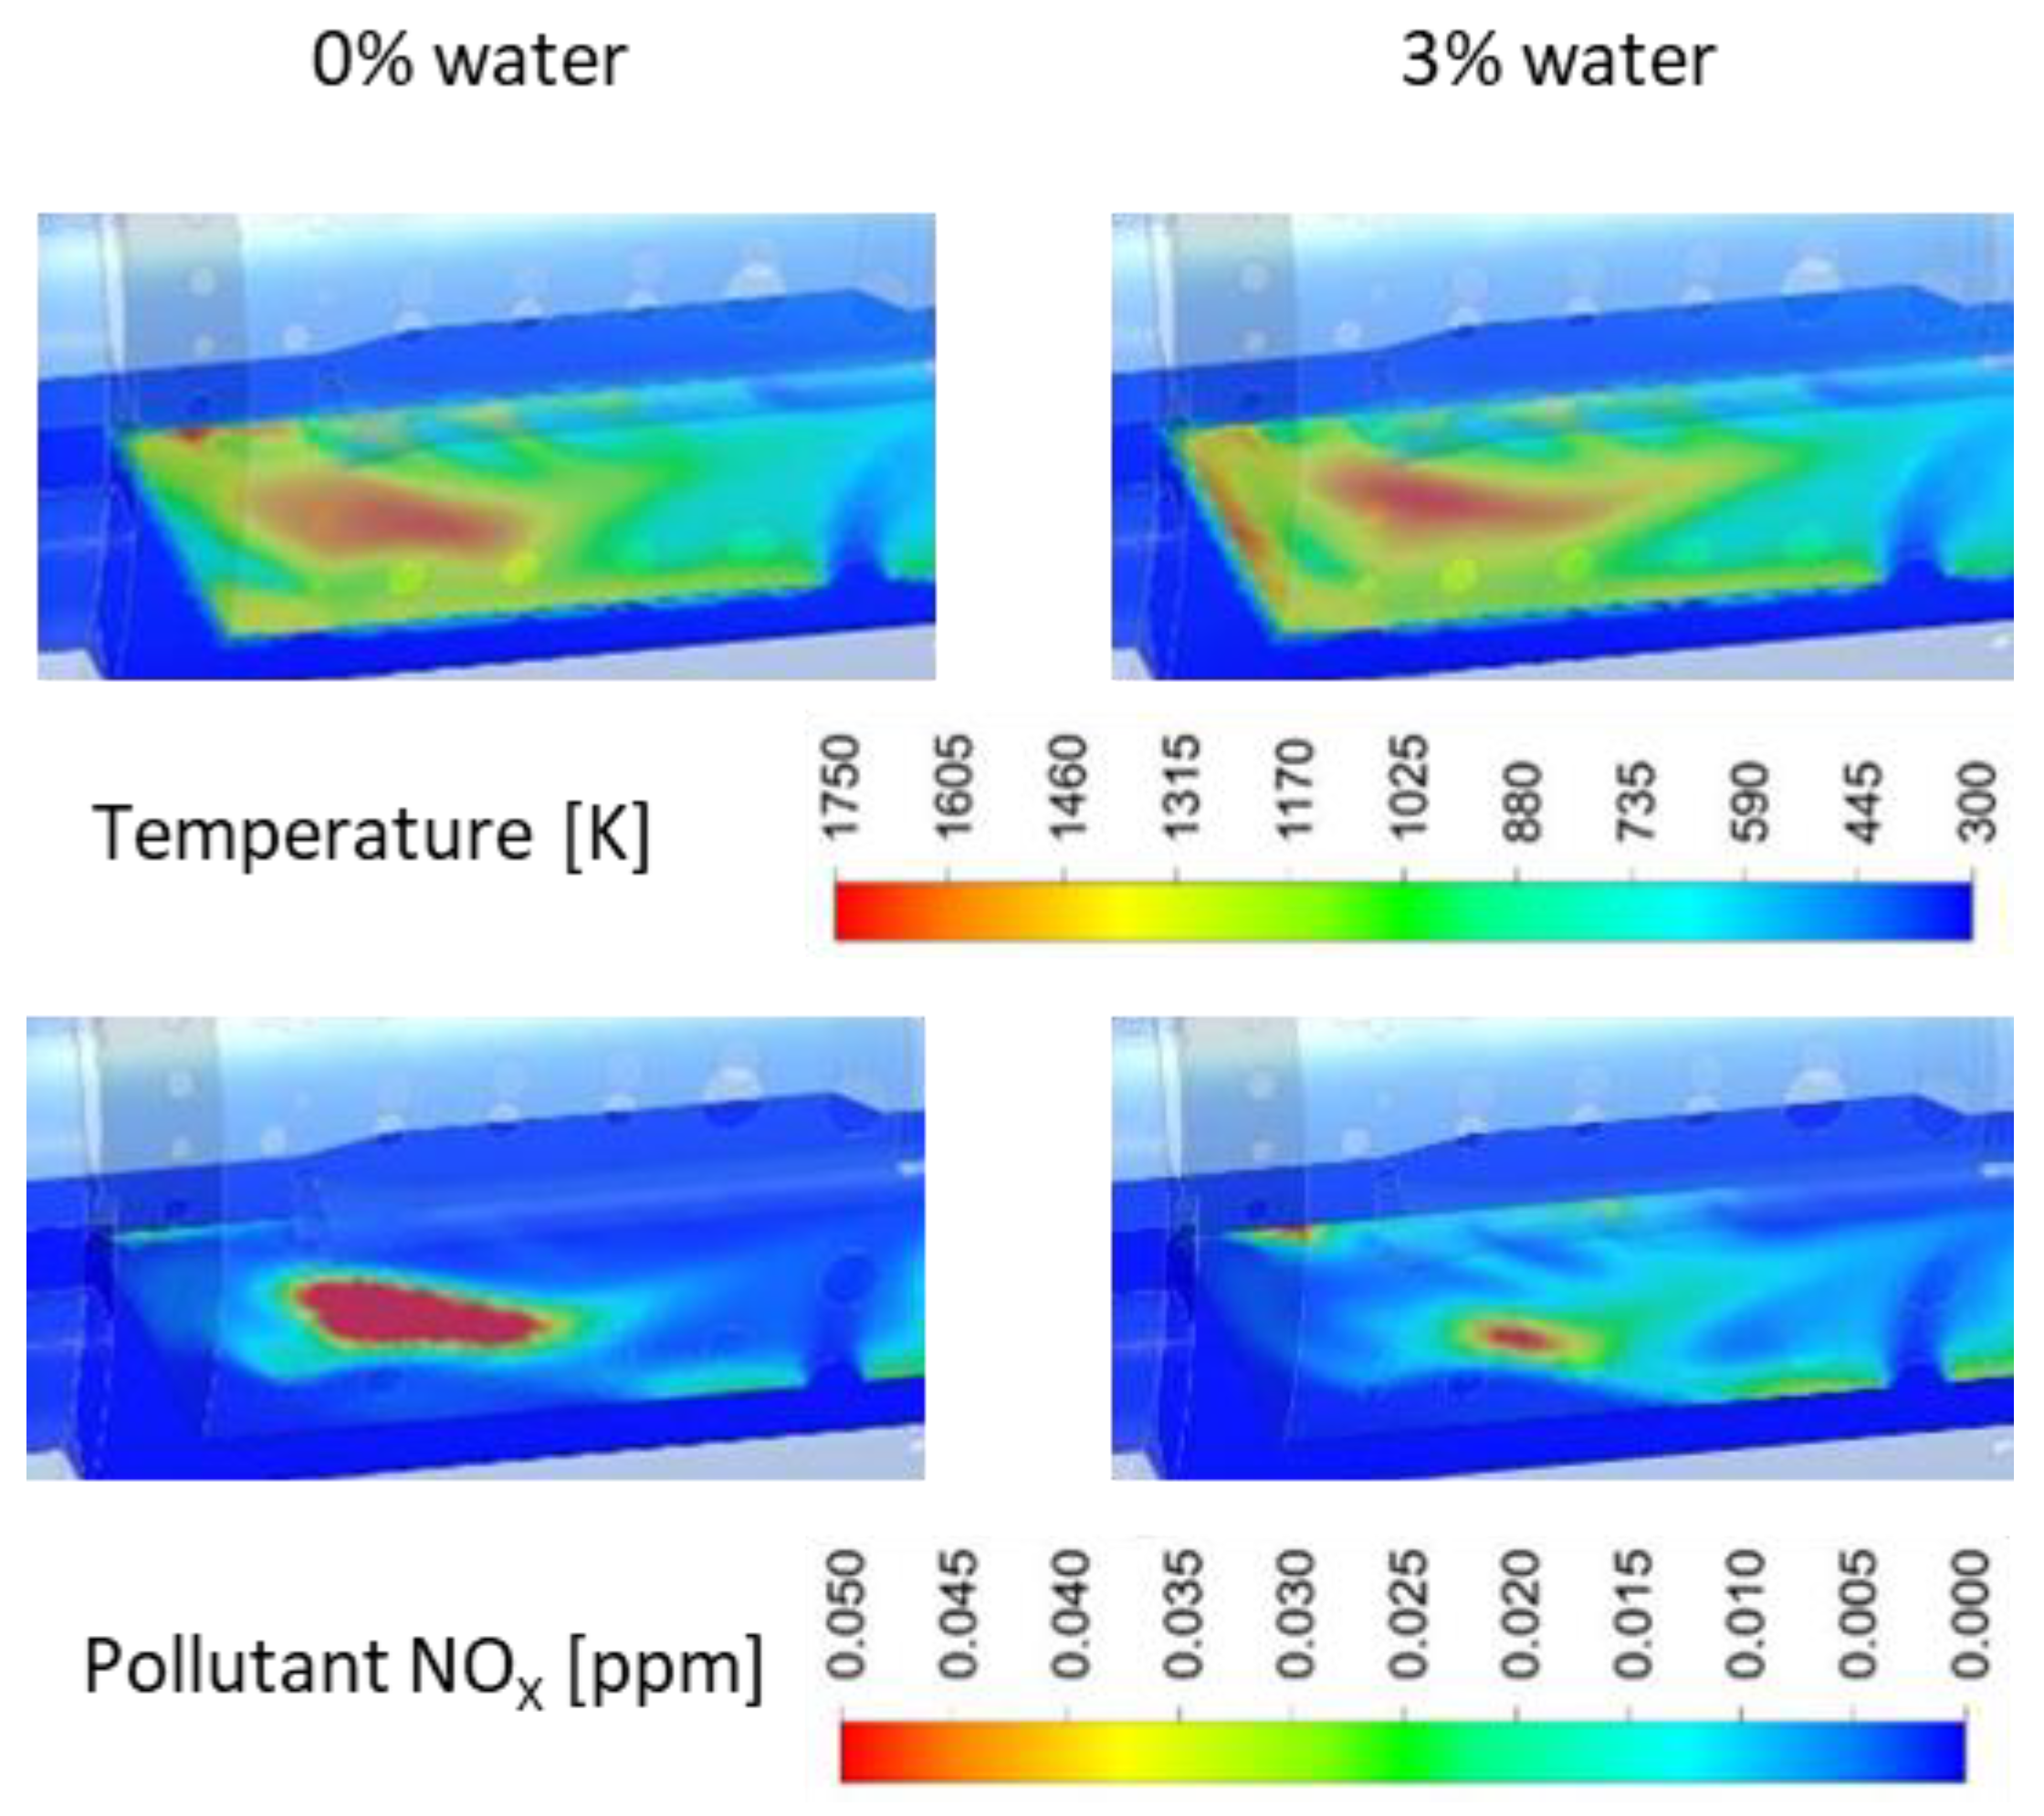
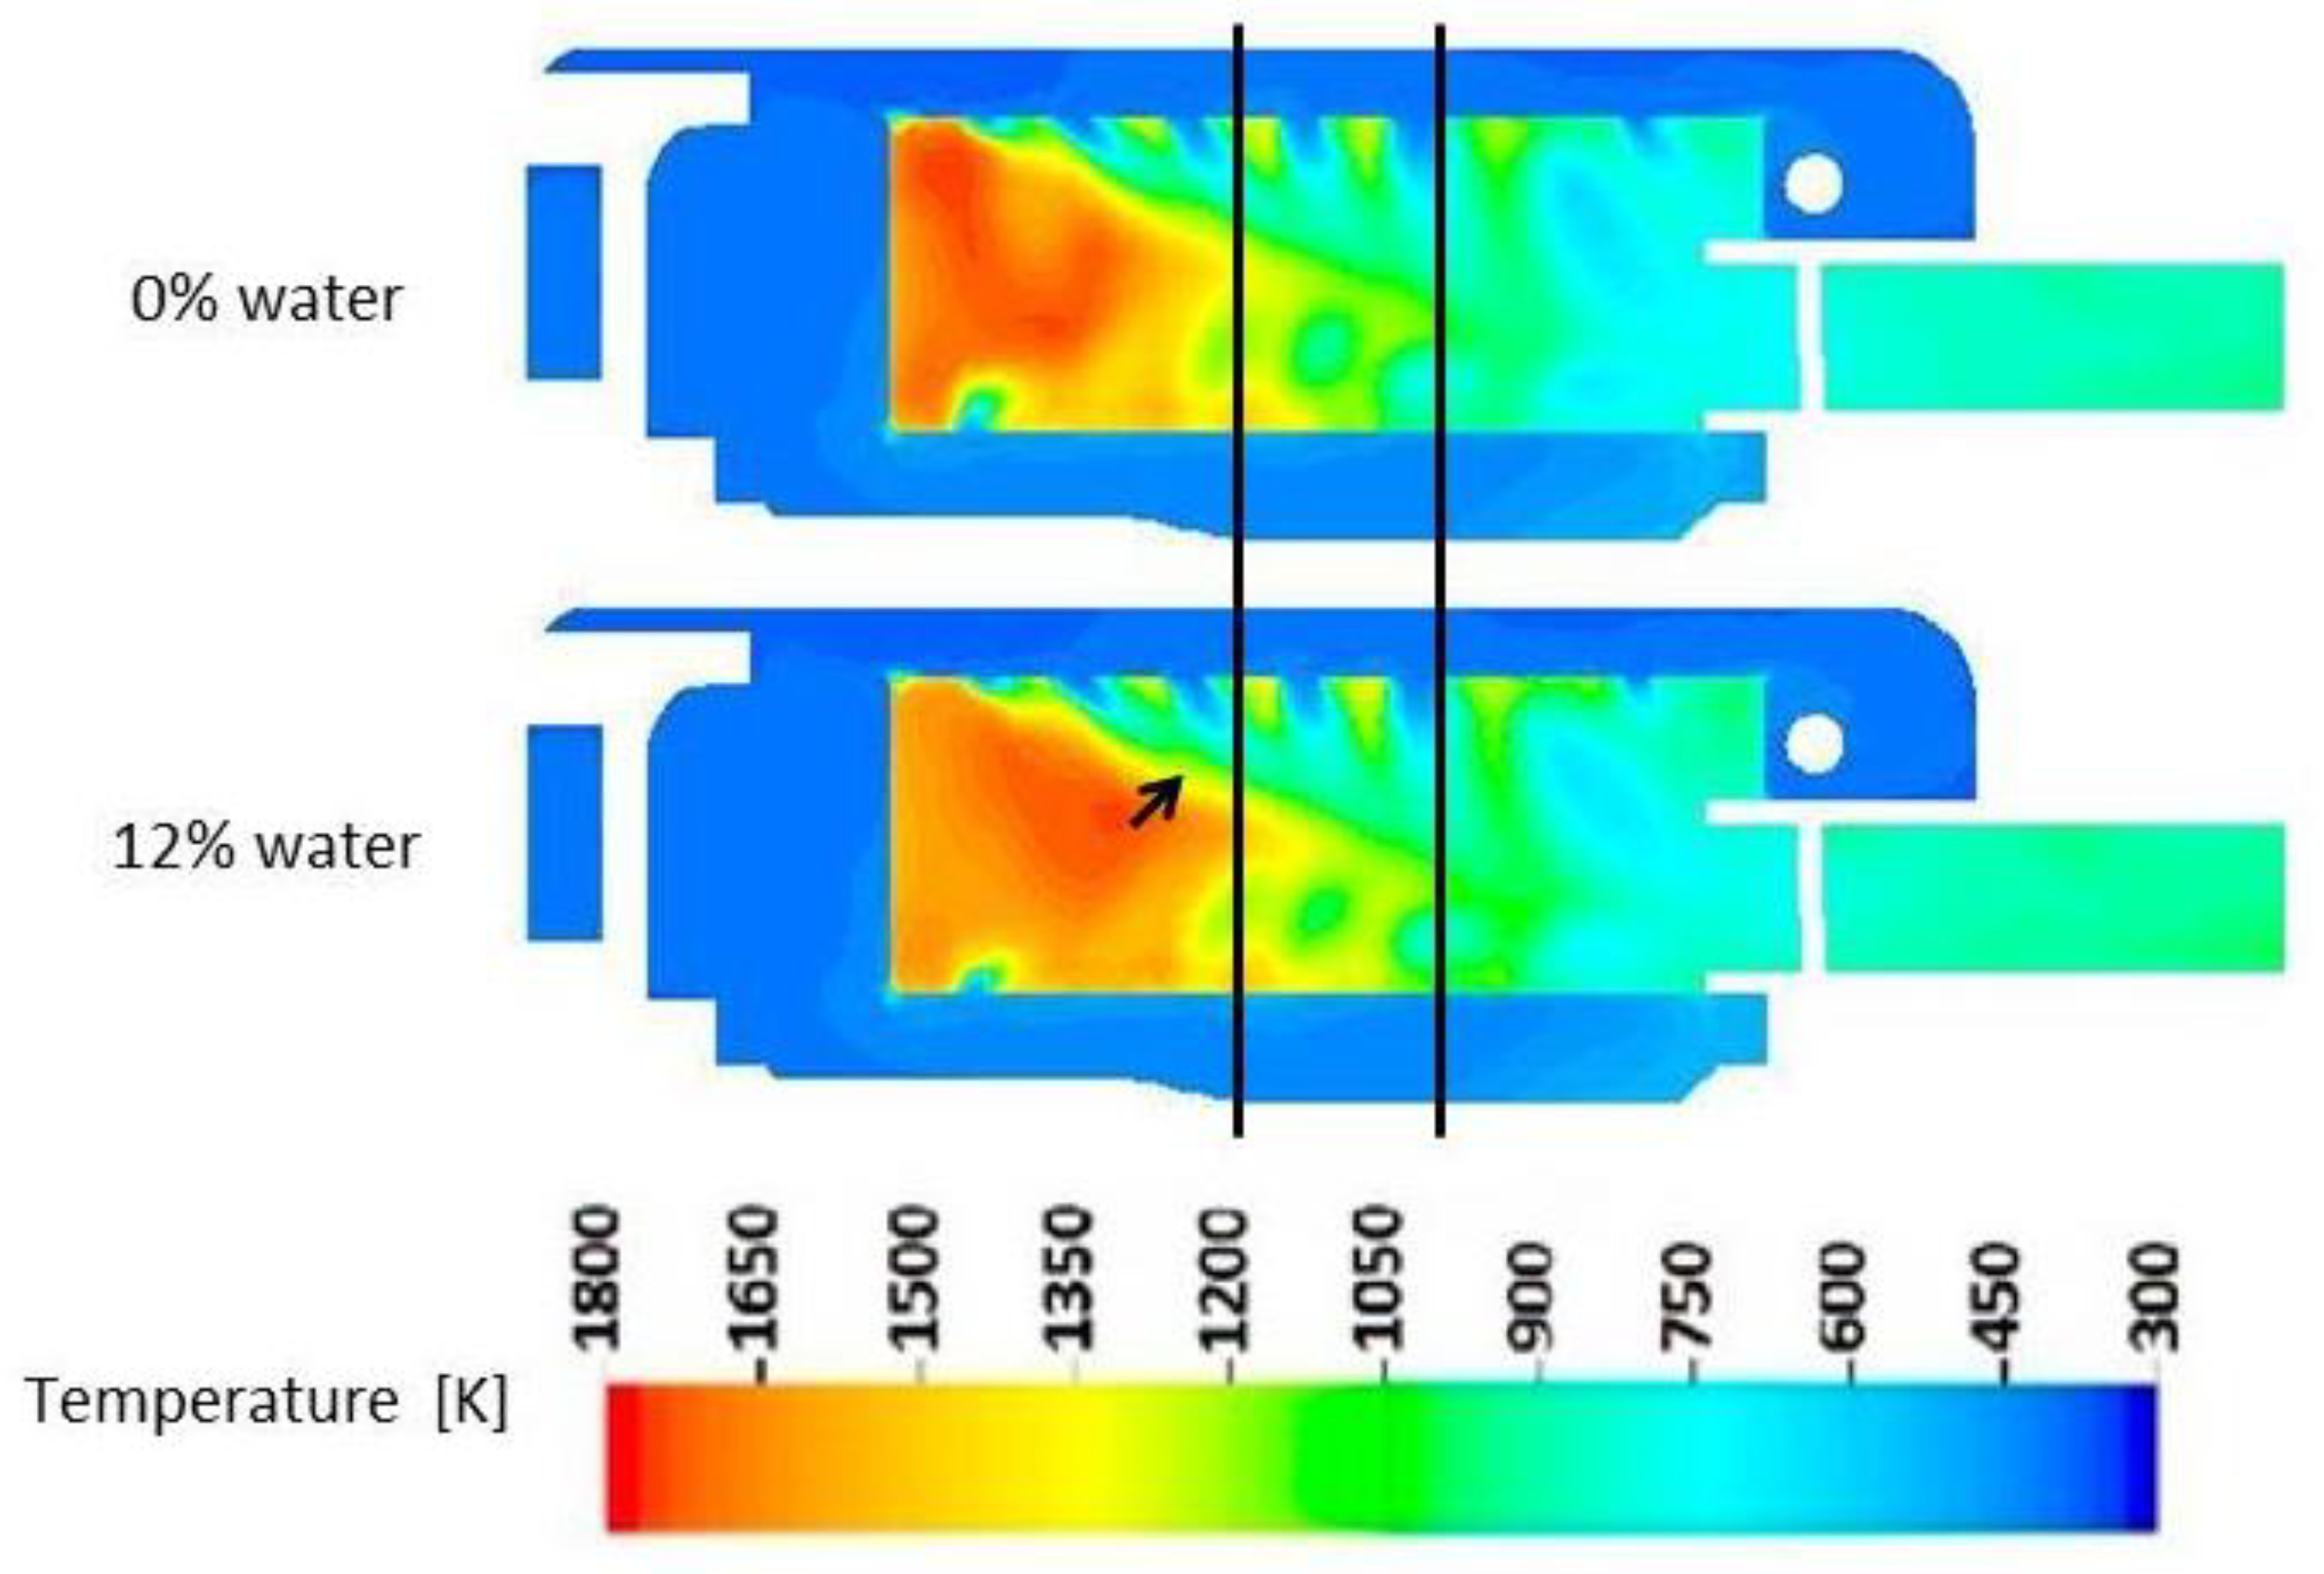
  • The use of a fuel–water emulsion leads to the reduction of NOx emissions in miniature gas turbines and full-size turbines. It occurs as a result of the extinction of hot spots in the primary combustion zone, where NO is produced intensively according to the thermal mechanism. However, it should be borne in mind that the nitrogen contained in the fuel in the case of emulsion fuel counteracts the reduction in NOx emissions, and that this effect is more intense the more water there is in the emulsion.
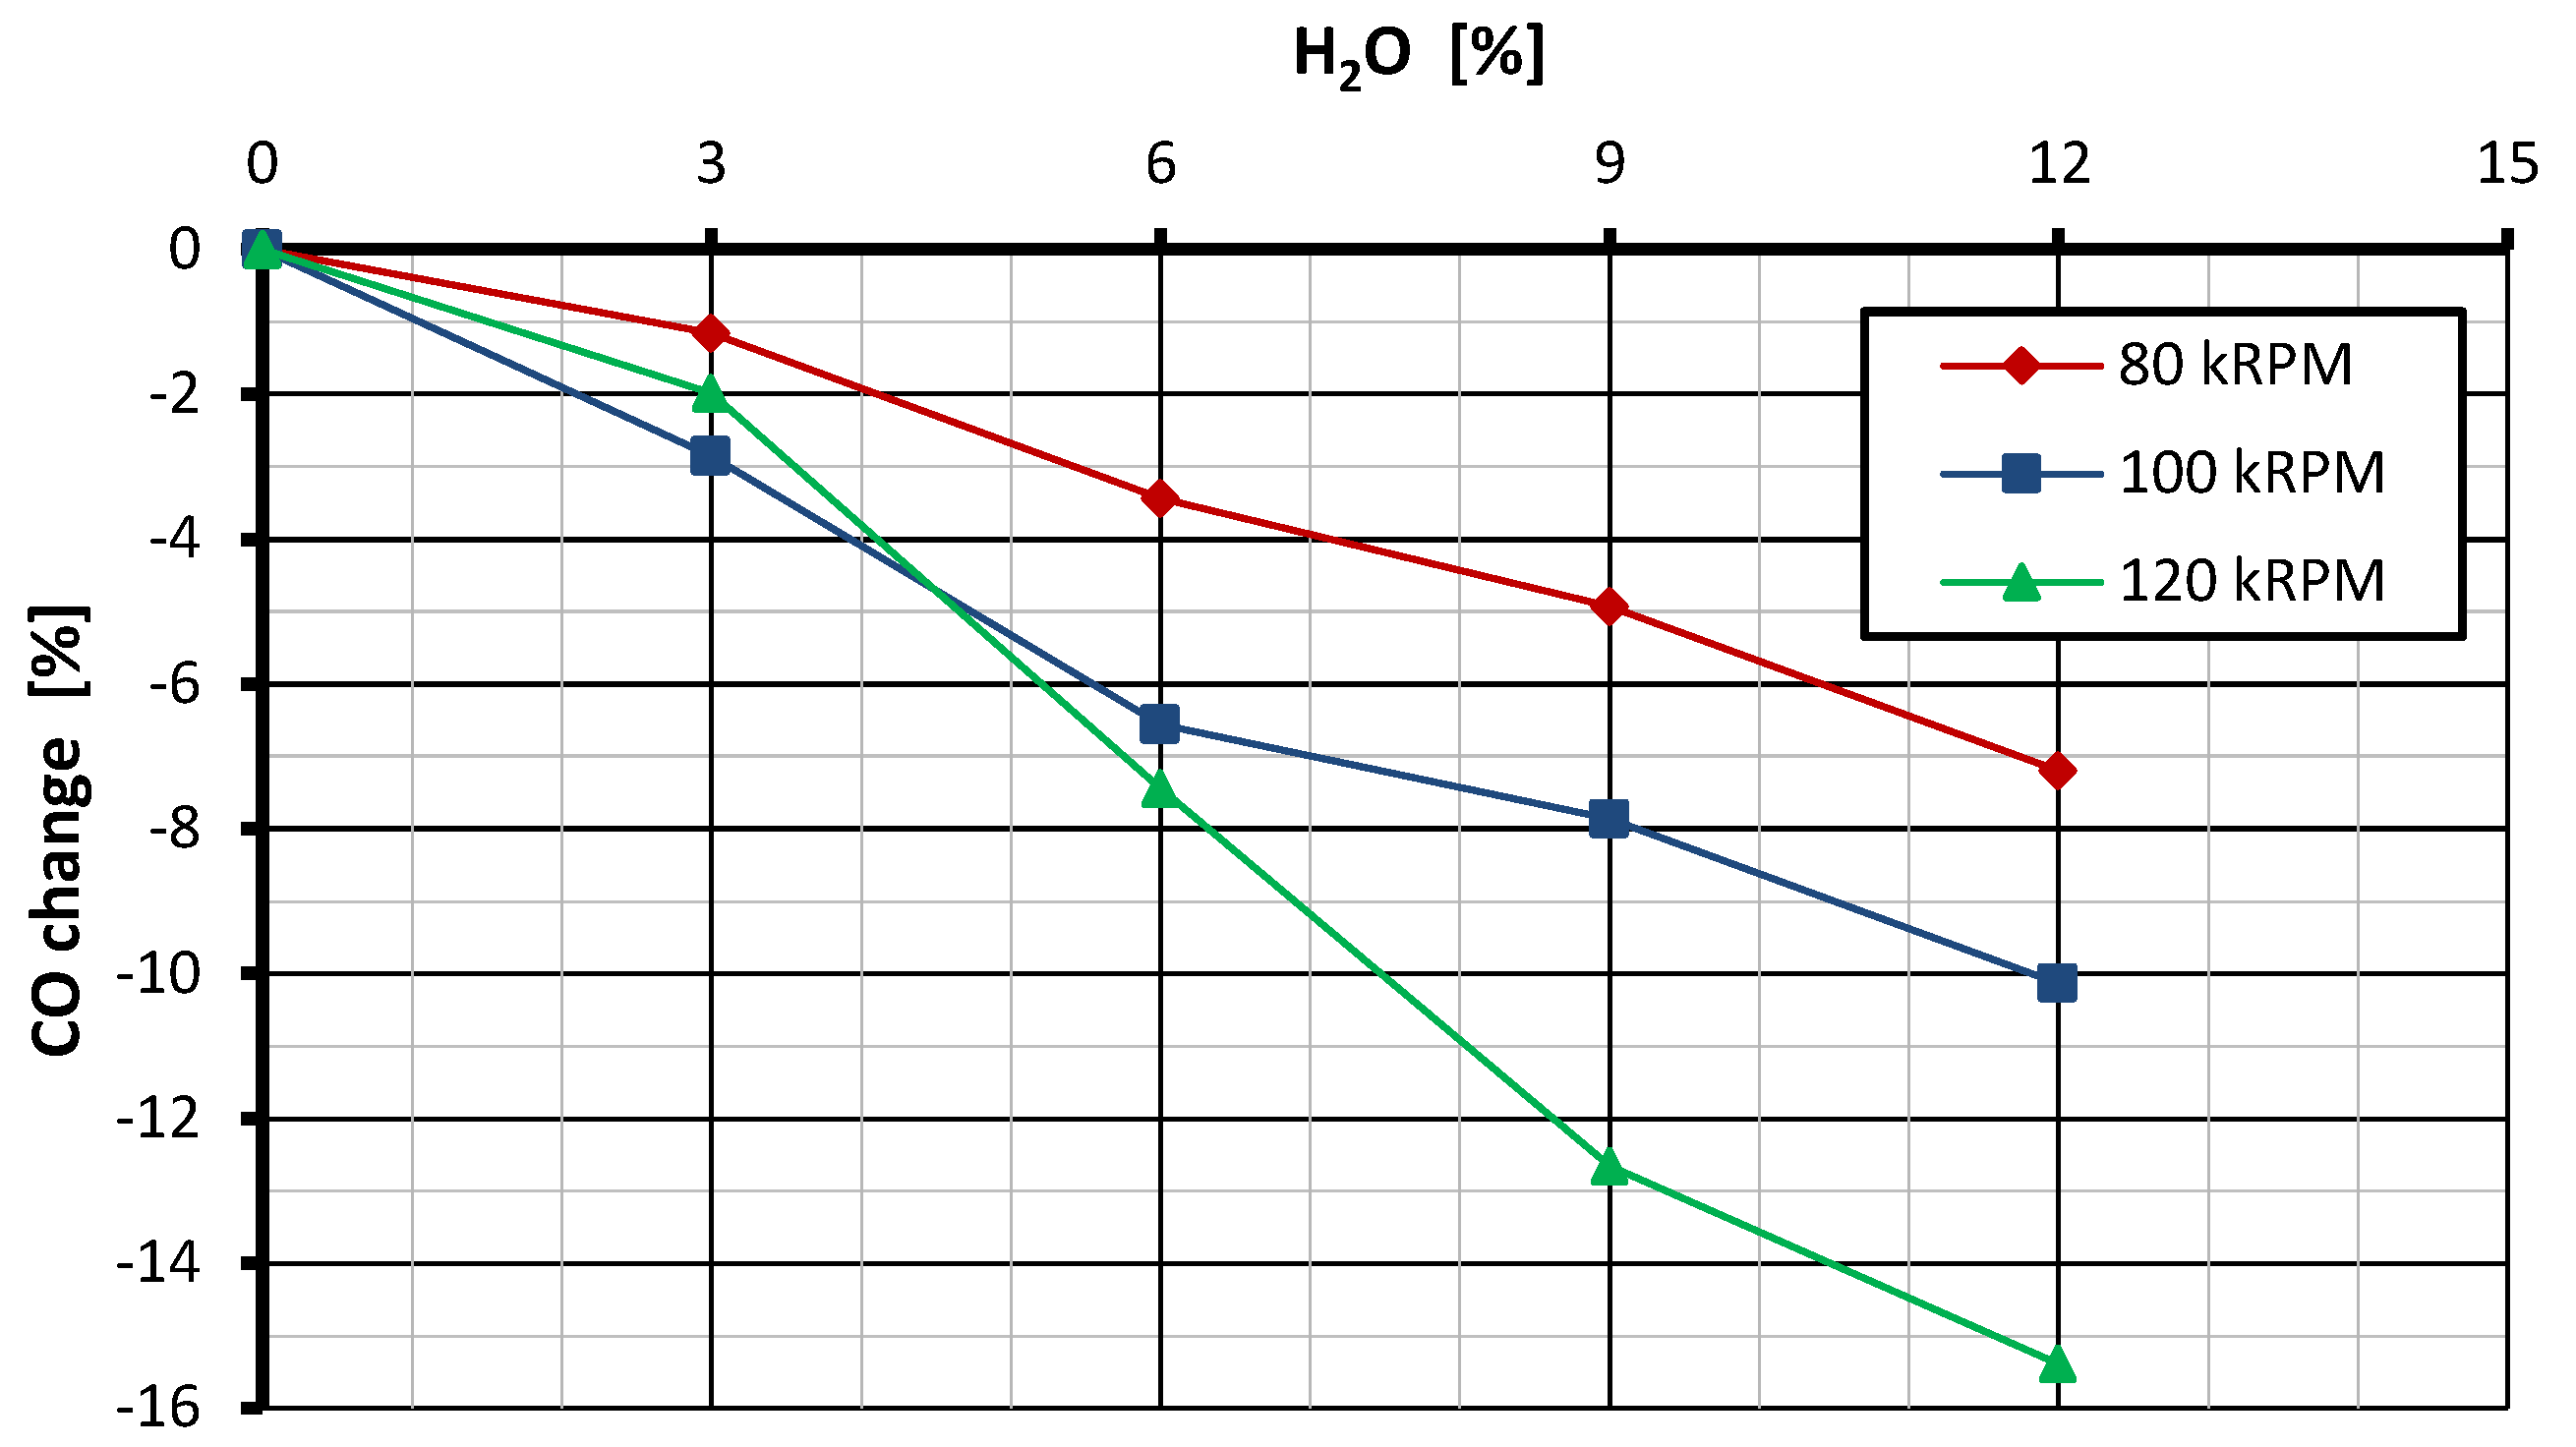
  • Adding water to fuel in miniature gas turbines can lead to a reduction in CO emissions. This effect is caused by changes in the distribution of reaction intensity in the combustion zone, which promote the further oxidation of CO.
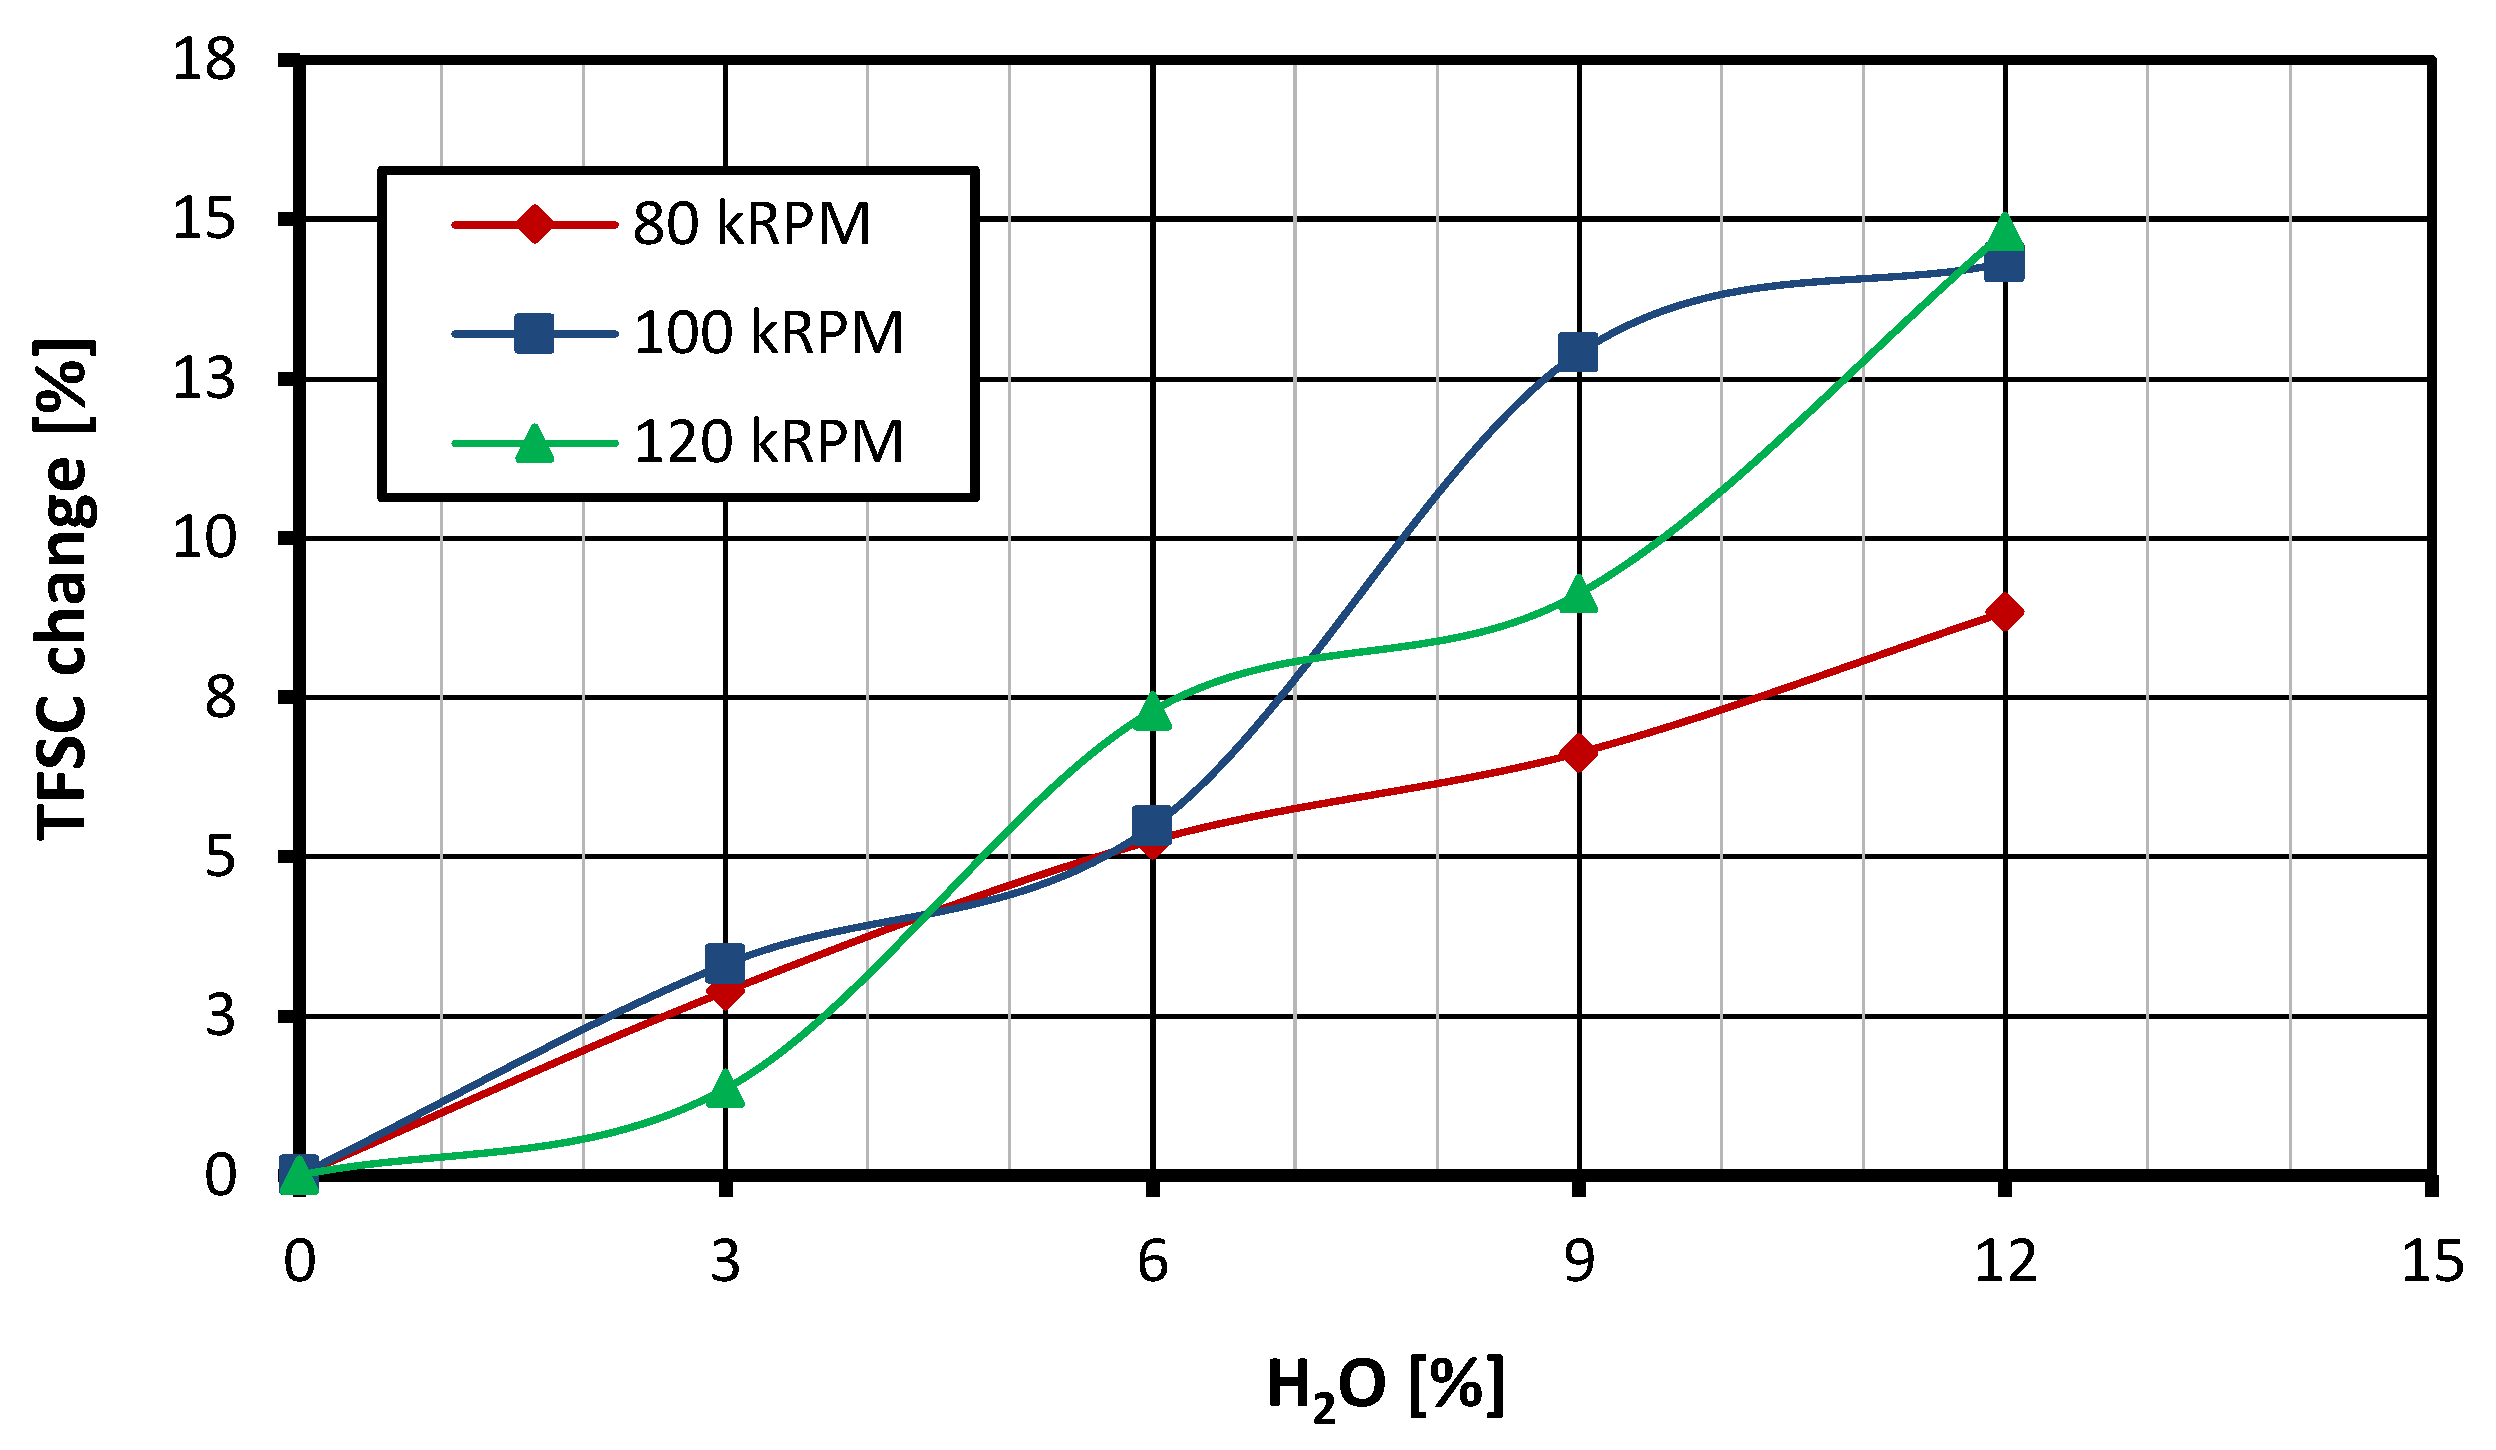
  • When feeding the turbine with a fuel–water emulsion, the total flow rate of the fuel mixture applied to the combustion chamber increases compared with the case in which the turbine operates at the same speed and is fed with standard fuel. However, the consumption of base fuel (after subtracting the mass of water and emulsifier) is reduced in the GTM120 miniature gas turbine. For a rotational speed of 80 krpm and an emulsion containing 12% water, a reduction of 5.46% in the consumption of base fuel was recorded.
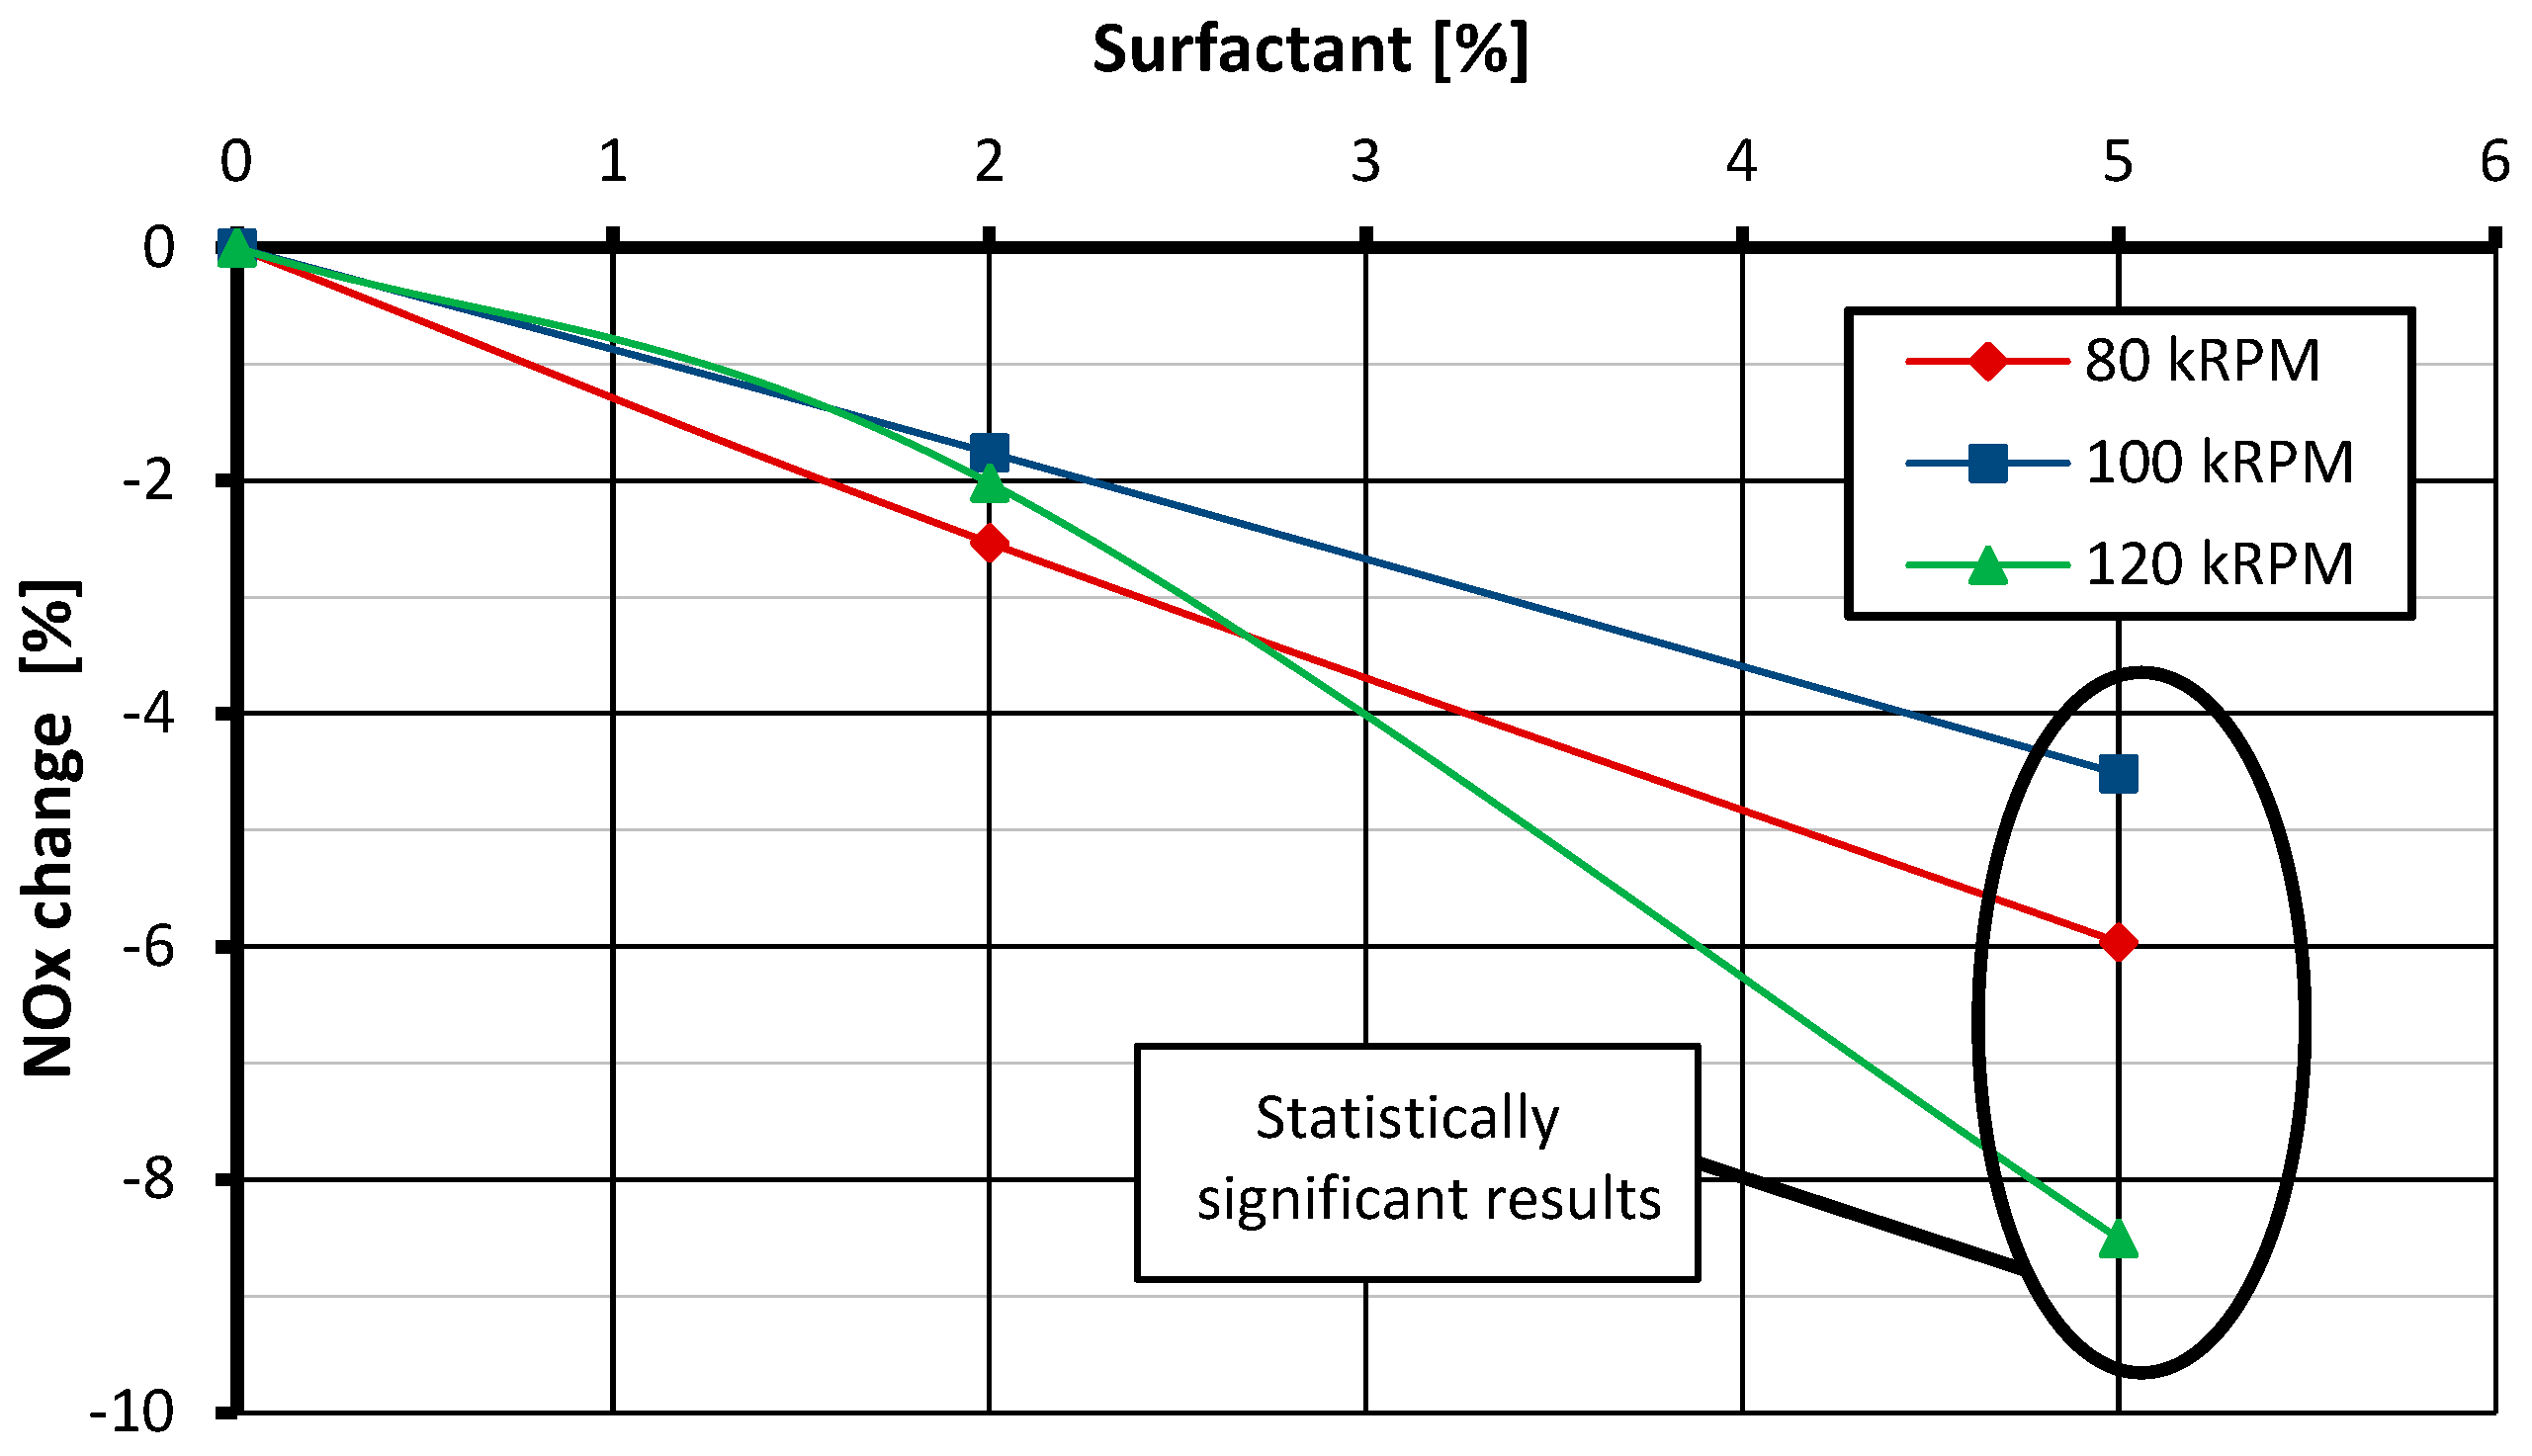
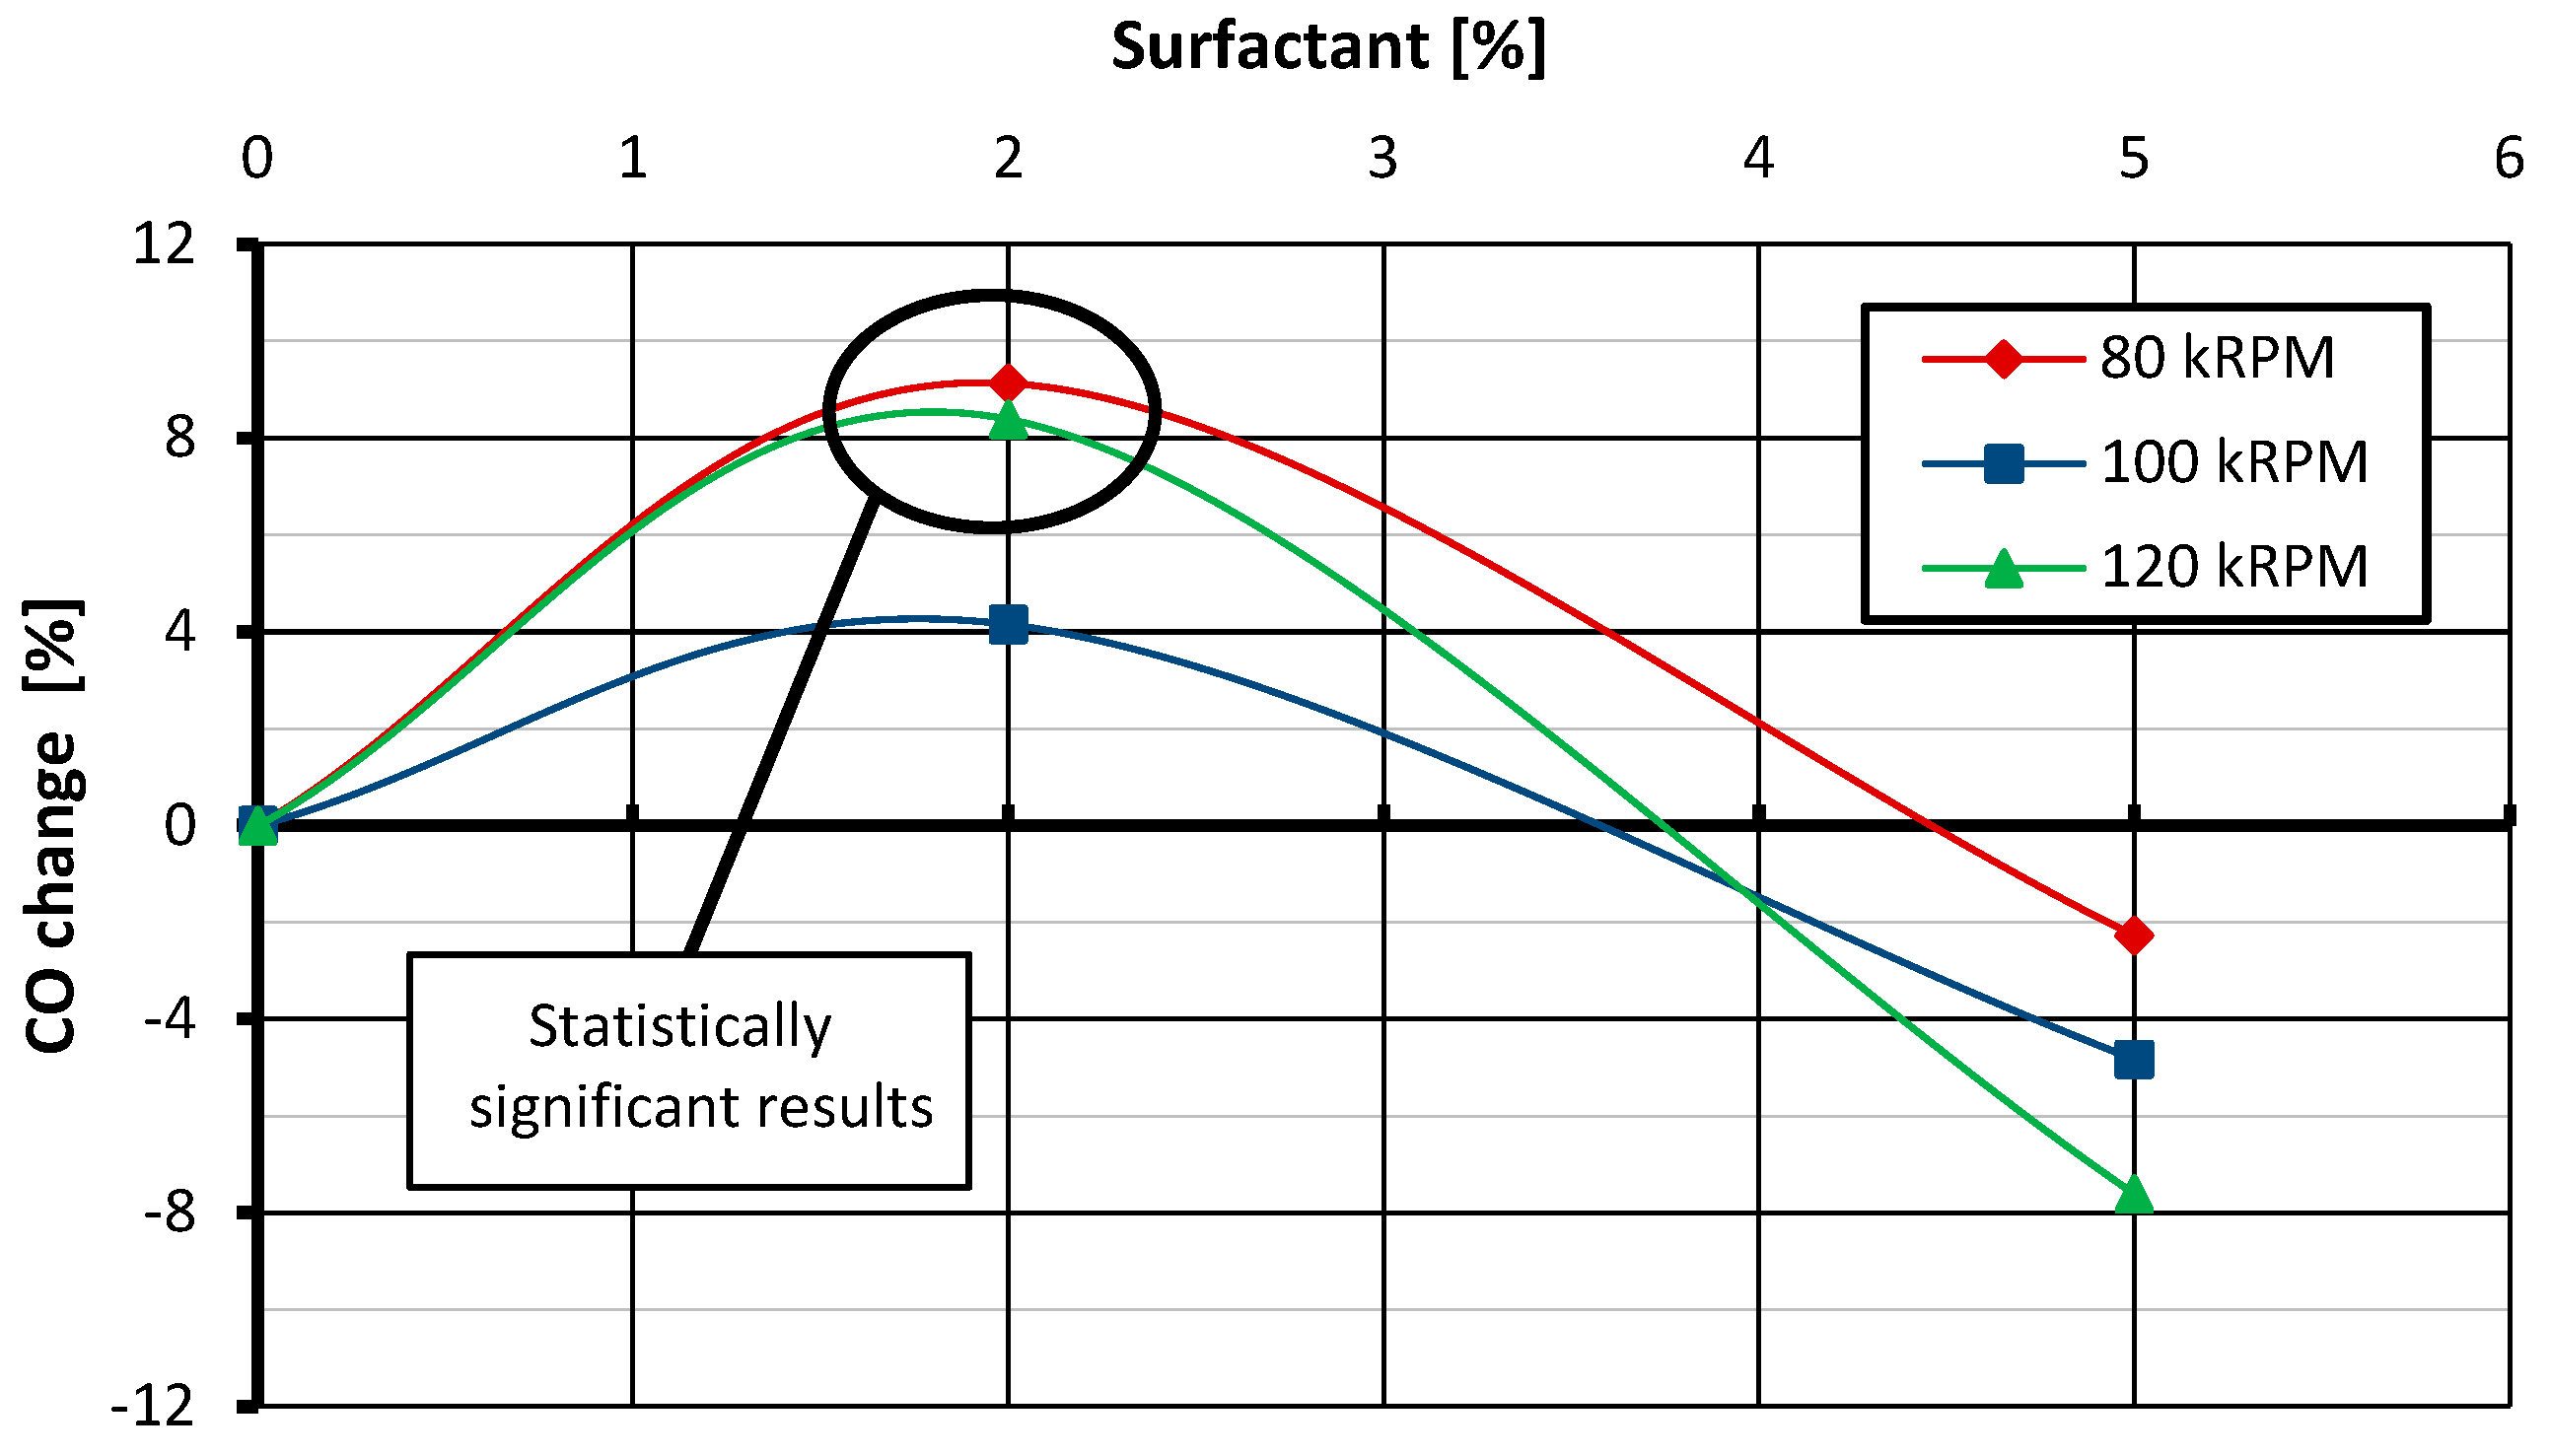
  • The surfactant used in the tests, added to the fuel in an amount of 2% of the mixture mass, does not affect NOx emissions but has a negative impact on CO emissions. Increasing its content to 5% reduces NOx emissions compared with the emissions recorded for the reference case and has no impact on CO emissions. Moreover, the addition of emulsifiers in the amount of both 2% and 5% does not have a statistically significant effect on the thrust-specific fuel consumption.
  • The use of emulsion fuel may lead to the formation of deposits on the elements of the hot section of the gas turbine. The glassy greenish coatings should be attributed to the surfactant, while the deposits in the form of white dust should be attributed to the water present in the emulsion or the synergistic effect of water and the surfactant.

Author Contributions

Conceptualization, P.N. and M.G.; methodology, P.N. and M.G.; validation, P.N.; formal analysis, P.N. and M.G.; investigation, P.N.; resources, M.G.; data curation, P.N.; writing—original draft preparation, P.N.; writing—review and editing, M.G.; visualization, P.N.; supervision, M.G.; project administration, P.N. and M.G.; funding acquisition, M.G. All authors have read and agreed to the published version of the manuscript.

Funding

This research received no external funding.

Institutional Review Board Statement

Not applicable.

Informed Consent Statement

Not applicable.

Data Availability Statement

No new data were created or analyzed in this study. Data sharing is not applicable to this article.

Conflicts of Interest

The authors declare no conflicts of interest.

References

  1. Encyclopedia Britannica. Available online: https://www.britannica.com/science/emulsion-chemistry (accessed on 26 April 2024).
  2. Yahaya Khan, M.; Abdul Karim, Z.A.; Hagos, F.Y.; Aziz, A.R.A.; Tan, I.M. Current Trends in Water-in-Diesel Emulsion as a Fuel. Sci. World J. 2014, 2014, 527472. [Google Scholar] [CrossRef] [PubMed]
  3. Lin, C.Y.; Wang, K.H. The fuel properties of three-phase emulsions as an alternative fuel for diesel engines. Fuel 2003, 82, 1367–1375. [Google Scholar] [CrossRef]
  4. Niszczota, P.; Chmielewski, M.; Gieras, M. Fuel-Water Emulsion as an Alternative Fuel for Gas Turbines in the Context of Combustion Process Properties—A Review. Energies 2022, 15, 8979. [Google Scholar] [CrossRef]
  5. Chen, G.; Tao, D. An experimental study of stability of oil–water emulsion. Fuel Process. Technol. 2005, 86, 499–508. [Google Scholar] [CrossRef]
  6. Lin, C.Y.; Chen, L.W. Comparison of fuel properties and emission characteristics of two-and three-phase emulsions prepared by ultrasonically vibrating and mechanically homogenizing emulsification methods. Fuel 2008, 87, 2154–2161. [Google Scholar] [CrossRef]
  7. Mondal, P.K.; Mandal, B.K. Experimental investigation on the combustion, performance and emission characteristics of a diesel engine using water emulsified diesel prepared by ultrasonication. J. Braz. Soc. Mech. Sci. Eng. 2018, 40, 510. [Google Scholar] [CrossRef]
  8. Rao, D.C.K.; Karmakar, S.; Som, S.K. Puffing and micro-explosion behavior in combustion of butanol/Jet A-1 and acetone-butanolethanol (ABE)/Jet A-1 fuel droplets. Combust. Sci. Technol. 2017, 189, 1796–1812. [Google Scholar] [CrossRef]
  9. Kadota, T.; Yamasaki, H. Recent advances in the combustion of water fuel emulsion. Prog. Energy Combust. Sci. 2002, 28, 385–404. [Google Scholar] [CrossRef]
  10. Jeong, I.; Lee, K.H.; Kim, J. Characteristics of auto-ignition and micro-explosion behavior of a single droplet of water-in-fuel. J. Mech. Sci. Technol. 2008, 22, 148–156. [Google Scholar] [CrossRef]
  11. Gan, Y.; Qiao, L. Combustion characteristics of fuel droplets with addition of nano and micron-sized aluminum particles. Combust. Flame 2011, 158, 354–368. [Google Scholar] [CrossRef]
  12. Kim, H.; Baek, S.W. Combustion of a single emulsion fuel droplet in a rapid compression machine. Energy 2016, 106, 422–430. [Google Scholar] [CrossRef]
  13. Califano, V.; Calabria, R.; Massoli, P. Experimental evaluation of the effect of emulsion stability on micro-explosion phenomena for water-in-oil emulsions. Fuel 2014, 117, 87–94. [Google Scholar] [CrossRef]
  14. Moussa, O.; Tarlet, D.; Massoli, P.; Bellettre, J. Investigation on the conditions leading to the micro-explosion of emulsified fuel droplet using two colors LIF method. Exp. Therm. Fluid Sci. 2020, 116, 110106. [Google Scholar] [CrossRef]
  15. Antonov, D.V.; Fedorenko, R.M.; Yanovskiy, L.S.; Strizhak, P.A. Physical and Mathematical Models of Micro-Explosions: Achievements and Directions of Improvement. Energies 2023, 16, 6034. [Google Scholar] [CrossRef]
  16. Fu, W.B.; Hou, L.Y.; Wang, L.; Ma, F.H. A unified model for the micro-explosion of emulsified droplets of oil and water. Fuel Process. Technol. 2002, 79, 107–119. [Google Scholar] [CrossRef]
  17. Le Clercq, P.; Noll, B.; Aigner, M. Modeling evaporation and microexplosion of water-in-alkane emulsion droplets. In Proceedings of the AIChE 2006 Annual Meeting, San Francisco, CA, USA, 12–17 November 2006. [Google Scholar]
  18. Klarman, A.F.; Rollo, A.J.; Scott, H.C. Evaluation of the Water/Fuel Emulsion Concept for Test Cell Smoke Abatement; Naval Air Propulsion Center, Propulsion Technology and Project Engineering Dept: Trenton, NJ, USA, 1978. [Google Scholar]
  19. Molière, M.; Colas, M.; Freimark, M. Des émulsions eau-fuel pour réduire les émissions de NOx de turbines à gaz. Rev. Gén. Therm. 1989, 330–331, 428–435. [Google Scholar]
  20. Meisl, J.; Lauer, G.; Hoffmann, S. Low NOx emission technology for the VX4. 3A gas turbine series in fuel oil operation. In Proceedings of the ASME Turbo Expo 2002: Power for Land, Sea, and Air, Amsterdam, The Netherlands, 3–6 June 2002; Volume 36061, pp. 665–671. [Google Scholar] [CrossRef]
  21. Prade, B.; Meisl, J.R.; Berenbrink, P.; Streb, H.; Hoffmann, S. Burner development for flexible engine operation of the newest Siemens gas turbines. In Proceedings of the ASME Turbo Expo 2003, collocated with the 2003 International Joint Power Generation Conference, Atlanta, GA, USA, 16–19 June 2003; Volume 36851, pp. 371–376. [Google Scholar] [CrossRef]
  22. Lauer, G.; Meisl, J.; Belting, C.; Hoffmann, S. Further development of low-emissions oil combustion in the Vx4. 3A hybrid burner. VGB Powertech. 2002, 82, 51–55. [Google Scholar]
  23. Aguilar Hernandez, D.; Sullivan-Lewis, E.; McDonell, V. Adaptation of a 60kW Commercial Natural Gas Fired Microturbine for Operation on Diesel and Diesel-Water Emulsions. In Proceedings of the ASME Turbo Expo 2017: Turbomachinery Technical Conference and Exposition, Charlotte, NC, USA, 26–30 June 2017; Volume 50848, p. V04AT04A053. [Google Scholar] [CrossRef]
  24. Spadaccini, L.J.; Pelmas, J. Evaluation of oil/water emulsions for gas turbine engines. Adv. Chem. 1978, 166, 232–244. [Google Scholar] [CrossRef]
  25. Lee, T.S.; Yang, J.Y. An Experimental Study on the Burning of Water-in-Ol Emulsions. Trans. Aeronaut Astronaut. Soc. China 1999, 31, 252–277. [Google Scholar]
  26. Gopidesi, R.K.; Selvi Rajaram, P. A review on emulsified fuels and their application in diesel engine. Int. J. Ambient Energy 2022, 43, 732–740. [Google Scholar] [CrossRef]
  27. Niszczota, P.; Gieras, M. Study of the droplet size of the discrete phase of a fuel-water emulsion. J. KONBiN 2023, 53, 1–12. [Google Scholar] [CrossRef]
  28. Abdollahi, M.; Ghobadian, B.; Najafi, G.; Hoseini, S.S.; Mofijur, M.; Mazlan, M. Impact of water–biodiesel–diesel nano-emulsion fuel on performance parameters and diesel engine emission. Fuel 2020, 280, 118576. [Google Scholar] [CrossRef]
  29. Jhalani, A.; Sharma, D.; Soni, S.L.; Sharma, P.K.; Sharma, S. A comprehensive review on water-emulsified diesel fuel: Chemistry, engine performance and exhaust emissions. Environ. Sci. Pollut. Res. 2019, 26, 4570–4587. [Google Scholar] [CrossRef] [PubMed]
  30. Hasannuddin, A.K.; Wira, J.Y.; Srithar, R.; Sarah, S.; Ahmad, M.I.; Aizam, S.A.; Aiman, M.A.B.; Zahari, M.; Watanabe, S.; Azrin, M.A.; et al. Effect of emulsion fuel on engine emissions—A review. Clean Technol. Environ. Policy 2016, 18, 17–32. [Google Scholar] [CrossRef]
  31. Naegeli, D.W.; Fodor, G.E.; Moses, C.A. Fuel Microemulsions for Jet Engine Smoke Reduction; Tyndall Air Force Base: Panama City, FL, USA, 1980. [Google Scholar]
  32. Park, K.; Kwak, I.; Oh, S. The effect of water emulsified fuel on a motorway-bus diesel engine. KSME Int. J. 2004, 18, 2049–2057. [Google Scholar] [CrossRef]
  33. Gürbüz, H.; Akçay, H.; Aldemir, M.; Akçay, İ.H.; Topalcı, Ü. The effect of euro diesel-hydrogen dual fuel combustion on performance and environmental-economic indicators in a small UAV turbojet engine. Fuel 2021, 306, 121735. [Google Scholar] [CrossRef]
  34. Dutczak, J. Micro turbine engines for drones propulsion. In Proceedings of the IOP Conference Series: Materials Science and Engineering, Scientific Conference on Automotive Vehicles and Combustion Engines (KONMOT 2016), Krakow, Poland, 22–23 September 2016. [Google Scholar] [CrossRef]
  35. JETPOL Tomasz Kiciński. Available online: https://jetpol.tech (accessed on 26 April 2024).
  36. Gieras, M. Miniaturowe Silniki Turboodrzutowe, 1st ed.; Oficyna Wydawnicza Politechniki Warszawskiej: Warsaw, Poland, 2016; pp. 41–51. ISBN 978-83-7814-552-3. [Google Scholar]
  37. Alabaş, H.A.; Çeper, B.A. Effect of the hydrogen/kerosene blend on the combustion characteristics and pollutant emissions in a mini jet engine under CDC conditions. Int. J. Hydrogen Energy 2024, 52, 1275–1287. [Google Scholar] [CrossRef]
  38. Chmielewski, M.; Gieras, M. Small gas turbine GTM-120 bench testing with emission measurements. J. KONES 2015, 22, 47–54. [Google Scholar] [CrossRef]
  39. Chmielewski, M. Badanie Wpływu Zmiennej Geometrii Komory Spalania Na Efektywność Procesów Spalania I Emisje Substancji Szkodliwych W Miniaturowej Turbinie Gazowej. Ph.D. Thesis, The Institute of Heat Engineering, Warsaw, Poland, 2016. [Google Scholar]
  40. Chmielewski, M.; Niszczota, P.; Gieras, M. Combustion efficiency of fuel-water emulsion in a small gas turbine. Energy 2020, 211, 118961. [Google Scholar] [CrossRef]
  41. Niszczota, P.; Gieras, M. Impact of the Application of Fuel and Water Emulsion on CO and NOx Emission and Fuel Consumption in a Miniature Gas Turbine. Energies 2021, 14, 2224. [Google Scholar] [CrossRef]
  42. Niszczota, P.; Gieras, M. Effect of Adding Emulsifier to Fuel on Work Efficiency and Gas Turbine Emissions. Energies 2021, 14, 5255. [Google Scholar] [CrossRef]
  43. Peters, N. Laminar diffusion flamelet models in non-premixed turbulent combustion. Prog. Energy Combust. Sci. 1984, 10, 319–339. [Google Scholar] [CrossRef]
  44. Peters, N. Laminar flamelet concepts in turbulent combustion. Symp. (Int.) Combust. 1988, 21, 1231–1250. [Google Scholar] [CrossRef]
  45. Dixon-Lewis, G. Structure of laminar flames. Symp. (Int.) Combust. 1991, 23, 305–324. [Google Scholar] [CrossRef]
  46. Launder, B.E.; Spalding, D.B. Lectures in Mathematical Models of Turbulence; Academic Press: London, UK, 1972. [Google Scholar]
  47. Chmielewski, M.; Gieras, M. Impact of variable geometry combustor on performance and emissions from miniature gas turbine engine. J. Energy Inst. 2017, 90, 257–264. [Google Scholar] [CrossRef]
  48. Verstraete, D.; Hendrick, P.; Djanali, V.; Ling, J.; Wong, K.C.; Armfield, S. Micro propulsion activities at the University of Sydney. In Proceeding of the Powermems 2010 Conference, Leuven, Belgium, 30 November–3 December 2010. [Google Scholar]
  49. Gieras, M.; Stańkowski, T. Computational study of an aerodynamic flow through a micro-turbine engine combustor. J. Power Technol. 2012, 92, 68–79. [Google Scholar]
  50. Toro, C.A.G.; Wong, K.C.; Armfield, S. Computational study of a micro-turbine engine combustor using large eddy simulation and Reynolds averaged turbulence models. ANZIAM J. 2007, 49, C407–C422. [Google Scholar] [CrossRef]
  51. White, F.M. Fluid Mechanics, 5th ed.; McGraw-Hill: Boston, MA, USA, 2003; p. 467. [Google Scholar]
  52. Niszczota, P.; Gieras, M. Photographic data on the influence of the composition, preparation method, time and fuel system on the size of water droplets in a fuel-water emulsion. Data Brief 2022, 43, 108406. [Google Scholar] [CrossRef] [PubMed]
  53. Niszczota, P.; Gieras, M. Photographic data on the influence of the composition, preparation method, time and fuel system on the size of water droplets in a fuel-water emulsion. Zenodo 2022. [Google Scholar] [CrossRef]
  54. Park, J.; Nguyen, T.H.; Joung, D.; Huh, K.Y.; Lee, M.C. Prediction of NOx and CO Emissions from an Industrial Lean-Premixed Gas Turbine Combustor Using a Chemical Reactor Network Model. Energy Fuels 2013, 27, 1643–1651. [Google Scholar] [CrossRef]
  55. Correa, S.M. A review of NOx formation under gas-turbine combustion conditions. Combust. Sci. Technol. 1993, 87, 329–362. [Google Scholar] [CrossRef]
  56. Gieras, M. Komory Spalania Silników Turbinowych: Organizacja Procesu Spalania, 1st ed.; Oficyna Wydawnicza Politechniki Warszawskiej: Warsaw, Poland, 2010; pp. 120–124. ISBN 978-83-7207-864-3. [Google Scholar]
  57. Łapucha, R. Komory Spalania Silników Turbinowo-Odrzutowych: Procesy, Obliczenia, Badania; Wydawnictwa Naukowe Instytutu Lotnictwa: Warsaw, Poland, 2004; pp. 128–143. ISBN 83-915995-8-2. [Google Scholar]
  58. Chmielewski, M.; Gieras, M.; Niszczota, P. Fuel-Water emulsion impact on miniature gas turbine pollutant emission. In Proceedings of the E3S Web of Conferences, Warsaw, Poland, 3–6 December 2019; EDP Sciences: Les Ulis, France, 2019; Volume 137, p. 01046. [Google Scholar] [CrossRef]
  59. Naegeli, D.W.; Moses, C.A. Fuel Microemulsions for Jet Engine Smoke Reduction. In Proceedings of the ASME 1982 International Gas Turbine Conference and Exhibit, London, UK, 18–22 April 1982; Volume 79580, p. V003T06A009. [Google Scholar] [CrossRef]
  60. Naegeli, D.W.; Moses, C.A. Fuel microemulsions for jet engine smoke reduction. J. Eng. Power 1983, 105, 18–23. [Google Scholar] [CrossRef]
  61. Mann, M.; Jainski, C.; Euler, M.; Böhm, B.; Dreizler, A. Transient flame-wall interactions: Experimental analysis using spectroscopic temperature and CO concentration measurements. Combust. Flame 2014, 161, 2371–2386. [Google Scholar] [CrossRef]
  62. De Giorgi, M.G.; Fontanarosa, D.; Ficarella, A.; Pescini, E. Effects on performance, combustion and pollutants of water emulsified fuel in an aeroengine combustor. Appl. Energy 2020, 260, 114263. [Google Scholar] [CrossRef]
  63. Niszczota, P.; Gieras, M. Influence of surfactant addition to emulsion fuels on the hot section of turbine engines. J. KONBiN 2023, 53, 13–25. [Google Scholar] [CrossRef]
Figure 1. Scheme of the quasi-reverse flow in a miniature gas turbine engine.
Applsci 14 06686 g001
Figure 2. Places of outlets of the lubrication system (GTM160) of the bearing: (a) front; (b) rear.
Applsci 14 06686 g002
Figure 3. Test stand: close-up of the GTM120 gas turbine.
Applsci 14 06686 g003
Figure 4. Cross-section of the engine with cross-section numbering (from [38]).
Applsci 14 06686 g004
Figure 5. Lubrication and fuel system: (a) unmodified; (b) modified.
Applsci 14 06686 g005
Figure 6. Scheme of the experimental trial.
Applsci 14 06686 g006
Figure 7. Simplified model of the GTM120 geometry.
Applsci 14 06686 g007
Figure 8. Photo of the fuel–water emulsion: (a) macroscopic; (b) microscopic.
Applsci 14 06686 g008
Figure 9. Percentage change in NOx emissions as a function of the percentage change in temperature behind the combustion chamber.
Applsci 14 06686 g009
Figure 10. Comparison of temperature distribution and NOx emissions at a turbine rotational speed of 80 krpm powered by standard fuel and an emulsion containing 3% water in its composition.
Applsci 14 06686 g010
Figure 11. The influence of water content in the emulsion on the change in CO emissions.
Applsci 14 06686 g011
Figure 12. Temperature distribution for the GTM120 turbine operating at a rotational speed of 100 krpm in the case of the combustion of a base fuel and an emulsion containing 12% water. (The arrow indicates the direction of the most intense expansion of the reaction area resulting from the addition of 12% water to the fuel mixture.)
Applsci 14 06686 g012
Figure 13. Changes in CO emissions resulting from the use of fuel–water emulsions depending on the year of publication of test results (based on data from [4]).
Applsci 14 06686 g013
Figure 14. The influence of water content in the emulsion on thrust-specific fuel consumption (calculated for the total mass of the fuel mixture).
Applsci 14 06686 g014
Figure 15. The influence of water content in the emulsion on the consumption of base fuel (after subtracting the weight of water and emulsifier).
Applsci 14 06686 g015
Figure 16. The influence of emulsifier content on the change in NOx emissions.
Applsci 14 06686 g016
Figure 17. The influence of emulsifier content on the change in CO emissions.
Applsci 14 06686 g017
Figure 18. GTM120 gas turbine outlet nozzle with the marked places indicating glassy deposits.
Applsci 14 06686 g018
Table 1. Measurement uncertainties of the sensors.
ParameterSensorUncertainty of Measurement
ThrustNS-6 + WDT-1±0.55 N
PressureKobold SEN-8701/2 B045±2.50 kPa
PressureKobold SEN-8701/2 B055±4.00 kPa
PressureDudek P400U±34.0 Pa
PressureHoneywell ASDX030D44R4.14 kPa
Temperature Thermocouple NiCr-NiAl - in the range of −40 ÷ 375 °C: ±1.5 °C
- in the range 375 ÷ 1000 °C: ±0.4% of the measured value
Table 2. Measurement uncertainties of the exhaust gas analyzer in the range of analyzer indications used.
ParameterResolutionUncertainty of Measurement
O20.01 vol.±0.2% vol.
CO1 ppm±5% of the measured value
NO0.1 ppm±2 ppm
NO20.1 ppm±5 ppm
CO20.01% vol.±0.3% vol. + 1% of the measured value
Table 3. Surfactant composition (by mass).
ComponentPercentage Content
Rokwin 8050.00
Rokanol RZ4P1125.00
Rokanol DB322.50
Rokafenol N81.67
Water0.83
Disclaimer/Publisher’s Note: The statements, opinions and data contained in all publications are solely those of the individual author(s) and contributor(s) and not of MDPI and/or the editor(s). MDPI and/or the editor(s) disclaim responsibility for any injury to people or property resulting from any ideas, methods, instructions or products referred to in the content.

