Article

Validation and Application of a Code for Three-Dimensional Analysis of Hydrogen–Steam Behavior in a Nuclear Reactor Containment during Severe Accidents

1
Korea Atomic Energy Research Institute, Daejeon 34057, Republic of Korea
2
Korea Institute of Nuclear Safety, Daejeon 34142, Republic of Korea
*
Author to whom correspondence should be addressed.
Appl. Sci. 2024, 14(15), 6695; https://doi.org/10.3390/app14156695
Submission received: 20 June 2024 / Revised: 17 July 2024 / Accepted: 30 July 2024 / Published: 31 July 2024
(This article belongs to the Special Issue CFD Analysis of Nuclear Engineering)

Abstract

:

Featured Application

Thermal hydraulics related to hydrogen safety in a nuclear reactor containment can be simulated by the 3D CFD code with validated steam condensation and hydrogen recombination models.

Abstract

In a pressurized water reactor (PWR) during a loss of coolant accident (LOCA) or a station blackout (SBO) accident, water and steam are released into the containment building. The water vapor mixes with the atmosphere, partially condensing into droplets or condensing on the containment walls. Although a significant amount of water vapor condenses, it coexists with hydrogen generated by the reactor core oxidation. As water vapor condenses, the volume fraction of hydrogen increases, raising the risk of explosion or flame acceleration. As such, water vapor’s behavior directly affects hydrogen distribution. To conservatively evaluate hydrogen safety in a PWR during a severe accident, lumped-parameter codes have been heavily used. As a best-estimate approach for hydrogen safety analysis in a PWR containment, a turbulence-resolved CFD code called contain3D has been developed. This paper presents the validation results of the code and simulation results of hydrogen behavior affected by water vapor condensation and hydrogen removal by passive autocatalytic recombiners (PARs) in the APR1400 containment. The results provide insight into the three-dimensional behaviors of the hydrogen in the containment.

1. Introduction

As seen in the Fukushima nuclear power plant (NPP) accident [1,2], hydrogen mitigation and the prevention of overpressure caused by water vapor is very important to maintain the integrity of the reactor containment in the event of an accident.
During a loss of coolant accident (LOCA) or a station blackout (SBO) accident in a pressurized water (PWR) reactor, hot water and steam are released into the containment building. The water vapor released into the containment mixes with the atmosphere and partially condenses into droplets or condenses on the surface of the structure in the containment building, raising the temperature of the structure. However, a large amount of water vapor is not condensed and remains in the containment building.
When hydrogen generated by reactor core oxidation [3] is released into the containment, it spreads as it mixes with the water vapor and air exiting in the containment. As the water vapor condenses in any space in the containment, the volume fraction of the hydrogen increases relatively, and the potential for explosion or flame acceleration will be raised. Hydrogen concentrations below 4 vol% are known to be non-flammable, meaning that combustion does not occur. Also, as the concentration of water vapor increases and reaches 65 vol% or more, combustion becomes unlikely even if the concentration of hydrogen is high [4]. Thus, the behavior of water vapor in a containment building directly affects the distribution of hydrogen. As the supersaturated water vapor changes phase in the containment and becomes liquid water, it no longer contributes to the concentration of hydrogen but can indirectly affect the behavior of hydrogen through thermal and flow resistance. Therefore, hydrogen mitigation needs to be carried out simultaneously to preventing the overpressure of water vapor.
Many NPPs operating around the world are adopting PAR-based hydrogen mitigation systems (HMSs) to control hydrogen concentration in the event of a design-based and design-extended severe accident. Due to the passive nature of PAR, it is affected by thermal–hydraulic conditions such as water vapor and temperature distributions within the containment. Various analysis codes have been developed or are being developed to evaluate the hydrogen safety in an NPP containment and to prove the effectiveness of the HMS installed in containment under severe accident conditions.
Each code simulates the behavior of hydrogen over time based on computational fluid dynamics (CFDs) which solves the mechanistic conservation equations of species masses, momentum, and energy of fluid. Generally, it is divided into lumped parameter (LP) and three-dimensional (3D) code depending on the method of discretizing the volume of the containment [5]. Because the LP code relies on many correlation-based physical models in the volume-averaged form to simulate severe accident phenomena, it is dominantly used to assess the hydrogen safety in an NPP containment. Meanwhile, compared to LP codes, the key feature of 3D analysis codes is that they can resolve 3D turbulence phenomena. Conservative evaluation is very important in hydrogen safety evaluation using the LP codes because the parameters of the correlation-based models are problem-dependent. Sometimes, it can be difficult to decide the conservativity of the analysis results of the LP codes due to the diversity in hydrogen behaviors in the containment. It is still difficult to evaluate hydrogen behaviors in containment buildings under severe accident conditions using 3D codes. Difficulties in the development of 3D physical models for thermal hydraulic phenomena within NPP containments and the development of numerical schemes for fast calculation speed are limiting the use of 3D codes. However, 3D codes can be of great help in assessing the conservativity of LP code analysis results or selecting conservative values for LP code model parameters [6].
Recently, 3D analysis codes for analyzing water vapor and hydrogen behaviors in NPP containments have been developed using various approaches. A typical method is to add special physical models to general-purpose CFD tools such as FLUENT [7], CFX [8], and STAR-CCM+ [9]. In-house codes developed especially for containment thermal hydraulics analysis include GASFLOW [10], GOTHIC [11], and TONUS [12]. Recently, research has been conducted to develop models and solvers optimized for containment analysis based on open-source CFD platforms such as OpenFOAM [13].
There are still not many cases where hydrogen behaviors in an NPP containment have been simulated using 3D codes. Royl et al. [14] performed the first full-3D analysis of hydrogen behavior in an NPP containment using the GASFLOW code. The GASFLOW code was upgraded for parallelized computation recently [15] and applied to other NPPs such as Qinshan-II [16]. Martin-Valdepenas et al. [17] used CFX by adding water vapor condensation, heat transfer, and hydrogen flame characteristics evaluation models to evaluate flammability and the deflagration-to-detonation transition (DDT) characteristics of hydrogen mixture in Westinghouse and KWU NPPs. Afterward, the KWP NPP was simulated again using GOTHIC to study hydrogen mitigation by PAR [18]. Kanik et al. [19] also used GOTHIC to three-dimensionally simulate hydrogen distribution in the VVER-1000 containment. Raman et al. [20] used FLUENT to study hydrogen distribution in 220 MWe PHWR containment with a user-supplied wall condensation model. Kudriakov et al. [12] used TONUS developed by CEA and IRSN for hydrogen risk analysis in the EPR containment, where there is no information about PAR modeling in the containment. Kelm et al. [21] developed a new 3D containment analysis code for hydrogen and carbon monoxide mitigation based on OpenFOAM, but no papers have yet been found on its application to actual NPP containment analysis.
The hydrogen recombination rate correlation obtained from PAR performance experiments is easy to implement in the LP-based codes. On the other hand, in order to apply it to a 3D code, additional efforts of model multi-dimensionalization, grid generation, parallelization, etc., are required because each PAR reacting zone may have multiple cells of a containment mesh. Modern CFD codes rely on parallel computing to enhance computing performance. A PAR module of 3D codes requires sophisticated numerical schemes for parallelization of the PAR model.
Recently a turbulence-resolved CFD code, contain3D, has been developed for a hydrogen safety analysis in an NPP containment for best estimation [22,23].
In this paper, we introduce the analytic models implemented in the code, with a particular focus on an enhanced PAR model that accounts for the pressure drop across the porous catalyst and the heat transfer between the catalyst body and the exhaust gas. The PAR and wall vapor condensation models are validated through benchmark test simulations. To streamline the time-consuming process of placing multiple PARs in the containment digital geometry model, we developed and applied a Python program to generate the APR1400 mesh. The contain3D code is used to study hydrogen behavior influenced by water vapor condensation and hydrogen recombination by PARs installed in the APR1400 containment [24]. Through these analyses, the hydrogen removal performance of PARs in the containment building is evaluated, along with the assessment of any uneven or stratified distribution of hydrogen.

2. Modeling of Containment Thermal Hydraulics

Volumetric or homogeneous condensation is the condensation of supersaturated water vapor when the atmosphere contains more water vapor than the saturated water vapor pressure corresponding to its temperature and is an important factor that directly affects the distribution and concentration of hydrogen in an NPP containment building.
The droplets produced by water vapor condensation take the form of aerosols and are commonly referred to as fog or mist. There are Eulerian and Lagrangian approaches for dealing with gases containing fog. The Eulerian approach includes two-phase and mixture models, while the Lagrangian approach tracks parcels of droplets. The Lagrangian method is more computationally intensive than the Eulerian method as the number of parcels increases. Therefore, to efficiently use the available computer resources, this study aims to develop a numerical method based on the Eulerian approach.
Since the volume fraction of fog generated by condensation in the containment building is negligibly small, the Eulerian two-phase model with phasic volume fractions as dependent variables may require many iterative calculations to obtain a rigorous solution for the behavior of the liquid phase, so it is advantageous in terms of numerical stability to use the mass fraction of the condensate. In addition, the velocity and temperature of the fog aerosol, which is microscale in size, can be assumed to be in mechanical and thermal equilibrium with the gas phase, so the momentum and energy equations for the liquid phase can be omitted and only the mass equation needs to be solved. This assumption is attractive for the fast running of a long-term simulation.

2.1. Governing Equations

Equations (1)–(4) represent the governing equations for the gas phase assuming thermal and mechanical equilibrium with the fog phase.
ρ t + · ρ U = S ρ
t ρ U + · ρ U U · R = p + ρ g + S m
t ρ Y i + · ρ Y i U · J i = S Y i
t ρ h s + · ρ h s U · q = p t t ρ K + · ρ K U + S h
The mass faction of the fog phase is defined as a ratio of fog mass to gas mass instead of the total mass of fog and gas [25].
α = m f m g
Equation (6) is the fog mass transport equation, and the rate of water vapor condensation and fog evaporation, S α , is simply modeled by Equation (7) [10].
t ρ g α + ρ g U α Γ t α = S α
S α = C b l k ρ s a t ρ h 2 o

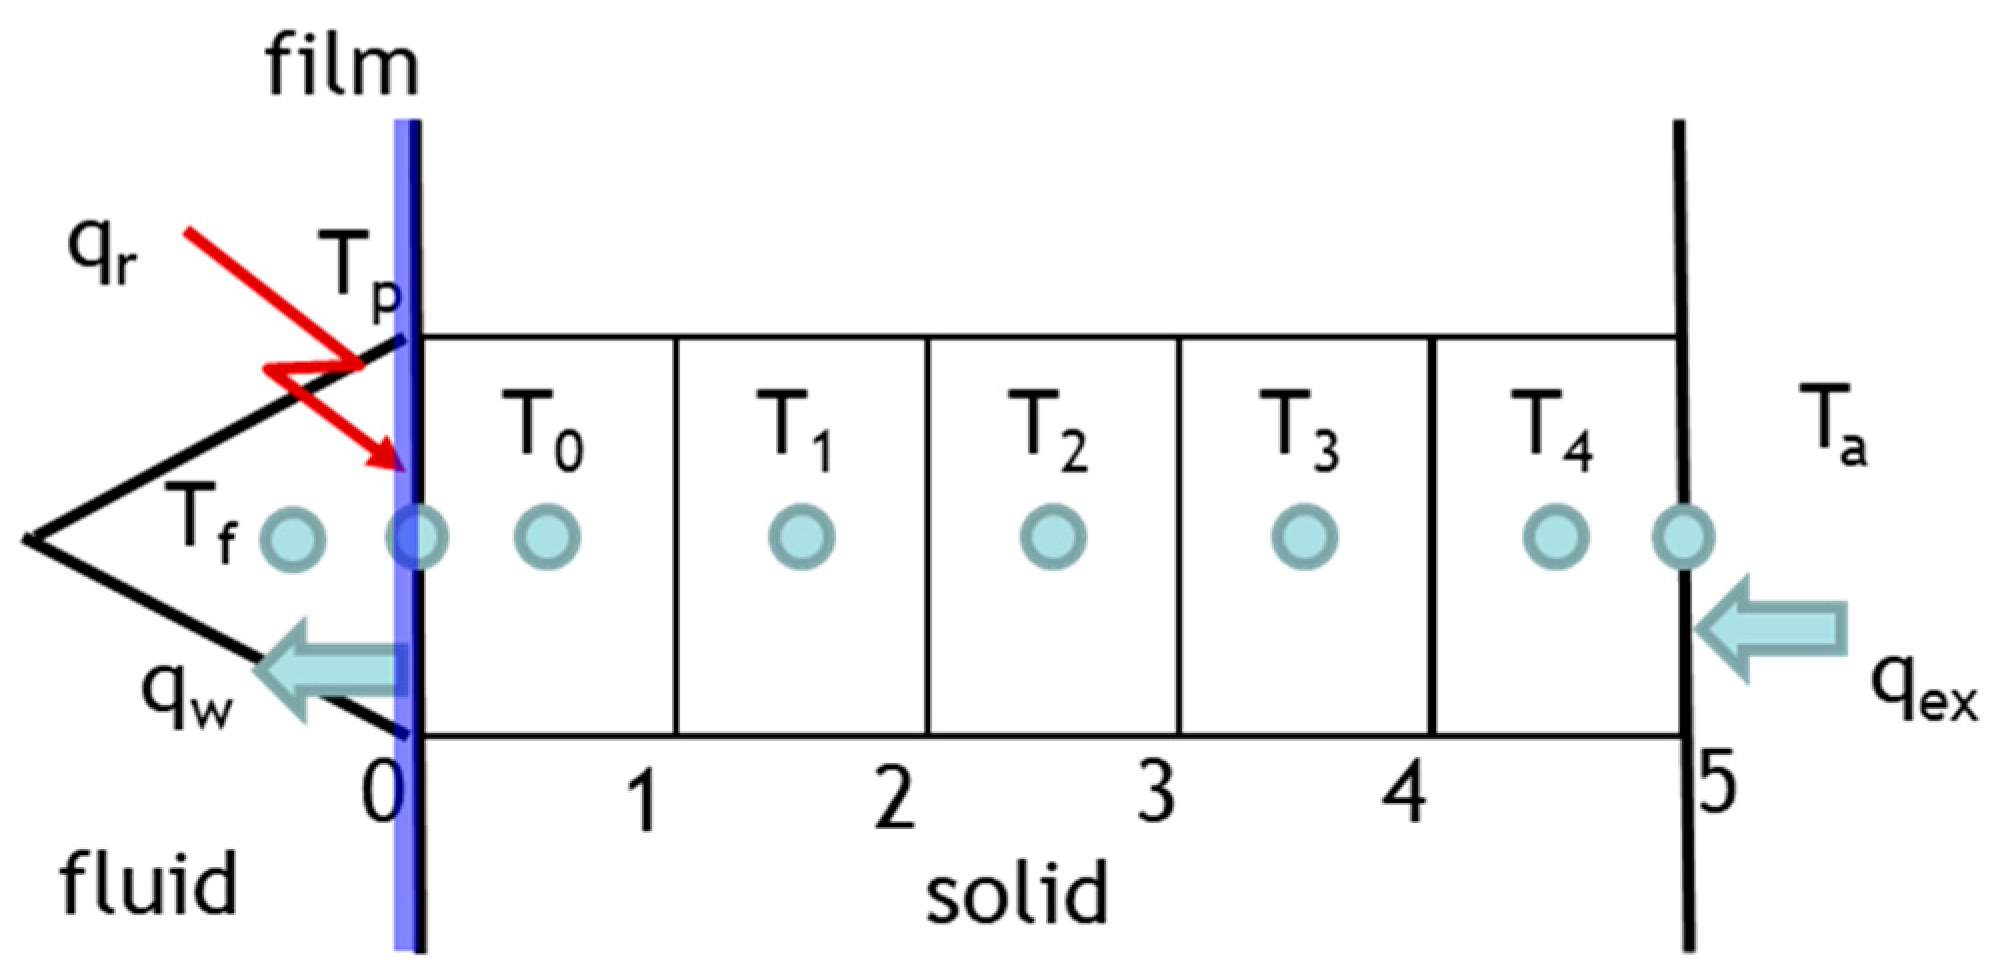
2.2. Modeling for Wall Condensation and Heat Transfer

The wall condensation of water vapor mixed with a non-condensable gas such as air is limited by its mass diffusion rate. So, the condensation mass flux is expressed as the mass diffusion rate of water vapor through the non-condensable gas. Reference [23] describes the equation of the water vapor diffusion rate in a discretized form as shown in Equation (8).
m ˙ v = ρ D w δ ( Y v i Y v w ) ( 1 Y v w ) = ρ h m ( Y v i Y v w ) ( 1 Y v w )
The mass flux of water vapor removed by condensation on the wall is determined by the water vapor diffusion coefficient on the wall, and therefore condensation models are currently implemented by how to determine D w or h m .
One of the mechanistic models for wall condensation is to use a turbulence model and a wall function. The condensation mass flux of water vapor on the wall is obtained using the wall heat transfer coefficient calculated from the wall function and Chilton–Colburn analogy [26]. First, T + is obtained from the wall function [27].
i f   y + < y T + ,      T + = P r y + + 1 2 ρ u τ U 2 q w P r
i f   y + y T + ,      T + = P r t U + + P + 1 2 ρ u τ U 2 q w P r t U 2 + P r P r t U c 2
The wall heat transfer coefficient h can be obtained from the relationship between T + and the wall heat flux.
h = k w δ = q w ( T w T p ) = ρ C p u τ ( T w T p ) T + 1 ( T w T p ) = ρ C p u τ T +
Here, using the Chilton–Colburn analogy, the mass diffusion coefficient can be obtained from the heat transfer coefficient h.
h m = h ρ C p P r 2 / 3 S c 2 / 3
The heat released from the water vapor condensation is transferred to the wall contacting with the condensate film. In general, the wall heat conduction can be considered by a conjugate heat transfer (CHT) approach, which needs a solid heat conduction solver coupled with a fluid solver. In addition to the CHT multi-region, a one-dimensional heat conduction model is implemented in the contain3D code for a fast simulation of containment thermal hydraulics. It solves the 1D unsteady heat conduction equation coupled with fluid boundary, as shown in Figure 1.

2.3. Modeling for Passive Autocatalytic Recombiner

In general, PAR modeling is composed of thermodynamic and gas dynamic models. The catalytic body of a PAR has two modes such as heat generation by the surface reaction and heat transfer between gas and the catalytic body.
The catalytic surface reaction of hydrogen and oxygen can be described by Equation (13) [28]
H 2 + 1 2 O 2 H 2 O + 121   M J / k g
Depending on the hydrogen removal rate R of a PAR, the hydrogen and oxygen consumption rates and water vapor production rate are defined as follows.
d d t m h 2 = R
d d t m o 2 = 8 R
d d t m h 2 o = 9 R
As a PAR catalytic reaction rate, a correlation equation based on hydrogen removal rate data obtained from PAR performance tests is generally used.
R = c o r r e l a t i o n p , T , x h 2 , x o 2 , x h 2 o
In the PAR model based on the correlation equation, the hydrogen removal rate R is obtained using the correlation equation. Table 1 shows the hydrogen removal rate correlation equations for commercial PARs.
The heat released from the hydrogen recombination is shared by the catalytic body and the gas flowing through the body because the surface catalyst participates in the reaction. The heat transfer model is similar to the previous study [22], and the equation is as follows.
m C p p a r d d x T p a r = ( 1 φ p a r ) 121 × 10 6 V p a r × d d t m h 2 A h ( T p a r T g a s )
ϕ p a r in Equation (18) is used to split the thermal energy, and it may vary depending on the shape of the catalyst body.
The hydrogen removal rate of a PAR is physically related to the mass flow rate of the hydrogen mixture gas flowing into the PAR housing. The gas flow into the catalytic body is induced continuously by the heat released from the catalytic hydrogen recombination but is limited by the frictional resistance between the catalytic body and the flowing gas.
In this study, the unsteady Darcy–Forchheimer friction model [33], which is an extension of the Darcy–Forchheimer model, was applied to consider a transient phenomenon of a PAR. The first term of Equation (19) is the same as the virtual mass term used in the Euler two-phase flow model, and the default value of the coefficient C v is 0.5. The second and third terms are Darcy friction and Forchheimer friction, respectively.
p = C v ρ d d t U + U · U + μ D · U + 1 2 ρ U F · U

3. Results

A code validation and its application to the APR1400 containment were conducted. To resolve their turbulent flows, the k-ω SST turbulence model with a buoyancy production of turbulent kinetic energy [34] was used with Spalding’s wall function.

3.1. Validation of the Models

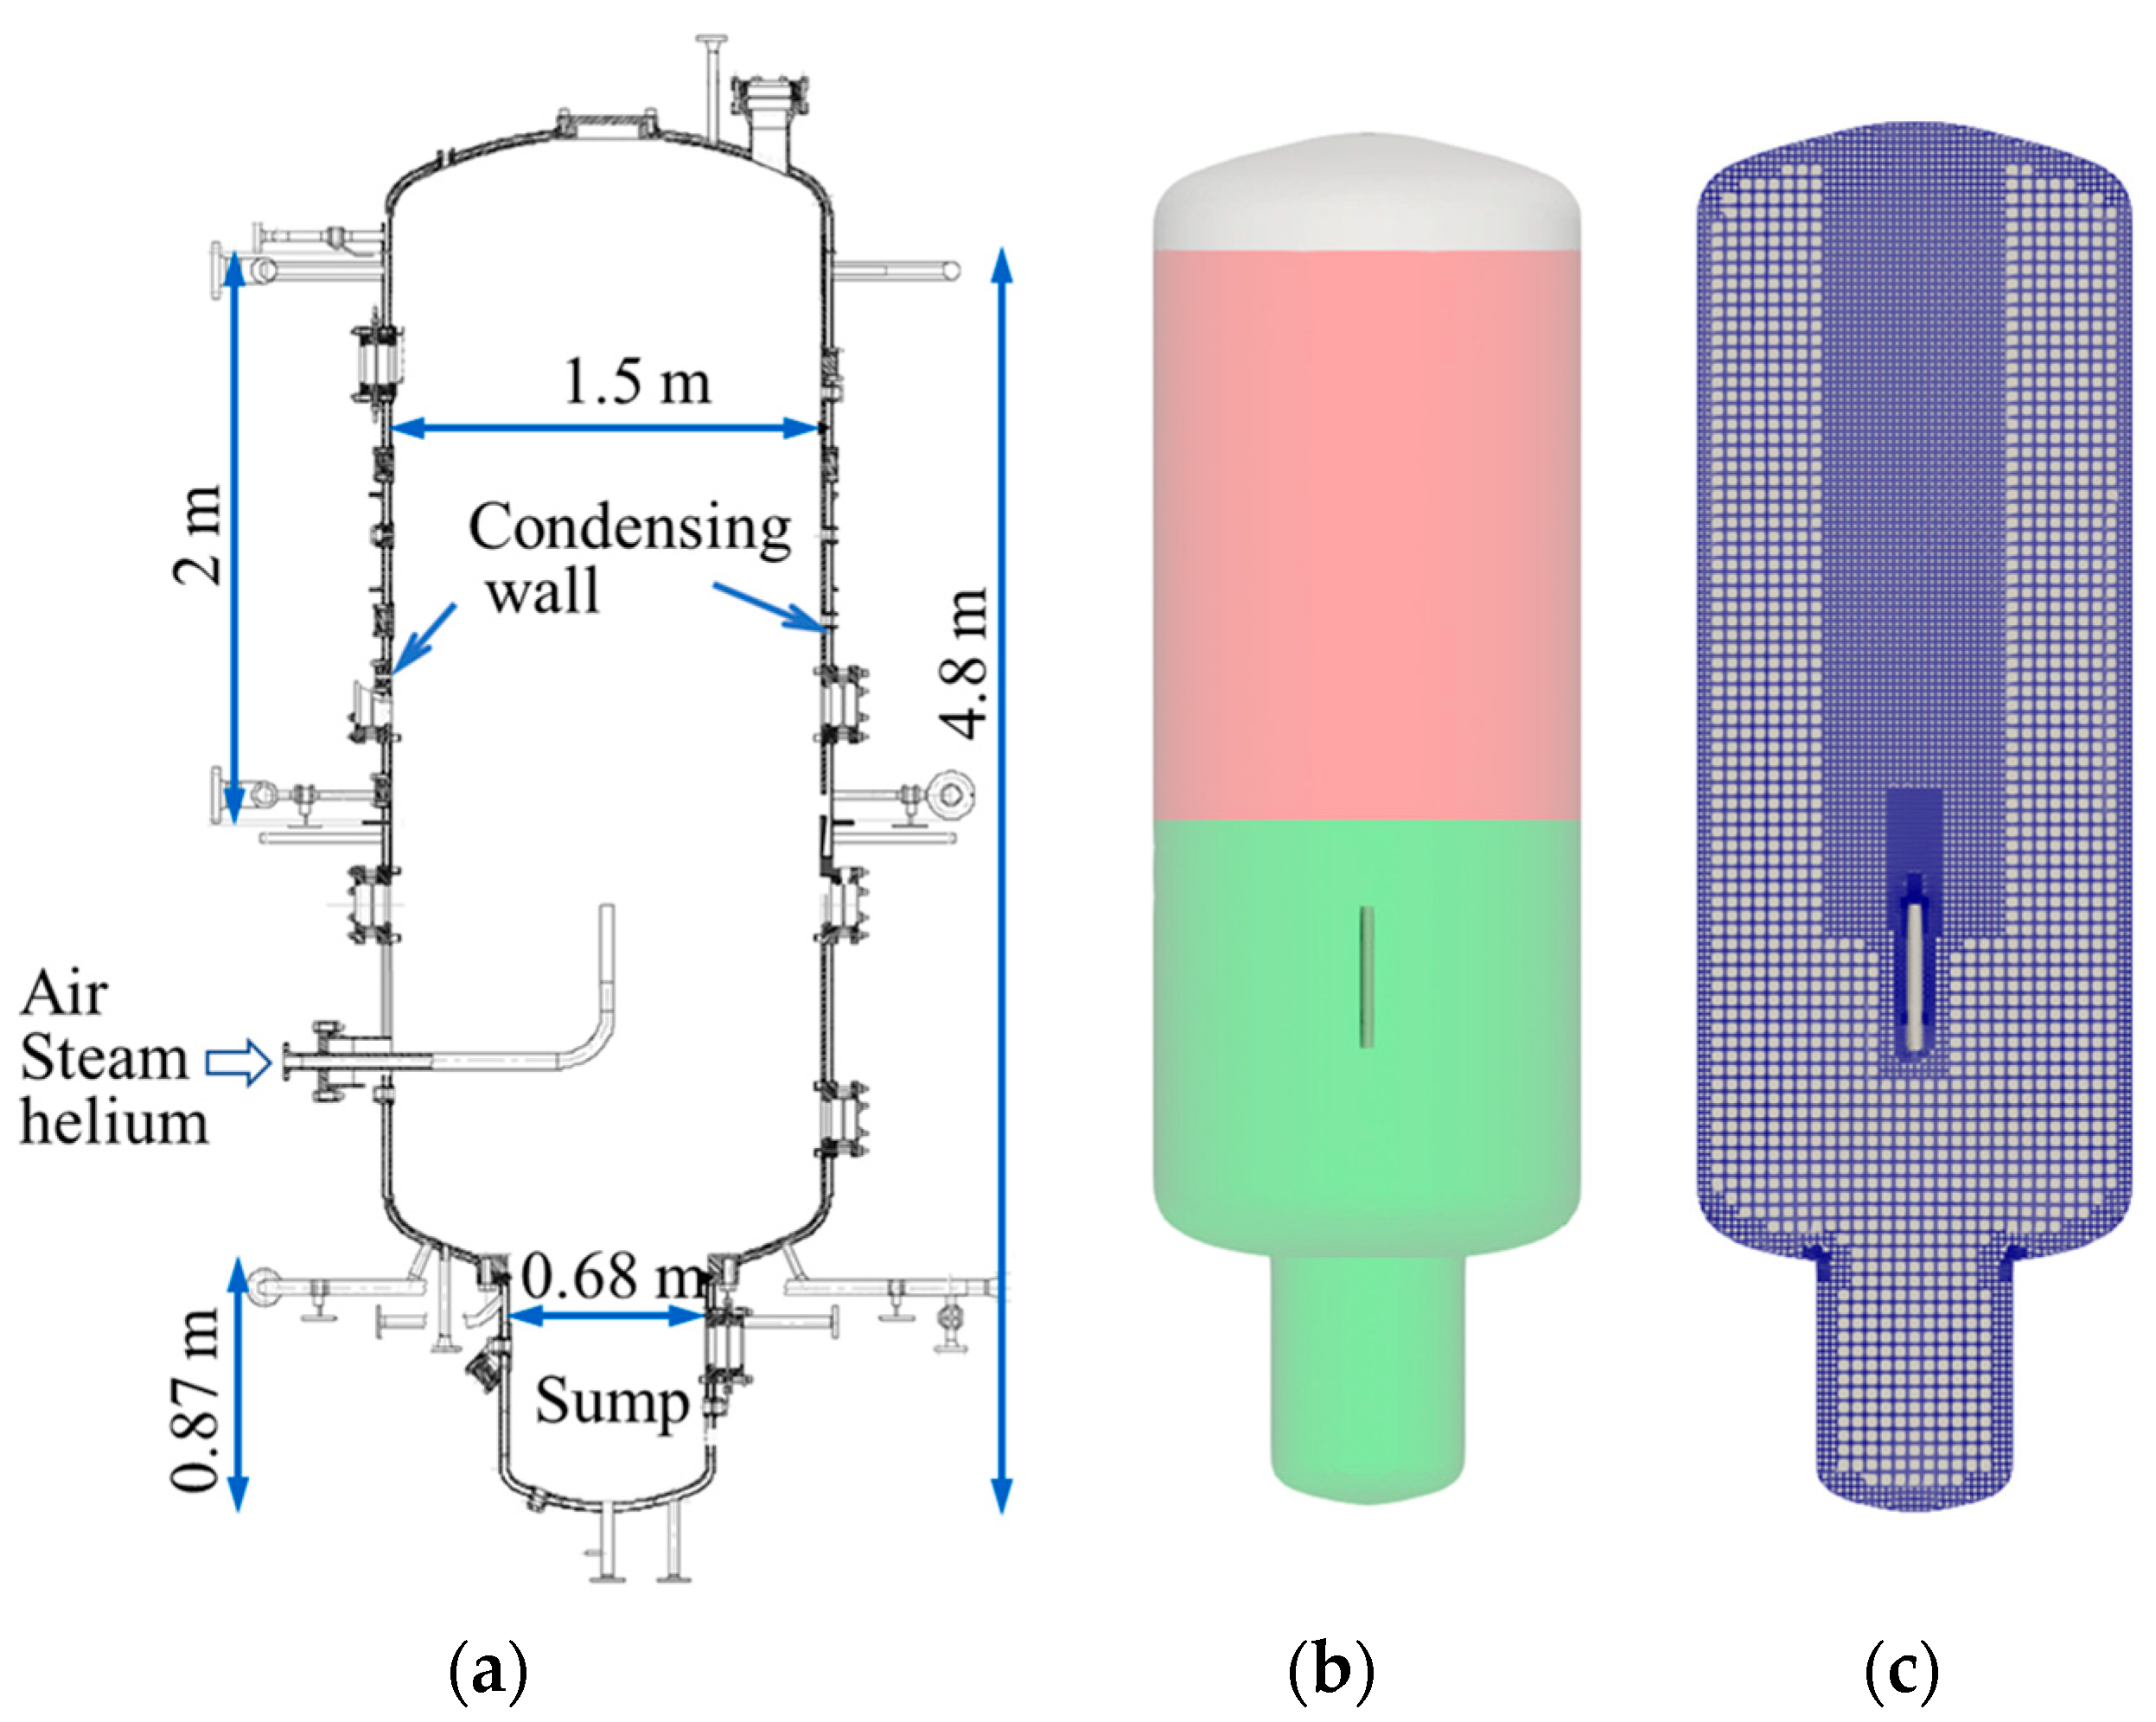
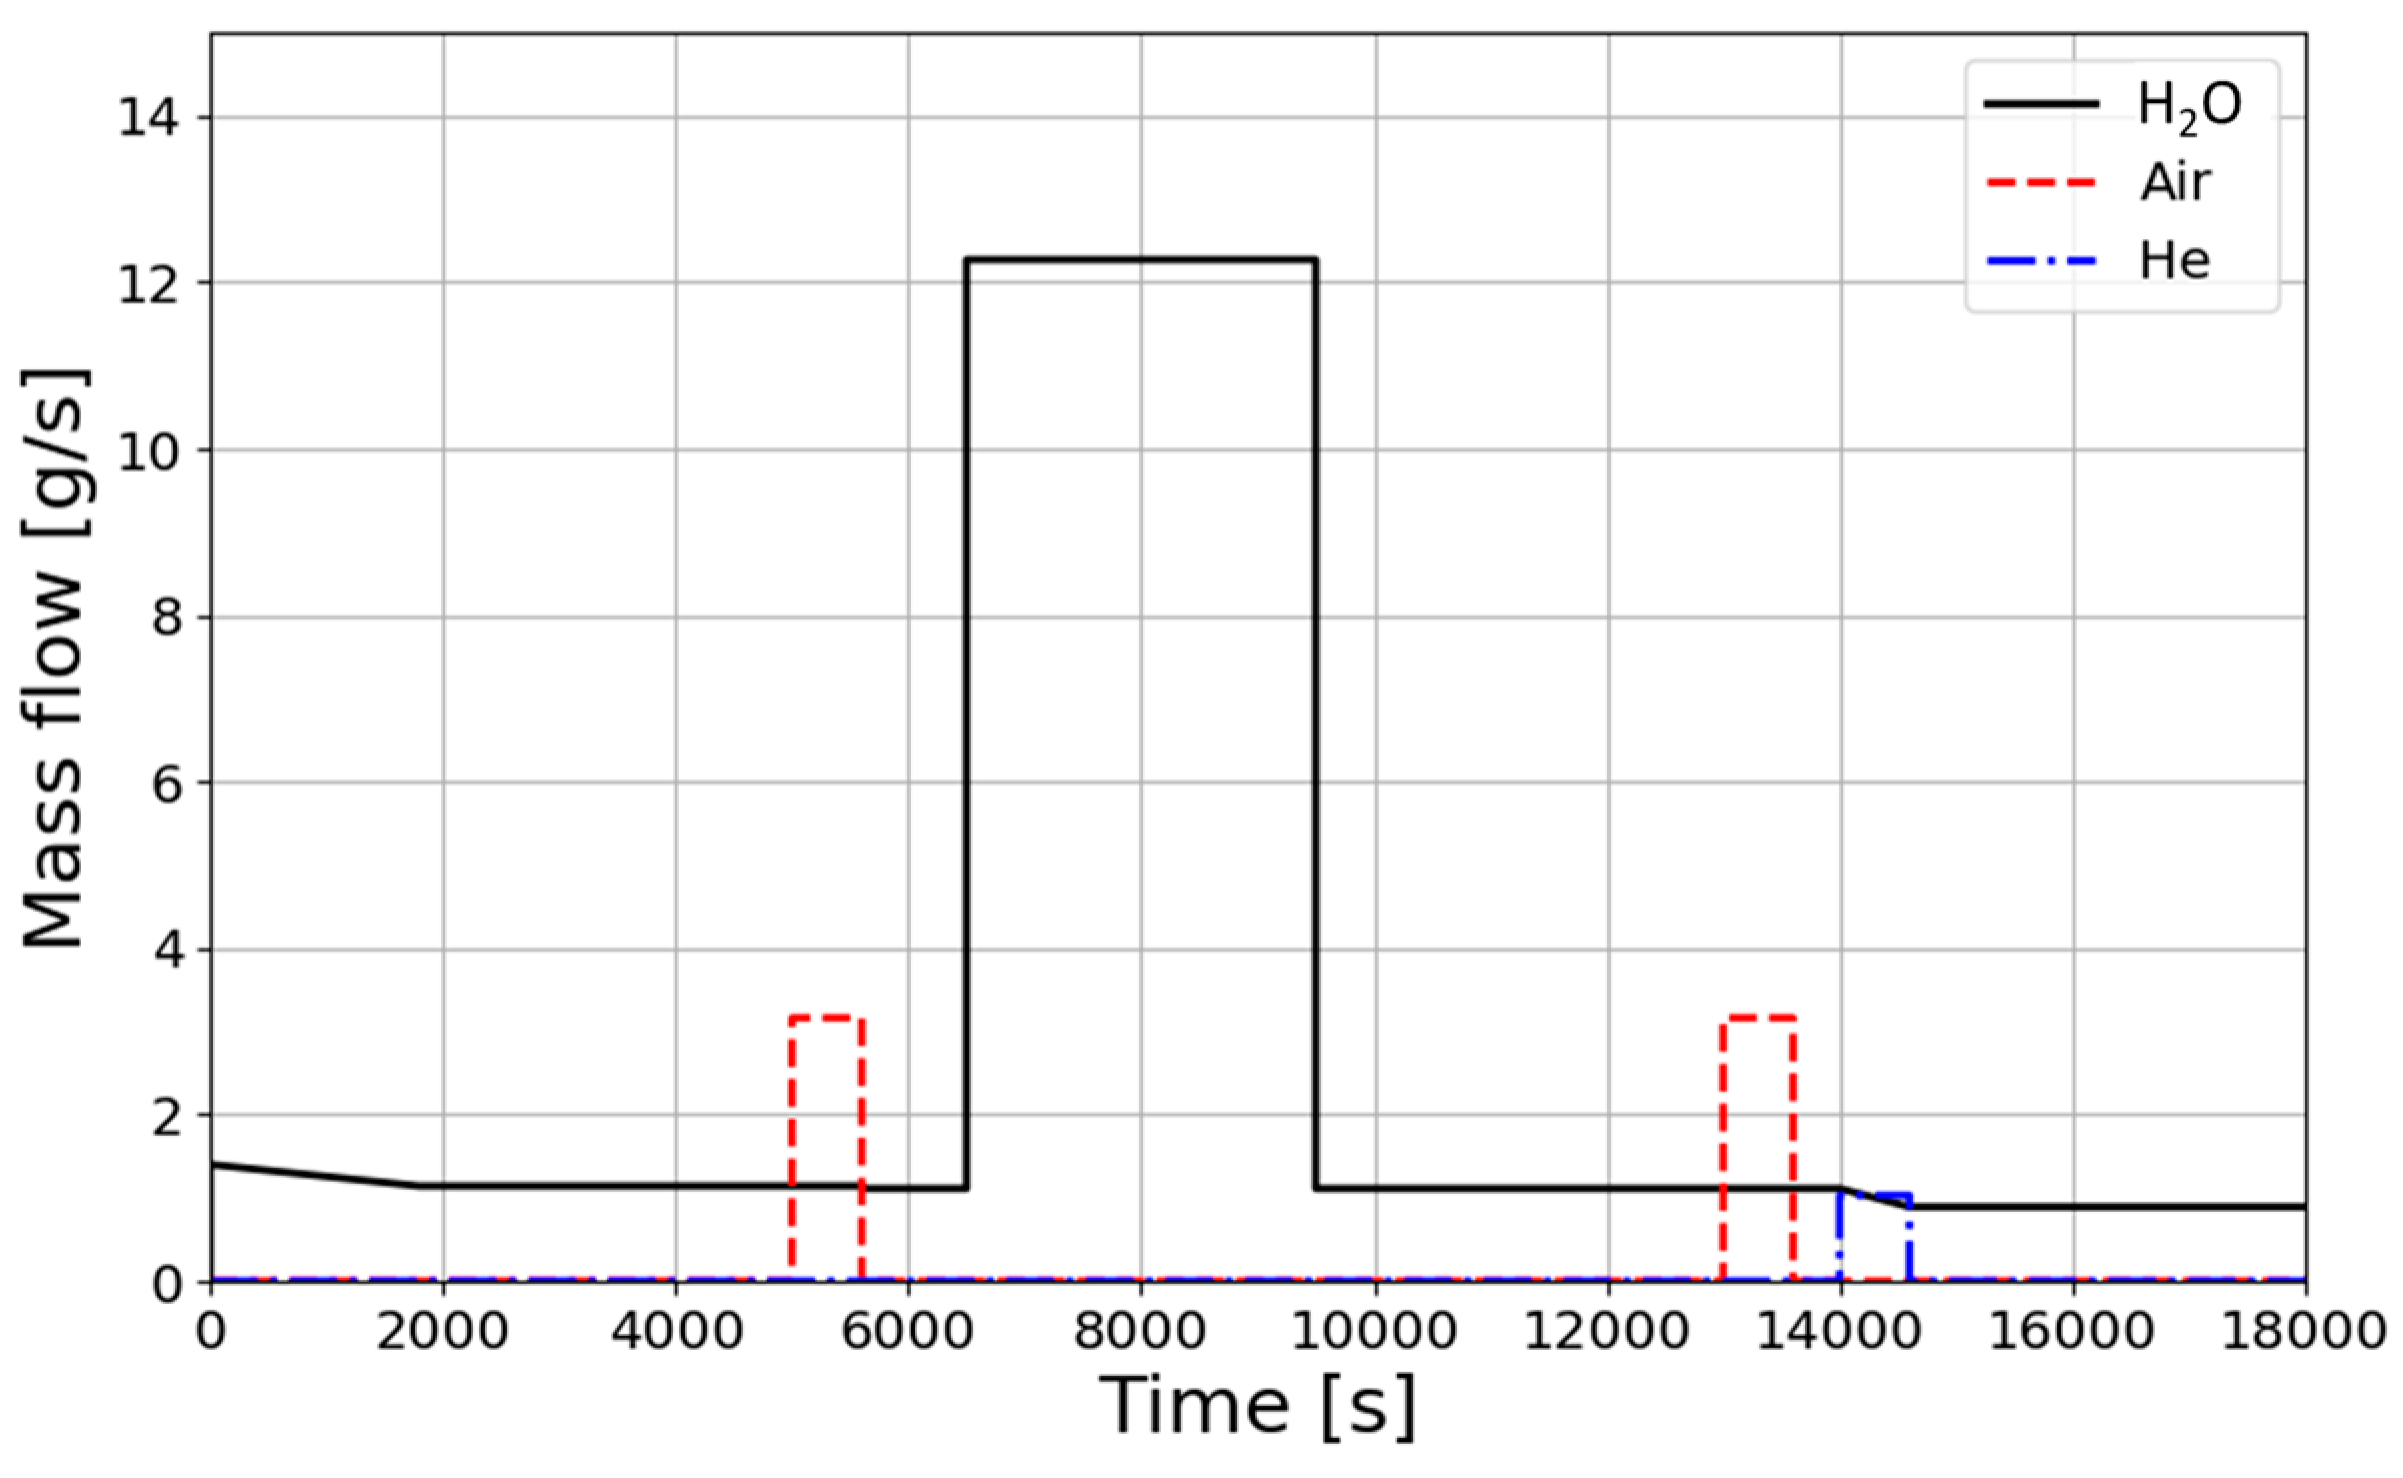
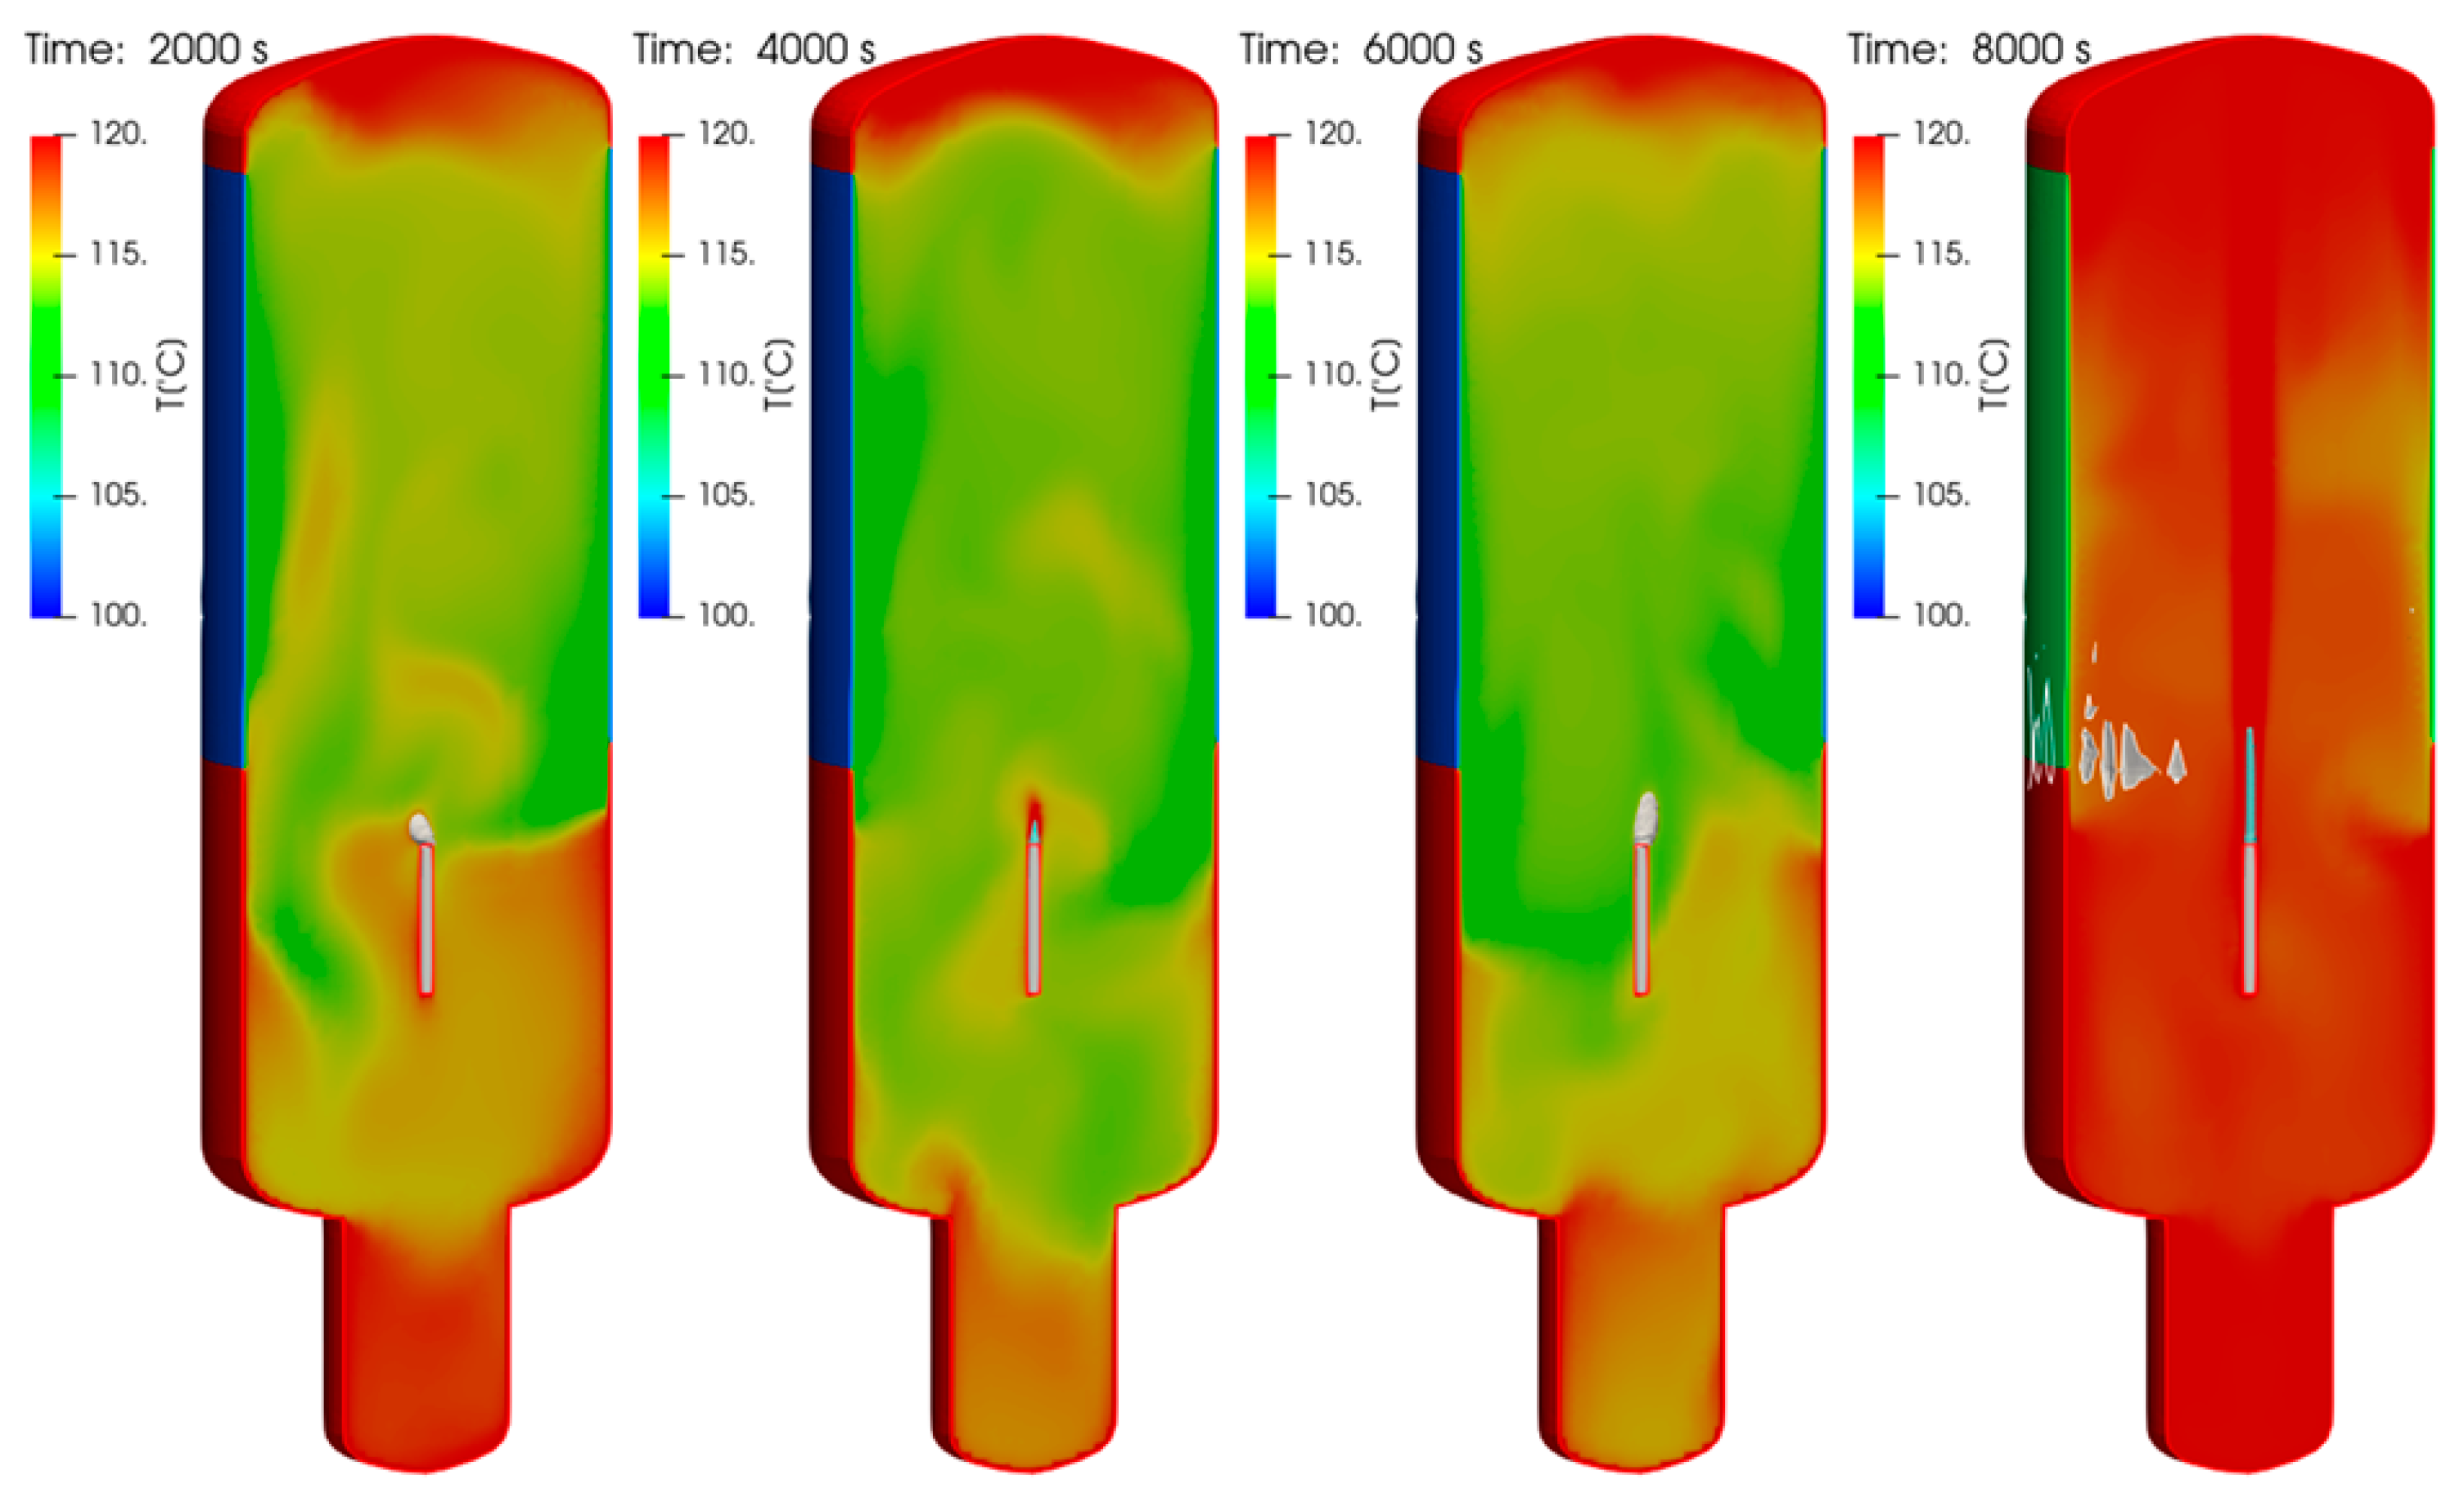
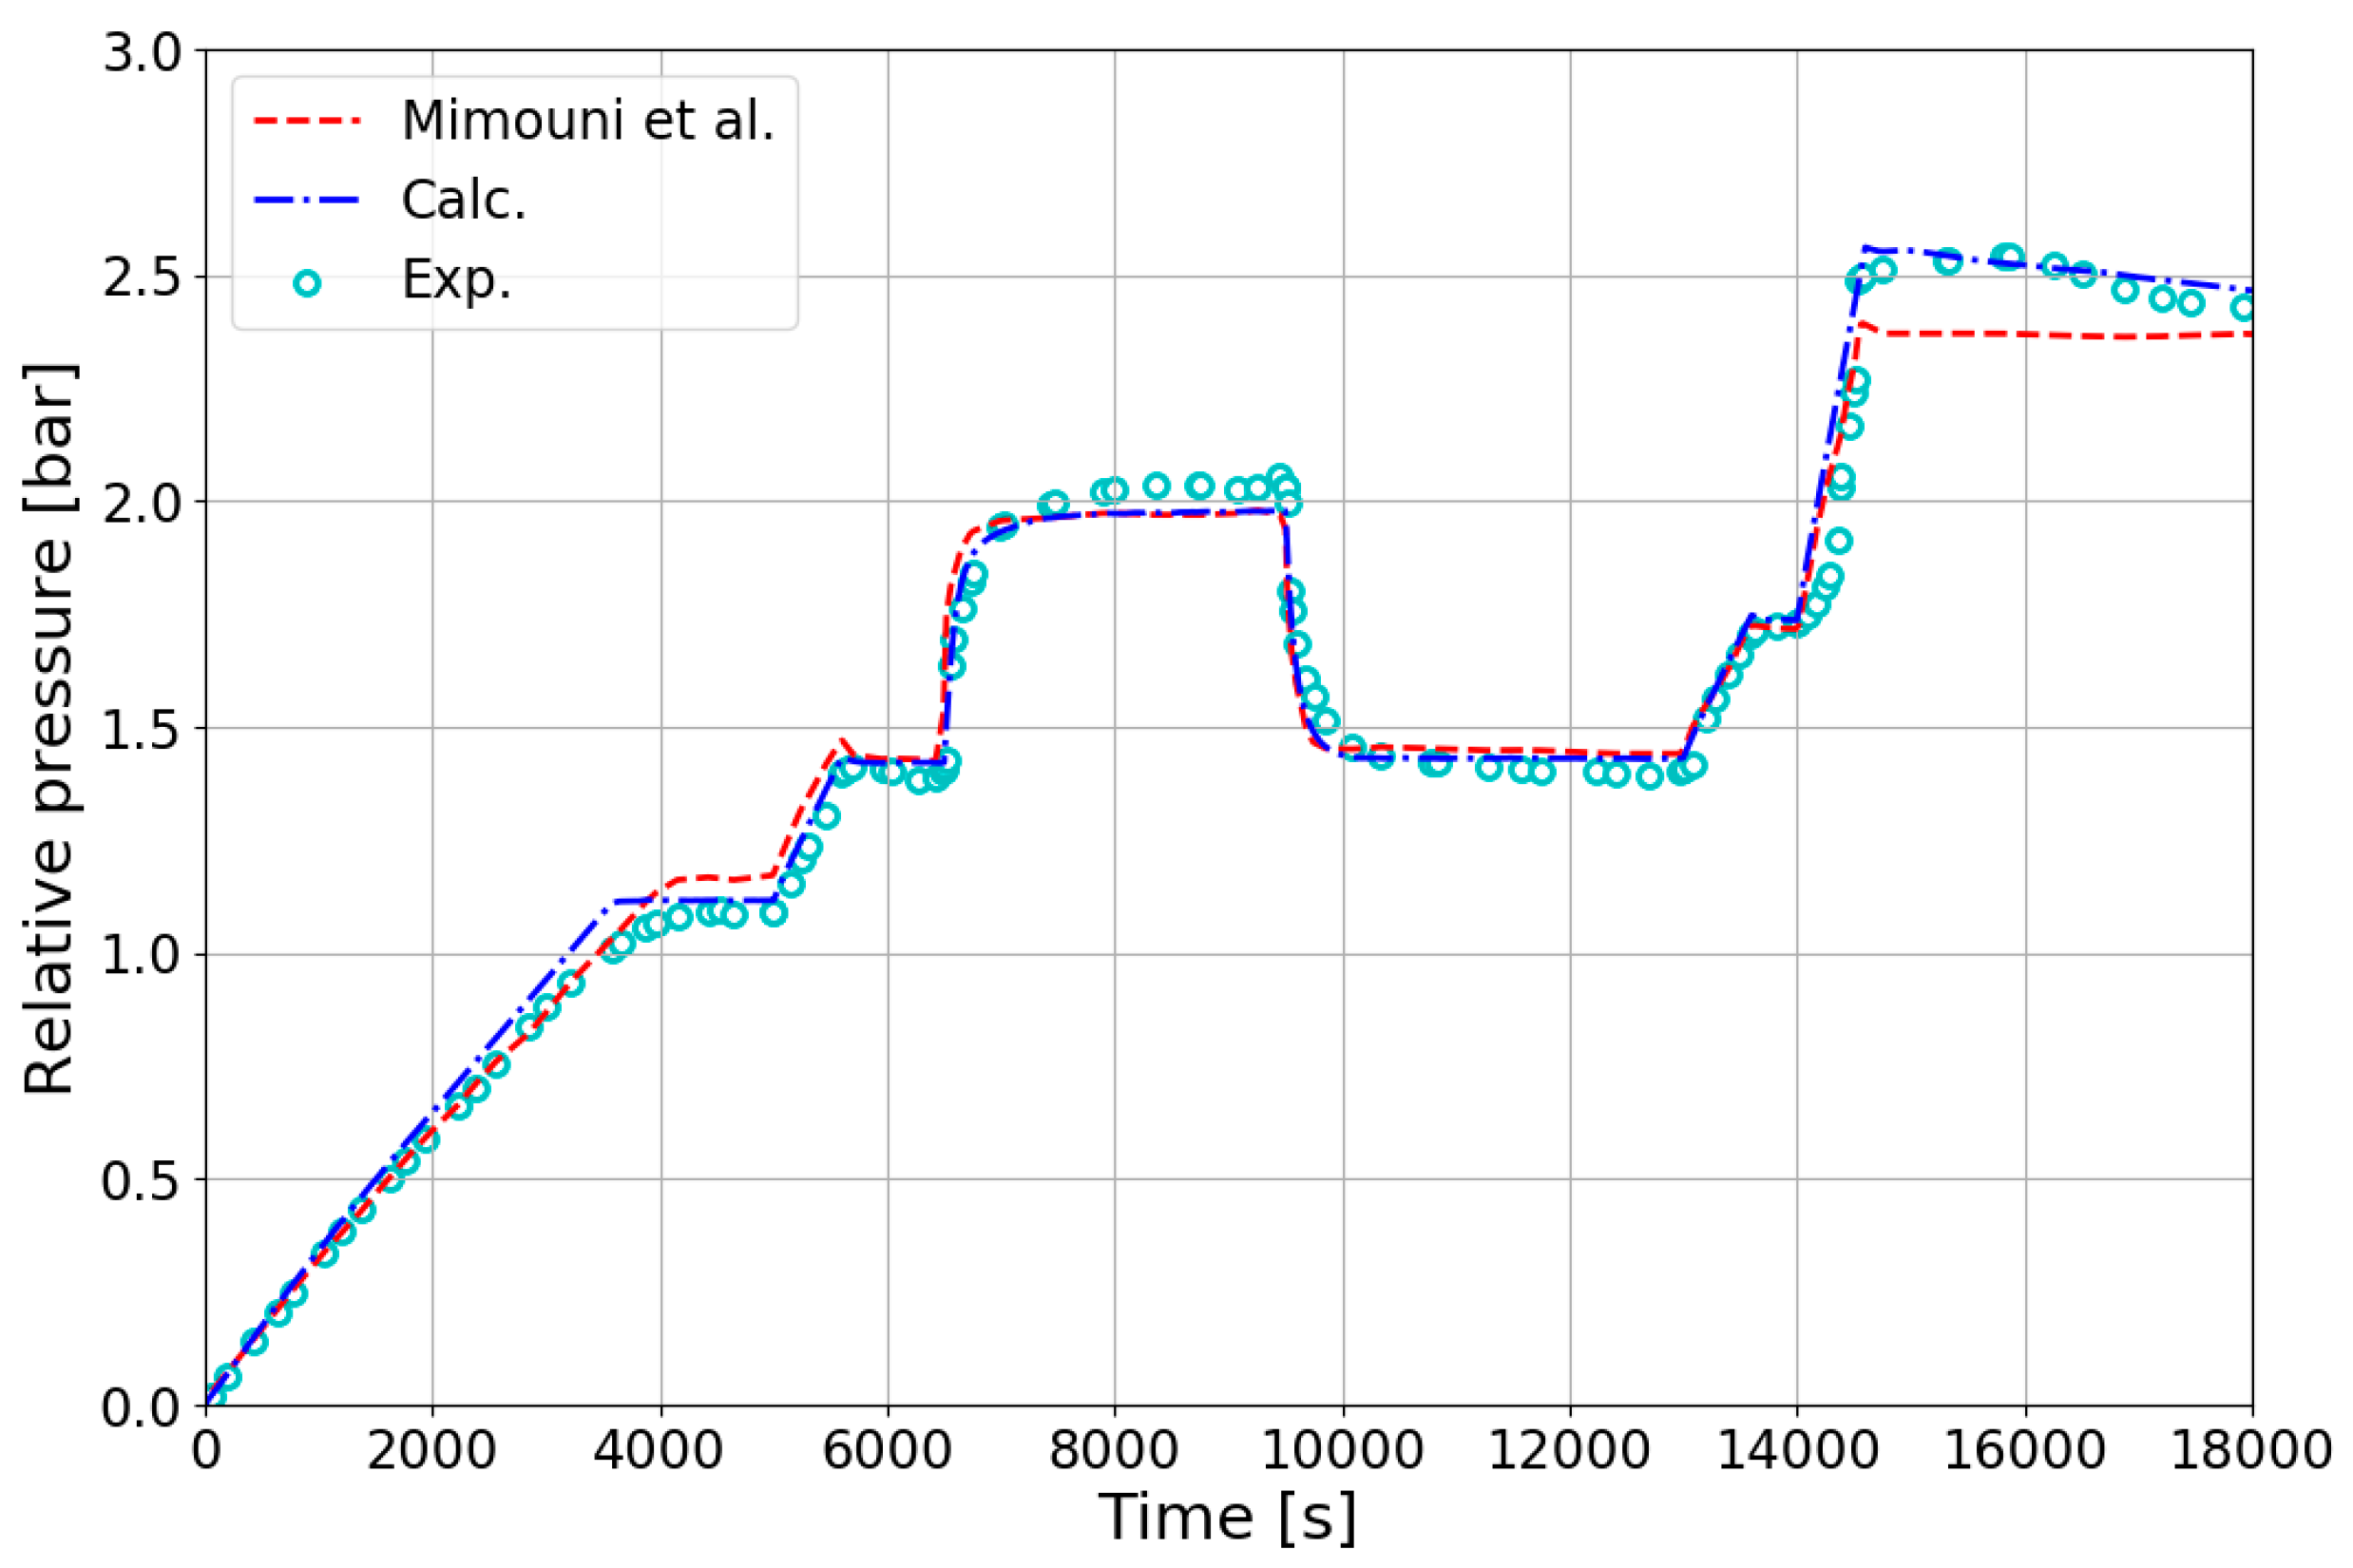
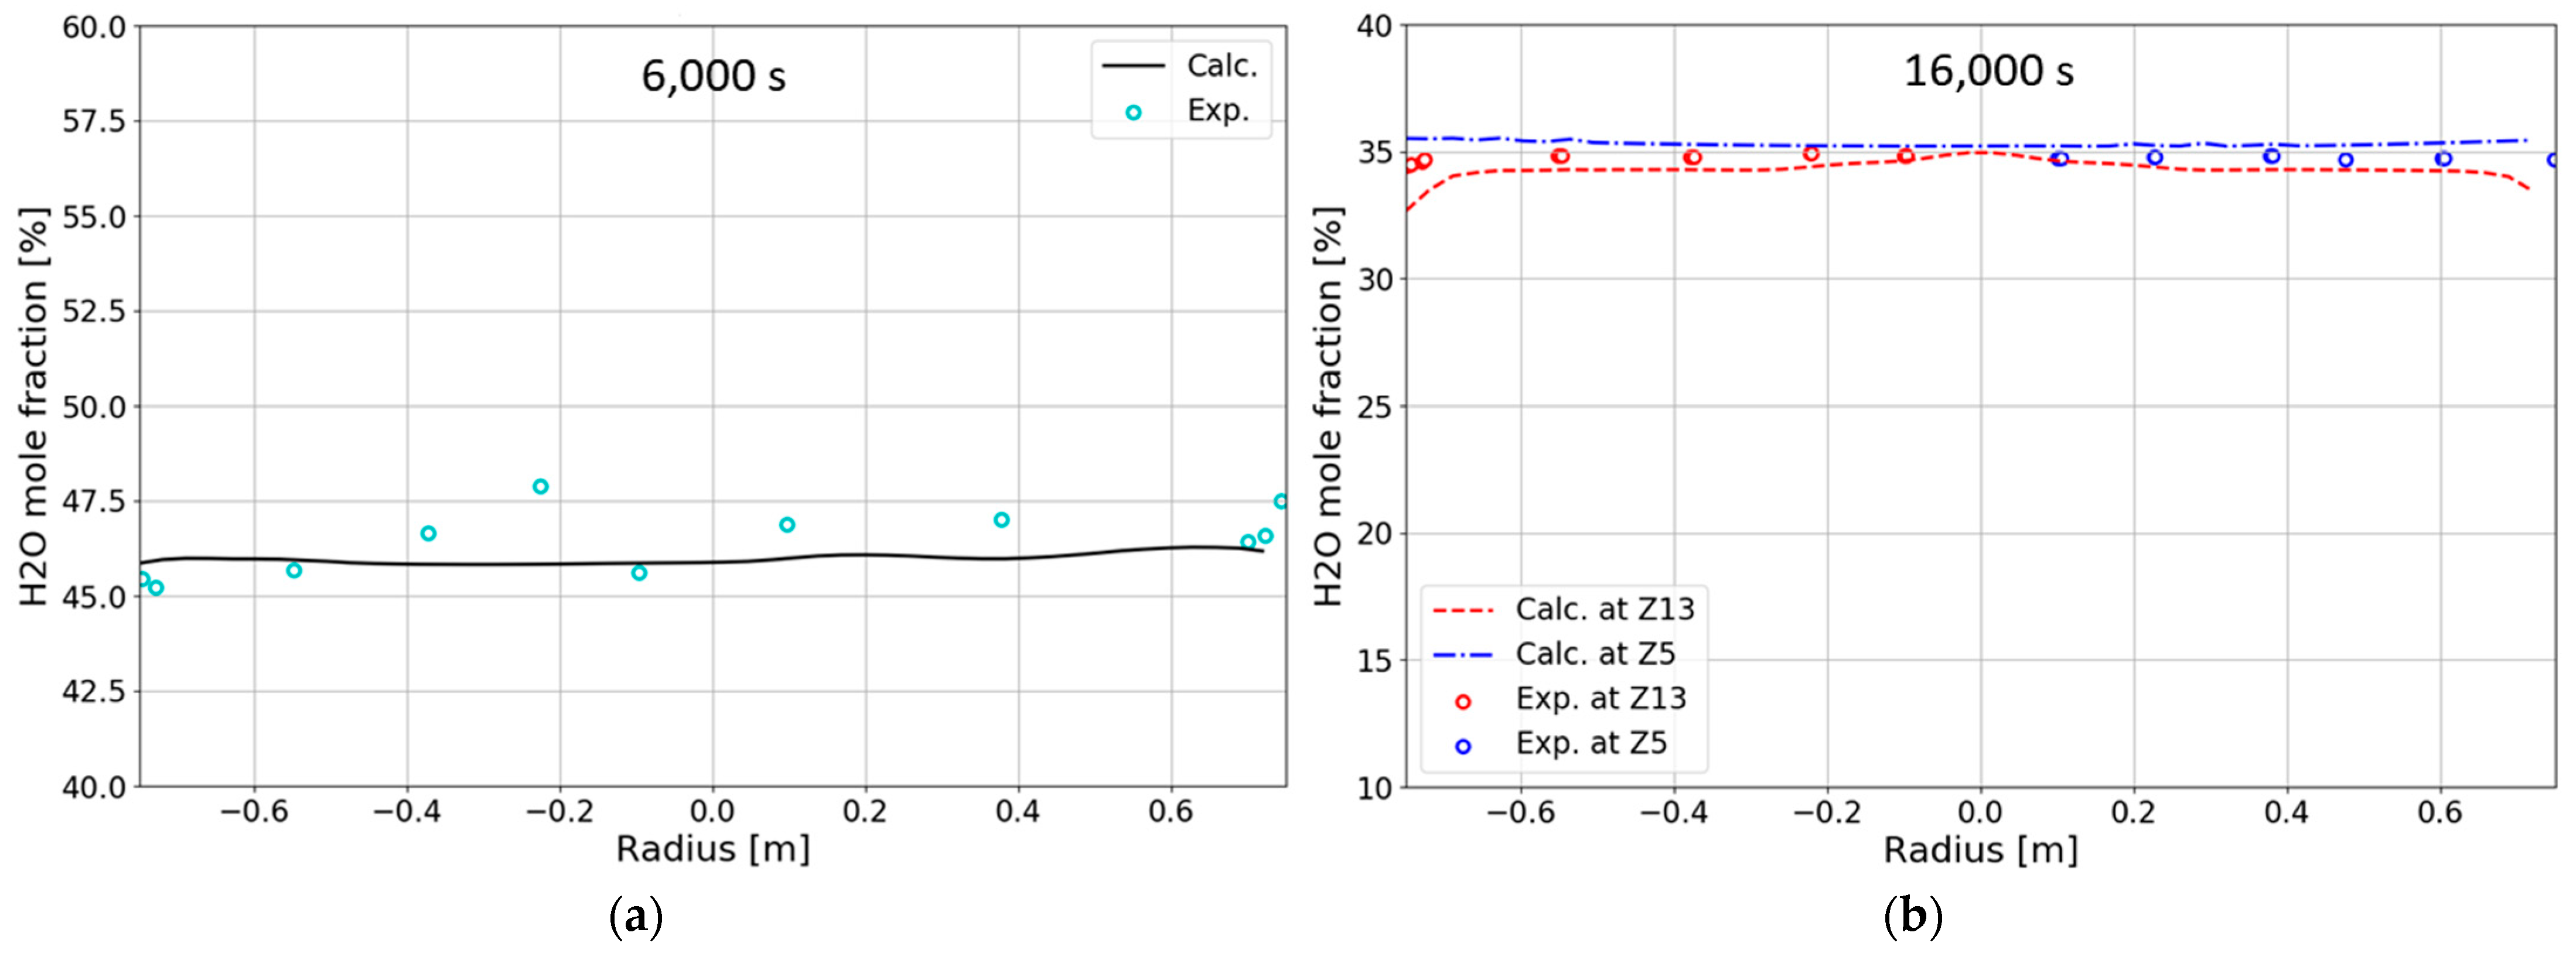
3.1.1. TOSQAN ISP-47 Test Simulation

As shown in Figure 2, the TOSQAN test facility [35] is a cylindrical vessel with an inner diameter of 1.5 m and a height of 4.8 m and includes a sump at the bottom to remove condensate.
The temperature of the outer wall of the pressure vessel is controlled by the oil jackets, and in particular, the temperature of the wall in the middle is lowered to induce condensation of water vapor. A vertical pipe is installed at the center of the vessel to inject water vapor and non-condensable gas (here, air and helium).
The experiment was conducted in a series of phases, and the injection conditions were varied in each phase by changing the injection rate and the injection material. Figure 3 shows the injection rates of the gas species in the TOSQAN ISP-47 test.
For the analysis of the experiment, a grid was generated as shown in Figure 2c, and the wall was composed of three patches considering the condensation wall (upper wall: 122 °C; condensation wall: 101.3 °C; lower wall: 123.5 °C).
Figure 4 shows the temperature distribution within the pressure vessel over time and the iso-concentration surfaces of water vapor and helium obtained from the analysis. Figure 5 shows the calculated pressure compared with the experimental data and the result calculated with NEPTUNE_CFD by Mimouni et al. [35]. It can be seen that the calculated result is similar to the result of Mimouni et al. and the experimental data. Figure 6 compares the water vapor concentration distribution of the calculated results with the experimental results. It is thought that the wall condensation analysis module of the 3D code simulates flow phenomena including water vapor condensation well.

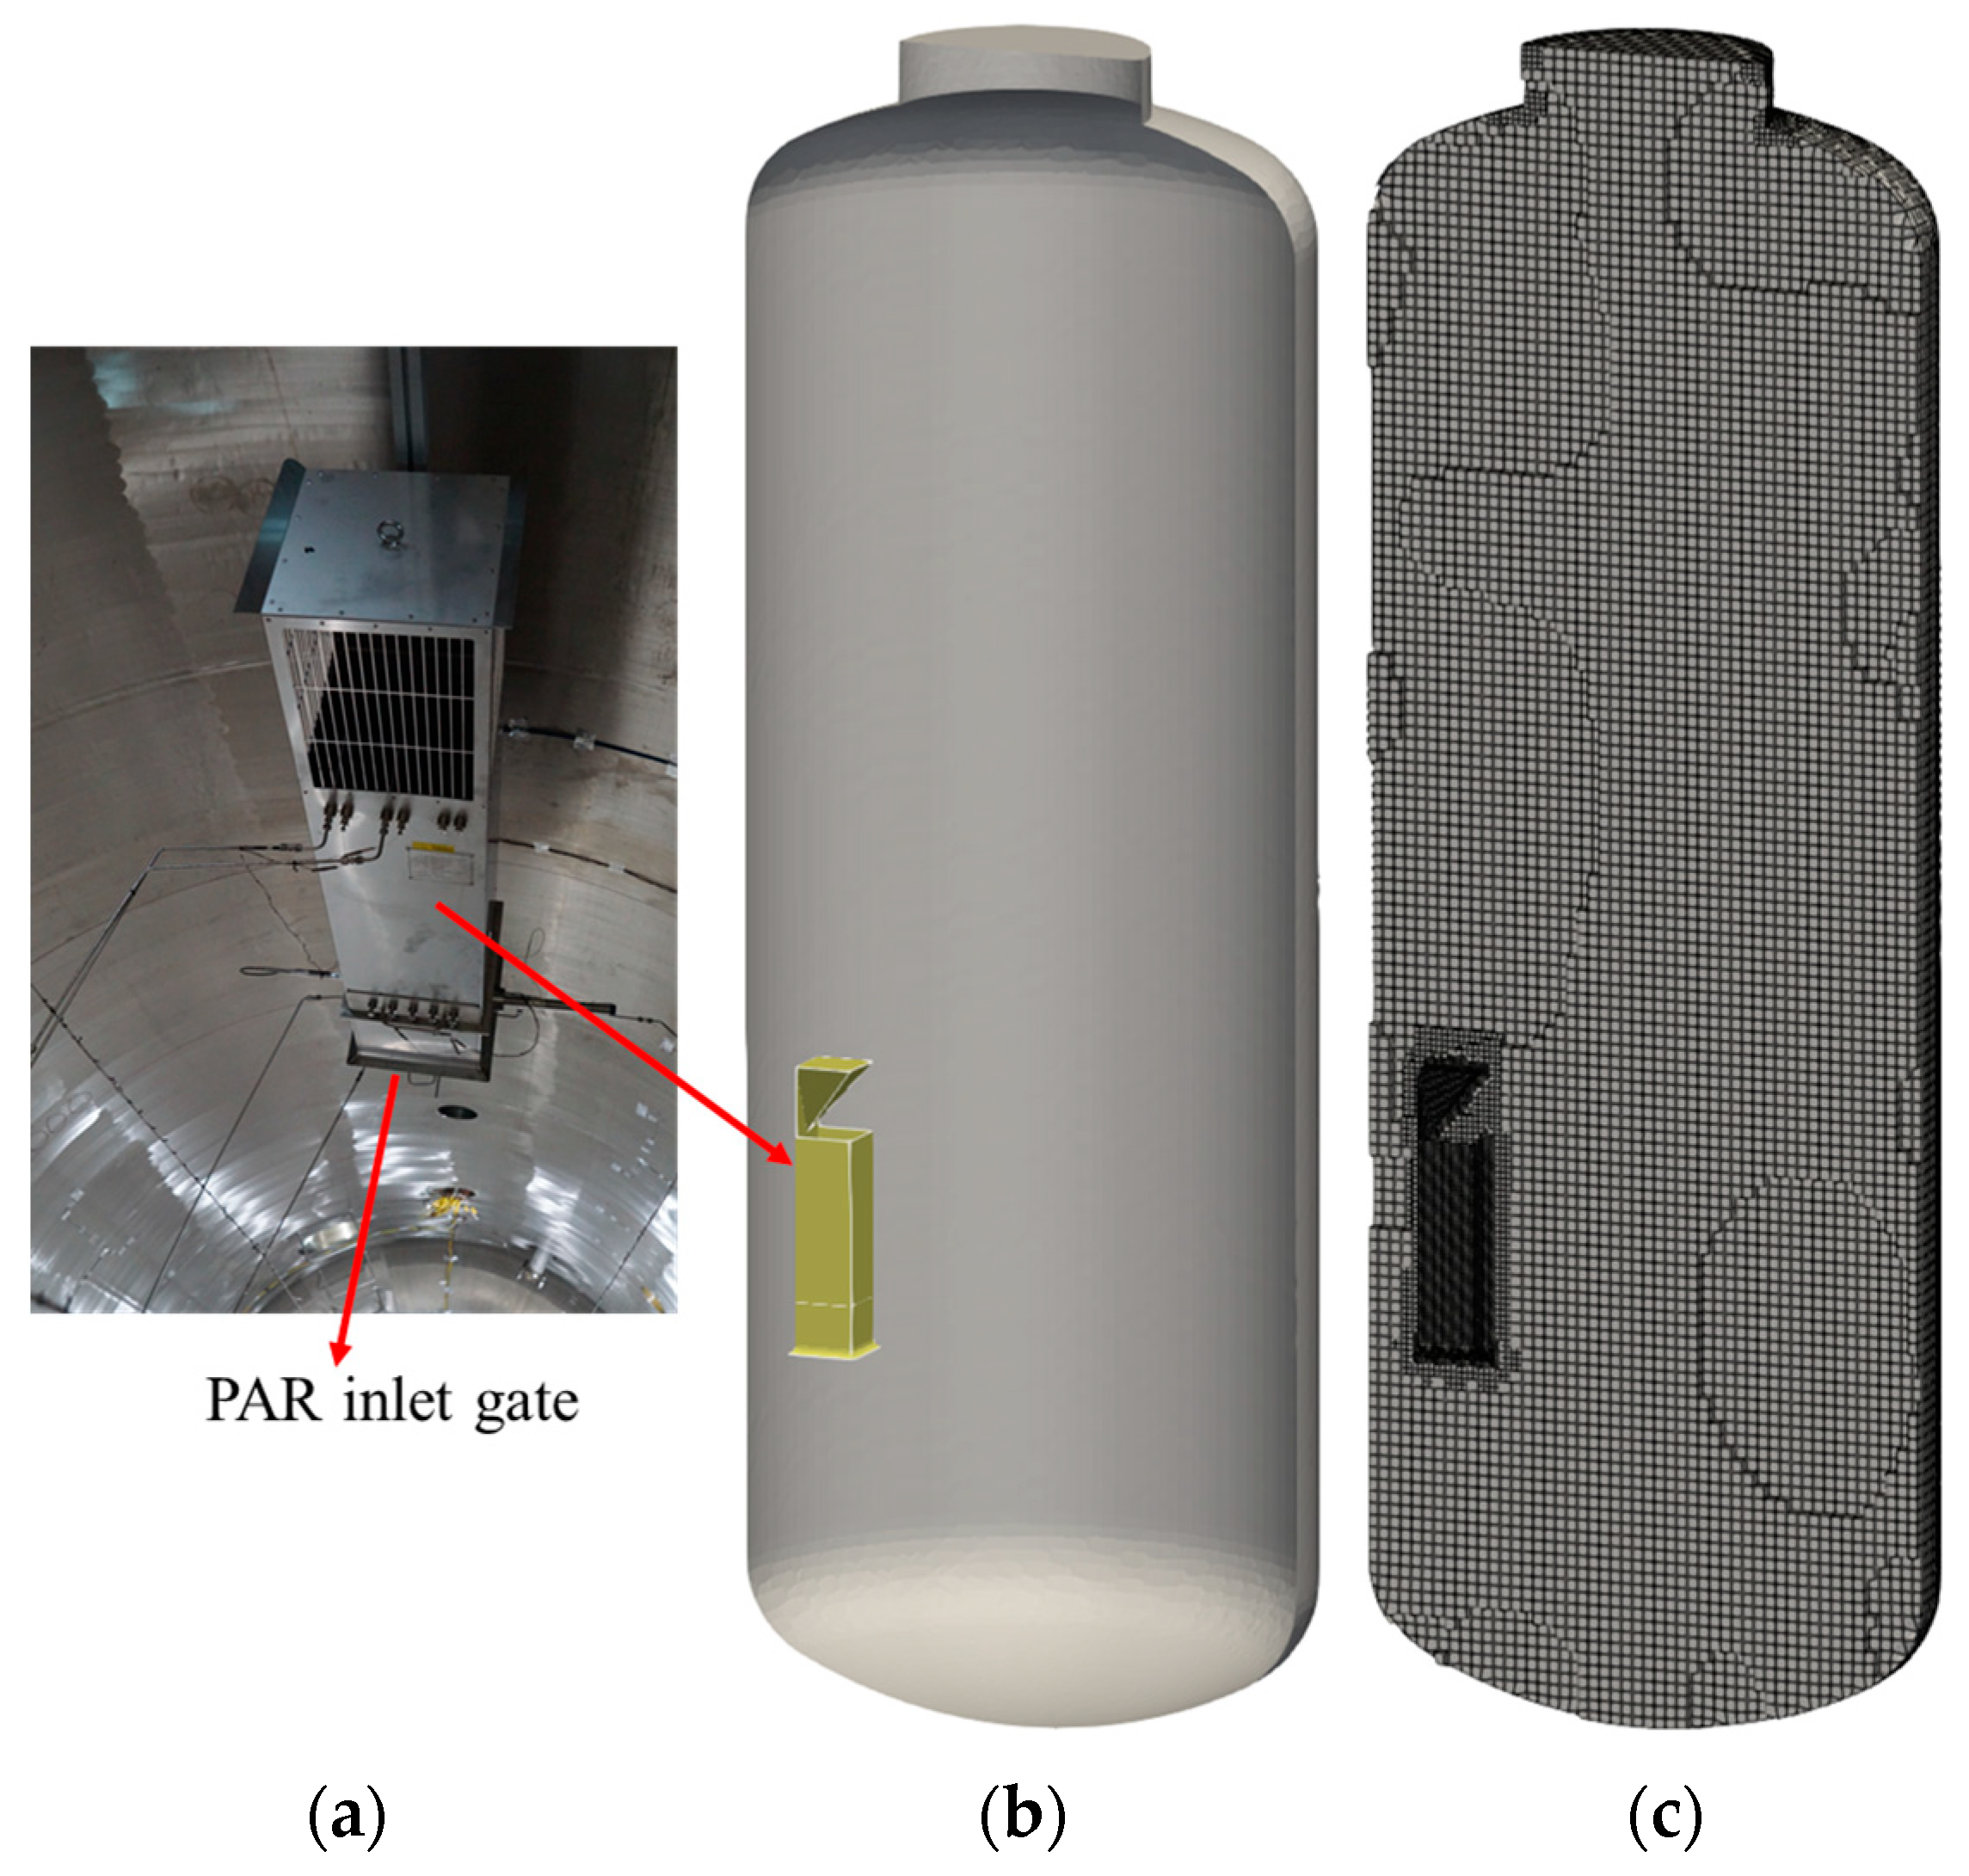
3.1.2. Simulation of PAR Experiments

Internationally, many commercial PARs have been developed and used in nuclear power plants (NPPs). Because PARs are passive hydrogen mitigation devices, their performances depend on the thermal hydraulic conditions surrounding them. The PAR operation can change thermal distribution in a containment and conversely, thermal hydraulic conditions in the containment affect the performance of the PARs. Therefore, it is important to conduct thermal hydraulic experiments related to PARs and verify and improve the PAR model based on the experimental data.
The PAR model implemented in the contain3D code has been applied to simulations of THAI HR tests [36] and SPARC SP tests [37]. In the THAI-1 project, experiments were conducted to evaluate hydrogen recombination characteristics under various thermal and hydraulic conditions using the PARs from AREVA, NIS, and AECL. In this paper, we describe the analysis results of the HR2 test using the AREVA PAR and the HR14 test using the NIS PAR. Figure 7 shows the geometric models and analysis meshes for the HR2 and HR14 tests. Among the features of the HR test facility is that a cylinder is installed in the test vessel to simulate an annular compartment inside a PWR containment, and the PARs are installed adjacent to the outer wall of the inner cylinder. From the figure, it can be seen that the shapes of the PAR housings of AREVA and NIS are very different. In the HR tests, hydrogen was injected through 56 holes in the pipe ring installed above the sump as shown in the figure. The meshes used for the analyses were well generated to resolve the important geometric features of the PAR, inner cylinder, and nozzle and to resolve the wall condensation rate appropriately. A simple mesh dependency test was conducted by doubling the mesh size and it was found that there is little difference in the prediction of the PAR recombination rates.
In the HR tests, hydrogen concentration, gas temperature, pressure, etc., were measured at several measuring points, and the measured values were integrated into the volume of the test vessel to predict the amount of hydrogen remaining in the vessel after being removed by the installed PAR over time. The hydrogen recombination rate of the PAR was obtained using the values measured through sensors installed at the inlet and outlet of the PAR housing. The hydrogen mass and recombination rates were reported in the reference [36]. Figure 8 compares the hydrogen masses remaining in the test vessel and the hydrogen recombination rates obtained from the experiments and numerical simulations. In Figure 8a, the rapid rise in the hydrogen recombination rate at 5640 s is due to hydrogen combustion induced by the PAR. Excluding this, it is thought that the PAR model implemented in the contain3D code well simulates hydrogen recombination characteristics of the AREVA and NIS PARs.
APR1400 adopts KNT PARs as a hydrogen mitigation system. The correlation for the hydrogen recombination rate, which is supplied by KNT, is included in Table 1. To evaluate the hydrogen recombination characteristics of the KNT PAR according to the thermal hydraulic conditions, we performed the SP8 and SP9 experiments using the SPARC test facility.
A feature of the tests is that to minimize errors in integrating the remaining hydrogen mass due to the non-uniform distribution of hydrogen while the hydrogen was being released into the SPARC vessel, a plate-type gate was installed at the inlet of the PAR housing and a fan was operated while the hydrogen jet was mixed well. Figure 9a shows the KNT PAR installed in the vessel. Figure 9b,c are the modeled geometry and computational mesh for the SP8 and SP9 analyses.
In the experiment, after the hydrogen injection was completed and the concentration of hydrogen measured in the pressure vessel was uniformly distributed, the gate installed at the entrance of the PAR was opened through an electric signal.
In Figure 10, the remaining amount of hydrogen and the hydrogen recombination rate of the PAR obtained by the test and the simulation are compared over time. The time of the gate opening is denoted in the figure. It is seen that hydrogen available in the vessel is quickly reduced by the PAR operation. Through this comparison, it can be seen that the PAR model implemented in the contain3D code well simulates the hydrogen recombination characteristics of the KNT PAR except for a short period of the gate opening.

3.2. Application to PWR Containment

The contain3D code validated in this study was applied to evaluate the three-dimensional behavior of hydrogen and water vapor in the APR1400 containment building during severe accidents. APR1400, which has a power generation capacity of 1400 MWe, has two main coolant loops, and each loop consists of one steam generator (SG) and two coolant pumps. The nuclear reactor is located in the center of the containment building, two steam generators are placed symmetrically in line with the reactor, and two coolant pumps are located on the left and right of the steam generator. The containment building of APR1400 consists of cylindrical vertical walls and a hemispherical dome on top, with an inner wall diameter of 22.86 m and a total height of 79.4 m. The geometry modeling, mesh generation, and source modeling for APR1400 were performed and simulations were conducted for two postulated accidents of SBLOCA and SBO.

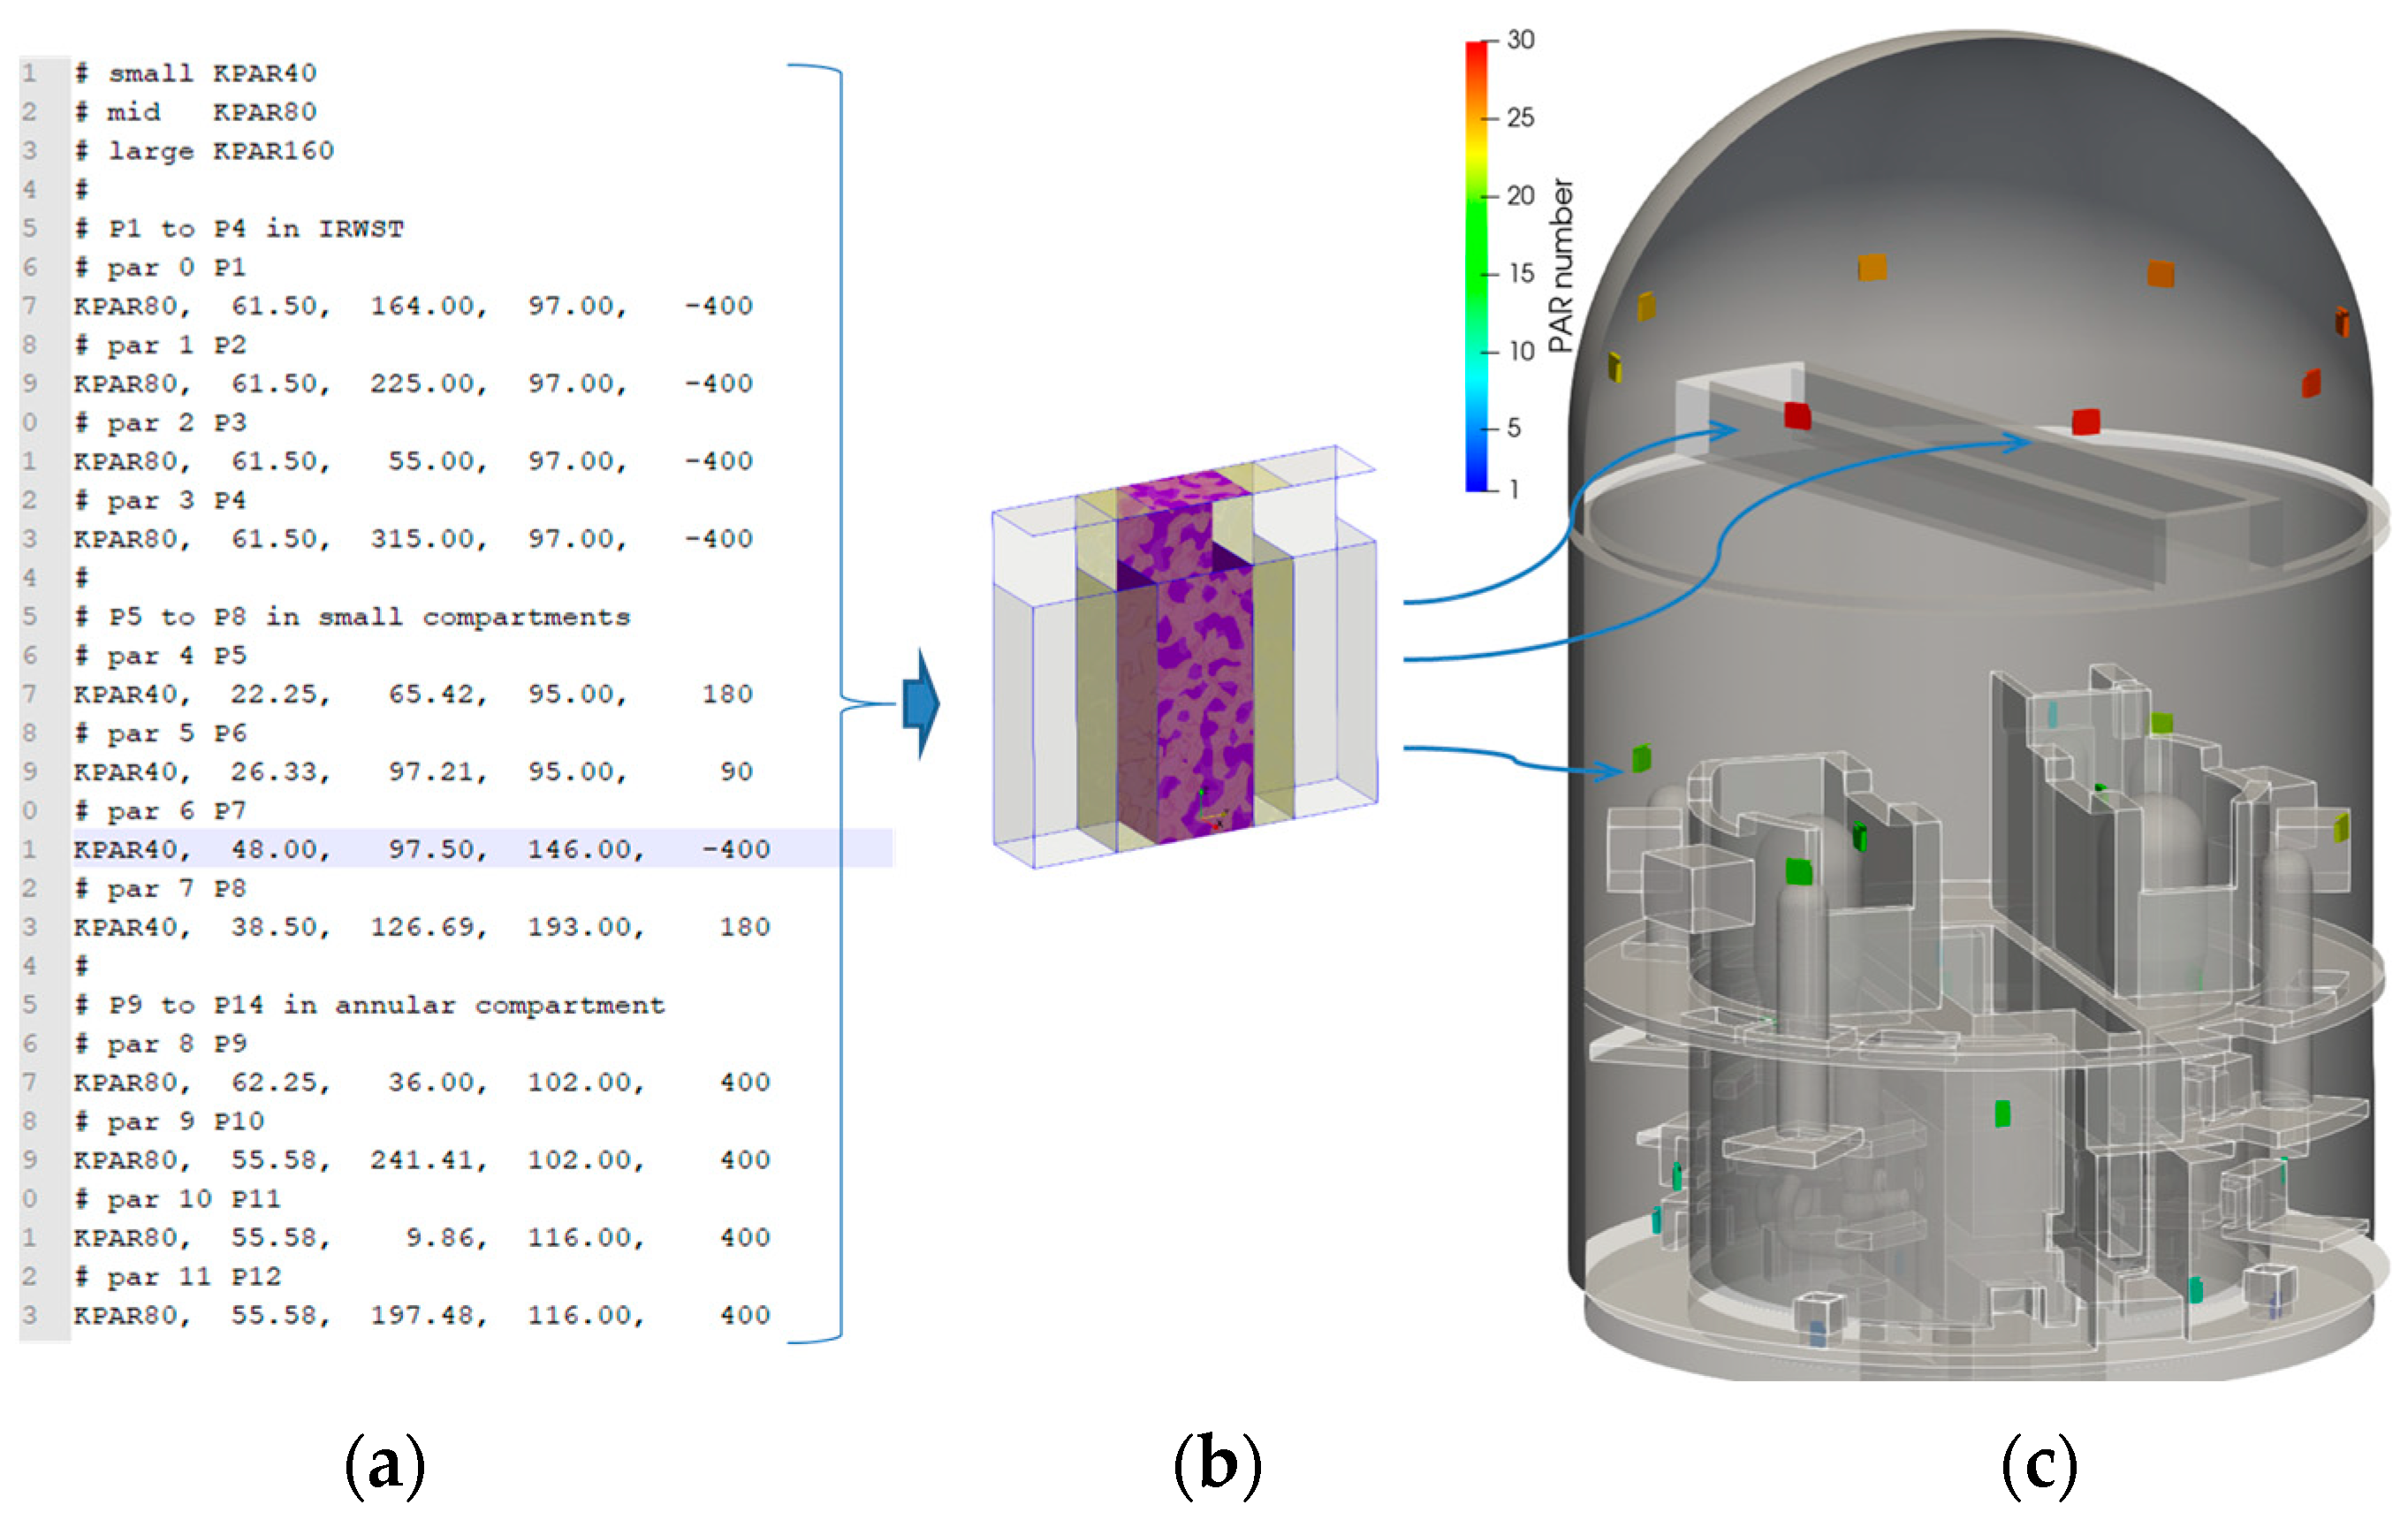
3.2.1. Containment Mesh Generation and Source Modeling

An important factor when modeling a containment building is the level of detail that can be resolved. The reference for the detail of the geometry is the characteristic length to resolve flow features with the analysis code.
In the case of the APR1400 containment with PARs installed, the hydraulic diameter of the PAR inlet can be the characteristic length. Whether to trim or resolve a geometric shape can be determined by the characteristic length. Another important step in geometry modeling is the placement of the PARs in the containment building. In general, PAR is an accident mitigation facility and can be changed during licensing, so its installation location is not included in the containment drawing but is indicated in the form of a table in the accident management or safety analysis report. A python program was developed to automatically place PARs on the computer drawing of the containment. When a table of PAR locations is input to the python program, it sequentially adds a PAR geometry to the containment drawing by finding the shape that fits the PAR model in a database and copying it to its location listed in the table.
Thirty PARs are installed in the APR1400 containment building. Figure 11 schematically shows the process of placing PARs in the digitalized APR1400 containment drawing. The color legend in Figure 11c means the identification numbers of the PARs installed in the containment.
A computational mesh for the APR1400 containment was generated using snappyHexMesh, which is an automatic mesh generator included in OpenFOAM. The numerical solution may be dependent on the mesh characteristics used, among which the number of cells, mesh skewness, and mesh topology were considered in the study.
To evaluate the mesh dependency of the numerical solutions, three meshes were constructed. Figure 12 shows the three meshes tested for solution’s mesh dependency. The meshes in Figure 12a and Figure 12c are generated based on a hexahedral background grid and consist of 680,000 and 1,150,000 cells, respectively. As can be expected, the containment outer wall is cylindrical. A cylindrical mesh can be an option. The mesh in Figure 12b is generated based on a cylindrical background grid. This mesh is the coarsest among them because a 0.3 m annular gap between the containment wall and operating deck is easily resolved in the cylindrical background grid. A simple hydrogen injection and PAR recombination test was conducted to check the mesh dependency of the solution. In this study, mesh dependency was evaluated based on the hydrogen mass remaining in the containment at 1000 s. The difference among the meshes is less than 0.1%. So, Mesh A was chosen for the accident analysis because it results in the fastest running time among the three meshes due to its smaller number of cells and better skewness.
Severe accident scenarios chosen in this study for hydrogen behavior analyses are a SBLOCA and a SBO in APR1400. The accident progressions of APR1400 were calculated by the MELCOR code [38] with an assumption of 100% active core oxidation in the reactor vessel. In the case of the APR1400 nuclear reactor, the total amount of hydrogen generated by 100% oxidation of the active core is approximately 1000 kg. It is still considered conservative that the active core is fully oxidized until the reactor vessel fails. If an accident persists without mitigation, as seen in the case of the Fukushima nuclear accident, the reactor vessel may be damaged. After the reactor vessel is damaged, the molten core relocates on the reactor cavity floor and causes a chemical reaction with the concrete. This is called molten core concrete interaction (MCCI), and depending on accident management, a large amount of water vapor, hydrogen, or carbon monoxide is generated by MCCI. Nuclear energy regulations in most countries stipulate that the average hydrogen concentration in a containment building be less than 10% under 100% active core oxidation conditions. In our opinion, since the generation of combustible gas by MCCI is a distinct issue that can vary depending on MCCI management, we think that it is meaningful to evaluate hydrogen safety in a reactor containment assuming 100% active core oxidation in the reactor vessel. It is also persuasive to consider 100% oxidation of the active core as a conservative point of view because the current oxidation model used in the MELCOR code is not fully validated to apply to debris formed on the core support plate or the lower plenum of the vessel. The MELCOR analyses of the accident scenarios indicate that approximately 500 kg of hydrogen would be produced before pressure vessel failure is reached. The remaining hydrogen mass to satisfy 100% active core oxidation was assumed to be constantly produced in the MELCOR simulation until vessel failure. Figure 13 shows water vapor and hydrogen release rates into the containment during the accident progressions with the assumption of 100% active core oxidation.
The total masses released until the vessel failure are summarized in Table 2. As the SBO accident in APR1400 begins, the water vapor is released into the in-containment refueling water storage tank (IRWST) through the safety depressurization valves. When the core exit temperature reaches 650 °C, the vapor and hydrogen are released into the SG compartment by turning a three-way valve under a severe accident management guide (SAMG). Thus, the amount of water vapor released into the containment in the SBO accident is much less than that of the SBLOCA.

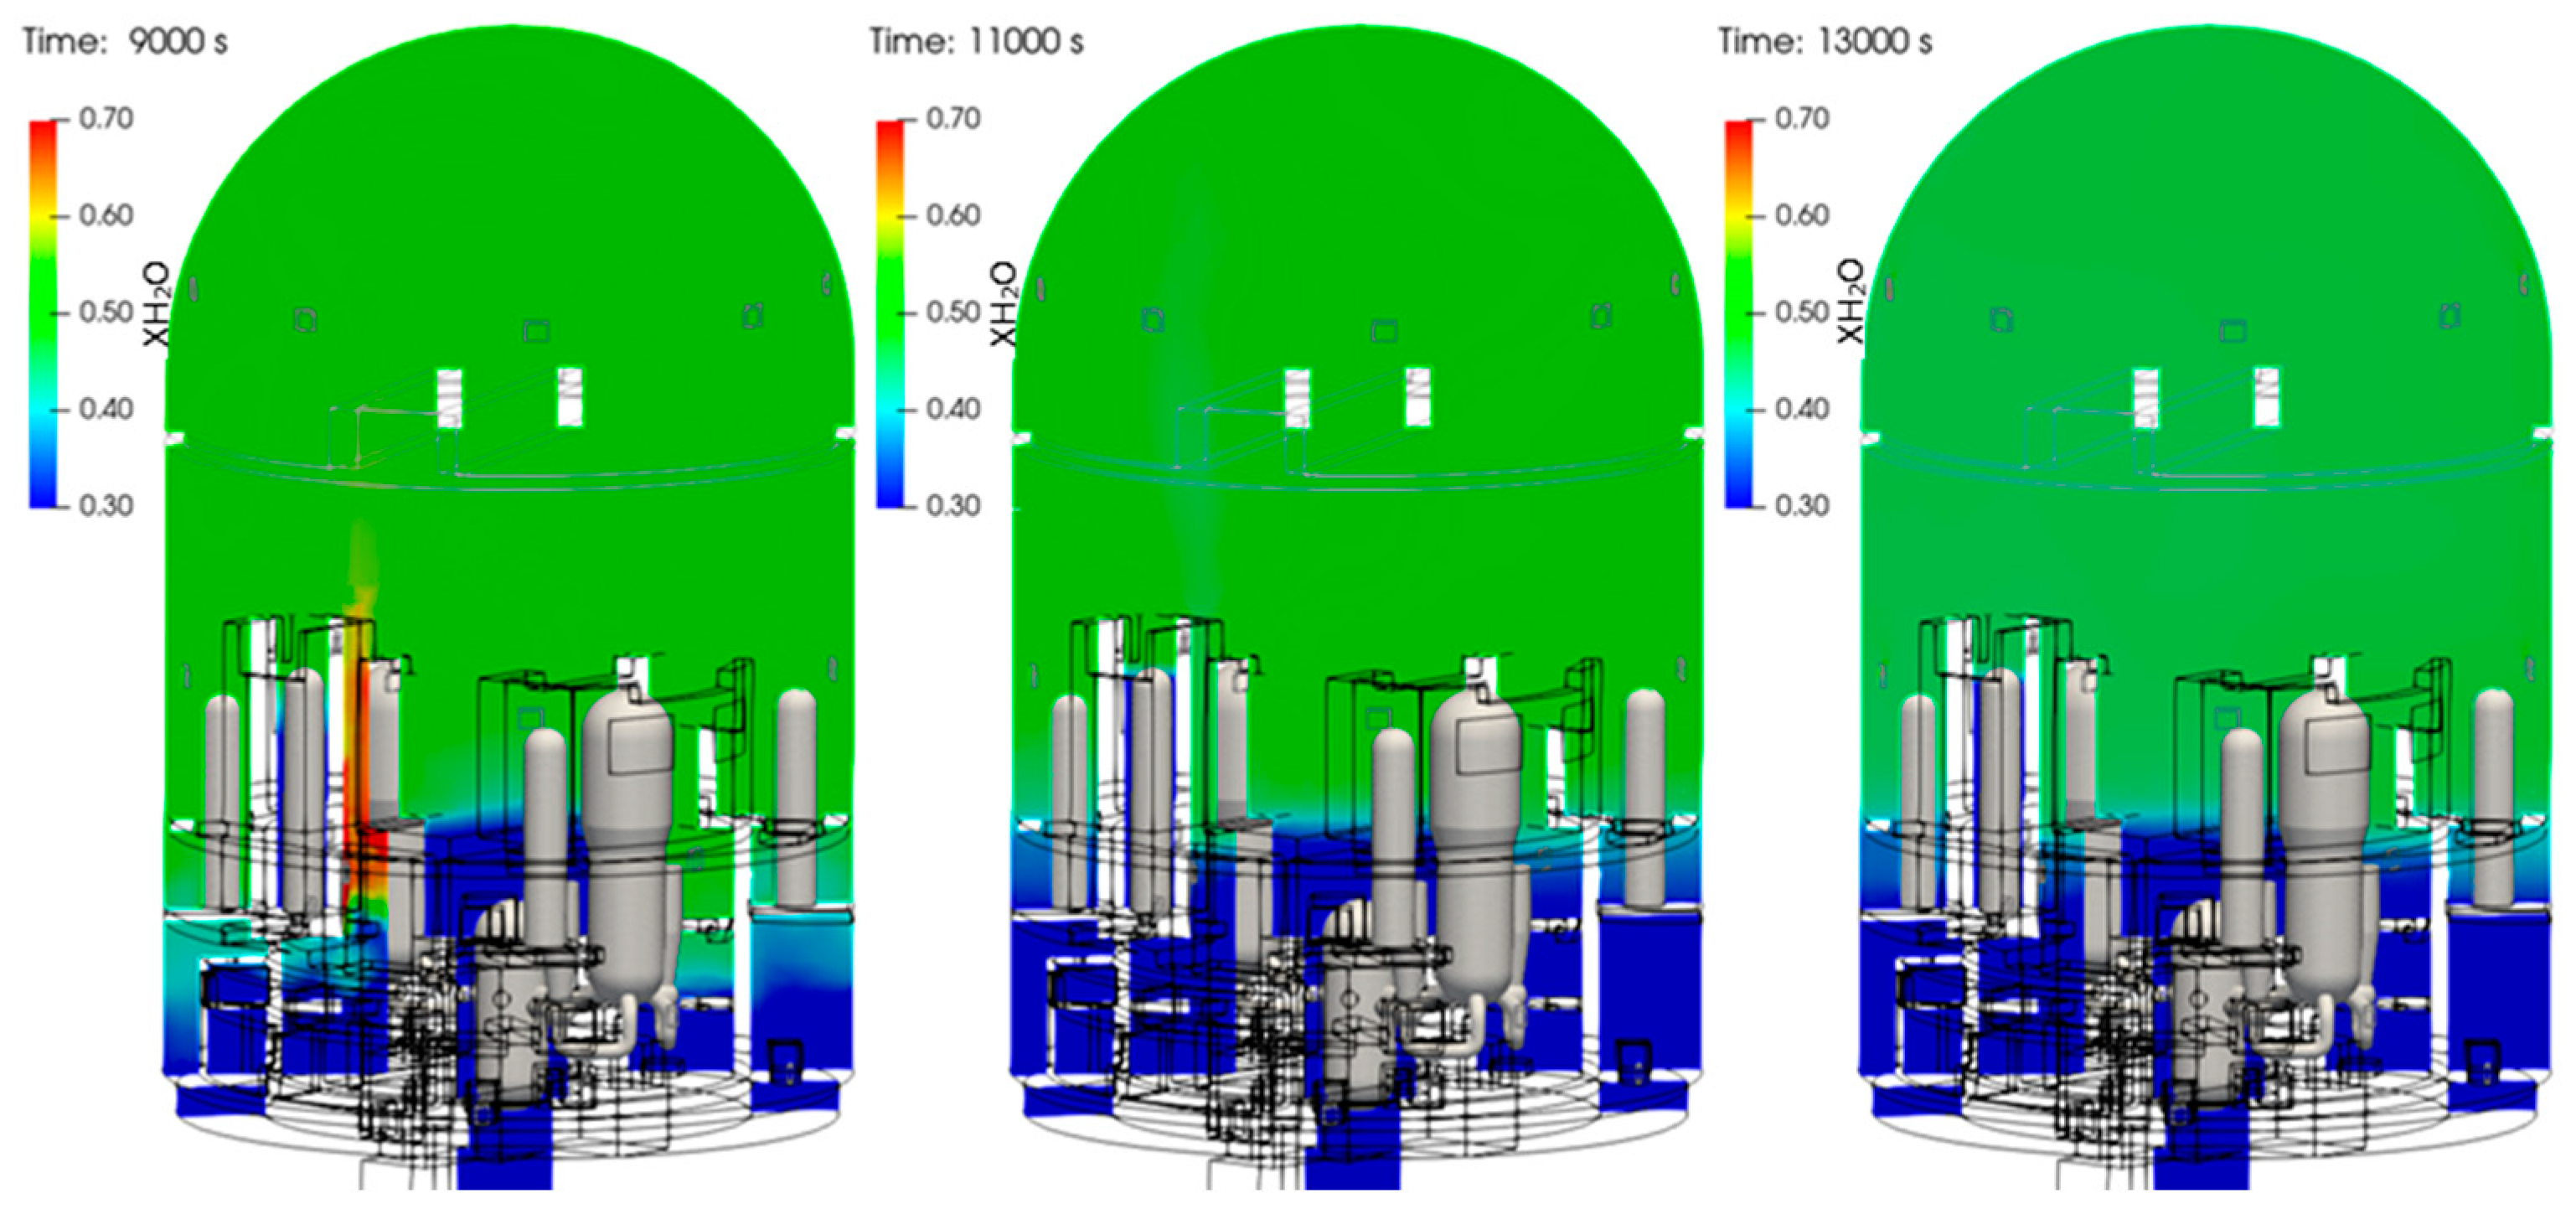
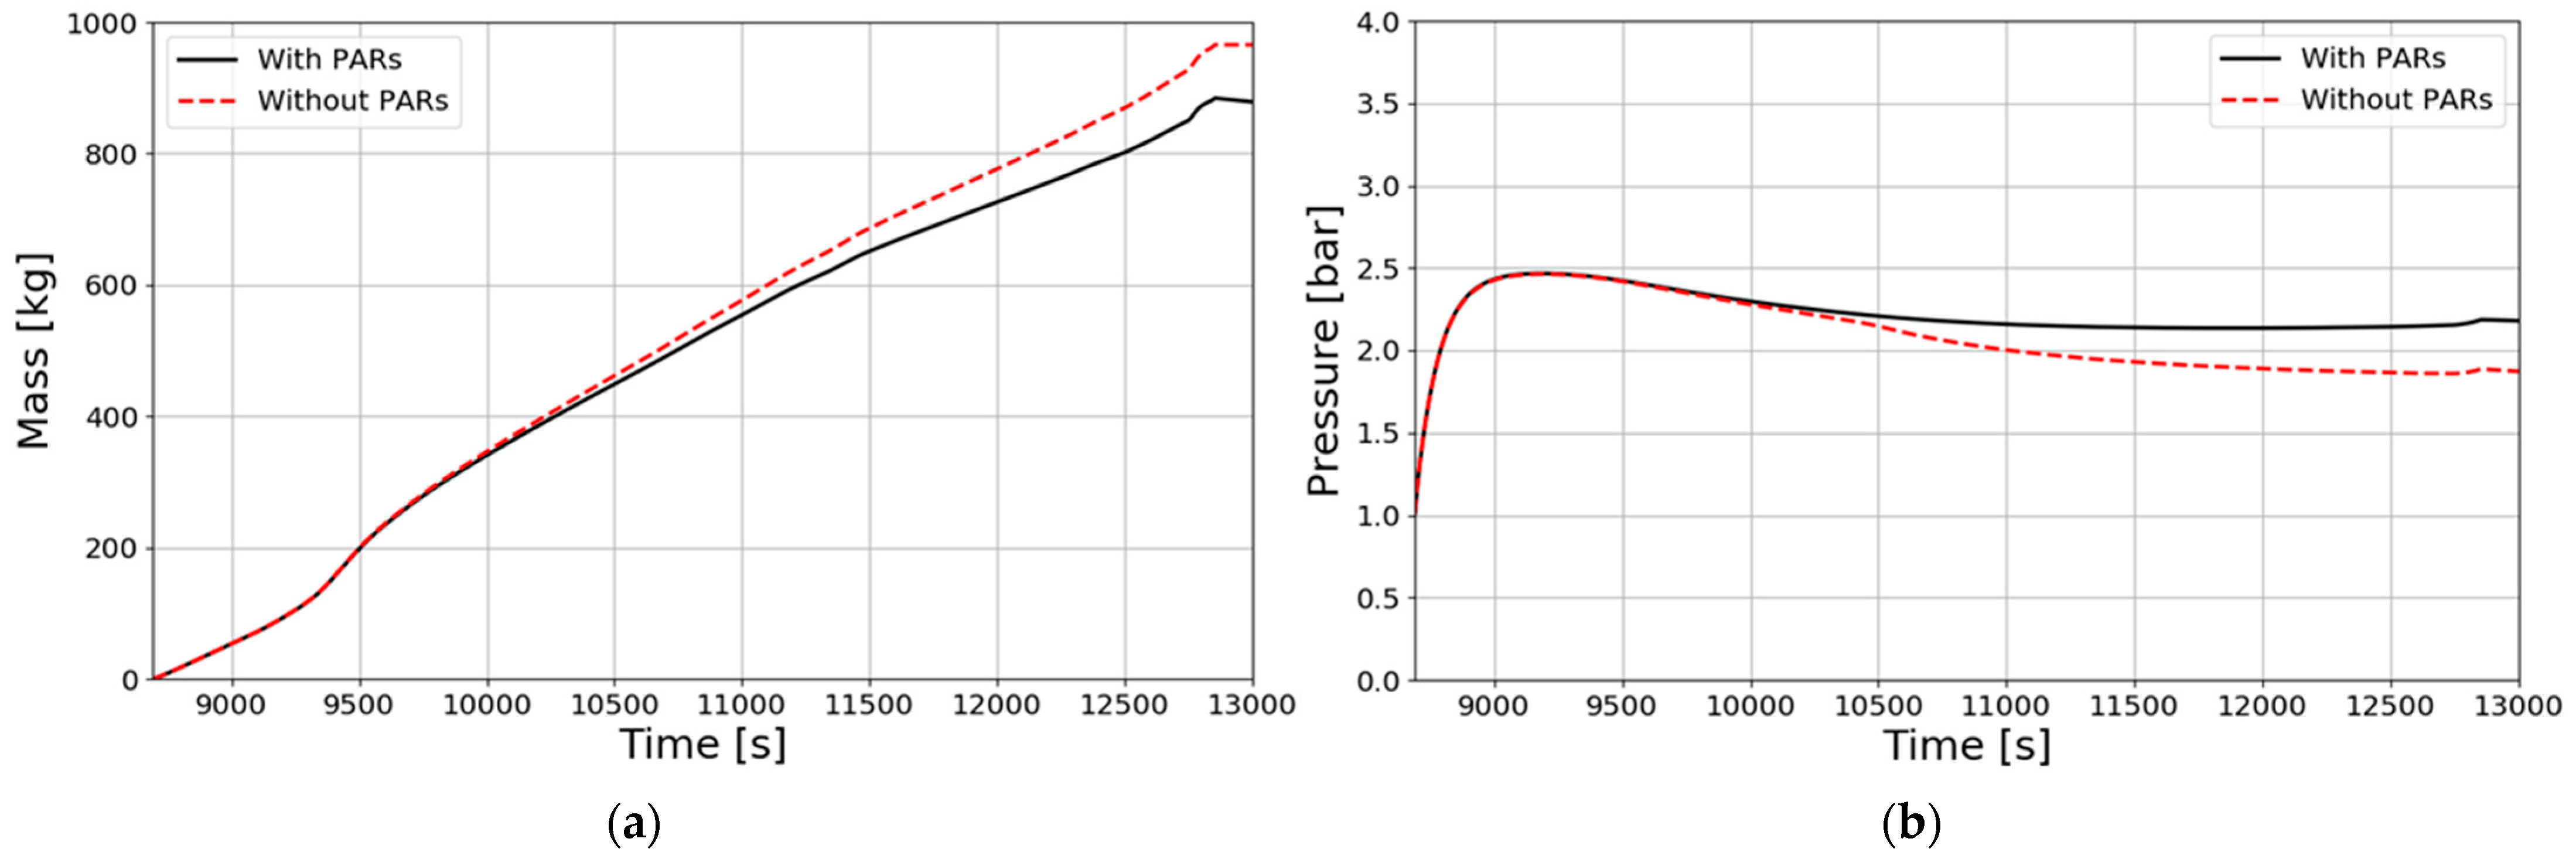
3.2.2. Steam and Hydrogen Behaviors in the Containment

In the early stage of the SBLOCA accident, the water vapor release rate is high due to the high reactor pressure, and the release rate decreases as the accident progresses (Figure 13a).
Figure 14 shows the distribution of water vapor in the containment building over time. At 5000 s after the start of the accident, the water vapor concentration in the containment increases up to 70%. Afterward, as the water vapor release rate decreases, its concentration in the containment decreases due to the reduced mass flow and the vapor condensation.
In the SBLOCA, the flow of the released gas is dependent on the orientation and location of a break. In this study, it was assumed that a small break occurred in the upper part of the cold leg, which resulted in a strong upward flow from the SG compartment to the containment dome, as shown in Figure 15. It is also found in the figure at 9992 s that a flow is developed by the PARs installed below the containment dome.
Figure 16 shows the evolution of hydrogen distribution in the containment over time, with hydrogen being well mixed by the strong upward flow of the released water vapor. In the figure at 9992 s, the hydrogen concentration is higher in the lower part of the containment, which is strongly related to the water vapor distribution.
Figure 17 shows the hydrogen mass inventory in the containment and pressure change over time during the SBLOCA. From 4500 s after the start of the accident, hydrogen is released into the containment, increasing the amount of hydrogen in the containment. Compared to the case where PARs are not installed, the start of hydrogen recombination by the PARs can be estimated from 6000 s. This time lag of 1500 s is called the PAR startup delay. The delay in the PAR operation includes the time it takes for the released hydrogen to arrive by convection at the point where PAR is installed and the time it takes for the PAR’s catalyst to be heated by catalytic reaction. The main reason for the longer delay of the PAR startup during the SBLOCA of APR1400 compared to the PAR experiments shown in Figure 8 is the height of the containment, which is about 10 times larger than the vessel used in the experiment. As shown in Figure 17b, when water vapor begins to release, the containment pressure rises rapidly. In the case without PARs, the pressure gradually decreases after 6000 s, whereas in the case with PARs, the pressure does not decrease due to the heat generated by hydrogen recombination.
As shown in Table 2, the amount of water vapor released into the containment atmosphere was significantly reduced during the SBO accident. Figure 18 shows that there is no significant change in the water vapor distribution over time, and the water vapor concentration is very low compared to the SBLOCA. Additionally, it can be seen that the water vapor distribution in the containment is strongly stratified.
In the SBO accident, water vapor and hydrogen are released through a nozzle horizontally near the top of the steam generator compartment. Because the discharge jet collides with the compartment walls, a significant amount of momentum dissipates and it rises through buoyancy, and the spreading characteristics of the hydrogen are very different than in the SBLOCA accident, as shown in Figure 19. When hydrogen recombination by the PARs progresses, high-temperature exhaust gas is released through the PAR housings and moves upward to the containment dome. Looking at Figure 19, the hydrogen released through the discharge nozzle at 12,500 s does not move upward to the dome region and stagnates in the area below the PARs installed near the dome. This phenomenon is called hydrogen stratification induced by PAR [39]. Fortunately, the right figure shows that the hydrogen cloud created by the PARs spreads slowly over time.
Figure 20 shows the hydrogen mass inventory in the containment and pressure change over time during the SBO accident. The hydrogen inventory in the containment continues to increase and stop at approximately 12,800 s when hydrogen release ceases. Compared to the case without PARs, about 100 kg of hydrogen was removed by the PARs, which is smaller than the SBLOCA case. This is because, in the case of the SBO accident, hydrogen is mainly spread in the upper region of the containment, so the effect of the PARs installed in the lower region is minimal.

4. Discussion

A three-dimensional analysis code of steam and hydrogen behaviors in a containment developed based on OpenFOAM has been validated by simulating steam condensation and hydrogen recombination experiments. By comparing the analysis results with the experimental results, it was confirmed that the wall condensation and PAR recombination modules in the code are reliable. However, because this code relies on the physical modeling of individual phenomena, it is acknowledged that it is necessary to perform the verification analyses of various experiments to increase confidence in the predictability of the code. In this study, the hydrogen behaviors in the APR1400 containment during severe accidents were evaluated using the developed three-dimensional analysis code. Because severe accidents of NPPs last for a very long time, the usability of the code is skeptical, considering the amount of calculation in 3D analysis. However, simulating the three-dimensional behaviors of hydrogen, which is difficult to predict with a lumped-parameter code, can be an important method to evaluate the conservativity of lumped-parameter analysis results. Various efforts are required to improve the computational efficiency of 3D analysis codes.

5. Conclusions

In this study, the three-dimensional analysis code for hydrogen distribution in containment was applied to the APR1400 NPP. Two severe accident scenarios such as SBLOCA and SBO were simulated using the 3D code.
During the SBLOCA, a huge amount of water vapor is released into the containment, and it was confirmed that its thermal hydraulic behaviors directly affect the distribution of the hydrogen released with the steam. A noticeable finding from the 3D analysis is a phenomenon of the reverse stratification of hydrogen in the containment because of smaller steam concentration in the lowest annular region than in the upper region of the containment. Unlike SBLOCA, in the event of the SBO accident, water vapor is initially sparged into the IRWST water through a safety depressurization value and condenses. Afterward, as the core damage progresses, hydrogen and water vapor are released into the SG compartment. Due to the small amount of water vapor released, the pressure of the containment is maintained about 1 bar lower than that of SBLOCA. The 3D analysis showed that hydrogen could not move to the containment dome due to the thermal stratification formed by the operation of the PARs, and a hydrogen cloud developed in the area below the dome.

Author Contributions

Methodology, J.K.; software, J.K.; validation, J.K. and K.L.; writing—original draft preparation, J.K.; writing—review and editing, K.L.; project administration, K.L.; funding acquisition, K.L. All authors have read and agreed to the published version of the manuscript.

Funding

This research was funded by the Korea Foundation of Nuclear Safety (KOFONS) (No. 2106007).

Institutional Review Board Statement

Not applicable.

Informed Consent Statement

Not applicable.

Data Availability Statement

The data presented in this study are available on request from the corresponding author.

Conflicts of Interest

The authors declare no conflicts of interest.

Nomenclature

α Ratio of fog mass-to-gas mass
δ Normal distance from wall to cell center
ρ Density
C p Specific heat
C v Coefficient for transient friction force
C b l k Bulk condensation coefficient
D w Water vapor diffusivity at wall
D Darcy coefficient vector
F Forchheimer coefficient tensor
g Gravity vector
Γ t Turbulent fog diffusivity
h Heat transfer coefficient
h m Mass diffusion coefficient
h s Sensible enthalpy
J Mass diffusion flux vector
k Thermal conductivity
K Kinetic energy ( 1 / 2 ρ U 2 )
m Mass
p Pressure
PrPrandtl number
ϕ p a r Ratio of thermal energy transferred to gas
q w Wall heat flux
q Heat flux vector
R Recombination rate
R Reynolds stress tensor
S Sink or source
ScSchmidt number
T Temperature
T + Dimensionless temperature
t time
U + Dimensionless velocity
u τ Shear velocity
U Velocity vector
Y + Dimensionless distance
Y i Mass fraction of gas species i

References

  1. TEPCO. Fukushima Nuclear Accident Analysis Report. 2012. Available online: http://www.tepco.co.jp/en/press/corp-com/release/betu12_e/images/120620e0104.pdf (accessed on 5 January 2023).
  2. Yanez, J.; Kuznetsov, M.; Souto-Iglesias, A. An analysis of the hydrogen explosion in the Fukushima-Daiichi accident. Int. J. Hydrogen Energy 2015, 40, 8261–8280. [Google Scholar] [CrossRef]
  3. IAEA-TECDOC-1661; Mitigation of Hydrogen Hazards in Severe Accidents in Nuclear Power Plants. IAEA: Vienna, Austria, 2011.
  4. Bentaib, A.; Meynet, N.; Bleyer, A. Overview on Hydrogen Risk Research and Development Activities: Methodology and Open Issues. Nucl. Eng. Technol. 2015, 47, 26–32. [Google Scholar] [CrossRef]
  5. IAEA-TECDOC-1939; Developments in the Analysis and Management of Combustible Gases in Severe Accidents in Water Cooled Reactors Following the Fukushima Daiichi Accident. IAEA: Vienna, Austria, 2020.
  6. Papini, D.; Andreani, M.; Niceno, B.; Prasser, H.-M.; Steiner, P.; Klugel, J.-U. Simulation of hydrogen distribution in the containment during a severe accident with fast hydrogen-steam release. In Proceedings of the International Topical Meeting on Nuclear Reactor Thermal Hydraulics, Chicago, IL, USA, 30 August–4 September 2015. [Google Scholar]
  7. FLUENT User’s Guide; Release 13.0; ANSYS, Inc.: Canonsburg, PA, USA, 2010.
  8. CFX-Solver Theory Guide; Release 12.1; ANSYS, Inc.: Canonsburg, PA, USA, 2009.
  9. Siemens Industries Digital Software. Simcenter STAR-CCM+, version 2023; Siemens: Munich, Germany, 2023. [Google Scholar]
  10. Travis, J.R.; Royl, P.; Xiao, J.; Necker, G.A.; Redlinger, R.; Spore, J.W.; Lam, K.L.; Wilson, T.L.; Müller, C.; Nichols, B.D. GASFLOW: A Computational Fluid Dynamics Code for Gases Aerosols, and Combustion; KIT: Amsterdam, The Netherlands, 2011; Volume 1. [Google Scholar]
  11. Andreani, M.; Smith, B. On the Use of the Standard k-ε Turbulence Model in GOTHIC to Simulate Buoyant Flows with Light Gases. In Proceedings of the 10th International Topical Meeting on Nuclear Reactor Thermal Hydraulics (NURETH-10), Seoul, Republic of Korea, 5–9 October 2003. [Google Scholar]
  12. Kudriakov, S.; Dabbene, F.; Studer, E.; Beccantini, A.; Magnaud, J.P.; Paillere, H.; Bentaib, A.; Bleyer, A.; Malet, J.; Caroli, C. The TONUS CFD Code for Hydrogen Risk Analysis: Physical Models, Numerical Schemes and Validation Matrix. Nucl. Eng. Des. 2008, 238, 551–565. [Google Scholar] [CrossRef]
  13. OpenFOAM: The Open Source CFD Toolbox User Guide, version v2312; OpenCFD Limited: Berkshire, UK, 2023.
  14. Royl, P.; Rochholz, H.; Breitung, W.; Travis, J.R.; Necker, G. Analysis of Steam and Hydrogen Distributions with PAR Mitigation in NPP Containments. Nucl. Eng. Des. 2000, 202, 231–248. [Google Scholar] [CrossRef]
  15. Xiao, J.; Breitung, W.; Kuznetsov, M.; Zhang, H.; Travis, J.R.; Redlinger, R.; Jordan, T. GASFLOW-MPI: A new 3-D parallel All-speed CFD Code for Turbulent Dispersion and Combustion Simulations Part II: First analysis of the hydrogen explosion in Fukushima Daiichi Unit 1. Int. J. Hydrogen Energy 2017, 42, 8369–8381. [Google Scholar] [CrossRef]
  16. Xiong, J.; Yang, Y.; Cheng, X. CFD Application to Hydrogen Risk Analysis and PAR Qualification. Sci. Technol. Nucl. Install. 2009, 2009, 213981. [Google Scholar] [CrossRef]
  17. Martin-Valdepenas, J.M.; Jimenez, M.A.; Martin-Fuertes, F.; Fernandez, J.A. Improvements in a CFD Code for Analysis of Hydrogen Behavior within Containments. Nucl. Eng. Des. 2007, 237, 627–647. [Google Scholar] [CrossRef]
  18. Lopez-Alonso, E.; Papini, D.; Jimenez, G. Hydrogen distribution and Passive Autocatalytic Recombiner (PAR) Mitigation in a PWR-KWU Containment Type. Ann. Nucl. Energy 2017, 109, 600–611. [Google Scholar] [CrossRef]
  19. Kanik, M.E.; Noori-kalkhoran, O.; Fernandez-Cosials, K.; Gei, M. 3D Analysis of Hydrogen Distribution and Its Mitigation Using Passive Autocatalytic Recombiners (PARs) Inside VVER-1000 Containment. Energies 2023, 16, 6612. [Google Scholar] [CrossRef]
  20. Raman, R.K.; Iyer, K.N.; Rao, R.S.; Gaikwad, A.J.; Sharma, S.K. CFD Studies of Hydrogen Distribution in 220 MWe PHWR Containment. Nucl. Eng. Des. 2022, 396, 111898. [Google Scholar] [CrossRef]
  21. Kelm, S.; Kampili, M.; Liu, X.; George, A.; Schumacher, D.; Druska, C.; Struth, S.; Kuhr, A.; Ramacher, L.; Allelein, H.-J.; et al. The Tailored CFD Package containment FOAM for Analysis of Containment Atmosphere Mixing, H2/CO Mitigation and Aerosol Transport. Fluid 2021, 6, 100. [Google Scholar] [CrossRef]
  22. Kim, J.; Jung, J.; Kim, D. Methodology Development for Evaluation of Hydrogen Safety in a NPP Containment using OpenFOAM. In Proceedings of the Technical Meeting on Hydrogen Management in Severe Accidents, Vienna, Austria, 25–28 September 2018. [Google Scholar]
  23. Kim, J. Modeling and Validation of Steam Condensation for Containment Thermal Hydraulic Analysis during a Severe Accident. In Proceedings of the Transactions of the Korean Nuclear Society Spring Meeting, Jeju, Republic of Korea, 8–10 May 2024; Korean Nuclear Society: Daejeon, Republic of Korea, 2024. [Google Scholar]
  24. Status Report 83—Advanced Power Reactor 1400 MWe (APR1400); KHNP: Gyeongju, Republic of Korea, 2011.
  25. Gerber, A.G.; Kermani, M.J. A pressure Based Eulerian–Eulerian Multi-phase Model for Non-equilibrium Condensation in Transonic Steam Flow. Int. J. Heat Mass Transf. 2004, 47, 2217–2231. [Google Scholar] [CrossRef]
  26. Chilton, T.H.; Colburn, A.P. Mass Transfer (absorption) coefficients Prediction from Data on Heat Transfer and Fluid Flow. Ind. Eng. Chem. 1934, 26, 1183–1187. [Google Scholar] [CrossRef]
  27. Jayatilleke, C.L.V. The Influence of Prandtl Number and Surface Roughness on the Resistance of the Laminar Sublayer to Momentum and Heat Transfer. Prog. Heat Mass Transf. 1969, 1, 193–321. [Google Scholar]
  28. Halouane, Y.; Dehbi, A. CFD Prediction of Hydrogen Passive Autocatalytic Recombiner Performance under Counter-current Flow Conditions. Int. J. Hydrogen Energy 2020, 45, 10247–10256. [Google Scholar] [CrossRef]
  29. Kelm, S.; Jahn, W.; Reinecke, E.-A. Operational Behaviour of Catalytic Recombiners Experimental Results and Modelling Approaches. In Proceedings of the OECD/NEA Workshop on the Experiments and CFD Code Application to Nuclear Reactor Safety, Grenoble, France, 10–12 September 2008. [Google Scholar]
  30. Bachellerie, E.; Arnould, F.; Auglaire, N.; de Boeck, B.; Braillard, O.; Eckardt, B.; Ferroni, F.; Moffett, R. Generic Approach for Designing and Implementing a Pass Autocatalytic Recombiner PAR-System in Nuclear Power Plant Containments. Nucl. Eng. Des. 2003, 221, 151–165. [Google Scholar] [CrossRef]
  31. Park, J.W.; Koh, B.R.; Suh, K.Y. Demonstrative Testing of Honeycomb Passive Autocatalytic Recombiner for Nuclear Power Plant. Nucl. Eng. Des. 2011, 241, 4280–4288. [Google Scholar] [CrossRef]
  32. Kim, C.H.; Sung, J.J.; Ha, S.J.; Yeo, I.S. Analysis Method for the Design of a Hydrogen Mitigation System with Passive Autocatalytic Recombiners in OPR1000, PBNC2014-072. In Proceedings of the 19th Pacific Basin Nuclear Conference (PBNC 2014), Vancouver, BC, Canada, 24–28 August 2014. [Google Scholar]
  33. Burcharth, H.F.; Andersen, O.H. On the One-dimensional Steady and Unsteady Porous Flow Equations. Coast. Eng. 1995, 24, 233–257. [Google Scholar] [CrossRef]
  34. Devolder, B.; Troch, P.; Rauwoens, P. Performance of a buoyancy-modified k-ω and k-ω SST turbulence model for simulating wave breaking under regular waves using OpenFOAM. Coast. Eng. 2018, 138, 49–65. [Google Scholar] [CrossRef]
  35. Mimouni, S.; Mechitoua, N.; Foissac, A.; Hassanaly, M.; Ouraou, M. CFD Modeling of Wall Steam Condensation: Two-Phase Flow Approach versus Homogeneous Flow Approach. Sci. Technol. Nucl. Install. 2011, 1, 941239. [Google Scholar] [CrossRef]
  36. Kanzleiter, T.; Gupta, S.; Fischer, K.; Ahrens, G.; Langer, G.; Kuhnel, A.; Poss, G.; Langrock, G.; Funke, F. Hydrogen and Fission Product Issues Relevant for Containment Safety Assessment under Severe Accident Conditions; Reactor Safety Research Project 1501326, OECD-NEA THAI Project; OECD: Paris, France, 2010. [Google Scholar]
  37. Kim, J.; Jung, J. Evaluation of Hydrogen Recombination Characteristics of a PAR using SPARC PAR Experimental Results. Nucl. Eng. Technol. 2023, 55, 4382–4394. [Google Scholar] [CrossRef]
  38. Gauntt, R.O.; Cash, J.E.; Cole, R.K.; Erickson, C.M.; Humphries, L.L.; Rodriguez, S.B.; Young, M.F. MELCOR Computer Code Manuals; Reference Manuals Version 1.8.6; Office of Nuclear Regulatory Research, U.S. Nuclear Regulatory Commission: Washington, DC, USA, 2005; Volume 2, Rev. 3, NUREG/CR-6119, SAND 2005-5713.
  39. Kim, J.; Hong, S.; Park, K.H.; Kim, J.H.; Oh, J.Y. Experimental Study on a Hydrogen Stratification Induced by PARs Installed in a Containment. Energies 2020, 13, 5552. [Google Scholar] [CrossRef]
Figure 1. One-dimensional virtual mesh for wall heat conduction model.
Applsci 14 06695 g001
Figure 2. (a) Schematic diagram of the TOSQAN test facility; (b) geometry modeling; (c) mesh generation for test simulation.
Applsci 14 06695 g002
Figure 3. TOSQAN ISP-47 test conditions [23].
Applsci 14 06695 g003
Figure 4. Change in temperature distribution in the TOSQAN test vessel over time.
Applsci 14 06695 g004
Figure 5. Comparison of pressure change over time for the TOSQAN ISP-47 test [35].
Applsci 14 06695 g005
Figure 6. Distribution of water vapor concentration in the radial direction: (a) at 6000 s; (b) at 16,000 s.
Applsci 14 06695 g006
Figure 7. (a) Geometry modeling of the THAI HR2 test; (b) mesh for HR2 simulation; (c) geometry modeling of the THAI HR14 test; (d) mesh for HR14 simulation.
Applsci 14 06695 g007
Figure 8. Hydrogen mass remaining in the test vessel and recombination rate of: (a) the HR2 test simulation with the AREVA correlation; (b) the HR14 test simulation with the NIS correlation.
Applsci 14 06695 g008
Figure 9. SPARC SP8 and SP9 test: (a) KNT-40 PAR installed in the test vessel; (b) geometry modeling; (c) mesh generated for simulation.
Applsci 14 06695 g009
Figure 10. Hydrogen mass remaining in the test vessel and recombination rate of: (a) the SPARC SP8 test; (b) the SP9 test simulation with the KNT correlation.
Applsci 14 06695 g010
Figure 11. Geometry modeling of the PARs installed in the APR1400 containment: (a) list of PAR locations; (b) database of PAR geometries; (c) PAR geometries copied at the specified locations.
Applsci 14 06695 g011
Figure 12. Computational mesh for the APR1400 containment: (a) Mesh A with 680,000 cells using a hexahedral background grid; (b) Mesh B with 540,000 cells using a cylindrical background mesh; (c) Mesh C with 1,150,000 cells using a hexahedral background mesh.
Applsci 14 06695 g012
Figure 13. Water vapor and hydrogen release rates in the case of: (a) APR1400 SBLOCA; (b) APR1400 SBO accident.
Applsci 14 06695 g013
Figure 14. Change in water vapor distribution during the SBLOCA in the APR1400 containment.
Applsci 14 06695 g014
Figure 15. Change in flow field during the SBLOCA in the APR1400 containment.
Applsci 14 06695 g015
Figure 16. Change in hydrogen distribution during the SBLOCA in the APR1400 containment.
Applsci 14 06695 g016
Figure 17. Simulation results for the SBLOCA accident: (a) change in hydrogen mass inventory; (b) change in containment pressure.
Applsci 14 06695 g017
Figure 18. Change in water vapor distribution during the SBO in the APR1400 containment.
Applsci 14 06695 g018
Figure 19. Change in hydrogen distribution during the SBO in the APR1400 containment.
Applsci 14 06695 g019
Figure 20. Simulation results for the SBO accident: (a) change in hydrogen mass inventory; (b) change in containment pressure.
Applsci 14 06695 g020
Table 1. Hydrogen depletion correlations of commercial PARs [29,30,31,32].
PAR VendorPAR CorrelationUnit
AREVA R = η x m i n A × p + B t a n h 100 x m i n , l i m X[-], p[bar]
AECL R = f s i z e k a 1 x h 2 + a 2 x h 2 2 × 298 T c × p d X[%], p[bar]
NIS R = a × x h 2 b × p R T X[-], p[Pa]
KNT R = 0.66 N a 1 + a 2 x h 2 + a 3 x h 2 2 × p T X[%], p[bar]
CERACOMB R = S k x h 2 0.15 1.16 × p 273 T × 10 3 X[%], p[bar]
Table 2. Total masses of water vapor and hydrogen.
Accident ScenarioWater Vapor MassHydrogen Mass
SBLOCA163 ton950 kg
SBO67 ton975 kg
Disclaimer/Publisher’s Note: The statements, opinions and data contained in all publications are solely those of the individual author(s) and contributor(s) and not of MDPI and/or the editor(s). MDPI and/or the editor(s) disclaim responsibility for any injury to people or property resulting from any ideas, methods, instructions or products referred to in the content.

