Abstract
We present the Group Cohesion and Emotion (GCE) dataset, which comprises 1029 segmented films sourced from YouTube. These videos encompass a range of interactions, including interviews, meetings, informal discussions, and other similar contexts. In the annotation process, graduate psychology students were tasked with assigning coherence levels, ranging from 1 to 7, and affective states as negative, neutral, or positive for each 30 s film. We introduce a foundational model that utilizes advanced visual and audio embedding techniques to investigate the concepts of group cohesion and group emotion prediction. The application of Multi-Head Attention (MHA) fusion is utilized to enhance the process of cross-representation learning. The scope of our investigation includes both unimodal and multimodal techniques, which provide insights into the prediction of group cohesion and the detection of group emotion. The results emphasize the effectiveness of the GCE dataset in examining the level of group unity and emotional conditions.
1. Introduction
Group cohesiveness refers to the extent to which group members work together to achieve a goal [1]. Group emotion is a term used to represent the shared emotions, attitudes, and dispositional effects of a group of persons [2]. In the field of emotion recognition research, emotions are primarily defined as follows: seven emotions including neutral, which is Ekman’s six emotions (anger, happiness, fear, surprise, disgust, sadness) [3], and a two-dimensional model based on arousal and valence [4]. A group emotion can be seen as either an emotional entity that influences members’ emotions or as an aggregate of those emotions. Group emotions can be defined by whether the group shares the same emotional category. Therefore, in this study, we define the group emotional categories as positive, neutral, and negative based on whether the same group shares the same emotional category. Studying group cohesiveness and group emotion is vital because members’ social and emotional interactions deepen their relationships. The explicit and implicit components of the group are two of the most important research topics in the field of affective computing because understanding the dynamics of group cohesiveness may be substantially enhanced by an awareness of the sentiments shared by the group members.
The comprehension and anticipation of group cohesion play a vital role in evaluating the effectiveness of teams, and numerous scholarly articles have made substantial contributions in this area of study. Guo et al. [5] utilize the GAF-Cohesion dataset for their research on predicting group cohesion. The dataset encompasses diverse visual cues, including face, body, and image information, allowing the authors to train a cascaded attention network and evaluate their model’s performance on group cohesion prediction. Dang et al. [6] contribute to group cohesion prediction using the EmotiW 2019 dataset. Their hybrid deep learning network leverages four types of visual cues (scene, skeleton, UV coordinates, and face image) to predict the Group Cohesion Score (GCS) and achieves first place in the Group-level Cohesion Sub-challenge. Zhu et al. [7] focus on the 7th Emotion Recognition in the Wild (EmotiW 2019 (https://github.com/yanan1989/Additional-EmotiW-dataset, accessed on 1 May 2024) Grand Challenge, specifically the category of Group-based Cohesion Prediction. Their automatic group cohesiveness prediction method incorporated a hybrid network trained on face, skeleton, and scene features, thereby demonstrating an improved performance. Maman et al. [8] employed a dataset for their research on using valence emotion to predict group cohesion dynamics. Although a specific dataset was not mentioned, the authors used deep neural network architectures grounded in multitask learning to jointly predict cohesion and emotion, emphasizing the interdependencies between these factors. Corbellini et al. [9] utilize existing datasets for their exploratory study on group potency classification from non-verbal social behaviors. These datasets contain interactions from 16 different groups displaying low or high potency, allowing the authors to train various classifiers and demonstrating the feasibility of the automated classification of group potency. These studies collectively advance the understanding and prediction of group cohesion through innovative methodologies, diverse datasets, and interdisciplinary approaches. However, it is important to acknowledge the limitations arising from dataset-specific constraints and the necessity for additional validation in real-world scenarios.
Group emotion has been conceptualized in terms of top-down and bottom-up components [2]. They are credited with establishing collective feelings, according to widely held beliefs [10]. Bottom-up components originate from individuals and their emotions, but top-down components are context-dependent and therefore rely on variables such as the environment and group knowledge. Consequently, group emotions may be described as a shared condition in a group that results from combining these two components [11]. The primary goal of emotional computing is to obtain an accurate categorization of the collective emotions, which is a significant challenge that requires the creation of novel datasets that capture the intricate dynamics of both group cohesion and group emotion. Current limitations, such as the preference for visible emotions over genuine emotions due to limitations in data formatting, emphasize the need for datasets that surpass conventional frameworks. These datasets would facilitate a comprehensive comprehension of the complex interplay between group cohesion and group emotion. The acquisition of extensive datasets is crucial for enhancing the precision and practicality of emotional computing models in real-life situations.
In this paper, we present a distinctive audio-visual dataset denoted as the “Group Cohesion and Emotion” GCE dataset, designed for a comprehensive analysis of group cohesion and group emotion. The GCE dataset references the data collection method of the VGAF [12] dataset. However, the VGAF dataset has a limitation in that the definitions of the age groups and situations are not specific. Therefore, in this study, when collecting the data, we restrict the group members in the video to adults to control for age effects. In addition, we limit the situation to sitting and having a conversation, focusing on detecting group cohesion and group emotions that are needed in counseling psychology. These video clips have been annotated with each segment assigned group cohesion scores within a range of 1 to 7, and the corresponding group emotional classes categorized as negative, neutral, or positive.
The principal contributions of this study are summarized as follows:
- Group Cohesion and Emotion Dataset Construction: We present the Audio-Visual Dataset for Group Cohesion and Emotion Analysis (GCE). When collecting the videos for this dataset, we considered control of the age effect and only sitting conversation situations. In addition, this dataset includes annotations by counseling psychology researchers with seven cohesion levels and three emotions for each video clip.
- Addressing Class Imbalance and Duration Challenges: The dataset is deliberately designed to incorporate challenging aspects, such as unbalanced class distributions and extended video durations. These challenges are inherent in their classification and regression tasks, where the dominant classes often receive more attention than the minority classes. Additionally, longer recordings encompass various levels of cohesion and emotional states, which can complicate accurate predictive modeling. Therefore, this research encourages the development of models that mitigate the impact of skewed class distributions.
- Multimodal Fusion Model for Group Cohesion and Emotion: We develop the baseline model for the prediction of group cohesion and group emotion. This involves extracting various features from the audio and visual aspects of the dataset, including facial traits, expressions, video context, static speech characteristics, speech emotions, and spectrograms of the speaker’s voice. In addition, FNet module and Multi-Head Attention (MHA) are used to combine the visual and audio features. The baseline model effectively fuses multi-modality, showing a higher performance than single modality.
The remainder of this paper is organized as follows. Section 2 describes the previous datasets related to group cohesion and group emotion. Next, we introduce the construction of the Group Cohesion and Emotion Dataset in Section 3, and we implement the details of the baseline model in Section 4. Section 5 presents the baseline performance with the analysis and discussion. Finally, we conclude the study in Section 6.
2. Related Works
The group cohesion and group emotion datasets can be divided into image-based and video-based datasets, as shown in Table 1 and Table 2. The HAPPEI dataset [13] was curated by Dhall et al. in 2015 [14] and comprises 2638 images. The dataset underwent meticulous annotation by four human labelers, characterizing the happiness intensity across six distinct stages (0–5): neutral, small smile, large smile, small laugh, large laugh, and thrilled. The MultiEmoVA dataset [11] comprises online photos that were hand-gathered and categorized to identify the prevailing emotions depicted in a group photograph. The GAF-Cohesion [15] image dataset was created as a follow-up to the original GAF3.0 dataset. Each image in the GAF-cohesion was tagged with information on the estimated group mood and cohesion score. The GroupEmoW [14] is a recent image dataset used for evaluating group emotion. It was acquired from Google, Baidu, Bing, and Flickr using terms connected to social occasions, such as burials, birthdays, protests, conferences, meetings, weddings, etc.

Table 1.
Recent datasets of group cohesion and group emotion analysis using images.
For video-based datasets, a new crowd dataset, labeled with one of five fine-grained aberrant behavior categories (panic, fight, congestion, obstruction, and neutral) was suggested in 2016 by Rabiee et al. [16]. The SALSA dataset was developed by Alameda-Pineda et al. [17] to analyze spontaneous chat rooms. Videos covering a wide spectrum of emotions and themes (such as interviews, festivals, parties, quiet protests, acts of violence, etc.) were compiled in the VGAF (Video Group AFfect) dataset [12]. The videos were cut into smaller segments of between 8 and 25 s long. To explore the modeling of the collaborative features of multimodal behavior in groups that accomplish basic tasks, the MULTISIMO (https://multisimo.eu/datasets.html, accessed on 1 May 2024) [18] multimodal corpus was established in 2018.
We have become aware of specific constraints within the latest datasets that are accessible for scholarly investigation in the fields of group communication, group cohesion, and emotional states. It is worth mentioning that a considerable number of these datasets have been obtained in controlled settings, such as the MULTISIMO and SALSA datasets. In addition, many of these datasets primarily consist of picture data, as demonstrated by the MultiEmoVA, GAF-Cohesion, and GroupEmoW datasets. However, many datasets, such as VGAF, primarily focus on evaluating the cohesiveness and emotional state of crowds in non-verbal situations, which may inadvertently mask the individual dynamics within these groupings.
Table 2.
Recent datasets of group cohesion and group emotion analysis using videos.
Table 2.
Recent datasets of group cohesion and group emotion analysis using videos.
| Dataset | Purpose | Scenario | Modality | Data Size | Duration | Annotator | Annotation |
|---|---|---|---|---|---|---|---|
| MED (2016) [16] | Research on abnormal behavior understanding in crowd | Crowd outdoor | Video | 31 | 0.4 h | - | Panic, Fight, Congestion, Obstacle, Neutral |
| SALSA (2017) [17] | Identify social interactions in the wild | Conversational group | Video | 1 | 1 h | 3 | Personality, Position, Head, Body orientation, F-formation |
| MatchNMingle (2018) [19] | Analyze the social signal and group interactions | Conversational group | Video | 1 | 2 h | 3 | HEXACO, Self control scale, Sociosexual orientation, Inventory, Social cues, Social actions, F-formations |
| MULTISIMO (2018) [18] | Identify human-human interactions, group behavior | Experiment | Video | 23 | 4 h | - | Personality, Experience, Speaker segmentation, Dominance, Transcript, Turn taking, Emotions |
| VGAF (2019) [12] | Identify group cohesion and group emotion | In the wild | Video | 234 | 5 h | 20 | Cohesion, Emotional state |
| GAME-ON (2020) [20] | Identify non-verbal behavior | Game | Video | - | 11.5 h | - | Cohesion, Leadership, Emotional state, Warmth and Competences |
| GCE (ours) | Identify group cohesion scores and group emotional states | Conversational group | Video | 40 | 8.6 h | 7 | Cohesion, Emotional state |
Based on these findings, we introduce a new video dataset designed to explore group communication, cohesion, and emotional dynamics comprehensively. This dataset, which is organized into uniform time intervals, facilitates researchers in studying the individual contributions to collective dynamics within a group. The approach holds promise for advancing research in group dynamics and communication.
3. Construction of the Group Cohesion and Emotion Dataset
We propose the Audio-Visual Dataset for Group Cohesion and Emotion Analysis (GCE). In this dataset, we focus on the recognition of group cohesion and group emotion. Group cohesion and emotion are important in human interactions and relationships. Especially, the comprehension of group cohesion and group emotion becomes essential when individuals sustain relationships to meet their needs and objectives. The characteristics of the GCE dataset are shown in Table 3.
Table 3.
Dataset characteristics.
3.1. Video Data Collection
This study used systematic and targeted methodology to gather the YouTube videos. Stringent criteria were applied to ensure the inclusion of videos pertinent to the group-related activities, compliance with permissive licensing, alignment with a specific age group and language, and devoid of hard-embedded subtitles or background music. The process of video retrieval involved the utilization of terms pertaining to activities involving groups, including “causal conversation”, “interview”, “discussion”, “debate”, and “meeting”. To satisfy the requirements for inclusion in the dataset, a thorough screening process was conducted to confirm that the films were submitted under the Creative Commons License. This step was taken to guarantee the lawful and ethical utilization of the content.
The videos exhibiting middle-aged people were chosen by visually identifying videos that did not feature individuals who were younger or older. This decision was made to ensure a consistent representation of the demographics within the dataset. Additionally, it was considered essential to eliminate videos with subtitles and background music, as these components can impact the interpretations made by annotators and unwittingly disclose the viewpoint of the video producers. Consequently, films that contained background music throughout their entirety were excluded from the dataset. The comprehensive selection procedure, which was conducted with great attention to detail and guided by the criteria, resulted in the production of 40 video clips. The videos were obtained using the youtube-dl (https://github.com/ytdl-org/youtube-dl, accessed on 7 April 2022) package and each video was partitioned into chunks of 30 s in order to permit a comprehensive examination.
Two graduate students with substantial training and clinical practice competence in the areas of group dynamics and treatment were assigned the responsibility of annotating the video clips. The students conducted a thorough examination and analysis of the video recordings, ensuring that the sequences pertaining to the greetings and introductions were suitably positioned at the beginning of the interviews. After performing a meticulous examination and annotation procedure, a comprehensive dataset consisting of 1029 video clips was compiled. This dataset serves as a foundation for conducting a thorough and extensive investigation of human relationships and emotions.
In summary, this study compiled a dataset comprising 40 original videos, which were carefully selected based on the above criteria. This rigorous selection procedure ensured the inclusion of a varied range of videos, so that this dataset serves as a valuable resource for analyzing group emotions and dynamics. The data collection process is outlined in Table 4, and the dataset predominantly consists of dialogues with middle-aged people. This dataset provides valuable insights into the interpersonal interactions of a certain demographic group.
Table 4.
Characteristics of video data collection by keywords.
3.2. Annotation
For the data annotation, we defined the group emotions and group cohesion, reflecting prior experimental studies on emotion recognition in the field of psychology [21,22]. In addition, the entire annotation process was reviewed by two psychology department researchers. The definition of group cohesion is referred to in [23]. The concept of “group cohesion” refers to the extent to which individuals in a group display favorable emotions, form interpersonal connections, aid one another, demonstrate attentiveness towards fellow group members during collaborative tasks, and effectively achieve objectives as a unified entity. To evaluate the level of group cohesion, a Likert scale [24] consisting of seven points was utilized. This scale encompassed a range of categories, including “very weak”, “weak”, “a bit weak”, “neutral”, “a bit strong”, “strong”, and “very strong” agreements. We used a 7-point Likert scale to differentiate and annotate the subtle differences in group cohesion.
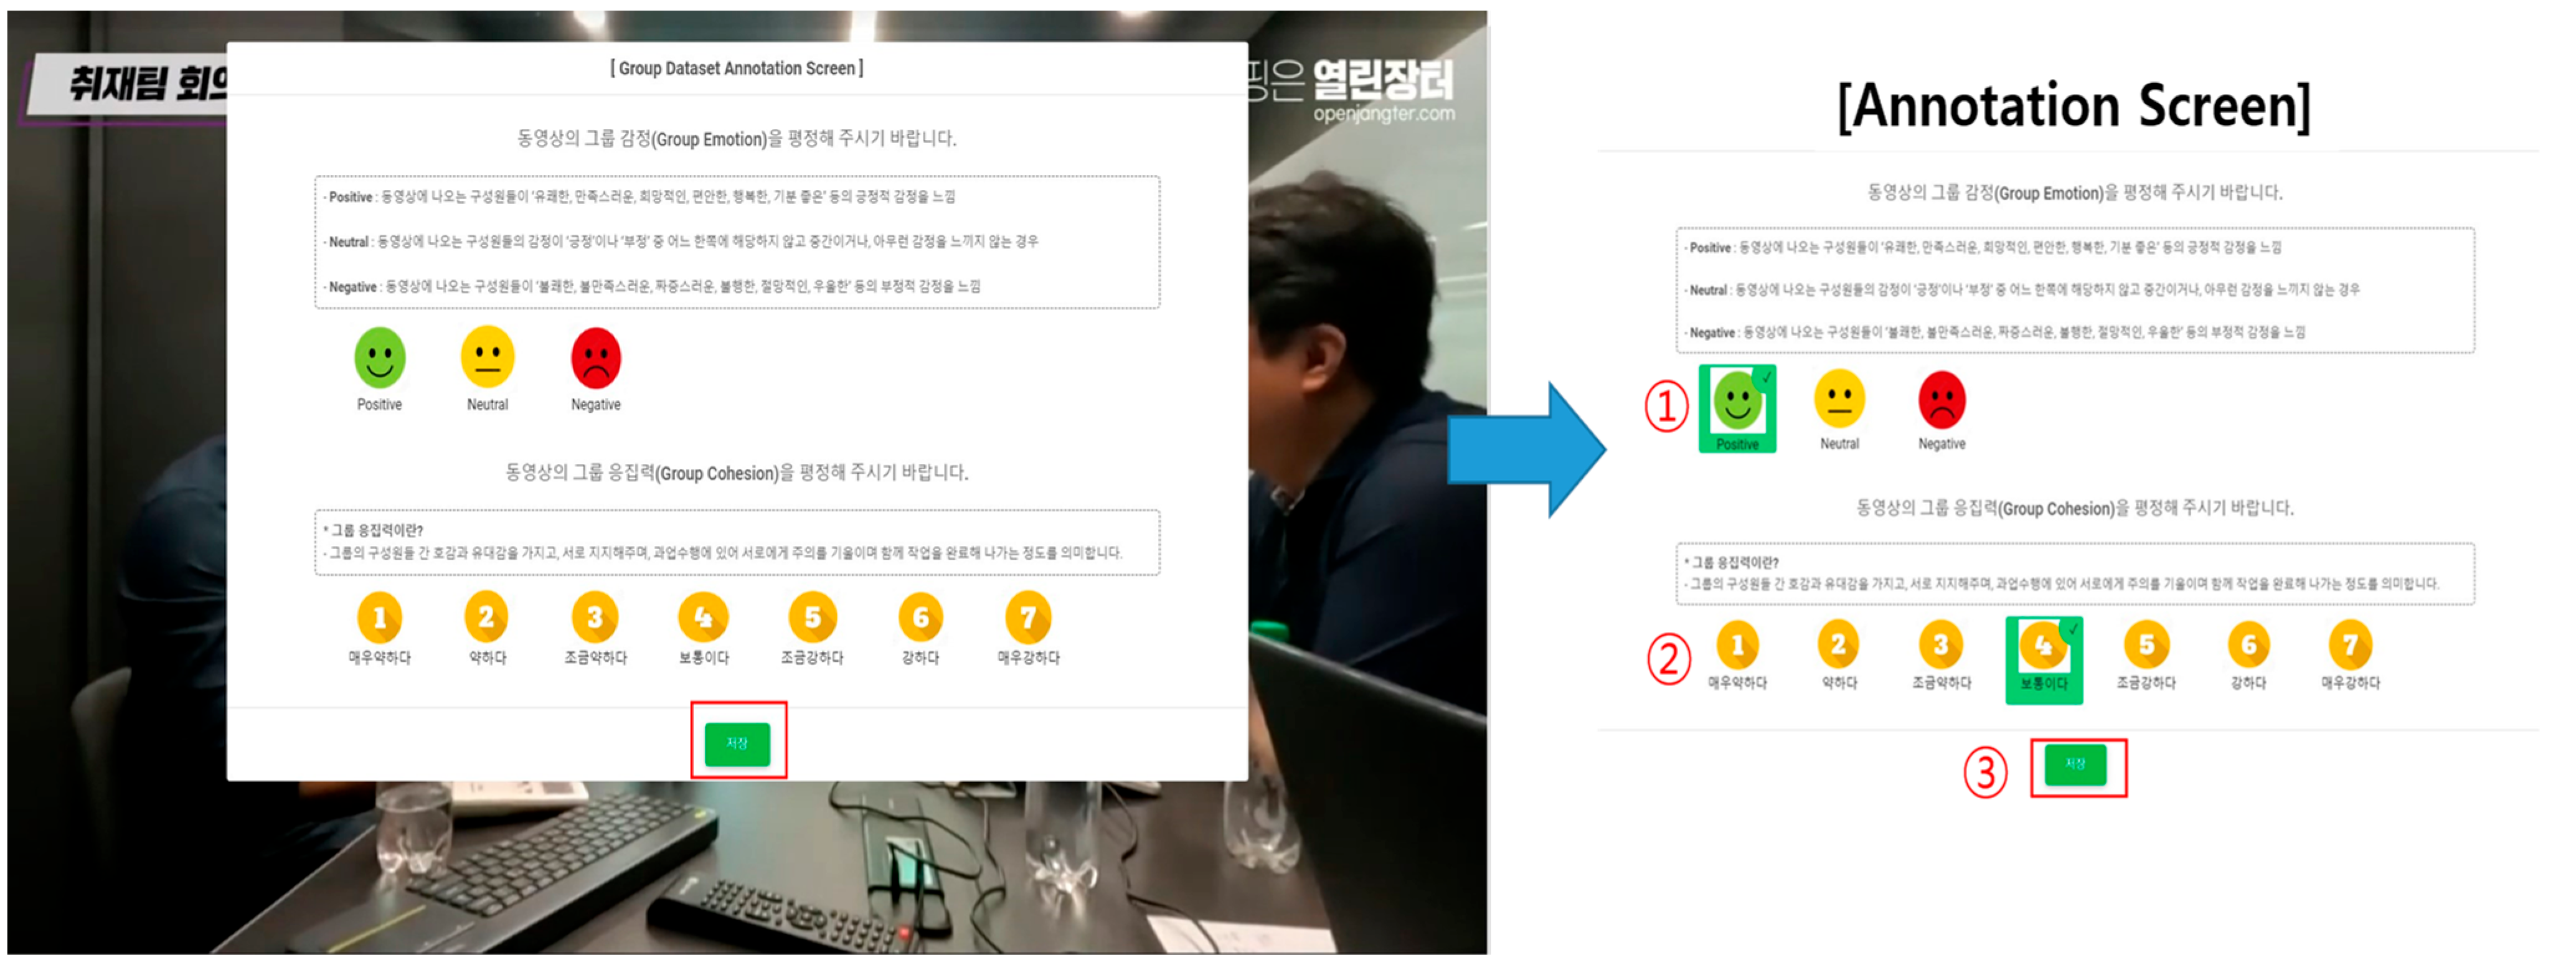
The definition of group emotion is shown in Table 5. The group emotions were annotated based on the emotions felt by the group members in the video, not the emotions felt by the annotator. If all the group members are judged to be feeling positive emotions, it is positive, and if they are judged to be feeling negative emotions, it is negative. In addition, if no emotions are felt or if they do not belong to the positive or negative category, it is neutral. A custom-designed annotation tool was utilized during the video clip annotation process. This application not only enabled the efficient administration of data using a database system but also offered annotators a user-friendly interface for annotating the web pages. Figure 1 presents a visual representation of the annotation interface. After successfully logging into their respective accounts, users were granted the ability to commence video playback. Users were able to access the annotation page with the conclusion of video playback, thereby simplifying the process of annotating data for labeling in a manner that is both convenient and efficient. The system administrator has the capacity to supervise and examine the content annotated by the annotators, which also includes the compilation of the statistical data pertaining to the annotated content.
Table 5.
Definition of the group emotion categories.
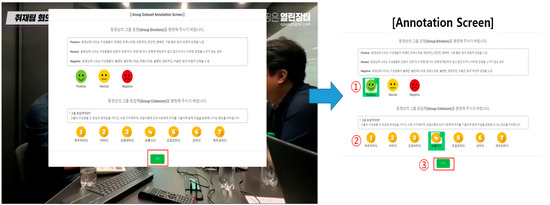
Figure 1.
Annotation interface (in Korean) after watching the video. (1) Decide the group emotional state, (2) decide the group cohesion score, (3) submit the results.
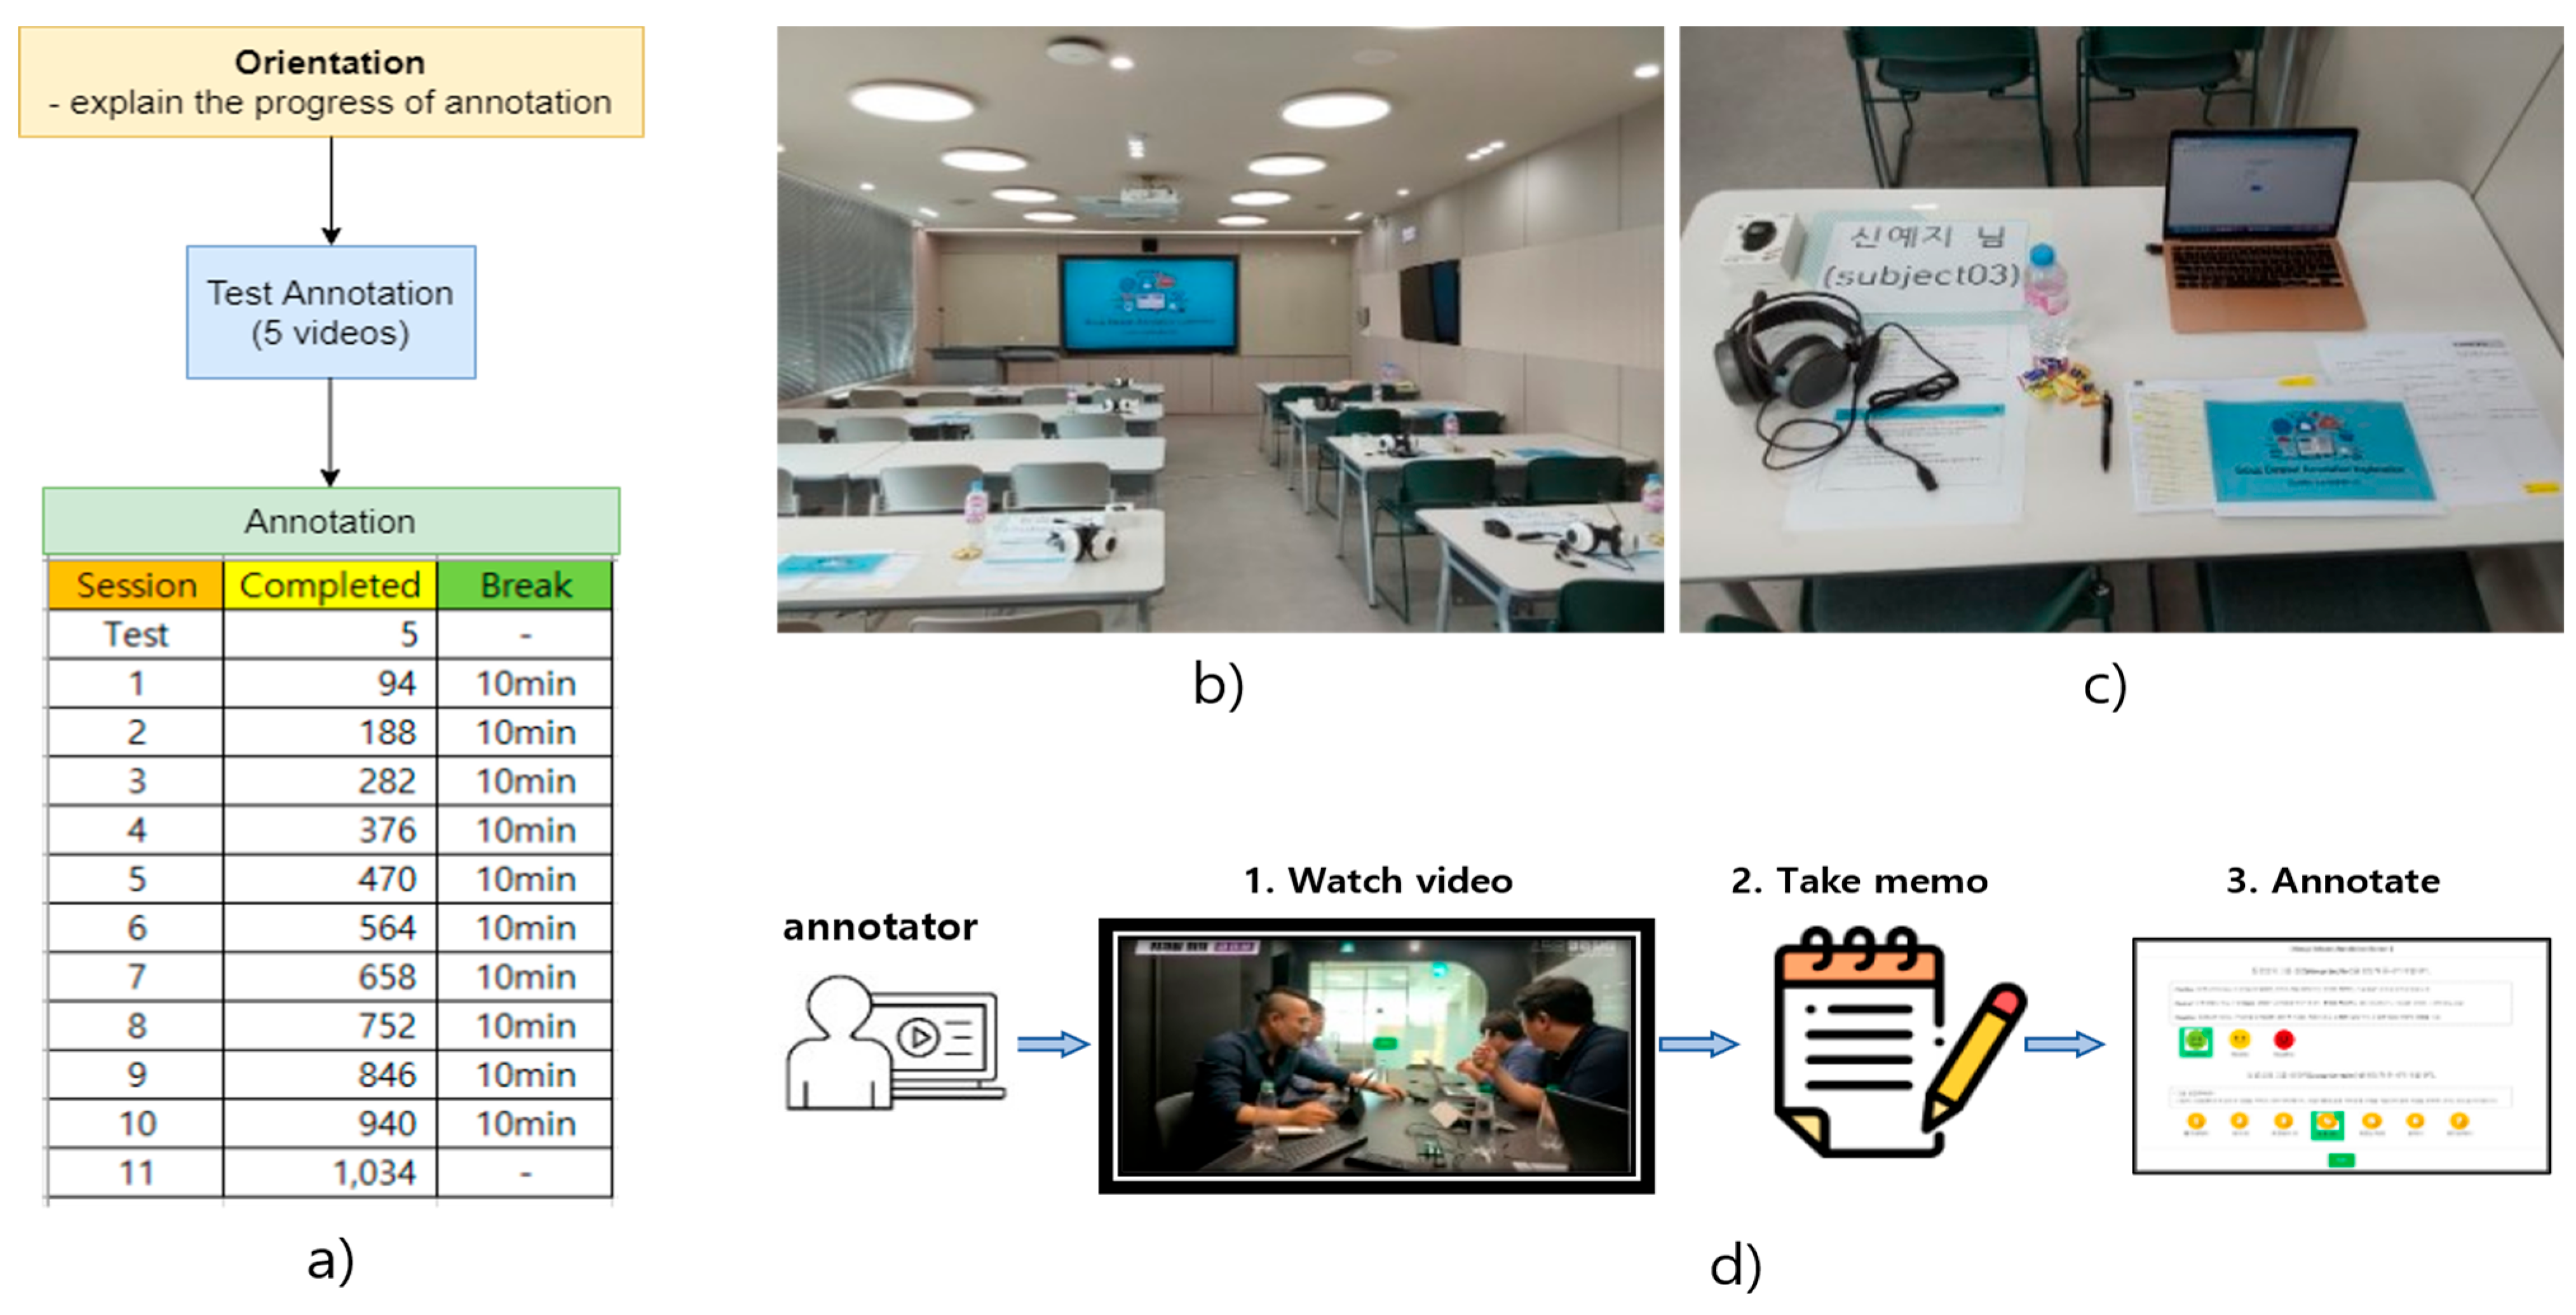
Figure 2 illustrates the setup and procedure for the video annotation. To carry out this task, a team of seven graduate students from the Department of Psychology was enlisted as annotators. Among these annotators, there was a distribution of one male and six female participants, with ages ranging from 24 to 30 years and a mean age of 27.14 years. This team of annotators comprised five master students and two Ph.D. students, all possessing a solid educational foundation in psychology, thus equipping them with the requisite knowledge to assign the group cohesion scores to the video clips. All the annotators were native Korean speakers, ensuring language proficiency in the task at hand.
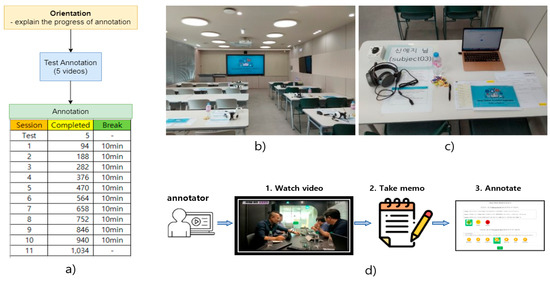
Figure 2.
Annotation environment. (a) Annotator training; (b) Annotation place; (c) Annotation equipment: headset, laptop, explanation document, pen, notepad; (d) Annotation process includes three steps: (1) annotator watches a video, (2) annotator takes memos while watching the video, (3) annotator decides labels for the watched video in terms of the group cohesion score and group emotional state.
The annotation process was conducted in a collaborative and conducive environment, namely, a spacious and quiet classroom, where each annotator had an individual workspace equipped with a computer screen displaying the videos. Prior to commencing the annotation, a comprehensive briefing was provided to the annotators to elucidate the specifics of the annotation tool and the overall process. To familiarize the annotators with the annotation tool, a set of five test videos, distinct from the main dataset, was used as a preliminary exercise.
The annotation process, in its entirety, extended over a period of 3 days, during which participants dedicated 4 h each day to the task of annotation. These annotation sessions were punctuated by 10-min breaks, taken every hour, to provide brief intervals of rest and rejuvenation. Following the annotation process, the assignment of labels to each video was determined by identifying the mode of values provided by the seven annotators. A comprehensive endeavor led to the annotation of a grand total of 1029 videos. Figure 3 shows a visual depiction of the data samples extracted from the annotated dataset, together with their respective labels. The data indicate that the cases exhibiting positive and neutral emotions do not have cohesiveness ratings of 1, but the negative instance does not have a cohesion score of 7. This discovery offers a significant contribution to the understanding of the dynamic relationship between group emotions and cohesion as evidenced by the dataset.
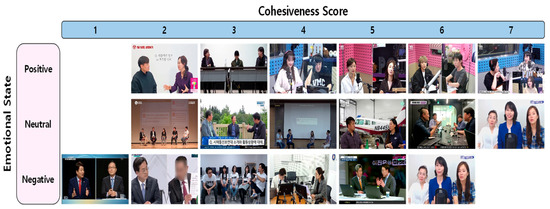
Figure 3.
Samples of data from the GCE dataset. Each row contains examples exhibiting the same emotional state, while each column contains examples with identical cohesion scores.
Figure 4 provides an illustration of the distribution of the labels pertaining to group cohesion and group emotion. The depicted data reveal a prevalent inclination towards positive emotional states within group settings across various situations. The analysis indicates that the observed group cohesion tends to exhibit a consistent tendency towards a moderately strong level.
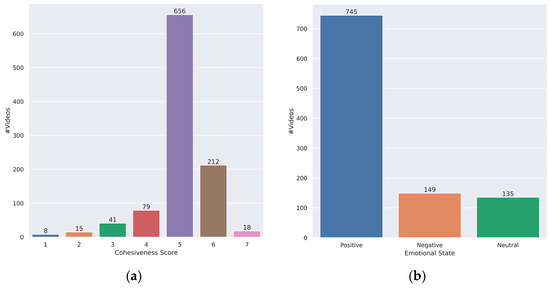
Figure 4.
Ground-truth distribution of the proposed GCE dataset. (a) Cohesion score—(b) emotional state.
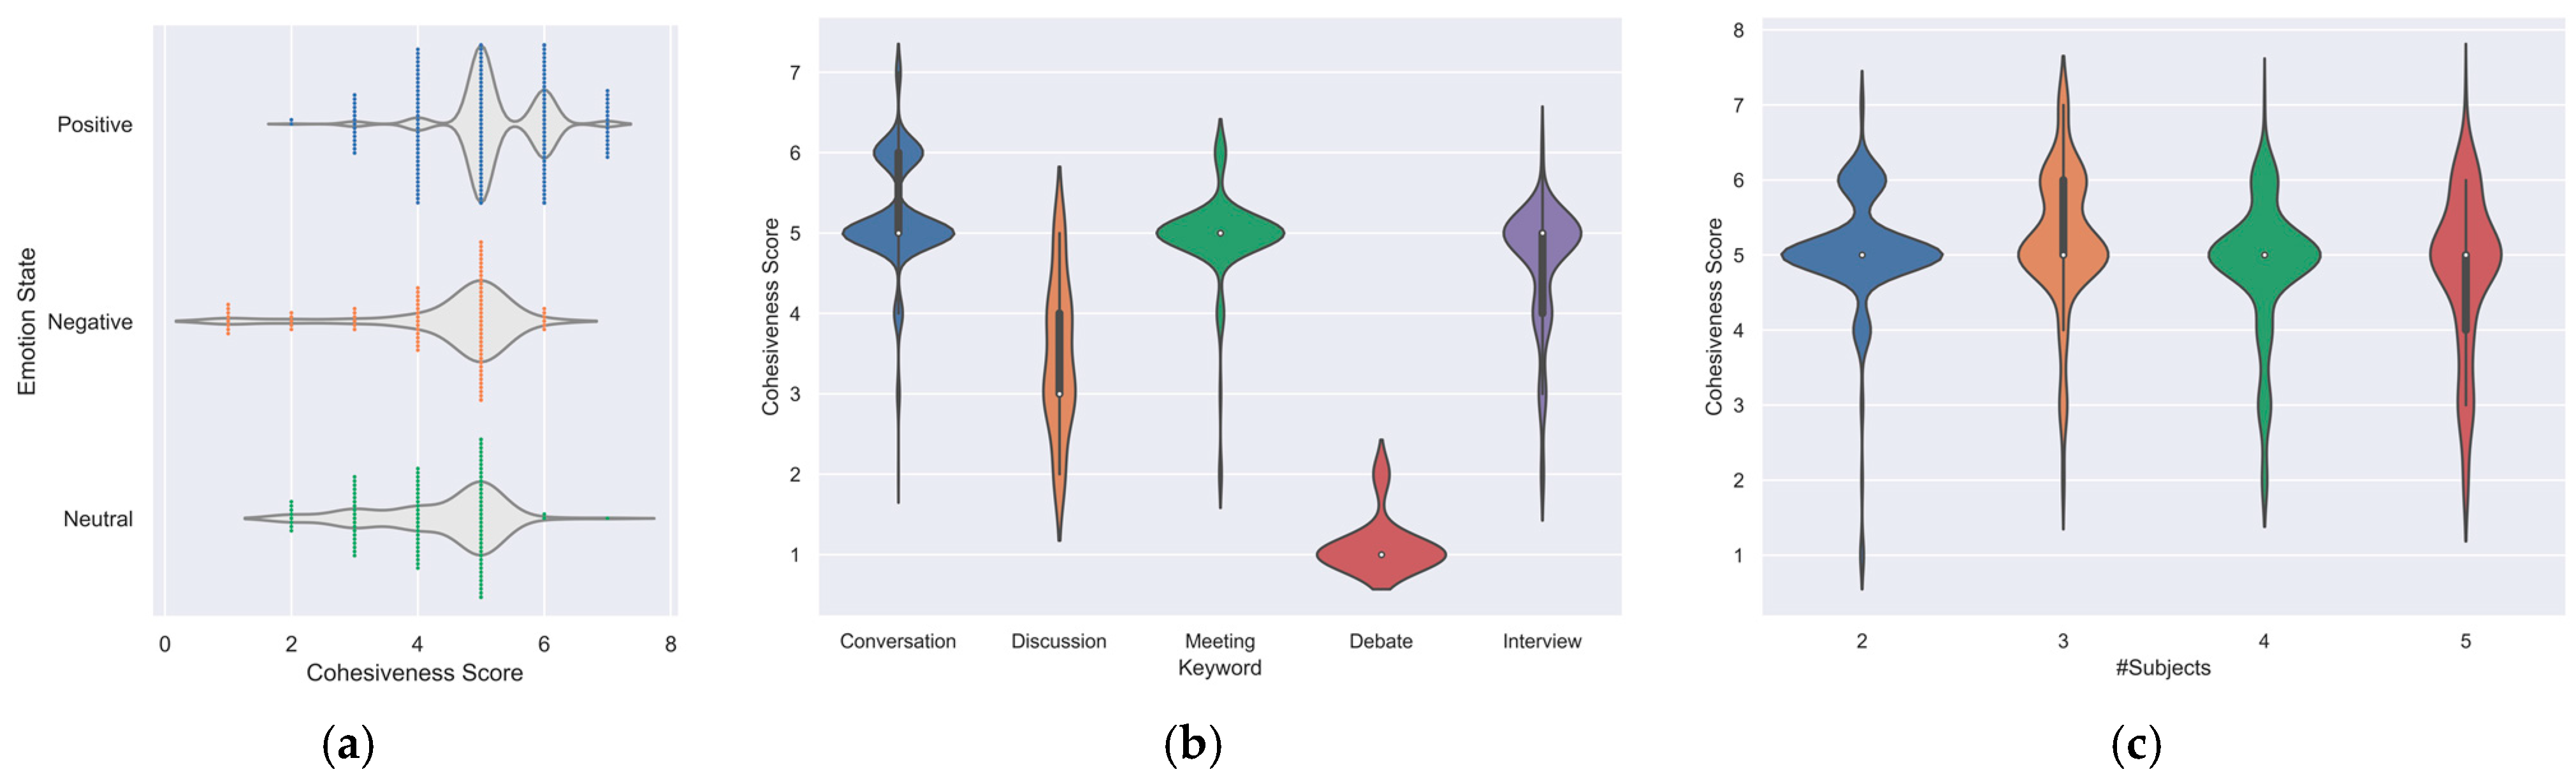
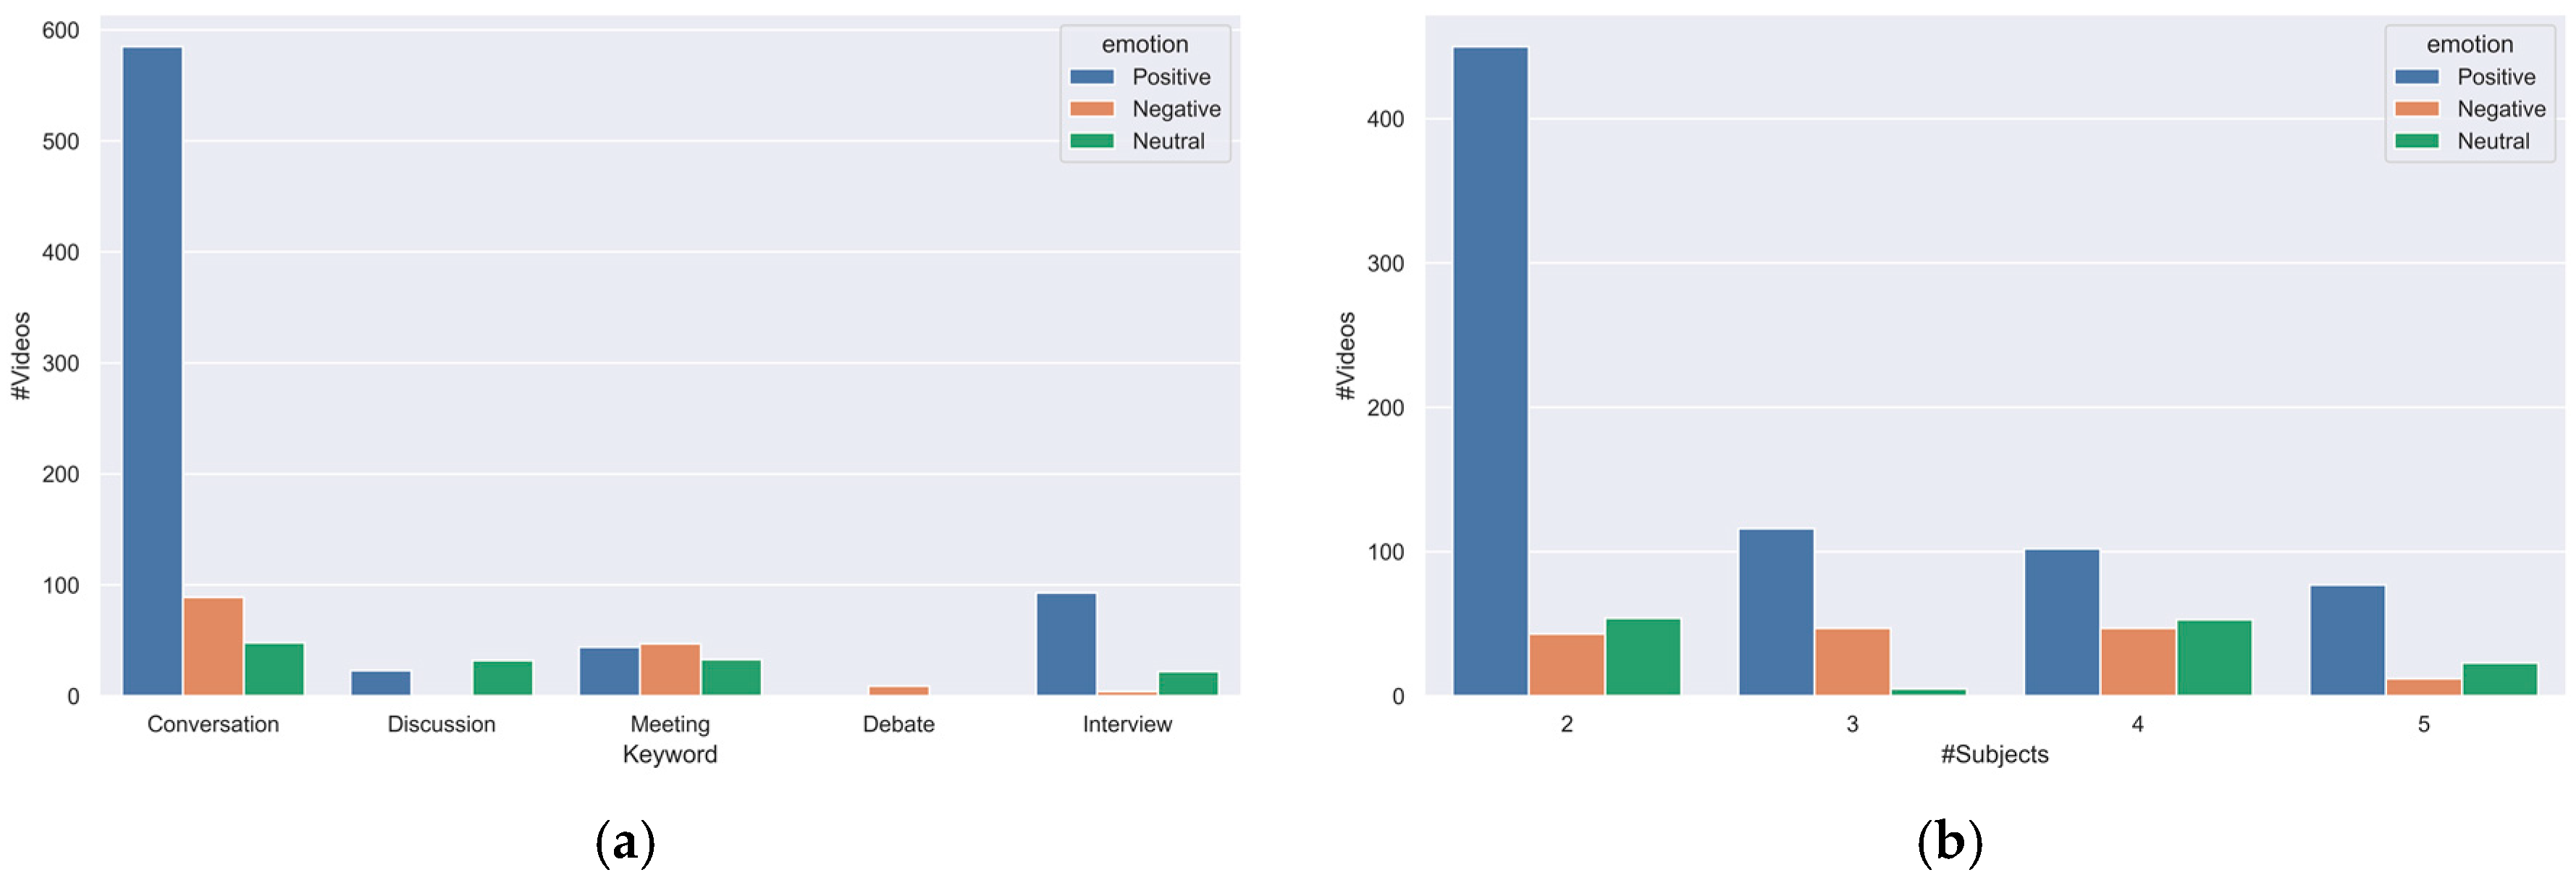
Figure 5a portrays the association between group cohesiveness and group emotions, revealing distinct patterns. Positive emotions are consistently associated with higher cohesion scores, typically falling within the range of 4 to 7. Conversely, negative emotions tend to coincide with lower cohesion levels, typically below 5. Neutral emotions, on the other hand, tend to exhibit moderate cohesion ratings, typically ranging from 3 to 5. When we consider specific scenarios, the keyword “debate” is characterized by predominantly negative emotions, as indicated in Figure 6a, which correspondingly results in very low cohesion levels, with a median score of 1, as exemplified in Figure 5b. In contrast, the “discussion” scenario exhibits a mix of positive and neutral emotions and displays a moderate level of cohesion. The scenarios of “casual conversation”, “meeting”, and “interview” consistently exhibit high cohesiveness scores, typically surpassing 5. Figure 5b,c provides additional insights, suggesting that the number of individuals within a group, ranging from two to five people, does not appear to exert a substantial influence on the expression of cohesion or the emotional dynamics of the group. These findings highlight the nuanced interplay between group cohesiveness and group emotions in various contexts, shedding light on the differential impact of emotions across diverse scenarios and the resilience of group cohesion across different group sizes.
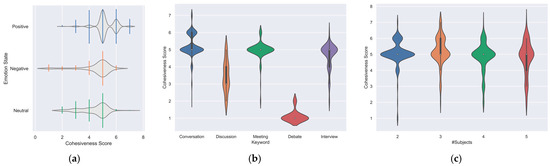
Figure 5.
Violet plot of cohesion distribution based on: (a) emotional correlation; (b) keywords; and (c) subjects.
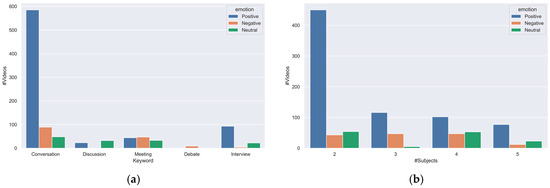
Figure 6.
Emotional state distribution based on: (a) keyword; and (b) number of subjects.
3.3. Inter-Rater Reliability Analysis
When evaluating the reliability of the datasets, a crucial factor to consider is the degree of consistency in the annotation. The evaluation involves examining the annotated instructions and methods [25] to assess their reliability and the extent to which they contribute to the overall credibility of the datasets. The assessment of inter-rater reliability is a fundamental measure used to evaluate the consistency and dependability of the annotations within the datasets. The metric presented in this study measures the degree of consensus among the annotators who individually assign labels to the samples in the dataset [26].
To further enhance the evaluation, Krippendorff alpha, a statistical measure of inter-coder agreement and inter-rater reliability, was incorporated into the analysis. Krippendorff alpha can be expressed as follows:
In Equation (1), D represents disagreement, represents the ‘within-unit inconsistency’, and represents the ‘total inconsistency within and between units’. This formula is the ratio of the observed inconsistency to the expected inconsistency, subtracted from 1. The closer the calculated α value is to 1, the higher the degree of agreement between the raters, and the closer it is to 0, the lower the degree of agreement. Using this method, Krippendorff’s alpha coefficient can measure the actual inter-rater reliability. The Krippendorff alpha reliability coefficient for this study was 0.423, indicating a moderate reliability.
In the present study, the Fleiss Kappa [27] was adopted to evaluate the inter-annotator reliability because there are more than two annotators. The Fleiss Kappa statistic, introduced by Fleiss and colleagues in 1971, is frequently employed in situations involving several annotators. A fair agreement was observed among seven annotators annotating 1029 video segments, with a Fleiss Kappa of 0.321. The agreement among the annotators is fairly high. This confirms the dependability and consistency of the annotation process in the analyzed dataset.
4. Baseline Model Development for Group Cohesion and Group Emotion Prediction
In this section, we propose a baseline model for predicting group cohesion and emotion. First, we detail the extraction of the visual features for face attributes and facial expressions using pre-trained models and the SlowFast network, and the extraction of audio features using OpenSMILE and Wav2Vec 2.0. Next, we present a framework that integrates a visual temporal encoder using the FNet architecture and a fusion module employing Multi-Head Attention strategies. The model’s output is processed through fully connected layers to predict emotional states and cohesion levels, enhancing the efficiency in understanding group dynamics.
4.1. Feature Extraction
To provide a comprehensive understanding of the feature extraction process in our proposed baseline model, we will delve into its various components. Initially, in the visual domain, we isolate the visual frames of the video recordings and the audio waveforms. We will employ RetinaFace (https://github.com/serengil/retinaface, accessed on 1 May 2024) to crop the face images from each frame for the visual feature extraction. We will extract two types of representations: face attributes and facial expressions.
We will utilize the FaceNet (https://github.com/davidsandberg/facenet, accessed on 1 May 2024) model (Face_1), which is pretrained on the VGGFace-2 (https://github.com/ox-vgg/vgg_face2, accessed on 1 May 2024) dataset to generate the face feature vector. FaceNet [28] is a deep convolutional network that directly learns a mapping from face images to a compact Euclidean space where the distances correspond to a measure of face similarity. The model is trained using triplets of roughly aligned matching and non-matching face patches, optimizing the embedding itself rather using than an intermediate bottleneck layer. This approach achieves a greater representational efficiency, enabling a state-of-the-art face recognition performance with only 128-byte feature vectors per face. The VGGFace-2 dataset comprises approximately 3.31 million photographs, each depicting a unique human identity. In addition, we used the pre-trained EfficientNet [29] model (Face_2) trained on the AffectNet dataset to obtain the emotion-related features for each face. EfficientNet is a novel scaling method that enhances performance by balancing network depth, width, and resolution. This model utilizes a simple yet effective compound coefficient to uniformly scale all dimensions and is based on a newly designed baseline network through a neural architecture search. AffectNet is a substantial facial expression dataset containing approximately 0.4 million images that are manually labeled for the presence of eight different facial expressions, as well as the intensity of valence and arousal. We calculate the average of all facial attributes within a single frame and sample nine frames from the entire video using a sliding window approach. Consequently, we obtain the sequences of the encoding features, each with a size of 100 × 512 pixels for facial attributes and 100 × 1408 pixels for facial emotions.
We employ the SlowFast (https://github.com/facebookresearch/SlowFast, accessed on 1 May 2024) network to extract a comprehensive representation of the video content. SlowFast [30] combines a slow, high-definition CNN (“Fast” pathway) and a fast, low-definition CNN (“Slow” pathway) to analyze both the static and dynamic content of the video. This parallel analysis enables a more thorough evaluation of a video’s content. Overall, SlowFast generates a feature vector with 2304 dimensions derived from a video clip. The extraction of the audio features results in three distinct representations. Initially, we utilize the OpenSMILE (https://audeering.github.io/opensmile-python/, accessed on 1 May 2024) toolbox to extract 88 characteristics from the Geneva Minimalistic Acoustic Parameter Set (GeMAPS), which is widely used in voice research and affective computing. OpenSMILE [31] is a feature extraction toolkit that unites algorithms from speech processing and Music Information Retrieval communities. It supports a wide range of audio low-level descriptors, including CHROMA and CENS features, loudness, MFCCs, PLPCCs, LPCs, LSFs, fundamental frequency, and formant frequencies, with the ability to apply delta regression and various statistical functionals. GeMAPS includes prosodic, excitation, vocal tract, spectral, and cepstral MFCCs (mel-frequency cepstrum coefficients). Additionally, we incorporate lower-order MFCCs.
We employ the Wav2Vec 2.0 [32] architecture to integrate the emotional attributes of speech. Wav2Vec 2.0 is a self-supervised learning framework that masks the speech input in the latent space and solves a contrastive task defined over a discretization of the latent representations, which are jointly learned. This approach illustrates that acquiring robust representations from speech audio in isolation, followed by fine-tuning transcribed speech, can surpass semi-supervised approaches. We collect 1024 characteristics from each audio sample using Wav2Vec 2.0. We convert the audio waveform into a log-melspectrogram image with 128 Mel bands, a 2048-length Fast Fourier Transform (FFT) window, 512 samples between frames, and a maximum frequency of 8 kHz. Consequently, the resulting spectrogram image has a size of 128 × 1292 pixels.
4.2. Multi-Task Multi-Feature Fusion Framework
The foundational structure of the baseline model designed for the prediction of group cohesion and group emotion by means of multi-feature fusion is illustrated in Figure 7. The initial phase of this process entails the input of two facial feature sequences into a visual temporal encoder, with the aim of harnessing temporal information. The visual temporal encoder is constructed utilizing the FNet (https://keras.io/examples/generative/text_generation_fnet/, accessed on 1 May 2024) architecture, which is based on the Fourier Transform, offering enhanced efficiency and reliability in contrast to the conventional Transformer network for temporal sequence processing. A visual representation of the FNet module can be observed in Figure 8. A global average pooling layer is employed to condense the temporal dimension, resulting in a 100-feature vector for the facial attribute branch and a 200-feature vector for the facial expression branch.

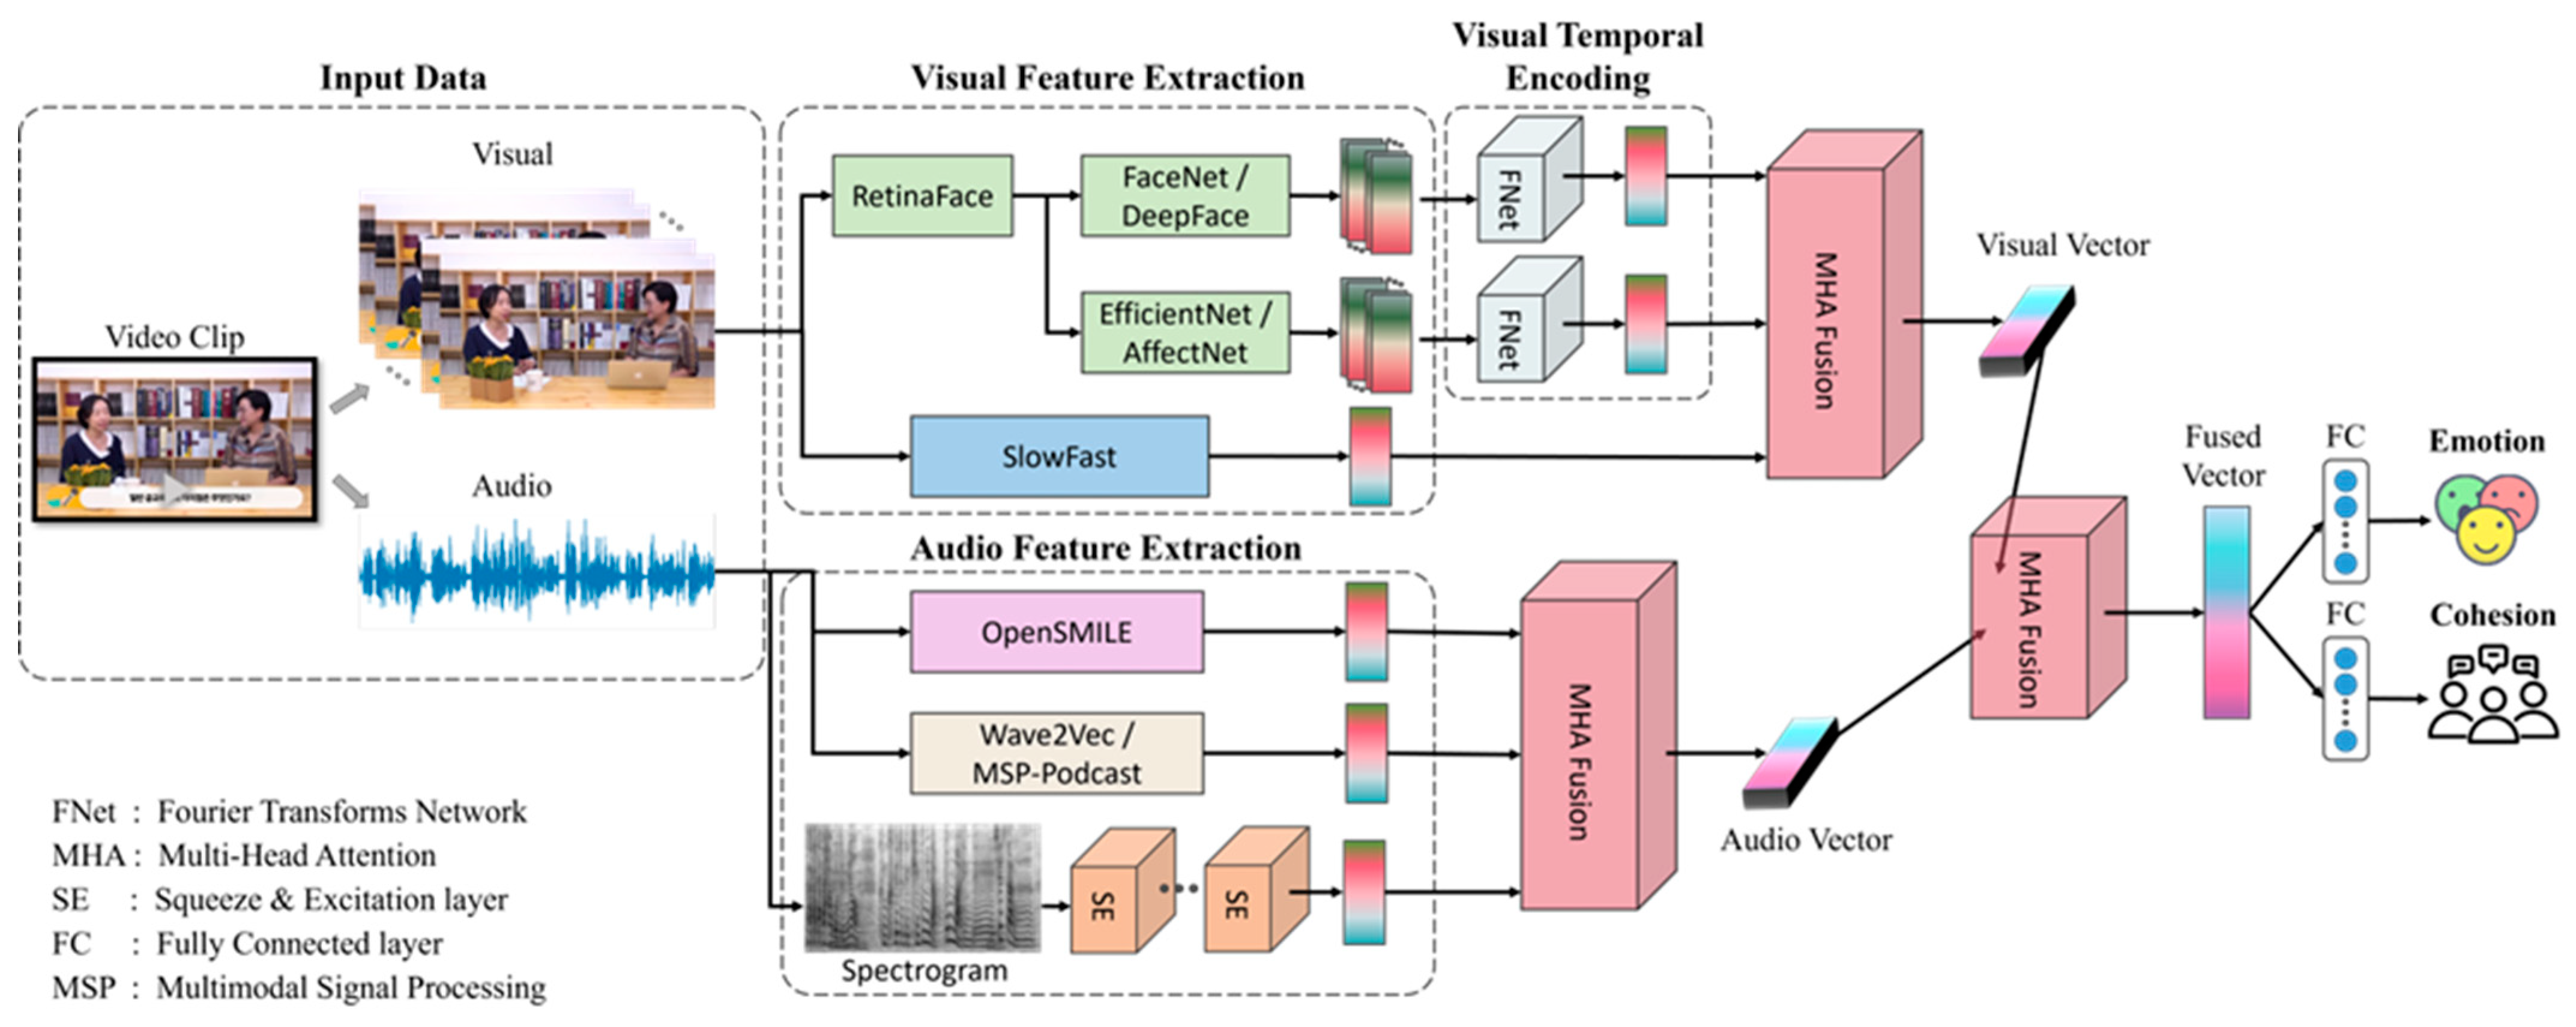
Figure 7.
Baseline architecture for group cohesion and group emotion prediction.
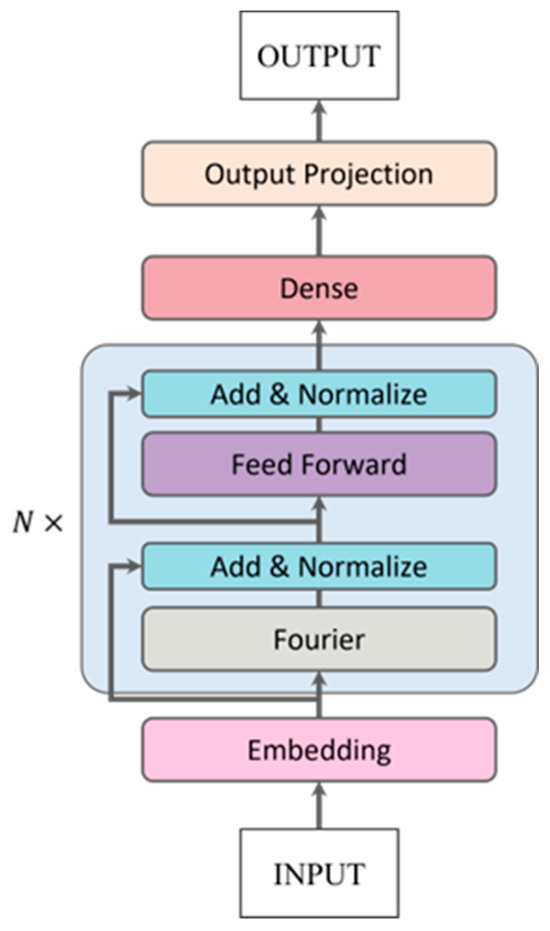
Figure 8.
FNet module with N-encoder blocks.
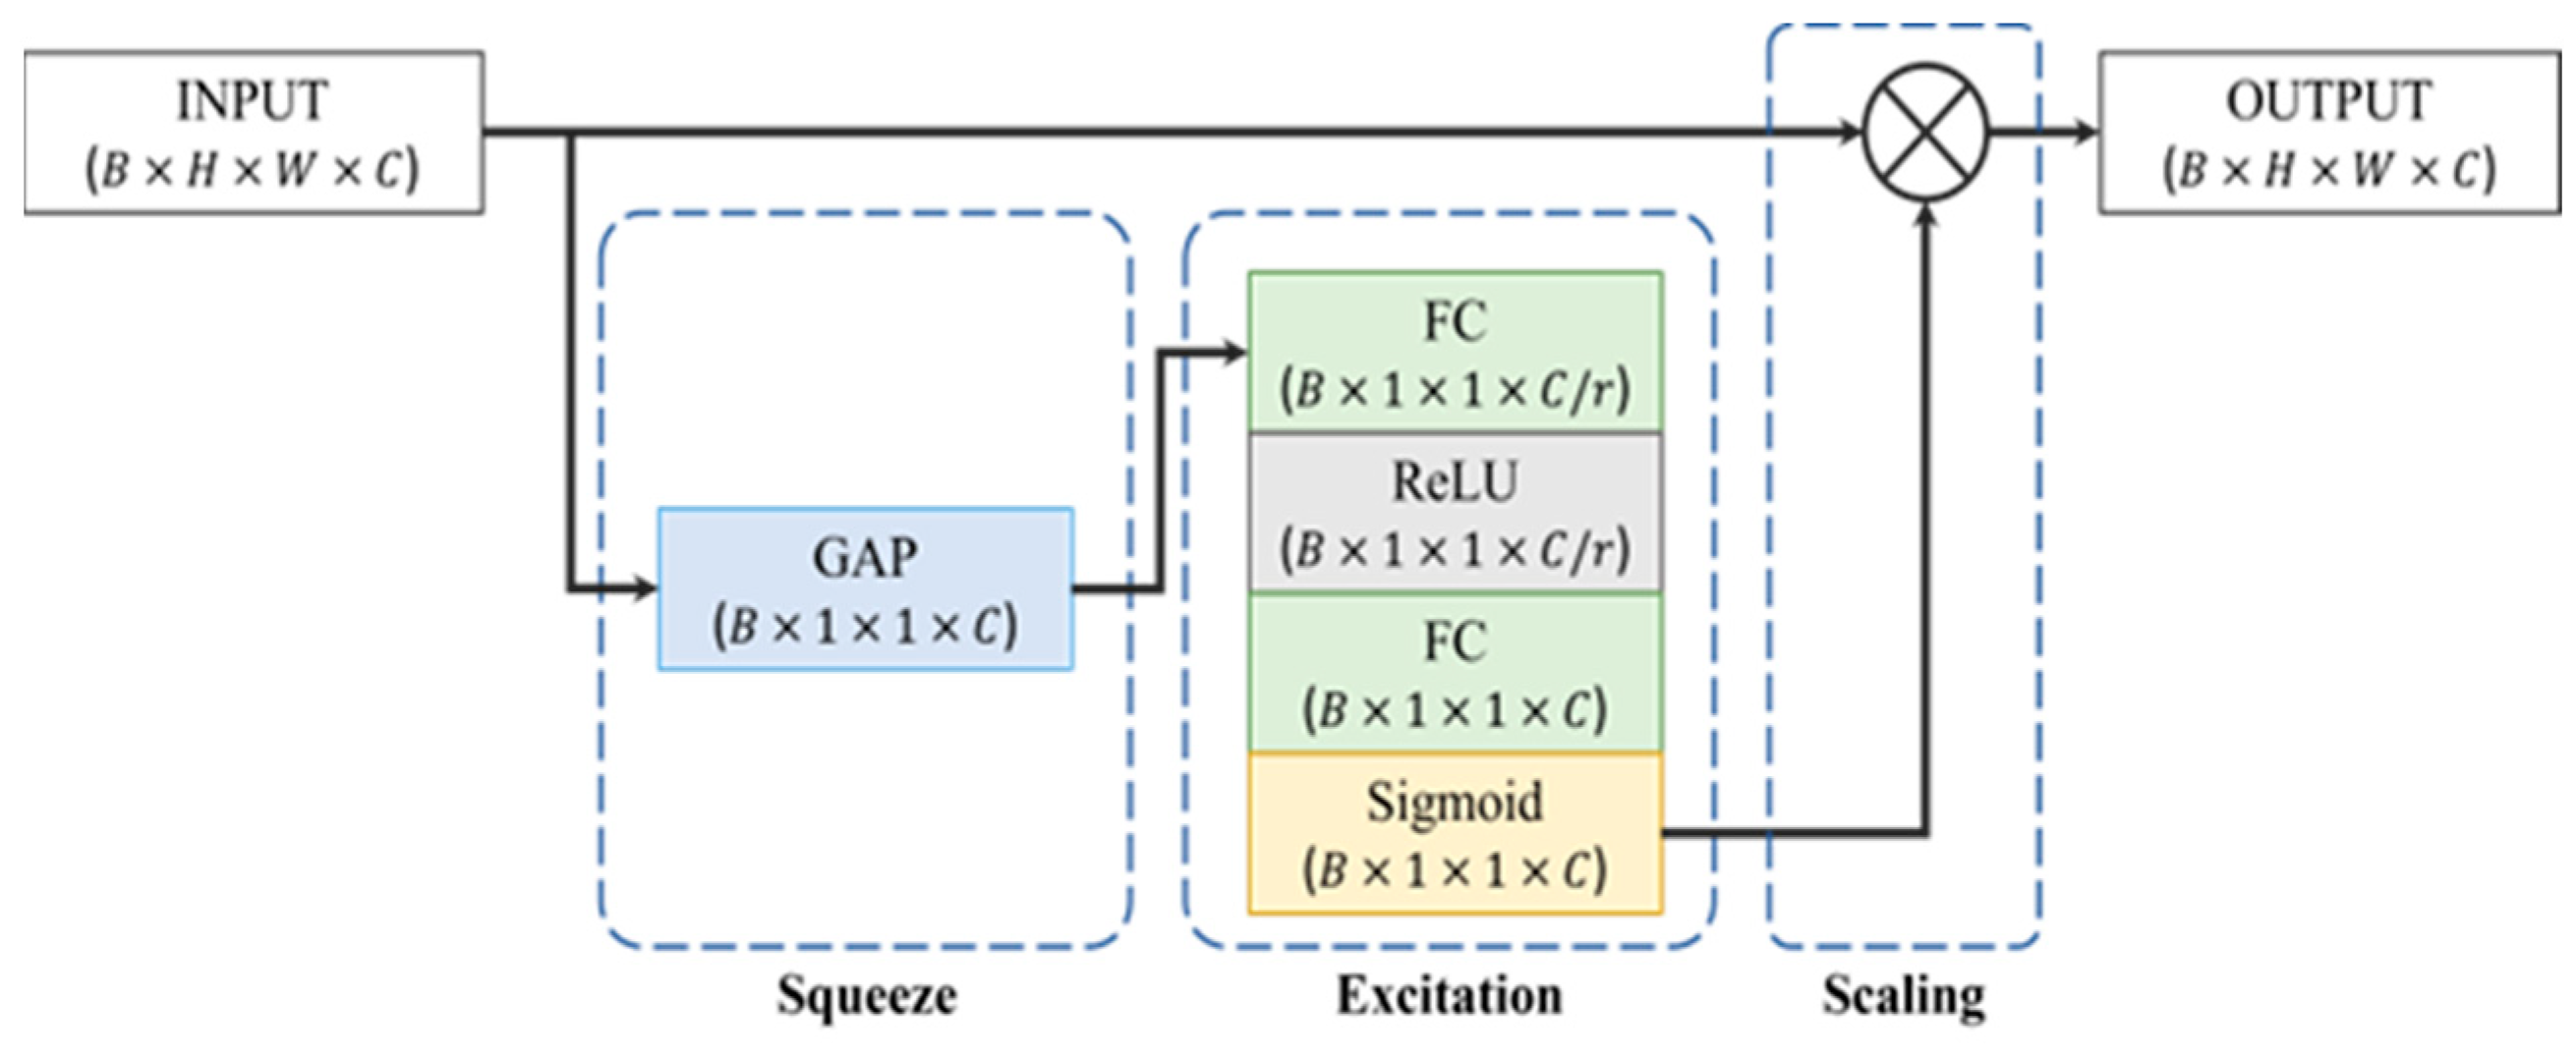
We employ a fully connected layer to reduce the dimensions of the feature representations extracted from SlowFast, OpenSMILE, and Wav2Vec 2.0. We derive 100-feature vectors for SlowFast and Wav2Vec 2.0, whereas the OpenSMILE representation results in a 32-feature vector due to its smaller input size. We also employ the Squeeze-and-Excitation (SE) (https://github.com/taki0112/SENet-Tensorflow, accessed on 1 May 2024) network to encode log-melspectrogram images. The SE network functions as a channel-specific attention mechanism designed for Convolutional Neural Networks (CNNs) with the aim of enhancing inter-dependencies among channels. This is achieved by introducing parameters that adjust the weight of each channel, making it more responsive to the important features while disregarding the less relevant ones. Figure 9 shows a visual representation of the SE block. Following this, we utilize a global average pooling layer to condense spatial information, resulting in a 64-feature vector that effectively represents the log-melspectrogram image.

Figure 9.
Squeeze and excitation module.
We have designed a fusion module incorporating Multi-Head Attention (MHA) strategies [33]. The MHA fusion module comprises three distinct layers: Input Attention, Cross-Attention, and Self-Attention. To effectively harness MHA, a set of queries, keys, and values are provided as the input and transformed independently via learned linear projections across h (the number of heads). Prior to the amalgamation of these representations, the Input Attention layer is deployed to align various attributes within the same domain. Cross-Attention plays a pivotal role in blending features from the paired modalities, where one modality aids in generating an attended map for another. In scenarios involving M modalities, there are M(M−1) cross-attention blocks. Subsequently, Self-Attention refines the representation by amalgamating the cross-modal data for each modality. Figure 10 illustrates the MHA fusion module, which accommodates both bimodal and trimodal scenarios. In our approach, we first apply the tri-modality MHA fusion modules to each of the three visual and auditory representations, obtaining fused features for each branch. Subsequently, the bimodal MHA fusion module is employed to further process these fused features. Finally, the resultant fused feature vector is fed into multiple fully connected layers to predict the emotional state and the cohesion level, thus addressing the objectives of our study.
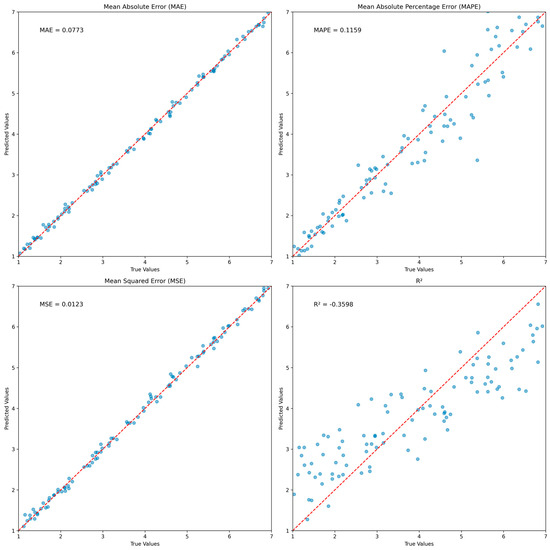
Figure 10.
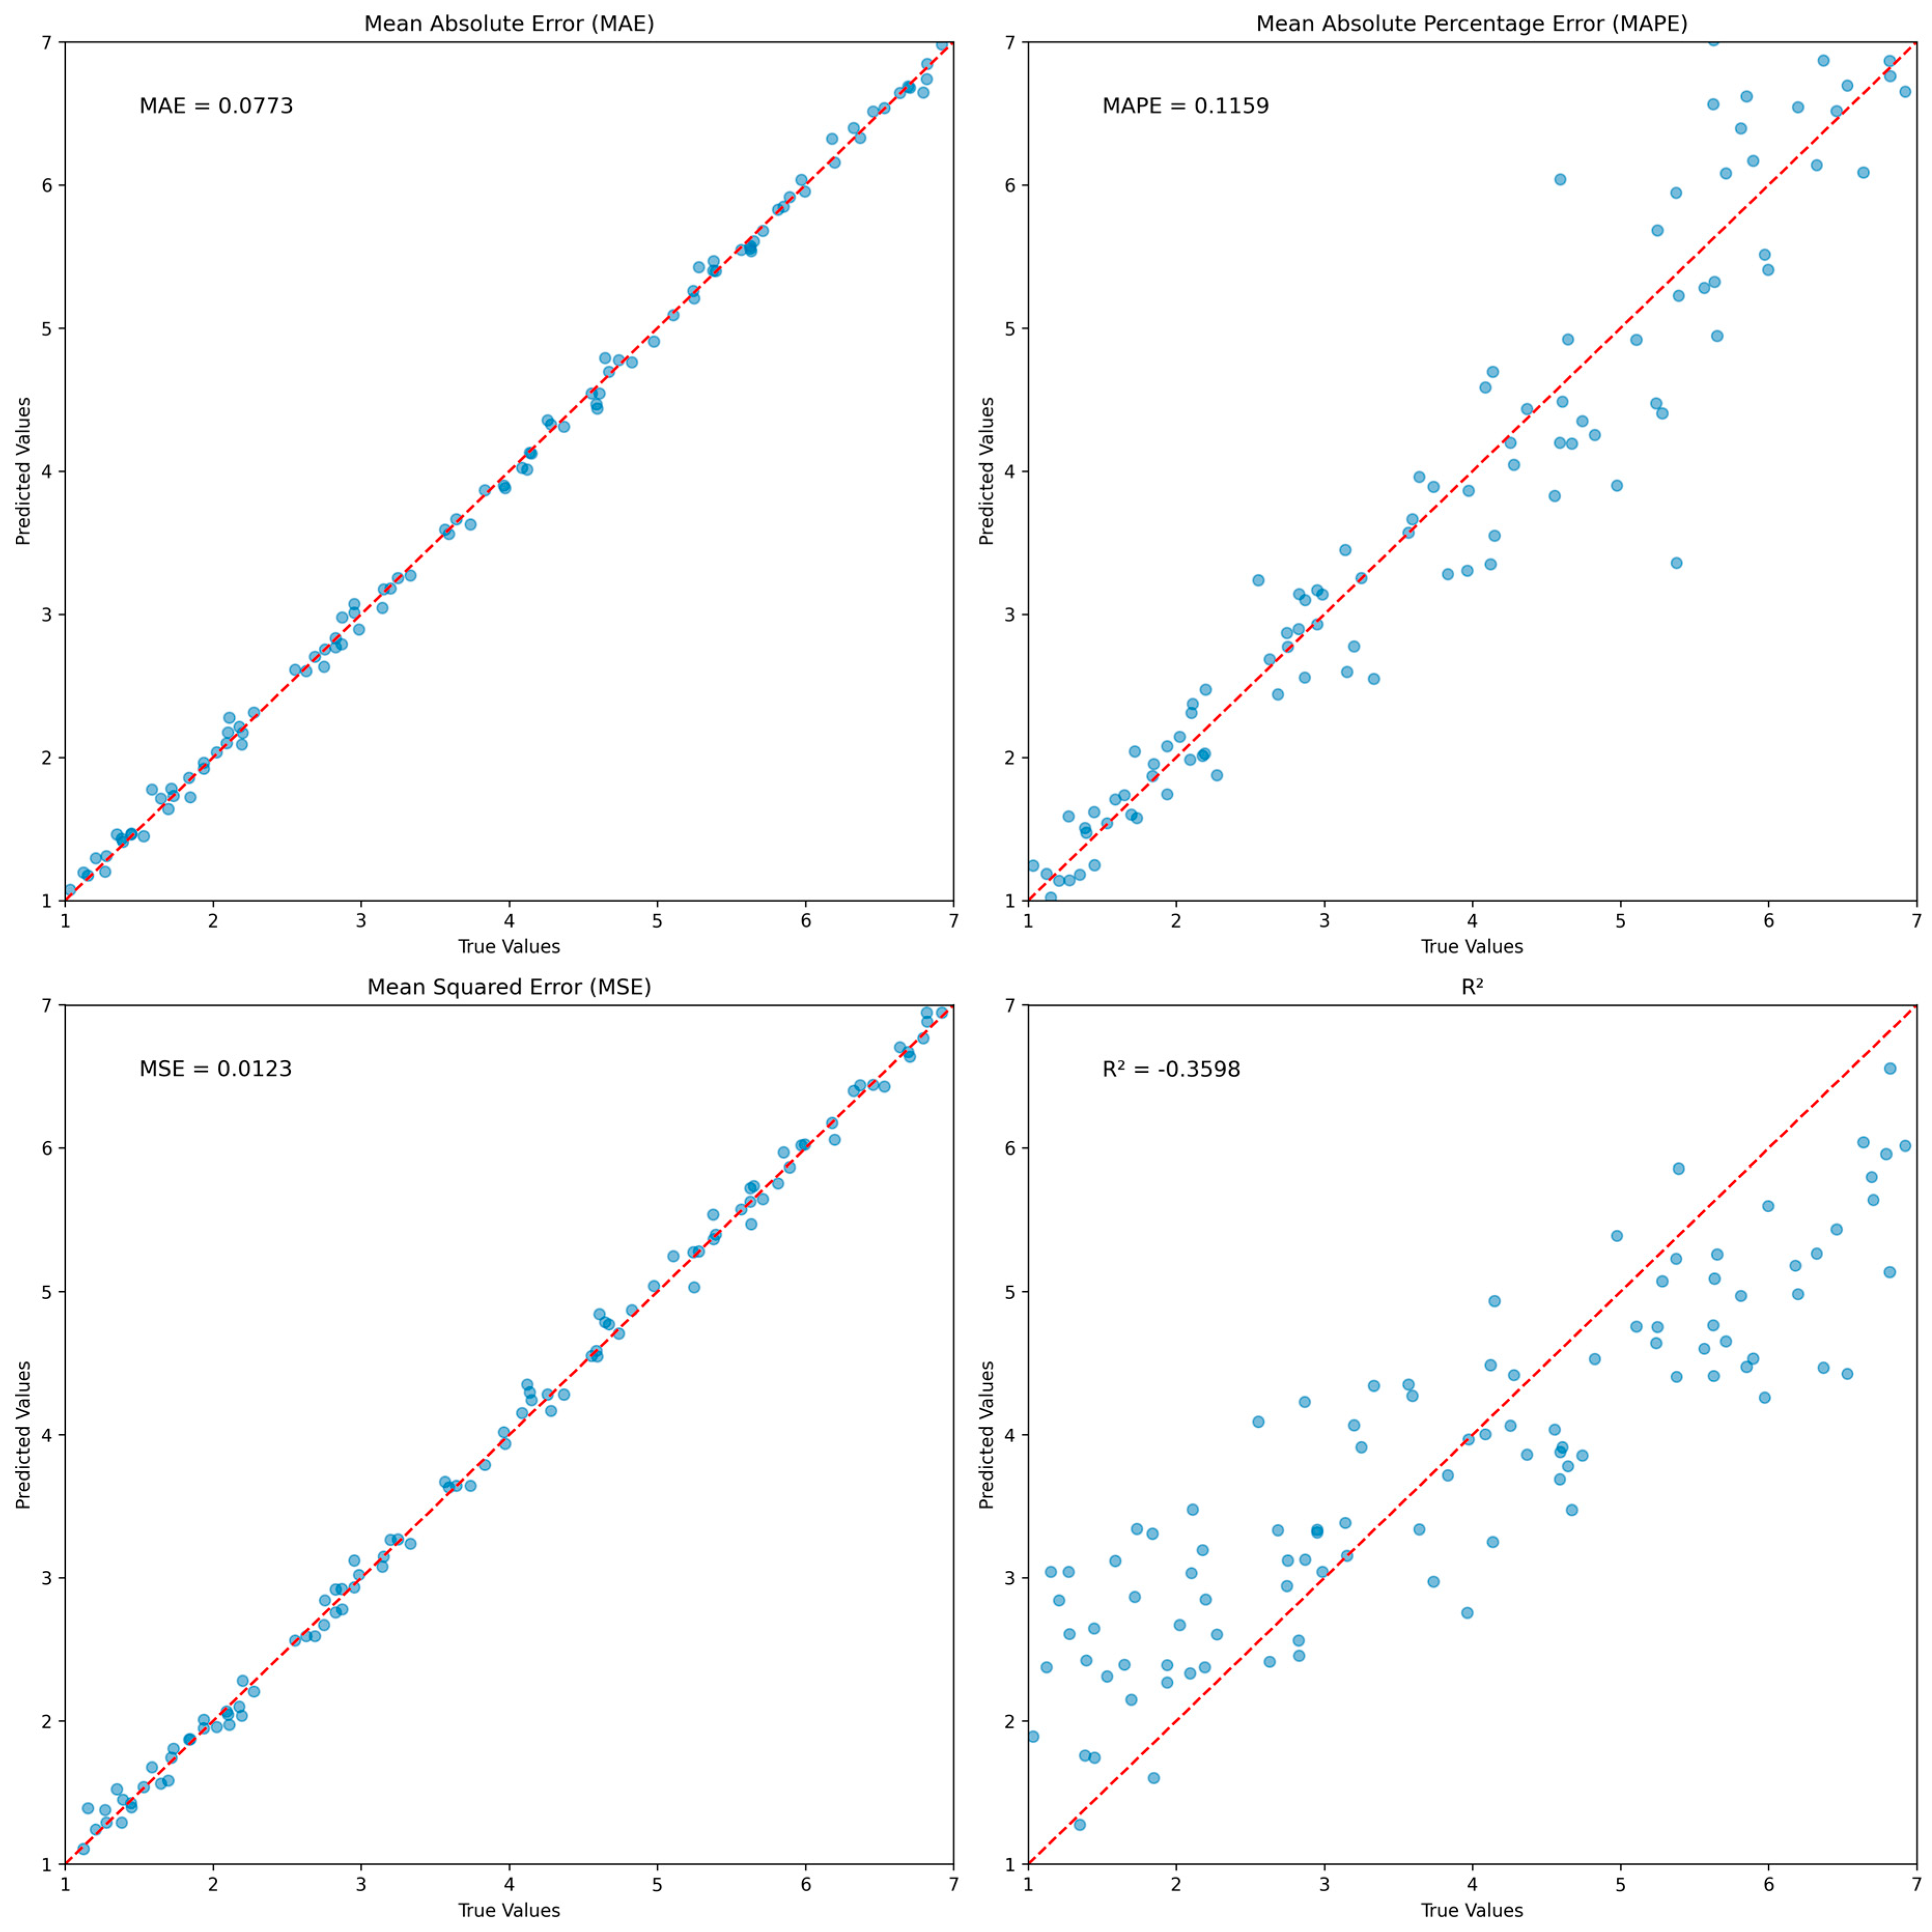
Visualization of the mean absolute error (MAE), the mean absolute percentage error (MAPE), the mean squared error (MSE), and the score on the test data for the Fusion (Visual + Audio) model. Blue dots represent individual data points, showing the relationship between predicted and true values. A red dashed line represents the ideal scenario where predicted values perfectly match true values. The closer the blue dots are to this line, the better the model’s predictions.
To optimize the model convergence, we utilized a combined loss function for both tasks: group cohesion and group emotion prediction. We use mean squared error loss to minimize the gap between the cohesion level and model prediction. We used focal loss for the classification problem because of the imbalanced classes. The final loss function, is expressed as follows:
where N is the number of samples, and are the true cohesion level and the predicted cohesion score, respectively, is the predicted probabilities of the emotional states, and and are the focal loss parameters.
5. Experimental Results
5.1. Experimental Settings
The GCE dataset was partitioned randomly into training, validation, and test sets, at a ratio of 7:1:2 based on the video IDs. The experiments were systematically conducted in both unimodal and multimodal scenarios, with the selection of the optimal training weights determined by assessing the validation loss. The optimization of all the models was executed utilizing the Rectified Adam method, employing a learning rate of 1 × 10⁻⁵, and employing a batch size of 64, as detailed in Table 6 outlining the models’ parameters. In the visual fusion configuration, the outputs of the AvgPool layers from the Face_1 and Face_2 models, along with the FC1 layer from the SlowFast model, were input into the tri-modality Multi-Head Attention (MHA) fusion to facilitate the learning of their cross-relations. Similarly, for the audio fusion, the FC1 layers of the OpenSMILE and Wav2Vec 2.0 models, as well as the AvgPool layer of the spectrogram model, were selected as inputs for the tri-modality MHA fusion. After obtaining outputs from the tri-modality MHA fusion blocks, the multimodal fusion model for visual and auditory cues proceeded to feed them into the bi-modality fusion process before formulating the predictions.
Table 6.
Models’ settings. Output1 is the emotional classification, Output2 is the cohesion prediction.
5.2. Performance
The evaluation of model performance involves the simultaneous goals of forecasting group cohesion and identifying group emotions. Various quantitative assessment metrics were utilized to evaluate the effectiveness of the models in forecasting group cohesion. These metrics include mean absolute error (MAE), mean absolute percentage error (MAPE), mean squared error (MSE), and R-squared (). The results of predicting group cohesiveness are presented in Table 7. In the single-modality experiment, the model using a spectrogram as a feature showed the best performance. This resulted in an MAE of 0.547, an MAPE of 0.173, an MSE of 0.864, and a coefficient of determination of −0.022. In addition, the model using Face_2 as a feature showed a low error rate in terms of MAE, MAPE, MSE, and . The proposed baseline model, fusion with visual and audio showed a high performance, exhibiting the lowest error rates in cohesiveness prediction with an MAE of 0.077, an MAPE of 0.116, and an MSE of 0.012, respectively. The performance metrics of the Fusion (Visual + Audio) model’s MAE, MAPE, MSE, and R-squared (R2) metrics on the test dataset are shown in Figure 10. Based on the test data, we observed the error between the predicted and true labels. In the case of the Fusion (Visual + Audio) model, this showed a relatively high performance on MAE and MSE.
Table 7.
Performance on group cohesion prediction. Fusion (Audio) includes representations of OpenSMILE, Wav2Vec 2.0, and a spectrogram. Fusion (Visual) includes representations of Face_1, Face_2, and the SlowFast model. ↓ indicates that lower is better and ↑ indicates that higher is better.
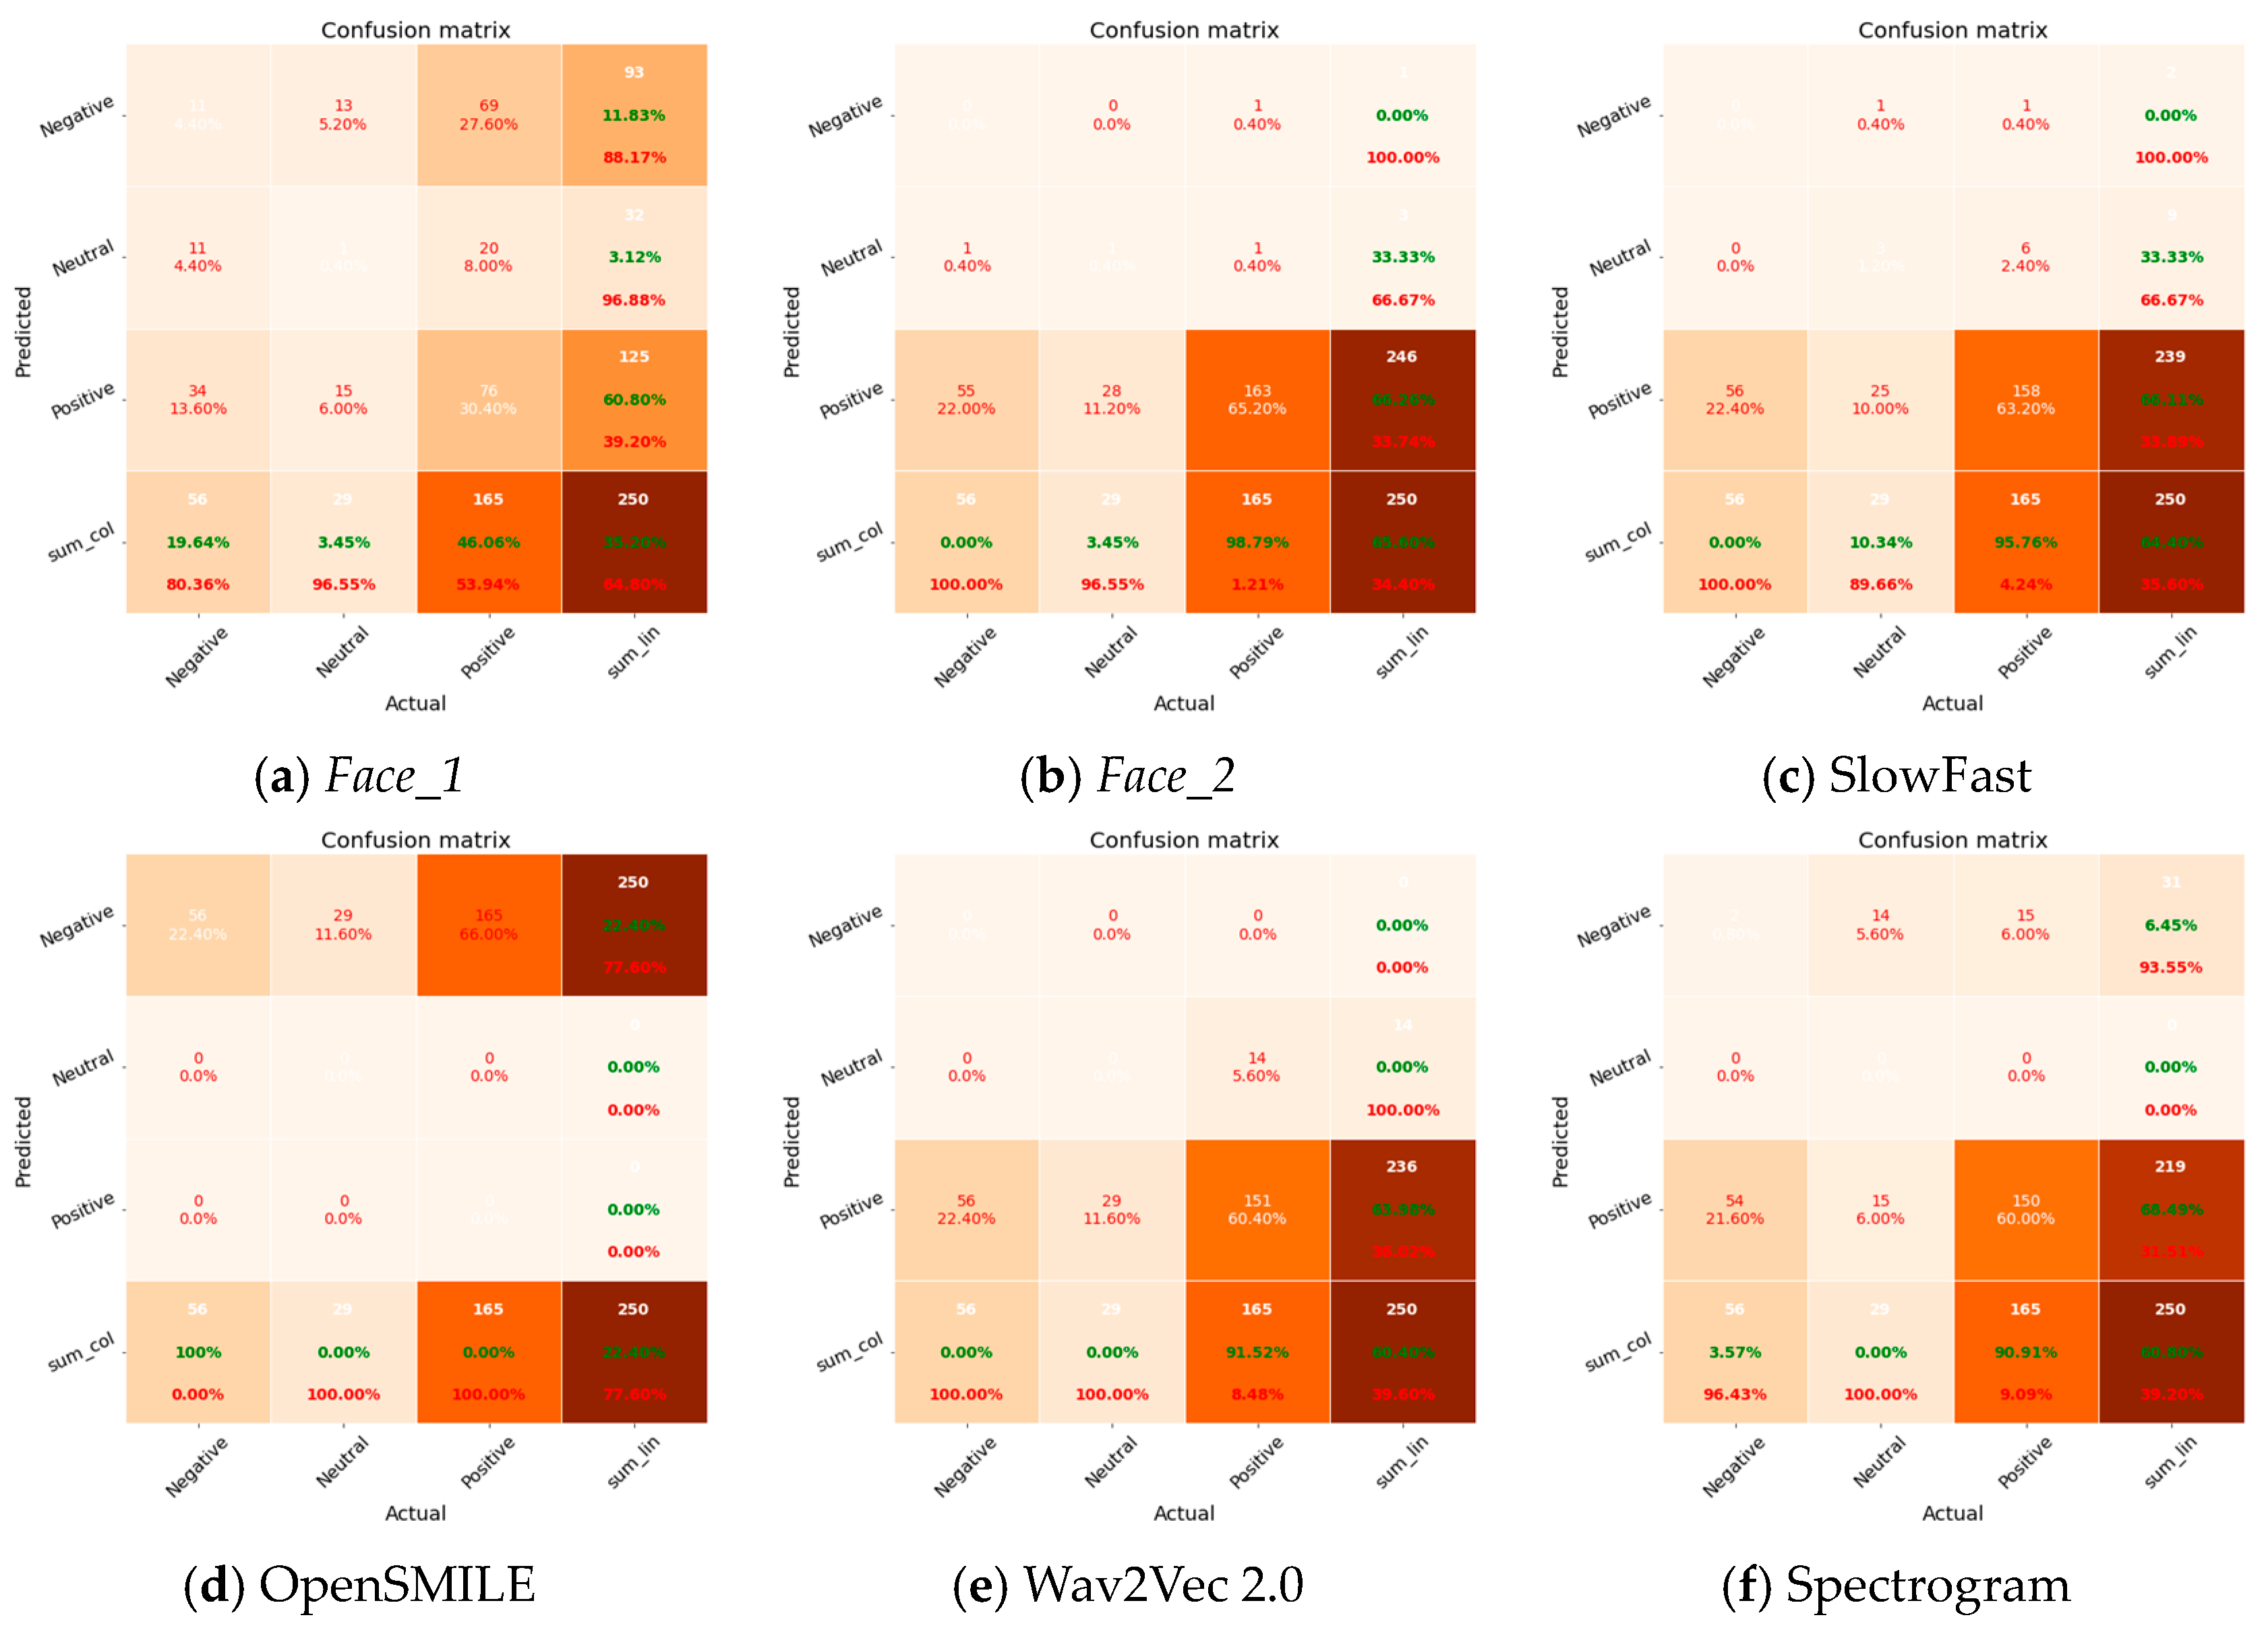
We used accuracy (Acc), precision (Pre), recall (Rec), F_1 score, average precision (AP), and area under the receiver operating characteristic curve (AUC) as classification evaluation metrics. The baseline results are shown in Table 8. In a single-modality experiment, the model using SlowFast as a feature showed a high performance with a precision of 0.33 and a recall of 0.35, and the model using a spectrogram as a feature showed a high performance with an AP and AUC of 0.53 and 0.73, respectively. The proposed baseline model, which fuses visual and audio features, achieved the highest performance with an accuracy of 91% and an score of 0.32. This confirmed that a model that combines visual and audio features is more effective for classifying group emotions than a model that uses a single modality. Although the baseline model had the characteristic of a good prediction performance for each class, it showed a performance difference of about 0.2 in the AP and AUC metrics compared with the model that only uses a spectrogram due to the characteristics of the imbalanced dataset.
Table 8.
Performance on group emotion recognition. Fusion (Audio) includes representations of OpenSMILE, Wav2Vec 2.0, and a spectrogram. Fusion (Visual) includes representations of Face_1, Face_2, and the SlowFast model. ↑ indicates that higher is better.
Figure 11 provides a graphical depiction of the confusion matrix, which presents a thorough evaluation of the effectiveness of both the unimodal and multimodal approaches in categorizing three separate emotional classes within the groups: negative, neutral, and positive. Upon a thorough examination of the outcomes, it became evident that a recurring obstacle faced by all models is the phenomenon of overfitting. This observation highlights a prevalent pattern in the models where there is a tendency to give more weight to predictions for the dominant class (positive). However, it is important to note that the OpenSMILE model stands out as an exception, because it shows a noticeable ability to accurately predict instances belonging to the negative class.

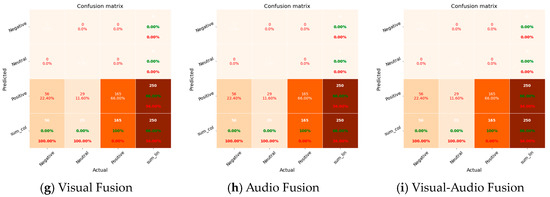
Figure 11.
Confusion matrix for group emotion recognition.
5.3. Discussion
In this study, we created a novel group cohesion and emotion (GCE) dataset encompassing two modalities, audio and visual, meticulously segmented into 30 s intervals. The primary purpose of this dataset was to facilitate the prediction of group cohesion and the recognition of group emotion within conversational contexts. This resource holds a potential interest for scholars across diverse disciplines, including psychology, affective computing, and multimodal learning. Departing from the conventional approach of individual emotion recognition, this dataset allowed for an exploration of group dynamics, shedding light on the interplay between group emotional states and cohesion. To construct the dataset, video clips were queried using common human–human interaction terms, such as “casual conversation”, “interview”, “meeting”, “debate”, and “discussion”, specifically focusing on groups comprising two to five individuals. A total of 1029 video clips were meticulously segmented to a predefined duration to streamline the development of deep learning models.
Addressing the challenges posed by variable-length videos in deep neural networks, the segmentation facilitated efficient model construction, minimizing the complexity in the network design. The objectives of this dataset were as follows:
- Data Creation: The primary objective was to construct the Group Cohesion and Emotion (GCE) dataset, which comprised 1029 segmented videos sourced from YouTube with the creative common license to address copyright concerns. These videos showcased a variety of group interactions, such as interviews, meetings, and casual conversations. Following the publication of this paper, we will make this dataset available for further research. This dataset served as a foundation for the in-depth analysis of group cohesion and emotion within social interactions.
- Annotation Process: To create a reliable foundation for subsequent research, the dataset was meticulously annotated. Graduate psychology students assigned group cohesion levels within the range of 1 to 7 and categorized affective states as negative, neutral, or positive for each 30 s video segment.
- Inter-Rater Reliability Analysis: To ensure the reliability and consistency of the dataset, the study employed the Fleiss Kappa statistic to assess the level of agreement among the seven annotators for categorizing group emotions. The analysis confirmed the dependability of the annotation process.
- Model Development: The study aimed to establish a foundational model for predicting group cohesion and detecting group emotion within the GCE dataset. Advanced visual and audio embedding techniques, including RetinaFace, FaceNet, EfficientNet, SlowFast, OpenSMILE, and Wav2Vec 2.0, were utilized for feature extraction. Multi-Head Attention (MHA) fusion was incorporated to enhance cross-representation learning.
- Unimodal and Multimodal Analysis: The research conducted an in-depth analysis of group cohesion prediction and group emotion detection using both unimodal and multimodal techniques. This provided insights into the effectiveness of the different approaches and the interplay between the visual and audio features.
- Challenges of Class Imbalanced: The dataset was constructed by collecting videos of group members having conversations, which were predominantly positive in real life. Consequently, the dataset reflected the real world and had a very high proportion of positive classes. Training a model on such an imbalanced dataset posed challenges, including difficulties in model convergence and a tendency to predict only the majority class. In this study, we aimed to improve the prediction accuracy for each class by enabling the model to learn the features specific to each class. While the baseline model performed well in predicting each class, even with an imbalanced dataset, it was limited to only increasing the prediction probability for the minority class.
The research endeavored to achieve a thorough comprehension of the interaction between group cohesion and group emotion. The GCE dataset and its corresponding model represent significant assets for future research within the field of group dynamics and psychology. After a thorough examination of the data, significant connections were observed between group cohesion and group emotion in various scenarios. Positive emotions consistently resulted in higher cohesiveness scores, whereas negative emotions were linked to lower cohesion values. The level of cohesiveness varied across different settings. For instance, in argument scenarios, a low level of cohesion was observed for negative emotions. On the other hand, casual conversations, meetings, and interviews indicated a high level of cohesion. The scenario of the conversation exhibited a diverse range of cohesiveness scores, ranging from 1 to 6, which can be attributed to the likely presence of agreement or disagreement among the participants during the discussions. It is worth noting that the discussions and interviews often exhibited a dearth of unpleasant feelings. The expected influence of the participant quantity on group cohesion exhibited negligible variability within the range of two to five individuals.
A foundational multimodal system was proposed using cutting-edge deep learning methods to simultaneously forecast the group cohesiveness scores and emotional states. The evaluation findings demonstrated that the spectrogram of audio representation and facial expressions in visual representation exhibited a superior performance compared with the other unimodal extractors. The utilization of transfer learning techniques, specifically focusing on facial expression characteristics, has been shown to significantly improve the accuracy of group-level emotion recognition. Although spectrograms have been proven to be effective in recognizing emotions, fusion models did not demonstrate substantial enhancements compared with unimodal techniques. The lack of an equal distribution of classes in the GCE dataset posed a challenge for deep models to achieve a full comprehension of the underlying classes, leading to unaltered results. Given these circumstances, we propose the promotion of innovative data resampling or punishment algorithms as viable approaches to mitigating the challenges associated with class imbalance.
6. Conclusions
In this paper, we introduced GCE, a new audio-visual dataset dedicated to the study of group cohesion and emotion prediction. The proposed dataset is comprised of 1029 films extracted from YouTube and divided into 30 s segments. Graduate students from the psychology department carefully annotated these video snippets with three emotional classifications (negative, neutral, and positive) and seven levels of cohesion. The dataset was developed in collaboration with Korean groups for a variety of circumstances (interviews, meetings, debates, etc.) using both visual and auditory inputs. We proposed a model based on multi-feature, multi-task group cohesion and emotion prediction. The visual branch retrieved three representation types for facial traits, facial emotion, and the entire video environment. In addition, three types of audio branch representations were recovered using OpenSMILE, Wav2Vec 2.0, and spectrogram encoding. The MHA fusion module was used to combine these feature representations, and the output of the fusion was supplied to the fully connected layers to predict both the group cohesion scores and the group emotional probability. We observed that our dataset is promising due to the imbalanced classes, extensive duration, and diverse environments, which encourage academics to contribute enthusiastically to this study. However, the GCE dataset has some restrictions. First, it solely investigates the visual and audio modalities, excluding the textual one; however, representations of the textual modality also play a significant role in conserved emotion identification. In addition, the dataset lacks physiological data that could be utilized to enhance the comprehension of cohesion and analytical techniques. To improve prediction performance, we intend to expand the dataset with text data in future studies. In addition, we will study how the interactions between speakers in conversation may affect the group’s efficiency and comprehension.
Author Contributions
All authors contributed to the study conception and design. Material preparation, data collection, and analysis were performed by S.P., N.-H.H. and E.L.; First draft of the manuscript was written by N.-H.H.; Supervision and project administration were performed by H.-J.Y. All authors have read and agreed to the published version of the manuscript.
Funding
This work was supported by the National Research Foundation of Korea (NRF) grant funded by the Korean government (MSIT) (RS-2023-00219107), in part by the Institute of Information and Communications Technology Planning and Evaluation (IITP) under the Artificial Intelligence Convergence Innovation Human Resources Development (IITP-2023-RS-2023-00256629) grant funded by the Korean government (MSIT), and in part by the MSIT (Ministry of Science and ICT), Korea, under the Innovative Human Resource Development for Local Intellectualization support program (IITP-2023-RS-2022-00156287) supervised by the IITP (Institute for Information and Communications Technology Planning and Evaluation).
Institutional Review Board Statement
Regarding Institutional Review Board approval, since it is not directly collected from human subjects, it is under the exemption from IRB review.
Informed Consent Statement
Not applicable.
Data Availability Statement
Publicly available datasets were analyzed in this study. This data can be found here: https://sites.google.com/view/gcedataset.
Conflicts of Interest
The authors declare they have no financial interests.
References
- Carron, A.V.; Widmeyer, W.N.; Brawley, L.R. The development of an instrument to assess cohesion in sport teams: The Group Environment Questionnaire. J. Sport Exerc. Psychol. 1985, 7, 244–266. [Google Scholar] [CrossRef]
- Barsade, S.G.; Gibson, D.E. Group Emotion: A View from Top and Bottom; Gruenfeld, D.H., Ed.; Elsevier Science: Amsterdam, The Netherlands, 1998; pp. 81–102. [Google Scholar]
- Ekman, P.; Friesen, W.V. Constants across cultures in the face and emotion. J. Personal. Soc. Psychol. 1971, 17, 124–129. [Google Scholar] [CrossRef] [PubMed]
- Posner, J.; Russell, J.A.; Peterson, B.S. The circumplex model of affect: An integrative approach to affective neuroscience, cognitive development, and psychopathology. Dev. Psychopathol. 2005, 17, 715–734. [Google Scholar] [CrossRef] [PubMed]
- Guo, D.; Wang, K.; Yang, J.; Zhang, K.; Peng, X.; Qiao, Y. Exploring regularizations with face, body and image cues for group cohesion prediction. In Proceedings of the 2019 International Conference on Multimodal Interaction, Suzhou, China, 14–18 October 2019. [Google Scholar]
- Dang, X.T.; Yang, H.J.; Lee, G.S.; Kim, S.H. D2C-Based Hybrid Network for Predicting Group Cohesion Scores. IEEE Access 2021, 9, 84356–84363. [Google Scholar]
- Zhu, B.; Guo, X.; Barner, K.; Boncelet, C. Automatic group cohesiveness detection with multi-modal features. In Proceedings of the 2019 International Conference on Multimodal Interaction, Suzhou, China, 14–18 October 2019. [Google Scholar]
- Maman, L. Multimodal Groups’ Analysis for Automated Cohesion Estimation. In Proceedings of the 2020 International Conference on Multimodal Interaction, Utrecht, The Netherlands, 25–29 October 2020. [Google Scholar]
- Corbellini, N.; Ceccaldi, E.; Varni, G.; Volpe, G. An exploratory study on group potency classification from non-verbal social behaviours. In Proceedings of the International Conference on Pattern Recognition, Montréal, QC, Canada, 21–25 August 2022. [Google Scholar]
- Ghosh, S.; Dhall, A.; Sebe, N. Automatic group affect analysis in images via visual attribute and feature networks. In Proceedings of the 2018 25th IEEE International Conference on Image Processing (ICIP), Athens, Greece, 7–10 October 2018. [Google Scholar]
- Mou, W.; Celiktutan, O.; Gunes, H. Group-level arousal and valence recognition in static images: Face, body and context. In Proceedings of the 2015 11th IEEE International Conference and Workshops on Automatic Face and Gesture Recognition (FG), Ljubljana, Slovenia, 4–8 May 2015. [Google Scholar]
- Sharma, G.; Ghosh, S.; Dhall, A. Automatic group level affect and cohesion prediction in videos. In Proceedings of the 2019 8th International Conference on Affective Computing and Intelligent Interaction Workshops and Demos (ACIIW), Cambridge, MA, USA, 3–6 September 2019. [Google Scholar]
- Guo, X.; Polania, L.; Zhu, B.; Boncelet, C.; Barner, K. Graph neural networks for image understanding based on multiple cues: Group emotion recognition and event recognition as use cases. In Proceedings of the IEEE/CVF Winter Conference on Applications of Computer Vision, Snowmass Village, CO, USA, 1–5 March 2020. [Google Scholar]
- Dhall, A.; Joshi, J.; Sikka, K.; Goecke, R.; Sebe, N. The more the merrier Analysing the affect of a group of people in images. In Proceedings of the 2015 11th IEEE International Conference and Workshops on Automatic Face and Gesture Recognition (FG), Ljubljana, Slovenia, 4–8 May 2015. [Google Scholar]
- Ghosh, S.; Dhall, A.; Sebe, N.; Gedeon, T. Predicting group cohesiveness in images. In Proceedings of the 2019 International Joint Conference on Neural Networks (IJCNN), Budapest, Hungary, 14–19 July 2019. [Google Scholar]
- Rabiee, H.; Haddadnia, J.; Mousavi, H.; Kalantarzadeh, M.; Nabi, M.; Murino, V. Novel dataset for fine-grained abnormal behavior understanding in crowd. In Proceedings of the 2016 13th IEEE International Conference on Advanced Video and Signal Based Surveillance (AVSS), Colorado Springs, CO, USA, 23–26 August 2016. [Google Scholar]
- Alameda-Pineda, X.; Subramanian, R.; Ricci, E.; Lanz, O.; Sebe, N. SALSA: A multimodal dataset for the automated analysis of free-standing social interactions. In Group and Crowd Behavior for Computer Vision; Academic Press: Cambridge, MA, USA, 2017. [Google Scholar]
- Cabrera-Quiros, L.; Demetriou, A.; Gedik, E.; Van der Meij, L.; Hung, H. The MatchNMingle dataset: A novel multi-sensor resource for the analysis of social interactions and group dynamics in-the-wild during free-standing conversations and speed dates. IEEE Trans. Affect. Comput. 2018, 12, 113–130. [Google Scholar] [CrossRef]
- Koutsombogera, M.; Vogel, C. Modeling collaborative multimodal behavior in group dialogues: The MULTISIMO corpus. In Proceedings of the Eleventh International Conference on Language Resources and Evaluation (LREC 2018), Miyazaki, Japan, 7–12 May 2018. [Google Scholar]
- Maman, L.; Ceccaldi, E.; Lehmann-Willenbrock, N.; Likforman-Sulem, L.; Chetouani, M.; Volpe, G.; Varni, G. Game-on: A multimodal dataset for cohesion and group analysis. IEEE Access 2020, 8, 124185–124203. [Google Scholar] [CrossRef]
- Zheng, W.-L.; Dong, B.-N.; Lu, B.-L. Multimodal emotion recognition using EEG and eye tracking data. In Proceedings of the 2014 36th Annual International Conference of the IEEE Engineering in Medicine and Biology Society, Chicago, IL, USA, 26–30 August 2014. [Google Scholar]
- Park, T.J.; Park, S.H. Emotional Evaluation about IAPS in Korean University Students. Korean J. Cogn. Sci. 2009, 20, 183–195. [Google Scholar]
- Cota, A.A.; Evans, C.R.; Dion, K.L.; Kilik, L.; Longman, R.S. The structure of group cohesion. Personal. Soc. Psychol. Bull. 1995, 21, 572–580. [Google Scholar] [CrossRef]
- Joshi, A.; Kale, S.; Chandel, S.; Pal, D.K. Likert scale: Explored and explained. Br. J. Appl. Sci. Technol. 2015, 7, 396. [Google Scholar] [CrossRef]
- Al-Twairesh, N.; Al-Khalifa, H.; Al-Salman, A.; Al-Ohali, Y. Arasenti-tweet: A corpus for arabic sentiment analysis of saudi tweets. Procedia Comput. Sci. 2017, 117, 63–72. [Google Scholar] [CrossRef]
- Hallgren, K.A. Computing inter-rater reliability for observational data: An overview and tutorial. Tutor. Quant. Methods Psychol. 2012, 8, 23. [Google Scholar] [CrossRef] [PubMed]
- Fleiss, J.L. Measuring nominal scale agreement among many raters. Psychol. Bull. 1971, 76, 378. [Google Scholar] [CrossRef]
- Florian, S.; Dmitry, K.; James, P. FaceNet: A Unified Embedding for Face Recognition and Clustering. In Proceedings of the IEEE Conference on Computer Vision and Pattern Recognition (CVPR) 2015, Boston, MA, USA, 7–12 June 2015; pp. 815–823. [Google Scholar]
- Mingxing, T.; Quoc, L. EfficientNet: Rethinking Model Scaling for Convolutional Neural Networks. In Proceedings of the 36th International Conference on Machine Learning 2019, PMLR 97, Long Beach, CA, USA, 9–15 June 2019; pp. 6105–6114. [Google Scholar]
- Christoph, F.; Haoqi, F.; Jitendra, M.; Kaiming, H. SlowFast Networks for Video Recognition. In Proceedings of the IEEE/CVF International Conference on Computer Vision (ICCV) 2019, Seoul, Republic of Korea, 27 October–2 November 2019; pp. 6202–6211. [Google Scholar]
- Florian, E.; Martin, W.; Björn, S. Opensmile: The munich versatile and fast open-source audio feature extractor. In Proceedings of the 18th ACM international conference on Multimedia (MM ‘10), Firenze, Italy, 25–29 October 2010; pp. 1459–1462. [Google Scholar]
- Alexei, B.; Yuhao, Z.; Abdelrahman, M.; Michael, A. wav2vec 2.0: A Framework for Self-Supervised Learning of Speech Representations. Adv. Neural Inf. Process. Syst. (NeurIPS) 2020, 33, 12449–12460. [Google Scholar]
- Vaswani, A.; Shazeer, N.; Parmar, N.; Uszkoreit, J.; Jones, L.; Gomez, A.N.; Polosukhin, I. Attention is all you need. Adv. Neural Inf. Process. Syst. 2017, 30, 6000–6010. [Google Scholar]


Disclaimer/Publisher’s Note: The statements, opinions and data contained in all publications are solely those of the individual author(s) and contributor(s) and not of MDPI and/or the editor(s). MDPI and/or the editor(s) disclaim responsibility for any injury to people or property resulting from any ideas, methods, instructions or products referred to in the content. |
© 2024 by the authors. Licensee MDPI, Basel, Switzerland. This article is an open access article distributed under the terms and conditions of the Creative Commons Attribution (CC BY) license (https://creativecommons.org/licenses/by/4.0/).