Abstract
This study used Theil–Sen median trend analysis and Mann–Kendall test, which are more suitable for long-term series research, to analyze high-precision NPP data and investigate the spatiotemporal characteristics of NPP (net primary productivity) in northwest Liaoning from 2001 to 2021. We further analyzed the impact of the natural environment and land use types on NPP in the region using correlation and a one-way linear regression analysis. The results show that (1) the interannual NPP values exhibited a generally increasing yet fluctuating trend, with the gradient of NPP decrease moving from northwest to southeast. (2) NPP in northwest Liaoning was predominantly influenced by climatic variations, with significant impacts from the combined precipitation–temperature effects seen in 74% of the region, 65% influenced by precipitation alone, and 26% by non-climatic factors. (3) The interaction of soil and vegetation also impacted NPP, which displayed variable rising trends across different soil types in northwest Liaoning. (4) Alterations in land use led to a hierarchical arrangement of the multi-year average NPP values, listed from highest to lowest as forest land, grassland, cultivated land, built-up areas, unused land, and watersheds.
1. Introduction
The ecosystem carbon cycle refers to the process of CO2-based carbon exchange between ecosystems and the outside world through biological action [1]. The primary components of the ecosystem carbon cycle are terrestrial ecosystems [2,3,4], which serve vital purposes such as storing carbon, preserving soil and water, and biodiversity [5]. Ways to achieve the sustainable development of terrestrial ecosystems and the stable growth of terrestrial carbon stocks have become important issues in achieving carbon balance.
During the carbon cycle, vegetation effectively reduces greenhouse gasses through photosynthesis [6], which become the primary productivity of terrestrial ecosystems [7,8,9] and have a profound effect on regulating the carbon equilibrium. Net primary productivity (NPP) refers to the quantity of organic carbon that vegetation captures, minus what is expended by autotrophic respiration per unit of time and space [10]. NPP not only indicates the ability for vegetation growth and net carbon sequestration but also determines the material and energy available to human beings and animals [11]. Moreover, it is an important ecological indicator reflecting the functional structure and sustainability of terrestrial ecosystems in the region [12,13,14,15].
With the development of remote sensing technology, more and more scholars have conducted systematic research on the spatiotemporal variation characteristics and influencing factors of regional NPP based on MODIS data. MOD17A3 is an NPP product dataset obtained using the light energy utilization model and BIOME-BGC model. Recently, researchers have widely applied and tested this product in biomass estimation, environmental monitoring, carbon cycling, and global change, demonstrating its ability to accurately reflect the spatiotemporal changes in global ecosystems [16]. Vegetation NPP research in Northeast China has also benefited greatly from it [17]. With a resolution of 500 m, the MOD17A3HGF data product offers a higher resolution than the MOD17A3 data, and its accuracy has undergone thorough verification. Chen Yaru used the Biome-BGC model to figure out the vegetation NPP in the Three Gorges Reservoir area [18]. She then compared the MOD17A3HGF data with the model’s estimated and measured values to make sure the data were correct.
Due to the changing characteristics of NPP, many scholars have used Theil–Sen median trend analysis combined with the Mann–Kendall test method to explore the long-term changing trends in NPP. The combination of these two methods can effectively determine the trend in long-term data series changes, and there is no specific requirement for data distribution types, making it widely used in vegetation carbon sequestration analysis. Researchers have used this method to analyze global NPP changes, which generally show an increasing trend. However, in tropical regions such as the Amazon rainforest and the Congo Basin, NPP shows a decreasing trend [19]. The trend in vegetation growth dynamics in Nepal suggests an overall increase in NPP, but the changes are not significant [20]. Within the arid regions of China, NPP shows an increasing trend, mainly distributed in the semi-arid areas of northern Shaanxi, the border between Shanxi and Inner Mongolia, the northern part of Shandong, the western part of Northeast China, and the Tianshan Mountains in arid regions of Xinjiang. NPP tends to decrease mainly in arid and semi-humid areas, such as the junction of Xizang and Sichuan, central and southern Hebei, and northeast Inner Mongolia [21]. For local areas, there are significant differences in NPP between different districts and counties due to varying water and heat conditions. This directly reflects the changing trend of vegetation growth status in these areas and plays an important role in exploring the differences in carbon sequestration levels between regions.
Many studies have shown that the increase in NPP from vegetation is the result of both natural and anthropogenic factors [22,23,24,25]. Due to the differences in natural factors, along with human production and lifestyle, in different regions, NPP shows regional variability and exhibits a region-specific spatial distribution pattern over a certain time frame. NPP in China was found to have a changing and growing tendency over the previous 20 years, with values generally increasing in the southeastern regions and decreasing in the northwestern areas [26,27]. Within the northeastern region, it seems that the NPP decreased from northeast to southwest [28,29].
NPP is greatly influenced by climatic factors and exhibits different seasonal and interannual patterns of change. Researchers have recently examined the causes of NPP in several parts of China and proposed a correlation between variations in NPP and weather factors such as temperature and rainfall [30,31], and indicated that the NPP influenced by the temperature and precipitation combination in different regions. However, except from the temperature and precipitation, changes in land use type, especially those induced by human activity, will also affect NPP changes. The detrimental effects of human activity on NPP mainly occur through transforming arable land into urbanized areas by grazing and economic activities [32], or changing highly productive land use categories into less productive ones [8]. A positive impact mainly occurs through the initiative to reforest and restore grasslands from previously cultivated land, prohibiting cutting and grazing, reducing soil erosion, and through other ecosystem conservation measures [33]. However, the specific changes in NPP caused by land use transformation are relatively less studied. In addition to the effects of climate and human activities, studies have shown that different soil types also have varying effects on plant growth conditions due to their fertility conditions, but the specific degree of influence is also relatively less studied.
Northwest Liaoning sits on the southern border of the Horqin Sandy Land, which is China’s key area of ecological sensitivity in the sandy northern regions of western Liaoning and a national key soil erosion control area. This area also is an important pilot study for ecological civilization in Liaoning Province, grassland sandy management, and ecological restoration. The plains of Northeast China, North China, and other areas all have their ecological security successfully safeguarded by this significant ecological barrier [34,35]. In view of this, we firstly used the R programming language to conduct a Theil–Sen median trend analysis and a Mann–Kendall test on the MOD17A3HGF NPP data from 2001 to 2021. Then, we explored the features of NPP’s spatial and temporal variations in northwest Liaoning over this period. Finally, we discussed the effects of human actions and environmental factors on NPP in northwest Liaoning, using the correlation and linear regression analysis. This will help to strengthen our understanding of the long-term trends in NPP changes in the northwest region of Liaoning, further clarify the mechanisms of the impacts of NPP differences in different districts and counties, and focus on the key roles of local climate, soil, and land use changes in vegetation growth processes.
2. Materials and Methods
2.1. Geographic and Climatic Context of the Study Region
The northwest Liaoning region is located at 118°50′ E–124°26′ E and 39°59′ N–43°29′ N, bordered by the region of Inner Mongolia in the north and Hebei Province in the south, and encompasses four prefectural-level cities and the counties and municipalities under their jurisdiction, namely Chaoyang, Fuxin, Jinzhou, and Huludao, as well as the cities of Xinmin, Faku, and Kangping, counties under the jurisdiction of Shenyang, and the county of Changtu under the jurisdiction of Tieling (Figure 1). With high temperatures and rainy summers, chilly and dry winters, and a significant variation in interannual precipitation, the climate is dominated and characterized by a temperate continental monsoon climate, averaging an annual rainfall of 430–680 mm [36] and a yearly average of evapotranspiration of 1000.4–1500.4 mm [37]. The region’s temperature and precipitation show a tendency of steadily declining from southeast to northwest, due to the effect of dry, cold air from Mongolia’s Siberian Plateau in the north, while evapotranspiration shows the opposite trend. Northwest Liaoning is a low mountainous and hilly region, with geomorphological features dominated by accretionary landforms, including the West Liao River alluvial high plain, the Liao River low plain, and wind-deposited sandy land. The soil is dominated by brown and brown soils, which are distributed in a mosaic, and the soil texture is mostly loam and sandy loam, with the main water systems being the Liao River, the Daling River, and the Raoyang River.
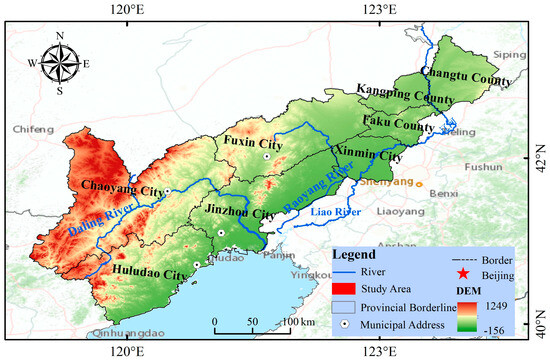
Figure 1.
The terrain and location of northwest Liaoning Province.
2.2. Sources and Processing of Data
2.2.1. Data on NPP
This study’s NPP data originated from NASA’s MOD17A3HGF dataset, which covered the years from 2001 to 2021, featuring a spatial resolution of 500 m and a temporal granularity of one year. The datasets were downloaded one by one using software tools ENVI 5.3 and ArcGIS 10.8 Reprojection. Splicing, cropping, and format conversion were performed one by one, using ENVI 5.3 and ArcGIS 10.8 software to multiply the scale factor. Then, the units were converted to gC·m−2·a−1 and the coordinates were unified to GCS_WGS_1984. With greater overall accuracy, this dataset simulated NPP values based on the light consumption model and the BIOME-BGC model. Further, it was applied to study NPP changes in regional vegetation.
2.2.2. Meteorological Data
The meteorological data used in this study included monthly average temperatures and monthly precipitation from 2001 to 2021, sourced from the CRU TS monthly dataset (Climate Research Unit) produced by the National Centre for Atmospheric Sciences (NCAS) in the UK, https://crudata.uea.ac.uk/cru/data/hrg/ (accessed on 19 November 2022). This dataset is currently one of the most widely used climate datasets, and it includes temperature and precipitation on land worldwide from 1901 to the present, with the exception of Antarctica. Compared to other meteorological data, it has significant advantages, such as wide coverage and long observation time. Therefore, it can not only reveal long-term climate trends but also provide a scientific basis for decision-making in areas such as regional ecology, agriculture, and water resource management. The spatial resolution of the data are 0.5° × 0.5°, and the format is nc data. We obtained the annual average temperature and precipitation in the study area after performing pixel statistics and inverse distance weighting interpolation.
2.2.3. Soil Type Data
The World Soil Database (HWSD), also known as the Harmonized World Soil Database, is the source of the soil type data. This dataset is a high-resolution (1 km) soil database that includes information on soil types, soil properties, soil texture, soil depth, and soil moisture. HWSD covers soil information on a global scale, providing detailed soil data at both global and local scales. This is of enormous significance for land degradation assessment, environmental impact research, and sustainable land management interventions on a global scale. The data source within China comes from the 1:1,000,000 soil data provided by the Nanjing Soil Research Institute during the Second National Land Survey. Authoritative institutions have reviewed and verified these data to ensure their accuracy and reliability. This study used ArcGIS 10.8 software to mask and reclassify HWSD data, dividing all soils under the same soil type group into one category for subsequent calculations.
2.2.4. Data on Land Usage
The land use data adopts the 30 m China Long Term Series Land Use Dataset (CLCD) released by the team of Professor Yang Jie and Professor Huang Xin from Wuhan University, with an overall accuracy of 79.3% and a cultivated land accuracy of over 80% in many years. The land use types in this study area were mainly cultivated land and forest land, with a relatively large proportion of cultivated land area. Therefore, these data have good applicability in this study area. This dataset contains annual land cover information in China from 1985 to 2020, showing a continuous coverage period of 30 years. The biggest advantage of the CLCD dataset is its high temporal resolution, providing annual land use classification results, which is very valuable for studying the dynamics and trends of land use change. This dataset divides land into 9 categories, namely farmland, forests, shrubs, grasslands, water bodies, ice and snow, bare land, impermeable surfaces, and wetlands. Using the “Classification of Land Use Status GB-T21010-2007 [38]” and regional land use characteristics, this study reclassified these into six groups in ArcGIS 10.8 software: land that is farmed, land that is forested, land that is grassland, land that is near water, land that is being built on, and land that is not being used.
2.2.5. DEM Data
DEM data comes from a geographic spatial data cloud (http://www.gscloud.cn/ (accessed on 2 December 2022)). The ASTER GDEM product data have a resolution of 30 m. This dataset covers the global land surface, providing a comprehensive elevation model with high resolution, which is more conducive to local small-scale use. After downloading the data, this study performed mask processing.
2.3. Research Methods
2.3.1. Trend Analysis and Significance
Theil–Sen median trend analysis, also known as Sen slope estimation, is a robust non-parametric statistical method. This method has high computational efficiency and is insensitive to measurement errors and outlier data. It is commonly used for trend analysis of long time series data. In the present study, the raster data of NPP mean values from 2001 to 2021 in the study area were used to perform a Theil–Sen median trend evaluation and a Mann–Kendall statistical test, using the R programming language. The aim was to calculate and analyze the spatial pattern of the annual average NPP and to evaluate the significance of the series’ long-term variations. The formula used is used to calculate the Sen trend was as follows:
where ‘Slope’ represents the slope, and xi and xj represent the annual average values of NPP in NW Liaoning for years i and j, respectively. A Slope > 0 indicates that there has been a rising trend in the annual average NPP value over the course of the 21-year period, as opposed to a declining trend.
The Mann–Kendall test is a non-parametric statistical test method proposed by Mann and Kendall and further refined in the mid-20th century. Its advantage is that it does not require the measured values to follow a normal distribution, nor does it require the trend to be linear, and it is not affected by missing values and outliers. This method has been widely applied in trend significance testing and can be combined with Theil–Sen median trend analysis to determine the trend of long-term data changes. It is commonly used in fields such as climate, hydrology, and vegetation. In addition, it can also verify whether there have been any mutations in the time series. The Mann–Kendall significance test was computed as follows.
Given the assumption that x1, x2, …, xn are time series elements, the test formula for the statistic S is as follows:
The Zs test statistic is determined as follows:
where S denotes a normal distribution, and Var(S) denotes variance; when |Zs| > Z1−α/2, it means that the change in this series is significant at the α level, and when |Zs| exceeds 1.65, 1.96, and 2.58, it indicates that there has been a substantial shift in the annual NPP mean’s trend at the 0.1, 0.05, and 0.01 confidence levels, respectively.
2.3.2. Correlation Analysis
Partial Correlation Analysis
The advantages of partial correlation analysis mainly lie in its ability to accurately reflect the intrinsic linear relationship between two variables and eliminate the interference of other variables on their relationship. For this study, using partial correlation analysis can result in intuitively recognizing the true linear relationship between NPP and temperature and NPP and precipitation, without being affected by other variables.
In this study, an image-by-image metric partial correlation analysis was employed to explore the correlation levels between the annual average NPP and two meteorological factors. The partial correlation coefficient can be computed using the following formula:
where Rxy, Rxz, and Ryz denote the correlation coefficients of annual mean NPP and annual mean temperature, annual mean NPP with annual precipitation, and between annual average temperature and annual precipitation, respectively. Rxy,z refers to the bias correlation coefficient among the annual mean NPP value and the annual mean temperature of northwest Liaoning when the annual precipitation remained constant, and the impact of the annual precipitation factor was excluded when analyzing the correlation of the mean annual temperature factor. Rxz,y is the correlation coefficient between the annual mean NPP and the annual mean temperature factor’s independent effect. Additionally, a t-test with the following formula was used to determine the significance of the partial correlation coefficients, as follows:
where Rxy,z and Rxz,y are partial correlation coefficients, n is the number of samples (n = 21), and m is the number of independent variables.
Complex Correlation Analysis
After using a partial correlation analysis, we introduced a compound correlation analysis to calculate the degree of correlation for multiple factors, taking into consideration the common effect of multiple influencing factors and the mutual influence and interconnection among factors. The advantages of complex correlation analysis mainly lie in its ability to comprehensively evaluate the complex relationships between one variable and multiple variables, providing more accurate and comprehensive evaluations and explanations. The vast majority of vegetation growth processes are influenced by both temperature and precipitation; therefore, it is crucial to consider the comprehensive impact of temperature and precipitation on NPP. The compound correlation between the annual mean NPP, annual precipitation, and annual mean temperature can be computed using the following formula:
Further, the complex correlation coefficients were examined for significance. The statistics were computed using the F-test technique, as follows:
where Rx,yz is the coefficient of complex correlation between the annual mean NPP and the annual mean temperature and annual precipitation, n is the number of samples (n = 21), and k is the number of independent variables.
NPP-Driven Partitioning
The main meteorological factors controlling vegetation growth vary across regions. Correctly dividing the driving types between each district and county in the research area will help to carry out management and decision-making in agriculture, forestry, and other fields, according to local conditions in the future. Combining the results of the partial correlation coefficient (α = 0.01) and the significance test of the complex correlation coefficient (α = 0.05) between the annual mean of NPP and two meteorological factors and referring to previous related studies [39,40], the driving types of NPP annual mean in the study area were delineated and can be seen in Table 1.

Table 1.
The driving factors behind the dynamic change in annual average NPP.
2.3.3. One-Way Linear Regression Analysis
In this study, the year was used as the independent variable, and the yearly average NPP across various soil types in the northwestern Liaoning region was used as the dependent variable for a one-way linear regression analysis. The gradient of the one-way linear regression depicted the trend and rate of change of NPP for different soil types.
The above data sources and research methods are shown in Figure 2.
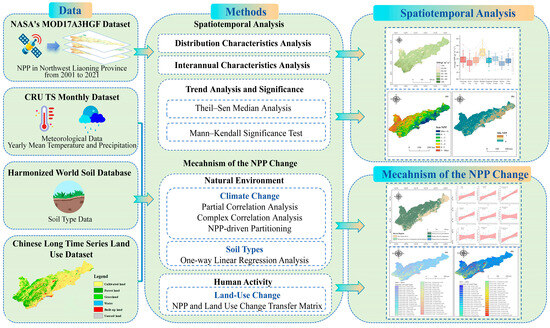
Figure 2.
Research technology roadmap.
2.3.4. Data Verification
The MOD17A3HGF dataset contains annual quality control data (NPP_QC), and its quality control measures include data filtering, outlier handling, spatial interpolation, and data correction. This study conducted a statistical analysis of NPP-QC data in the northwest region of Liaoning Province over the past 21 years, dividing the credibility of NPP data into three levels, namely high, medium, and low [41], and calculating their percentages (Table 2). The results showed that the cumulative percentage of high- and medium-reliability NPP data in the northwest region of Liaoning from 2001 to 2021 reached 99%, indicating that the application of these data in the northwest region of Liaoning is highly accurate.
Table 2.
NPP data credibility classification.
3. Results
3.1. Characteristics of Spatial and Temporal Changes in NPP
3.1.1. General Characteristics of NPP in the Study Area
NPP was averaged over a 21-year period in northwest Liaoning to obtain the gradient of the one-way linear regression depicting the trend (Figure 3). The highest values were located in the southwestern sector of the research area, mainly in Huludao City, Lingyuan City, and Harqin Left Wing Mongolian Autonomous County in the southern part of Chaoyang City, where the annual mean NPP figures exceeded 400 gC·m−2·a−1. In this area, most of the vegetation cover types were forests and thickets with good vegetation growth, while the abundant precipitation and well-developed water systems in the southwestern region were favorable for vegetation growth.
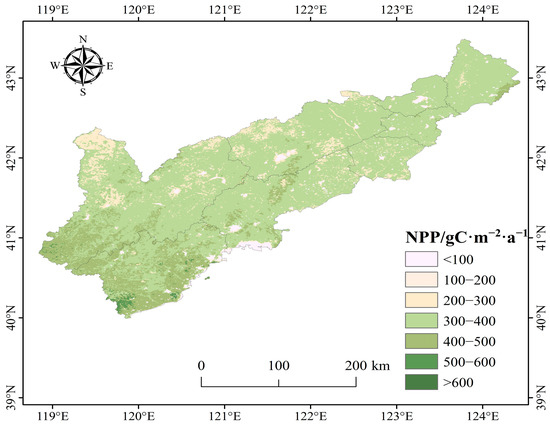
Figure 3.
The spatial distribution of annual average NPP in northwest Liaoning Province from 2001 to 2021.
Most of the areas in the study area had medium values of NPP, including Chaoyang City, the eastern part of Fuxin City, Jinzhou City, Xinmin City, Faku County, Kangping County, and Changtu County, with annual average NPP values ranging from 300 to 400 gC·m−2·a−1. Their values were 344.57 gC·m−2·a−1, 317.97 gC·m−2·a−1, 332.61 gC·m−2·a−1, 313.91 gC·m−2·a−1, 332.2 gC·m−2·a−1, 329.1 gC·m−2·a−1, and 340.74 gC·m−2·a−1. The vegetation cover types were mainly cultivated land, and the mean NPP figures for crops were generally smaller than those of forests and scrubs but larger than those of grasslands in China. The medium-value zones constituted a significant portion of the research area.
The northern region of Chaoyang City and the western section of Fuxin City had low values of NPP, with annual means of less than 300 gC·m−2·a−1. Their deviation was about 30 gC·m−2·a−1. These areas have poor water and heat conditions, and the land use type is mainly grassland with poor vegetation growth. Further, the developed urban areas in the southwestern region of Fuxin City may be more affected by anthropogenic activities, contributing to low NPP values. Overall, the mean annual NPP values in northwestern Liaoning varied considerably in the west, while the vegetation growth level was more similar to the rest of the region.
3.1.2. Characteristics of Interannual Changes in NPP Values
We separately calculated the mean values and interannual changes in NPP in eight cities and counties in the northwest Liaoning region from 2001 to 2021 (Figure 4). In general, the yearly average NPP in the northwest Liaoning region displayed a varying upward trend, with relatively stable changes, while the cities and counties had similar trends. Over the two decades, the annual average NPP value in 2021 was significantly higher than in other years, and it was also higher in 2012. Before and after 2012, there was a sequence of growth succeeded by a reduction. Comparing the annual average NPP values in different regions, Huludao City had a higher NPP value than other areas, with 11 years exceeding 400 gC·m−2·a−1, indicating vigorous vegetation growth. From 2001 to 2012, Fuxin City had an overall lower mean annual NPP than other regions, and from 2013 to 2021, Xinmin City had the lowest value in the region. Calculating the disparity between the highest and lowest values showed that the region with the most substantial rise in the yearly average NPP was Chaoyang City, possessing a figure of 167.1 gC·m−2·a−1, while the region with the smallest change was Changtu County, with an increase of 124.5 gC·m−2·a−1. The increase in NPP values in descending order of magnitude was as follows: Chaoyang City, Fuxin City, Kangping County, Faku County, Huludao City, Xinmin City, Jinzhou City, and Changtu County.
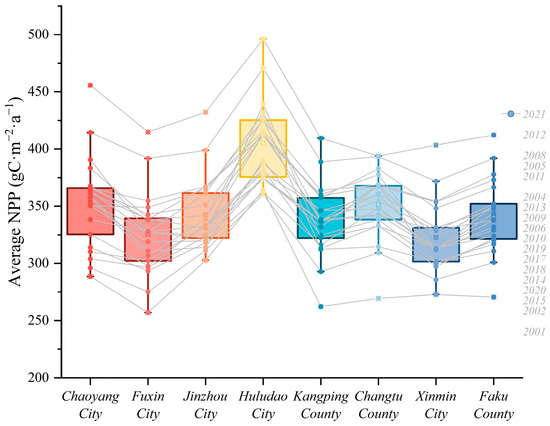
Figure 4.
Interannual variation in average NPP for different regions in the northwest Liaoning Province from 2001 to 2021.
3.1.3. Characteristics of Spatial Change in NPP
From 2001 to 2021, the slope of NPP change in northwest Liaoning ranged from −15.3 to 18.6, with the slope change concentrated between 0 and 5, and the areas with upward and downward trends were 88.5% to 11.6%, respectively (Figure 5). Generally, the slope of NPP change exhibited a decreasing trend from the northwest to the southeast, with an upward trend primarily concentrated in the northwest and the central region. The Mann–Kendall significance test showed that |Z| < 1.96, which was not significant. We speculated, drawing from the previous study, that the early stages of the year in the northwestern part of the country may have seen more vegetation cover and growth, leading to a relatively high and stable level of vegetation production in the later stages of the year. As a result, the majority of the annual mean NPP values were at medium levels, with small fluctuations from year to year.
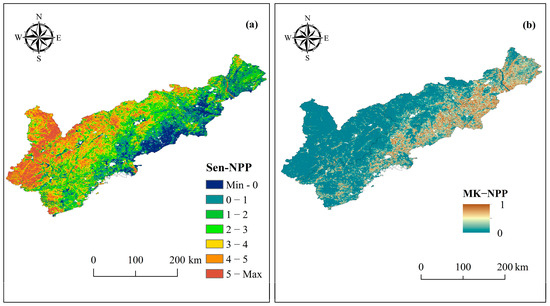
Figure 5.
Trend and significance test of NPP changes in northwest Liaoning Province from 2001 to 2021. (a) Theil–Sen Median Analysis of NPP, (b) Mann–Kendall Significance Test of NPP.
3.2. Mecahnism of the NPP Change
3.2.1. Impact of Climate Change on NPP
Characteristics of Interannual Changes in Meteorological Factors
By analyzing the interannual changes in NPP, precipitation, and average temperature in northwest Liaoning from 2001 to 2021, we established a pattern of long-term change (Figure 6). During the 21-year period, annual precipitation in northwest Liaoning fluctuated in the range of 407.4 to 687.3 mm, with the lowest value occurring in 2009 and the highest in 2010. The multi-year average precipitation was 520.7 mm, and there were large differences between years. Except for some years, the mean NPP and precipitation showed similar volatility, indicating that the amount of precipitation in the region directly affected vegetation growth, and to a certain extent influenced the mean NPP trend. The annual mean temperature generally demonstrated a pattern of rising, then falling, and rising again, within a range of 7.6–9.3 °C. The minimum value was recorded in 2012 and the maximum in 2007, with an average value over multiple years of 8.6 °C. In 2021, both temperature and precipitation had high values in northwest Liaoning, so the annual mean NPP was also at its highest level with 441.3 gC·m−2·a−1. Other years with higher NPP values also had a relatively good combination of hydrothermal conditions. In 2012, the annual average temperature was reduced. Nevertheless, employing the monthly average temperature, the average temperature was higher throughout the vegetation growing period, from April to September. In addition, the precipitation was ample and sufficient during the critical period of vegetation water demand, so the annual mean NPP value was also high.
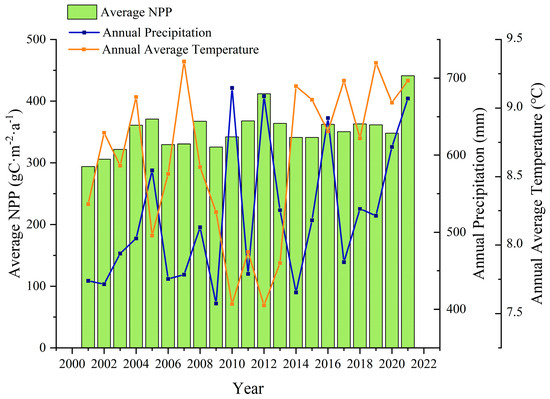
Figure 6.
Interannual variation in average NPP, total precipitation, and average temperature in northwest Liaoning Province from 2001 to 2021.
Meteorological factors usually affect the physiological structure and growth process of vegetation through differences in hydrothermal conditions, and thus play an important role in NPP changes. Image-by-image meta-partial correlation analysis and significance tests were carried out between the annual mean NPP and two meteorological factors (precipitation and air temperature) in northwest Liaoning (Figure 7 and Figure 8). Partial correlation coefficients for annual average NPP and yearly precipitation varied from −0.7 to 0.9; however, they mainly showed high and moderate positive correlations. Measured by area, the research area exhibiting a negative correlation constituted just 1.1% of the overall area, primarily located in the eastern part of Changtu County. An area that comprised 54.1% of the complete area possessed partial correlation coefficients in the range of 0.6 to 0.8 and was found mainly in Chaoyang City, Fuxin City, central and northern Huludao City, northwestern Jinzhou City, and western Kangping County. These areas are relatively arid, with a relatively low annual precipitation, and, thus, their vegetation growth is sensitive to precipitation. A rise in rainfall can significantly reduce water stress and enhance the accumulation of dry matter, which in turn affects NPP changes.
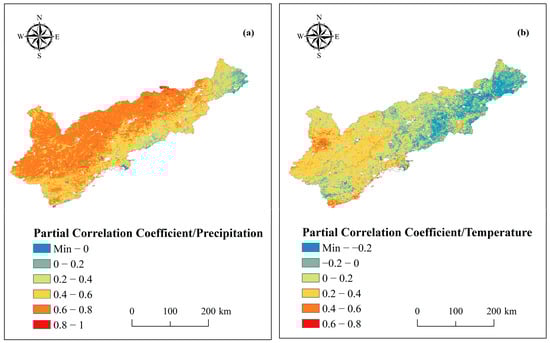
Figure 7.
The partial correlation coefficient of annual average NPP with precipitation and annual average NPP with temperature. (a) Partial correlation coefficient of annual average NPP with precipitation, (b) Partial correlation coefficient of annual average NPP with temperature.
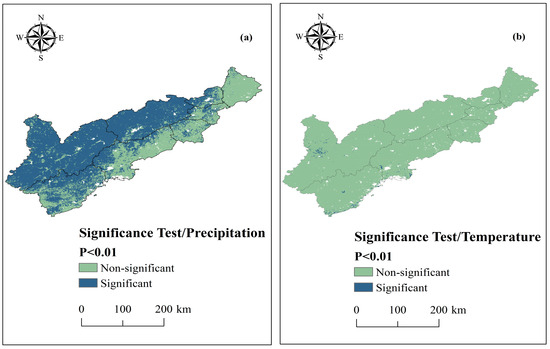
Figure 8.
Partial correlation significance for annual average NPP with precipitation and annual average NPP with temperature. (a) Partial correlation significance for annual average NPP with precipitation, (b) Partial correlation significance for annual average NPP with temperature.
The partial correlation coefficients between the annual average NPP and the yearly average temperature ranged from −0.8 to 0.8. The geographical distribution of NPP demonstrated a low to moderate negative correlation in the eastern areas, and a mild to moderate positive correlation in the western and northern regions. Chaoyang City, Fuxin City, Huludao City, and the western part of Jinzhou City predominantly observed positive correlations in an area that comprised 69.7% of the entire area. In general, the areas with positive correlations involving mean yearly NPP with annual precipitation and mean yearly NPP with average annual air temperature were larger than those with negative correlations from 2001 to 2021, suggesting that, for most of northwest Liaoning, an increase in rainfall or an appropriate increase in temperature would positively affect vegetation growth.
Based on the partial correlation significance testing (Figure 7), 65.2% within the study area demonstrated a significant correlation (p < 0.01) between the annual mean NPP and annual precipitation, with the greatest significance occurring in Chaoyang and Fuxin. In contrast, only 0.8% of the area exhibited a significant correlation at the p <0.01 level between the annual mean NPP and air temperature, primarily in the central and western sections of Chaoyang City. Thus, the correlation involving NPP and air temperature was insignificant in most areas.
Complex Correlation Analysis
From the compound correlation analysis of the yearly average NPP in relation to annual precipitation and the annual average air temperature (Figure 9), the compound correlation coefficients ranged from 0 to 0.9, with a high degree of overall correlation. Regarding spatial distribution, the complex correlation values of precipitation and temperature and the bias correlation coefficients of annual precipitation were consistent, i.e., most of the regions where the yearly average NPP showed strong correlations with annual rainfall also had relatively high complex correlation coefficients. On the contrary, the complex correlation coefficients for the areas where the influence of precipitation was weak were also small. Among them, 9.8% of regions with correlation coefficients below 0.4 suggested that the annual average NPP and the precipitation–temperature composite effect had low correlations in these areas, which were predominantly located in the eastern part of Changtu County, the southern part of Jinzhou City, the central and southern part of Xinmin City, and the southwestern part of Huludao City. Of the area, 31.8% had compound correlation coefficients between 0.4 and 0.6, including the western section of Changtu County, the eastern section of Kangping County, the central and southern parts of Huludao City, Jinzhou City, Xinmin City, and Faku County. Finally, 58.4% of the area had a compound correlation coefficient greater than 0.6, indicating that most regions in northwestern Liaoning contributed significantly to the compound effect of the precipitation-temperature impact on NPP at a highly correlated level.
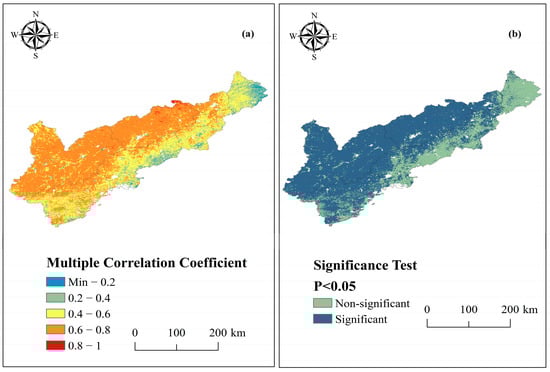
Figure 9.
The multiple correlation coefficient and significance test results of NPP annual mean and precipitation temperature comprehensive effect. (a) The multiple correlation coefficient, (b) The significance test results.
The significance test for the compound correlation relationship showed that 74% of the area in northwestern Liaoning had a significance of p < 0.05, indicating that the composite precipitation–temperature effect was significant. Of the area, 26.1% had a compound correlation that was not significant (p < 0.05), which was primarily located in Changtu County, Xinmin City, and the southern–central part of Jinzhou City.
Spatial Division of NPP Driving Factors
The division of NPP annual mean values in different regions of northwest Liaoning by driving factors (Figure 10) reveals the following: ① the areas in the study area where NPP changes were mainly driven by precipitation accounted for 65% of the total area, and they were concentrated in Chaoyang City, Fuxin City, Kangping County, north–central Huludao City, and northern Jinzhou City; ② the areas driven by non-climatic factors were also relatively large in size, with an area of 26%, and they were mainly distributed in Changtu County, Xinmin City, the west side of Faku County, the south of Jinzhou City, and the southwest of Huludao City, suggesting that these areas may be more affected by human activities; ③ the areas weakly driven by air temperature and precipitation were mainly concentrated in the borders of Fuxin City with Jinzhou City and Xinmin City, the south of Kangping County, and the northeast of Faku County, with an area of 8.5%; and ④ the rest of the area was either strongly driven by precipitation and air temperature or driven by air temperature, which had areas of 0.5% and 0.3%, respectively; these were mainly distributed in the southwest of Jinzhou City and a small part of the central region of Huludao City. Overall, the annual mean NPP changes in northwest Liaoning from 2001 to 2021 were mainly driven by precipitation and non-climatic factors.
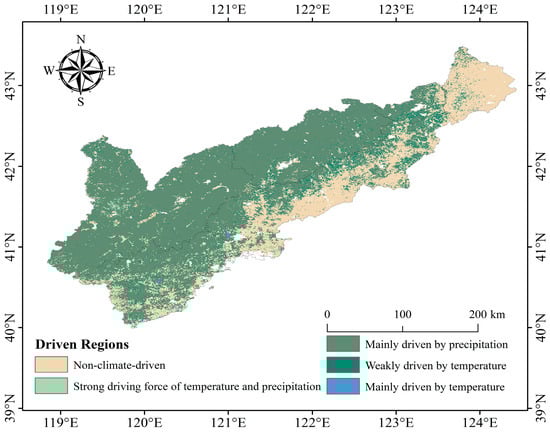
Figure 10.
Regional differences in annual average NPP change driven by various factors in northwest Liaoning province from 2001 to 2021.
3.2.2. NPP Variation Characteristics of Different Soil Types
Overall, the NPP among various soil types within the research area demonstrated a fluctuating increase from 2001 to 2021 (Figure 11). The NPP of the nine soil types, in descending order of magnitude, was as follows: alfisol soil (376.8 gC·m−2·a−1), ferroaluminous soil (373.5 gC·m−2·a−1), primordial soil (346.1 gC·m−2·a−1), semi-hydromorphic soil (343.4 gC·m−2·a−1), semi-alfisol soil (341.9 gC·m−2·a−1), anthropogenic soil (326 gC·m−2·a−1), hydromorphic soil (319.8 gC·m−2·a−1), saline soil (312 gC·m−2·a−1), and calcareous layer soil (253.1 gC·m−2·a−1). The study showed that the degree of NPP change varied among different soil types in northwest Liaoning. Firstly, the NPP growth rate was the largest in the calcareous soil zone at 4.5/a, followed by the ferroaluminous soil zone at 4.3/a. At 0.4/a, the hydromorphic soil zone had the smallest growth rate. The probable reason for this is that temperate grasses and miscellaneous grass meadow steppe, which have a high demand for moisture, were the main vegetation types in the calcareous soil zone, along with other conditions such as the fluctuating rise in precipitation in the study area. Second, the mean annual NPP values showed mostly similar trends across the alfisol, semi-alfisol, primordial soil, and semi-hydromorphic soil zones. However, NPP levels in the alfisol zone surpassed those in the other three, which was due to the fact that the vegetation types here were mainly temperate deciduous thickets, which had a stronger ability to adapt to drought and cold stress and had better growth conditions. Finally, the growth rate of NPP was less than 1/a in the hydromorphic, saline, and anthropogenic soil zones while the NPP values were also lower, indicating that the development and growth of the indigenous vegetation were subpar and less susceptible to the influence of external factors.
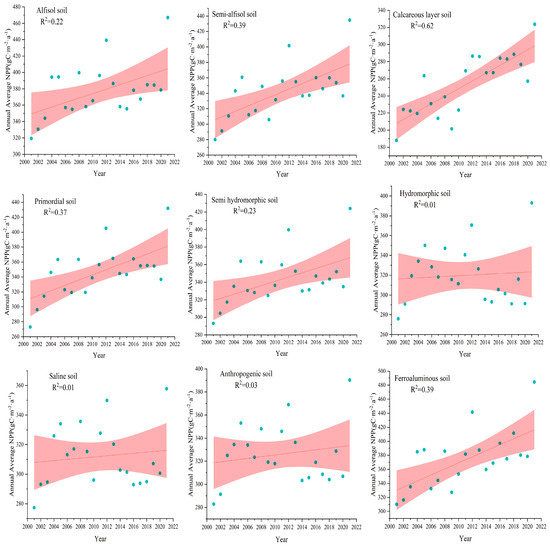
Figure 11.
Interannual variation in annual average NPP in different soil type zones.
3.2.3. Impact of Human Activities on NPP
Characteristics of Changes in NPP of Different Land Use Types
By calculating the yearly mean value and overall quantity of NPP across different land use categories under different periods (Table 3), the multi-year mean NPP value, within descending order, was as follows: forest land (412.9 gC·m−2·a−1), grassland (369.5 gC·m−2·a−1), cropland (360.1 gC·m−2·a−1), built-up land (345.8 gC·m−2·a−1), unused land (300.1 gC·m−2·a−1), and water (270 gC·m−2·a−1). The annual total of NPP in descending order was as follows: arable agricultural land, forest areas, grasslands, urban territories, aquatic zones, and fallow lands. The yearly mean NPP value for the six types of land use demonstrated a rising pattern, and the annual total of NPP showed a decreasing trend only on unused land.
Table 3.
The variation in annual average NPP and total NPP in northwest Liaoning Province in different periods.
Impact of Land Use Change on NPP
We divided the 21-year period into two time periods, 2001–2011 and 2011–2021, to study the conversion between various categories of land use in northwest Liaoning and the affected changes in total NPP. We employed ArcGIS 10.8 software and Excel to create a map of land use changes (Figure 12) and a matrix of total NPP changes (Table 4). Between 2001 and 2011, the aggregate area of land use categories that changed in northwestern Liaoning was 6941 km2, representing 11.2% of the overall area. The changes that occurred were mainly a growth in forested land area, watersheds, and built-up land, and a reduction in the area for the rest of the categories of land use. From 2011 to 2021, the overall area that changed was 6899.8 km2, comprising 11.1% of the total area, and primarily, the change was due to a decrease in grassland area. Among the land use types, arable land and grassland were the types that changed the most frequently. Grassland mainly changed to arable and forest land, arable land mainly changed to forest land (941.8 km2), grassland (932.1 km2), and built-up land (946.3 km2) from 2001 to 2011, and mainly to built-up land (1088.8 km2) from 2011 to 2021. Owing to alterations in types of land use, the total amount of NPP also showed a certain degree of change, with an overall increase in the total amount of NPP under forest and built-up land, and an obvious decrease in the overall quantity of NPP influenced by the expansion in the area of cultivable land and grassland transferred out. The transformation of grassland into cropland and woodland changed the total NPP by 11.3 × 10⁻² TgC and 11.2 × 10⁻² TgC, respectively, from 2001 to 2011; the conversion of grassland to woodland changed the total NPP by 11.9 × 10⁻² TgC from 2011 to 2021.
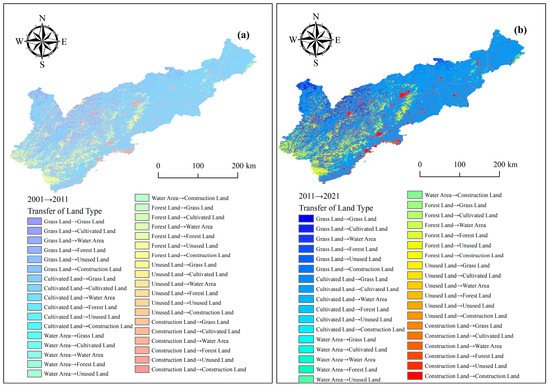
Figure 12.
Spatial distribution of land type transfer in northwest Liaoning Province from 2001 to 2021. (a) Transfer of land type from 2001 to 2011, (b) Transfer of land type from 2011 to 2021.
Table 4.
Matrix of total NPP changes in the northwest region of Liaoning Province from 2001 to 2021.
Overall, the complete quantity of NPP in northwestern Liaoning from 2001 to 2021 exhibited a rising trend, with a net increase in NPP on forest land, thanks to the initiative to convert farmland back to forestland, the construction of the “Three North Protective Forests”, and other projects in the region. At the same time, more unused land has been transformed into other land use types, which makes the use of land resources in northwest Liaoning more reasonable. Going forward, greater focus should be given to the rational planning of grasslands and waters.
4. Discussion
There are certain differences in the impact of different combinations of temperature and precipitation on NPP globally. Nemani et al. analyzed the trend in global land vegetation NPP changes from 1982 to 1999, and found that NPP significantly increased in regions accounting for more than 25% of the global vegetation area [42]. Due to different climatic conditions, it showed a characteristic of being mainly distributed in tropical regions and high-latitude areas in the northern hemisphere. Zarei et al. evaluated the spatiotemporal variation characteristics of grassland NPP in Tanzania based on a regression model of temperature, precipitation, and evapotranspiration from 2001 to 2019 [43]. The results showed a significant positive correlation between NPP and temperature. Within the dry and semi-dry areas of Northwest China, the correlation between NPP and temperature and precipitation gradually increased over time, mainly showing positive correlations [44]. In the Tibetan Plateau region, NPP showed a positive correlation with air temperature and a negative correlation with precipitation in some areas, and its vegetation changes were mainly affected by air temperature [45]. In the southern humid zone [46], such as the Yangtze River’s middle and lower regions [47], the Yunnan–Guizhou Plateau [48], and the southeastern coastal area [27], vegetation grows better with more water, heat, and light, and carbon accumulates sufficiently. NPP is greatly influenced by climatic factors and exhibits different seasonal and interannual patterns of change. In the humid and semi-humid region of Northeast China, precipitation primarily influences the spatial distribution of NPP [49].
Compared with other regions, the correlation between NPP and temperature and precipitation in the northwest region of Liaoning is more consistent. The northwest region of Liaoning belongs to the semi-arid region, and the climatic and environmental conditions are similar to those of the northwest arid and semi-arid region. Therefore, from a long-term trend perspective, both regions are positively correlated with temperature and precipitation. However, the degree of this positive correlation varies, and we speculate that this may be due to differences in land use and soil types between the two regions. Compared with the Qinghai–Tibet Plateau region and other humid areas, its NPP changes are mainly influenced by temperature and precipitation factors, and in some areas, it shows a negative correlation with climate factors. This difference is influenced by factors such as different combinations of temperature and precipitation, land use types, and soil types.
Given that temperature and precipitation are the primary climatic factors that affect NPP, we can elucidate the overall impact of climate change on NPP, thereby increasing the total amount of NPP. Furthermore, given that ecologically fragile areas in developing countries around the world are particularly sensitive and vulnerable to climate change, an effective assessment of NPP fluctuations can mitigate the decline in NPP due to climate change and enhance the adaptability of these areas.
5. Conclusions
(1) Yearly average NPP figures within most areas of northwestern Liaoning were within the span of 300 to 400 gC·m−2·a−1, which was a medium level. The area with the highest values was the southwestern part of the region, where the annual average NPP value exceeded 400 gC·m−2·a−1, and the area with the lowest values was the northern section of Chaoyang City and the western area of Fuxin City, where the annual mean NPP value was less than 300 gC·m−2·a−1. The interannual changes in the mean NPP values in different regions had a variable upward pattern, and the slope of the change in the NPP values displayed a downward trend from the northwest toward the southeast. Areas showing an upward trend were predominantly located in the northwestern and central parts of the region.
(2) The NPP in northwestern Liaoning was significantly influenced by climatic variations, with 74% of the region impacted by both precipitation and temperature. In most areas, NPP was mainly driven by precipitation, particularly in Chaoyang City, Fuxin City, Kangping County, the north–central region of Huludao City, and the northern part of Jinzhou City. In the rest of the area, NPP was mostly driven by non-climate factors. However, the specific impact of non-climate-driven factors on NPP needs further exploration.
(3) NPP was also driven by both soil and vegetation and showed a fluctuating upward trend in different soil categories within the research area. The NPP of the nine soil categories ranked in descending order were as follows: alfisol soil, ferroaluminous soil, primordial soil, semi hydromorphic soil, semi-alfisol soil, anthropogenic soil, hydromorphic soil, saline soil, and calcareous layer soil. However, the extent of fluctuation in NPP also differed among soil types.
(4) Land use changes can cause changes in NPP. Within the research area, the yearly average NPP value in descending order was as follows: forested areas, grassy lands, cultivated land, built-up land, unused land, and water. The specific impact was evident in the increase in the total NPP under forest and built-up land, while the increase in the changed area of cultivated land and grassland caused a significant decrease in the total NPP.
Author Contributions
Conceptualization, W.Z.; methodology, T.W.; software, T.W.; validation, W.Z.; formal analysis, W.Z.; investigation, T.W.; resources, T.W.; data curation, W.Z.; writing—original draft preparation, T.W.; writing—review and editing, W.Z.; visualization, T.W.; supervision, W.Z.; project administration, W.Z.; funding acquisition, W.Z. All authors have read and agreed to the published version of the manuscript.
Funding
This research was funded by the National Natural Science Foundation of China, grant number 40571016 and the Distinguished Professor Program of Liaoning Province, grant number 60618006.
Institutional Review Board Statement
Not applicable.
Informed Consent Statement
Not applicable.
Data Availability Statement
The raw data supporting the conclusions of this article will be made available by authors on request.
Conflicts of Interest
The authors declare no conflicts of interest.
References
- Chen, W.; Li, G.; Wang, D.; Yang, Z.; Wang, Z.; Zhang, X.; Peng, B.; Bi, P.; Zhang, F. Influence of the ecosystem conversion process on the carbon and water cycles in different regions of China. Ecol. Indic. 2023, 148, 110040. [Google Scholar] [CrossRef]
- Xie, L.; Bai, Z.; Yang, B.; Fu, S. Simulation Analysis of Land-Use Pattern Evolution and Valuation of Terrestrial Ecosystem Carbon Storage of Changzhi City, China. Land 2022, 11, 1270. [Google Scholar] [CrossRef]
- Liu, K.; Zhang, H.; Kong, L.; Qiao, Y.; Hu, M. An overview of terrestrial ecosystem carbon sink assessment methods towards achieving carbon neutrality in China. Acta Ecol. Sin. 2023, 43, 4294–4307. [Google Scholar]
- Duncanson, L.; Liang, M.; Leitold, V.; Armston, J.; Moorthy, S.M.K.; Dubayah, R.; Costedoat, S.; Enquist, B.J.; Fatoyinbo, L.; Goetz, S.J.; et al. The effectiveness of global protected areas for climate change mitigation. Nat. Commun. 2023, 14, 2908. [Google Scholar] [CrossRef] [PubMed]
- Liu, Q.; Yang, D.; Cao, L.; Anderson, B. Assessment and Prediction of Carbon Storage Based on Land Use/Land Cover Dynamics in the Tropics: A Case Study of Hainan Island, China. Land 2022, 11, 244. [Google Scholar] [CrossRef]
- Fan, W.; Wu, H.; Fan, F. Spatial-temporal variation of net primary productivity and its influencing factors in Tibet over past 20 years. Bull. Soil Water Conserv. 2022, 42, 378–386. [Google Scholar]
- Sun, H.; Wang, C.; Niu, Z. Analysis of the vegetation cover change and the relationship between NDVI and environmental factors by using NOAA time series data. J. Remote Sens. 1998, 2, 204–210. [Google Scholar]
- Liu, Y.; Yang, Y.; Wang, Q.; Khalifa, M.; Zhang, Z.; Tong, L.; Li, J.; Shi, A. Assessing the Dynamics of Grassland Net Primary Productivity in Response to Climate Change at the Global Scale. Chin. Geogr. Sci. 2019, 29, 725–740. [Google Scholar] [CrossRef]
- Cleveland, C.C.; Houlton, B.Z.; Smith, W.K.; Marklein, A.R.; Reed, S.C.; Parton, W.; Del Grosso, S.J.; Running, S.W. Patterns of new versus recycled primary production in the terrestrial biosphere. Proc. Natl. Acad. Sci. USA 2013, 110, 12733–12737. [Google Scholar] [CrossRef] [PubMed]
- Lieth, H. Methods of Assessing Terrestrial Productivty. In Primary Productivity of the Biosphere; Springer: New York, NY, USA, 1975. [Google Scholar]
- Fang, J.; Ke, J.; Tang, Z.; Chen, A. Implications and Estimations of four Terrestrial Productivity Parameters. Acta Phytoecol. Sin. 2001, 25, 414. [Google Scholar]
- Running, S.W.; Nemani, R.R.; Heinsch, F.A.; Zhao, M.; Reeves, M.; Hashimoto, H. A Continuous Satellite-Derived Measure of Global Terrestrial Primary Production. BioScience 2004, 54, 547. [Google Scholar] [CrossRef]
- Schoen, D. Primary productivity: The link to global health. Bioscience 1997, 47, 477–480. [Google Scholar] [CrossRef][Green Version]
- Gao, Y.; Yu, G.; Zhang, L.; Liu, M.; Huang, M.; Wang, Q. The changes of net primary productivity in Chinese terrestrial ecosystem: Based on process and parameter models. Prog. Geogr. 2012, 31, 109–117. [Google Scholar]
- Wang, Z.; Li, D. Spatial-temporal distribution of vegetation net primary productivity and its driving factors from 2000 to 2015 in Shaanxi, China. Chin. J. Appl. Ecol. 2018, 29, 1876–1884. [Google Scholar]
- Li, C.; Zhao, J. Spatiotemporal variations of vegetation NPP and related driving factors in Shiyang Riverbasin of Northwest China in 2000-2010. Chin. J. Ecol. 2013, 32, 712–718. [Google Scholar]
- Guo, Z.; Wang, Z.; Zhang, B.; Liu, D.; Yang, G.; Song, K.; Li, F. Analysis of Tempora-l Spatial Characteristics and Factors Influencing Vegetation NPP in Northeast China from2000 to 2006. Resour. Sci. 2008, 30, 1226–1235. [Google Scholar]
- Chen, Y. The Response of Forest Productivity and Carbon Storage to Landscape Pattem Change in Three Gorges Reservoir Area. Ph.D. Thesis, Chinese Academy of Forestry, Beijing, China, 2017. [Google Scholar]
- Chen, J.; Shao, Z.; Huang, X.; Zhuang, Q.; Dang, C.; Cai, B.; Zheng, X.; Ding, Q. Assessing the impact of drought-land cover change on global vegetation greenness and productivity. Sci. Total Environ. 2022, 852, 158499. [Google Scholar] [CrossRef] [PubMed]
- Liu, Z.; Zhou, D.; Lu, H.; Fan, J.; Zhang, L. Comparison of Three Remote Sensing Indices in Revealling the Vegetation Growth Dynamics in Nepal from 2000 to 2020. Environ. Sci. 2024; accepted. [Google Scholar]
- Wang, L.; Wei, W. Variation characteristics of water cycle and its effect on NPP in arid regions of China. Chin. J. Ecol. 2022, 41, 703–713. [Google Scholar]
- Gang, C.; Zhang, Y.; Wang, Z.; Chen, Y.; Yang, Y.; Li, J.; Cheng, J.; Qi, J.; Odeh, I. Modeling the dynamics of distribution, extent, and NPP of global terrestrial ecosystems in response to future climate change. Glob. Planet. Change 2017, 148, 153–165. [Google Scholar] [CrossRef]
- Alireza, K.; Mahmood, K.; Mohsen, H. Spatial-temporal analysis of net primary production (NPP) and its relationship with climatic factors in Iran. Environ. Monit. Assess. 2020, 192, 718. [Google Scholar]
- Li, H.; Ding, J.; Zhang, J.; Yang, Z.; Yang, B.; Zhu, Q.; Peng, C. Effects of Land Cover Changes on Net Primary Productivity in the Terrestrial Ecosystems of China from 2001 to 2012. Land 2020, 9, 480. [Google Scholar] [CrossRef]
- Liu, Y.; Zhou, R.; Wen, Z.; Khalifa, M.; Zheng, C.; Ren, H.; Zhang, Z.; Wang, Z. Assessing the impacts of drought on net primary productivity of global land biomes in different climate zones. Ecol. Indic. 2021, 130, 108146. [Google Scholar] [CrossRef]
- Zhao, D.; Jia, W.; Liu, J. Dynamic Changes and Driving Mechanisms of Net Primary Production (NPP) in a Semi-Arid Region of China. Sustainability 2023, 15, 11829. [Google Scholar] [CrossRef]
- Xi, Z.; Chen, G.; Xing, Y.; Xu, H.; Tian, Z.; Ma, Y.; Cui, J.; Li, D. Spatial and temporal variation of vegetation NPP and analysis of influencing factors in Heilongjiang Province, China. Ecol. Indic. 2023, 154, 110798. [Google Scholar] [CrossRef]
- Xue, M.; Chen, Y.; Yan, M.; Li, Z.; Wang, X.; Xu, H.; Zhang, Z.; Tian, X. Simulation and spatio-temporal variation analysis of net primary productivity in Northeast China. J. Fuzhou Univ. (Nat. Sci. Ed.) 2018, 46, 821–830. [Google Scholar]
- Qiu, Y.; Fan, D.; Zhao, X.; Sun, W. Spatio-temporal changes of NPP and its responses to phenology in Northeast China. Geogr. Geo-Inf. Sci. 2017, 33, 21–27. [Google Scholar]
- Liu, Z.; Yang, J.; Ma, L.; Ke, Z.; Hu, Y.; Yan, X. Spatial-temporal trend of grassland net primary production and their driving factors in the Loess Plateau, China. Chin. J. Appl. Ecol. 2021, 32, 113–122. [Google Scholar]
- Dong, X.; Yao, H.; Dai, J.; Zhu, M. Phenological changes of desert steppe vegetation and its effect on net primary productivity in Inner Mongolia from 2000 to 2017. Prog. Geogr. 2020, 39, 24–35. [Google Scholar] [CrossRef]
- Yang, D.; Wang, X. Contribution of climatic change and human activities to changes in net primary productivity in the Loess Plateau. Arid. Zone Res. 2022, 39, 584–593. [Google Scholar]
- Naeem, S.; Zhang, Y.; Tian, J.; Qamer, F.; Latif, A.; Paul, P. Quantifying the impacts of anthropogenic activities and climate variations on vegetation productivity changes in China from 1985 to 2015. Remote Sens. 2020, 12, 1113. [Google Scholar] [CrossRef]
- Zheng, S.; Li, D.; Guo, C.; Ning, R. Analysis of wind erosion in northwest area of Liaoning Province. Res. Soil Water Conserv. 2015, 22, 138–142. [Google Scholar]
- Wang, G.; Zhang, H. Spatial flow and radiation effect of sand-fixing service in Northwest Liaoning Province. J. Ecol. Rural. Environ. 2023, 39, 52–59. [Google Scholar]
- Ge, Y.; Li, Q.; Chu, L.; Sun, Y. Temporal and spatial analysis on drought events in northwest of Liaoning based on adjusted Z-Index. J. Irrig. Drain. 2013, 32, 133–136. [Google Scholar]
- Gao, Z.; Liu, J.; Cao, M. Impacts of land use and climate change on regional net primary productivity. Acta Geogr. Sin. 2004, 59, 581–591. [Google Scholar]
- GB/T 21010—2007; Classification Standards for Land Use Status in the Second National Land Survey. Standards Press of China: Beijing, China, 2007.
- Mohamed, M.; Babiker, I.; Chen, Z.; Ikeda, K.; Ohta, K.; Kato, K. The role of climate variability in the inter-annual variation of terrestrial net primary production (NPP). Sci. Total Environ. 2004, 332, 123–137. [Google Scholar] [CrossRef] [PubMed]
- Li, X.; Ji, F.; Li, X.; Wen, R.; Wang, X.; Sun, B.; Lan, H. Quantitative analysis of the influence of climate change on NDVI in the growing season from 1998 to 2020 in Northwest Liaoning. Chin. J. Ecol. 2024; accepted. [Google Scholar]
- Jia, Z.; Guo, L.; Cui, S.; Fu, Q.; Liu, D. Spatial-temporal evolution of NPP and its response to extreme climate in Songhua River basin. South-to-North Water Transf. Water Sci. Technol. 2024, 22, 131–147. [Google Scholar]
- Nemani, R.; Keeling, C.; Hashimoto, H.; Jolly, W.; Piper, S.; Tucker, C.; Myneni, R.; Running, S. Climate-driven increases in global terrestrial net primary production from 1982 to 1999. Science 2003, 300, 1560–1563. [Google Scholar] [CrossRef] [PubMed]
- Zarei, A.; Chemura, A.; Gleixner, S.; Hoff, H. Evaluating the grassland NPP dynamics in response to climate change in Tanzania. Ecol. Indic. 2001, 125, 107600. [Google Scholar] [CrossRef]
- Jia, J.; Liu, H.; Lin, Z. Multi-time scale changes of vegetation NPP in six provinces of northwest China and their responses to climate change. Acta Ecol. Sin. 2019, 39, 5058–5069. [Google Scholar]
- Zhu, B. Research on the Response of Vegetation to Climate Change and Human Activities on the Qinghai-Tibet Plateau. Master’s Thesis, Nanjing Forestry University, Nanjing, China, 2021. [Google Scholar]
- Cui, L.; Du, H.; Shi, J.; Chen, Z.; Guo, W. Spatial and temporal pattern of vegetation NPP and its relationship with climate in the Southeastern China. Sci. Geogr. Sin. 2016, 36, 787–793. [Google Scholar]
- Xu, Y.; Lu, Y.; Dai, Q.; Zhao, C.; Huang, W.; Chen, T.; Zhang, Y. Assessment of the relative contribution of climate change and land use change on net primary productivity variation in the middle and lower reaches of the Yangtze river basin. China Environ. Sci. 2023, 43, 4988–5000. [Google Scholar]
- Yang, Y. Spatio-Temporal Change of Net Primary Productivity in Guizhou and Its Correlationship with Meteorologic Factors. Master’s Thesis, Southwest University, Chongqing, China, 2009. [Google Scholar]
- Zhu, W.; Pan, Y.; Liu, X.; Wang, A. Spatio-temporal distribution of net primary productivity along the Northeast China Transect and its response to climatic change. J. For. Res. 2006, 17, 93–98. [Google Scholar] [CrossRef]


Disclaimer/Publisher’s Note: The statements, opinions and data contained in all publications are solely those of the individual author(s) and contributor(s) and not of MDPI and/or the editor(s). MDPI and/or the editor(s) disclaim responsibility for any injury to people or property resulting from any ideas, methods, instructions or products referred to in the content. |
© 2024 by the authors. Licensee MDPI, Basel, Switzerland. This article is an open access article distributed under the terms and conditions of the Creative Commons Attribution (CC BY) license (https://creativecommons.org/licenses/by/4.0/).