Article

The Influence of Grain Size Gradation on Deformation and the Void Structure Evolution Mechanism of Broken Rock Mass in the Goaf

1
School of Mechanics and Civil Engineering, China University of Mining & Technology, Xuzhou 221116, China
2
State Key Laboratory of Intelligent Construction and Healthy Operation and Maintenance of Deep Underground Engineering, China University of Mining & Technology, Xuzhou 221116, China
3
College of Mining Engineering and Geology, Xinjiang Institute of Engineering, Urumqi 830023, China
4
Key Laboratory of Xinjiang Coal Resources Green Mining, Ministry of Education, Xinjiang Institute of Engineering, Urumqi 830023, China
*
Author to whom correspondence should be addressed.
Appl. Sci. 2024, 14(15), 6764; https://doi.org/10.3390/app14156764
Submission received: 2 July 2024 / Revised: 28 July 2024 / Accepted: 30 July 2024 / Published: 2 August 2024
(This article belongs to the Special Issue New Insights into Digital Rock Physics)

Abstract

:
The high porosity and high specific surface area of the broken rock mass in abandoned mine goaf make it an excellent thermal storage space. The void structure is an important factor that affects the permeability characteristics of broken rock mass, which determines the efficiency of extracting geothermal water from abandoned mine shafts. To accurately describe the void structure of broken rock mass, the effect of particle erosion on the fracture of rock blocks is considered in this study, based on which an impact-induced strength corrosion calculation model was proposed. Then, this calculation model was embedded into the three-dimensional numerical simulation of broken rock mass for secondary development. A discrete element numerical calculation model was established for broken rock masses with different size grading distributions under water immersion and lateral compression conditions. On this basis, considering the strength erosion effect of impacts, this study investigated the deformation and fracture characteristics of broken rock masses with different size grading distributions and analyzed the evolution laws of porosity in the broken rock masses. The main findings are as follows: The impact effect has a significant influence on the growth of microcracks and the breakage rate of broken rock mass. When the particle size of the broken rock mass differs significantly (size grading as G3), impact-induced strength erosion exerts the greatest impact on the growth of microcracks and the breakage rate. When the particle size of the broken rock mass is uniform (size grading as G1), impact-induced strength erosion minimally impacts the secondary fracturing of the broken rock mass. When the strain of the broken rock sample is less than 0.175, the distribution of microcracks is scattered; when the strain reaches 0.275, microcrack propagation accelerates and exhibits a clustered distribution; and when the strain reaches 0.375, microcracks exhibit a reticular distribution and their connectivity is enhanced. With the increase in deformation, the broken rock mass porosity decreases, and the porosity curve fluctuates along the z-axis with a decreasing trend and gradually becomes more uniform. This study provides a theoretical foundation for assessing the efficiency of extracting and storing mine water with heat in abandoned mine geothermal mining projects.

1. Introduction

The utilization of geothermal energy in abandoned mines is an important means of repurposing such sites, which can accelerate the establishment of a clean, low-carbon, safe, and efficient energy system [1]. The working principle of geothermal exploitation in abandoned mines involves injecting water into the void space of the goaf through fractures in the roof or artificial replenishment. Subsequently, the water undergoes heat exchange with the high-temperature rock mass and gradually increases in temperature. The high-temperature water is then extracted for direct utilization on the surface or upgraded using a water-source heat pump. Currently, there are only 16 documented abandoned mine geothermal energy projects worldwide [2,3]. For instance, Heerlen Mine in the Netherlands utilizes geothermal energy from abandoned mines to provide heating for approximately 500,000 square meters of buildings [4]. Geothermal exploitation in abandoned mines involves multiple theoretical and technical challenges, including the evaluation of geothermal potential, geothermal recovery system design, reservoir stabilization, and dynamic monitoring of geothermal well systems [5]. Among these challenges, the initial permeability characteristics of thermal storage spaces are difficult to maintain, directly limiting the long-term operation of geothermal systems [6]. The permeability characteristics and void structure of broken rock masses are closely related. Moreover, the change in the void structure of broken rock mass in the geothermal mining environment of the abandoned mine goaf is mainly due to the deformation, fracture, and migration of rock blocks affected by the load of surrounding rock and the movement of mine water. Therefore, the study of the deformation and fracture characteristics of broken rock mass under immersion and lateral compression is the basis for evaluating the heat water extraction efficiency in abandoned mines.
The broken rock mass in goaf exhibits the characteristics of high porosity and a high ratio of heat exchange surface area [7], which contributes to increasing the water storage capacity and heat exchange efficiency in geothermal exploitation projects in abandoned mines. Furthermore, goaf areas also possess advantages such as large water storage capacity, stable temperature, and high enthalpy, making them particularly suitable for the storage of water and heat resources after closure and renovation [8]. However, under long-term overlying loads, the fractured rock mass in goaf areas is prone to compaction deformation and rock block damage, which alters the void structure and thus affects permeability characteristics [9]. Simultaneously, the movement of broken micro-rock particles within the void structure of broken rock mass and their collision with the rock mass skeleton alter the deformation and fracture characteristics of rock blocks, thus impacting the efficiency of geothermal energy extraction. The process of geothermal exploitation in abandoned mines and its influence on the deformation and movement characteristics of broken rock masses in goaf areas are illustrated in Figure 1. The red arrows in Figure 1 represent the heat flow migration direction and the black arrows represent the load on the caving zone by overlying rock.
In recent years, the compaction characteristics of caving zones in goaf have become a hot topic [10], which leads to significant findings [11,12,13,14]. Fractal theory exhibits notable advantages for studying irregularly shaped materials. Accordingly, Qiang et al. [15] used fractal theory to elucidate the evolution of compressive seepage voids within broken rock mass against the background of geothermal reservoirs. In laboratory experiments, Huang et al. [16] investigated the particle size variation and breakage index of crushed coal gangue under triaxial compression conditions using a self-developed triaxial loading test system. Li et al. [17] conducted indoor experiments to investigate the compressive creep behavior of broken rock masses with different lithologies and proposed a creep constitutive model. Due to the limitations of indoor experiments to visually demonstrate the complex internal deformation processes of broken rock mass, numerical simulation methods were used to study the stress redistribution and spatiotemporal evolution of secondary fracturing within broken rock blocks [18,19]. Wang et al. [20] employed a two-dimensional discrete element numerical simulation method to compare the creep behavior of broken rock masses composed of rounded aggregates and irregular aggregates under uniaxial compression and direct shear loading conditions, respectively. Furthermore, they investigated the distribution characteristics of force chains within broken rock masses through key aggregates. Meng et al. [21] established a three-dimensional numerical model using the discrete element method (DEM) for triaxial compression of broken rock mass, proposed a long-term prediction model for bulking factor, and provided initial explanations for the principles of particle interlocking during triaxial compression. Zhang et al. [22] employed a combined approach of three-dimensional discrete element numerical simulation and experimental methods to quantitatively analyze the evolution characteristics of stress, porosity, and breakage rate of broken rock blocks in the process of lateral confinement compression within goaf. The perspective of flow through a cracked or porous medium has recently emerged as a prominent research area. Zehairy et al. [23] compared heterogeneous porous media, such as broken rock mass, with homogeneous porous media and concluded that the distribution of dominant flow channels has a greater influence on fluid flow patterns and pressure distribution. Li et al. [24] experimentally investigated the compaction characteristics, fracture growth law, and permeability evolution of broken coal-rock mass under seepage effects. Wu et al. [25] developed a heat exchange test system for broken rock mass using CO2 as a substitute for heat transfer fluid, demonstrating that higher porosity in broken rock mass leads to improved energy storage efficiency. Meng et al. [26] used the discrete element method (DEM) to track particle migration trajectories within broken rock masses, revealing their migration laws and proposing a method to determine their migration states.
In the process of thermal mine water extraction, the impaction of small rock particles on rock blocks will affect their fracture propagation and fracture law. However, there is currently limited research on the migration and impact of detached small-size particles from broken rock mass within the void structure and their influence on the overall structural strength. Therefore, it is necessary to discuss the detachment, migration, and impact of small-sized particles of broken rock mass in geothermal water storage in the goaf of the abandoned mine so as to obtain deformation and fracture characteristics of broken rock mass that are more in line with engineering practice. This study proposed a computational model for impact strength erosion based on the bonding weakening method in discrete element particles and subsequently conducted the secondary development of a three-dimensional numerical calculation model for broken rock mass under lateral compression within abandoned mine goaf. Hence, the strength erosion effect of small particles on rock mass is taken into account for the first time in the numerical simulation of particle discrete elements, and the method of simulating the fracture behavior of broken rock mass with discrete elements is innovatively presented. On this basis, the deformation, fracture patterns, and acoustic emission (AE) characteristics of broken rock masses with different size grading distributions considering impact strength weakening were studied. Furthermore, the evolution patterns of layer-by-layer porosity and average porosity of broken rock masses were analyzed as well. The research findings provide a theoretical basis for establishing models to explore the porosity evolution and permeability characteristics of thermal storage spaces in abandoned mine geothermal exploitation.

2. Calculation Model of Particle Impact Strength Corrosion

Complex macroscopic phenomena often arise from the interactions of microstructural components [27]. To describe the phenomenon of strength erosion in broken rock under particle impact, it is necessary to investigate the underlying micro-mechanical behavior. The occurrence of fractures and particle detachment in rock blocks subjected to particle impacts can be explained by a localized reduction in strength near the impact point. Potyondy [27] and Tran et al. [28] proposed cohesive erosion models to simulate creep behavior using the strength erosion method. By analogy, a method was developed to simulate the strength-weakening effect of impact by reducing the bonded strength around the impact point in numerical models of broken rock mass, and an equation for calculating bonded strength erosion due to impacts was derived.

2.1. The Proposal of the Calculation Model

The storage space of the geothermal mining project in the abandoned mine consists of collapsed roof voids resulting from long-wall mining. The volume expansion of the collapsed rock layers is influenced by the expansion characteristics of the broken rock mass. Based on previous research [21], it can be inferred that the volume expansion of broken rock mass in goaf is directly associated with factors such as lithology, size grading of fragmented blocks after crushing, and accumulation state.
The strength erosion rate is defined as the mass loss of the target material after being impacted by moving particles (unit: kg/(m2·s)) [29]. Multiple factors influence the strength erosion rate caused by particle impact on broken rock blocks, and Bitter [30,31] proposed a deformation mechanism-based calculation model for impact erosion rate in brittle materials, which can be expressed as:
ε m = 1 2 M p v p sin α K 2 δ T
where Mp denotes the mass of a single impacting particle (unit: kg); vp represents the impacting velocity of the particle (unit: m/s); α is the impact angle (unit: °); K denotes the velocity component perpendicular to the surface of the target material (unit: m/s), and when the velocity is below K, no significant erosion occurs; and δT represents the energy required for unit volume of target material erosion (unit: kg·m/s2).
The Mp can be calculated by ρpVp, in which ρp is the density of the impact particle and Vp is the volume of the impact particle. Because the impact particle is exfoliated from the target material, the density of the impact particle is the same as that of the target material ρT. Then, Equation (1) can be modified as:
ε m = 1 2 ρ T V p v p sin α n K 2 δ T
According to the particle discrete element numerical simulation method, each basic element ‘ball’ that makes up the rock block is bonded by a ‘contact’ element. Similar to the study method of reducing the bonding strength of rock model contact due to chemical corrosion rate when a particle discrete element is used to simulate the creep phenomenon [20,25], the corrosion rate of bonding strength between contacts inside the rock block after particle impact is assumed to be the same as the erosion rate of Equation (2). Then, the remaining rate of the bonding vc after corrosion can be calculated as follows:
v c = 1 1 2 ρ T V p v p sin α n K 2 δ T
Equation (3) is applicable only in the presence of impact corrosion. The corrosion rate is 1 when there are no impact phenomena and becomes 0 after the bond is broken. Combining with Equation (3), the bond radius multiplier of the particle mechanics model during cycling can be calculated by:
λ n = D n D n 1 = 1 n = 0   1 1 2 ρ T V p v p sin α n K 2 δ T 0 n < n c 0 n > n c
where n denotes the impacting times; λ is the bond radius multiplier; αn is the impact angle of the nth impacting; Dn−1 and Dn represent the bond radius at the (n − 1)th and nth impacting, respectively (unit: m); and nc refers to the effective impacting times when the contact bond is broken.
The fracture energy of a unit volume of rock mass can be calculated using the following equation [32]:
δ T = 5 σ T ε T 12
where σT and εT denote the stress and strain of the target material, respectively.
Then the final impacting strength erosion model can be obtained, and the bond radius multiplier λ can be computed as:
λ n = 1 n = 0   1 6 5 E T ρ T V p v p sin α n K 2 σ T 2 0 n < n c 0 n > n c

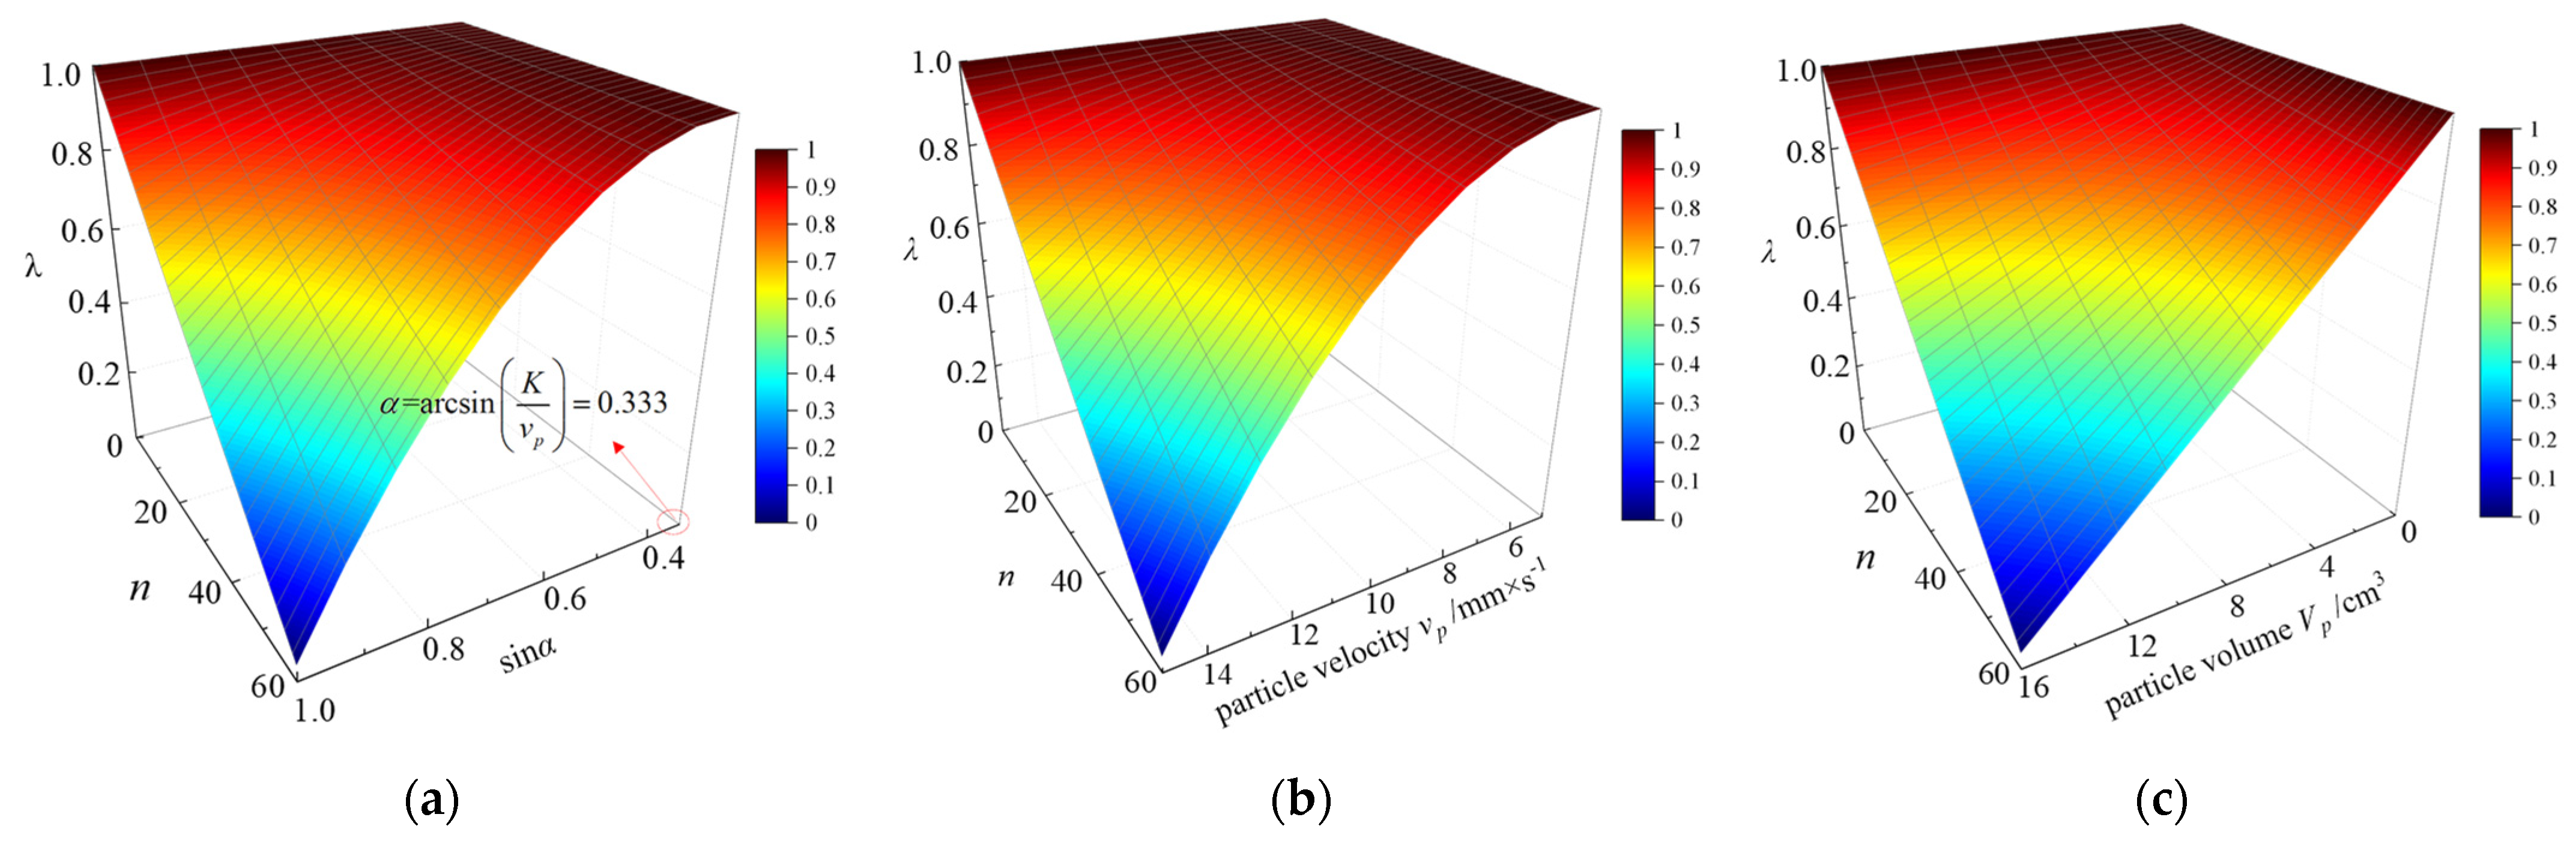
2.2. Parameter Analysis of the Impacting Strength Erosion Model

The independent variables in Equation (6) are particle volume Vp, impact velocity vp, impacting time n, and impact angle αn. There is a clear positive correlation between impacting time n and the dependent variable bond radius multiplier λ. However, further analysis is needed to characterize the relationship between the other parameters and the bond radius multiplier λ. This study investigated the effects of particle volume Vp, impact velocity vp, and impact angle αn on bond radius multiplier λ. Figure 2a–c illustrates the influence of impact angle αn, impact velocity vp, and particle volume Vp on bond radius multiplier λ, respectively (assuming nc = 60 and K = 0.5 mm/s).
According to Figure 2, the strength corrosion rate of the target material increases with the number of impact times n. When particles impact the target material vertically (sinα = 1), the bond radius of the affected area decreases the fastest with the impact time n. When n is fixed, the impact angle that results in the slowest decrease in bond radius satisfies α = arcsin K v p . The strength corrosion rate of the target material is directly proportional to both impact velocity vp and particle volume Vp.

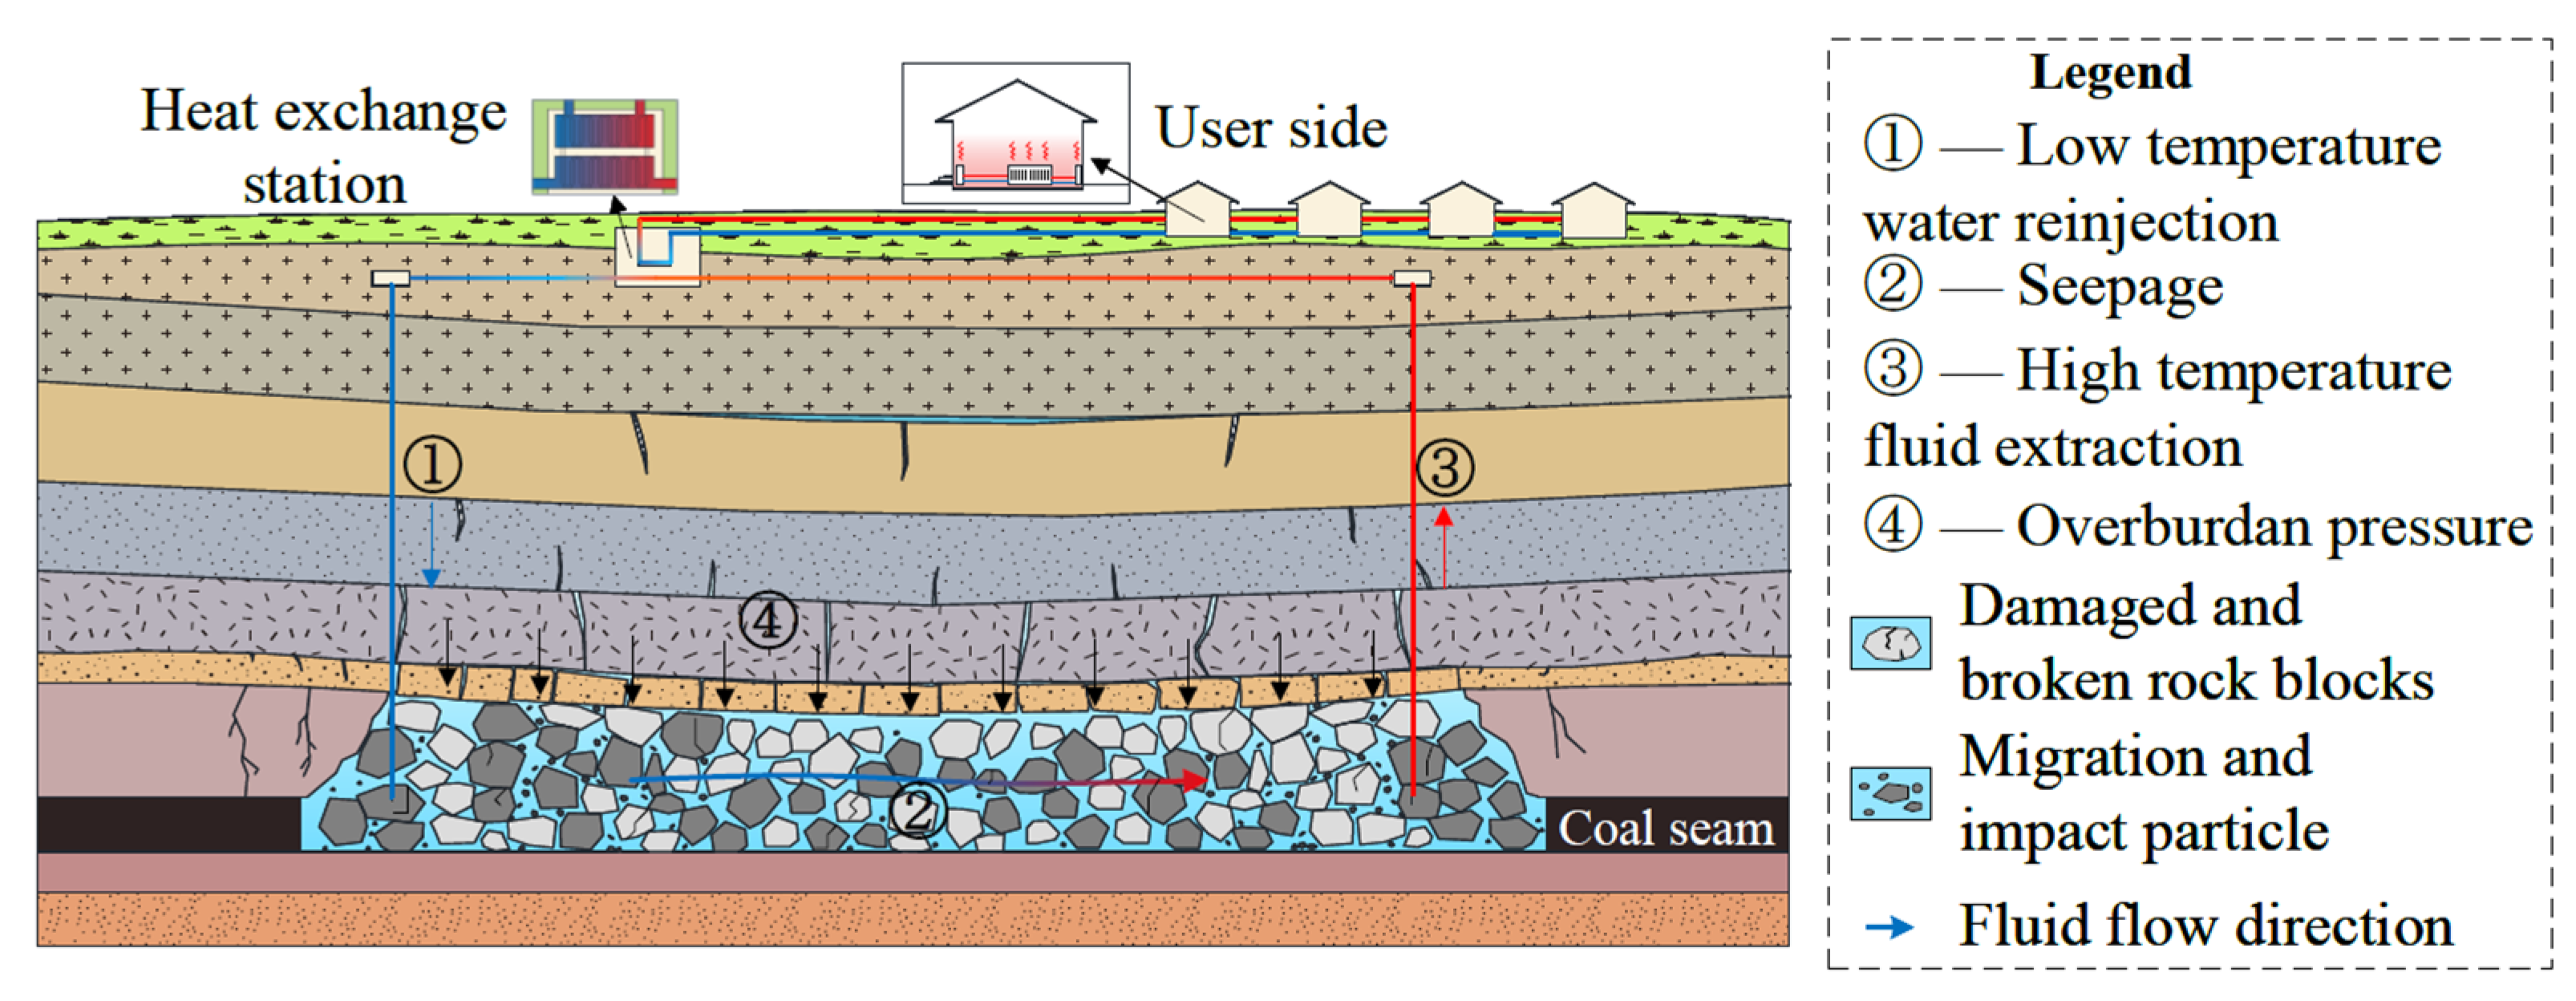
2.3. Influence Ranges of Particle Impact Strength Erosion

The particle impacting behavior can be simplified as the concentrated force F = mpap (where ap is the acceleration of the impact particle), shown in Figure 3.
According to Figure 3, the distance between any point M(x,y,z) in the rock mass and the impact point is r; the distance from the impact acting surface is z; and the projected length on the impact action surface is ρ. Then, the stress at point M is:
σ x = F 2 π r 2 3 x 2 z r 3 1 2 μ T z r r r + z + x 2 2 r + z r r + z 2 σ y = F 2 π r 2 3 y 2 z r 3 1 2 μ T z r r r + z + y 2 2 r + z r r + z 2 σ z = 3 F z 3 2 π r 5
To establish a numerical calculation model for broken rock mass considering the impact effect, it is necessary to define the range of bond strength affected by the stress corrosion phenomenon. If we consider the process of a small particle impacting a large rock block as the squeezing of the rock block by the particle with the same force as the inertial force of accelerating motion, then Hertz’s theory can be applied. Assuming that the collision phenomenon during model loading conforms to Hertz’s contact theory, the pressure distribution in the impact zone is in a semi-spherical form, with maximum stress at the point of impact. Then, it is not necessary to consider the horizontal stresses, and we can calculate the radius of the semi-spherical by only considering the vertical stress. The maximum stress can be calculated as:
q max = 3 F 2 π a 2
where F denotes the force acting on the impact particle and a represents the radius of the contact area, which can be computed as:
a 3 = 3 2 1 μ T 2 E T r p F
where rp denotes the radius of the impact particle and μT is the Poisson ratio of the rock mass.
Hence, by combining Equations (8) and (9), the equation of qmax can be obtained and expressed as follows:
q max = 0.364 F 1 3 1 μ T E T r p 2 3
By analogy with Hertz, the range of stress corrosion phenomena is also assumed to be hemispherical in the target rock mass. Similarly, the strength corrosion phenomenon no longer occurs in the target material rock mass when the vertical stress at point M is less than 0.1 qmax. By combining Equations (7) and (10), the strength erosion area can be obtained as follows:
r < 3.623 1 μ T E T r p m p v p z 2 1 3

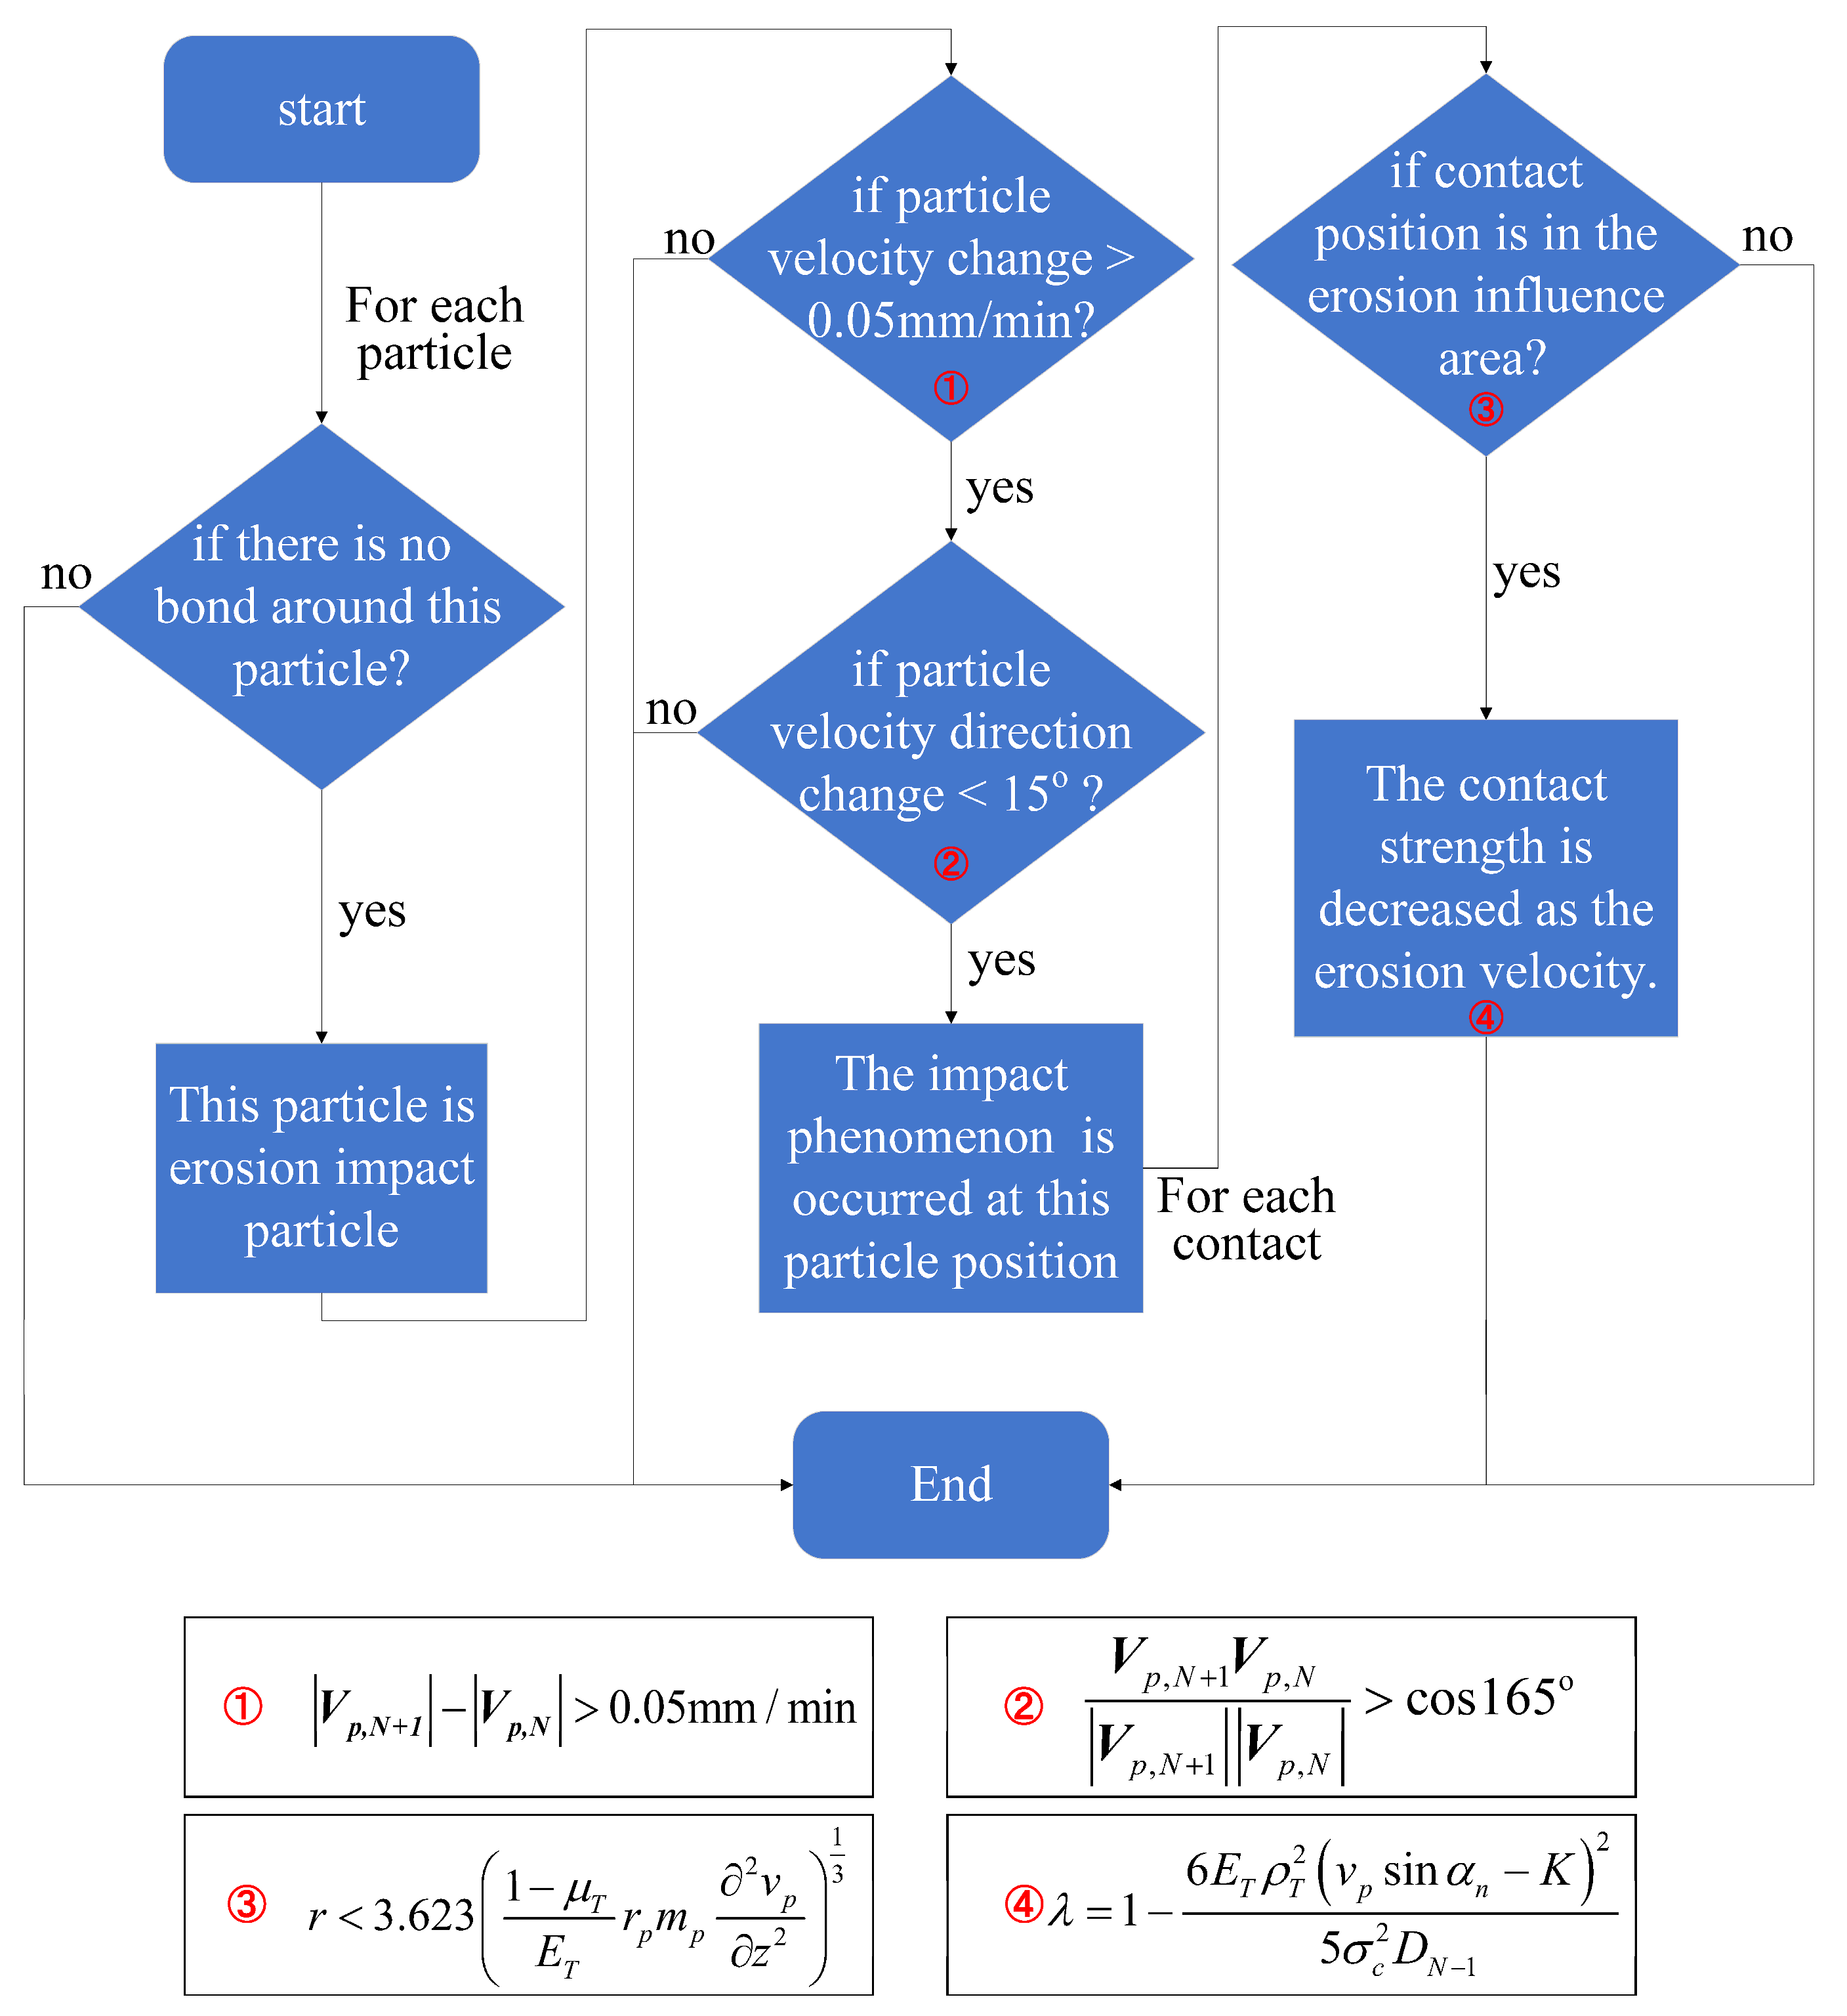
2.4. Realization of Impacting Strength Erosion in a Particle Discrete Element Simulation

Based on the proposed strength erosion calculation model for impact, a secondary development was conducted on the broken rock mass numerical model under water immersion and lateral compression conditions. It is assessed based on the presence or absence of constraints around the particle to determine whether a particle is an impact particle in the numerical model. The impact position of particles and the range of strength erosion influence are determined by Equation (11), and the specific procedure is illustrated in Figure 4. Considering the coordination between computational speed and accuracy, the model traverses all particles and updates data on impacted particles and erosion areas every 3000 steps. In the formula in Figure 4, Vp is the vector form of particle impact velocity, with subscripts N and N + 1 denoting the running process of erosion position determination code for the Nth and (N + 1)th times, respectively.

3. Establishment of a Discrete Element Numerical Model for Broken Rock Mass in Goaf

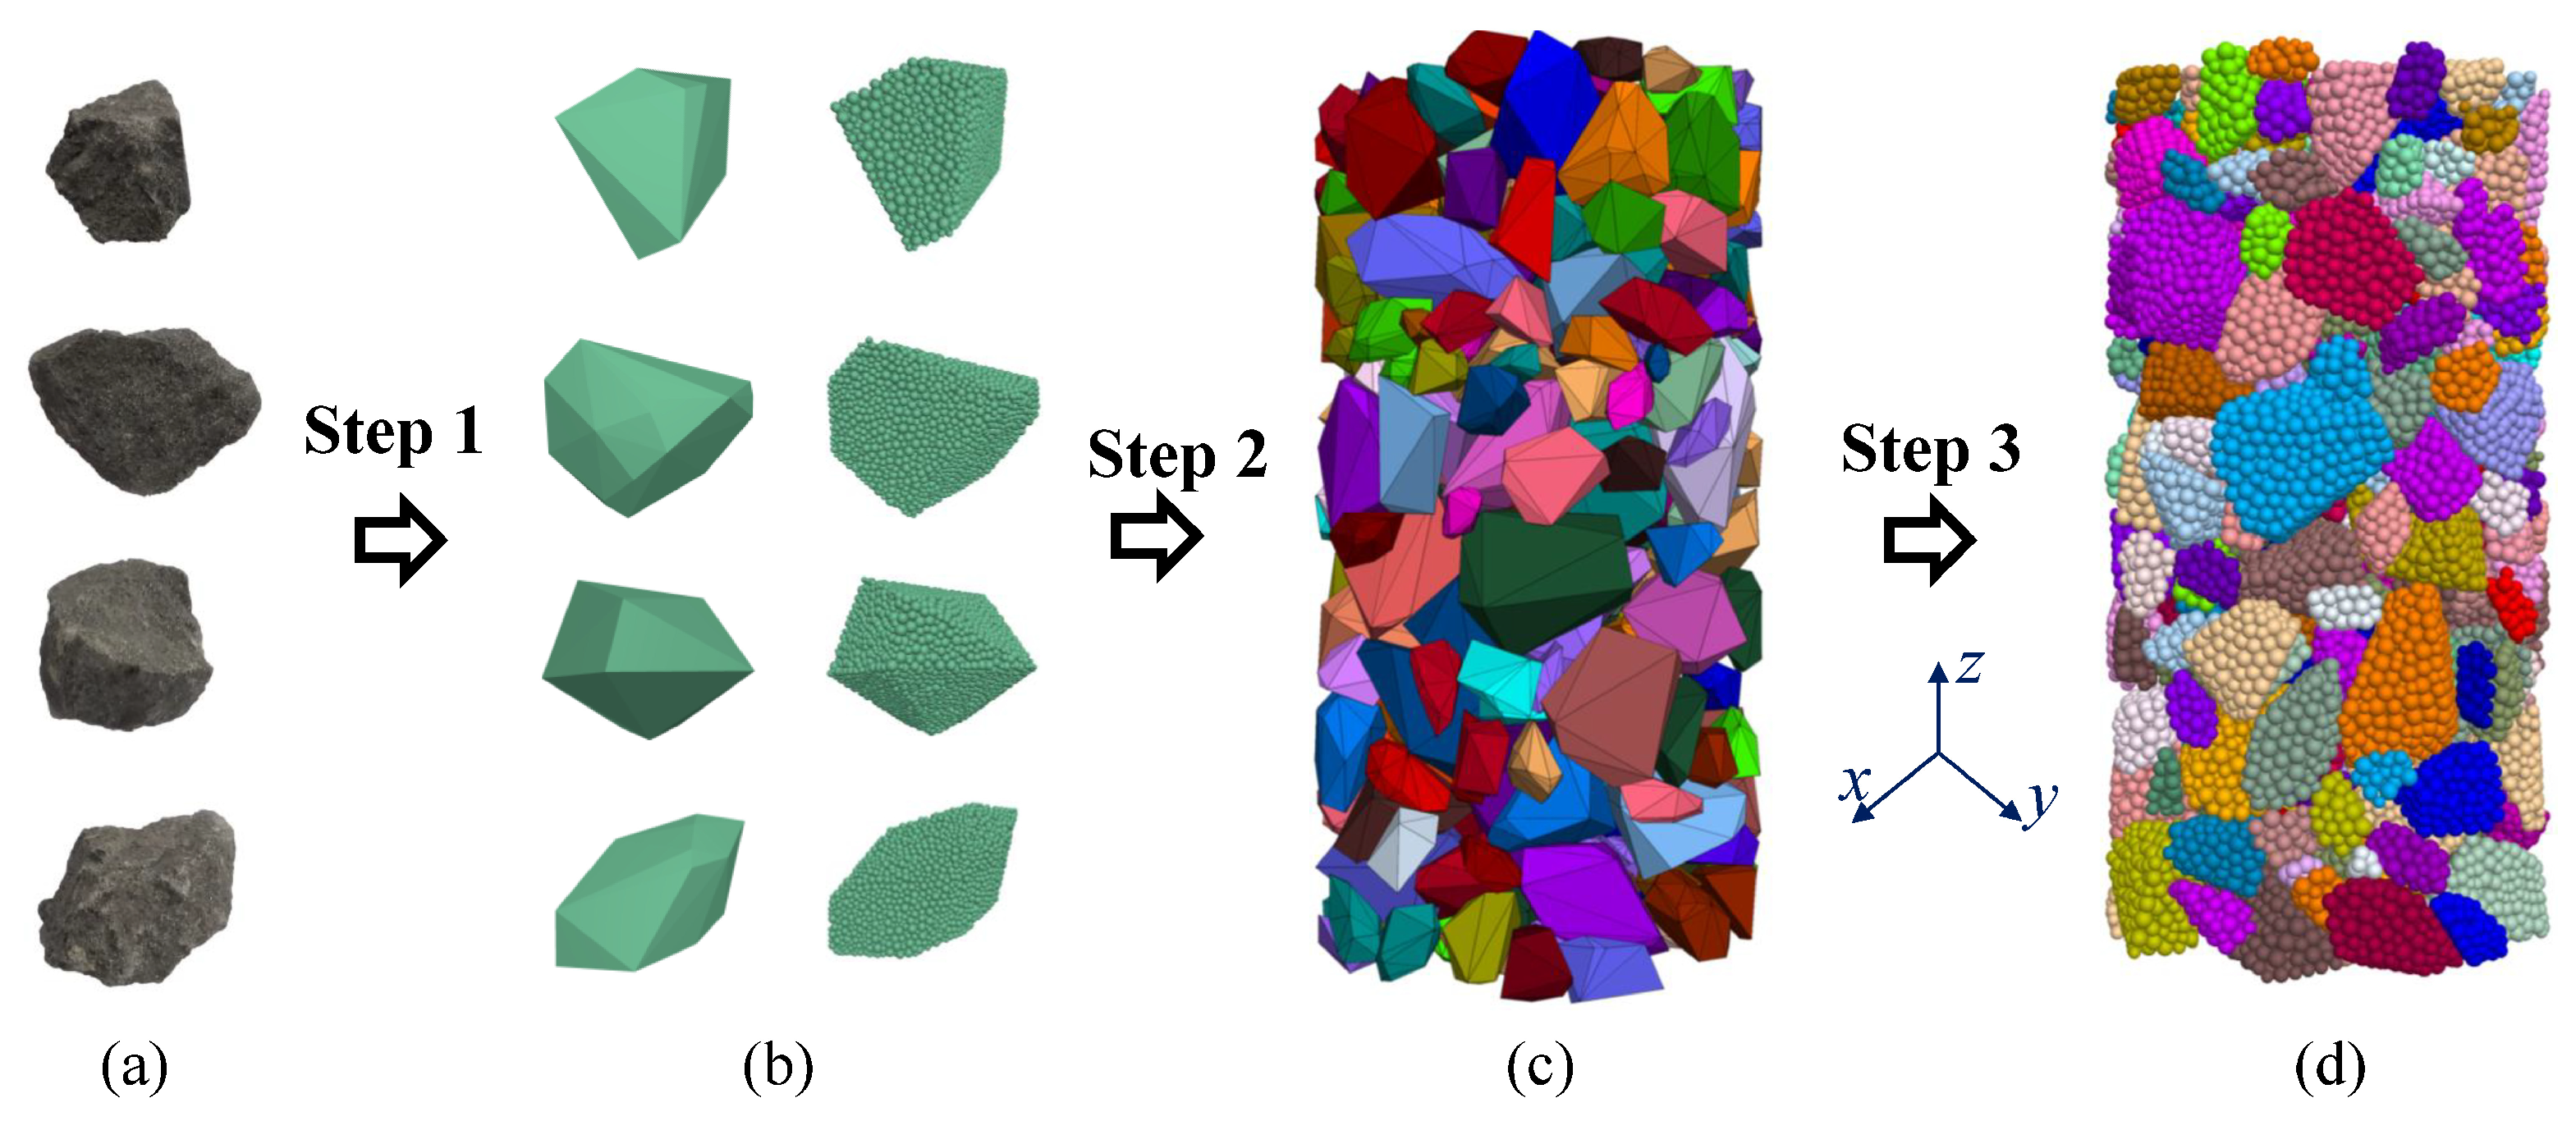
3.1. Simulation Method of the Broken Rock Mass Specimen

The software PFC3D7.0 is widely used to simulate particle breakage by the debris replacement method and the bonding combination method [33], and it was used to establish the broken rock mass specimen in this study. The schematic diagram of the numerical model of particle discrete element under compression loading of broken rock mass under the conditions of flooding and lateral confinement is shown in Figure 5 [26]. We utilized the digital rock method to better align the established broken rock mass specimen with real-world conditions [34,35,36]. This numerical model can simulate the deformation and fracture characteristics of broken rock masses with different size gradations in goaf during geothermal mining in abandoned mines.
The main steps for establishing the numerical model of broken rock mass are as follows:
① CT scanning was carried out on the rock blocks sampled in the goaf, and four kinds of on-site rock blocks were selected in this simulation, as shown in Figure 5a;
② The corresponding structural block template for the CT results was established, as shown in Figure 5b;
③ The four types of rock blocks were grouped according to certain gradations. Five kinds of size gradation conditions were discussed in this paper, and detailed information is shown in Section 3.2;
④ A cylinder with a height of 100 mm and a diameter of 50 mm was generated, and the balance was calculated, as shown in Figure 5c;
⑤ Spherical particles were generated within the closed structure of each broken rock block in Figure 5c, and the equilibrium was calculated;
⑥ Particles within the same block were bonded together by parallel bonding contact bonds, and closed structural planes were removed, as shown in Figure 5d.
The undergo load and its setting method for this broken rock mass numerical simulation model are described in Section 3.4 and Section 3.5.

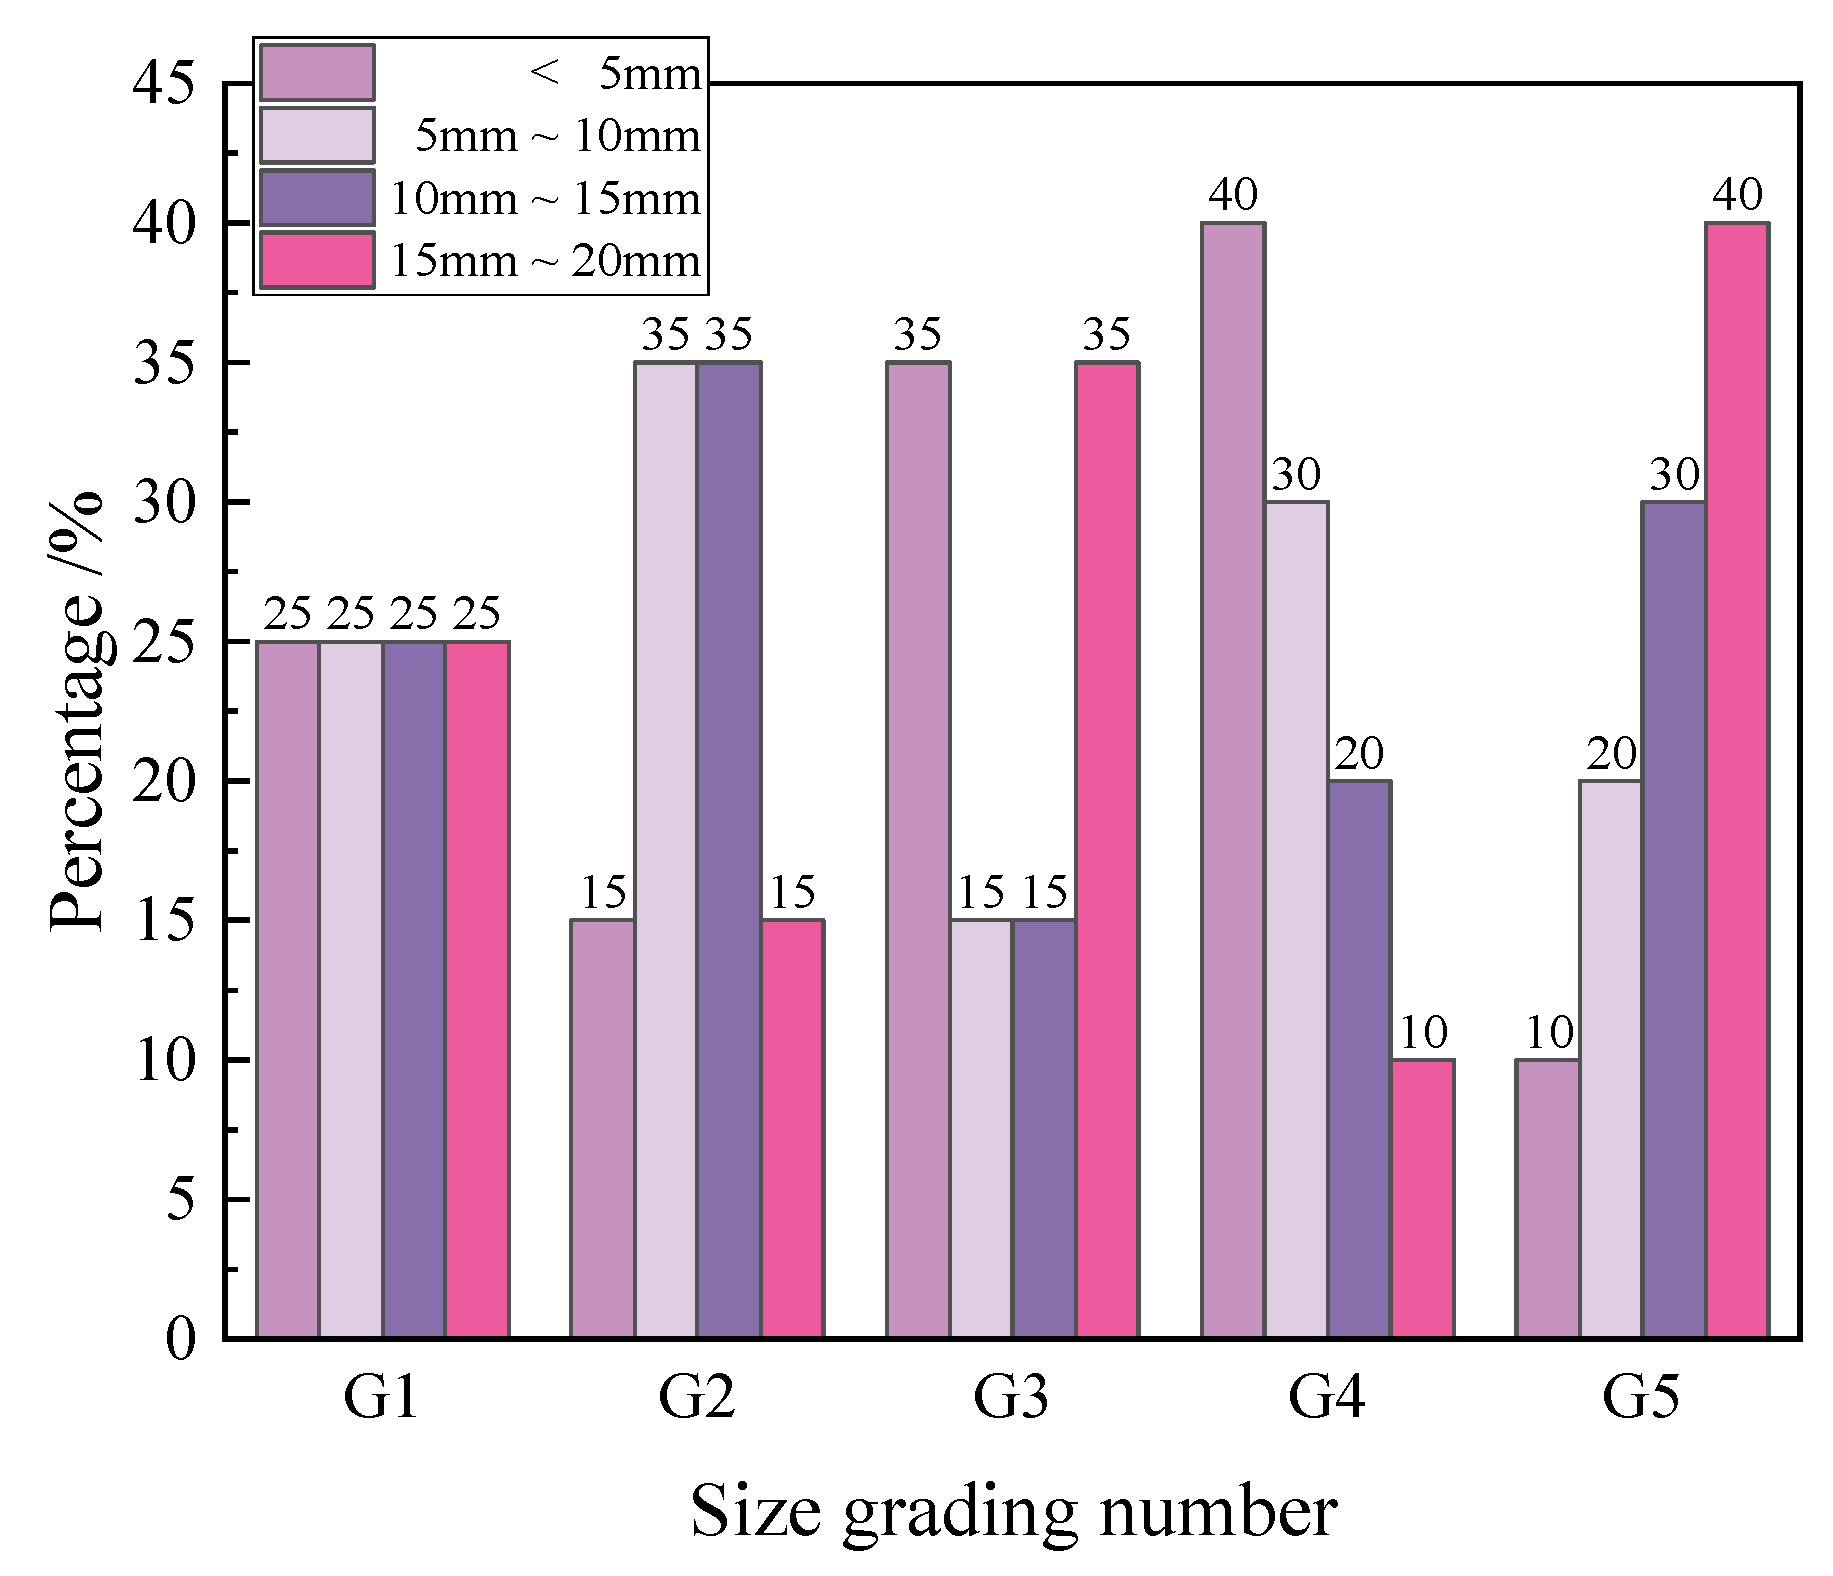
3.2. Size Grading Scheme of the Broken Rock Mass Specimen

The broken rock in the caving zone comprises blocks generated from the rupture of the immediate roof above the goaf [14]. The fragment size distribution of the immediate roof is random, and it is not easy to monitor the size grading exactly on-site. Accordingly, the block size is divided into four groups: less than 5 mm, 5 mm~10 mm, 10 mm~15 mm, and 15 mm to 20 mm. Five different kinds of grading sizes are fully considered in this study (shown in Figure 6) [13]: The proportion of the size groups is homogeneous distribution (G1); the proportion of the large and small size groups is less than the middle size groups (G2); the proportion of the large and small size groups is more than the middle size groups (G3); the proportion of the size groups constantly decreases with the size increasing (G4); and the proportion of the size groups increases as constant with the size increasing (G5).

3.3. Determination of the Mesoscopic Parameter

The model was continuously adjusted to determine mesoscopic parameters in the particle discrete element method until its results were consistent with the macroscopic results of corresponding indoor experiments [37]. The initial void ratio of broken rock mass in the goaf is generally between 0.5 and 0.6 [38], and it was set at 0.55 in this study.
The final calibration results of the discrete element mesoscopic parameter of broken rock mass are shown in Table 1.

3.4. Fluid Force Embedding

Under the geothermal water storage environment in the goaf, the broken rock mass is immersed in the water for a long time and affected by the fluid force. In this numerical simulation study, buoyancy, Fb, and drag, Fd, are set as fluid forces. The buoyancy can be computed as follows:
F b = ρ f V p g
where ρf denotes the fluid density and g is the gravity.
The drag can be obtained by:
F d = 6 π η f r p v p
where ηf is the fluid dynamic viscosity.

3.5. Loading Method of Laterally Confined Compression (LCS)

The effects of overlying strata compaction and the constraints of surrounding rock masses on broken rock mass in abandoned mine goaf were simplified as lateral compression loading of broken rock mass specimens. The compression effect on broken rock mass is applied by the relative displacement between the upper and lower loading plates, with displacements of 0.1 mm/min and −0.1 mm/min, respectively. Lateral confinement is provided by fixed lateral cylindrical plates, as shown in Figure 7.

4. Results and Discussion

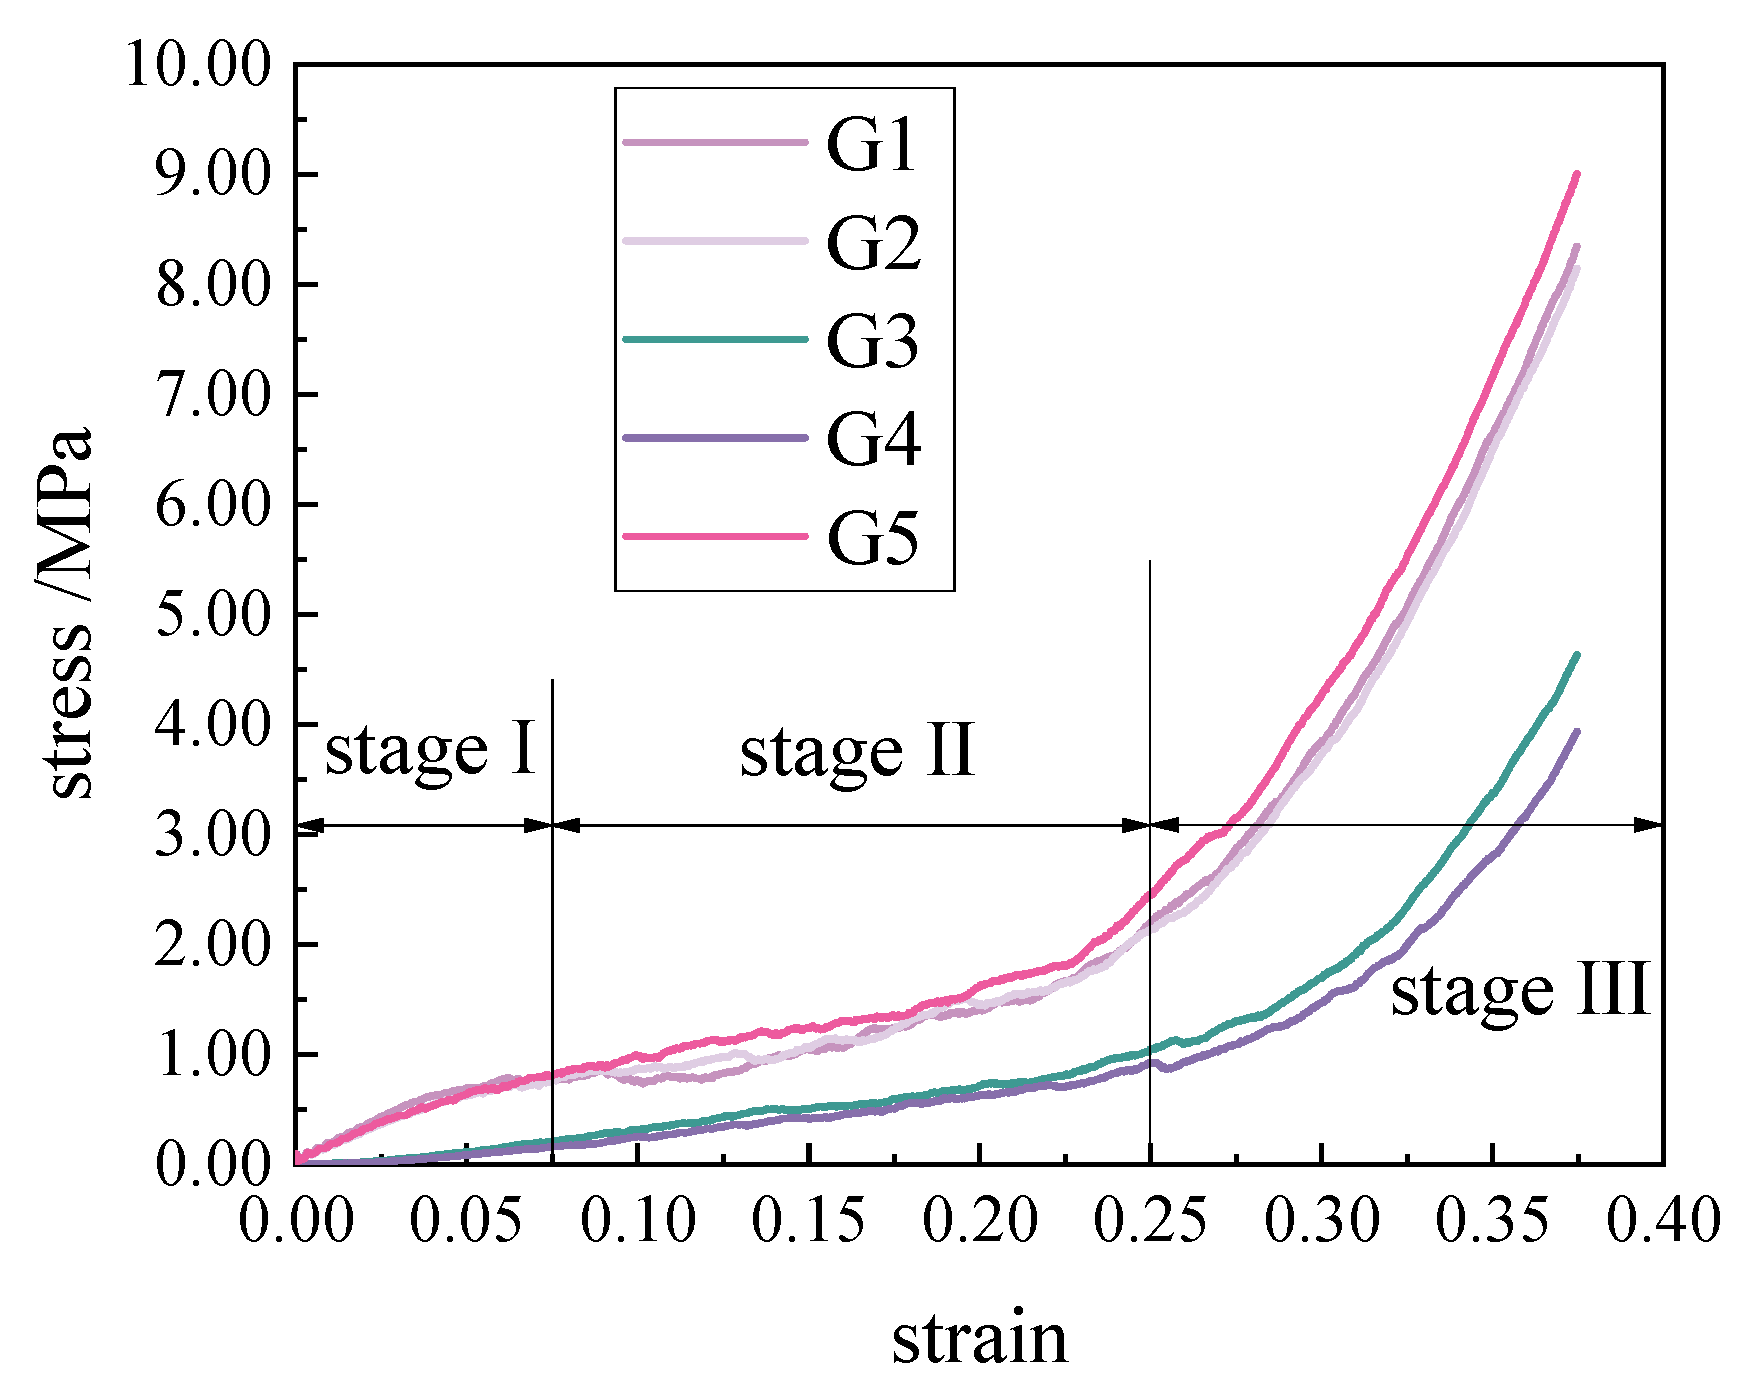
4.1. Stress–Strain Curve of Broken Rock Mass in Different Size Grading Conditions

The stress–strain relationship curve of broken rock mass under lateral compression with different size grading distributions and with or without impact strength corrosion influence is shown in Figure 8.
As can be seen from Figure 8, the stress–strain curve of broken rock mass under confined compressive stress exhibits exponential growth, consistent with the results of laboratory experiments and empirical formulas [39,40,41]. The stress–strain curve of the broken rock mass can be divided into three stages: Stage I: the initial stage; Stage II: the slow growth stage; and Stage III: the rapid growth stage. In the initial stage (Stage I), the rock mass has a relatively large void ratio, allowing for sufficient displacement and rotation of rock blocks. Therefore, the stress increase in the broken rock mass skeleton is slow, and rock blocks can fully displace or rotate. During the slow growth stage (Stage II), the void ratio decreases, leading to an increased interlocking phenomenon between rock blocks and gradually increasing the stress-bearing capacity of the broken rock mass. In the rapid growth stage (Stage III), the void ratio continues to decrease while interlocking forces between rock blocks increase, resulting in rapid strain growth in the broken rock mass.
When the grading size distribution of a broken rock mass is classified as G5, it indicates a higher proportion of larger particles and a loose arrangement of the structure. As a result, greater stress loading is required to achieve the same strain. This in turn leads to the fastest growth rate in the stress–strain curve for the G5 grading size distribution. Conversely, when the grading size distribution is classified as G4, it signifies a higher proportion of smaller particles and a relatively larger void ratio after compression. This allows for greater displacement space for smaller rock blocks and makes it easier for the broken rock mass to undergo skeleton redistribution. Therefore, the stress–strain curve exhibits the slowest growth rate for the G4 grading size distribution. For G3 grading size distribution, there exists a significant difference in particle sizes where larger rock blocks support the framework while smaller particles tend to fill in the gaps, resulting in a more stable skeleton structure and thus a slower growth rate in the stress–strain curve. In the case of G1 or G2 grading size distributions, both large and small particles are distributed relatively evenly. Consequently, their stress–strain curves exhibit similar characteristics.

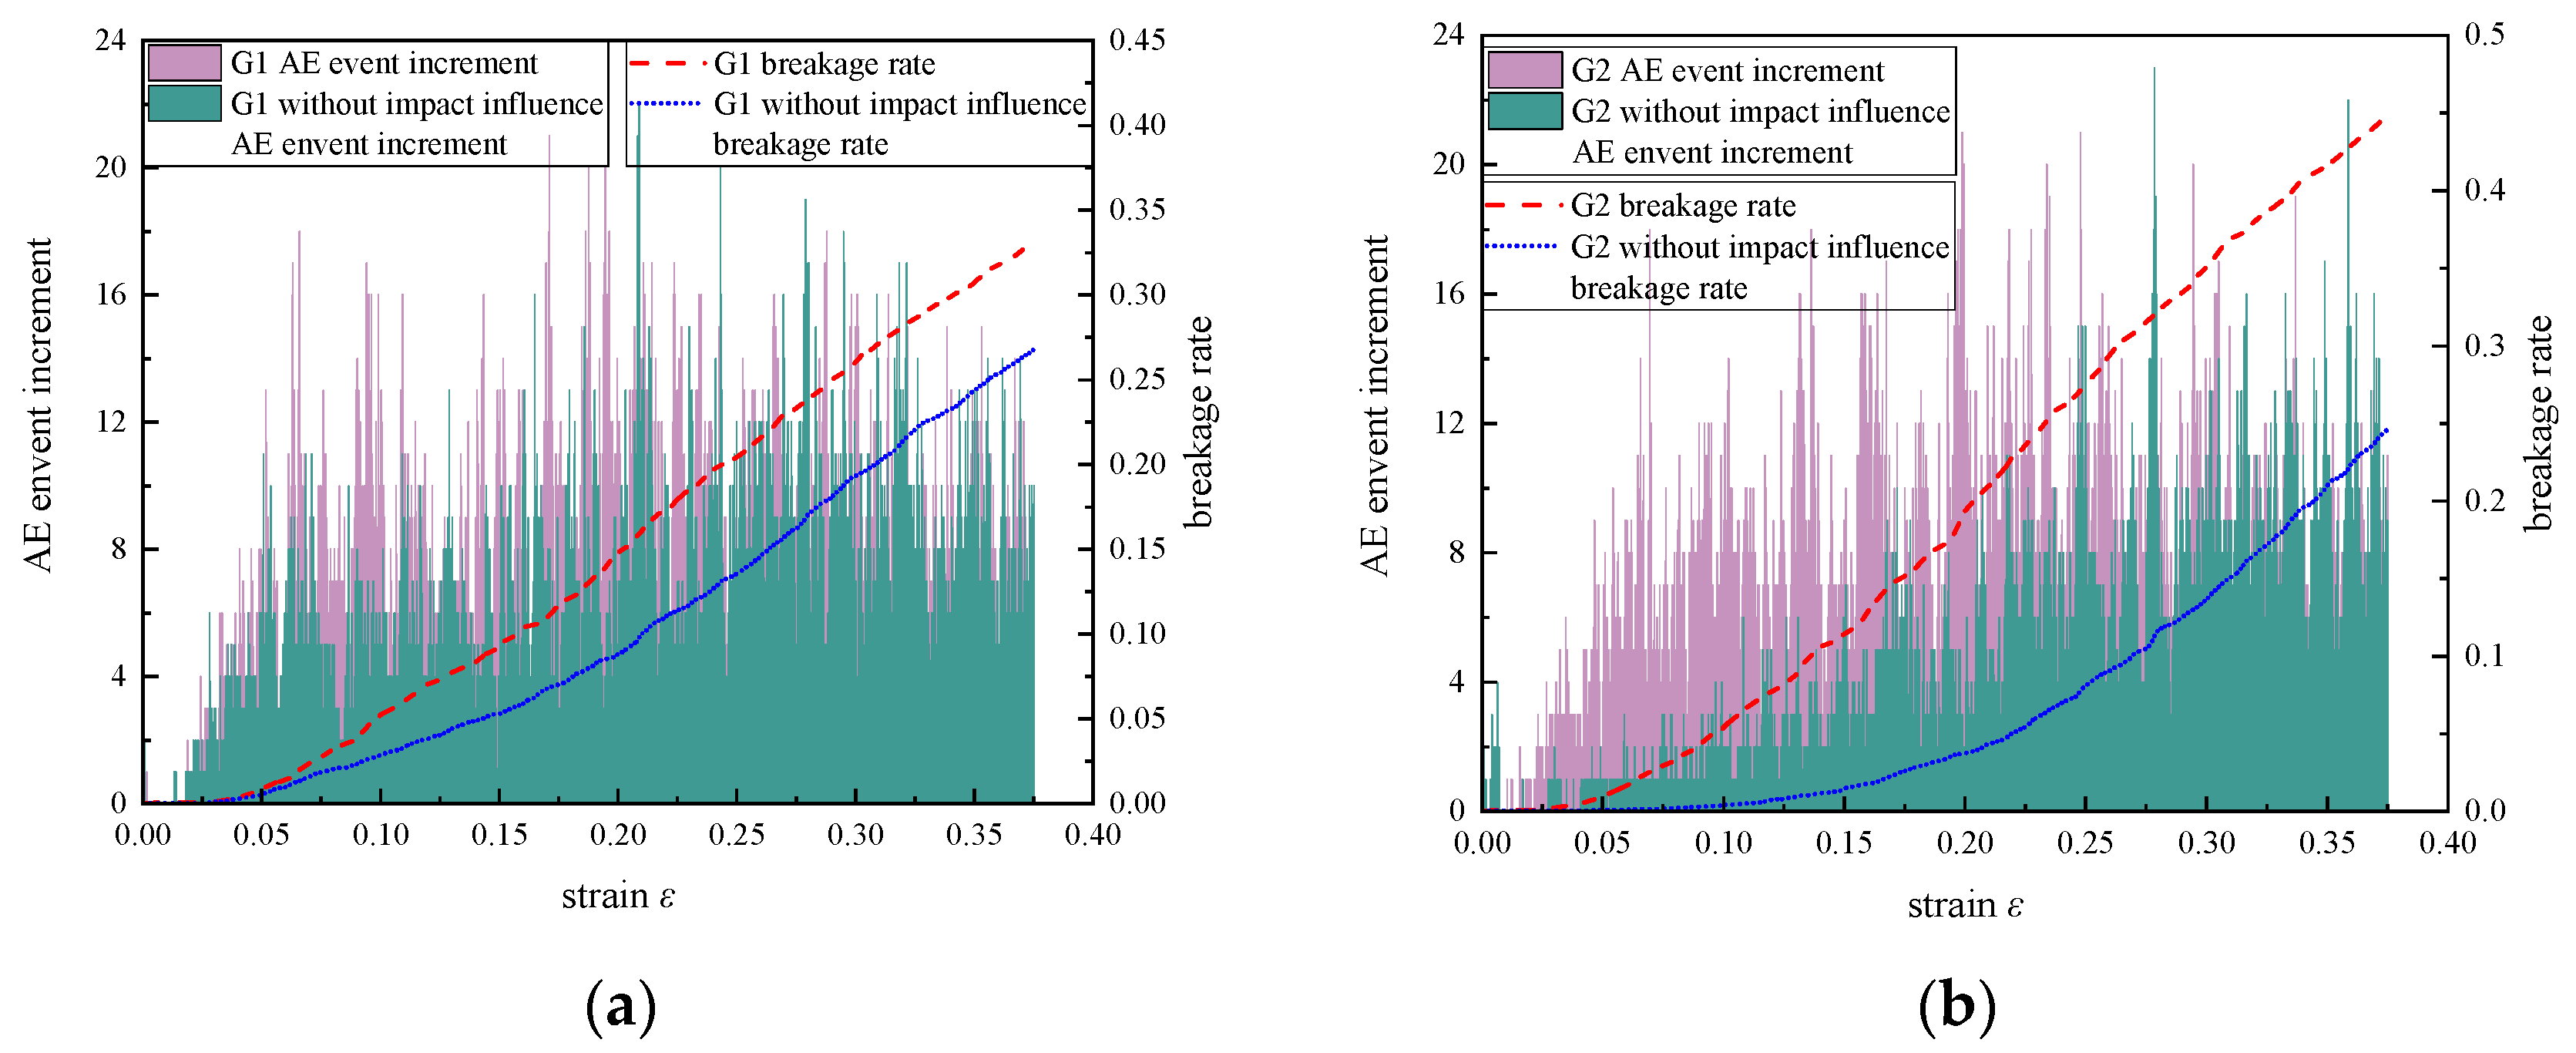
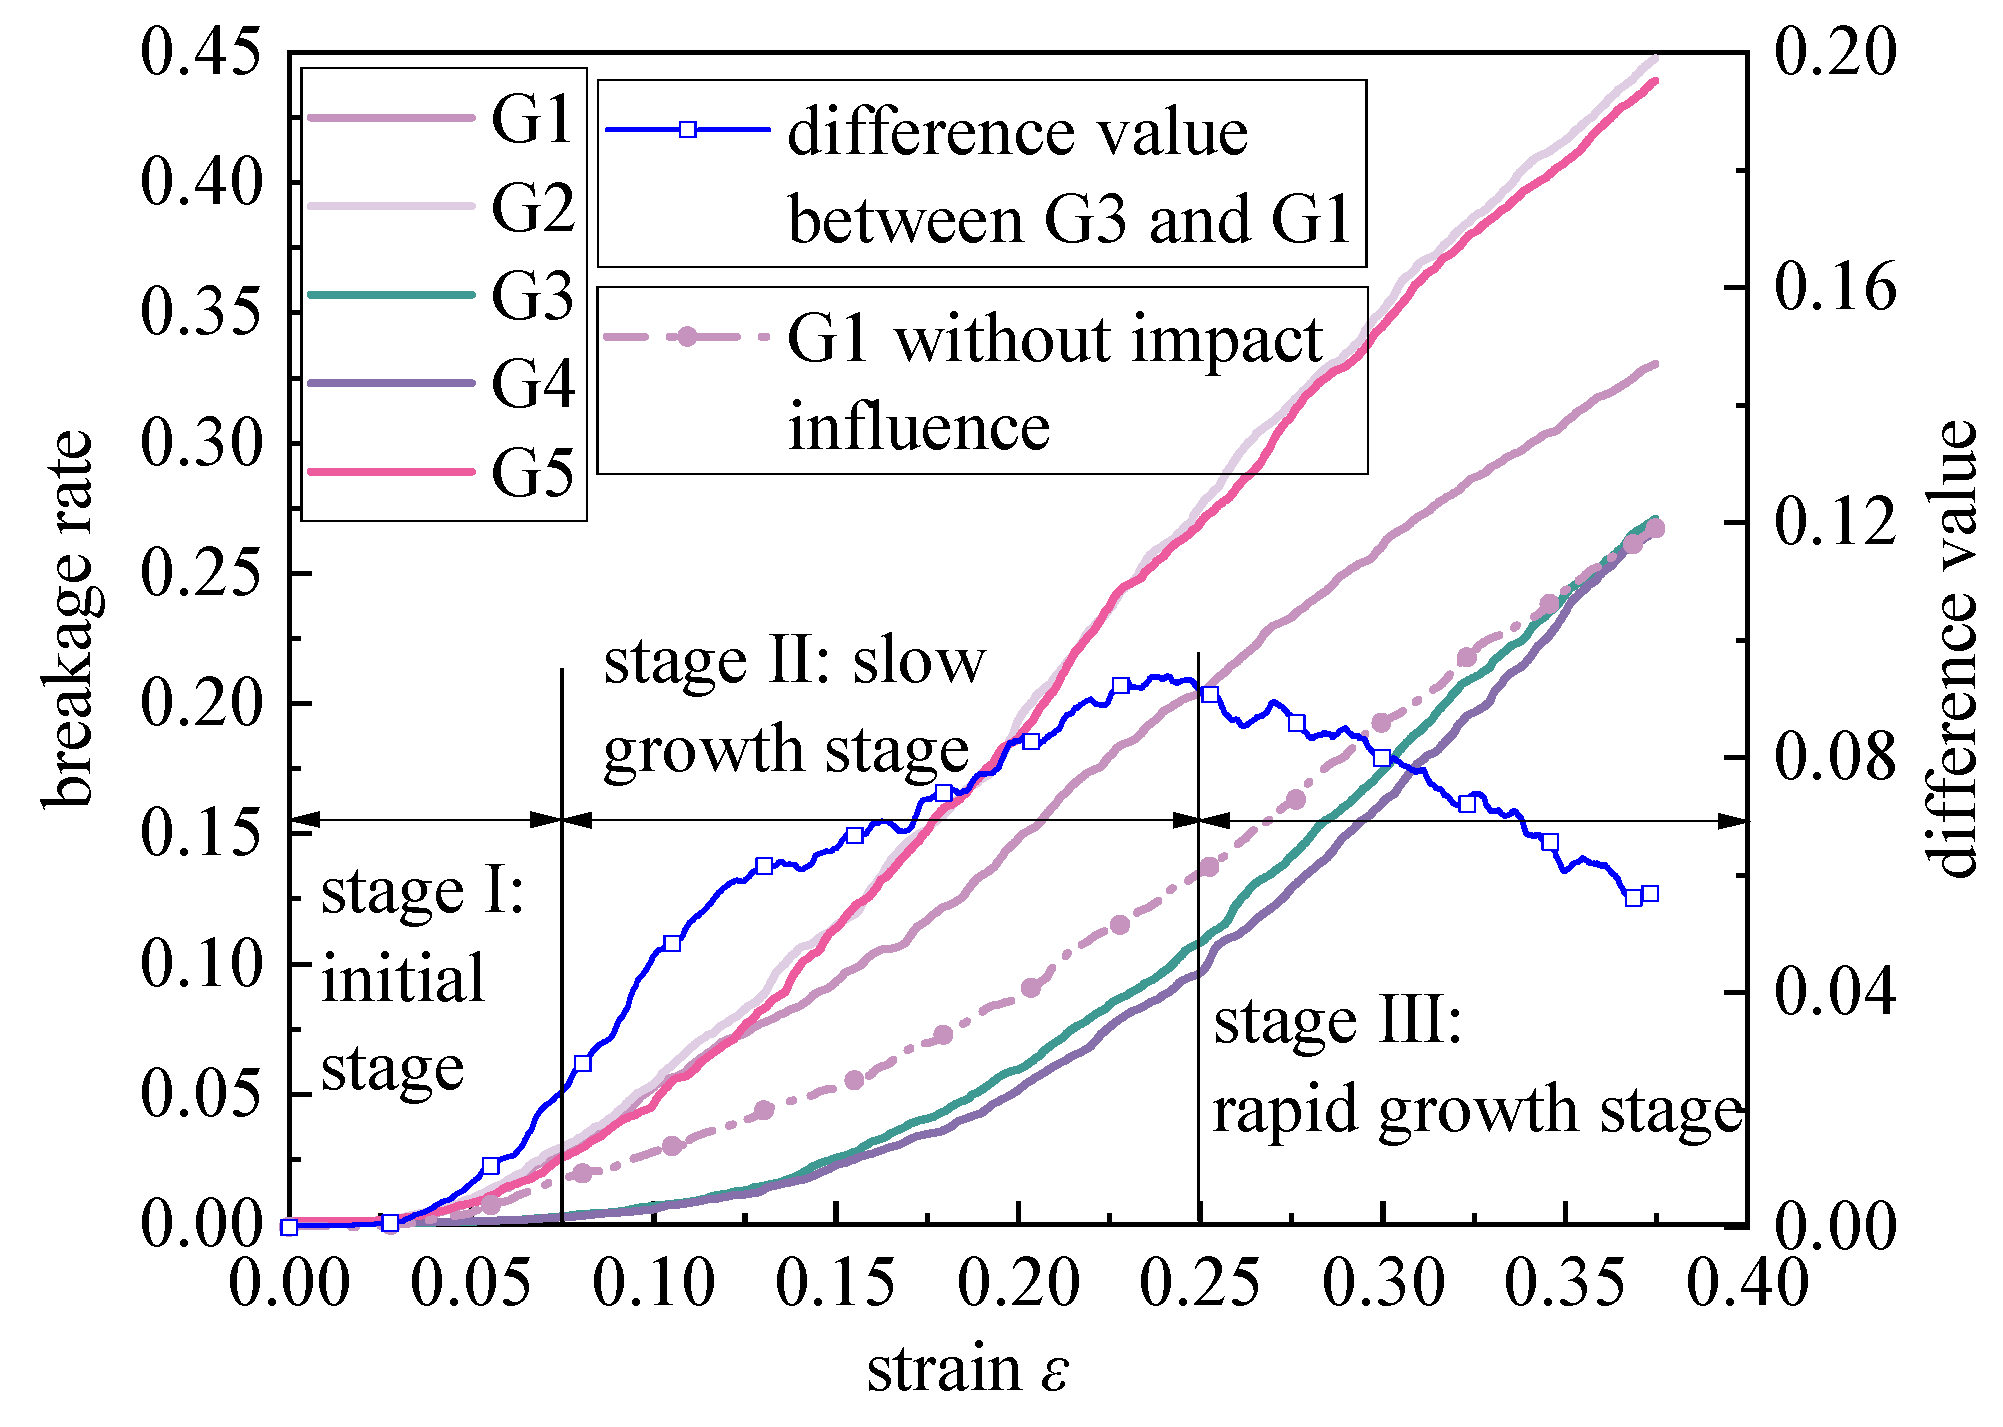
4.2. Breakage Rate of Broken Rock Mass in Different Size Grading Conditions

AE is a phenomenon that spans the generation and propagation of acoustic waves caused by sudden irreversible changes in the internal structure of a material [42,43,44,45]. In the discrete element model of broken rock mass, the basic element is ‘ball’, and the ‘contact’ between balls within a rock block is considered as parallel bonding. During the confined compression loading process of broken rock mass, bonding fractures occur, resulting in microcracks that are regarded as acoustic emission events. To better approximate real-time monitoring results of acoustic emissions, these occurrences of microcracks with similar initiation time and space are treated as individual AE events [46].
The total number of parallel bonding contacts in broken rock masses with different size grades cannot directly reflect the degree of secondary fracturing. Therefore, the concept of a microcrack ratio is introduced. The concept of a breakage ratio needs to be introduced, which can be defined as follows:
R b = n N
where n denotes the number of parallel bond fractures and N is the total parallel bonds in the broken rock mass model.
The influence of impact-induced strength erosion on the AE events of broken rock mass and breakage rate with different size grading distributions was compared, and the results are shown in Figure 9.
According to Figure 9, impact-induced strength erosion has a significant effect on the increment of AE events in broken rock mass during the early stage of lateral compression loading overall. However, there is a small difference between them during the later stage of loading. This indicates that during the early stage of loading, microcrack propagation is mainly caused by the weakening effect of impacts from small-sized rock blocks. In contrast, during the later stage of loading, as voids decrease and impact particles are hindered and deposited, microcrack propagation induced by lateral compression in broken rock mass increases significantly compared to impact-induced strength erosion weakening effects.
When the particle size distribution of the crushed rock masses is highly disparate, i.e., G3, the impact weakening effect has the greatest influence on the growth of microcracks and breakage rate in the broken rock mass. This is because larger rock blocks tend to fracture, while smaller ones are more likely to become impact particles under combined lateral compression loads and fluid forces. As G3 contains a higher proportion of both large and small particles, impact weakening occurs more frequently and thus exerts a greater influence. Conversely, when the particle size distribution of broken rock blocks is uniform, i.e., G1, the impact-induced strength erosion effect minimally influences secondary fracturing in the broken rock mass.
The relationship between the breakage rate and strain of broken rock specimens with different size gradings under limiting constraints of compression and water immersion conditions, as calculated by using Equation (14), is shown in Figure 10.
As shown in Figure 10, the breakage rate–strain curve of broken rock mass is divided into three stages, corresponding to the stress–strain curve in Figure 8. In Stage I, deformation of the broken rock mass is predominantly induced by pore compression, and the rock mass skeleton structure is not yet stable, resulting in a minimal rock block failure rate. Combined with Figure 8, the breakage rate is closely related to the stress–strain curve pattern. In the early period of Stage I, the stress in the broken rock mass approaches zero, resulting in an almost negligible breakage rate. In the later period of Stage I, stress begins to slowly increase, leading to a gradual increase in the breakage rate. In Stage II, the interaction force between rock blocks is intensified, initiating the formation of penetrating cracks and causing a slow increase in the breakage rate. Combined with Figure 8, it can be concluded that during Stage II, the erosive weakening effect of impact strength predominantly governs the generation of microcracks in the broken rock mass. Upon entering Stage III, the interlocking action between rock blocks rapidly increases, accelerating the breakage rate, thereby causing a rapid increase in the breakage rate in Stage III.
Combining with Figure 9a, take the broken rock sample with a size grading of G1 as an example, this study explored the influence of impact-induced strength corrosion on the breakage rate. In Stage I, there are few early AE events in the G1 broken rock sample, indicating that no small-sized impacting rock particles have been formed yet. At this stage, the two breakage rate curves, with or without impact influence, overlap with each other. In the later period of Stage I, impacting rock particles start to appear, and the strength corrosion effect begins to affect the breakage rate, causing a gradual separation between the two curves. In Stage II, the number of impact particles increases, and the separation trend between the two curves becomes more pronounced. During this stage, the impact of erosion on the breakage rate reaches its maximum. In Stage III, the growth rates of both curves become similar. In this stage, microcracks are caused by two factors: firstly, the mutual compression and interlocking between rock blocks lead to direct fracture; secondly, particle impacts reduce the local strength of rock blocks, making fracture phenomena more likely to occur. The difference in incremental AE events decreases in Stage III, indicating that mutual interlocking between rock blocks becomes the dominant factor for rock fragmentation at this stage.
Combined with Figure 8, according to the trend similarity of the stress–strain curve, these five kinds of grading size broken rock masses can be divided into two groups: Group 1 with G1, G2, and G5; Group 2 with G3 and G4. To discuss the two groups’ differences in breakage rate characteristics, we take G1 vs. G3, for example, as shown in Figure 10. The difference value of the breakage rate between G1 and G3 increases until Stage III, then decreases during Stage III, and the maximum difference value is 0.094.

4.3. Fracture Morphology of Broken Rock Mass

The propagation law of microcracks in broken rock masses under lateral compressive loads and water immersion conditions lays the theoretical basis for the study of the connectivity of goaf. The crack propagation law of broken rock mass in this numerical simulation study with different size grading distributions is shown in Figure 11.
According to Figure 11, as the broken rock sample is loaded, the cracks disperse when ε is less than 0.175. This is because, as a granular material, broken rock causes adjacent rock blocks to undergo squeezing and occlusion actions under compression load. The stress concentrates at the edges of these occlusion blocks, leading to crack formation. This corresponds with the conclusion in reference [21] that compressed loads on broken rock masses can easily cause fractures at the edges of rock blocks. Therefore, during the initial loading stage, microcracks are more dispersed in distribution, which is similar to the reference study [19]. This contrasts with jointed rock masses, where initial microcracks tend to concentrate at the joints, particularly near the joint tip [47]. After the post-loading stage, when the strain reaches 0.275, crack propagation accelerates and exhibits a clustered distribution. When the strain reaches 0.375, cracks form a mesh-like pattern with enhanced connectivity. However, due to a significant reduction in porosity, the overall connectivity of broken rock mass decreases. The evolution of porosity in broken rock masses will be further discussed in the next section.

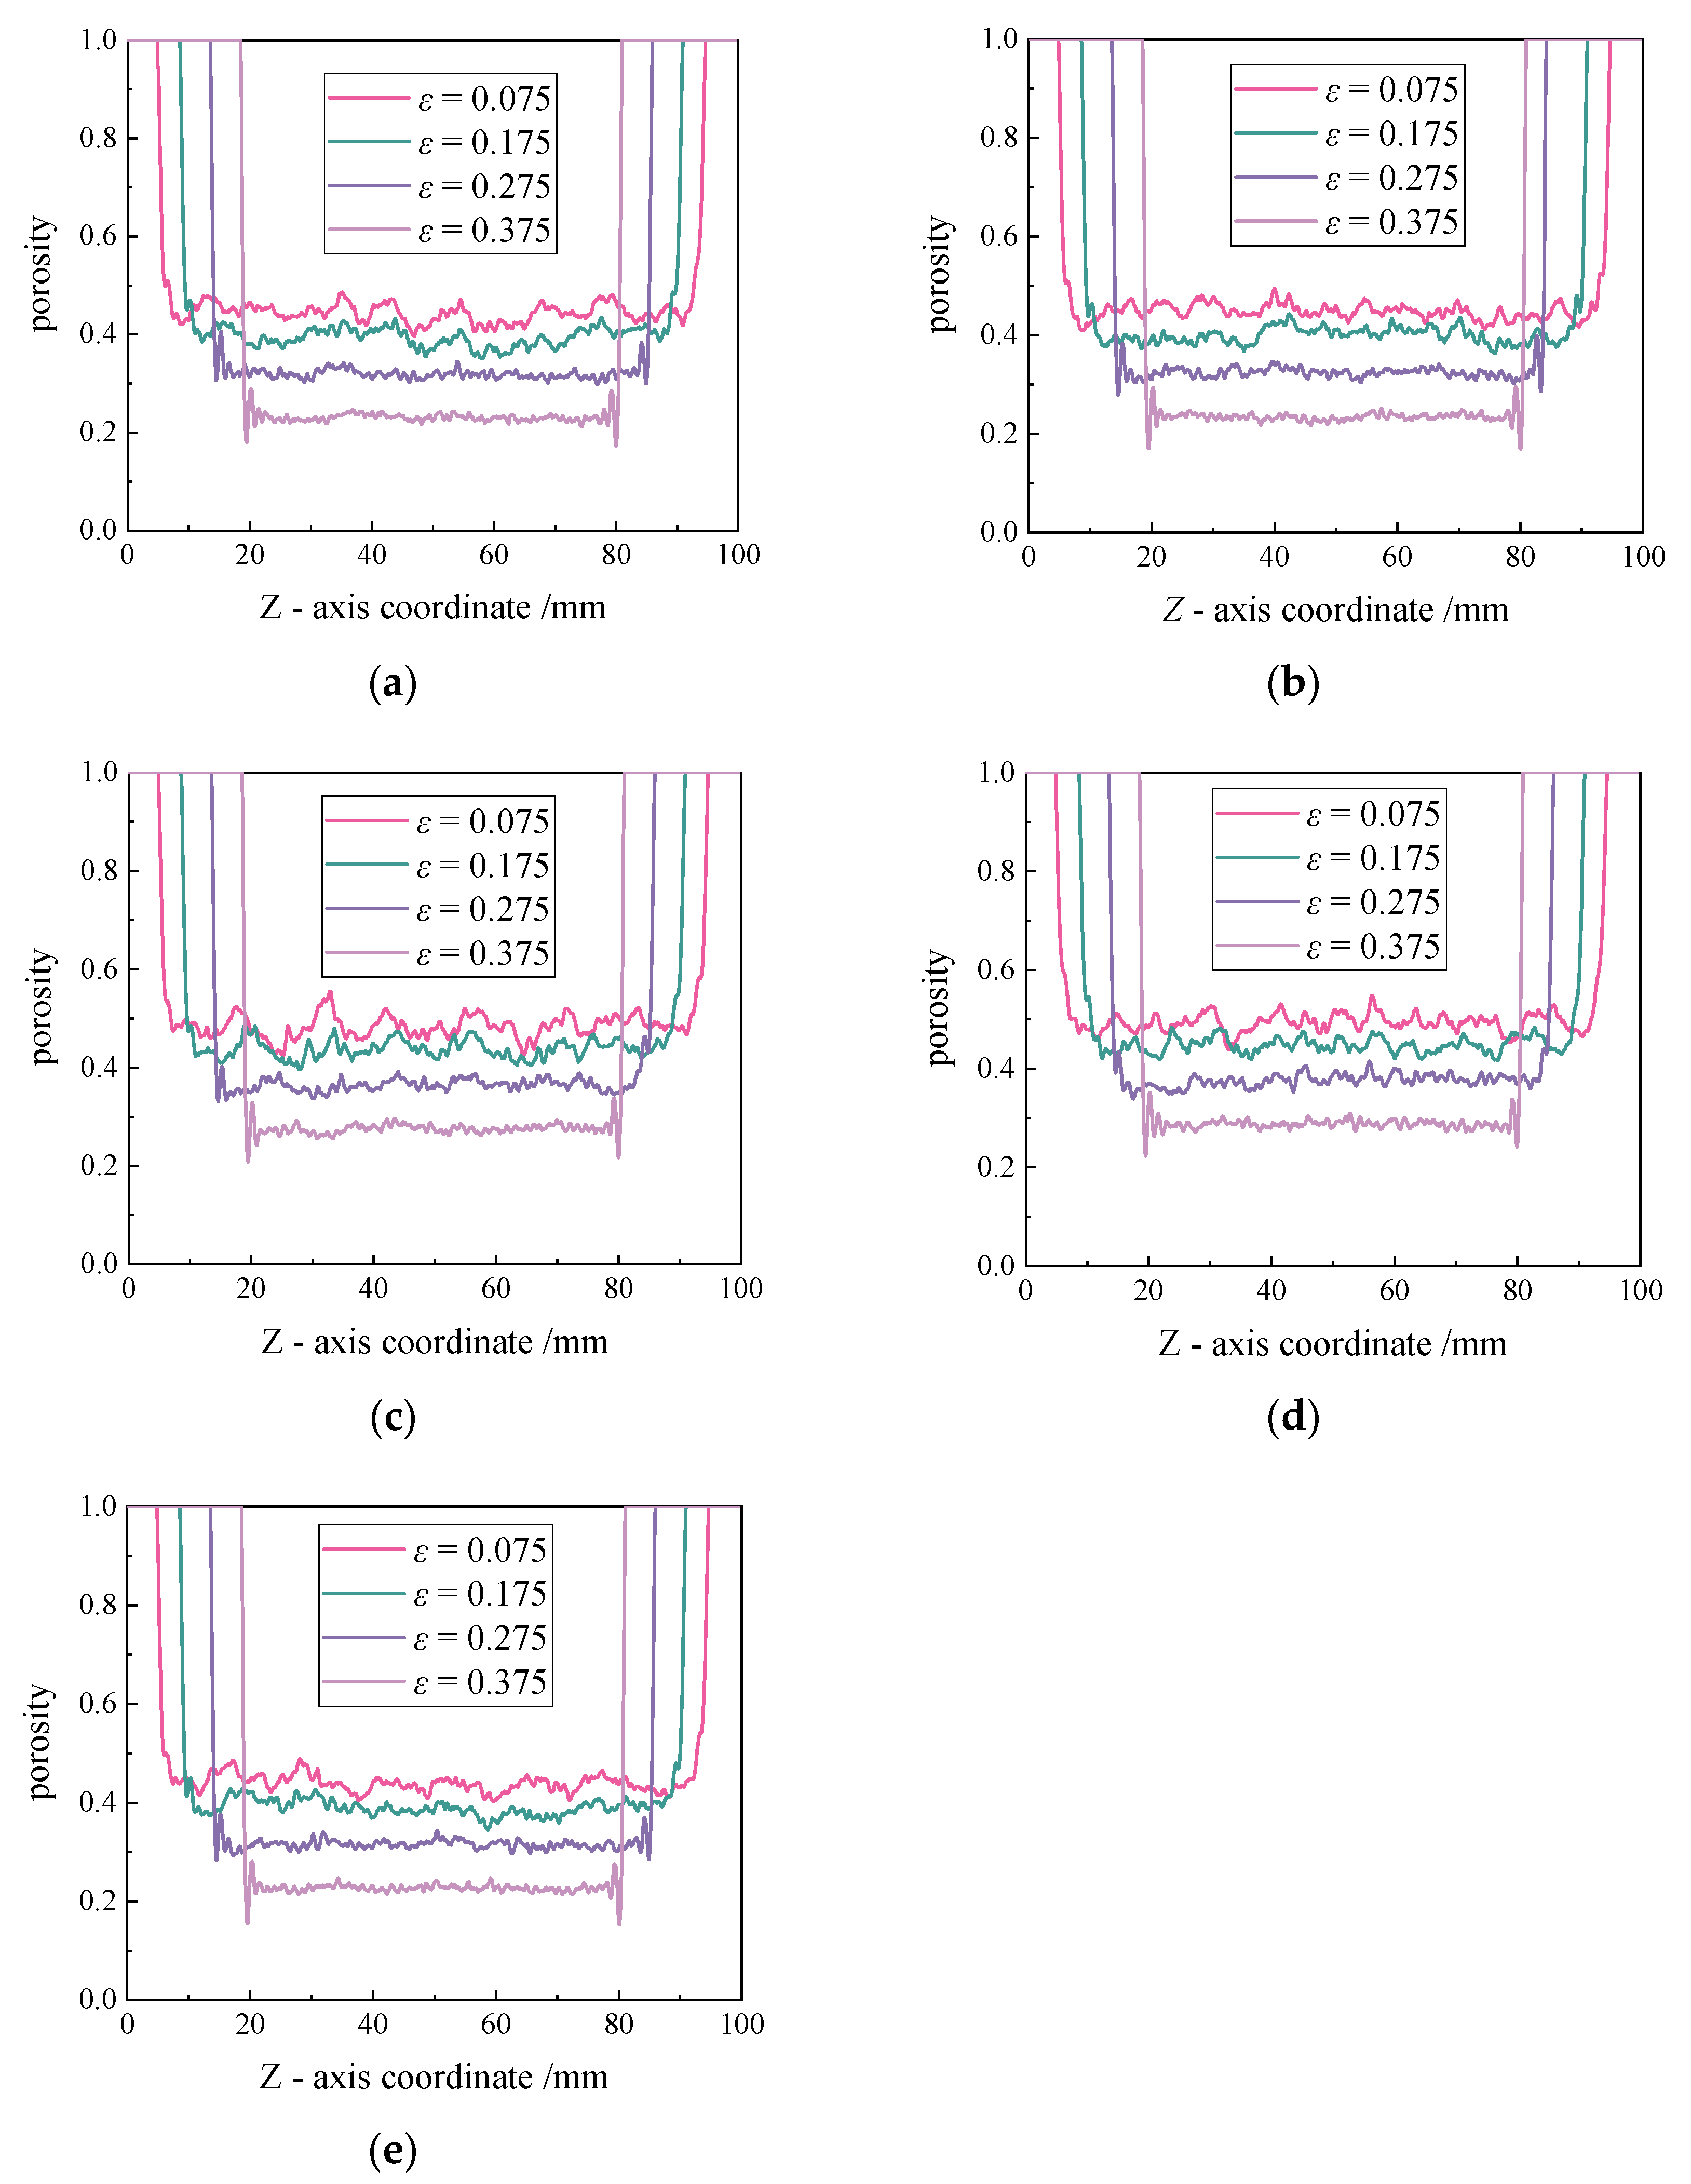
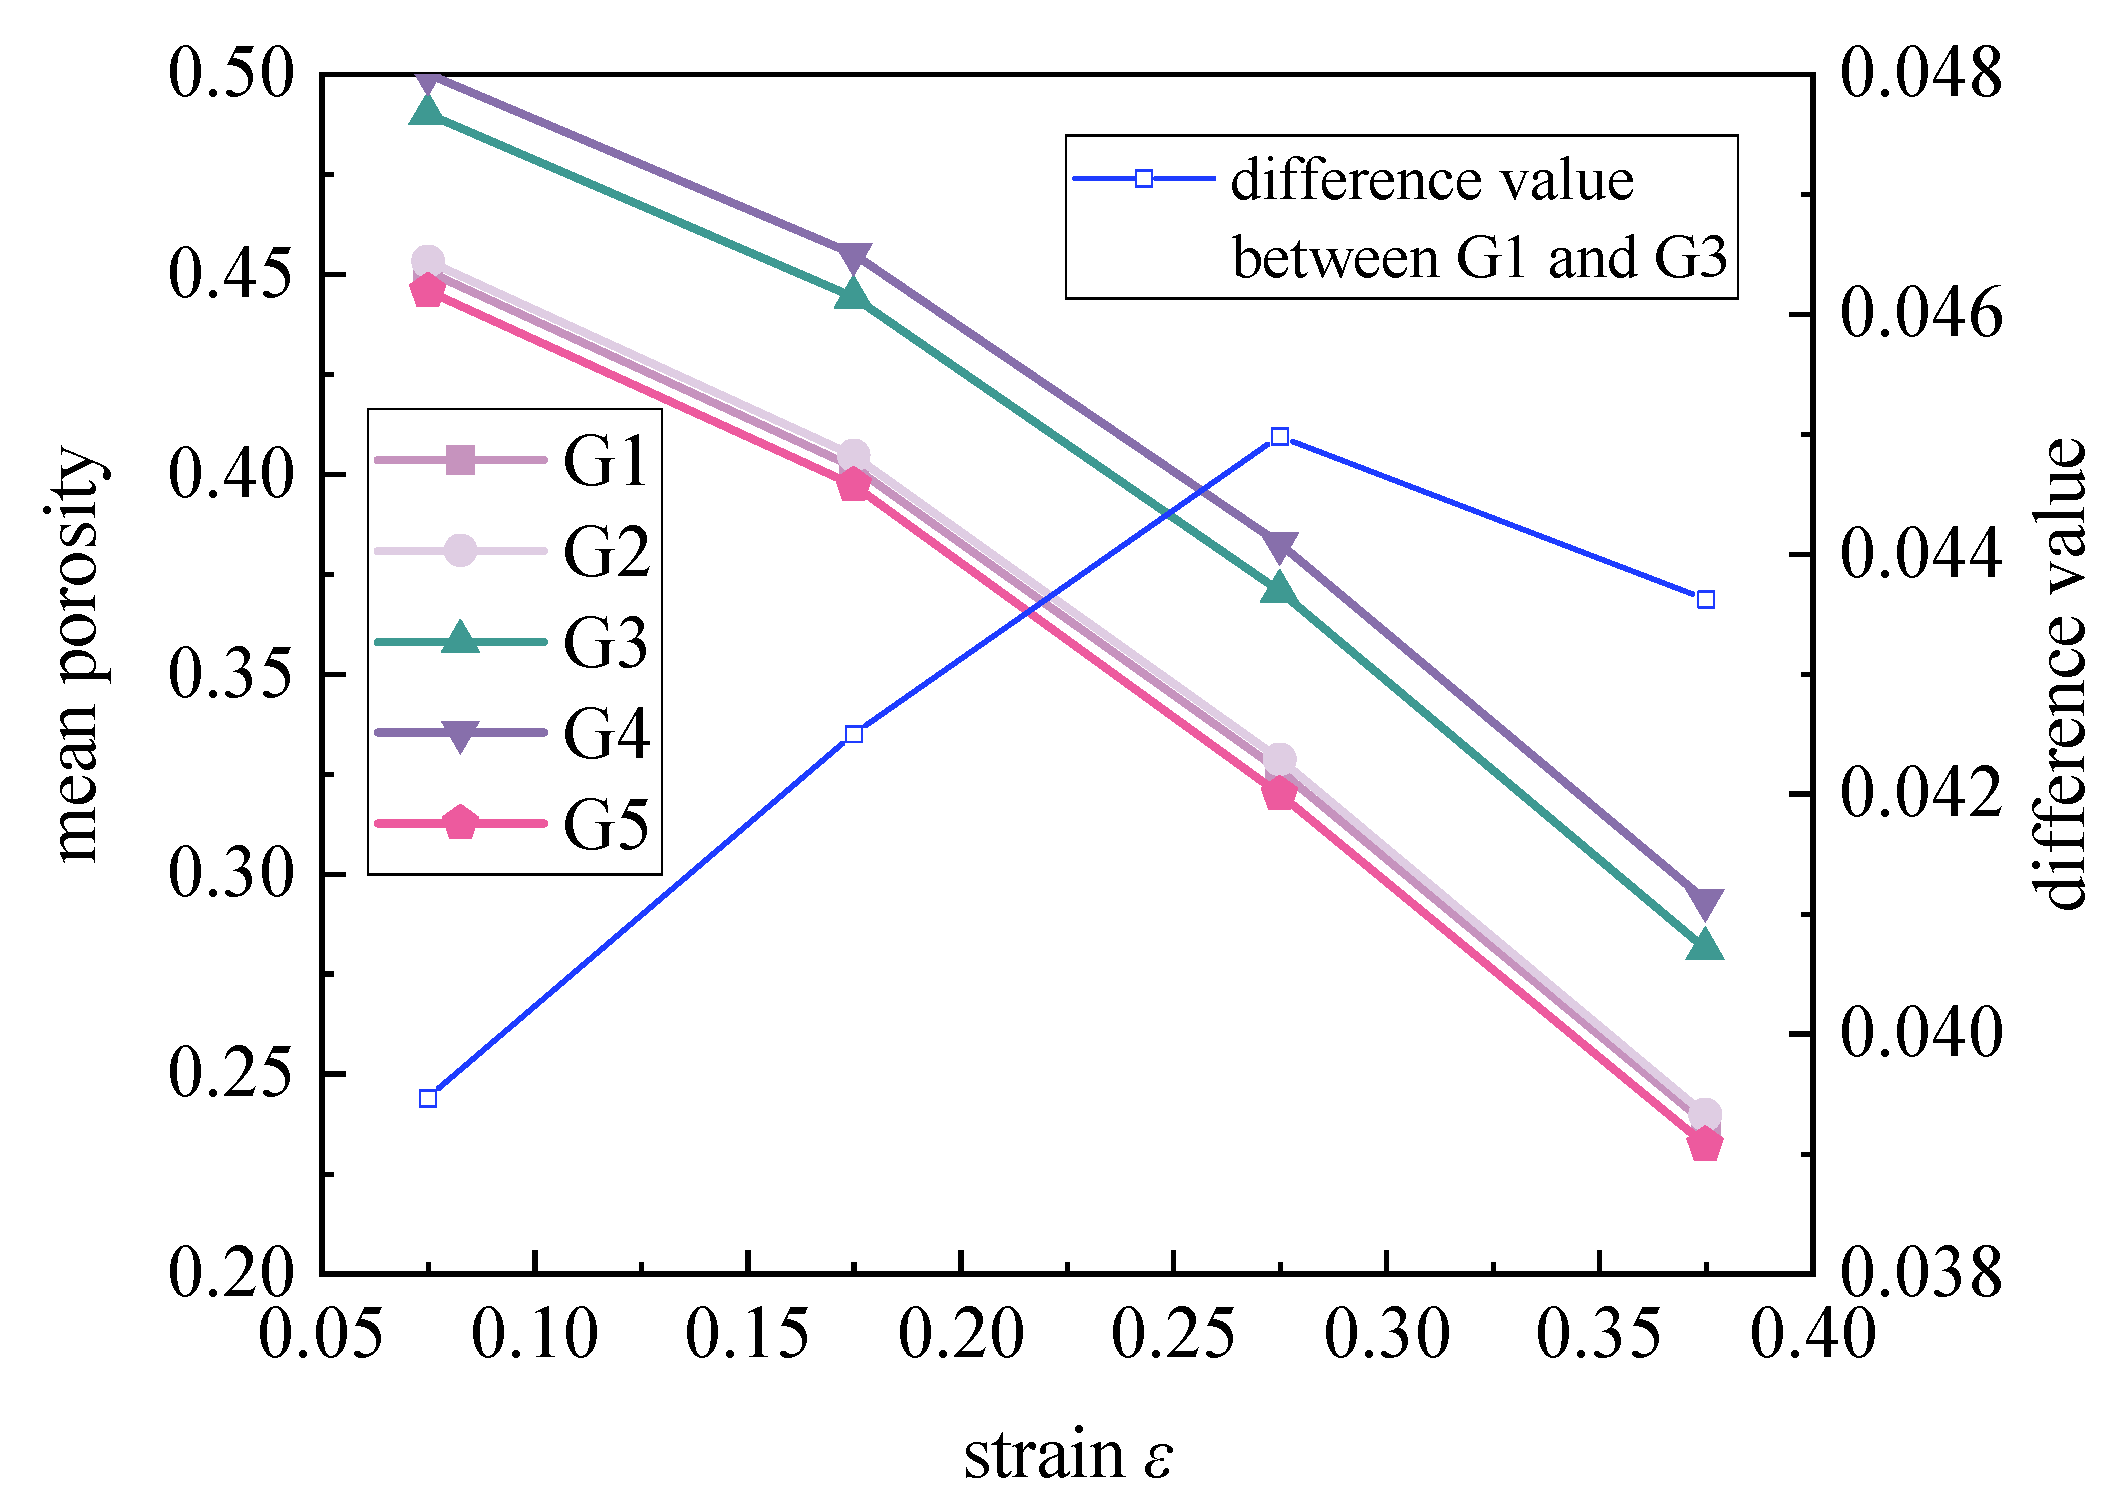
4.4. Porosity along the Vertical Direction

Porosity is an important fundamental parameter in the evolution process of broken rock masses [48]. Different from previous studies on the porosity of broken rock mass [26,39,40], this paper innovatively uses the slice method to visually display the porosity change along broken rock mass in the Z-axis space, which can more accurately study the spatial distribution characteristics of porosity along the seepage direction and provide a better theoretical basis for the evaluation of the permeability characteristics of thermal storage mine water. The model was divided into 1000 slices along the z-axis at different strain levels of 0.075, 0.175, 0.275, and 0.375, and the corresponding porosity of each slice with different size grading distributions in the broken rock mass was recorded, as shown in Figure 12.
As shown in Figure 12, the initial broken rock mass sample undergoes symmetrical compressive deformation along the z-axis due to the influence of axial stress. The porosity at the starting and ending parts of the z-axis is zero, whereas non-zero porosity indicates the presence of a broken rock skeleton structure at that location. The porosity of broken rock mass decreases with increasing strain, and the porosity curve along the z-axis fluctuates and decreases as strain increases, indicating a more uniform distribution of rock blocks. When the strain reaches 0.275 and 0.375, significant symmetrical fluctuations in the broken rock mass porosity curve are observed at both ends of the z-axis. This is believed to be caused by the increased displacement of particles at both ends of the broken rock mass when the strain becomes too high. It results in a certain difference in displacement between adjacent particles above and below, leading to collisions between them and causing fluctuations in porosity.
The porosity of broken rock mass is related to its permeability characteristics, which directly affect the efficiency of extracting water with heat from the abandoned mine. To analyze and study the influence of particle size grading distribution on the porosity of broken rock mass, the variation law of average porosity with strain for broken rock mass with different size grading distributions is shown in Figure 13.
According to Figure 13, the overall porosity of broken rock mass under lateral compression decreases gradually with strain, and the curve trend is similar for different size grading conditions. The difference in mean porosity between G1 and G3 is small, with a maximum value of 0.045, and the value increases first and then decreases. According to the study on the grading of rock mass in goaf formation under different lithological roof strata [14], the size grading of the broken rock mass in the goaf tends to be closer to G1, G2, and G4. When the particle size proportion decreases monotonically with particle size (G4), the porosity of the broken rock mass samples is consistently highest. At this time, the efficiency of extracting thermal mine water from abandoned mines can be relatively improved.

5. Conclusions

This study proposed an impact-induced strength corrosion calculation model and then incorporated it into the discrete element numerical simulation of broken rock mass subjected to confined compression and water immersion conditions. The deformation and fracture characteristics, as well as the AE features of broken rock mass with different size grading distributions considering impact-induced strength weakening, were investigated, and the evolution laws of layer-by-layer porosity and average porosity in the broken rock mass were analyzed. The main research findings are as follows:
(1) The stress–strain curve of confined compressed and water-immersed broken rock mass exhibits an exponential growth pattern, which can be divided into three stages: the initial stage, the slow growth stage, and the rapid growth stage. When the proportion of large-sized rock blocks in a broken rock mass is high (size grading as G5), the stress-strain curve exhibits the highest growth rate. Conversely, when the grading size distribution is classified as G4, which signifies a higher proportion of smaller particles and a relatively larger void ratio after compression, the stress–strain curve exhibits the slowest growth rate. When there is a significant difference in particle sizes (graded as G3), it results in a more stable skeleton structure and, thus, a slower growth rate in the stress–strain curve.
(2) The increase in AE events in broken rock mass samples considering impact-induced strength erosion is significantly higher than the case without considering this erosion during the early loading stage. However, there is little difference between them during the later loading stage. When the particle size of the broken rock mass is significantly different (graded as G3), impact strength erosion has the greatest impact on the growth of microcracks and the breakage rate in the broken rock mass. Conversely, when the particle size of the broken rock mass is uniform (graded as G1), impact strength erosion has minimal influence on secondary fracturing in the broken rock mass. The deformation and fracture of confined compressed and water-immersed broken rock mass are primarily controlled by the evolution of pore structure in the initial stage, impact-induced strength erosion in the slow growth stage, and interlocking between rock blocks in the rapid growth stage.
(3) When the strain of the broken rock mass is less than 0.175, the microcracks are scattered. When the strain reaches 0.275, microcrack propagation accelerates and forms a clustered distribution. At a strain of 0.375, microcracks exhibit a mesh-like pattern with enhanced connectivity. With the continuation of deformation, the porosity curve fluctuates along the z-axis with a decreasing trend and gradually becomes more uniform. When the strain reaches 0.275 and 0.375, significant symmetrical fluctuations in the broken rock mass porosity curve are observed at both ends of the sample. When the size grading distribution is classified as G4, the broken rock mass shows the lowest porosity, and the highest when classified as G5.

Author Contributions

Conceptualization, F.M.; Methodology, F.M. and Y.C.; Software, W.L. and Y.C.; Resources, H.P.; Data curation, M.L.; Writing—original draft, W.L.; Writing—review & editing, F.M.; Supervision, H.P. and M.L. All authors have read and agreed to the published version of the manuscript.

Funding

This work was supported by the Fundamental Research Funds for the Central Universities (2022QN1024).

Institutional Review Board Statement

Not applicable.

Informed Consent Statement

Not applicable.

Data Availability Statement

The original contributions presented in the study are included in the article, further inquiries can be directed to the corresponding author.

Conflicts of Interest

The authors declare no conflict of interest.

References

  1. Guo, P.; Zheng, L.; Sun, X.; He, M.; Wang, Y.; Shang, J. Sustainability evaluation model of geothermal resources in abandoned coal mine. Appl. Therm. Eng. 2018, 144, 804–811. [Google Scholar] [CrossRef]
  2. Peralta, R.E.; Breede, K.; Falcone, G. Geothermal heat recovery from abandoned mines: A systematic review of projects implemented worldwide and a methodology for screening new projects. Environ. Earth Sci. 2015, 73, 6783–6795. [Google Scholar] [CrossRef]
  3. Al-Habaibeh, A.; Athresh, A.P.; Parker, K. Performance analysis of using mine water from an abandoned coal mine for heating of buildings using an open loop based single shaft GSHP system. Appl. Energy 2018, 211, 393–402. [Google Scholar] [CrossRef]
  4. Opt, V.P.; Demollin-Schneiders, E. The mine water project Heerlen, the Netherlands—Low exergy in practice. In Proceedings of the 6th International Conference on Indoor Air Quality, Ventilation & Energy Conservation in Buildings (IAQVEC 2007), Sendai, Japan, 28–31 October 2007; pp. 28–31. [Google Scholar]
  5. Yuan, L.; Zhang, T.; Zhang, Q.H.; Jiang, B.; Lv, X.; Li, S.; Fu, Q. Construction of green low-carbon and multi-energy complementary system for abandoned mines under global carbon neutrality. J. China Coal Soc. 2022, 47, 2131–2139. (In Chinese) [Google Scholar]
  6. Zhai, X.; Wang, G.; Wu, J.; Bi, Y. Goaf compaction evaluation based on integrity and permeability measurement of the overburden strata. Teh. Vjesn. 2019, 26, 510–517. [Google Scholar]
  7. Wang, C.; Jiang, N.; Shen, B.; Sun, X.; Zhang, B.; Lu, Y.; Li, Y. Distribution and evolution of residual voids in longwall old goaf. Geomech. Eng. 2019, 19, 105–114. [Google Scholar]
  8. Xie, H.; Zhao, J.W.; Zhou, H.W.; Ren, S.H.; Zhang, R.X. Secondary utilizations and perspectives of mined underground space. Tunn. Undergr. Space Technol. 2020, 96, 103129. [Google Scholar] [CrossRef]
  9. Feng, M.; Wu, J.; Ma, D.; Ni, X.; Yu, B.; Chen, Z. Experimental investigation on the seepage property of saturated broken red sandstone of continuous gradation. Bull. Eng. Geol. Environ. 2018, 77, 1167–1178. [Google Scholar] [CrossRef]
  10. Zhang, L.; Zhu, J. Analysis of mechanical strength and failure morphology of prefabricated closed cracked rock mass under uniaxial compression. Geotech. Geol. Eng. 2020, 38, 4905–4915. [Google Scholar] [CrossRef]
  11. Li, B.; Liang, Y.; Zhang, L.; Zou, Q. Breakage law and fractal characteristics of broken coal and rock masses with different mixing ratios during compaction. Energy Sci. Eng. 2019, 7, 1000–1015. [Google Scholar] [CrossRef]
  12. Zhang, C.; Ren, Z.; Hao, D.; Zhang, T. Numerical Simulation of Particle Size Influence on the Breakage Mechanism of Broken Coal. Arab. J. Sci. Eng. 2020, 45, 9171–9185. [Google Scholar] [CrossRef]
  13. Meng, F.; Pu, H.; Dintwe, T.K.; Sasaoka, T.; Xu, J. Creep and breakage behavior of broken rock in the caved zone of abundant mines under triaxial compression condition. Energy Rep. 2022, 8, 14517–14532. [Google Scholar] [CrossRef]
  14. Zhang, C.; Bai, Q.; Zhu, C. A methodology for determining the size distribution of broken rock masses in longwall mining goaf. Geomech. Geophys. Geo-Energy Geo-Resour. 2022, 8, 113. [Google Scholar] [CrossRef]
  15. Li, Q.; Ma, D.; Zhang, Y.; Liu, Y.; Ma, Y.; Hu, D. Insights into controlling factors of pore structure and hydraulic properties of broken rock mass in a geothermal reservoir. Lithosphere 2021, 2021, 3887832. [Google Scholar] [CrossRef]
  16. Huang, Y.; Li, J.; Ma, D.; Gao, H.; Guo, Y.; Ouyang, S. Triaxial compression behaviour of gangue solid wastes under effects of particle size and confining pressure. Sci. Total Environ. 2019, 693, 133607. [Google Scholar] [CrossRef] [PubMed]
  17. Li, M.; Zhang, J.; Meng, G.; Gao, Y.; Li, A. Testing and modelling creep compression of waste rocks for backfill with different lithologies. Int. J. Rock Mech. Min. Sci. 2020, 125, 104170. [Google Scholar] [CrossRef]
  18. Li, C.; Yao, B.; Ma, Q. Numerical simulation study of variable-mass permeation of the broken rock mass under different cementation degrees. Adv. Civ. Eng. 2018, 1, 3592851. [Google Scholar] [CrossRef]
  19. Chen, X.; Gao, W.; Hu, C.; Wang, C.; Zhou, C. Study on macro–micro mechanical behavior of broken rock mass using numerical tests with discrete element method. Comput. Part. Mech. 2023, 10, 691–705. [Google Scholar] [CrossRef]
  20. Wang, Y.; Song, E.X.; Zhao, Z. Particle mechanics modeling of the effect of aggregate shape on creep of durable rockfills. Comput. Geotech. 2018, 98, 114–131. [Google Scholar] [CrossRef]
  21. Meng, F.; Pu, H.; Sasaoka, T.; Shimada, H.; Liu, S.; Dintwe, T.K.; Sha, Z. Time effect and prediction of broken rock bulking coefficient on the base of particle discrete element method. Int. J. Min. Sci. Technol. 2021, 31, 643–651. [Google Scholar] [CrossRef]
  22. Zhang, C.; Zhao, Y.; Bai, Q. 3D DEM method for compaction and breakage characteristics simulation of broken rock mass in goaf. Acta Geotech. 2022, 17, 2765–2781. [Google Scholar] [CrossRef]
  23. El-Zehairy, A.A.; Nezhad, M.M.; Joekar-Niasar, V.; Guymer, I.; Kourra, N.; Williams, M.A. Pore-network modelling of non-Darcy flow through heterogeneous porous media. Adv. Water Resour. 2019, 131, 103–378. [Google Scholar] [CrossRef]
  24. Li, B.; Liang, Y.; Zhang, L.; Zou, Q. Experimental investigation on compaction characteristics and permeability evolution of broken coal. Int. J. Rock Mech. Min. Sci. 2019, 118, 63–76. [Google Scholar] [CrossRef]
  25. Wu, Y.; Geng, H.; Hao, G.; Li, D. Experimental study on heat exchange efficiency of rock bed heat storage system based on broken rock mass. Energy Rep. 2022, 8, 12456–12465. [Google Scholar] [CrossRef]
  26. Meng, F.; Pu, H.; Ni, H.; Bian, Z. Research on re-fracturing mechanism and cavity structure evolution characteristics of broken rock mass in goaf of closed mine. Coal Sci. Technol. 2024, 52, 104–114. (In Chinese) [Google Scholar]
  27. Potyondy, D.O. Simulating stress corrosion with a bonded-particle model for rock. Int. J. Min. Sci. Technol. 2007, 44, 677–691. [Google Scholar] [CrossRef]
  28. Tran, T.H.; Vénier, R.; Cambou, B. Discrete modelling of rockageing in rockfill dams. Comput. Geotech. 2009, 36, 264–275. [Google Scholar] [CrossRef]
  29. Parsi, M.; Najmi, K.; Najafifard, F.; Hassani, S.; McLaury, B.S.; Shirazi, S.A. A comprehensive review of solid particle erosion modeling for oil and gas wells and pipelines applications. J. Nat. Gas Sci. Eng. 2014, 21, 850–873. [Google Scholar] [CrossRef]
  30. Bitter, J.G.A. A study of erosion phenomena: Part I. Wear 1963, 6, 5–21. [Google Scholar] [CrossRef]
  31. Bitter, J.G.A. A study of erosion phenomena: Part II. Wear 1963, 6, 169–190. [Google Scholar] [CrossRef]
  32. Gong, C.; Zhang, L.; Ma, C.; Tian, Z. Analysis brittleness index based on fracture energy ratio of rock mass. Ming Res. Dev. 2022, 42, 82–89. (In Chinese) [Google Scholar]
  33. Liu, W.; Meng, F.; Pu, H.; Wang, J.; Zhang, G.; Yi, Q. The seepage-creep numerical simulation model of coal measures sandstone based on particle discrete element. Geofluids 2022, 1, 5981768. [Google Scholar] [CrossRef]
  34. Iraji, S.; Soltanmohammadi, R.; Munoz, E.R.; Basso, M.; Vidal, A.C. Core scale investigation of fluid flow in the heterogeneous porous media based on X-ray computed tomography images: Upscaling and history matching approaches. Geoenergy Sci. Eng. 2023, 225, 211716. [Google Scholar] [CrossRef]
  35. Iraji, S.; De Almeida, T.R.; Munoz, E.R.; Basso, M.; Vidal, A.C. The impact of heterogeneity and pore network characteristics on single and multi-phase fluid propagation in complex porous media: An X-ray computed tomography study. Pet. Sci. 2024, 21, 1719–1738. [Google Scholar] [CrossRef]
  36. Soltanmohammadi, R.; Iraji, S.; de Almeida, T.R.; Basso, M.; Munoz, E.R.; Vidal, A.C. Investigation of pore geometry influence on fluid flow in heterogeneous porous media: A pore-scale study. Energy Geosci. 2024, 5, 100222. [Google Scholar] [CrossRef]
  37. Zhang, Y.; Shao, Z.; Wei, W.; Qiao, R. PFC simulation of crack evolution and energy conversion during basalt failure process. J. Geophys. Eng. 2019, 16, 639–651. [Google Scholar] [CrossRef]
  38. Wang, S.; Li, X.; Wang, D. Void fraction distribution in overburden disturbed by longwall mining of coal. Environ. Earth Sci. 2016, 75, 151. [Google Scholar] [CrossRef]
  39. Guo, Y.; Qin, Y.; Chen, P.; Xu, N. Simulation of the Compaction behavior and the water permeability evolution of broken rock masses of different shapes in a goaf. Water 2023, 15, 1190. [Google Scholar] [CrossRef]
  40. Fan, L.; Liu, S. A conceptual model to characterize and model compaction behavior and permeability evolution of broken rock mass in coal mine gobs. Int. J. Coal Geol. 2017, 172, 60–70. [Google Scholar] [CrossRef]
  41. Ma, W.; Wang, T. Experimental study of shear strength features of regenerated rock mass compacted and consolidated by broken soft rocks. KSCE J. Civ. Eng. 2019, 23, 1839–1848. [Google Scholar] [CrossRef]
  42. Zhao, Y.; Zhao, G.; Zhou, J.; Ma, J.; Cai, X. Failure mechanism analysis of rock in particle discrete element method simulation based on moment tensors. Comput. Geotech. 2021, 136, 104215. [Google Scholar] [CrossRef]
  43. Petružálek, M.; Jechumtálová, Z.; Šílený, J.; Kolář, P.; Svitek, T.; Lokajíček, T.; Turková, I.; Kotrlý, M.; Onysko, R. Application of the shear-tensile source model to acoustic emissions in Westerly granite. Int. J. Rock Mech. Min. Sci. 2020, 128, 104246. [Google Scholar] [CrossRef]
  44. Nunziante, L.; Gesualdo, A.; Minutolo, V. On the local collapse in soft rock bank cavities. J. Geotech. Geoenviron. Eng. ASCE 2001, 127, 1037–1042. [Google Scholar]
  45. Nunziante, L.; Gesualdo, A.; Minutolo, V. A kind of failure in Mohr-Coulomb soil cavities. Can. Geotech. J. 2001, 38, 1314–1320. [Google Scholar]
  46. Xunjian, H.U.; Kang, B.I.; Jian, L.I.; Ming, C.H.; Yue, C.E.; Zhenping, L.I. Particle flow simulation of the influence of granite crystal size distribution on acoustic emission characteristics. J. China Coal Soc. 2021, 46, 721–730. (In Chinese) [Google Scholar]
  47. Yan, Z.; Dai, F.; Liu, Y.; Feng, P. Experimental and numerical investigation on the mechanical properties and progressive failure mechanism of intermittent multi-jointed rock models under uniaxial compression. Arab. J. Geosci. 2019, 12, 681. [Google Scholar] [CrossRef]
  48. Zhang, C.; Jia, S.; Bai, Q.; Zhang, H.; Chen, Y.; Jiao, Y. CFD-DEM coupled simulation of broken rock mass movement during water seepage in an underground goaf reservoir. Mine Water Environ. 2021, 40, 1048–1060. [Google Scholar] [CrossRef]
Figure 1. Schematic diagram of the working principle of the goaf reservoir in the abandoned mine.
Applsci 14 06764 g001
Figure 2. Bond radius multiplier changing chart. (a) Bond radius multiplier changing with different angles; (b) Bond radius multiplier changing with different particle velocities; (c) Bond radius multiplier changing with different particle volumes.
Applsci 14 06764 g002
Figure 3. Schematic diagram for calculating the impact ranges of impact effects on rock blocks. (a) Distribution diagram of fractured rock mass in goaf; (b) Schematic diagram of the impact of rock particles on the broken rock mass in goaf; (c) Simplified diagram of the force on the rock block affected by impact erosion.
Applsci 14 06764 g003
Figure 4. Flow chart of the erosion influence numerical simulation method.
Applsci 14 06764 g004
Figure 5. (ad) Process of establishing the broken rock mass specimen by the CT scan method [26].
Applsci 14 06764 g005
Figure 6. Particle size grading schemes of the broken rock samples [13].
Applsci 14 06764 g006
Figure 7. Loading method of the broken rock numerical simulation.
Applsci 14 06764 g007
Figure 8. The stress–strain curve of broken rock mass under laterally confined compression.
Applsci 14 06764 g008
Figure 9. The evolution of the AE event increment and breakage rate. (a) AE event increment and breakage rate with size grading G1; (b) AE event increment and breakage rate with size grading G2; (c) AE event increment and breakage rate with size grading G3; (d) AE event increment and breakage rate with size grading G4; (e) AE event increment and breakage rate with size grading G5.
Applsci 14 06764 g009aApplsci 14 06764 g009b
Figure 10. Relationship between breakage rate and strain of broken rock mass with different particle size grades.
Applsci 14 06764 g010
Figure 11. Fracture pattern diagram of broken rock mass.
Applsci 14 06764 g011
Figure 12. Space distribution of porosity in broken rock mass during the lateral confinement compression process and water immersion. (a) Porosity of broken rock mass with size grading G1; (b) Porosity of broken rock mass with size grading G2; (c) Porosity of broken rock mass with size grading G3; (d) Porosity of broken rock mass with size grading G4; (e) Porosity of broken rock mass with size grading G5.
Applsci 14 06764 g012
Figure 13. Evolution curve of average porosity of broken rock mass under compressive load and water immersion.
Applsci 14 06764 g013
Table 1. Calibrated mesoscopic parameters of broken rock mass.
Mesoscopic ParametersParameter MeaningParameter Value
ρpParticle density2700 (kg/m3)
deform_emodLinear contact modulus5.3 (GPa)
pb_deform_emodEffective modulus of parallel bond49.7 (GPa)
pb_tenTangential strength43 (MPa)
pb_cohNormal strength52 (MPa)
kratioStiffness ratio1.2
Disclaimer/Publisher’s Note: The statements, opinions and data contained in all publications are solely those of the individual author(s) and contributor(s) and not of MDPI and/or the editor(s). MDPI and/or the editor(s) disclaim responsibility for any injury to people or property resulting from any ideas, methods, instructions or products referred to in the content.

