Article

A Feature Selection-Incorporated Simulation Study to Reveal the Effect of Calcium Ions on Cardiac Repolarization Alternans during Myocardial Ischemia

1
Department of Biomedical Engineering, School of Information Science and Technology, Fudan University, Shanghai 200438, China
2
Academy for Engineering and Technology, Fudan University, Shanghai 200433, China
3
Department of Electronic Engineering, School of Information Science and Technology, Fudan University, Shanghai 200438, China
4
Yiwu Research Institute, Fudan University, Yiwu 322000, China
5
The Key Laboratory of Medical Imaging Computing and Computer Assisted Intervention (MICCAI) of Shanghai, Shanghai 200032, China
6
Research Center of Assistive Devices, Shanghai 200093, China
*
Authors to whom correspondence should be addressed.
These authors contributed equally to this work.
Appl. Sci. 2024, 14(15), 6789; https://doi.org/10.3390/app14156789 (registering DOI)
Submission received: 23 June 2024 / Revised: 28 July 2024 / Accepted: 29 July 2024 / Published: 3 August 2024

Abstract

:
(1) Background: The main factors and their interrelationships contributing to cardiac repolarization alternans (CRA) remain unclear. This study aimed to elucidate the calcium (Ca2+)-related mechanisms underlying myocardial ischemia (MI)-induced CRA. (2) Materials and Methods: CRA was induced using S1 stimuli for pacing in an in silico ventricular model with MI. The standard deviations of nine Ca2+-related subcellular parameters among heartbeats from 100 respective nodes with and without alternans were chosen as features, including the maximum systole and end-diastole and corresponding differences in the Ca2+ concentration in the intracellular region([Ca2+]i) and junctional sarcoplasmic reticulum ([Ca2+]jsr), as well as the maximum opening of the L-type Ca2+ current (ICaL) voltage-dependent activation gate (d-gate), maximum closing of the inactivation gate (ff-gate), and the gated channel opening time (GCOT). Feature selection was applied to determine the importance of these features. (3) Results: The major parameters affecting CRA were the differences in [Ca2+]i at end-diastole, followed by the extent of d-gate activation and GCOT among beats. (4) Conclusions: MI-induced CRA is primarily characterized by functional changes in Ca2+ re-uptake, leading to alternans of [Ca2+]i and subsequent alternans of ICaL-dependent properties. The combination of computational simulation and machine learning shows promise in researching the underlying mechanisms of cardiac electrophysiology.

1. Introduction

Ischemic heart disease (IHD) is the most common cardiovascular illness, with an increasing prevalence worldwide [1]. It is estimated to affect more than 1.85% of the global population by 2030. The pathophysiological process of IHD refers to myocardial ischemia (MI), which generally occurs when blood flow through a coronary artery is physically obstructed [2]. Following this closure, the electrical impedance of myocardial tissue typically increases, resulting in a reduction in conduction velocity and changes in the action potential duration (APD) [3]. The increased electrophysiological heterogeneity between ischemic and normal myocardial regions establishes an arrhythmogenic substrate. Therefore, MI may lead to severe cardiac arrhythmias and even sudden cardiac death [4].
Cardiac repolarization alternans (CRA) triggered by MI has garnered significant clinical attention as it is considered a risk indicator and key pathophysiological mechanism underlying arrhythmias and sudden cardiac death [5]. CRA is characterized by beat-to-beat variations in the APD, AP amplitude, and intracellular calcium transient in cardiomyocytes [6]. This alternation can be observed at the cellular level and can manifest on the surface electrocardiogram (ECG) as T-wave alternans (TWA), which is a crucial biomarker of the severity of IHD [7]. Changes in multiple transmembrane ionic currents are fundamental to CRA formation [8]. Among these, the L-type calcium ion current (ICaL) is the primary inward ion flow during the repolarization phase and significantly influences the plateau phase of AP of cardiomyocytes. Pathophysiological conditions such as hyperkalemia, acidosis, and hypoxia resulting from MI can promote alternans by affecting Ca2+ currents [9]. Under MI, variations in APD and the Ca transient usually occur together [10] due to the bidirectional coupling between the membrane voltage and intracellular Ca. APD directly influences the Ca transient amplitude, while the Ca transient amplitude, in turn, directly affects APD via Ca-sensitive currents such as ICaL and Na–Ca exchange (NCX), acting as a critical component to maintaining calcium homeostasis. The inhibition of NCX may help attenuate CRA [11]. The bidirectional coupling, whether voltage-driven or calcium-driven, is inherently unstable, potentially leading to complex repolarization processes and calcium cycling kinetics [6].
An understanding of CRA is essential for the early detection and prevention of life-threatening cardiac events, thus benefiting targeted treatment [6]. To date, the underlying mechanisms of CRA continue to be studied, highlighting the roles of sarcoplasmic reticulum (SR) Ca2⁺ content, ryanodine receptor (RyR) function, and sarco-endoplasmic reticulum Ca2⁺-ATPase (SERCA) activity. Díaz et al. posited that alternans primarily stems from fluctuations in the SR Ca2⁺ content [12]. Their findings indicated a correlation between alternans in the amplitude of systolic Ca2⁺ transients and alternating SR Ca2⁺ content. This alternation results from a steep dependence of Ca2⁺ release on SR Ca2⁺ content, facilitated by Ca2⁺-induced Ca2⁺ release triggered by L-type Ca2⁺ channels. The larger transients arise from the propagation of Ca2⁺ waves, which are steep functions of SR Ca2⁺ content. This steep relationship suggests that changes in SR Ca²⁺ content are sufficient to produce alternans, where larger Ca2⁺ transients lead to significant Ca2⁺ efflux, lowering SR Ca2⁺ content and resulting in a smaller subsequent Ca2⁺ transient. The study by Picht et al. challenges the notion that diastolic SR Ca2⁺ content fluctuations are essential for alternans, suggesting that the availability and recovery of RyRs are more critical [13]. Their study showed that alternans could occur without significant diastolic SR Ca2⁺ content fluctuations. The SR Ca2⁺ release rate was higher during large depletions than during small ones, indicating that RyR refractoriness and recovery from inactivation are pivotal in the genesis of Ca2⁺ alternans. Wang et al. utilized a novel imaging approach to monitor intra-SR free Ca2⁺ and transmembrane potential in intact hearts [14]. They found that RyR refractoriness is the first mechanism affected as heart rate increases, leading to the initial development of SR Ca2⁺ release alternans. At higher heart rates, SR Ca2⁺ load also begins to alternate, amplifying the magnitude of SR Ca2⁺ release alternans and repolarization alternans. During ventricular fibrillation, a high SR Ca2⁺ load coincides with nearly continuous RyR refractoriness, resulting in minimal SR Ca2⁺ release despite the elevated load. The study by Wang et al. examined the effects of SERCA inhibition on CRA [15]. They found that inhibiting SERCA with cyclopiazonic acid slowed SR Ca2⁺ re-uptake and increased the magnitude of SR Ca2⁺ and APD alternans. SERCA inhibition promoted the emergence of spatially discordant alternans, with SR Ca2⁺ release alternans occurring before diastolic SR Ca2⁺ load alternans. This suggests that the relative refractoriness of RyR Ca2⁺ release is a primary factor governing the onset of intracellular Ca2⁺ alternans.
The role of Ca2+ is considered substantial in the development of CRA; however, studies on the mechanisms of CRA have not been able to identify the major factors for CRA generation or conduct a detailed analysis of the interrelationships among them. The objective of this manuscript was to develop a method to identify the main Ca2+-related factors leading to CRA. A whole-ventricular model with MI was constructed to induce CRA. After obtaining the Ca2+-related subcellular parameters with cellular transmembrane potential in cardiomyocytes with and without alternans, statistical tests and machine learning-based feature selection methods were integrated to investigate the main Ca2+-related factors in priority of importance that affect CRA, facilitating a deeper understanding of the electrical mechanism of tachycardia induced by MI and providing new perspectives for research methods in cardiac electrophysiology.

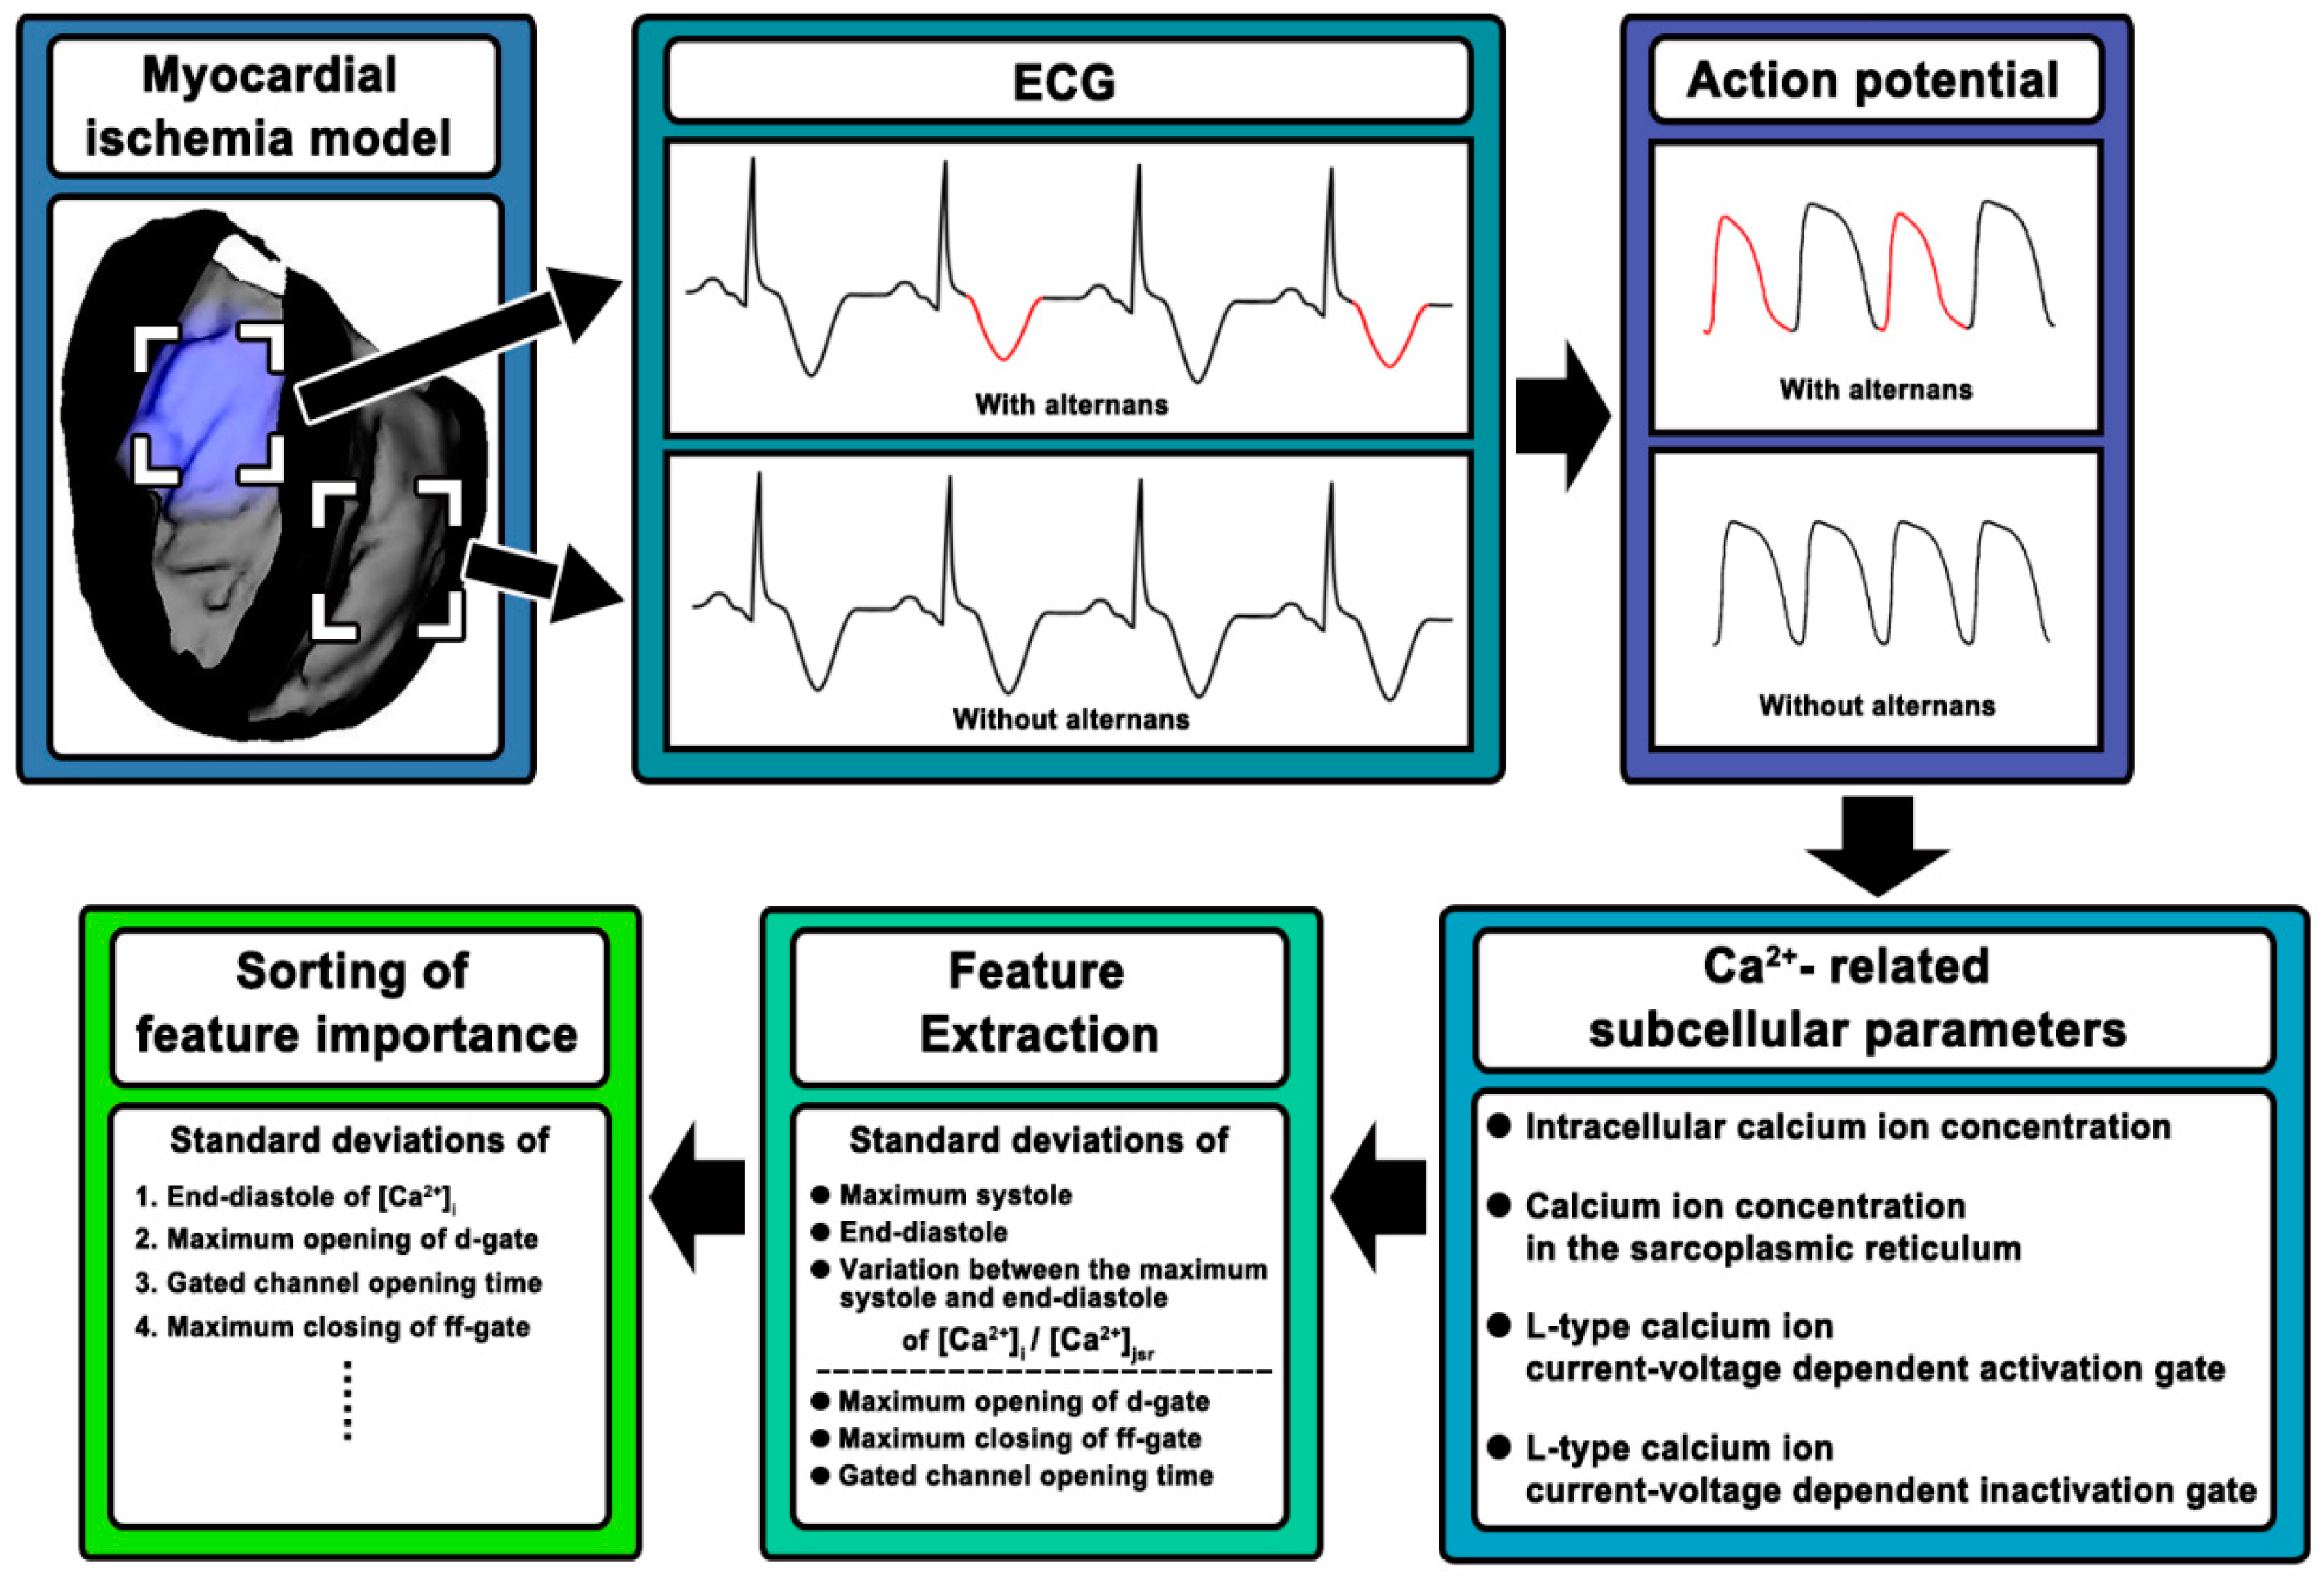
2. Materials and Methods

The overall research methodology is outlined in the flow diagram shown in Figure 1. The study began with the construction of a cardiac electrophysiological model of MI. The validity of the method was confirmed by comparing the local ECG from ischemic and non-ischemic regions with historical measurements. After obtaining and analyzing the APs and Ca2+-related subcellular parameters with and without alternans, feature extraction and importance sorting were performed. This approach allowed for the identification and prioritization of key factors influencing CRA.

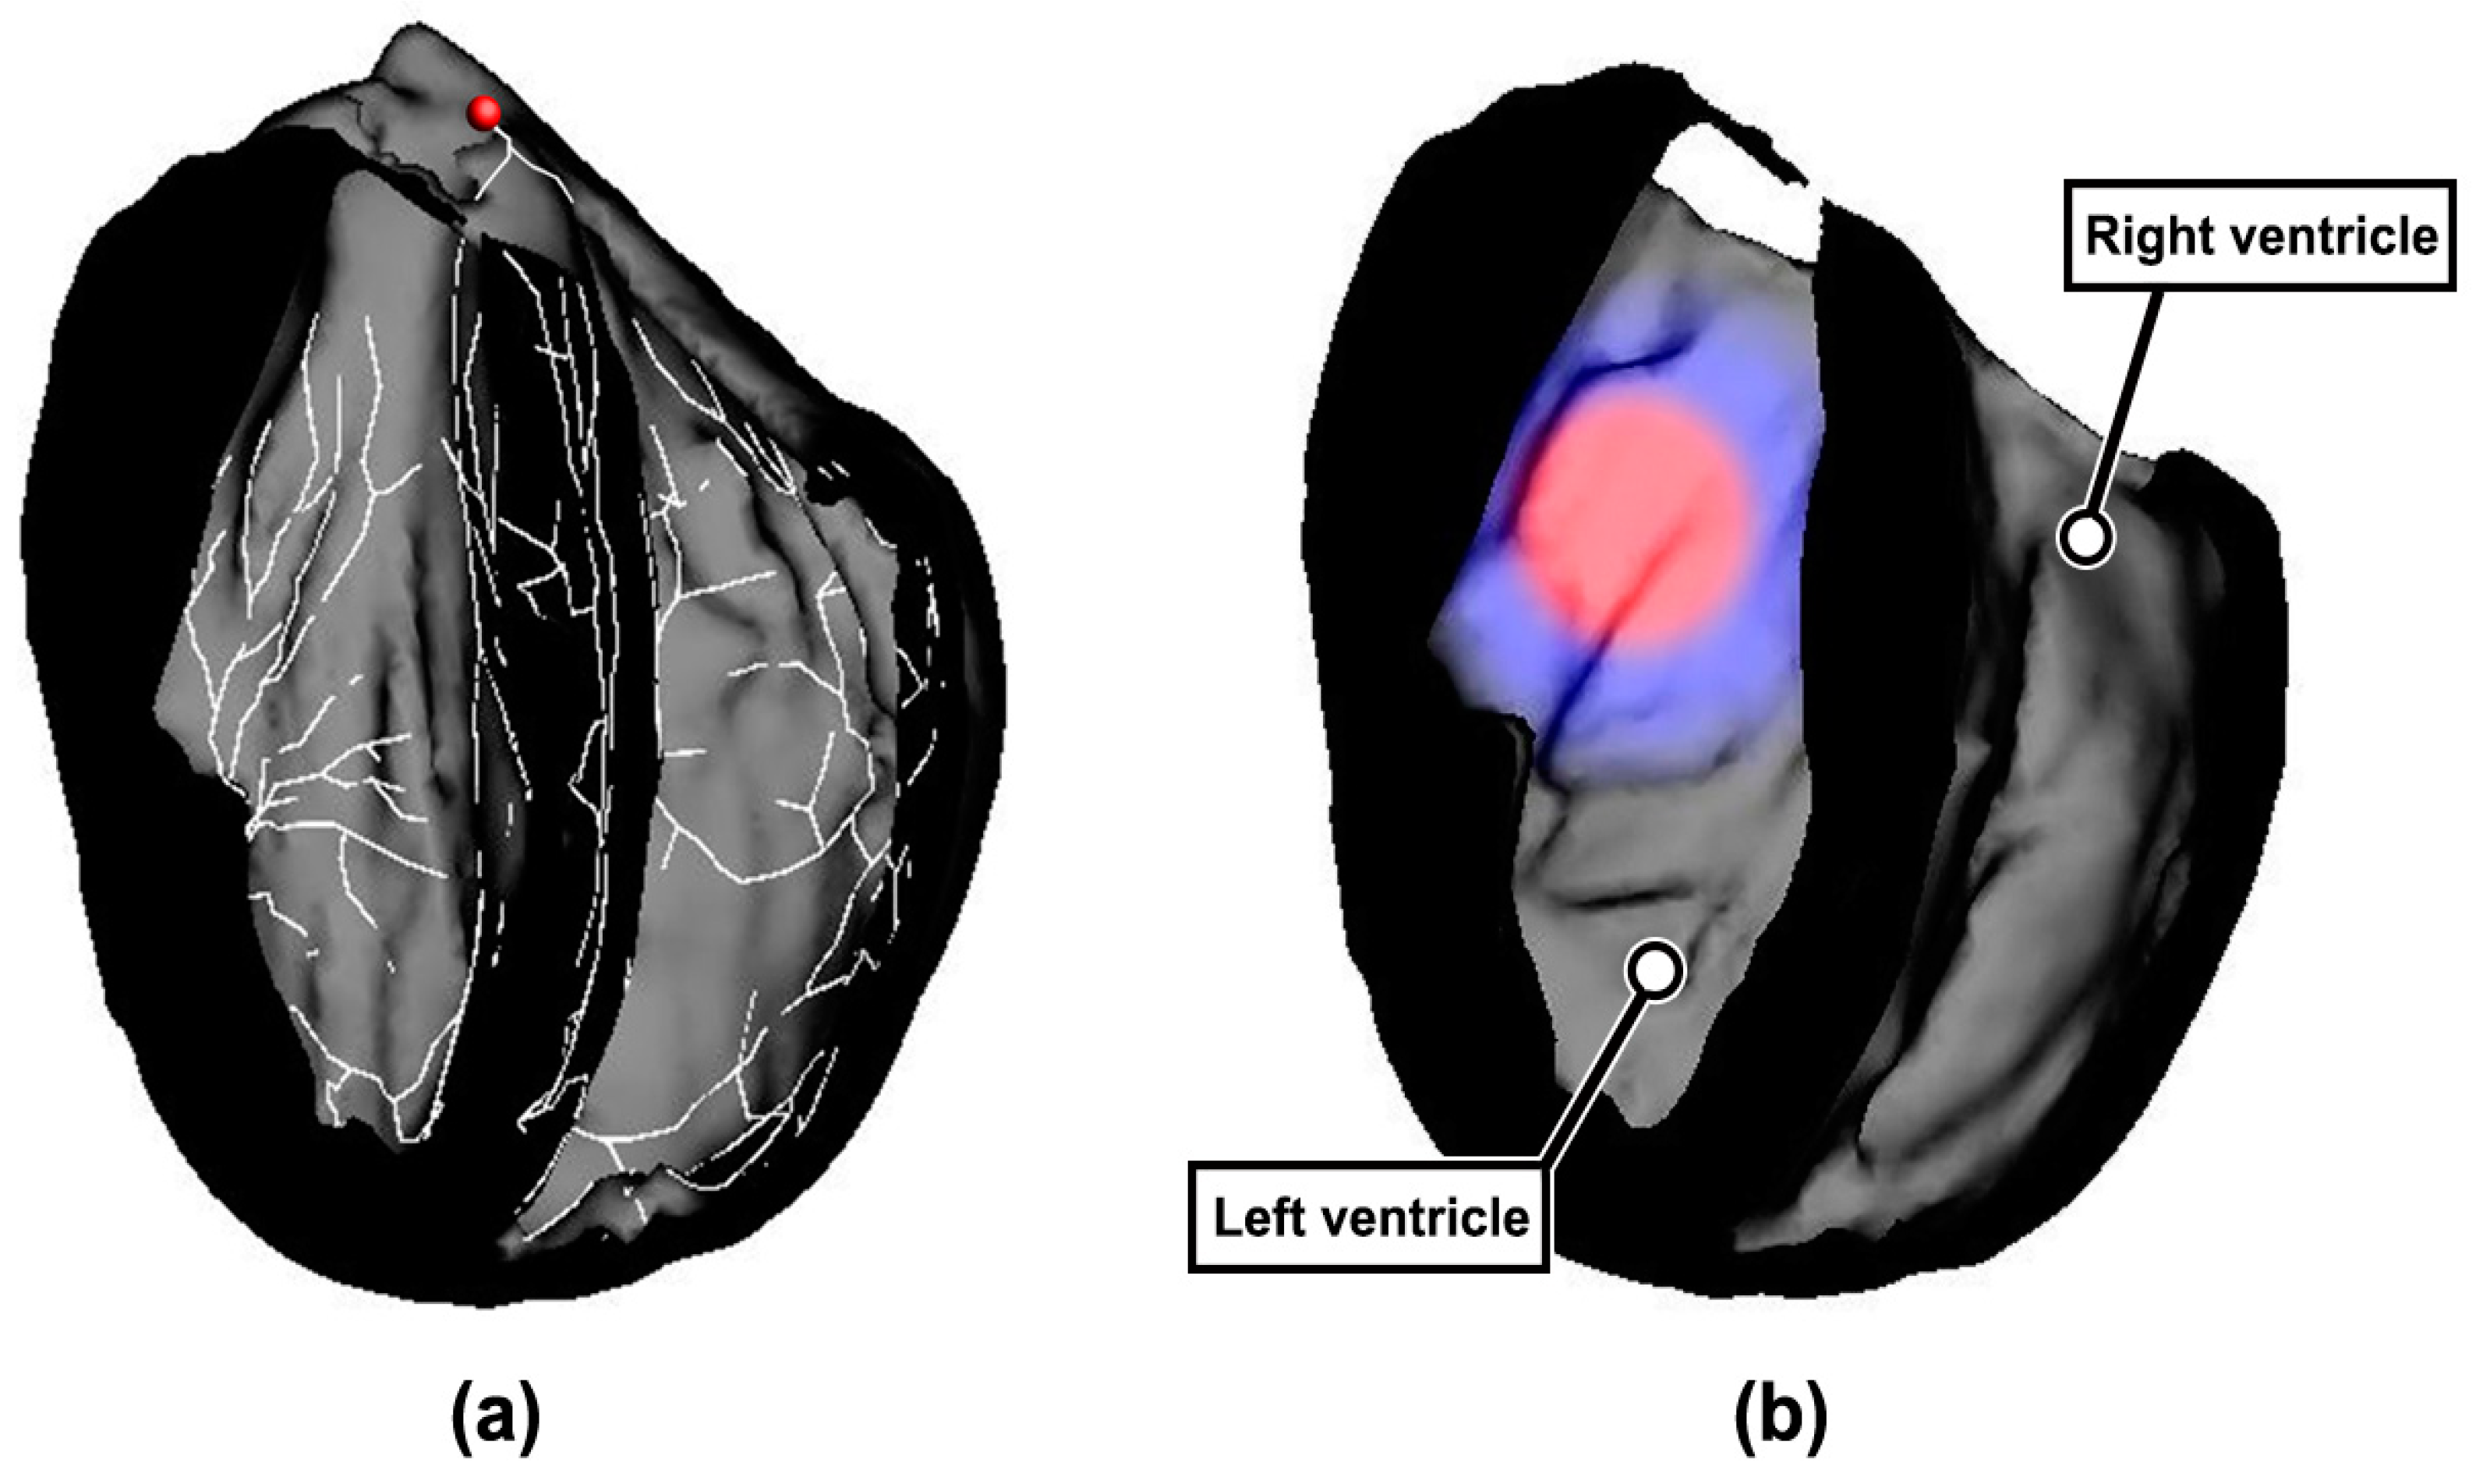
2.1. Construction of Rabbit Ventricular Model with MI

Considering the relatively high computational cost of a precise human ventricular model and the similarity in cardiac electrophysiology between rabbit and human hearts, as noted in previous studies [16,17], we utilized a geometric model of rabbit ventricles as described in [18,19]. This model, developed by the University of Oxford, was employed to conduct MI-related cardiac electrophysiological simulations. Briefly, the model was constructed from high-resolution magnetic resonance imaging of a rabbit’s ventricle and meshed using finite element analysis, consisting of 431,990 elements and 82,619 nodes. The myocardial fiber structure was assembled, and the His–Purkinje system was manually generated using the fractal tree algorithm (Figure 2a) [20]. The ORd model was used to simulate the electrophysiological properties of the ventricular geometry [21]. The electrophysiological characteristics of the endocardium, mid-myocardium, and epicardium, each with equal thickness, were modified based on previous research [22] to achieve heterogeneity in cardiomyocyte electrophysiological activities. This was accomplished by decreasing the conductivities of the transit outward potassium current (Ito,s) and the slow delayed rectifier potassium current (IKs) to 25% of normal values for the endocardium and mid-myocardium, respectively, while the parameters for the epicardium remained unchanged [22]. The cardiac conduction of the His–Purkinje system in the ventricular model functioned via the DiFrancesco–Noble model.
MI caused by left anterior descending branch occlusion was considered in this study, as shown in Figure 2b. The ventricular model, specifically the cardiac tissue, was segmented into three parts, namely the Ischemic Central Zone (ICZ), Border Zone (BZ), and Normal Zone (NZ). The MI domain was represented by a sphere encompassing the ICZ and BZ, with radii of 6000 μm and 3000 μm for the MI domain and the ICZ, respectively. The cardiac conduction in the ventricular model was described by the bidomain equation [23]. For the NZ, the intracellular conductivity was set at 0.174 S/m in the longitudinal direction and 0.019 S/m in the transverse direction, with extracellular conductivities of 0.62 S/m and 0.24 S/m, respectively. For the ICZ, the cellular conductivities were reduced by 50% to simulate cellular uncoupling. Additionally, the fast sodium current, L-type calcium current, slowly activated delayed rectifier potassium current, and rapidly activated delayed rectifier potassium current were reduced by 62%, 69%, 80%, and 70%, respectively [24]. The extracellular potassium ion concentration was increased to 12 mM [25]. The ATP-sensitive potassium current was reduced by 20% [26]. These modifications collectively reproduce the effects of acidosis, hyperkalemia, and hypoxia under MI. The BZ consisted of twenty equidistant spherical shells, with the electrophysiological characteristics of each shell varying equivalently to simulate a gradient transition from the ICZ to the NZ.

2.2. Simulation Strategy

Simulations were conducted using the cardiac electrophysiology simulator CARPentry. CRA was incited through pacing, where a series of S1 stimuli was applied at the starting point of the His bundle. The stimulus cycle initially set at 600 ms progressively decreased in steps of 30 ms. The stimulus intensity was 50 μA/cm2 and the duration was 5 ms. TWA was observed when the stimulus cycle reached 330 ms. Subsequently, simulations were run for a total duration of 4600 ms, and the results were obtained after 10 stimuli (i.e., 3300 ms) to ensure the steady state of ventricular electrical activity. The correctness and accuracy of the constructed model were verified by comparing the virtual lead II ECG with historical measurements under different stimulus cycles. Figure 3 shows that no alternans of ECG waves occurred with a stimulus cycle of 600 ms; however, pronounced TWA was observed at 330 ms. This trend aligns with findings from several research studies [27], which indicate that the occurrence of TWA is proportional to the increasing heart rate, thereby validating the model used in this study. In both cases, the T-wave was inverted due to anterior wall ischemia induced by left anterior descending branch occlusion.

2.3. Ca2+-Related Subcellular Parameters

To explore Ca2+-related subcellular parameters that affect alternans, we focused on the condition with a stimulus cycle of 330 ms. We randomly selected 100 nodes with CRA from the ICZ and 100 nodes without CRA from the NZ in the left anterior descending branch occlusion model. Considering the major ion currents and gated channels involved in the calcium cycling of cardiomyocytes, as well as the capability of the currently applied simulation tool, we chose [Ca2+]i, the calcium ion concentration in the junctional sarcoplasmic reticulum ([Ca2+]jsr), the ICaL voltage-dependent activation gate (d-gate), and the fast inactivation gate (ff-gate) as subcellular parameters from all selected nodes. The d-gate and ff-gate function as opening and closing states over time with respect to the membrane potential, which can be described by:
d d d t = d V d τ d V
d f f d t = f f V f f τ f f V
where d and f f represent the probability of being open for the d-gate and ff-gate, respectively. d V and f f V represent activation and inactivation in the steady state. τ d V and τ f f V represent the activation and inactivation time constants, respectively.

2.4. Feature Extraction and Sorting

Given that CRA is characterized by heartbeats with varying degrees of fluctuation, we focused on the standard deviation (SD) (i.e., degree of change) of selected features among multiple beats. Based on the physiological significance of the aforementioned Ca2+-related subcellular parameters in Section 2.3, we extracted features as the SDs of the maximum systole (wave crest), end-diastole (wave trough), and the variation between the maximum systole and end-diastole (crest-trough) of [Ca2+]i and [Ca2+]jsr among all simulated beats under alternans and non-alternans. Moreover, the SDs of the maximum opening (wave crest) of the d-gate, the maximum closing (wave trough) of the ff-gate, and the gated channel opening time (GCOT) among all beats were also considered. Wave crests and troughs were identified by the ‘findpeaks’ function in MATLAB. All features underwent a homogeneity of variance test (Levene test) and a normality test (Shapiro–Wilk test), which can be expressed by Equations (3) and (4), respectively:
W L = ( N k ) ( k 1 ) i = 1 k N i ( Z i . ¯ Z . . ¯ ) 2 i = 1 k j = 1 N i ( Z i j Z i . ¯ ) 2
where N is the total number of features ( N = 18 in our research) under groups of alternans and non-alternans. k is the number of different groups ( k = 2) and N i is the number of features in different groups ( N i = 9 for each group). Z i j is a transform of the original data Y i j , which is the absolute value of the subtraction of Y i j from the mean of the i t h feature Y i . ¯ . Z i . ¯ is the group mean of Z i j and Z . . ¯ is the mean of all data in Z i j .
W s = ( i = 1 m a i x i ) 2 i = 1 m ( x i x ¯ ) 2
where a is the tabulated coefficient, m is the number of features, x i is the dataset of feature values in increasing order, and x ¯ is the mean of the dataset.
All features were found to be non-normally distributed. Afterward, the Wilcoxon rank-sum test was performed to determine if each feature with and without alternans is of statistical significance. The statistic of such a test is given by the smaller of the two following equations:
U 1 = N A N B + N A ( N A + 1 ) 2 R A
U 2 = N A N B + N B ( N B + 1 ) 2 R B
where A and B denote the group of feature values under alternans and non-alternans, respectively. N i ( i = A , B ) is the number of features in dataset A or B , and R i (i = A , B ) is the rank sum of elements in the two groups. Then, the z -value was calculated by:
z = min U 1 , U 2 ( N A N B ) / 2 N A N B ( N A + N B + 1 ) / ( N A + N B )
In the current case, the p-values corresponding to the z -values for all features were less than 0.001, indicating that all the extracted features were statistically significant. As the filter method balances computational cost, classification speed, and data overfitting, seven algorithms belonging to this method, including the variance threshold, the chi-square test, the correlation-based feature selector (CFS) [28], mutual information-based (MIB) importance interpretation, the Fisher score [29], relief [30], and Minimum-Redundancy–Maximum-Relevance (MRMR) [31], were incorporated to implement feature selection. The first three algorithms were used to discriminate whether a feature mainly influenced CRA generation, assigning weights of 1 and 3 to features within and without the class, respectively. The explicit sorting of features was accomplished using the latter four algorithms, which assigned preset weights from 1 to 9 to the nine selected features based on their importance. No prioritization of algorithm use was employed during the discrimination and sorting stages. Features with lower scores implied higher importance. The expression and function of each algorithm are described in Table A1 (refer to Appendix A).

3. Results

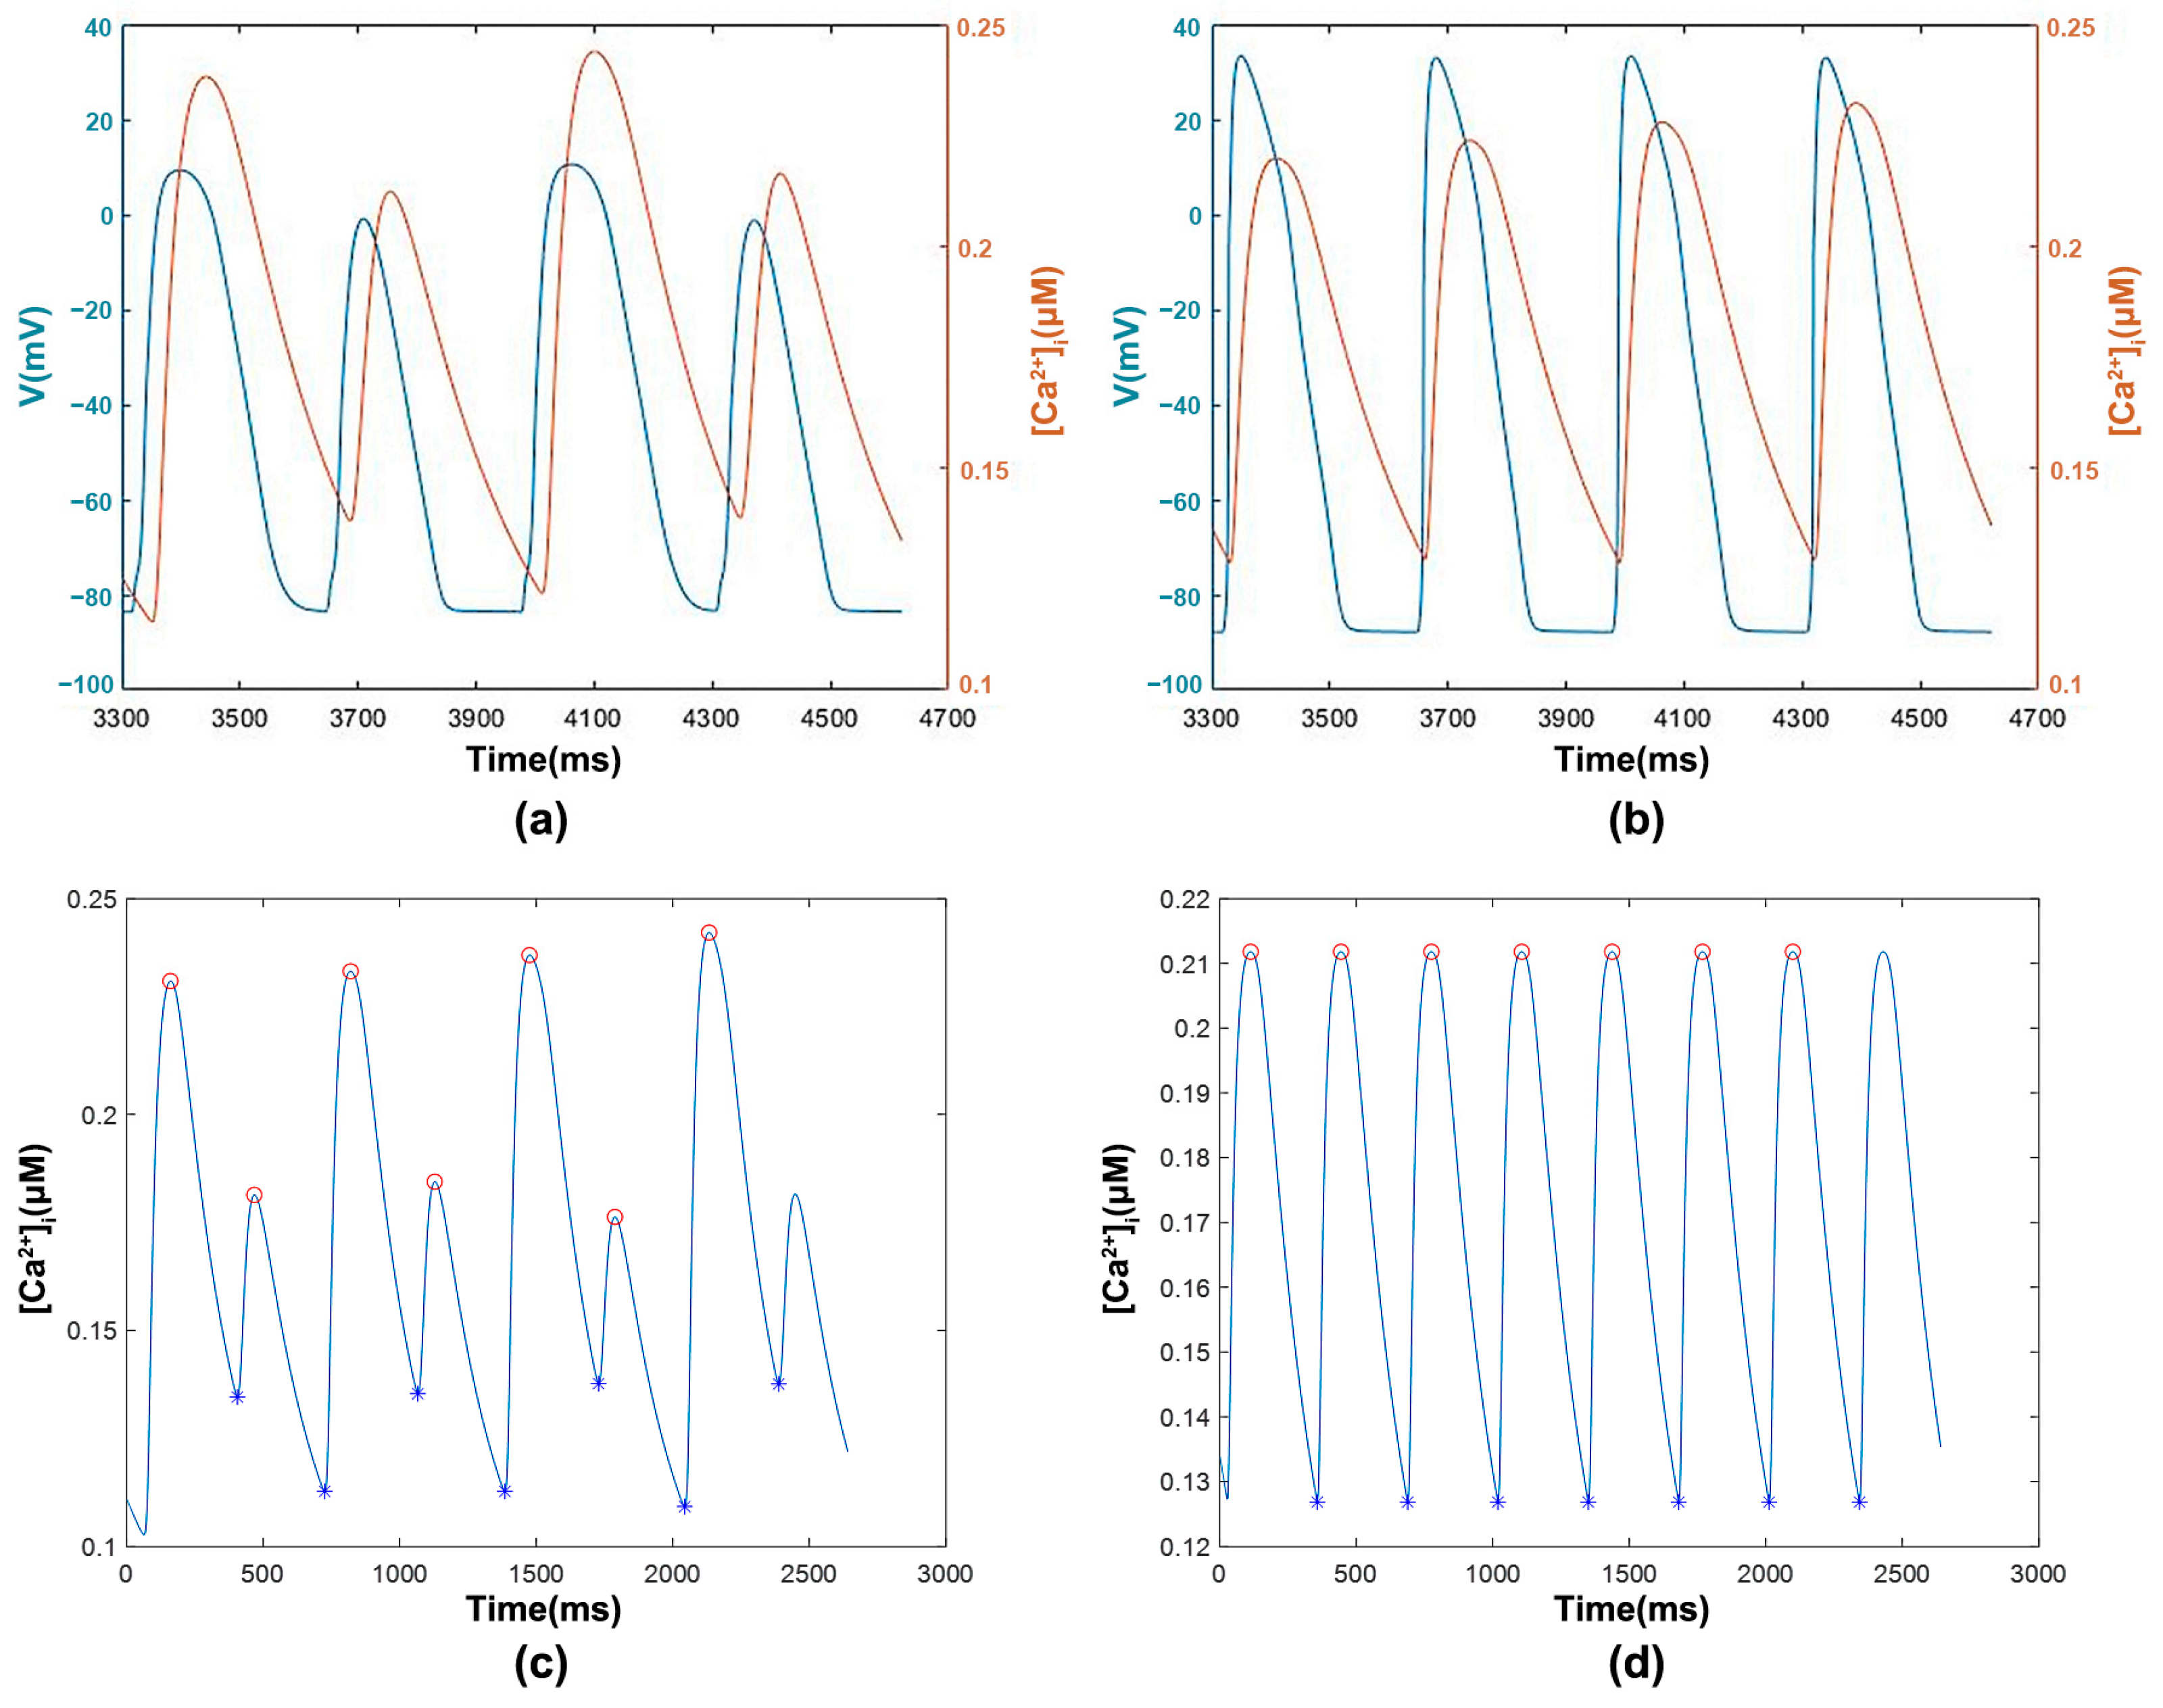
3.1. Feature Extraction

3.1.1. [Ca2+]i with Transmembrane Potential and Features

Figure 4a,b depicts the relationships between [Ca2+]i (brown trace) and the transmembrane potential (teal trace) in a randomly selected cardiomyocyte from 100 cases with (from ICZ) and without CRA (from NZ), respectively. In Figure 4a, the transmembrane potentials of cardiomyocytes with repolarization alternans show different traces under odd and even beats, exhibiting a pattern of large (L)–small (S)–L–S in amplitude and duration. The amplitude of [Ca2+]i mirrors this trend in the AP, but the diastolic [Ca2+]i during each beat is reversed (i.e., S-L-S-L), indicating that a smaller diastolic [Ca2+]i corresponds to a larger AP amplitude and vice versa. In contrast, Figure 4b shows no significant difference in the waveforms under non-alternans of [Ca2+]i. The changes in [Ca2+]i under alternans and non-alternans over a longer duration are demonstrated in Figure 4c,d, in which the elements of the selected feature (red circles and blue asterisks) are pointed out, standing for the maximum systole and end-diastole of [Ca2+]i, respectively. The difference between each pair of elements in one beat stands for the degree of decrease in [Ca2+]i due to calcium re-uptake.

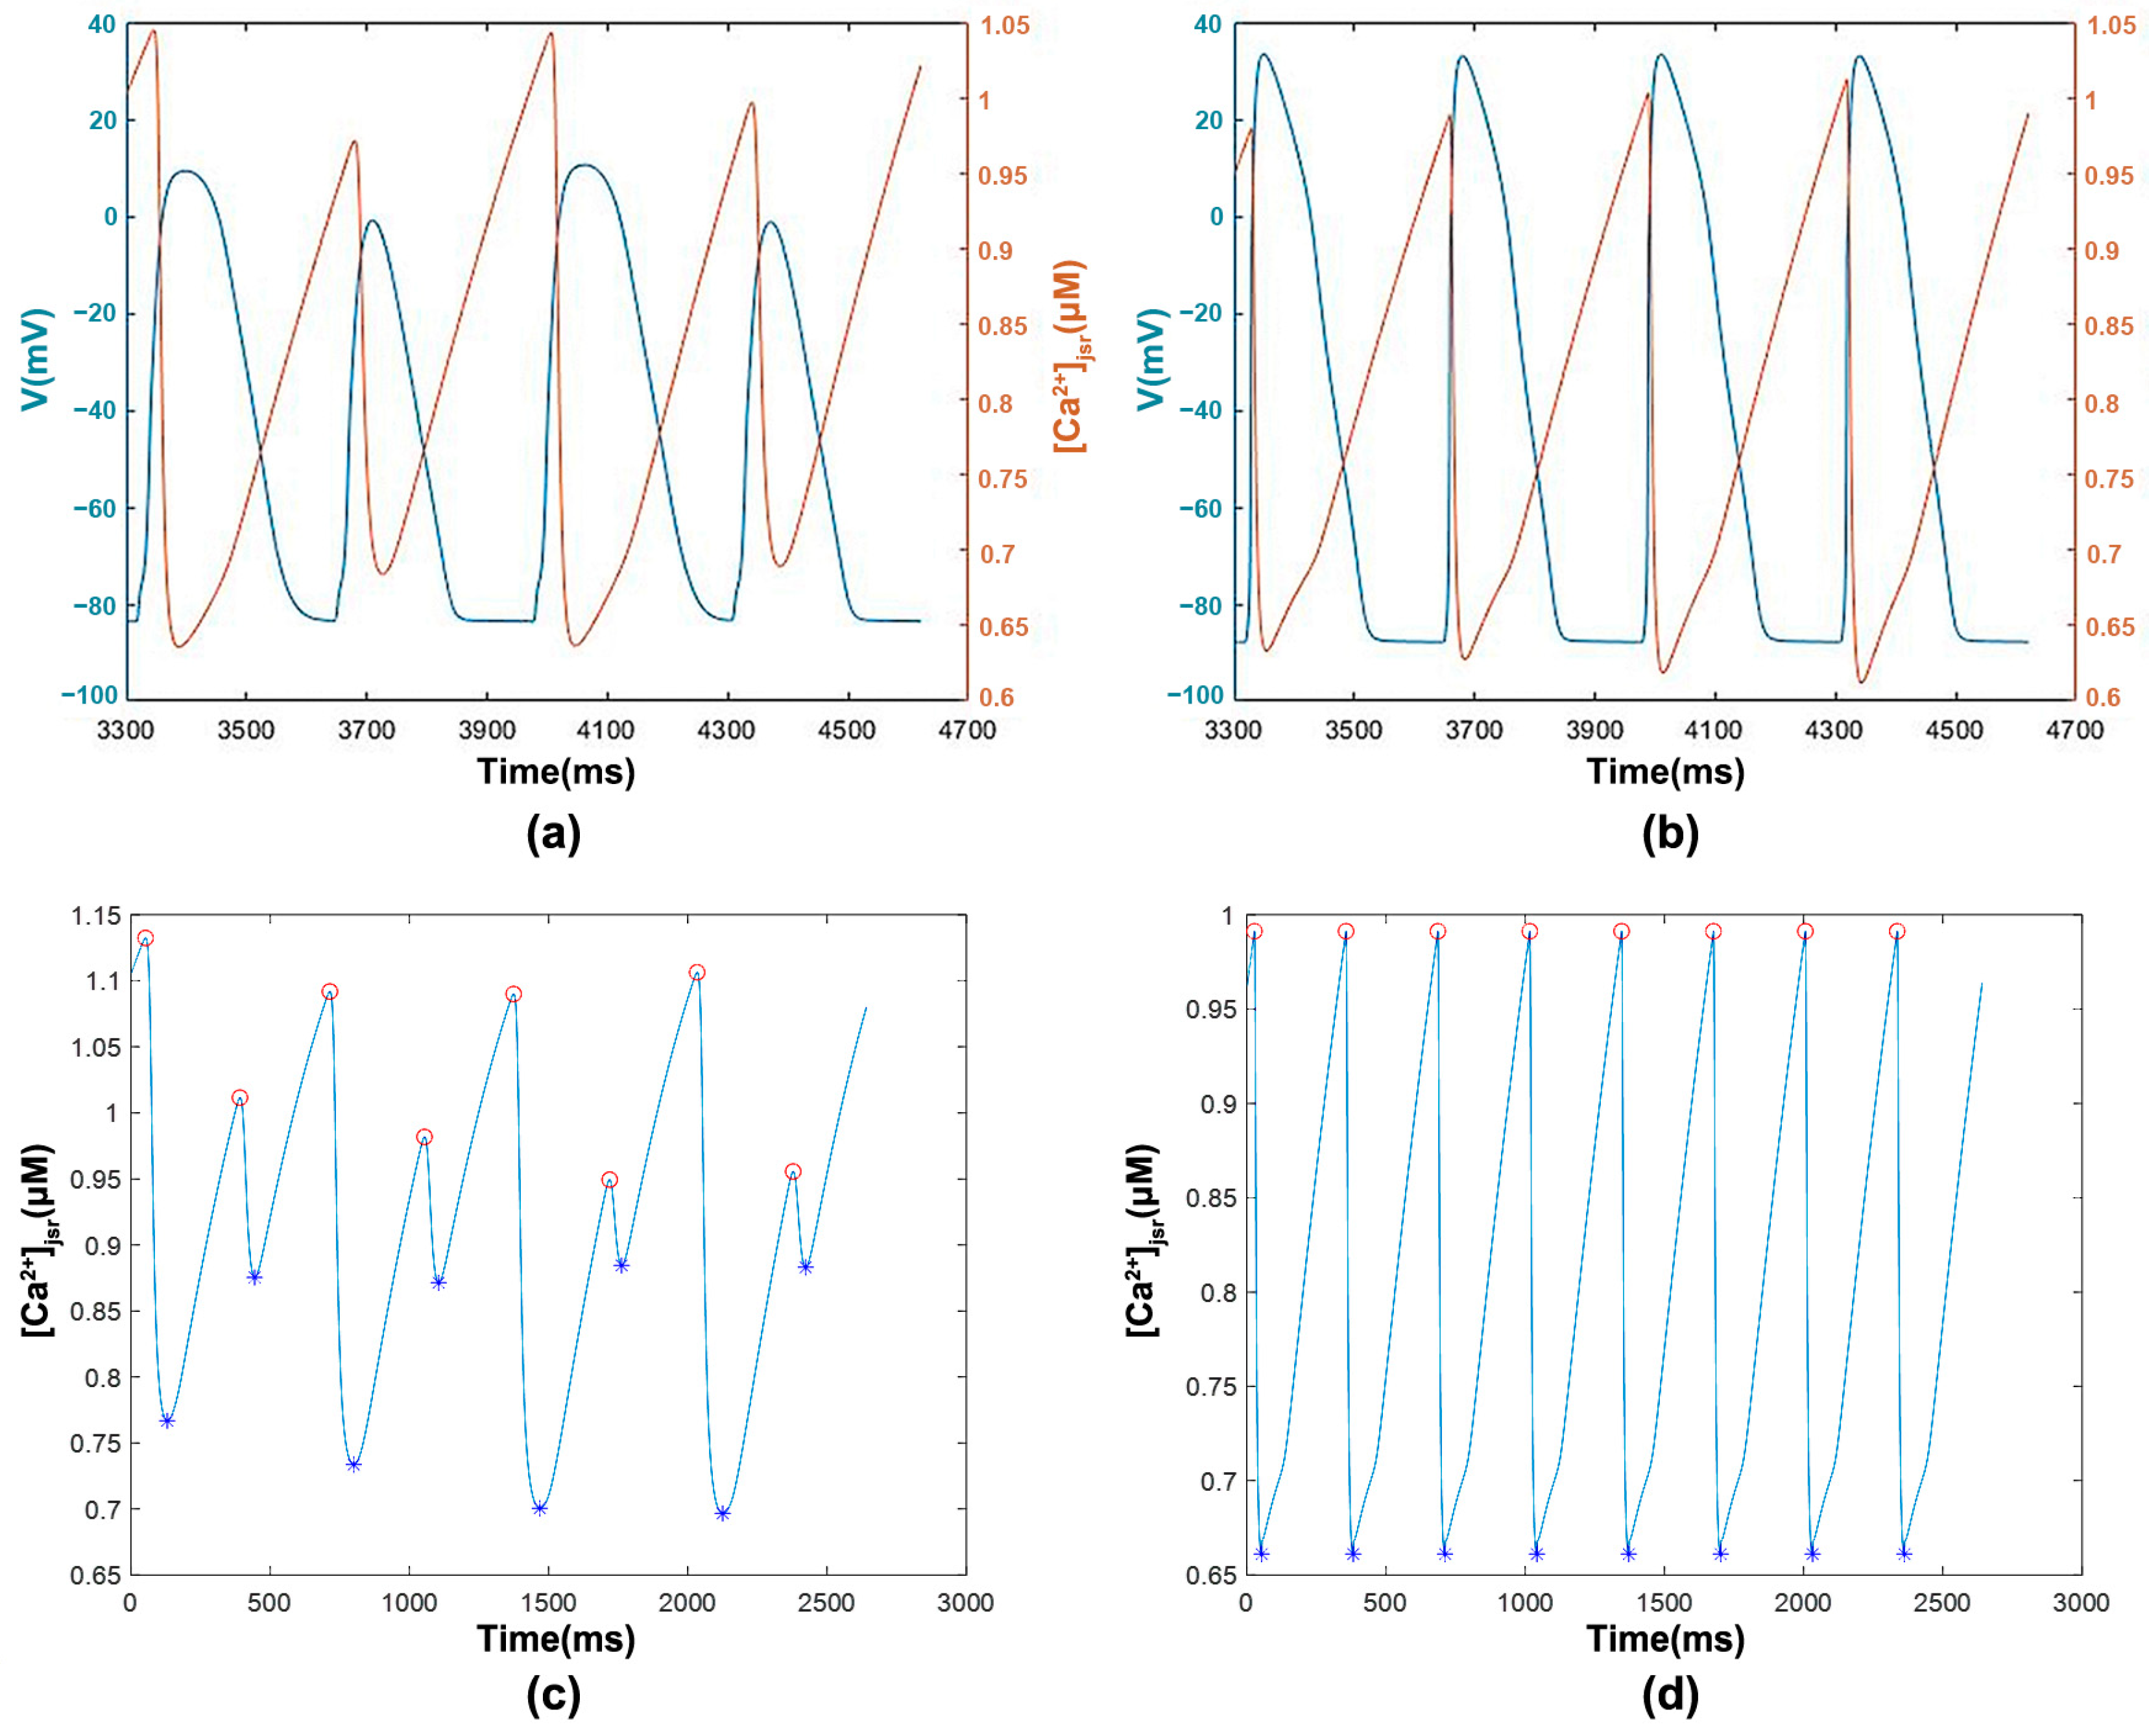
3.1.2. [Ca2+]jsr with Transmembrane Potential and Features

Figure 5a,b illustrates the relationships between [Ca2+]jsr (brown trace) and transmembrane potential (teal trace) in a randomly selected cardiomyocyte from 100 cases with (from ICZ) and without CRA (from NZ), respectively. In Figure 5a, [Ca2+]jsr, the AP amplitude, and duration exhibit an L–S–L–S pattern under alternans. For cardiomyocytes without alternans (Figure 5b), the patterns of [Ca2+]jsr variation and AP waves are similar and more consistent. The highest [Ca2+]jsr levels are observed when no AP occurs in both cases. The elements for feature extraction (red circles and blue asterisks in Figure 5c,d) represent the maximum systole and end-diastole of [Ca2+]jsr among all simulated beats. These elements indicate the variation of [Ca2+]jsr for each beat, reflecting the different amounts of Ca2+ released from the SR located in the cardiomyocyte junctions.

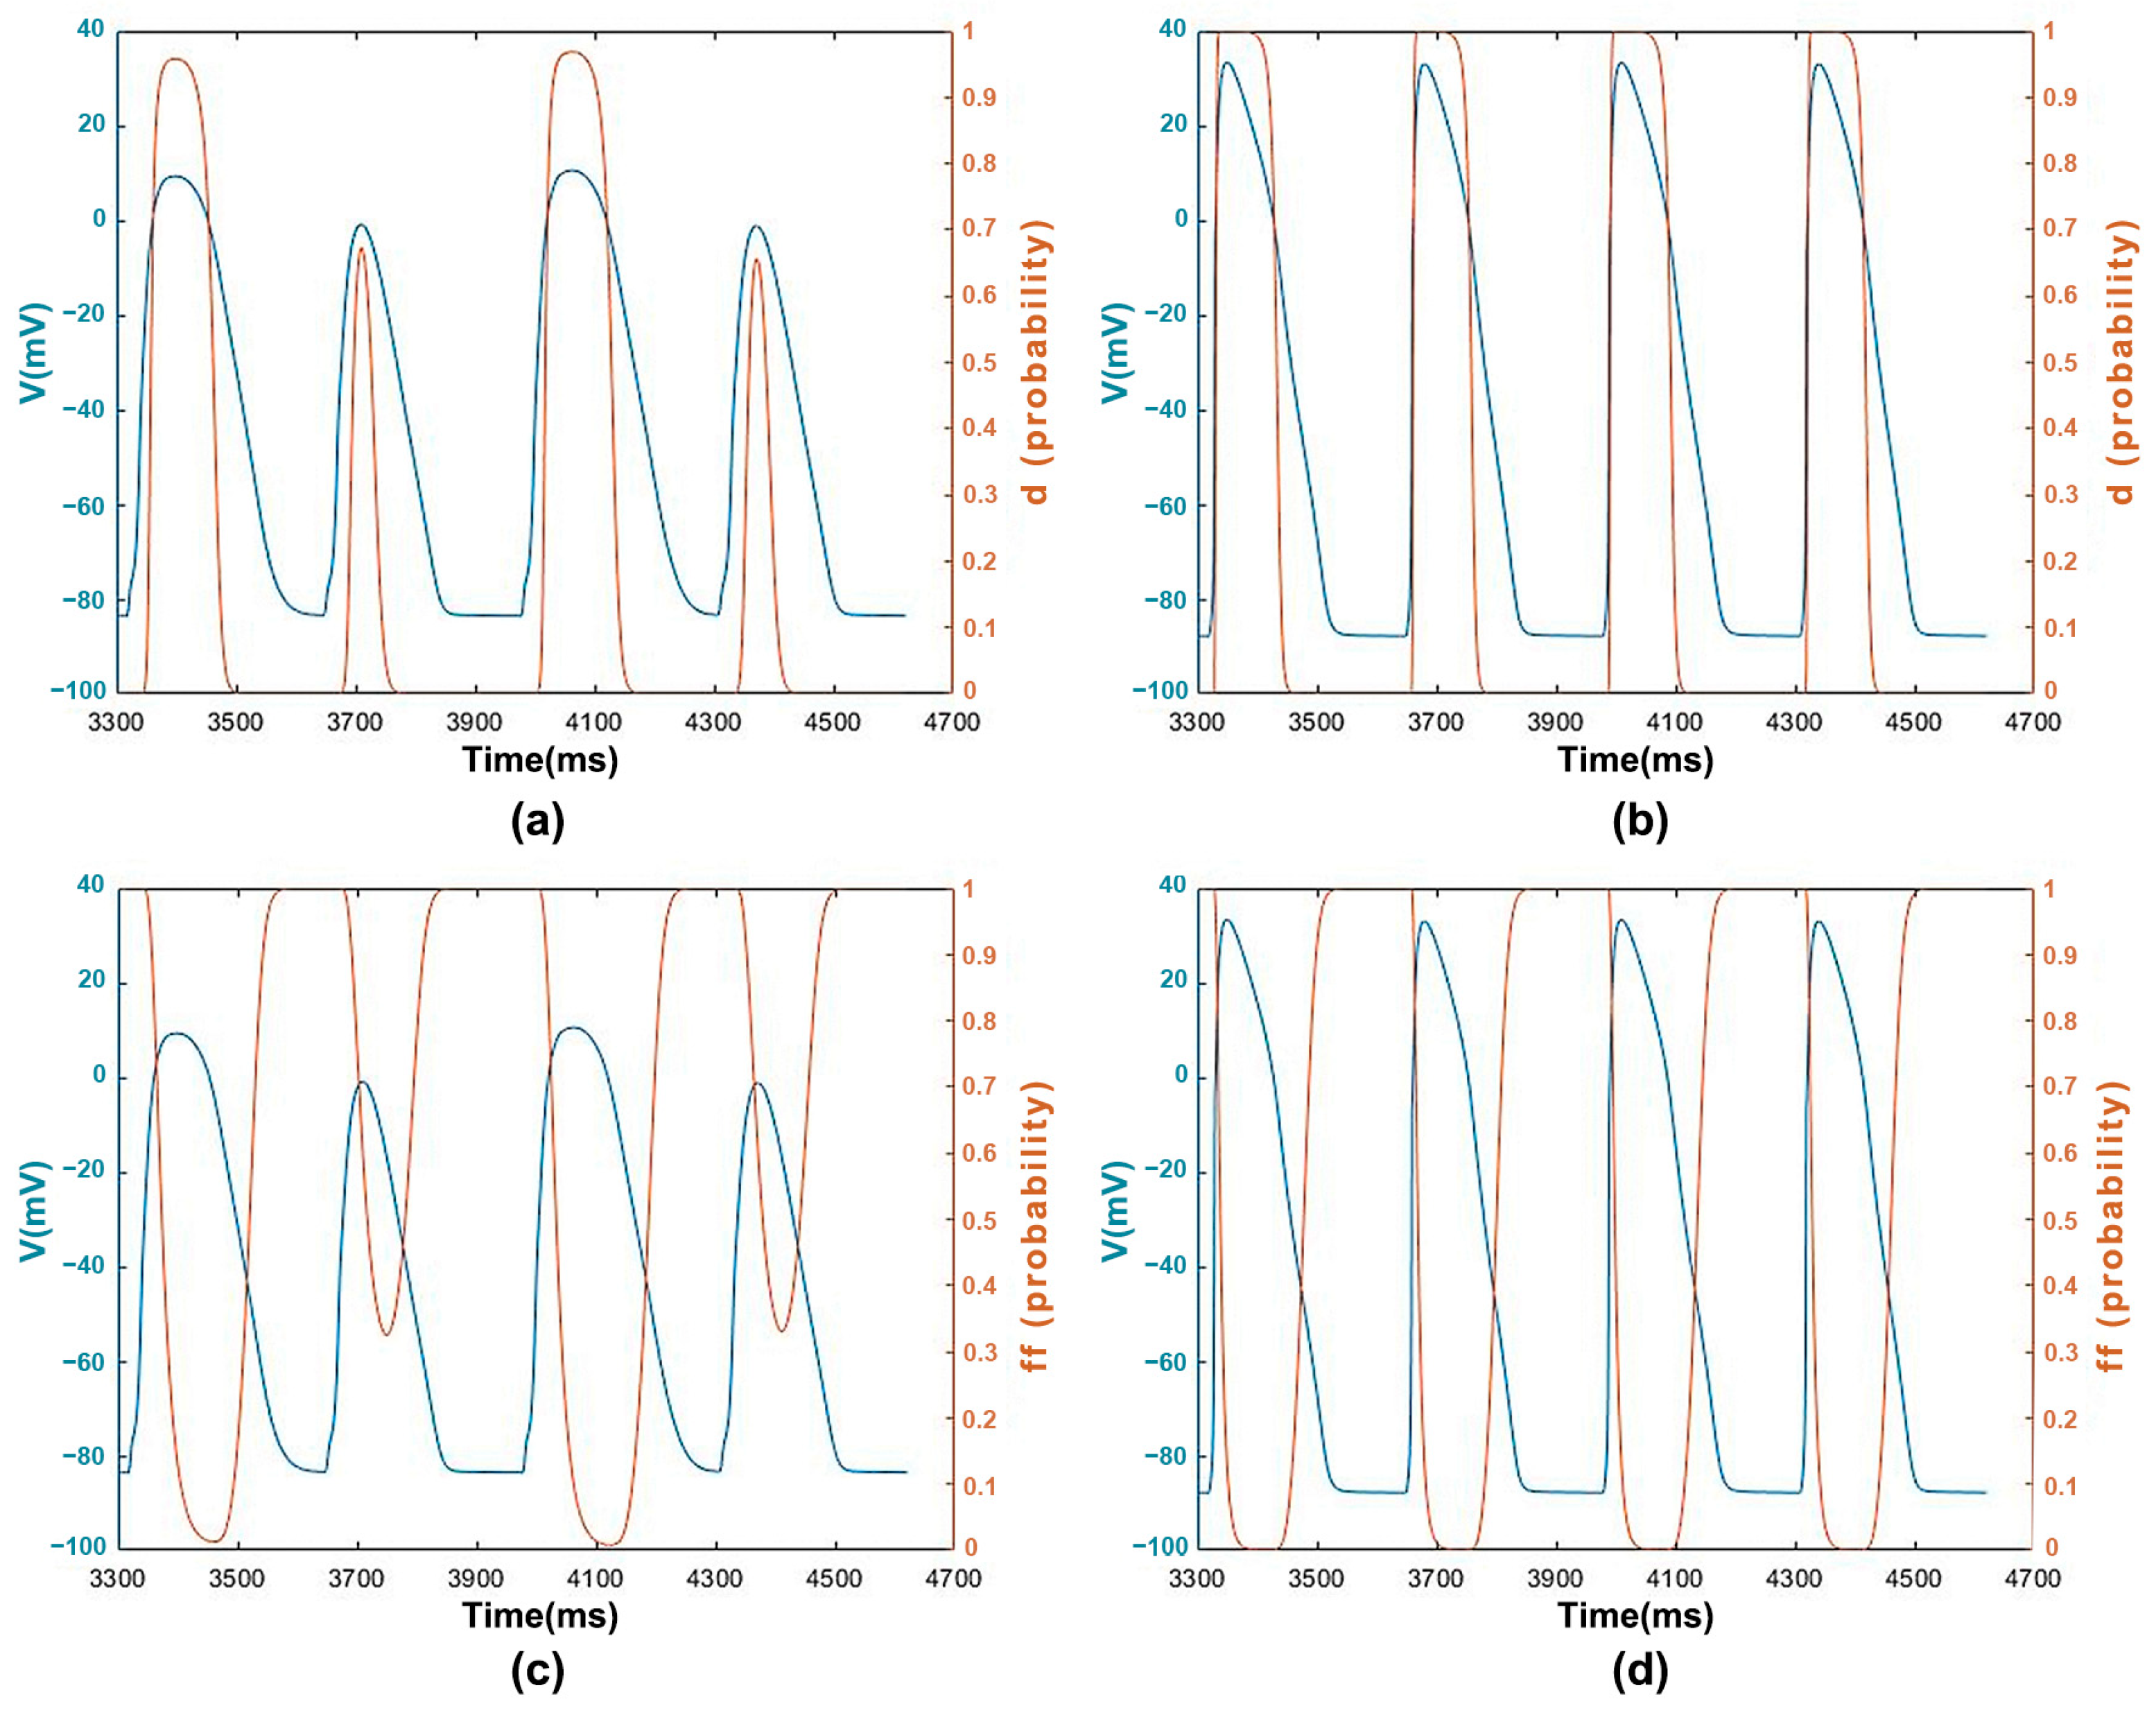
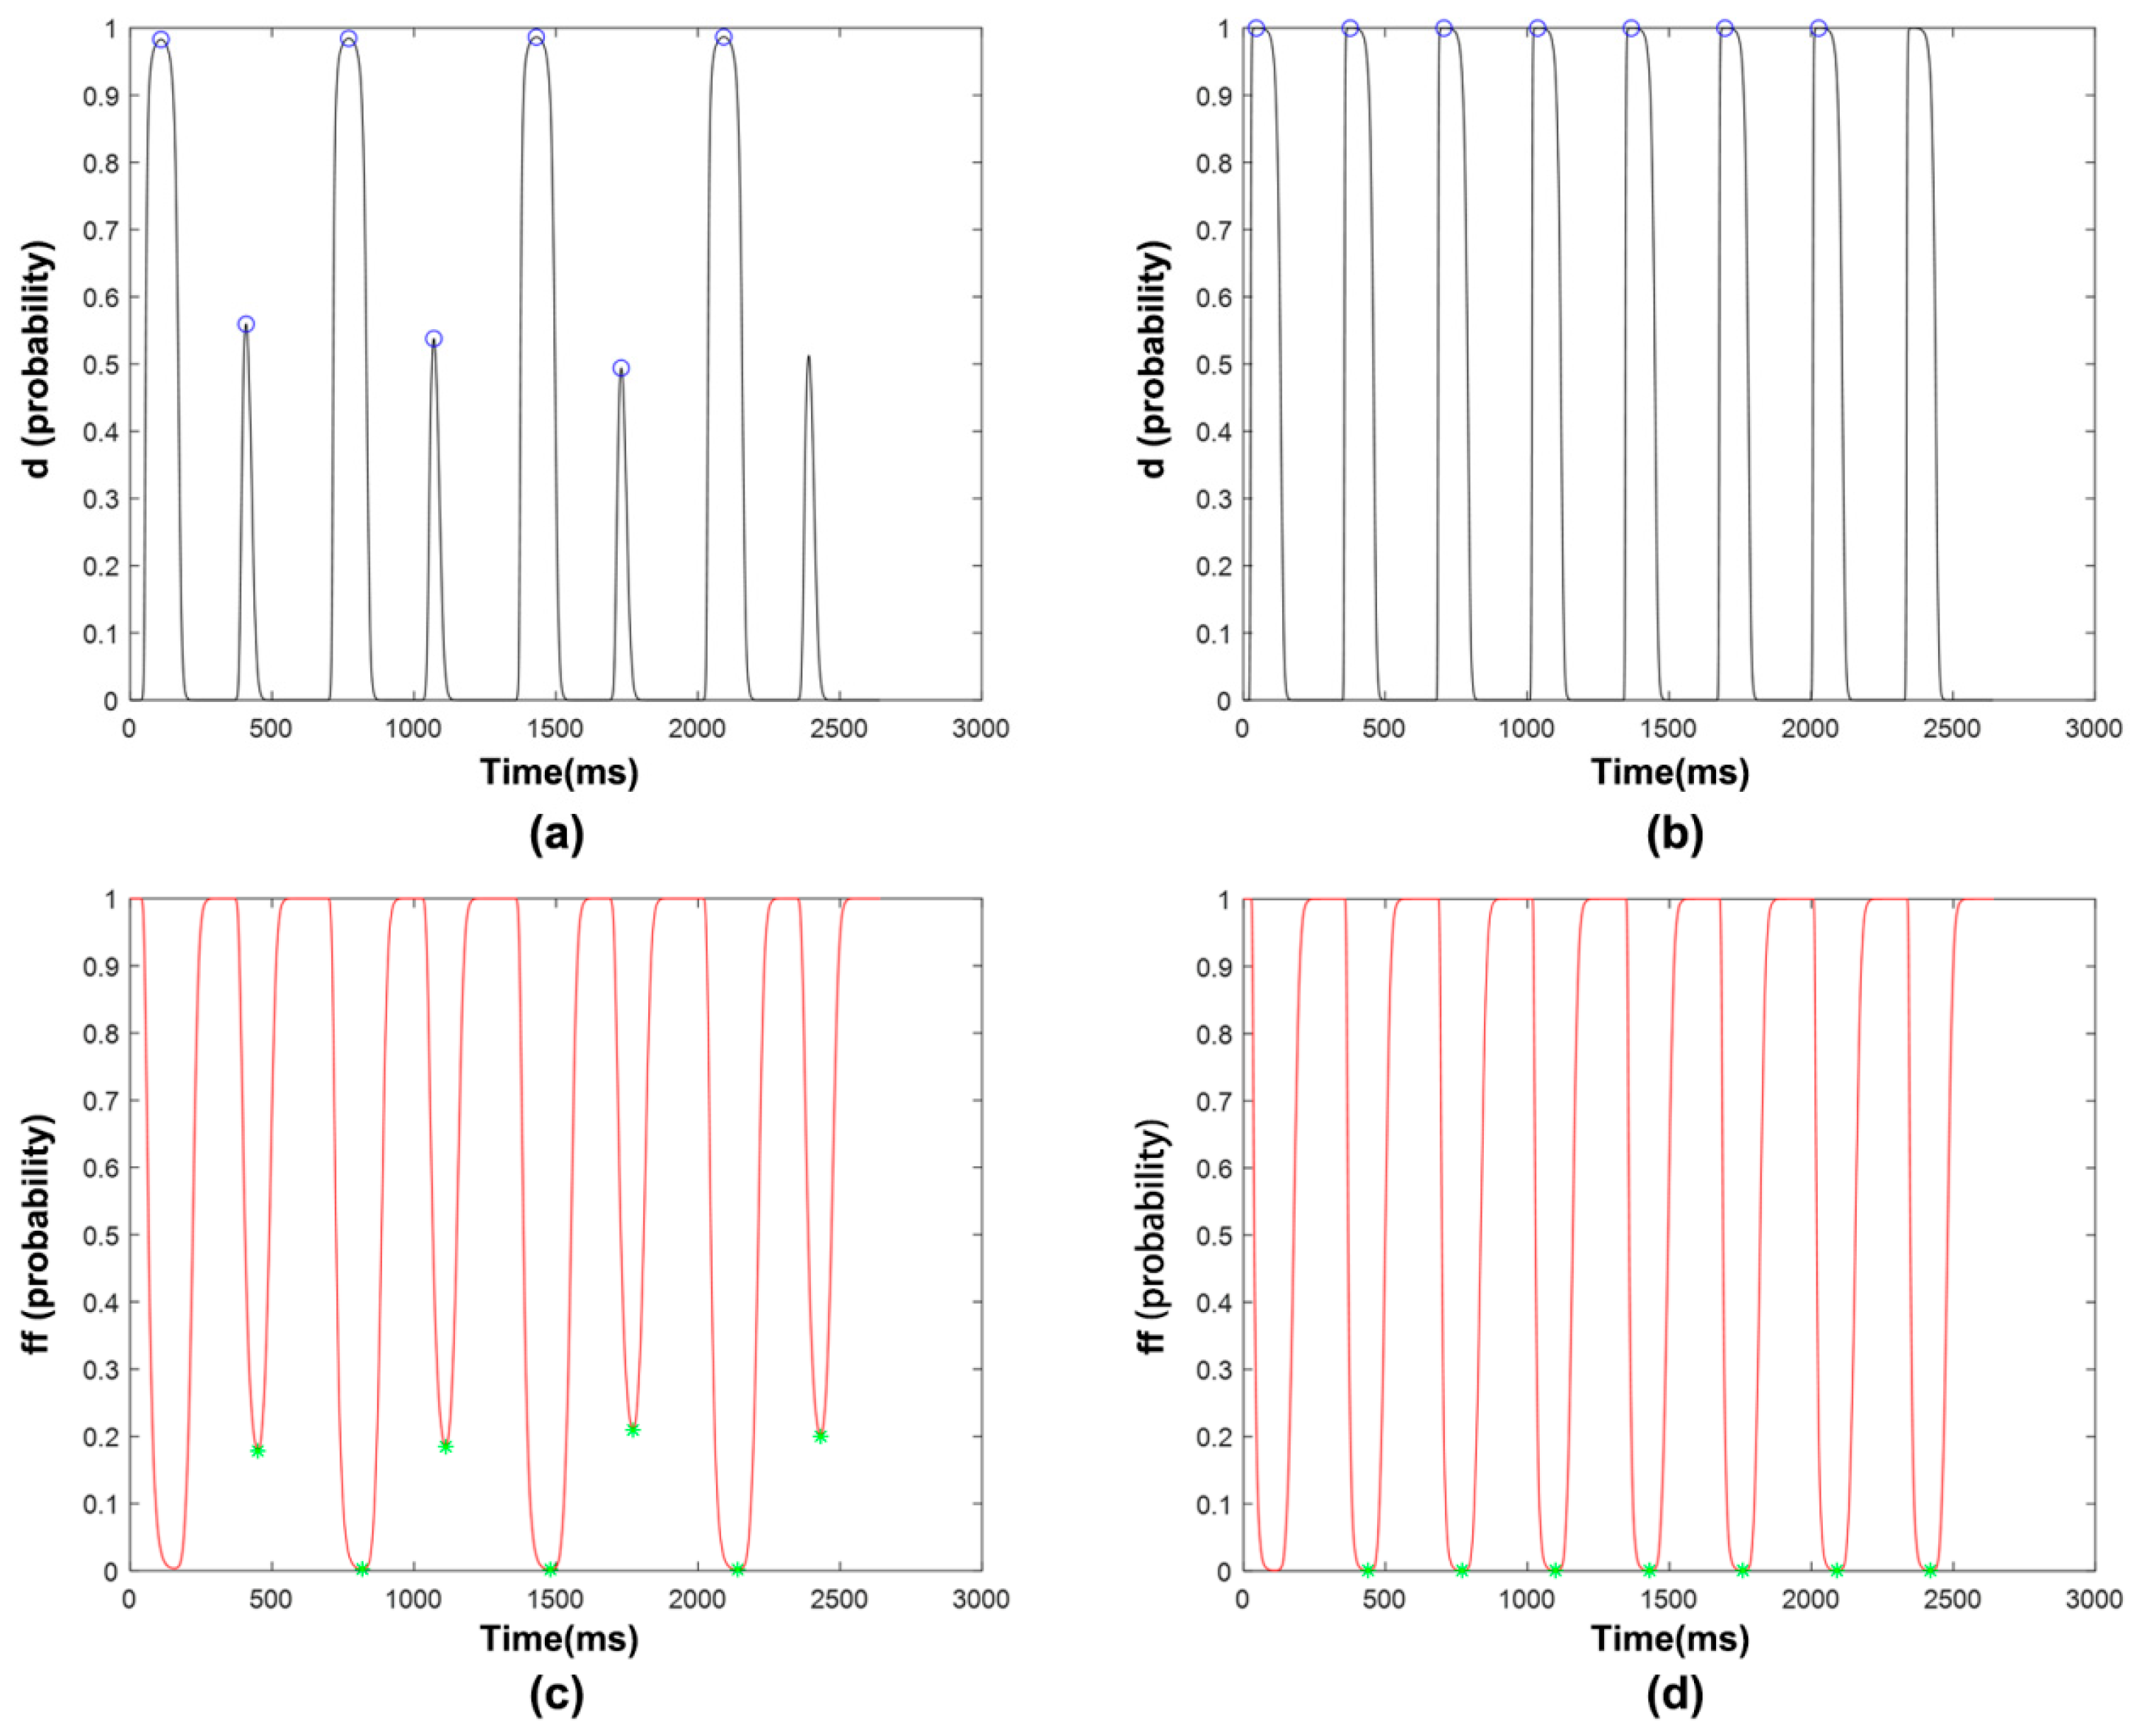
3.1.3. ICaL Voltage-Dependent Gated Channels and Features

Figure 6 shows the opening probability of the d-gate and ff-gate in a random cardiomyocyte with (from ICZ) and without CRA (from NZ), respectively. Complete closing and opening of the gates are represented by 0 and 1, respectively. In Figure 6a, the amplitude and duration of the AP, along with the wave crest of the d-gate, reveal a periodic L–S–L–S variation under alternans. Figure 6b,d shows no differences in the traces among each beat for both gates under non-alternans. Regardless of the normal condition or CRA, the variations in d-gate and ff-gate traces are simultaneously opposite to each other. A common phenomenon observed in all four Ca2+-related subcellular parameters is the elevation of the resting membrane potential (RMP) of cardiomyocytes for each beat under CRA compared to those without CRA. The extent of d-gate opening and ff-gate closing (recovery) is shown in Figure 7. We extracted features such as the SDs of the wave crest of the d-gate (blue circles in Figure 7a,b) and the wave trough of the ff-gate (green asterisks in Figure 7c,d), denoting the variabilities of gate states among all simulated beats.
The detailed relationship between the states of the two gates and the gated channel is demonstrated in Figure 8. The GCOT is indicated by the pulse width of the black square wave, which is the intersection of the opening times of the d-gate and ff-gate. This means that the activation of the ICaL channel relies entirely on the simultaneous opening of both gates. Changes in the state of the d-gate occur more frequently than those of the ff-gate, thus the state of the gated channel is more dominated by the d-gate. Apparent alternans is observed in the d-gate and the gated channel. The SD of GCOT, representing the variability of GCOT among all simulated beats, was chosen as the last feature.

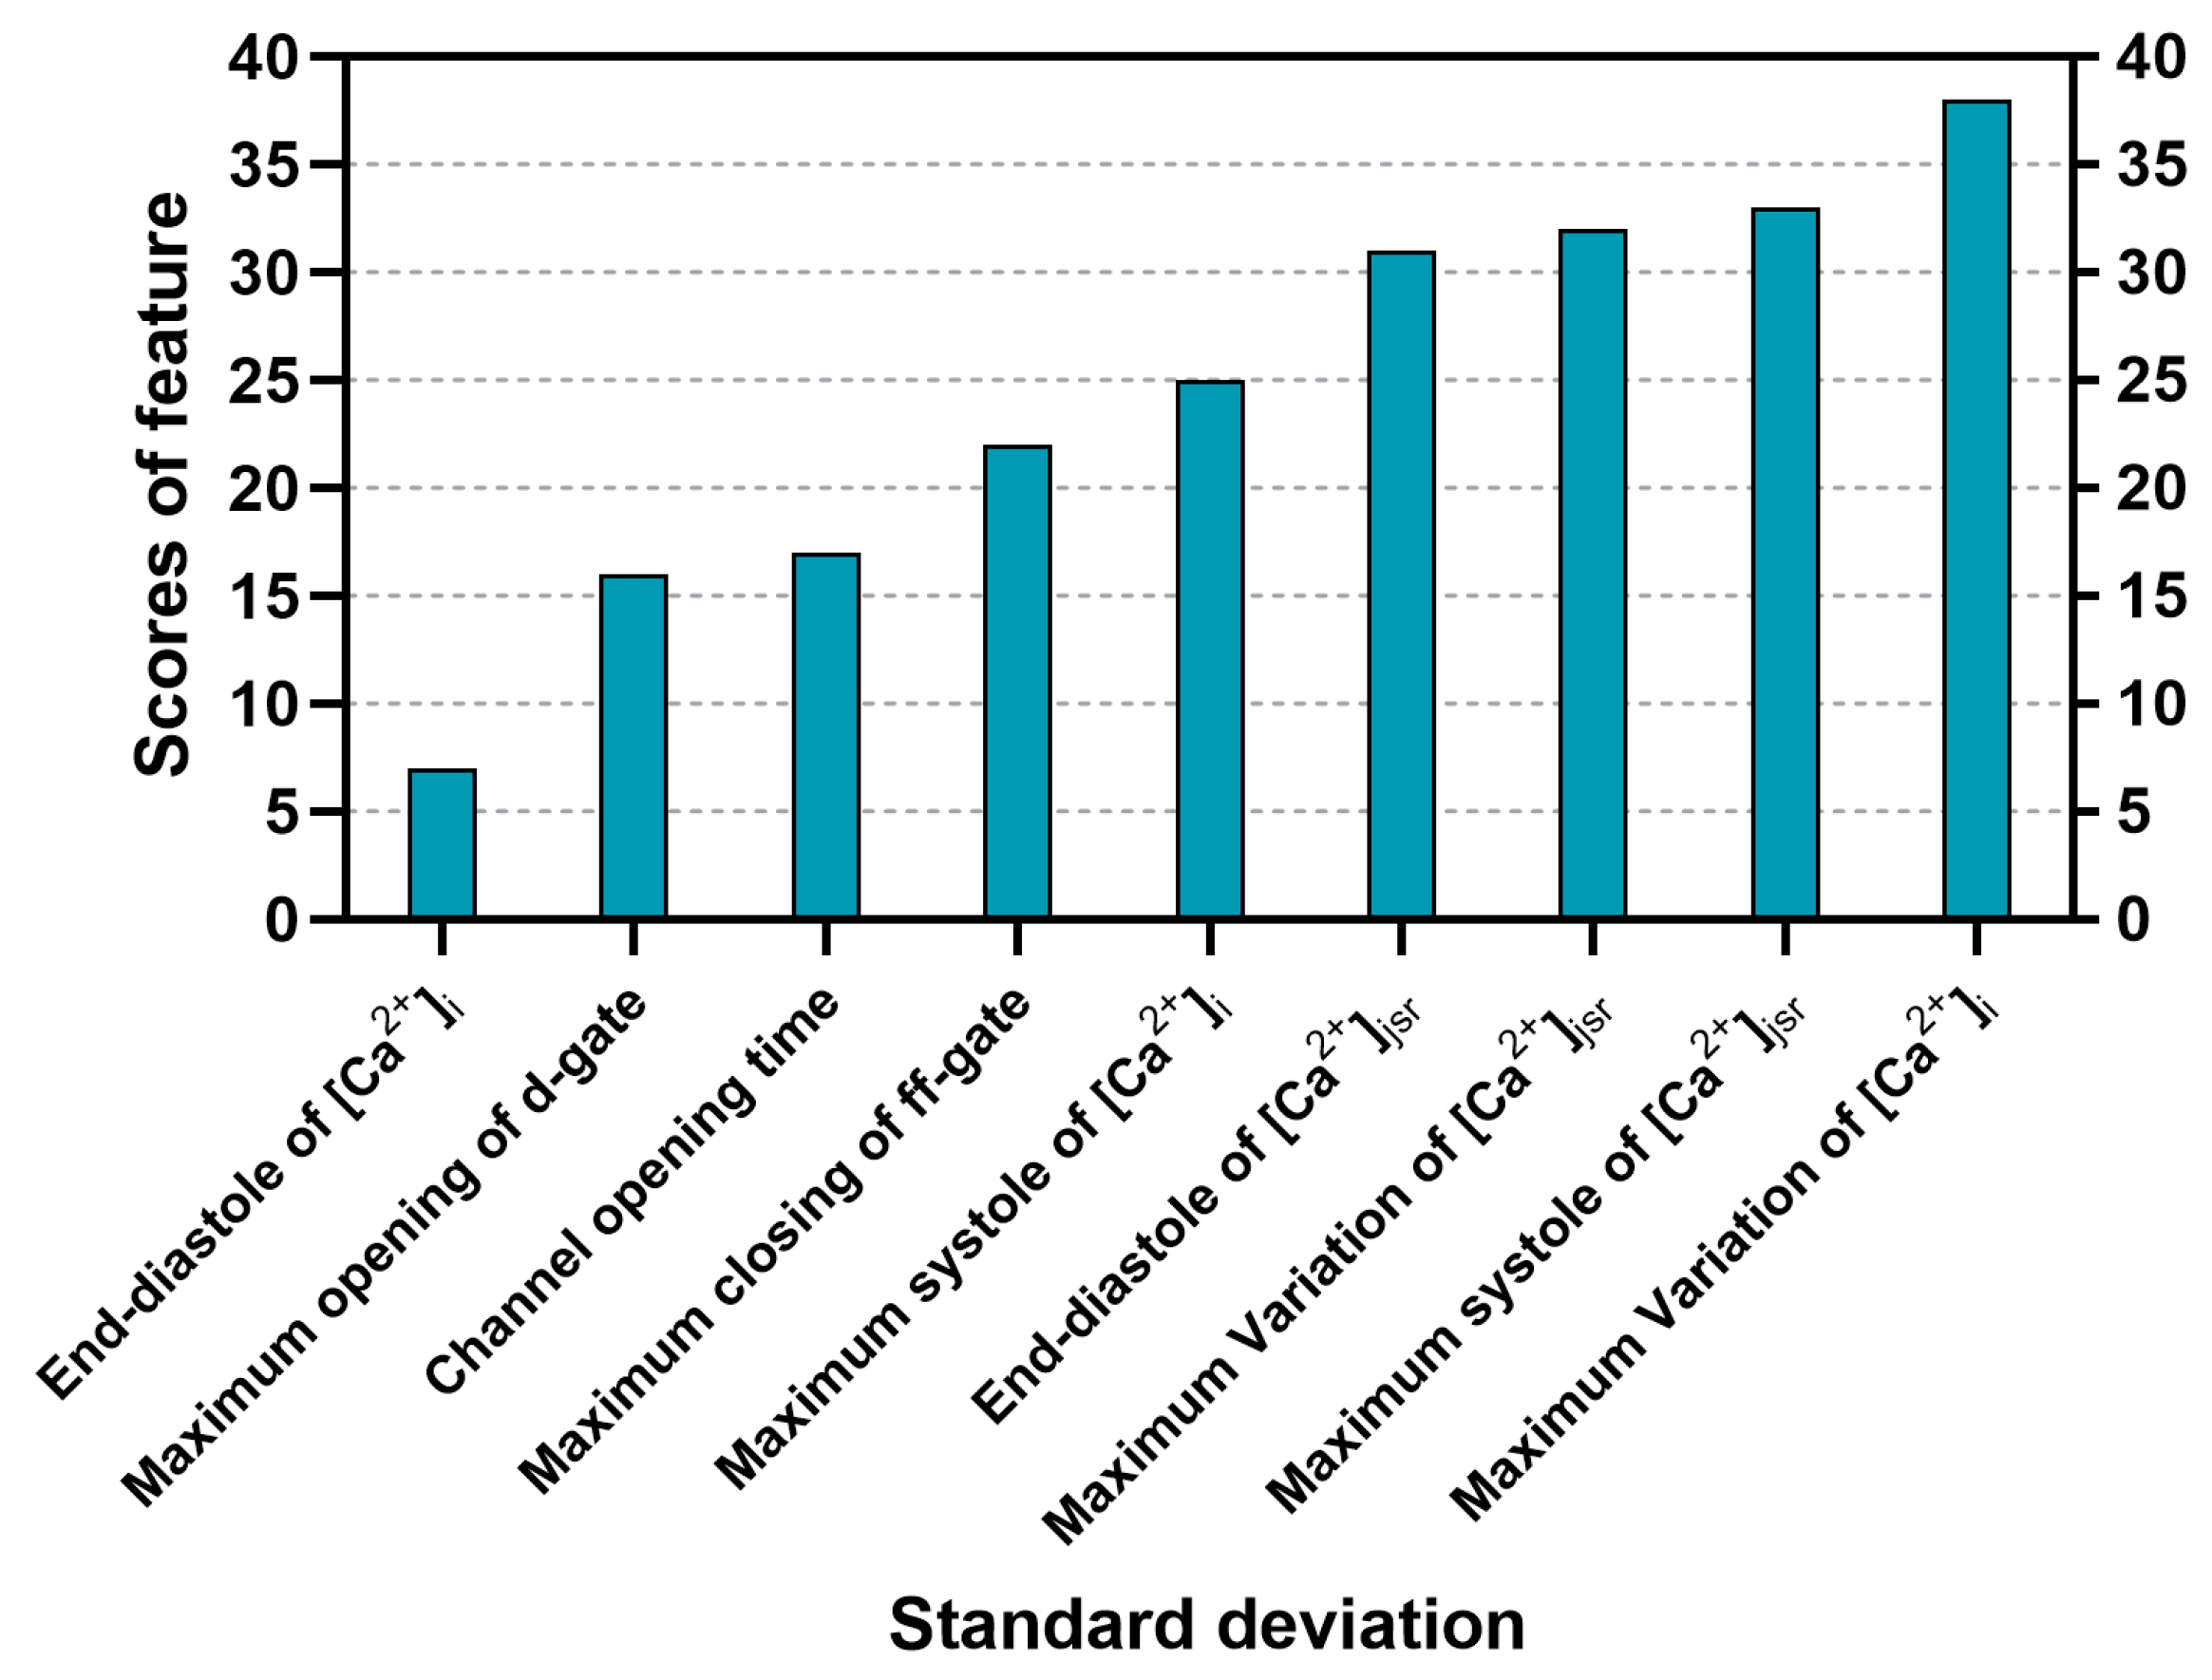
3.2. Sorting of Feature Importance

By tallying the scores of each feature after implementing the seven algorithms mentioned in Table A1, the order of feature importance is demonstrated in Figure 9. The results indicate that the SD of end-systole of [Ca2+]i is the most crucial factor affecting CRA, followed by the SDs of the maximum opening of the d-gate and the GCOT.

4. Discussion

The objective of this study was to gain insight into the importance of Ca2+-related subcellular parameters that affect CRA by combining computational modeling and machine learning-based feature selection. We constructed a ventricle model with localized MI representative of left anterior descending branch occlusion, which worked as a foundation to provide 100 cases of CRA and normal conditions, respectively, for feature extraction and importance sorting. The features included the SDs of the maximum systole and end-diastole and the degree of change between these two periods for [Ca2+]i and [Ca2+]jsr, as well as the SDs of the extent of opening for the d-gate, the extent of closing for the ff-gate, and the GCOT of ICaL. From the current results, [Ca2+]i and the states of the voltage gates of ICaL are the main influencing factors affecting CRA.

4.1. The Influences of [Ca2+]i and ICaL

Our results demonstrate that the alternans caused by rapid heart rate yields a periodic L–S–L–S variation in the AP of cardiomyocytes in ischemic regions. The variation in [Ca2+]i at the end-diastole is reversed compared to the AP due to decreased calcium re-uptake in cardiomyocytes under MI. The expression of SERCA on the SR is highly dependent on cellular metabolism. The reduction in ATP during acute ischemia lowers the energy available to SERCA, leading to decreased electrical conductivity [32,33]. Furthermore, SERCA activity is regulated by phospholamban (PLB). During MI, the dephosphorylation of PLB impairs SERCA dynamics, reducing the calcium handling capacity of SR [34]. This dysfunction in calcium re-uptake disrupts intracellular calcium homeostasis during diastole, preventing Ca2+ absorption by the SR and thereby increasing [Ca2+]i.
Altamirano et al. reported that higher [Ca2+]i during diastole reduced the availability of the ICaL channel [35], which plays a crucial role in SR calcium release. Concurrently, increased [Ca2+]i enhances the closing of the ff-gate, promoting ICaL inactivation and further hindering the Ca2+ passage. Although ICaL plays a minor role during phase 0 of the ventricular myocyte AP, its activation is essential from the beginning of the AP, and reduced ICaL impairs AP formation during the plateau phase. In fact, the overall AP amplitude decreases with the partial inactivation of INa [36] as the elevated extracellular potassium ion concentration from MI alters the potassium equilibrium potential, partially depolarizing the RMP. This explains the raised RMP under alternans observed in our results. Previous in vivo and animal studies have shown that RMP depolarization is associated with susceptibility to alternans [37,38]. In addition to potassium-related factors, the application of a high-frequency pacing protocol can also increase RMP [39] due to the inability of SR to fully compensate for rapid calcium cycling, leading to an increase in the intracellular calcium level and the acceleration of the sodium–calcium exchanger. The influx of sodium ions consequently depolarizes RMP [40]. As the d-gate activation characteristic is voltage-dependent, its function is affected. In addition to the transmembrane voltage, which is the main factor controlling the opening of the L-type calcium channel, the reduced ICaL shortens the plateau duration and overall APD. This collective reduction in AP amplitude and APD accelerates the onset of repolarization, inhibiting d-gate opening. Such inhibition, combined with increased ff-gate closing, decreases GCOT, consequently limiting ICaL flow. Eventually, a positive feedback loop develops between ICaL, AP, the d-gate, and GCOT.

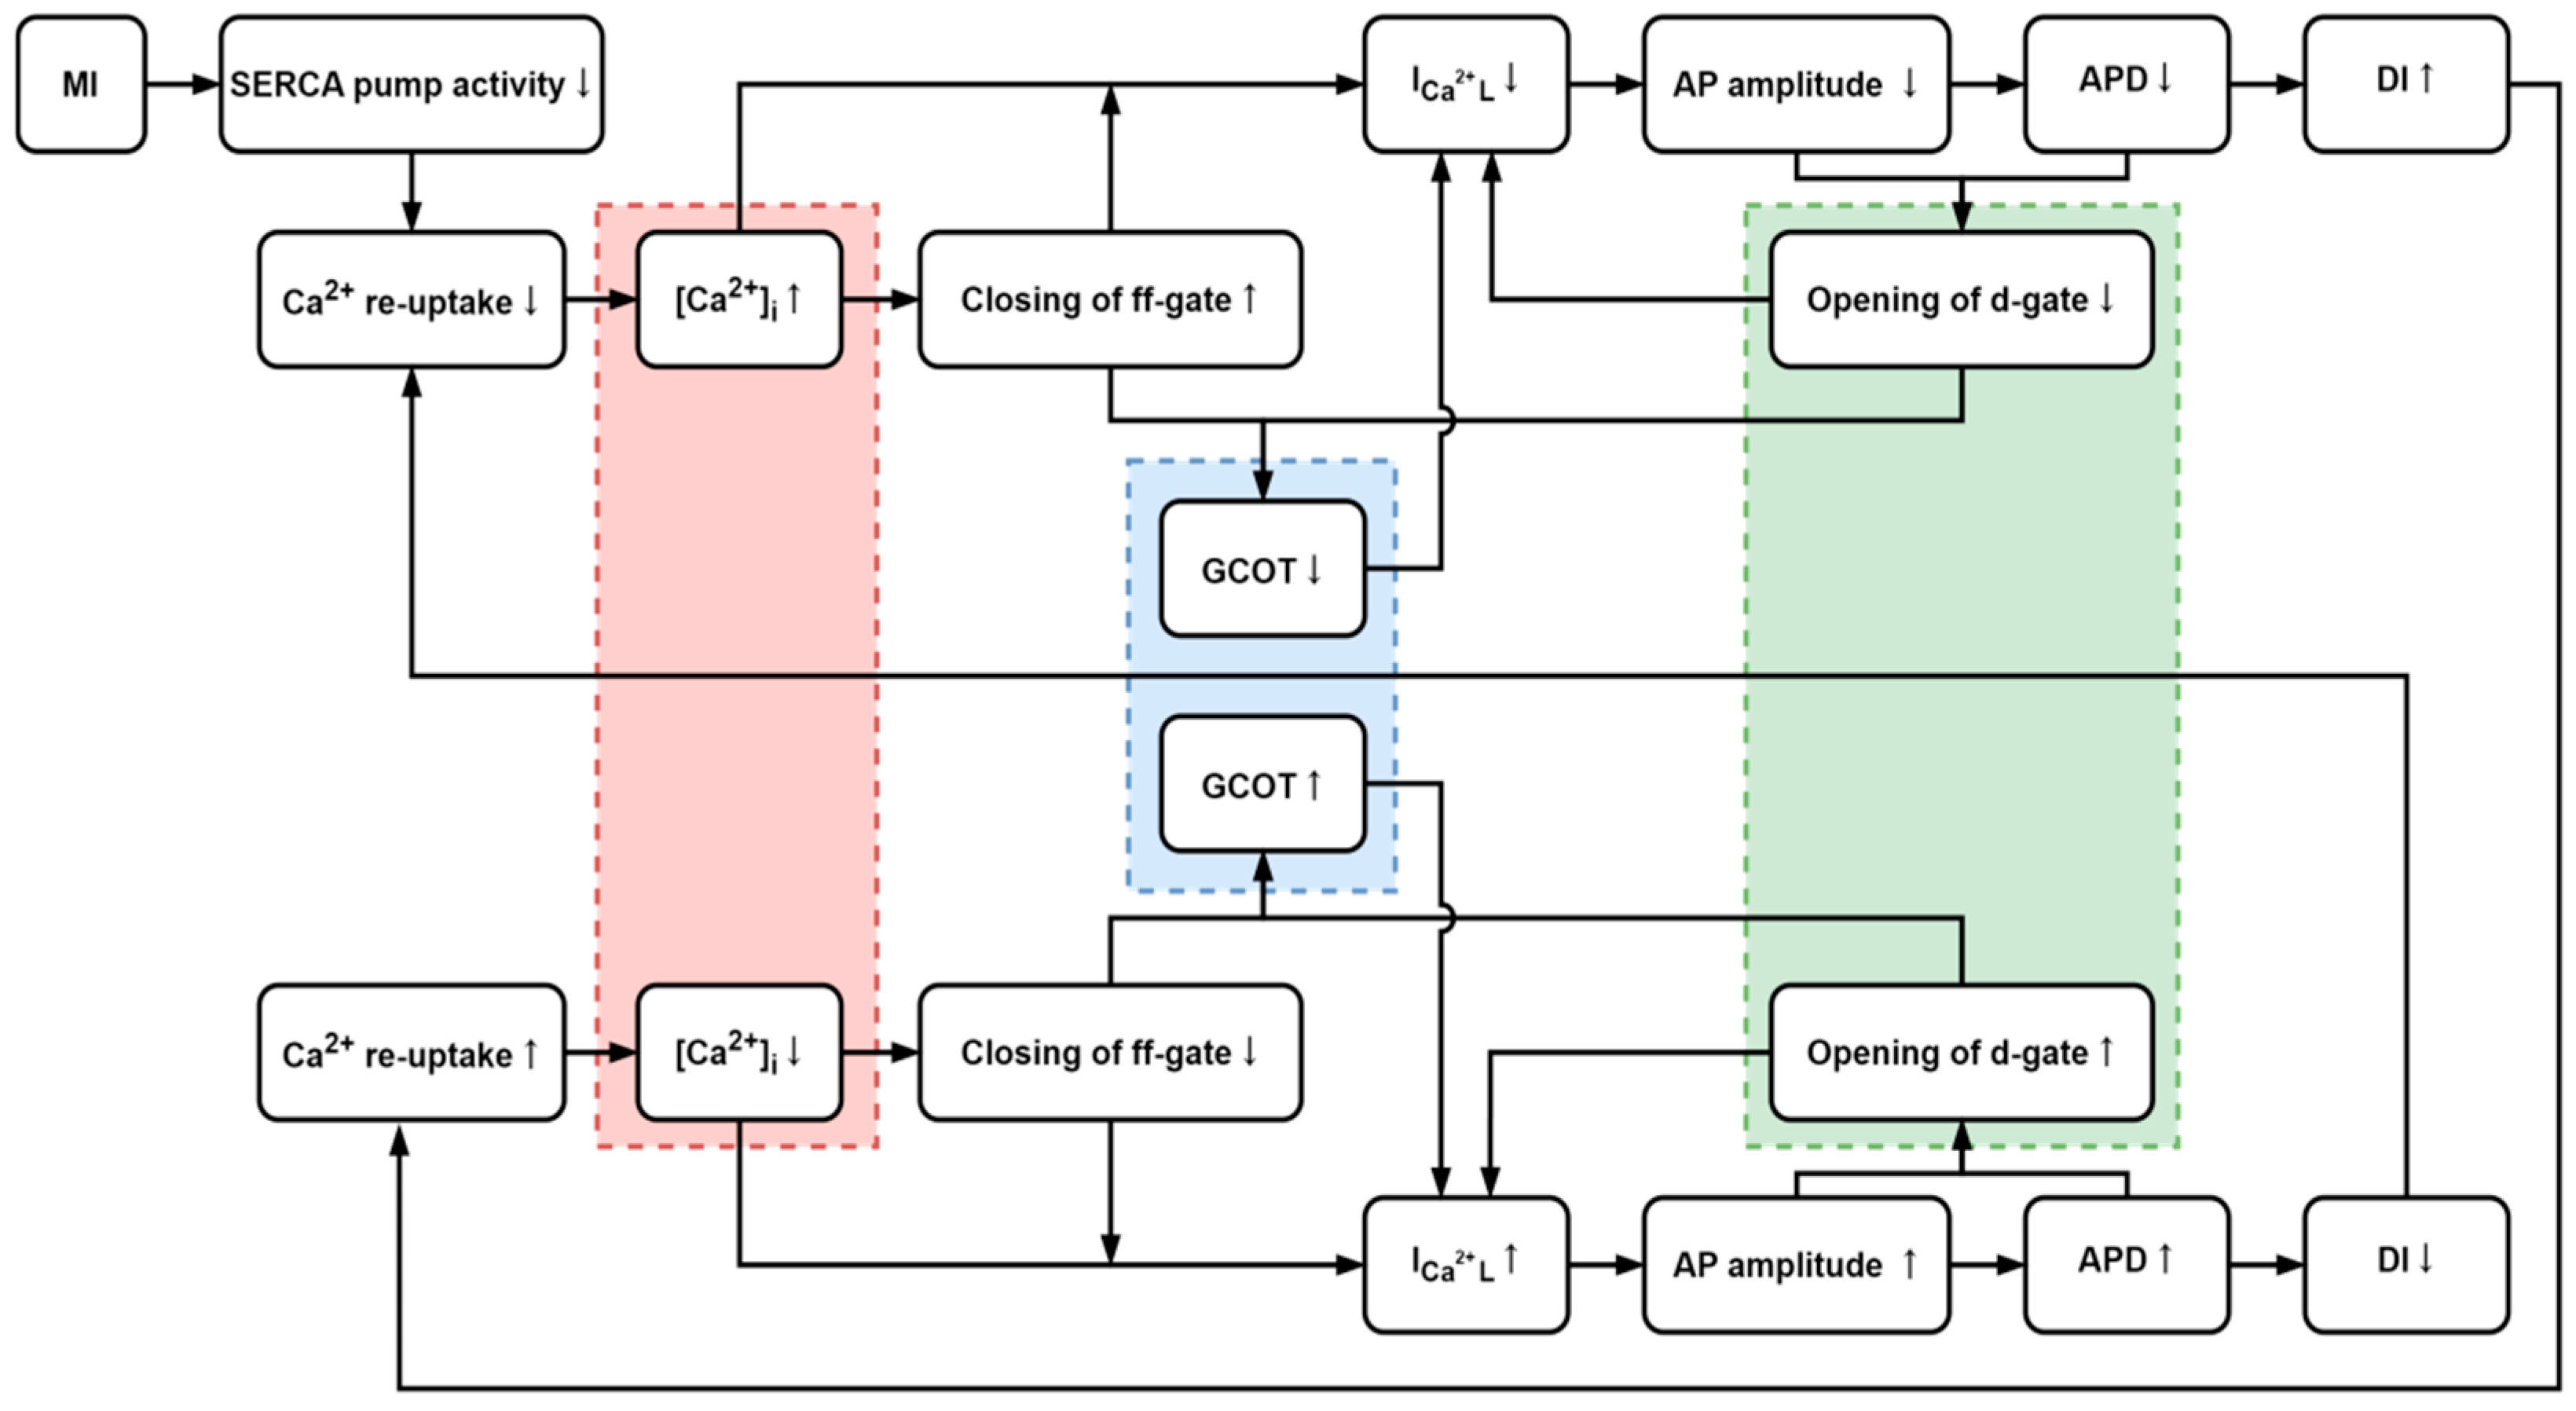
4.2. Generation of CRA

According to the current results, a flow diagram illustrating the causal relationship between CRA and the main Ca2+-related subcellular parameters during MI is summarized in Figure 10.
Decreased Ca2+ re-uptake in cardiomyocytes due to MI leads to higher [Ca2+]i, reduced ICaL channel restoration, and diminished calcium inward flow, which decreases AP amplitude and APD. Krishna et al. indicated that the stimulus inducing RyR to release Ca2+ is dominated by the concentration of Ca2+ in the subspace near the ICaL channel, rather than in the entire cytoplasm [41]. As a result, in addition to the reduction in ICaL channel availability caused by higher diastolic [Ca2+]i, the inward flow of extracellular Ca2+ is also decreased, which in turn leads to a reduced amount of Ca2+ released by RyR, and ultimately, a decrease in [Ca2+]i. This explains why the lower [Ca2+]i wave crest under even beats occurred after a higher diastolic [Ca2+]i in our results.

4.3. Limitations

This study has certain limitations. First, as mentioned in Section 2.1, a model built with rabbit ventricular geometry and human electrophysiological parameters was chosen to study the effect of MI. Although this choice was based on the compromise of current computing resources and the fact that rabbit and human electrophysiological characteristics share several similarities [16,17], employing a human ventricular geometry would provide more valuable clinical guidance. Moreover, an exact human ventricular model with compatible electrophysiological parameters would offer more robust validation. Second, this study focused solely on key Ca2+-related subcellular parameters due to the limited capabilities of the simulation software. The effect of the time constant of the gating parameter was not considered when calculating the GCOT by integrating the activation and inactivation gates. Furthermore, some subcellular parameters, such as complete information on an ionic level, the activation and inactivation gates of sodium, and potassium ion channels, could not be extracted from the current software. Consequently, the effects of these parameters on CRA were ignored. These factors absent in this study can be further addressed if the simulation software is updated to include these functions or if the study is performed using other emerging tools in the future.

5. Conclusions

In conclusion, a rabbit ventricular model parametrized with human cardiac electrophysiology was constructed to identify the dominant Ca2+-related factors influencing CRA by simulating MI caused by left anterior descending branch occlusion. With the assistance of feature selection, it was found that the formation of CRA was mainly affected by [Ca2+]i at end-diastole due to an MI-caused functional decline in calcium re-uptake. This, in turn, induced a series of alternans, including changes in AP, states of voltage gates, and GCOT of ICaL in subsequent beats. The findings from this study may not only lead to a clearer understanding of the mechanism of repolarization alternans in cardiomyocytes but also provide new insights for research methodologies in cardiac electrophysiology.

Author Contributions

Conceptualization, X.W.; data curation, Y.Y.; formal analysis, Z.G. and Y.Y.; investigation, Z.G.; methodology, X.W.; project administration, S.Y.; resources, Z.G.; software, K.G.; supervision, S.Y. and B.H.; validation, Y.Y. and S.Y.; writing—original draft, K.G.; writing—review and editing, B.H. and X.W. All authors have read and agreed to the published version of the manuscript.

Funding

This research was funded by the National Key Research and Development Program of China, China (Grant No. 2022YFC2404904).

Institutional Review Board Statement

Not applicable.

Informed Consent Statement

Not applicable.

Data Availability Statement

The original contributions presented in the study are included in the article, and further inquiries can be directed to the corresponding authors.

Conflicts of Interest

The authors declare no conflicts of interest.

Appendix A

Table A1. Mathematical expression and function of the seven algorithms for feature selection.
ExpressionFunction
Variance threshold σ 2 = 1 n i = 1 n ( x i x ¯ ) 2
n = Number of elements for a given dataset { x 1 ,   x 2 ,     x n }
x ¯ = The average of elements
Calculate the variance of each feature and remove features with variance less than a preset threshold, which are incapable of discriminating samples.
Chi-square test χ 2 = i = 1 k ( A i E i ) 2 E i
A i = Observed value
E i = Theoretical value
k = Number of observed value
Calculate the difference between observed value and theoretical value, larger result implies stronger correlation between features and classification.
MIB M I ( X , Y ) = x X y Y p ( x , y ) log p ( x , y ) p ( x ) p ( y )
X, Y = Random variables
p ( x , y ) = Joint probability distribution
p ( x ) , p ( y ) = Marginal distributions
Assess correlations between random variables, larger mutual information value referring to feature and label implies stronger correlation, accordingly more important features.
Fisher score J f i s h e r ( k ) = S B k S ω k
S B k = i = 1 C n i n ( m i k m k ) 2
S ω k = 1 n i = 1 C x ω i ( x k m i k ) 2
S B k = Between-class variance of the k-th feature
S ω k = Intra-class variance of the k-th feature
n = Number of samples for a given dataset
C = Number   of   classes   based   on   n , each   class   involves   n i  samples
x k = The   value   of   sample   x for the k-th feature
m i k = The   average   value   of   sample   in   class   i for the k-th feature
m k = The average value of all classes of sample for the k-th feature
Assess correlations between a feature and sample from the same and the different class. Larger Fisher score proves the feature to be beneficial for classification and more important, in which the variance is small between the feature and sample from the same class, and large between it and sample from the different class.
CFS r z c = k r z i ¯ k + k ( k 1 ) r i i ¯
k = Number of features
r z i ¯ = The average correlation between fea-
ture and class
r i i ¯ = The average correlation between features
Assess correlations between feature subsets and classes to screen the subset that is highly related to a class but not related to each other. The feature combination with the largest r z c is the optimal feature subset.
Relif δ j = i = 1 m d i f f ( x j i , x j i , n m ) 2 d i f f ( x j i , x j i , n h ) 2 d i f f ( x j a , x j b ) = { 0 , x j a = x j b 1 , o t h e r w i s e
x i , n m = The   nearest   neighbor   sample   m (near-miss) belonging to the different class for sample x i
x i , n h = The   nearest   neighbor   sample   h (near-hit) belonging to the same class for sample x i
x a j = The   value   of   sample   x a   on   feature   j
Appley correlation statistics to weigh the ability of feature to discriminate between nearest neighbor samples. If a random sample is closer to its near-hit than near-miss on a particular feature, then the feature weight is increased as it benefits the classification, and vice versa.
MRMR Φ = V I W I   o r   Φ = V I / W I
V I = 1 | S | i S I ( h , i )
W I = 1 | S | 2 i , j S I ( i , j )
V I = The maximum relevance
W I = The minimum redundancy
S = Feature   subset
h = Target class
I ( i , j ) = Mutual   information   between   feature   i   and   feature   j
Filter out features with high relevance to the class and low feature redundancy. The MRMR value Φ of a feature is obtained by integrating the maximum relevance and the minimum redundancy through addition or multiplication. Larger Φ implies more important feature.

References

  1. Khan, M.A.; Hashim, M.J.; Mustafa, H.; Baniyas, M.Y.; Al Suwaidi, S.K.B.M.; Alkatheeri, R.; Alblooshi, F.M.K.; Almatrooshi, M.E.A.H.; Alzaabi, M.E.H.; Al Darmaki, R.S.; et al. Global Epidemiology of Ischemic Heart Disease: Results from the Global Burden of Disease Study. Cureus 2020, 12, e9349. [Google Scholar] [CrossRef] [PubMed]
  2. Heusch, G. Myocardial ischaemia–reperfusion injury and cardioprotection in perspective. Nat. Rev. Cardiol. 2020, 17, 773–789. [Google Scholar] [CrossRef] [PubMed]
  3. Han, B.; Trew, M.L.; Zgierski-Johnston, C.M. Cardiac Conduction Velocity, Remodeling and Arrhythmogenesis. Cells 2021, 10, 2923. [Google Scholar] [CrossRef]
  4. Gräni, C.; Benz, D.C.; Gupta, S.; Windecker, S.; Kwong, R.Y. Sudden Cardiac Death in Ischemic Heart Disease: From Imaging Arrhythmogenic Substrate to Guiding Therapies. JACC Cardiovasc. Imaging 2020, 13, 2223–2238. [Google Scholar] [CrossRef] [PubMed]
  5. Kulkarni, K.; Merchant, F.M.; Kassab, M.B.; Sana, F.; Moazzami, K.; Sayadi, O.; Singh, J.P.; Heist, E.K.; Armoundas, A.A. Cardiac Alternans: Mechanisms and Clinical Utility in Arrhythmia Prevention. J. Am. Hear. Assoc. 2019, 8, e013750. [Google Scholar] [CrossRef] [PubMed]
  6. Weiss, J.N.; Karma, A.; Shiferaw, Y.; Chen, P.S.; Garfinkel, A.; Qu, Z. From pulsus to pulseless: The saga of cardiac alternans. Circ. Res. 2006, 98, 1244–1253. [Google Scholar] [CrossRef]
  7. Yang, Y.; Lv, T.; Li, S.; Zhang, P. The Relationship between T-Wave Alternans and Adverse Cardiac Events in Patients with Congenital Long QT Syndrome: A Systematic Review and Meta-Analysis. Congenit. Heart Dis. 2022, 17, 557–567. [Google Scholar] [CrossRef]
  8. Carmeliet, E. Cardiac Ionic Currents and Acute Ischemia: From Channels to Arrhythmias. Physiol. Rev. 1999, 79, 917–1017. [Google Scholar] [CrossRef]
  9. Rakisheva, A.; Marketou, M.; Klimenko, A.; Troyanova-Shchutskaia, T.; Vardas, P. Hyperkalemia in heart failure: Foe or friend? Clin. Cardiol. 2020, 43, 666–675. [Google Scholar] [CrossRef]
  10. Kormos, A.; Nagy, N.; Acsai, K.; Váczi, K.; Ágoston, S.; Pollesello, P.; Levijoki, J.; Szentandrássy, N.; Papp, J.G.; Varró, A.; et al. Efficacy of selective NCX inhibition by ORM-10103 during simulated ischemia/reperfusion. Eur. J. Pharmacol. 2014, 740, 539–551. [Google Scholar] [CrossRef]
  11. Szlovák, J.; Tomek, J.; Zhou, X.; Tóth, N.; Veress, R.; Horváth, B.; Szentandrássy, N.; Levijoki, J.; Papp, J.G.; Herring, N.; et al. Blockade of sodium-calcium exchanger via ORM-10962 attenuates cardiac alternans. J. Mol. Cell. Cardiol. 2021, 153, 111–122. [Google Scholar] [CrossRef] [PubMed]
  12. Díaz, M.E.; O’neill, S.C.; Eisner, D.A. Sarcoplasmic Reticulum Calcium Content Fluctuation Is the Key to Cardiac Alternans. Circ. Res. 2004, 94, 650–656. [Google Scholar] [CrossRef]
  13. Picht, E.; DeSantiago, J.; Blatter, L.A.; Bers, D.M. Cardiac alternans do not rely on diastolic sarcoplasmic reticulum calcium content fluctuations. Circ. Res. 2006, 99, 740–748. [Google Scholar] [CrossRef] [PubMed]
  14. Wang, L.; Myles, R.C.; De Jesus, N.M.; Ohlendorf, A.K.; Bers, D.M.; Ripplinger, C.M. Optical mapping of sarcoplasmic reticulum Ca 2+ in the intact heart. Circ. Res. 2014, 114, 1410–1421. [Google Scholar] [CrossRef]
  15. Wang, L.; Myles, R.C.; Lee, I.-J.; Bers, D.M.; Ripplinger, C.M. Role of Reduced Sarco-Endoplasmic Reticulum Ca2+-ATPase Function on Sarcoplasmic Reticulum Ca2+ Alternans in the Intact Rabbit Heart. Front. Physiol. 2021, 12, 656516. [Google Scholar] [CrossRef] [PubMed]
  16. Nattel, S.; Duker, G.; Carlsson, L. Model systems for the discovery and development of antiarrhythmic drugs. Prog. Biophys. Mol. Biol. 2008, 98, 328–339. [Google Scholar] [CrossRef] [PubMed]
  17. Nerbonne, J.M. Molecular basis of functional voltage-gated K+ channel diversity in the mammalian myocardium. J. Physiol. 2000, 525, 285–298. [Google Scholar] [CrossRef]
  18. Geng, Z.; Jin, L.; Huang, Y.; Wu, X. Rate dependence of early afterdepolarizations in the His-Purkinje system: A simulation study. Comput. Methods Programs Biomed. 2022, 217, 106665. [Google Scholar] [CrossRef]
  19. Geng, Z.; Jin, L.; Zhu, H.; Wang, J.; Wu, X. Effects of increased extracellular potassium concentration induced by ischemia on the vulnerability of ventricular arrhythmias and the regularity of related ventricular tachycardia. Appl. Sci. 2021, 11, 2189. [Google Scholar] [CrossRef]
  20. Costabal, F.S.; Hurtado, D.E.; Kuhl, E. Generating Purkinje networks in the human heart. J. Biomech. 2016, 49, 2455–2465. [Google Scholar] [CrossRef]
  21. O’Hara, T.; Virág, L.; Varró, A.; Rudy, Y. Simulation of the undiseased human cardiac ventricular action potential: Model formulation and experimental validation. PLoS Comput. Biol. 2011, 7, e1002061. [Google Scholar] [CrossRef] [PubMed]
  22. Ten Tusscher, K.H.W.J.; Noble, D.; Noble, P.J.; Panfilov, A. A model for human ventricular tissue. Am. J. Physiol.-Heart Circ. Physiol. 2004, 286, 1573–1589. [Google Scholar] [CrossRef] [PubMed]
  23. Keener, J.P.; Bogar, K. A numerical method for the solution of the bidomain equations in cardiac tissue. Chaos Interdiscip. J. Nonlinear Sci. 1998, 8, 234–241. [Google Scholar] [CrossRef]
  24. Deng, D.; Arevalo, H.J.; Prakosa, A.; Callans, D.J.; Trayanova, N.A. A feasibility study of arrhythmia risk prediction in patients with myocardial infarction and preserved ejection fraction. Europace 2016, 18, iv60–iv66. [Google Scholar] [CrossRef] [PubMed]
  25. Wilde, A.A.; Aksnes, G. Myocardial potassium loss and cell depolarisation in ischaemia and hypoxia. Cardiovasc. Res. 1995, 29, 1–15. [Google Scholar] [CrossRef] [PubMed]
  26. Michailova, A.; Lorentz, W.; McCulloch, A. Modeling transmural heterogeneity of K-ATP current in rabbit ventricular myo-cytes. Am. J. Physiol.-Cell Physiol. 2007, 293, C542–C557. [Google Scholar] [CrossRef]
  27. Qu, Z.; Xie, Y.; Garfinkel, A.; Weiss, J.N. T-wave alternans and arrhythmogenesis in cardiac diseases. Front. Physiol. 2010, 1, 154. [Google Scholar] [CrossRef] [PubMed]
  28. Hall, M.A. Correlation-based Feature Selection for Machine Learning. Ph.D. Thesis, The University of Waikato, Hamilton, New Zealand, April 1999. [Google Scholar]
  29. Gu, Q.; Li, Z.; Han, J. Generalized fisher score for feature selection. In Proceedings of the 27th Conference on Uncertainty in Artificial Intelli-gence, Barcelona, Spain, 14–17 July 2011. [Google Scholar] [CrossRef]
  30. Urbanowicz, R.J.; Meeker, M.; La Cava, W.; Olson, R.S.; Moore, J.H. Relief-based feature selection: Introduction and review. J. Biomed. Inform. 2018, 85, 189–203. [Google Scholar] [CrossRef]
  31. Ding, C.; Peng, H. Minimum redundancy feature selection from microarray gene expression data. J. Bioinform. Comput. Biol. 2005, 3, 185–205. [Google Scholar] [CrossRef]
  32. Zuurbier, C.J.; Bertrand, L.; Beauloye, C.R.; Andreadou, I.; Ruiz-Meana, M.; Jespersen, N.R.; Kula-Alwar, D.; Prag, H.A.; Eric Botker, H.; Dambrova, M.; et al. Cardiac metabolism as a driver and therapeutic target of myocardial infarction. J. Cell. Mol. Med. 2020, 24, 5937–5954. [Google Scholar] [CrossRef] [PubMed]
  33. Samuel, T.J.; Lai, S.; Schär, M.; Wu, K.C.; Steinberg, A.M.; Wei, A.-C.; Anderson, M.E.; Tomaselli, G.F.; Gerstenblith, G.; Bottomley, P.A.; et al. Myocardial ATP depletion detected noninvasively predicts sudden cardiac death risk in patients with heart failure. JCI Investig. 2022, 7, e157557. [Google Scholar] [CrossRef]
  34. Wang, R.; Wang, M.; He, S.; Sun, G.; Sun, X. Targeting Calcium Homeostasis in Myocardial Ischemia/Reperfusion Injury: An Overview of Regulatory Mechanisms and Therapeutic Reagents. Front. Pharmacol. 2020, 11, 872. [Google Scholar] [CrossRef] [PubMed]
  35. Altamirano, J.; Bers, D.M. Effect of intracellular Ca2+ and action potential duration on L-type Ca2+ channel inactivation and recovery from inactivation in rabbit cardiac myocytes. Am. J. Physiol. Circ. Physiol. 2007, 293, H563–H573. [Google Scholar] [CrossRef]
  36. Fletcher, A. Action potential: Generation and propagation. Anaesth. Intensiv. Care Med. 2019, 20, 243–247. [Google Scholar] [CrossRef]
  37. Alpert, N.M.; Guehl, N.; Ptaszek, L.; Pelletier-Galarneau, M.; Ruskin, J.; Mansour, M.C.; Wooten, D.; Ma, C.; Takahashi, K.; Zhou, Y.; et al. Quantitative in vivo mapping of myocardial mitochondrial membrane potential. PLoS ONE 2018, 13, e0190968. [Google Scholar] [CrossRef] [PubMed]
  38. Gauvrit, S.; Bossaer, J.; Lee, J.; Collins, M.M. Modeling Human Cardiac Arrhythmias: Insights from Zebrafish. J. Cardiovasc. Dev. Dis. 2022, 9, 13. [Google Scholar] [CrossRef]
  39. Sutanto, H.; Heijman, J. Integrative Computational Modeling of Cardiomyocyte Calcium Handling and Cardiac Arrhythmias: Current Status and Future Challenges. Cells 2022, 11, 1090. [Google Scholar] [CrossRef]
  40. Agrawal, A.; Wang, K.; Polonchuk, L.; Cooper, J.; Hendrix, M.; Gavaghan, D.J.; Mirams, G.R.; Clerx, M. Models of the cardiac L-type calcium current: A quantitative review. WIREs Mech. Dis. 2023, 15, e1581. [Google Scholar] [CrossRef]
  41. Krishna, A.; Sun, L.; Valderrábano, M.; Palade, P.T.; Clark, J.W. Modeling CICR in rat ventricular myocytes: Voltage clamp studies. Theor. Biol. Med. Model. 2010, 7, 1–66. [Google Scholar] [CrossRef] [PubMed]
Figure 1. Flow diagram of the overall research methodology. The blue area in the myocardial ischemia model denotes the ischemic region.
Applsci 14 06789 g001
Figure 2. The rabbit ventricular model featuring (a) the His–Purkinje system and (b) myocardial ischemia. The red dot in (a) represents the starting point of His bundle. The red and blue regions in (b) represent the ICZ and the BZ, respectively.
Applsci 14 06789 g002
Figure 3. The virtual lead II ECG of the ventricular model under cycle lengths of (a) 600 ms and (b) 330 ms.
Applsci 14 06789 g003
Figure 4. Examples of (a) alternans and (b) non-alternans in cardiomyocyte action potential (teal trace) and [Ca2+]i (brown trace). The wave crest (red circle) and trough (blue asterisk) of [Ca2+]i among beats are marked under (c) alternans and (d) non-alternans.
Applsci 14 06789 g004
Figure 5. Examples of (a) alternans and (b) non-alternans in cardiomyocytes action potential (teal trace) and [Ca2+]jsr (brown trace). The wave crest (red circle) and trough (blue asterisk) of [Ca2+]jsr among beats are marked under (c) alternans and (d) non-alternans.
Applsci 14 06789 g005
Figure 6. Examples of (a) alternans and (b) non-alternans in cardiomyocyte action potential (teal trace) and states of the d-gate (brown trace), along with the same traces of cardiomyocyte action potential (teal trace) and states of ff-gate (brown trace) under (c) alternans and (d) non-alternans.
Applsci 14 06789 g006
Figure 7. Examples of the states of the d-gate under (a) alternans and (b) non-alternans, along with the states of the ff-gate under (c) alternans and (d) non-alternans. The blue circles in the d-gate represent wave crests. The green asterisks in the ff-gate represent wave troughs.
Applsci 14 06789 g007
Figure 8. States of the ff-gate, d-gate, and gated channel.
Applsci 14 06789 g008
Figure 9. Ranking of the importance of features affecting CRA.
Applsci 14 06789 g009
Figure 10. Mechanistic flowchart of the major Ca2+-related subcellular parameters leading to CRA. The arrows inside the flowchart elements indicate an increase or decrease in the associated parameter; while those outside the elements indicate the direction of effect between different parameters.In the context of a fixed activation cycle, shortened APD corresponds to a longer DI (currently even beats), which provides relatively sufficient time to largely compensate for the elevated [Ca2+]i caused by decreased cardiomyocyte calcium re-uptake. This results in lower [Ca2+]i, improved ICaL channel restoration, larger calcium inward flow, which increases AP amplitude and APD, and GCOT in the following beat (currently odd beats). In addition to the inherent decline in SERCA pump function, the reduced DI combined with lengthened APD further suppresses Ca2+ re-uptake in the next beat, forming alternans of [Ca2+]i, voltage gates, and GCOT among adjacent beats. Among these parameters, alternans of [Ca2+]i at end-diastole always occurs first as it directly reflects the situation of Ca2+ re-uptake, making it the most important factor contributing to CRA. The activation and opening time of the ICaL channel significantly determine the amount of current flow responsible for the subsequent generation of AP. From Figure 8, it is evident that state switching is more intensive for the d-gate. Therefore, a shorter total opening time, along with the impacts from AP, ICaL, and GCOT involved in the positive feedback loop, makes the importance of the d-gate higher than the ff-gate.
Applsci 14 06789 g010
Disclaimer/Publisher’s Note: The statements, opinions and data contained in all publications are solely those of the individual author(s) and contributor(s) and not of MDPI and/or the editor(s). MDPI and/or the editor(s) disclaim responsibility for any injury to people or property resulting from any ideas, methods, instructions or products referred to in the content.

