Article

Machine Learning and Image Processing-Based System for Identifying Mushrooms Species in Malaysia

Faculty of Information Technology, Multimedia University, Jalan Ayer Keroh Lama, Melaka 75450, Malaysia
*
Author to whom correspondence should be addressed.
Appl. Sci. 2024, 14(15), 6794; https://doi.org/10.3390/app14156794
Submission received: 26 June 2024 / Revised: 21 July 2024 / Accepted: 1 August 2024 / Published: 4 August 2024

Abstract

:
Malaysia, a country with a tropical climate characterized by consistent warmth and year-long high humidity, houses the perfect conditions for mushroom growth. Recently, there has been a surge in back-to-nature activities in Malaysia. However, many participants lack prior knowledge about the local flora and fungi, leading to a rise in mushroom poisoning cases, some of which have been fatal. Despite thorough research, there is a notable lack of identification studies specifically focused on mushroom species in Malaysia. Identifying these species is crucial for medical providers to effectively counteract the toxins from ingested mushrooms and also serves as an important educational tool. This study aims to determine the most suitable architecture for mushroom identification, focusing specifically on mushroom species found in Malaysia. A dataset of these mushrooms was curated, augmented, and processed through multiple variants of Vision Transformers (ViTs) and ResNet models, with uniform hyperparameters to ensure fairness. The results indicate that the ViT-L/16 model achieved the highest accuracy at 90.47%.

1. Introduction

Malaysia is a tropical country with year-long high humidity and stable temperatures, which is suitable for the growth and cultivation of mushrooms. Therefore, mushrooms are a staple in many people’s diets across Southeast Asia, mainly due to their natural availability and nutritional value. However, the Deputy Vice-chancellor of Research and Innovation, Professor Dr. Shahril Yusof from Universiti Malaysia Sabah (UMS) has stated that between 2001 and 2017, there have been 111 cases of mushroom poisoning in Malaysia [1]. Two of these cases have resulted in death [1]. This is a testament to the fact that not all people who forage for mushrooms can tell the subtle difference between edible mushrooms and poisonous mushrooms. Even when samples are brought to the hospital for identification, the doctors may not know what species they are, and therefore are unable to treat patients of mushroom poisoning properly [2]. This is of great concern because the most potent toxins are the ones that do not show symptoms until it is too late [3,4]. For example, the active mycotoxin in the species Cortinarius violaceus (included in the dataset) is Orellanine, a nephrotoxin that targets the kidneys, causing acute kidney failure when ingested. As of now, not much is known about the long-term effects of Orellanine, only that the damage it inflicts may be irreversible and lifelong dialysis will be needed; in the worst cases, probably a kidney transplant will be the only viable option [3,4]. Poisonous mushrooms when ingested can cause nausea, vomiting, abdominal (stomach) pain or cramps, diarrhea, hallucinations, kidney and liver failure, and even death [5].
In July 2023, a woman and her family in Kuala Lumpur, Malaysia, were hospitalized after consuming poisonous mushrooms that they harvested from the area around their house [6]. They had mistakenly identified the poisonous mushroom Chlorophyllum molybdites as the edible Termitomyces mushroom, also known locally as “Cendawan Busut”. The Termitomyces genus, known as the termite mushroom, is an edible genus of mushroom that grows near termite nests. They are known for their flavor and high nutritional value. The species Chlorophyllum molybdites, known locally as “kulat asu”, also known as false parasol and the vomiter, can be most commonly found in eastern North America, California, as well as many subtropical countries around the world. They are mostly found growing near human populations. As a result, they are one of the most commonly misidentified species. The nature of the poisoning is mostly gastrointestinal, hence the nickname “The Vomiter” [7].
A concerning trend is the increasing number of fatalities due to the ingestion of toxic mushrooms, as more people participate in back-to-nature activities without adequate knowledge of fungi. As of 2024, there has been a lack of research studies regarding mushroom species recognition using machine learning in Malaysia specifically. Identifying mushroom species is crucial not only for medical providers to administer appropriate treatments to counteract toxins, but also to help the public gain more knowledge about fungi. Therefore, this project aims to address the lack of mushroom species recognition systems, specifically focusing on mushrooms found in Malaysia.
Especially in recent years, back-to-nature activities such as hiking and jungle trekking have been gaining popularity rapidly. It is important for people to have some form of environmental education to be aware of the risks that come with ingesting unknown species of mushrooms. This project also aims to foster environmental stewardship among people. Environmental stewardship helps people to develop a lifelong appreciation and understanding of nature, its resources, and its biodiversity, as well as how to conserve and preserve the biodiversity of Malaysia.
When identifying mushrooms for research purposes or for gastronomy purposes, experts tend to rely on traditional methods. This can potentially lead to human error and to loss of life in the worst-case scenario. Mushrooms tend to be identified based on the following characteristics: cap characteristics such as the texture and color, bruises on the mushroom, odor, characteristics of the gill such as the color, attachment, and spacing, stalk surface, veil color, and many more. However, examining the mushrooms visually can often lead to subjective interpretations that can prove fatal. Figure 1 is an example of how edible and poisonous mushrooms can look alike.
There have been a few attempts at using machine learning to identify the edibility of mushrooms. The studies can be broken down into two parts: traditional machine learning and deep learning. One of the methods proposed is to use the K-Nearest Neighbor classifier with the Gaussian Naïve Bayes algorithm [8]. Other methods include using other machine learning algorithms such as K-Nearest Neighbor as a standalone [9,10], Support Vector Machine (SVM) [9,10], and decision trees. In deep learning attempts, VGG16, Inception-v3 [9,11], and MobileNet [12] have been used.
The proposed algorithm in [8] is an ensemble of the Naive Bayes algorithm paired with K-Nearest Neighbor as the classifier. The dataset used was obtained from the UCI Machine Learning Repository and included only two classes: edible mushrooms and poisonous mushrooms. The data were split into 4208 entries for edible mushrooms and 3916 entries for poisonous mushrooms, for a total of 8124 entries. The feature extraction used was morphological features. The accuracy achieved with the Naive Bayes algorithm alone was 90.21%, which was then further improved to 100%. In a study conducted by [9], which used the K-Nearest Neighbor algorithm, the highest recorded accuracy for their attempt was 94.4% for their model trained on eigen features. In a legume species recognition system proposed by [10], an accuracy of 76% was achieved on 5400 images with a specificity of 99.10%, edging out the deep learning models used in the study by more than 10%. In the same study, VGG-16 was also used. It managed to achieve an accuracy of 93.79%; however, it was outperformed by Inception-v3. In a study conducted by [11], the accuracy achieved for SVM was 100%. It utilizes the dataset obtained from the UCI Machine Learning Repository. The model has been tested using 10-fold cross-validation to obtain the average accuracy of the model. It is on par with C4.5 algorithm in terms of accuracy, which is 100%, however it loses out on processing time as it is slower by 6.67 s. In the study conducted by [9], the SVM algorithm did not perform well, as it only scored 58.3% in accuracy when trained on eigen features with real dimensions. It scored 83% when trained on eigen features with virtual dimensions, and 86.1% when trained on parametric features (contrast, skewness, kurtosis, entropy, mean, standard deviation, energy, correlation, and homogeneity). It achieved its highest accuracy when trained on histogram features.
Despite the progress made with machine learning, there remain opportunities for further improvement. For example, deep learning allows for automatic feature extraction and can achieve a higher accuracy when using a large dataset. In a study conducted by [13], the highest accuracy achieved was 84% with VGG-16, followed by Inception-v3 with 82%. Both models were trained on raw images only. In another comparison with models trained on contrast-enhanced images, Inception-v3 achieved an accuracy of 88%, followed by VGG16 with 84%. In another study by [12], the accuracy achieved by their Mobilenet-V2_GAP_flatten_fc model was 97.20% in their testing dataset which contained five classes.
According to the literature, there is a scarcity of research on classifying mushroom species, particularly within the context of Malaysia. The majority of existing studies primarily concentrate on distinguishing mushrooms as either edible or inedible. Other than that, the majority of current research studies utilize a text-based dataset which is based on hypothetical scenarios of where certain mushrooms can be found. This study aims to develop a novel machine learning and image processing-based system for recognizing mushrooms species in Malaysia. This can be divided into two stages: first, curating a unique dataset tailored to Malaysia’s ecology, and second, introducing a deep learning model for recognizing mushroom species using an image-based dataset. Additionally, this study also compares the performance of the traditional convolutional neural network architecture against a novel transformer architecture with the same task, under the same parameters. The experiment shows promising results and proves that deep learning can be used to identify different species of mushrooms using an image-based dataset. The ViT-L/16 model is particularly promising as it has the highest accuracy among all other models tested. The model also exhibits the highest recall and precision which is important for it to be practically applicable. Although there is always room for improvement, this paper can serve as a basis for future researchers to conduct more in-depth studies in this area.

2. Dataset

The dataset used in this study was curated from the website https://www.inaturalist.org/ (accessed on 16 July 2024) [14]. The species of mushrooms included in this study are mushrooms that can be found naturally in Malaysia [15]. The list of mushrooms are as follows (NE stands for “non-edible”, E stands for “edible”): Amanita vaginata (NE), Armillaria mellea (E), Boletus reticulatus (E), Chlorophyllum molybdites (NE), Coltricia perennis (NE), Coprinellus disseminatus (E), Coprinopsis lagopus (NE), Cortinarius violaceus (NE), Entoloma murrayi (NE), Flammulina velutipes (E), Laccaria laccata (E), Macrolepiota procera (E), Mycena epipterygia (NE), Mycena pura (NE), Panus conchatus (NE), Panus lecomtei (E), Phallus indusiatus (E), Pleurotus ostreatus (E), Suillus granulatus (E), and Tylopilus plumbeoviolaceus (NE). The dataset consists of 20,000 images across 20 classes, and each class consists of 1000 images of which 600 per class was used for training, 200 was used for validation, and 200 was used for testing. Only “Research-Grade” images were used for the dataset. An image is certified “Research-Grade” when 2/3 of iNaturalist identifiers agree on the taxon [16].
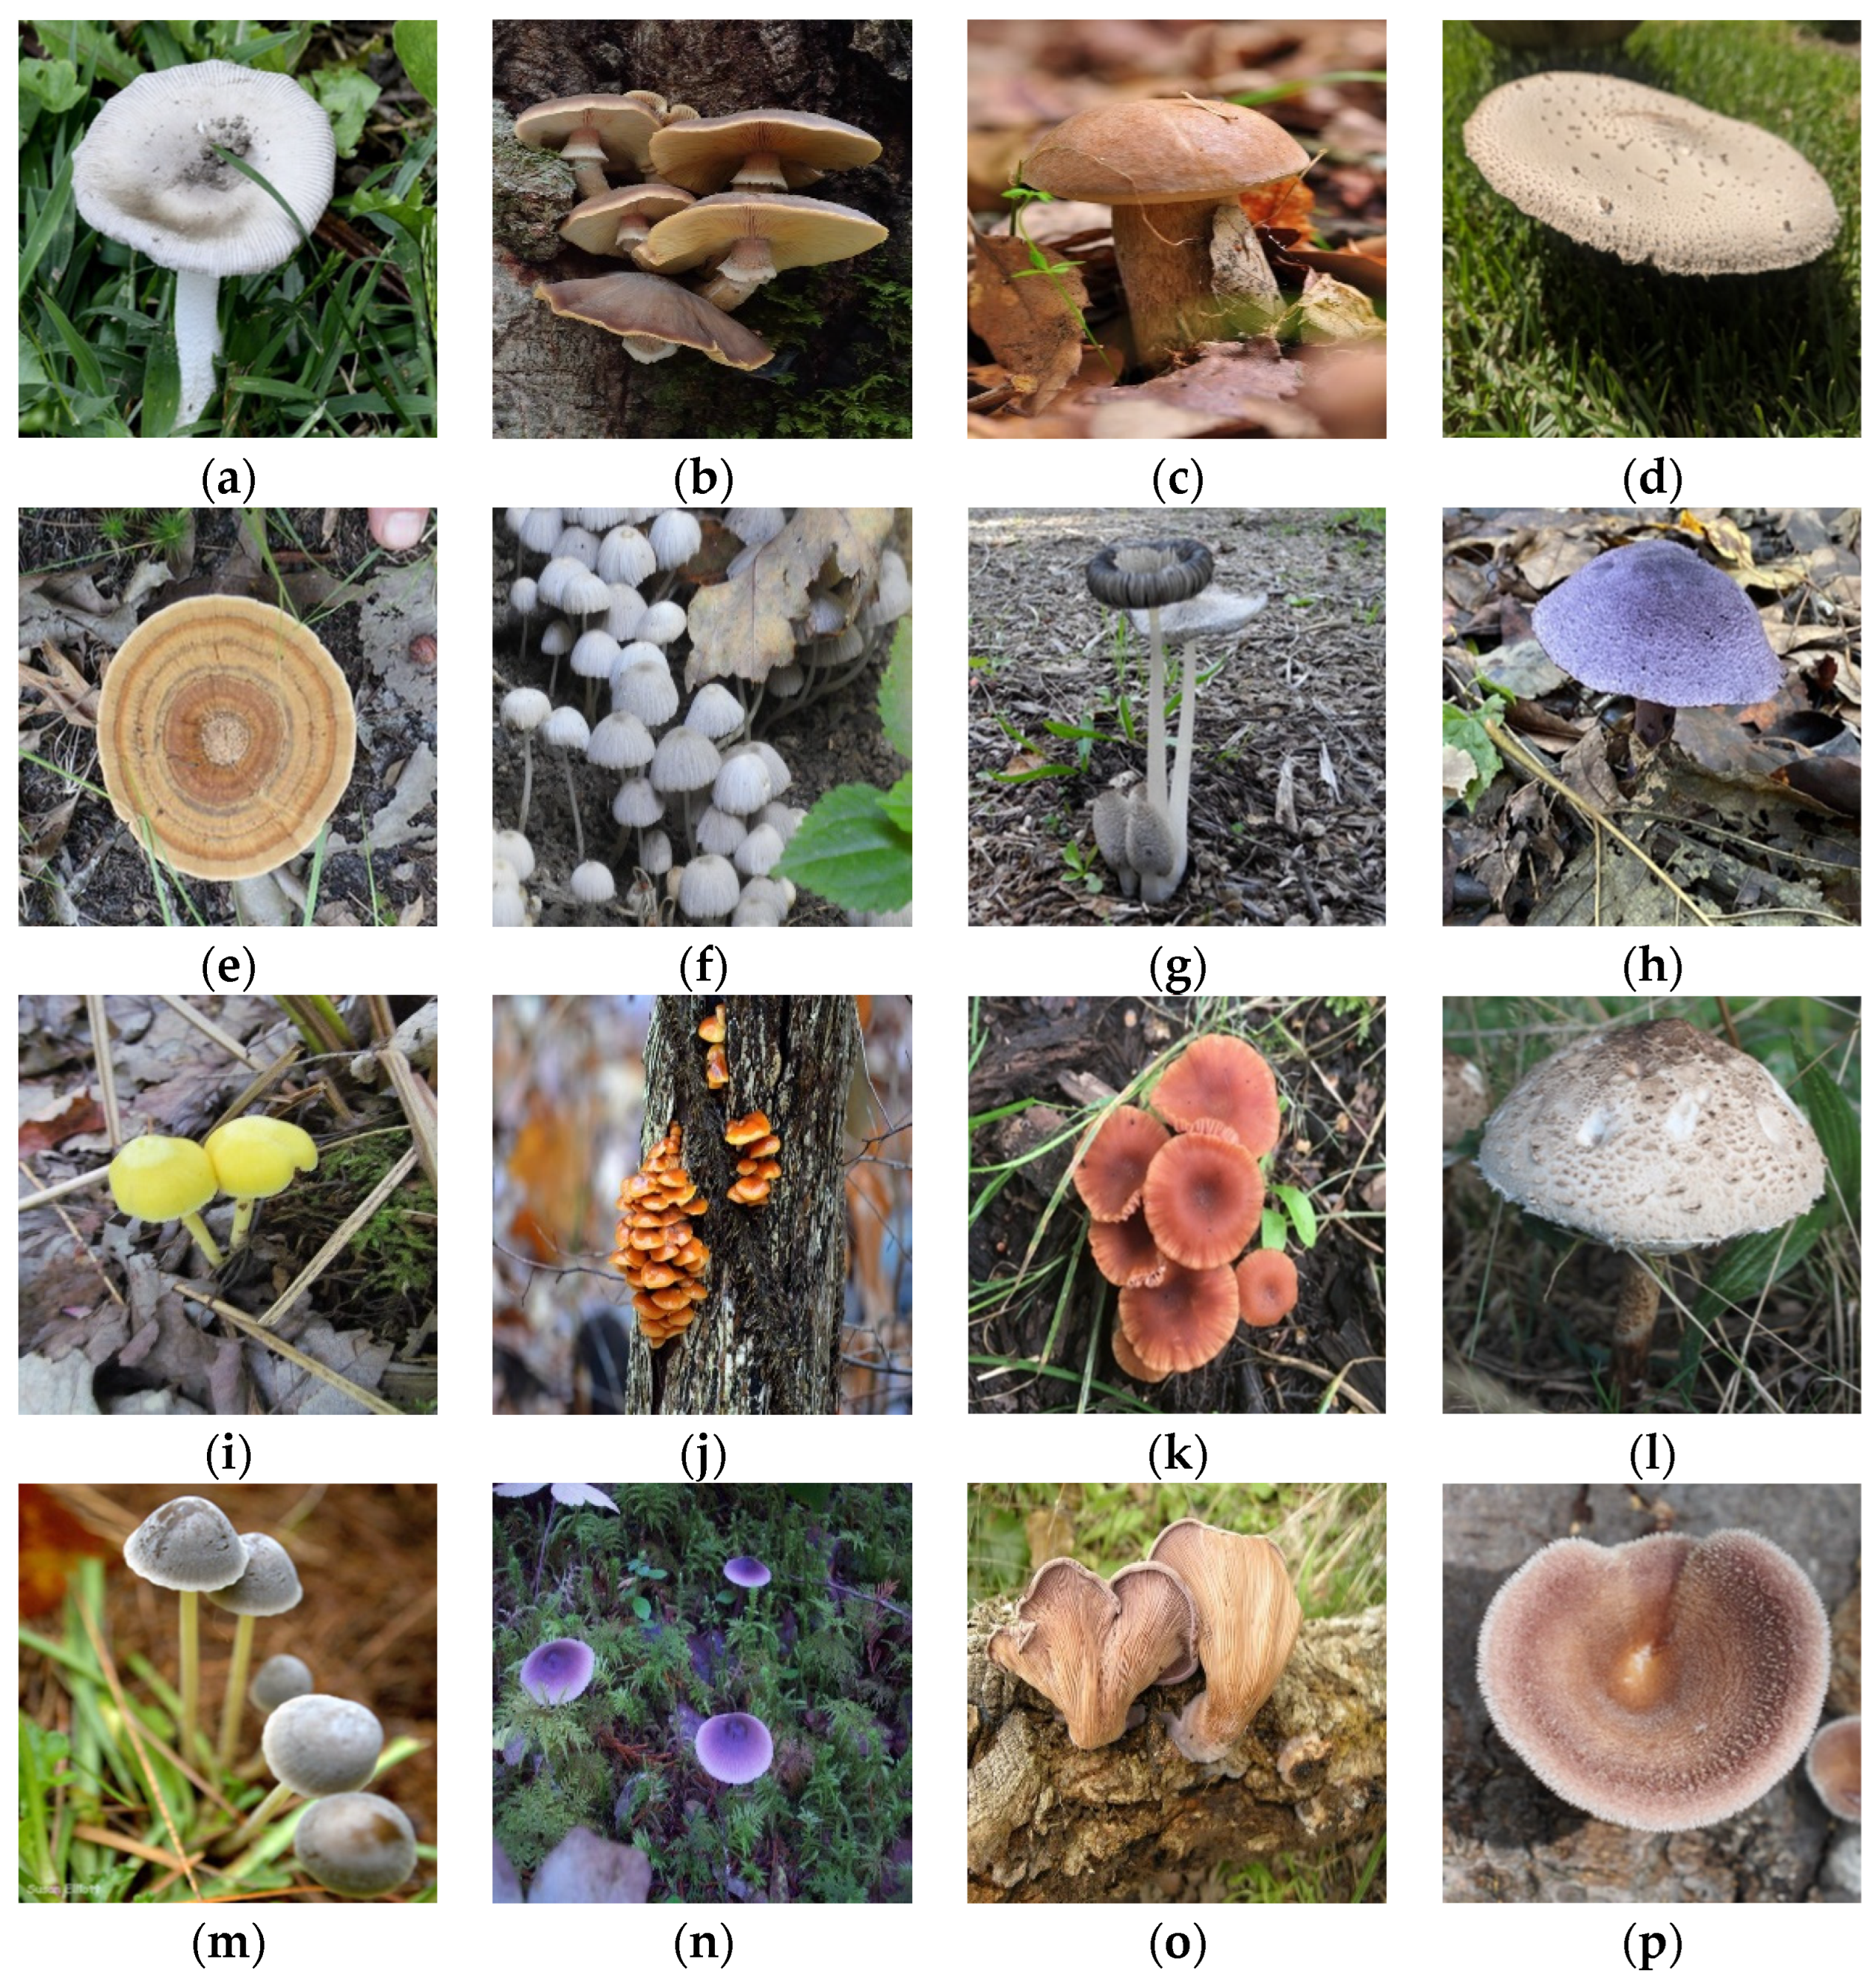
A csv file with the image URL was exported, and a python script was used to automate the downloading process. The images were further filtered to remove suspicious and irrelevant images. The dataset is available upon request from the authors. Figure 2 shows a sample of each species used in the dataset.

3. Methods

3.1. Computer Vision for Image Classification

Computer vision is a field of artificial intelligence and computer science that focuses on enabling computers to interpret and make decisions based on visual data. The objective of computer vision is to replicate the human visual system and to apply it onto machines to understand and process visual information in a way that is similar to a human, which can be both useful and meaningful.
Computer vision has been used in a variety of tasks in many fields such as the medical field for COVID-19 classification from CT chest images [17], the ecology field for marsh grass classification [18], the cybersecurity field for an intrusion detection system [19], and the engineering field for damage detection in plates [20]. Such promising performance is the reason why ResNet and Vision Transformer were chosen for this specific task as they are designed primarily for image-based tasks.
In this study, an image-based dataset was curated. This decision was in light of the drawbacks with using a text-based dataset. Text-based datasets do not contain the visual features necessary for image classification tasks. They only provide descriptive information about the tasks which can be ambiguous or subjective. Different people might describe the same object in different ways, leading to inconsistencies in the dataset. Previous research studies mostly utilized the text-based dataset from the UCI Machine Learning Repository, which may lead to the aforementioned limitations.

3.2. Vision Transformer

The Vision Transformer model is a novel approach to image recognition that applies the Transformer architecture to sequences of image patches. The study follows a successful attempt of using transformers in natural language processing (NLP) tasks [21,22]. The ViT model follows the original Transformer design but with an emphasis on simplicity and scalability. It also solves the issues regarding CNN such as poor generalization when trained on insufficient data because it can achieve good results when pre-trained on larger datasets and then transferred to tasks with fewer data points. Since ViT can achieve high accuracy on tasks involving ImageNet, CIFAR-100, ImageNet-Real, and VTAB suite of 19 tasks, it can effectively solve the generalization and performance issues when CNN is trained on limited data [21].
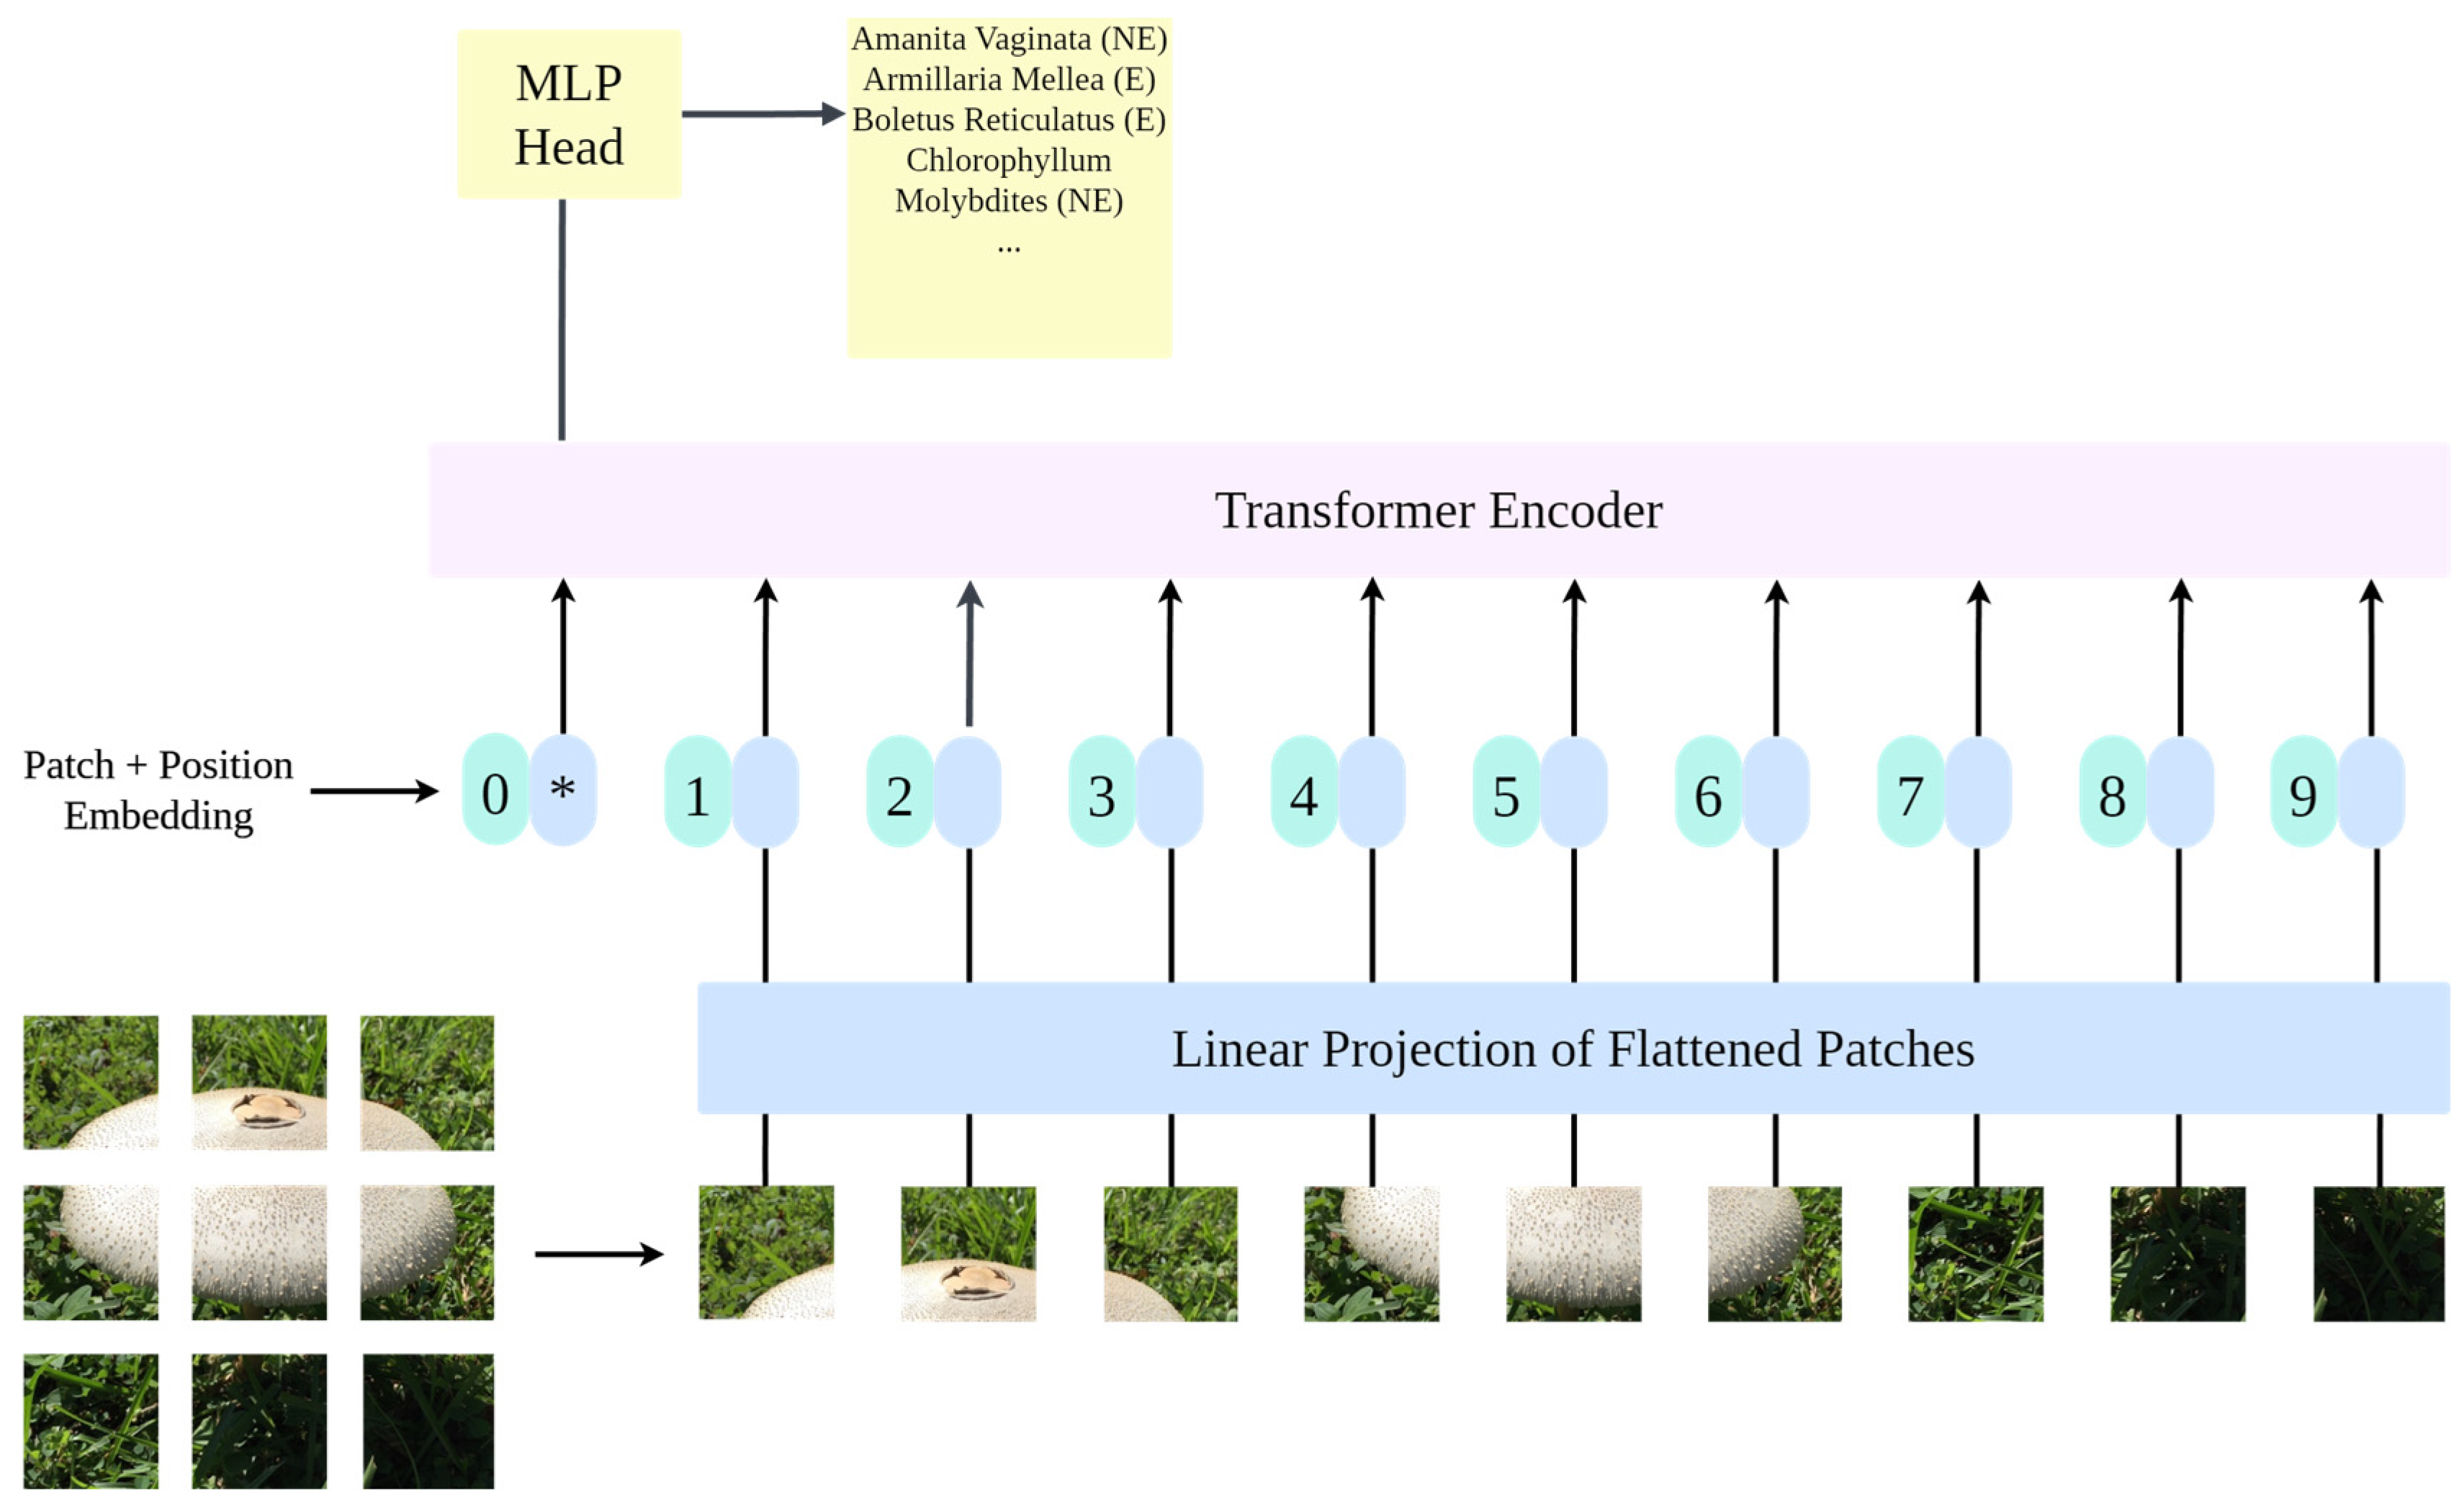
In Vision Transformer, the input image is divided into fixed-sized patches. Each patch is flattened into a 1D vector and these flattened patches are then linearly projected into lower-dimensional embeddings. Each patch embedding retains spatial information about its location in the original image. Positional encodings are added to the patch embeddings to provide the model with information about the absolute and relative positions of the patches. The transformer encoder consists of multiple layers of self-attention mechanisms followed by feed-forward neural networks (FFNNs). In the self-attention mechanism, each patch embedding attends to all other patch embeddings to capture global dependencies and relations. The FFNNs process the attended representations from the self-attention layer independently. After passing through the Transformer encoder, the final token embeddings are used for classification tasks. This token aggregates information from all the patches and contains global information about the entire image. This token is fed into a classification head, which is a fully connected layer, to make predictions for the given task. Figure 3 is a proposed example of a Vision Transformer model for mushroom species classification [21].
The following formulas provide the input sequence z of ViT, where x represents an image patch. The formulas for ViT are as follows [21]:
z 0 = x c l a s s ; x p 1 Ε ;     ; x p N + Ε p o s ,           Ε R P 2 C × D ,       Ε p o s R ( N + 1 ) × D
z l = Μ S A L Ν z l 1 + z l 1 ,             l = 1 L
z l = Μ L P L Ν z l + z l ,             l = 1 L

3.3. ResNet

ResNet is a deep convolutional neural network architecture designed to address the problem of vanishing gradients during the training of deeper networks. ResNet addresses this issue by introducing skip connections, also known as shortcuts, that can bypass one or more layers. These shortcuts allow the gradients to flow directly through the network, thus mitigating the vanishing gradient problem and enabling the training of very deep networks [23].
The input image will first pass through a series of convolutional layers, which extract hierarchical features from the image. ResNet uses residual blocks as its main components. Each residual block consists of two or more convolutional layers followed by skip connections that bypass one or more layers. Multiple residual blocks are stacked on top of each other to form the structure of the architecture. Within the network, downsampling operations are used to reduce the spatial dimensions of the feature maps while increasing the number of channels. Downsampling also helps capture hierarchical features at different scales and reduces computational complexity. A global average pooling layer is typically applied to the feature maps after the stacking of residual blocks. The output of the global average pooling layer is passed through the layers which learns to map the features to the output classes. Then, a softmax activation function is applied to produce the predicted probability distribution over the classes. Figure 4 is an example of the ResNet-18 architecture [23].

4. Experiment

4.1. Experiment Settings

The pretrained architectures used in this experiment are as follows: (1) ResNet-18, (2) ResNet-34, (3) ResNet-50, (4) ResNet-101, (5) ResNet-152, (6) ViT-B/16, (7) ViT-B/32, (8) ViT-L/16, and (9) ViT-L/32.
For the ResNet models, the numbers behind the models indicate the depth of the network, or the number of layers. For example, ResNet-18 has 18 layers. For ViT models, the variants are divided into B for base and L for large. The number following the letter means the dimension of the input patches; for example, ViT-B/16 means that it is the ViT Base model with 16×16 input patches.
These models are fine-tuned to follow the principles of transfer learning. Transfer learning consists in transferring knowledge learned from a first task to a second different but relevant task [24]. The pretrained model weights were pretrained on the ImageNet dataset to obtain a low-level feature extractor for its tasks [20]. The final layer of all pretrained models were changed to a custom layer to match the number of classes. The hyperparameters of all models were configured manually to ensure a fair test environment. The hyperparameters set were as follows: a learning rate of 0.001, number of epochs: 30, batch size: 16, and SGD optimizer. The hardware used for this experiment were two desktops with Intel(R) i7-8700 CPU (3.20 GHz), NVIDIA GeForce GTX1080, and 16 GB memory. The model training was conducted using Jupyter Notebook.

4.2. Data Augmentation

Data augmentation was applied to the dataset to obtain a more varied set of inputs. The images were augmented using the v2 version of the transforms function from Pytorch’s torchvision library.
The functions used for the training dataset were as follows: RandomResizedCrop(224), RandomHorizontalFlip(), ToTensor(), and Normalize([0.485, 0.456, 0.406], [0.229, 0.224, 0.225]). The functions used for the validation dataset were as follows: Resize(256), RandomResizedCrop(224), ToTensor(), and Normalize([0.485, 0.456, 0.406], [0.229, 0.224, 0.225]). The functions used for the testing dataset were as follows: Resize(256), CenterCrop(224), ToTensor(), and Normalize([0.485, 0.456, 0.406], [0.229, 0.224, 0.225]).

4.3. Performance Metrics

The confusion matrix was used to assess the model’s performance and to confirm the efficacy of the suggested strategy based on the comparison between the prediction map and the label map.
Accuracy is the ratio of correctly predicted instances to the total number of instances. The equation is as shown in Equation (4).
A c c u r a c y = N u m b e r   o f   C o r r e c t   P r e d i c t i o n s T o t a l   N u m b e r   o f   P r e d i c t i o n s
Precision is the ratio of correctly predicted positive observations to the total predicted positives. It measures how many of the predicted positive instances are actually positive. The equation is as shown in Equation (5).
P r e c i s i o n = T r u e   P o s i t i v e s T r u e   P o s i t i v e s + F a l s e   P o s i t i v e s
Recall is the ratio of correctly predicted positive observations to the total actual positives. The equation is as shown in Equation (6).
R e c a l l = T r u e   P o s i t i v e s T r u e   P o s i t i v e s + F a l s e   N e g a t i v e s
The F1 score is the harmonic means of precision and recall. The equation is as shown in Equation (7).
F 1   S c o r e = 2 × P r e c i s i o n × R e c a l l P r e c i s i o n + R e c a l l

5. Results

Table 1 displays the results of this experiment. The ViT L/16 model outperformed all other models with an accuracy of 90.47%. For ResNet, the best performing model was the ResNet-50 model with an accuracy of 84%, which was about 6% lower than the ViT L/16 model. The performance disparity between the best ViT model and the worst ViT model was only at 5%. The same holds true for ResNet. The worst performing ViT models were the ones which use 32 × 32 input patches. This indicates that they were too complex for the simpler task at hand. For ResNet, the worst performing model was ResNet-18. This indicates that the model was not complex enough to capture the intricate patterns in the data.
Next, the precision, recall, and F1 score of the best performing ViT and ResNet models were compared. The accuracy and recall rate of both models were of the same value, which indicates that both models were performing well albeit one was performing better than the other. For a model to be practically useful, both values must be high.
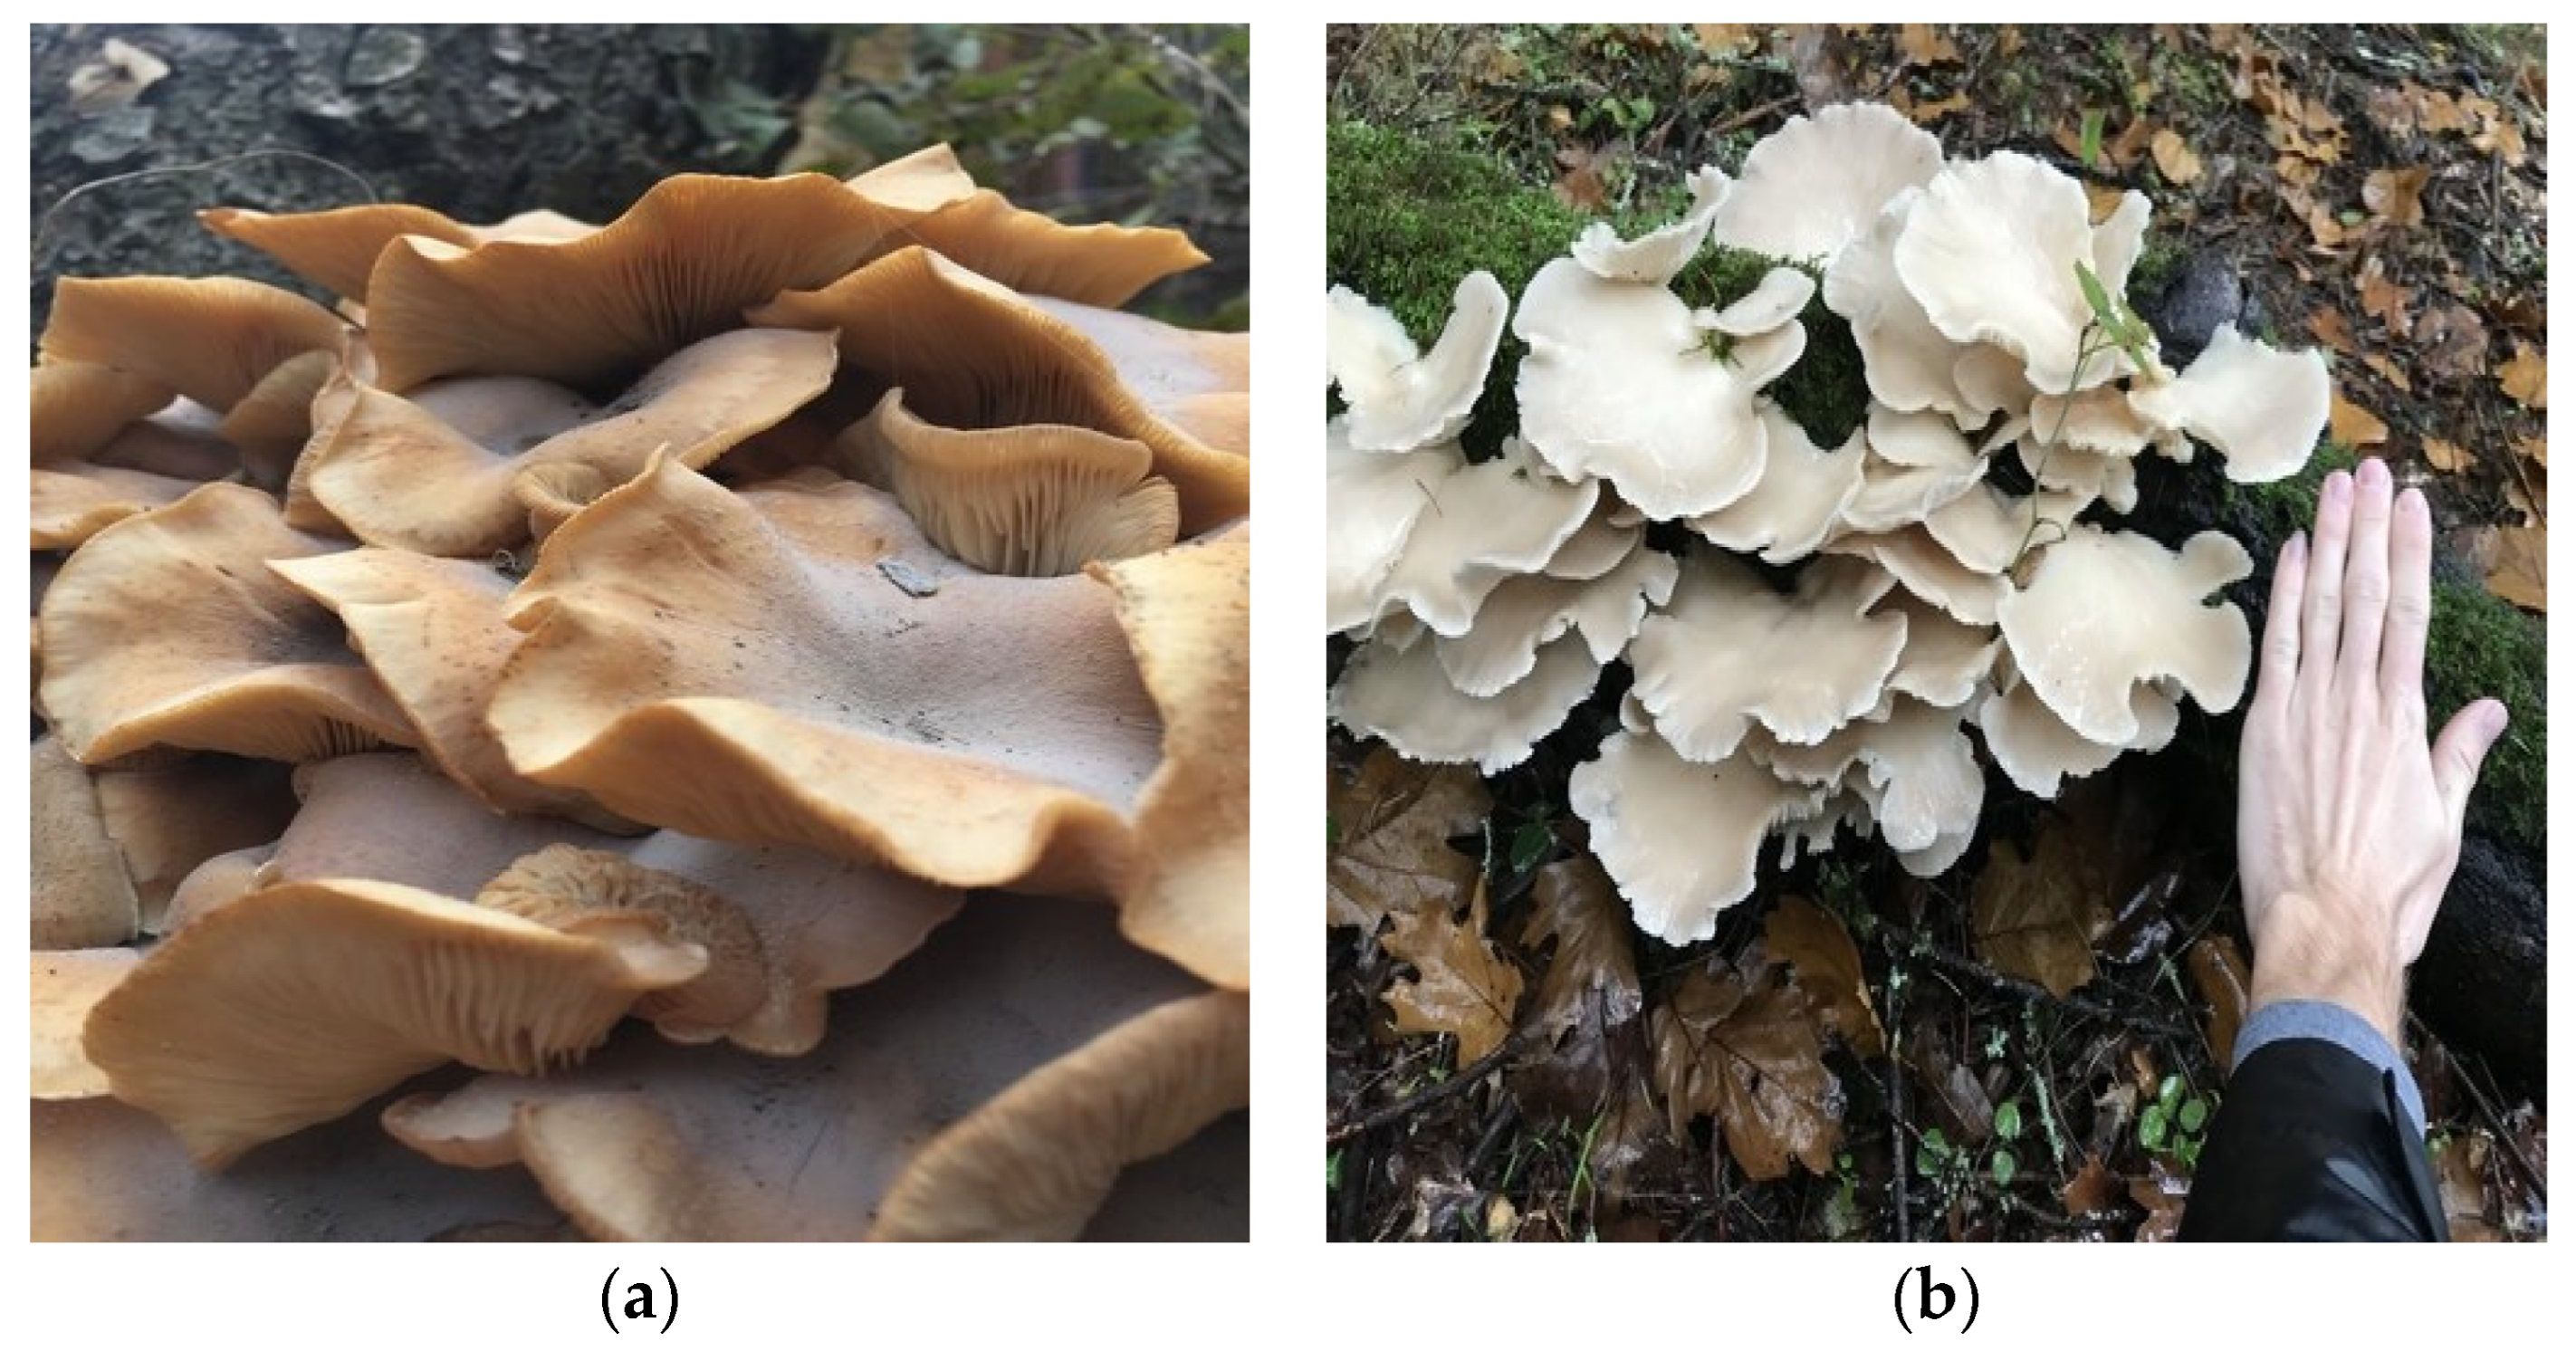
In terms of species accuracy, the most misidentified species was Armillaria mellea. It was mostly misidentified as Pleurotus ostreatus. The outcome was the same across all the models. Figure 5 shows an example on why the mushrooms can potentially be misidentified. They both have similarly wavy shapes when reaching maturity. The species Phallus indusiatus was identified with the highest accuracy, 97% and above, across all models. This could be due to its unusual and unique shape compared to the other mushroom species.
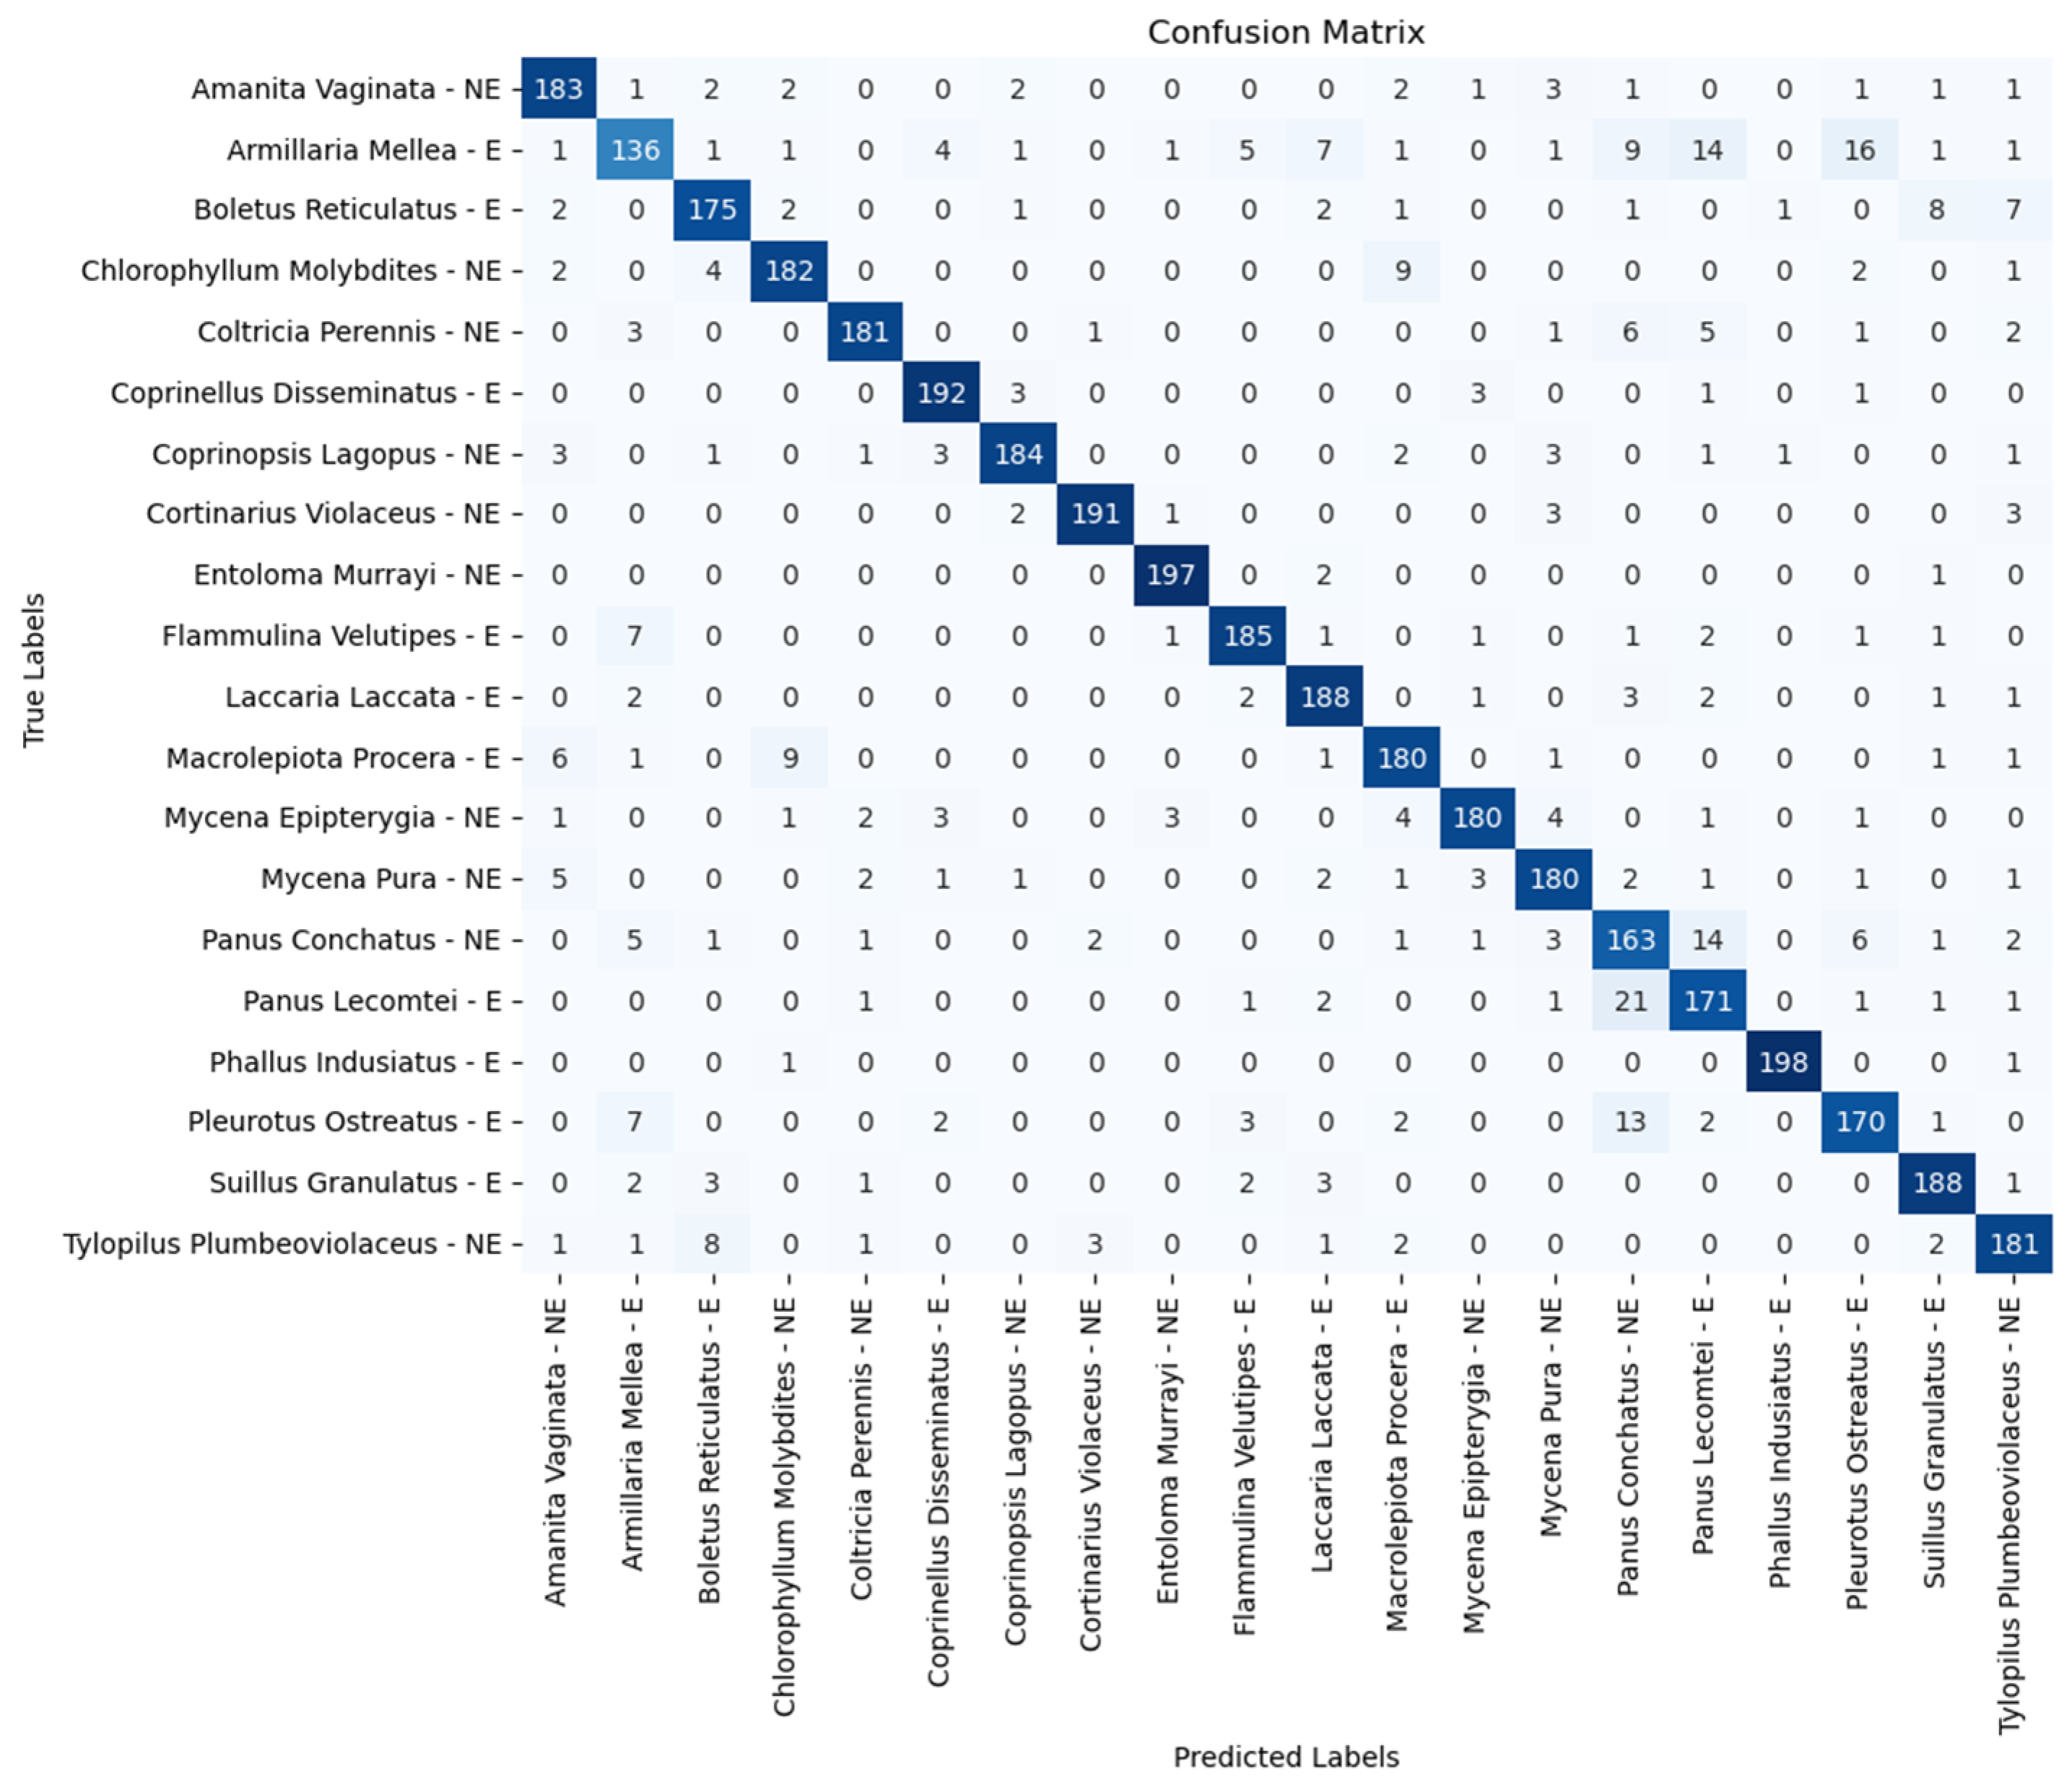
Table 2 and Table 3 show the accuracy in the identification of each species for ViT and ResNet models, respectively. For ViT-L/16, the most misidentified inedible mushroom was Panus conchatus, with an accuracy of 78%. It was mistakenly identified as Panus lecomtei, which is an edible species. However, for the ResNet-50 model, the most misidentified inedible mushroom was Mycena pura. It was often mistaken for Amanita vaginata, also an inedible species. The misidentification of inedible mushrooms as edible is of the utmost concern and should be reviewed in future research.
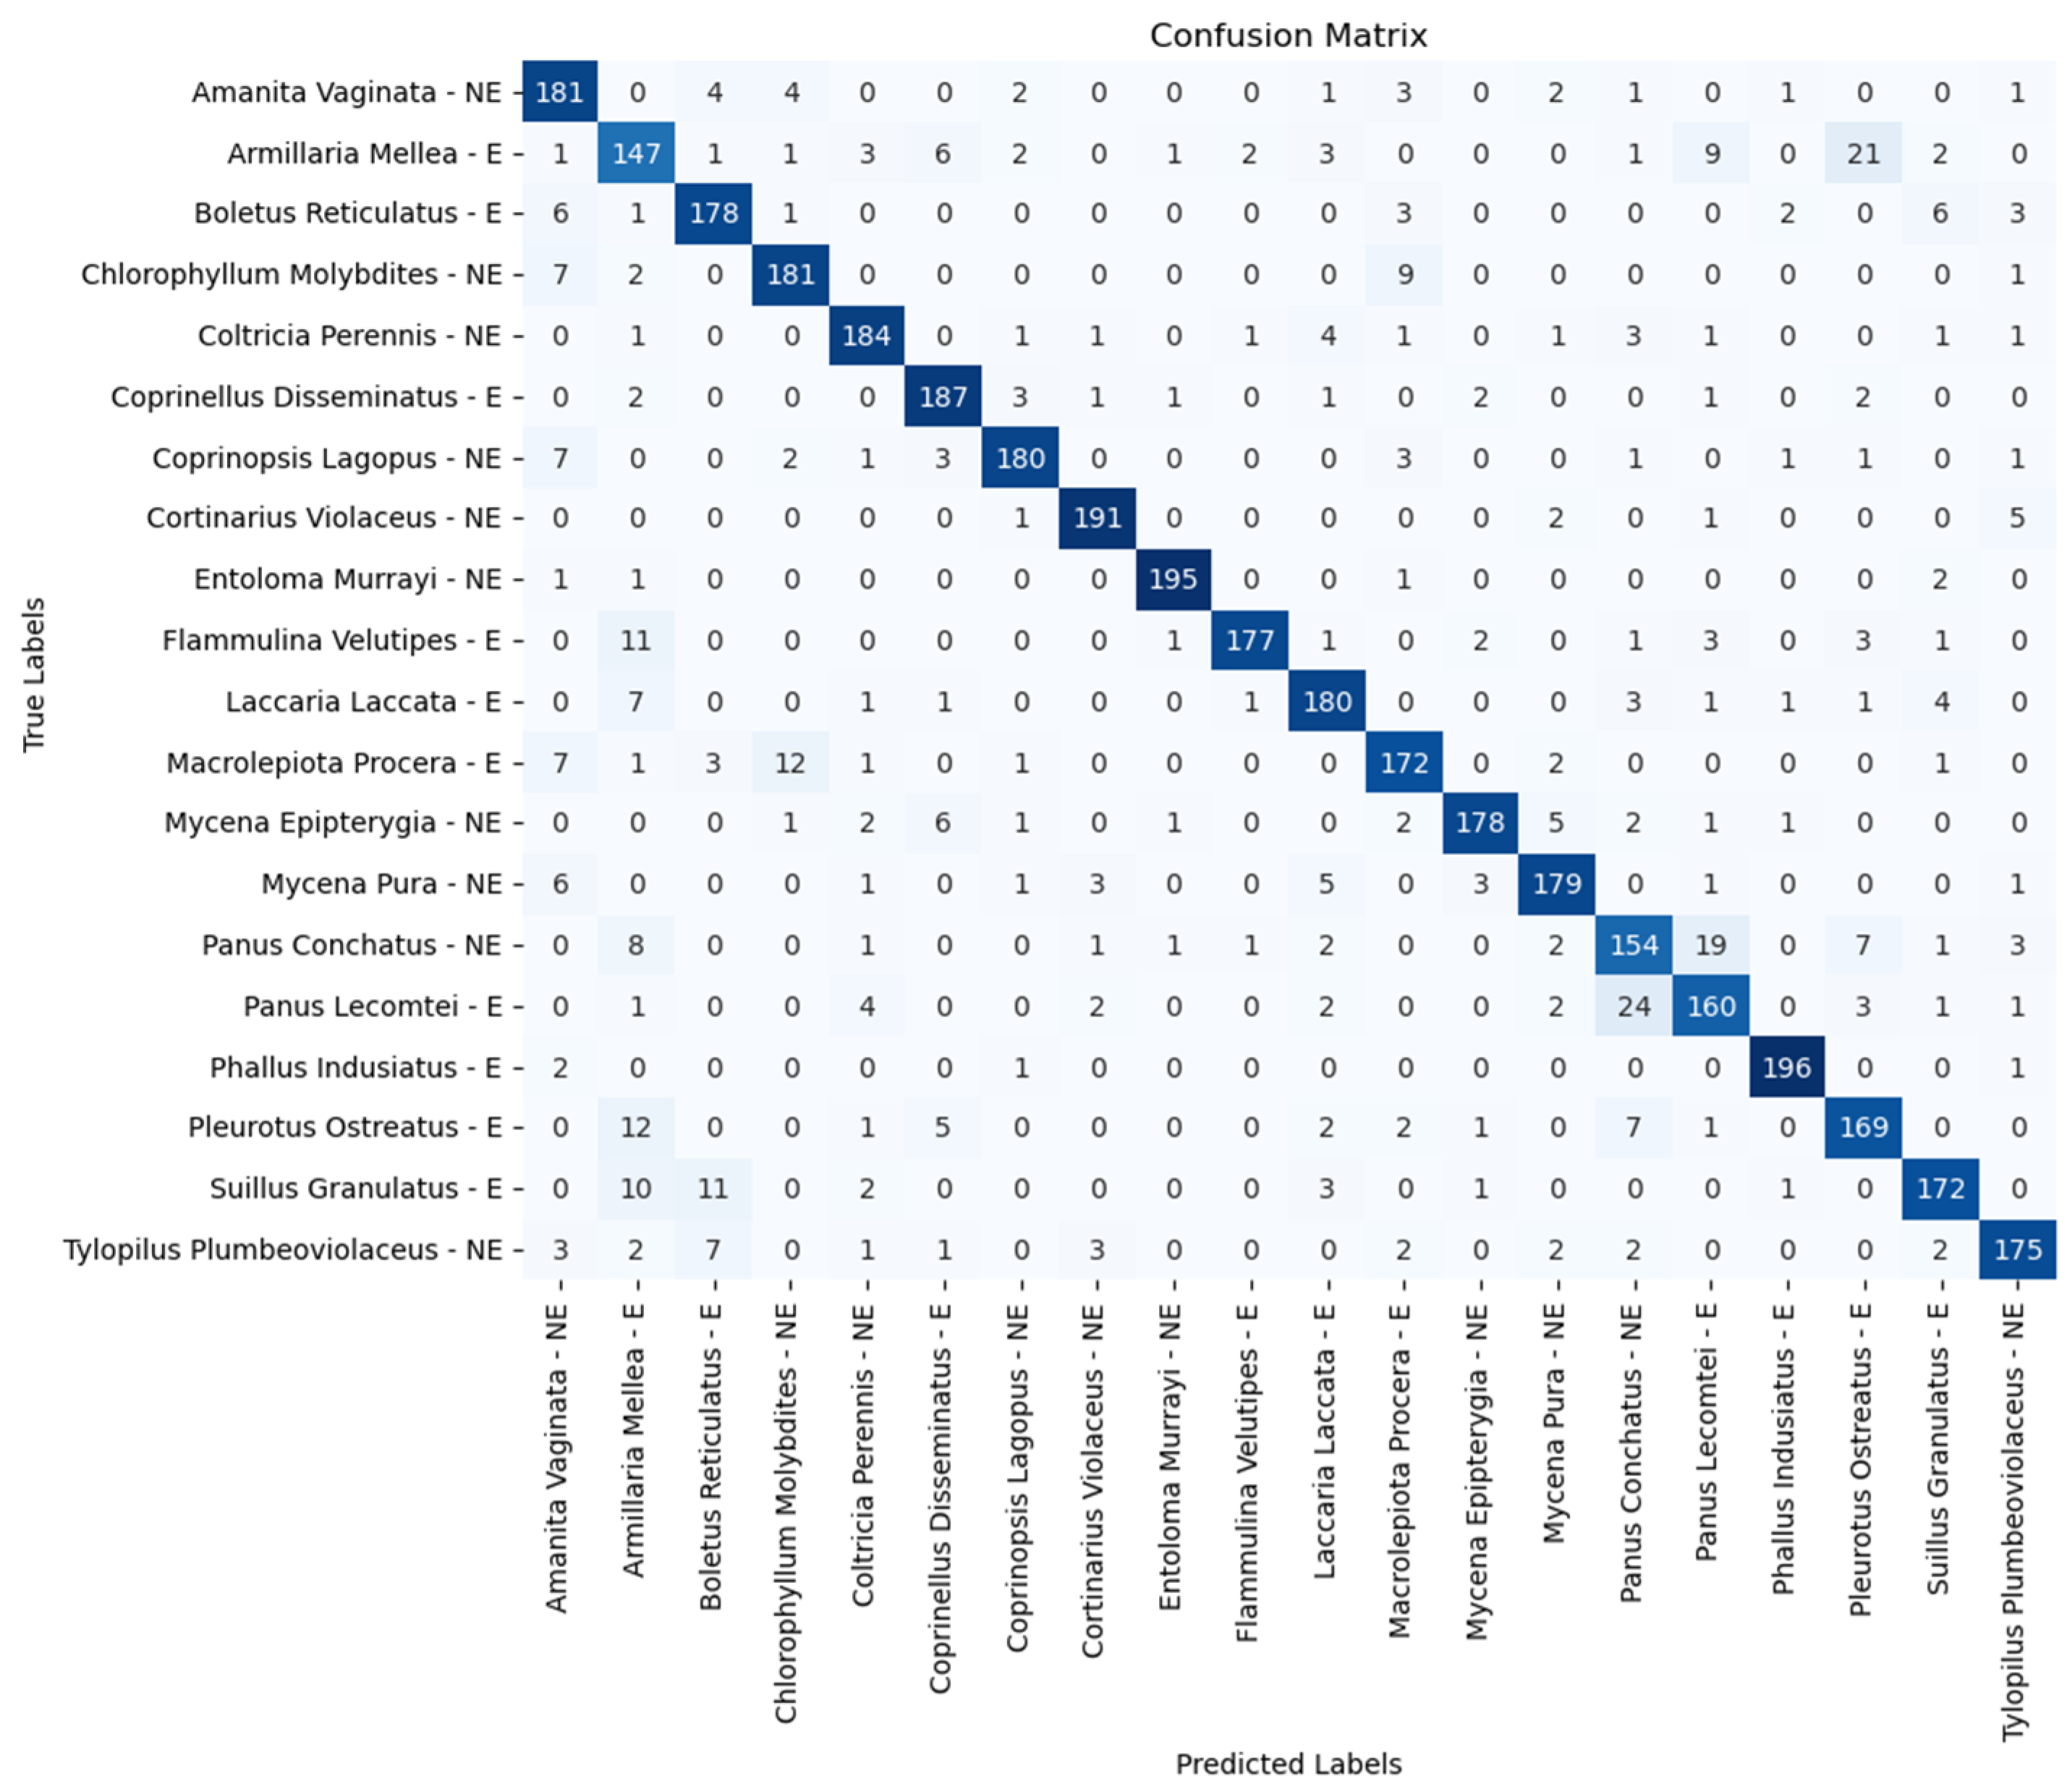
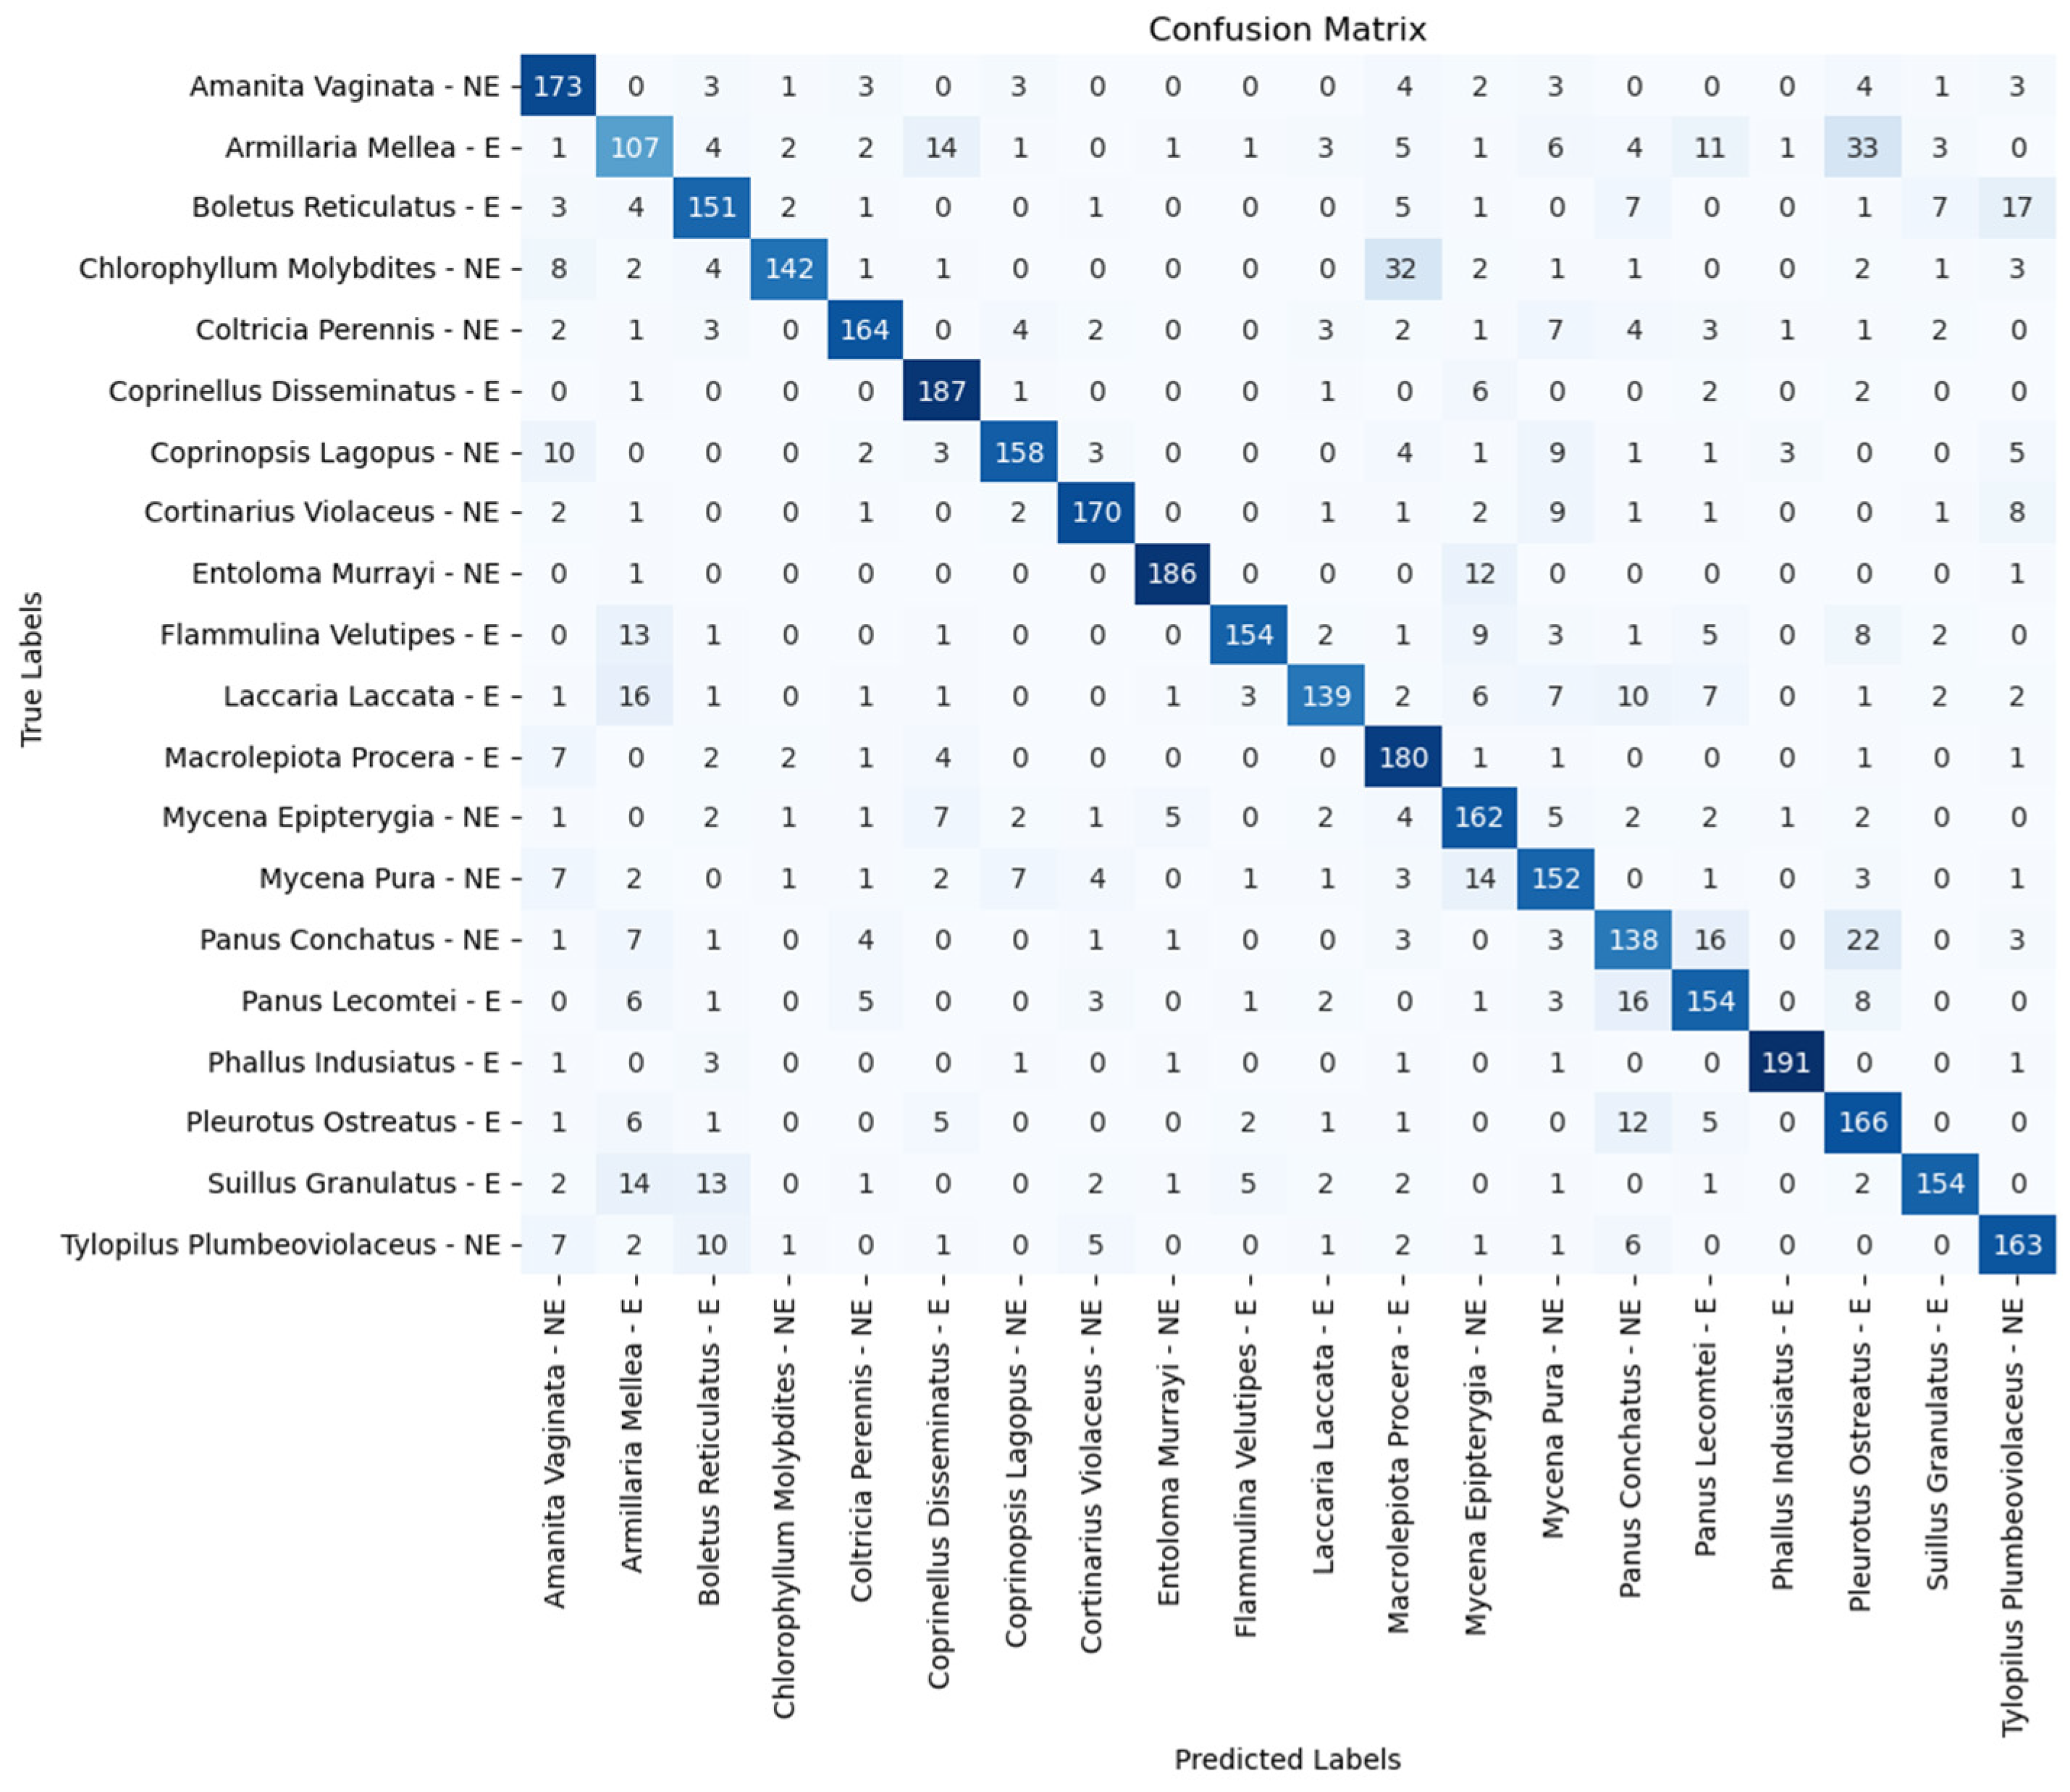
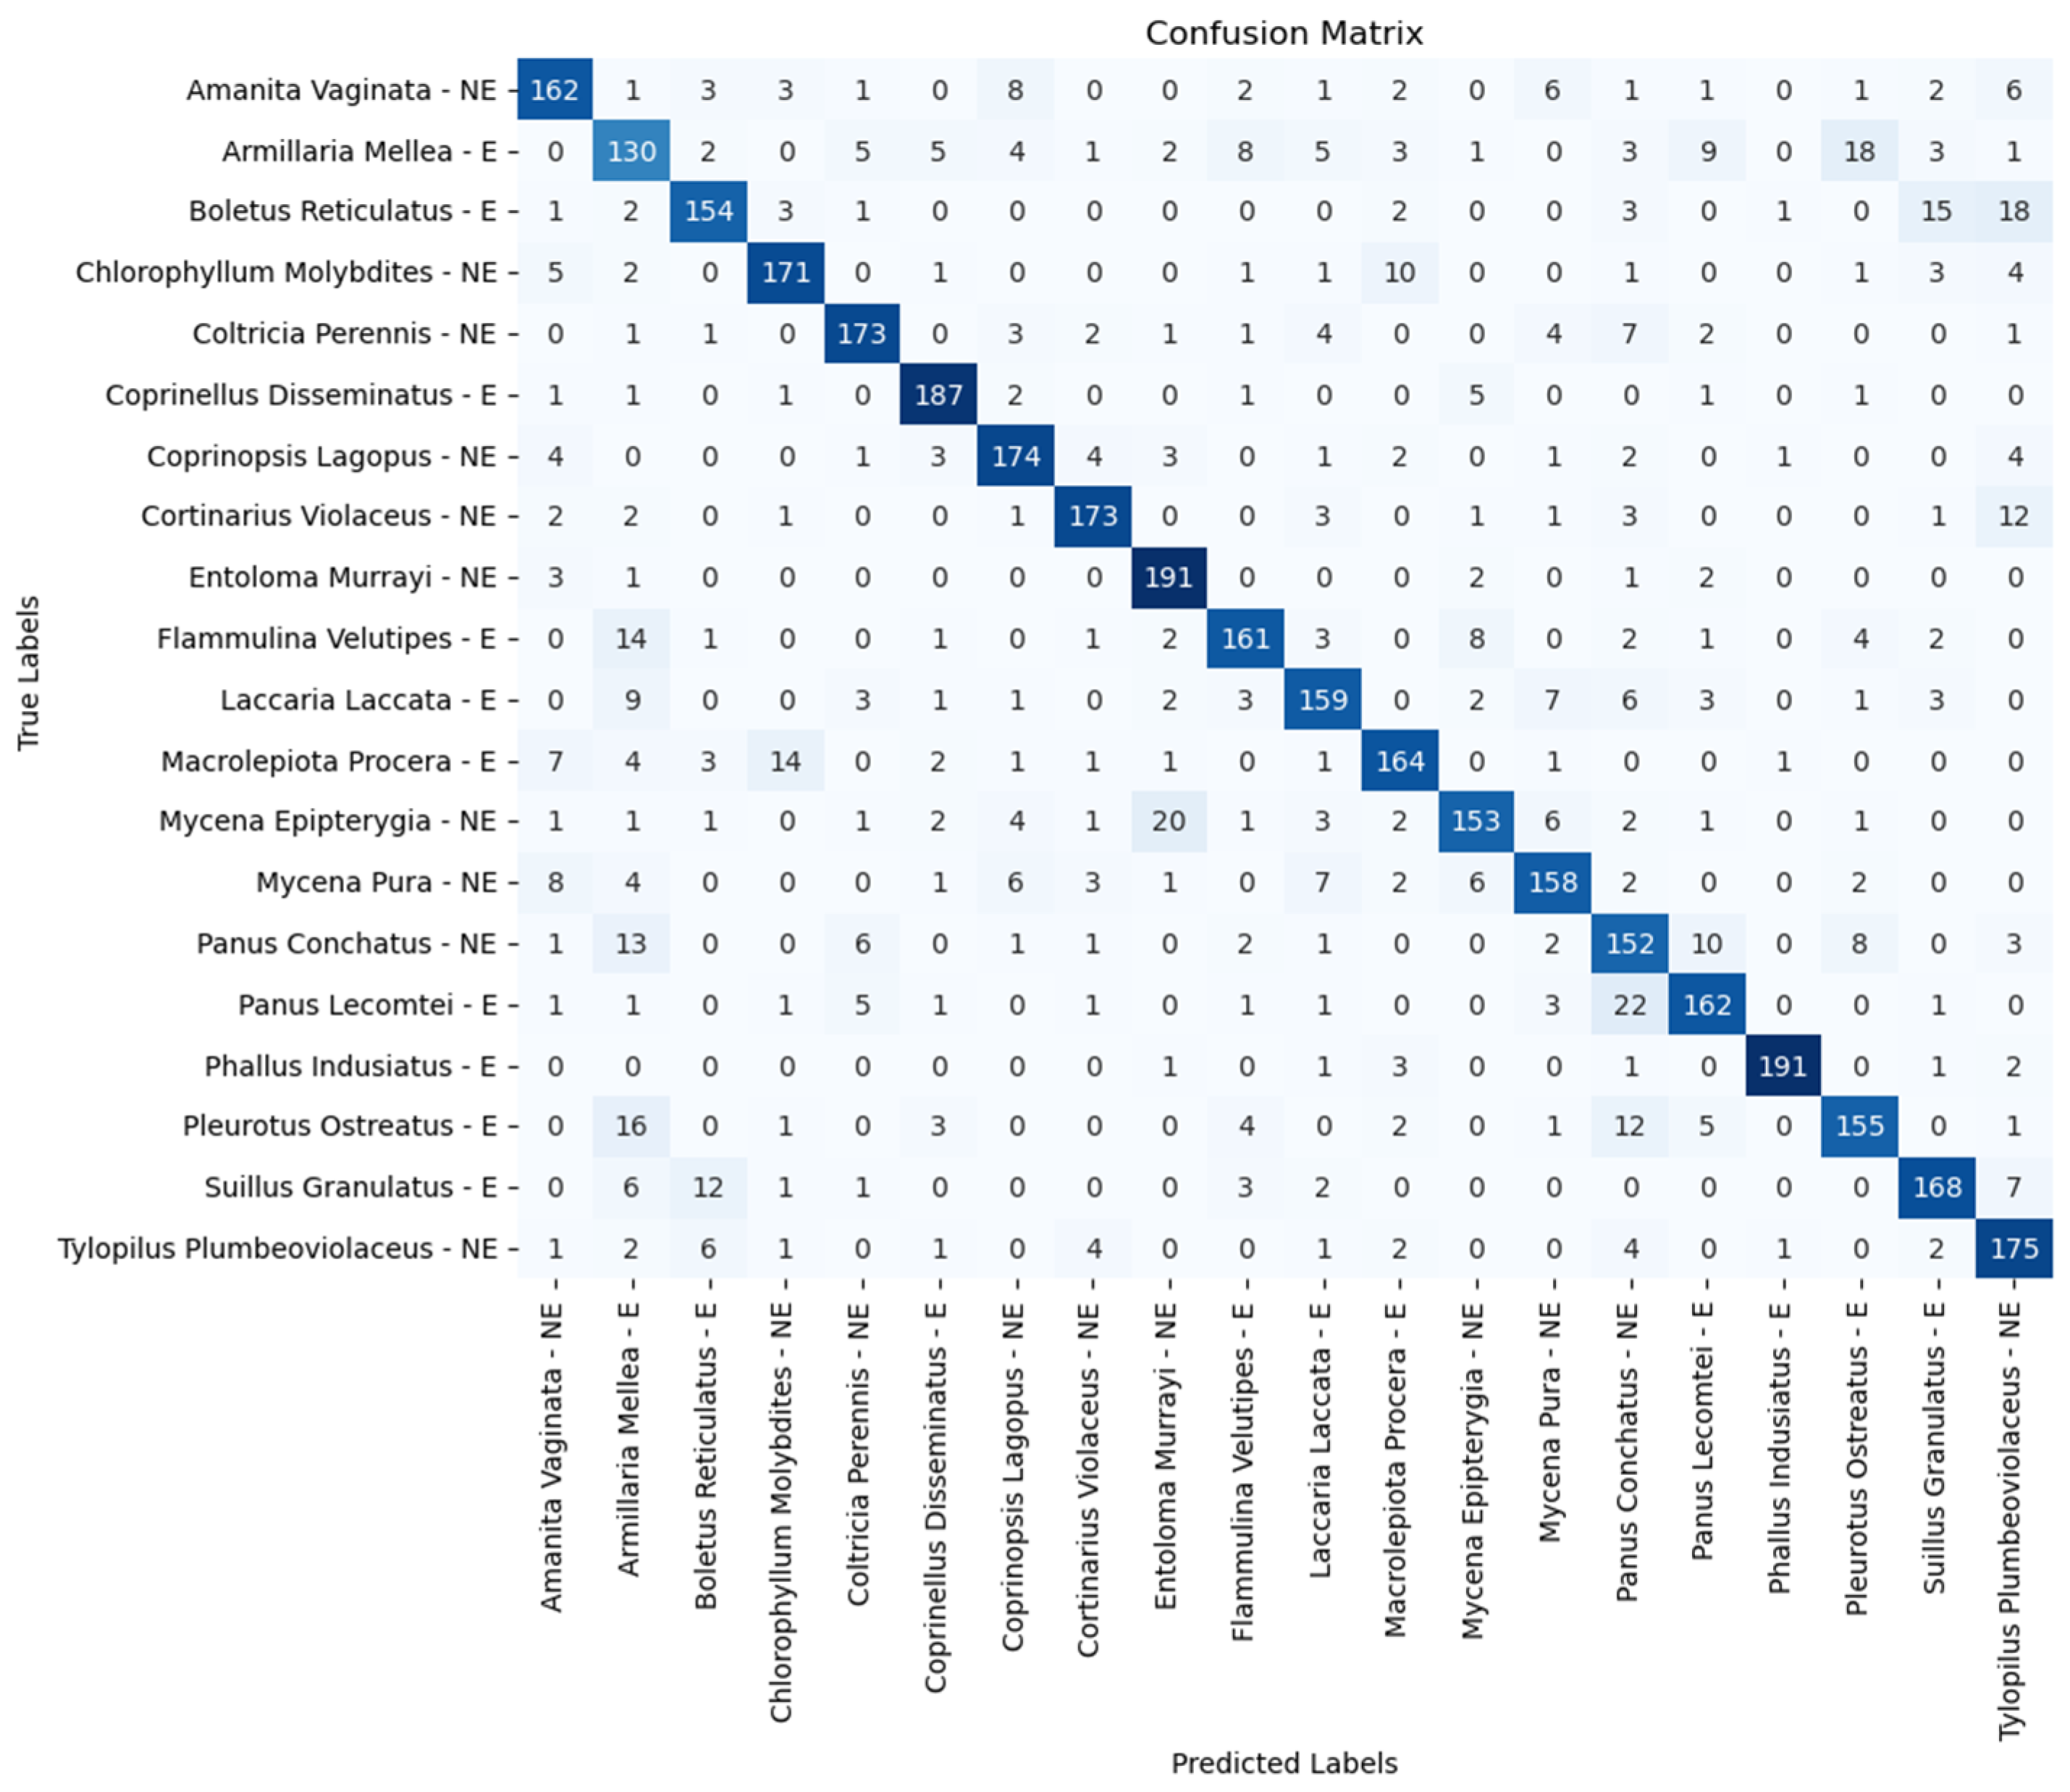
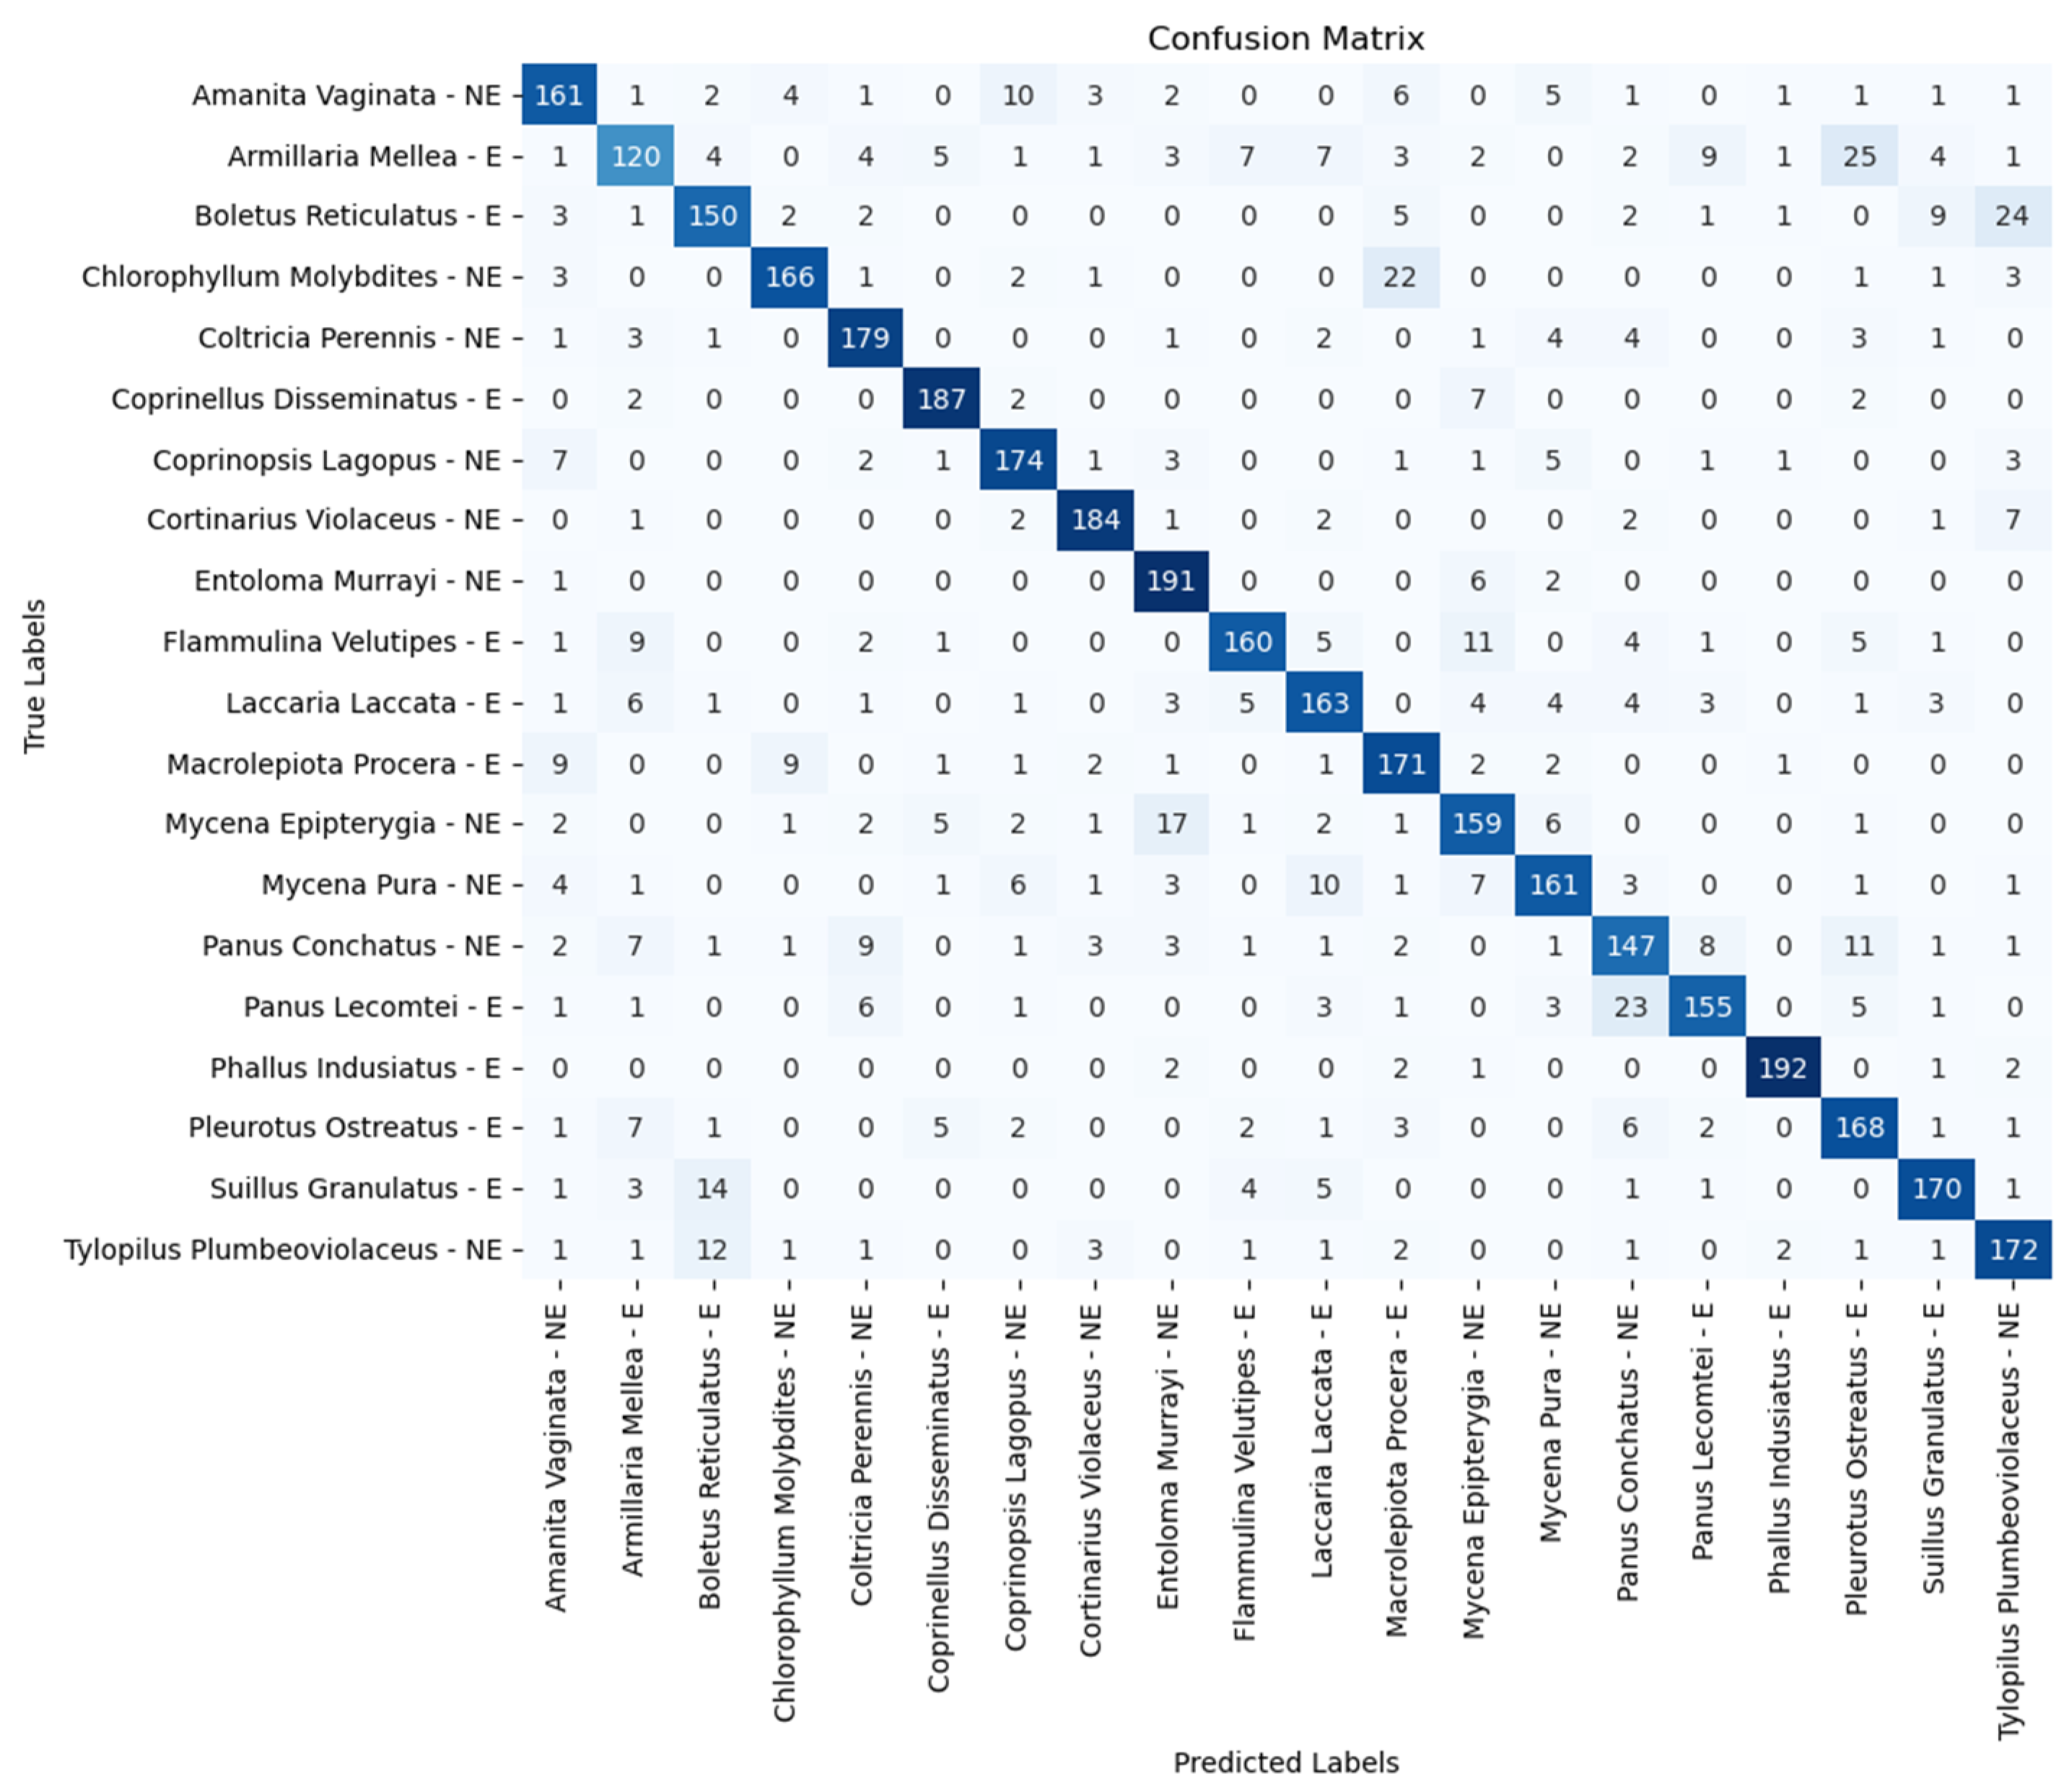
Figure 6, Figure 7, Figure 8, Figure 9, Figure 10, Figure 11, Figure 12, Figure 13 and Figure 14 are the confusion matrixes for all the models used in this experiment. They offer a visual representation of the accuracy of identification for each species of mushroom. They can also provide insight on which species look similar by the model’s standards. They can identify which species are more prone to misidentification, so that in future studies, more steps can be taken to minimize this error.
Figure 6, Figure 7, Figure 8 and Figure 9 are the confusion matrixes for all ViT models. When comparing ViT models, the confusion matrix shows that the models tend to misclassify Armillaria mellea as Ostreatus Pleurotus, Panus Lacomtei, and Coprinellus disseminatus, all of which are edible species. The models showed consistent results except for ViT B-32, which had a higher misclassification value of Armillaria mellea as Coprinellus disseminatus with a 10. The best performing species was Phallus indusiatus, with an identification accuracy of 97% and above. The lowest accuracy for this species was 97.50% from the ViT-B/32 model.
Figure 10, Figure 11, Figure 12, Figure 13 and Figure 14 are the confusion matrixes for all ResNet models. When comparing ResNet models, the confusion matrix shows that all the models also tended to misclassify Armillaria mellea as Pleurotus ostreatus, Coprinellus disseminatus, and Panus lecomtei, which is consistent with the ViT models. However, as the network became deeper, the errors became more varied between more species, with Pleurotus ostreatus still being the highest. This behavior is inconsistent with ViT as the errors with ViT models tended to mostly be only between the three species. Similar to the ViT models, Phallus indusiatus was the best performing species, with accuracies of 95% and above. The worst accuracy of this species was 95.50% from the ResNet-18 and ResNet-101 models.
Across all models, it is apparent that Armillaria mellea was the worst performing species. ViT-L/16 classified 23 instances of Armillaria mellea as Pleurotus ostreatus and 6 instances as Panus lecomtei. ResNet-50 classified 18 instances of Armillaria mellea as Pleurotus ostreatus, followed by 15 instances as Coprinellus disseminatus. It could be that the images used for Armillaria mellea were not diverse enough in terms of stages of maturity or that there were not enough variation of images such as stem, cap, and gills. On the other hand, Phallus indusiatus was the best performing species, with accuracies of over 95.50% across all models. This could be due to its very distinctive shape and features. Future studies should focus on appropriate feature extraction mechanisms to achieve a higher accuracy on the lower performing species.

6. Conclusions

In this study, a deep learning framework for mushroom species classification specific to Malaysia was developed. In the first part of the experiment, a localized dataset of mushrooms was curated to suit the local ecology. In the second stage, various models were trained to classify the species. This approach allowed for the models to effectively classify mushroom species with an acceptable degree of accuracy. For Vision Transformer models, ViT-L/16 was the best across the board with the highest accuracy and recall of 90.47%. For ResNet models, ResNet-50 was the best performing model, with an accuracy and recall of 84%. When comparing both models side by side, the lowest species accuracy of ViT-L/16 was 74.50% for Armillaria mellea, while ResNet-50 was at 61.50% for the same species. In conclusion, ViT-L/16 is the best model for the task of mushroom species classification. This study lays the foundation for the use of deep learning models for mushroom species classification in Malaysia, bridging the knowledge gap concerning local fungi and helping to reduce cases of mushroom poisoning. Environmental education is crucial for raising awareness about the risks associated with ingesting unknown mushroom species. This study fosters environmental stewardship, encouraging people to develop a lifelong appreciation and understanding of nature, its resources, and its biodiversity. Additionally, it promotes the conservation and preservation of Malaysia’s rich biodiversity. Future efforts should aim to expand the dataset size and the number of classes while maintaining performance.

Author Contributions

J.Y.L.: Conceptualization, formal analysis, investigation, data curation, and writing—original draft preparation, Y.Y.W.: Conceptualization, formal analysis, resource acquisition, writing—review and editing, supervision, and project administration, K.W.: Conceptualization, formal analysis, resource acquisition, and writing—review and editing. All authors have read and agreed to the published version of the manuscript.

Funding

This research received no external funding.

Institutional Review Board Statement

Not applicable.

Informed Consent Statement

Not applicable.

Data Availability Statement

The raw data supporting the conclusions of this article will be made available by the authors on request.

Acknowledgments

I would like to thank my supervisor Wee Yit Yin for her guidance and support for this project. I also would like to thank the lab technician of the IT faculty for lending us two PCs for the project.

Conflicts of Interest

The authors declare no conflicts of interest.

References

  1. Roslan, F. Two Mushroom Poisoning Deaths Recorded in Sabah—Professor. The Borneo Post. 12 July 2018. Available online: https://www.theborneopost.com/2018/07/12/two-mushroom-poisoning-deaths-recorded-in-sabah-professor/ (accessed on 16 July 2024).
  2. O’Malley, G.F.; O’Malley, R. Mushroom Poisoning. MSD Manual Professional Edition. 13 June 2022. Available online: https://www.msdmanuals.com/professional/injuries-poisoning/poisoning/mushroom-poisoning (accessed on 16 July 2024).
  3. Hedman, H.; Holmdahl, J.; Mölne, J.; Ebefors, K.; Haraldsson, B.; Nyström, J. Long-term clinical outcome for patients poisoned by the fungal nephrotoxin orellanine. BMC Nephrol. 2017, 18, 121. [Google Scholar] [CrossRef] [PubMed]
  4. Anantharam, P.; Shao, D.; Imerman, P.M.; Burrough, E.; Schrunk, D.; Sedkhuu, T.; Tang, S.; Rumbeiha, W. Improved Tissue-Based analytical test methods for orellanine, a biomarker of cortinarius mushroom intoxication. Toxins 2016, 8, 158. [Google Scholar] [CrossRef] [PubMed]
  5. Wild Mushroom Poisoning—Fact Sheets. Available online: https://www.health.nsw.gov.au/environment/factsheets/Pages/wild-mushroom-poisoning.aspx (accessed on 16 July 2024).
  6. Leong, A. Family Ends in Hospital after Ingesting Poisonous Mushrooms. TRP. 15 July 2023. Available online: https://www.therakyatpost.com/news/2023/07/15/watch-family-ends-in-hospital-after-ingesting-poisonous-mushrooms/ (accessed on 16 July 2024).
  7. Chlorophyllum molybdites—Mushroom World. Available online: https://www.mushroom.world/show?n=Chlorophyllum-molybdites (accessed on 16 July 2024).
  8. Hamonangan, R.; Bagus, M.; Bagus, C.; Dinata, S.; Atmaja, K. Accuracy of classification poisonous or edible of mushroom using naïve bayes and k-nearest neighbors. J. Soft Comput. Explor. 2021, 2, 53–60. [Google Scholar]
  9. Ottom, M. Classification of mushroom fungi using machine learning techniques. Int. J. Adv. Trends Comput. Sci. Eng. 2019, 8, 2378–2385. [Google Scholar] [CrossRef]
  10. Rimi, I.F.; Habib, M.T.; Supriya, S.; Khan, M.A.A.; Hossain, S.A. Traditional machine learning and deep learning modeling for legume species recognition. SN Comput. Sci. 2022, 3, 430. [Google Scholar] [CrossRef]
  11. Wibowo, A.; Rahayu, Y.; Riyanto, A.; Hidayatulloh, T. Classification algorithm for edible mushroom identification. In Proceedings of the 2018 International Conference on Information and Communications Technology (ICOIACT), Yogyakarta, Indonesia, 6–7 March 2018. [Google Scholar]
  12. Demirel, Y.A.; Demirel, G. Deep learning based approach for classification of mushrooms. Gazi Univ. J. Sci. Part A Eng. Innov. 2023, 10, 487–498. [Google Scholar] [CrossRef]
  13. Zahan, N.; Hasan, M.Z.; Malek, M.A.; Reya, S.S. A Deep Learning-Based Approach for Edible, Inedible and Poisonous Mushroom Classification. In Proceedings of the 2021 International Conference on Information and Communication Technology for Sustainable Development (ICICT4SD), Dhaka, Bangladesh, 27–28 February 2021. [Google Scholar]
  14. INaturalist. (n.d.) Available online: https://www.inaturalist.org/ (accessed on 16 July 2024).
  15. Lee, S.S.; Alias, S.A.; Jones, E.G.B.; Zainuddin, N.; Chan, H.T. Checklist of Fungi of Malaysia. J. Trop. For. Sci. 2023, 25, 442. [Google Scholar]
  16. Help iNaturalist. iNaturalist. Available online: https://help.inaturalist.org/en/support/home (accessed on 16 July 2024).
  17. Gao, X.; Qian, Y.; Gao, A. COVID-VIT: Classification of COVID-19 from CT chest images based on vision transformer models. arXiv 2021, arXiv:2107.01682. [Google Scholar]
  18. Testagrose, C.; Shabbir, M.; Weaver, B.; Liu, X. Comparative study between Vision Transformer and EfficientNet on Marsh grass classification. In Proceedings of the International Florida Artificial Intelligence Research Society Conference, Clearwater Beach, FL, USA, 14–17 May 2023. [Google Scholar]
  19. Isiaka, F. Performance metrics of an intrusion detection system through Window-Based Deep Learning models. J. Data Sci. Intell. Syst. 2023, 2, 174–180. [Google Scholar] [CrossRef]
  20. Shang, L.; Zhang, Z.; Tang, F.; Cao, Q.; Pan, H.; Lin, Z. Signal process of ultrasonic guided wave for damage detection of localized defects in plates: From shallow learning to deep learning. J. Data Sci. Intell. Syst. 2023. [Google Scholar] [CrossRef]
  21. Dosovitskiy, A.; Beyer, L.; Kolesnikov, A.; Weissenborn, D.; Zhai, X.; Unterthiner, T.; Dehghani, M.; Minderer, M.; Heigold, G.; Gelly, S.; et al. An Image is Worth 16x16 Words: Transformers for Image Recognition at Scale. arXiv 2021, arXiv:2010.11929. [Google Scholar]
  22. Devlin, J.; Chang, M.; Lee, K.; Toutanova, K. BERT: Pre-training of Deep Bidirectional Transformers for Language Understanding. arXiv 2019, arXiv:1810.04805. [Google Scholar]
  23. He, K.; Zhang, X.; Ren, S.; Sun, J. Deep Residual Learning for Image Recognition. In Proceedings of the 2016 IEEE Conference on Computer Vision and Pattern Recognition (CVPR), Las Vegas, NV, USA, 27–30 June 2016. [Google Scholar]
  24. Zhuang, F.; Qi, Z.; Duan, K.; Xi, D.; Zhu, Y.; Zhu, H.; Xiong, H.; He, Q. A Comprehensive Survey on Transfer Learning. Proc. IEEE 2021, 109, 43–76. [Google Scholar] [CrossRef]
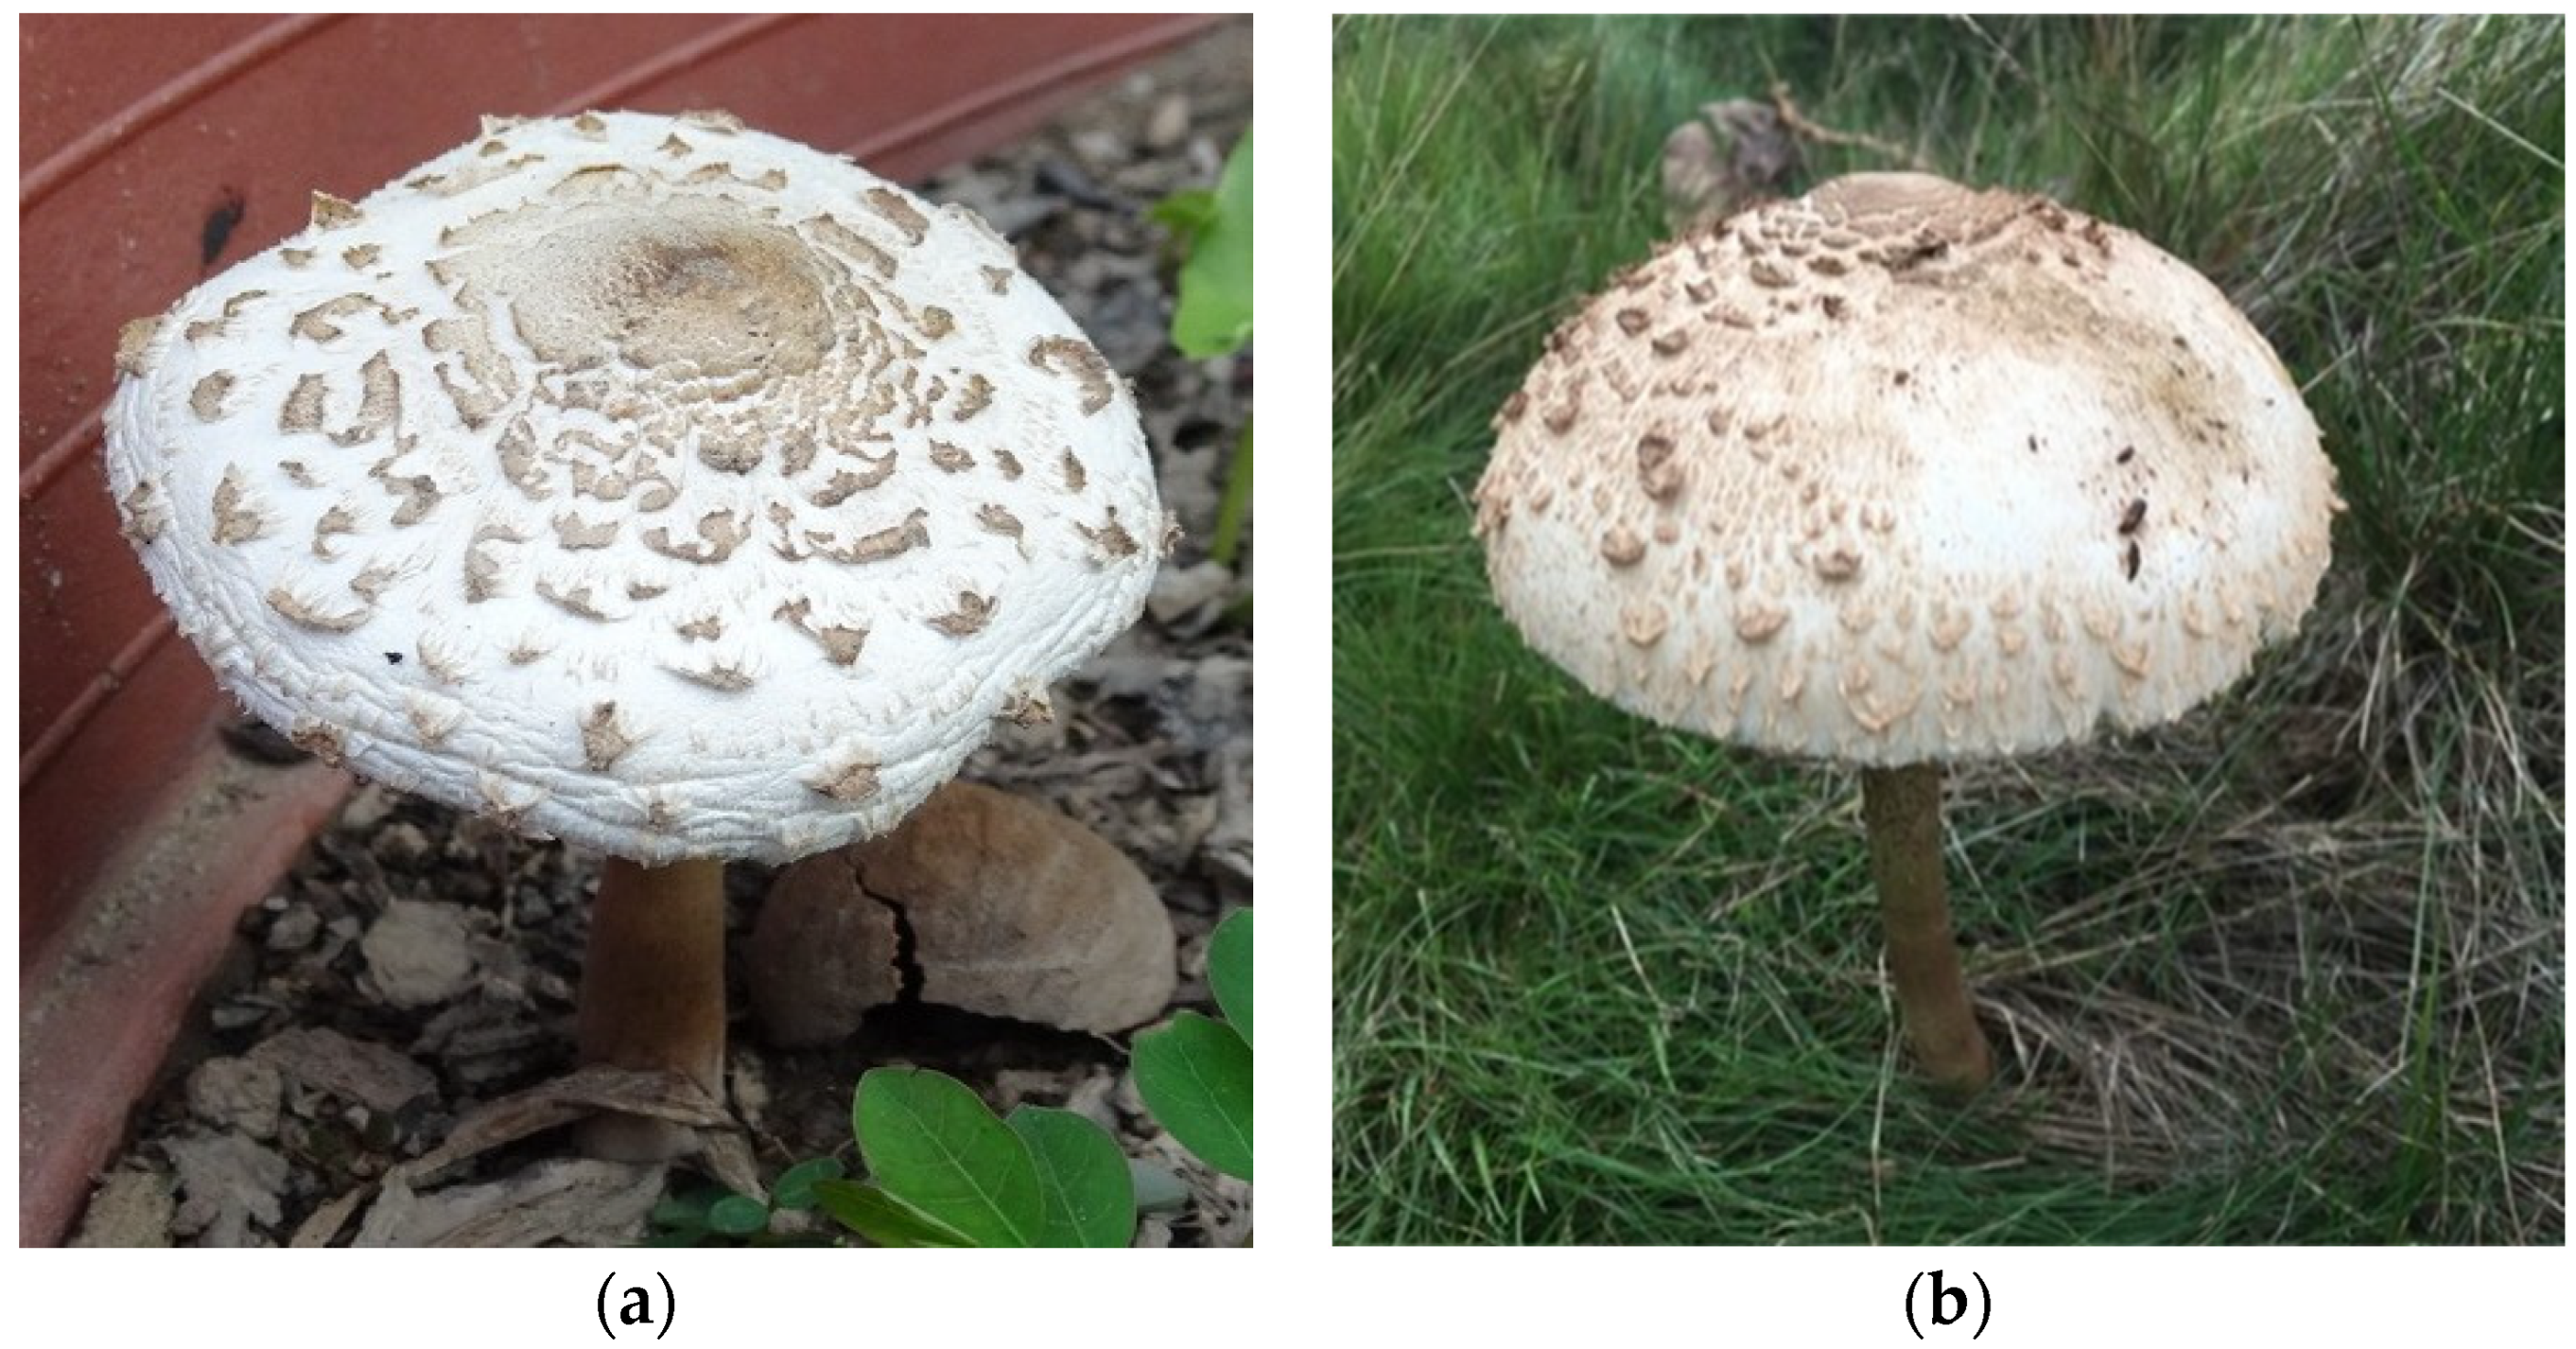
Figure 1. Similar-looking mushrooms are hard to differentiate. (a) A picture of Chlorophyllum molybdites, which is poisonous; (b) a picture of Macrolepiota procera, which is edible.
Applsci 14 06794 g001
Figure 2. Pictures of the species of mushrooms used in the dataset. (a) Amanita vaginata—NE; (b) Armillaria mellea—E; (c) Boletus reticulatus—E; (d) Chlorophyllum molybdites—NE; (e) Coltricia perennis—NE; (f) Coprinellus disseminatus—E; (g) Coprinopsis lagopus—NE; (h) Cortinarius violaceus—NE; (i) Entoloma murrayi—NE; (j) Flammulina velutipes—E; (k) Laccaria laccata—E; (l) Macrolepiota procera—E; (m) Mycena epipterygia—NE; (n) Mycena pura—NE; (o) Panus conchatus—NE; (p) Panus lecomtei—E; (q) Phallus indusiatus—E; (r) Pleurotus ostreatus—E; (s) Suillus granulatus—E; (t) Tylopilus Plubeoviolaceus—NE.
Applsci 14 06794 g002aApplsci 14 06794 g002b
Figure 3. An example of a Vision Transformer model proposed for mushroom species classification.
Applsci 14 06794 g003
Figure 4. Architecture of ResNet-18.
Applsci 14 06794 g004
Figure 5. (a) An example of Armillaria mellea; (b) an example of Pleurotus ostreatus.
Applsci 14 06794 g005
Figure 6. Confusion matrix for ViT-B/16.
Applsci 14 06794 g006
Figure 7. Confusion matrix for ViT-B/32.
Applsci 14 06794 g007
Figure 8. Confusion matrix for ViT-L/16.
Applsci 14 06794 g008
Figure 9. Confusion matrix for ViT-L/32.
Applsci 14 06794 g009
Figure 10. Confusion matrix for ResNet-18.
Applsci 14 06794 g010
Figure 11. Confusion matrix for ResNet-34.
Applsci 14 06794 g011
Figure 12. Confusion matrix for ResNet-50.
Applsci 14 06794 g012
Figure 13. Confusion matrix for ResNet-101.
Applsci 14 06794 g013
Figure 14. Confusion matrix for ResNet-152.
Applsci 14 06794 g014
Table 1. Results of the experiment.
Model Accuracy (%) Precision (%) Recall (%) F1 Score (%)
ViT-B/16 90.12 90.20 90.12 90.10
ViT-B/32 85.87 85.98 85.87 85.88
ViT-L/16 90.47 90.52 90.47 90.46
ViT-L/32 88.40 88.52 88.40 88.42
ResNet-18 79.77 80.60 79.77 79.82
ResNet-34 81.67 82.08 81.67 81.63
Resnet-50 84.00 84.00 84.00 83.95
ResNet-101 82.82 83.07 82.82 82.85
ResNet-152 83.25 83.30 83.25 83.15
Table 2. Accuracy in the identification of each species for ViT models.
Mushroom SpeciesAccuracy (%)
ViT-B/16ViT-B/32ViT-L/16ViT-L/32
Amanita vaginata—E91.5186.0088.5090.50
Armillaria mellea—E68.0068.0074.5073.50
Boletus reticulatus—E87.5084.0089.5089.00
Chlorophyllum molybdites—NE91.0085.0089.5090.50
Coltricia perennis—NE90.5087.0093.0092.00
Coprinellus disseminatus—E96.0092.0097.5093.50
Coprinopsis lagopus—NE92.0091.5092.5090.00
Cortinarius violaceus—NE95.5090.5095.0095.50
Entoloma murrayi—NE98.5096.5097.5097.50
Flammulina velutipes—E92.5084.5090.5088.50
Laccaria laccata—E94.0085.0093.5090.00
Macrolepiota procera—E90.0089.0088.5086.00
Mycena epipterygia—NE90.0089.0092.5089.00
Mycena pura—NE90.0085.0095.0089.50
Panus conchatus—NE81.5076.0078.0077.00
Panus lecomtei—E85.5078.5087.5080.00
Phallus indusiatus—E99.0097.5099.5098.00
Pleurotus ostreatus—E85.0077.0094.0084.50
Suillus granulatus—E94.0086.0093.5086.00
Tylopilus plumbeoviolaceus—NE90.5089.5089.5087.50
Table 3. Accuracy in the identification of each species for ResNet models.
Mushroom Species Accuracy (%)
ResNet-18 ResNet-34 ResNet-50 ResNet-101 ResNet-152
Amanita vaginata—E 86.50 82.50 80.50 81.00 80.50
Armillaria mellea—E 53.50 57.50 61.50 65.00 60.00
Boletus reticulatus—E 75.50 81.00 76.50 77.00 75.00
Chlorophyllum molybdites—NE 71.00 82.00 84.50 85.50 83.00
Coltricia perennis—NE 82.00 84.00 88.50 86.50 89.50
Coprinellus disseminatus—E 93.50 93.50 92.50 93.50 93.50
Coprinopsis lagopus—NE 79.00 84.00 85.00 87.00 87.00
Cortinarius violaceus—NE 85.00 92.50 89.00 86.50 92.00
Entoloma murrayi—NE 93.00 89.50 93.50 95.50 95.50
Flammulina velutipes—E 77.00 68.50 85.50 80.50 80.00
Laccaria laccata—E 69.50 79.50 80.50 79.50 81.50
Macrolepiota procera—E 90.00 88.00 88.50 82.00 85.50
Mycena epipterygia—NE 81.00 81.50 83.50 76.50 79.50
Mycena pura—NE 76.00 74.00 76.50 79.00 80.50
Panus conchatus—NE 69.00 70.00 77.00 76.00 73.50
Panus lecomtei—E 77.00 82.50 82.50 81.00 77.50
Phallus indusiatus—E 95.50 97.50 98.50 95.50 96.00
Pleurotus ostreatus—E 83.00 85.50 82.50 77.50 84.00
Suillus granulatus—E 77.00 80.00 85.00 84.00 85.00
Tylopilus plumbeoviolaceus—NE 81.50 80.00 88.50 87.50 86.00
Disclaimer/Publisher’s Note: The statements, opinions and data contained in all publications are solely those of the individual author(s) and contributor(s) and not of MDPI and/or the editor(s). MDPI and/or the editor(s) disclaim responsibility for any injury to people or property resulting from any ideas, methods, instructions or products referred to in the content.