

Meat Color, Marbling, and the Evaluation of Defects in Beef and Pork at the Point of Purchase

 ,
,  , , , , and
Abstract
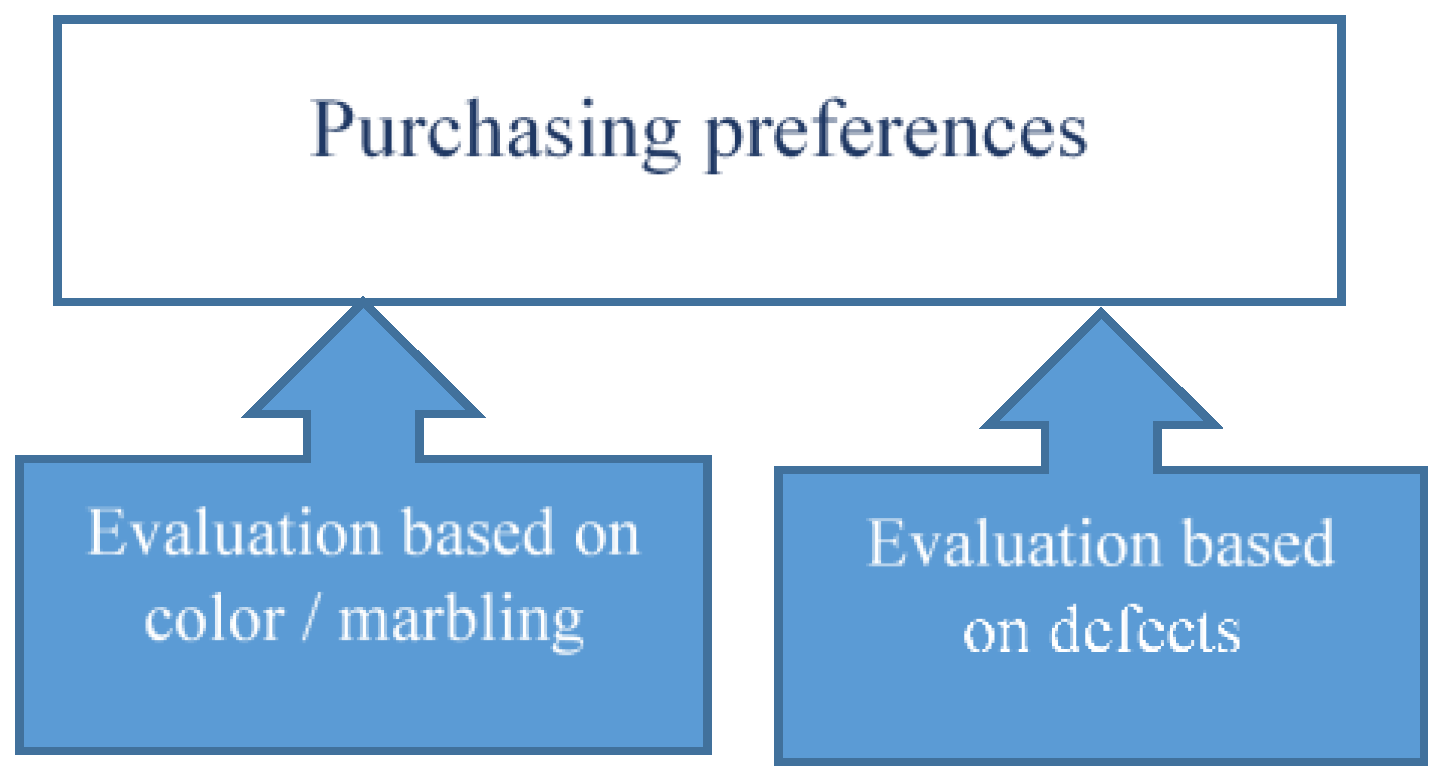
1. Introduction
- The implementation of the TLF for the control of the color and marbling variations of beef and pork is possible.
- Four typical types of defects of beef and pork will affect consumers’ choices.
2. Materials and Methods
2.1. Creation of Experimental Color and Marbling Scales
2.2. Meat Selection
2.3. Computer Vision System (CVS)
2.4. Image-Based Survey
2.5. Color and Marbling Assessment
2.6. Surveying
2.7. Demographic Characteristics
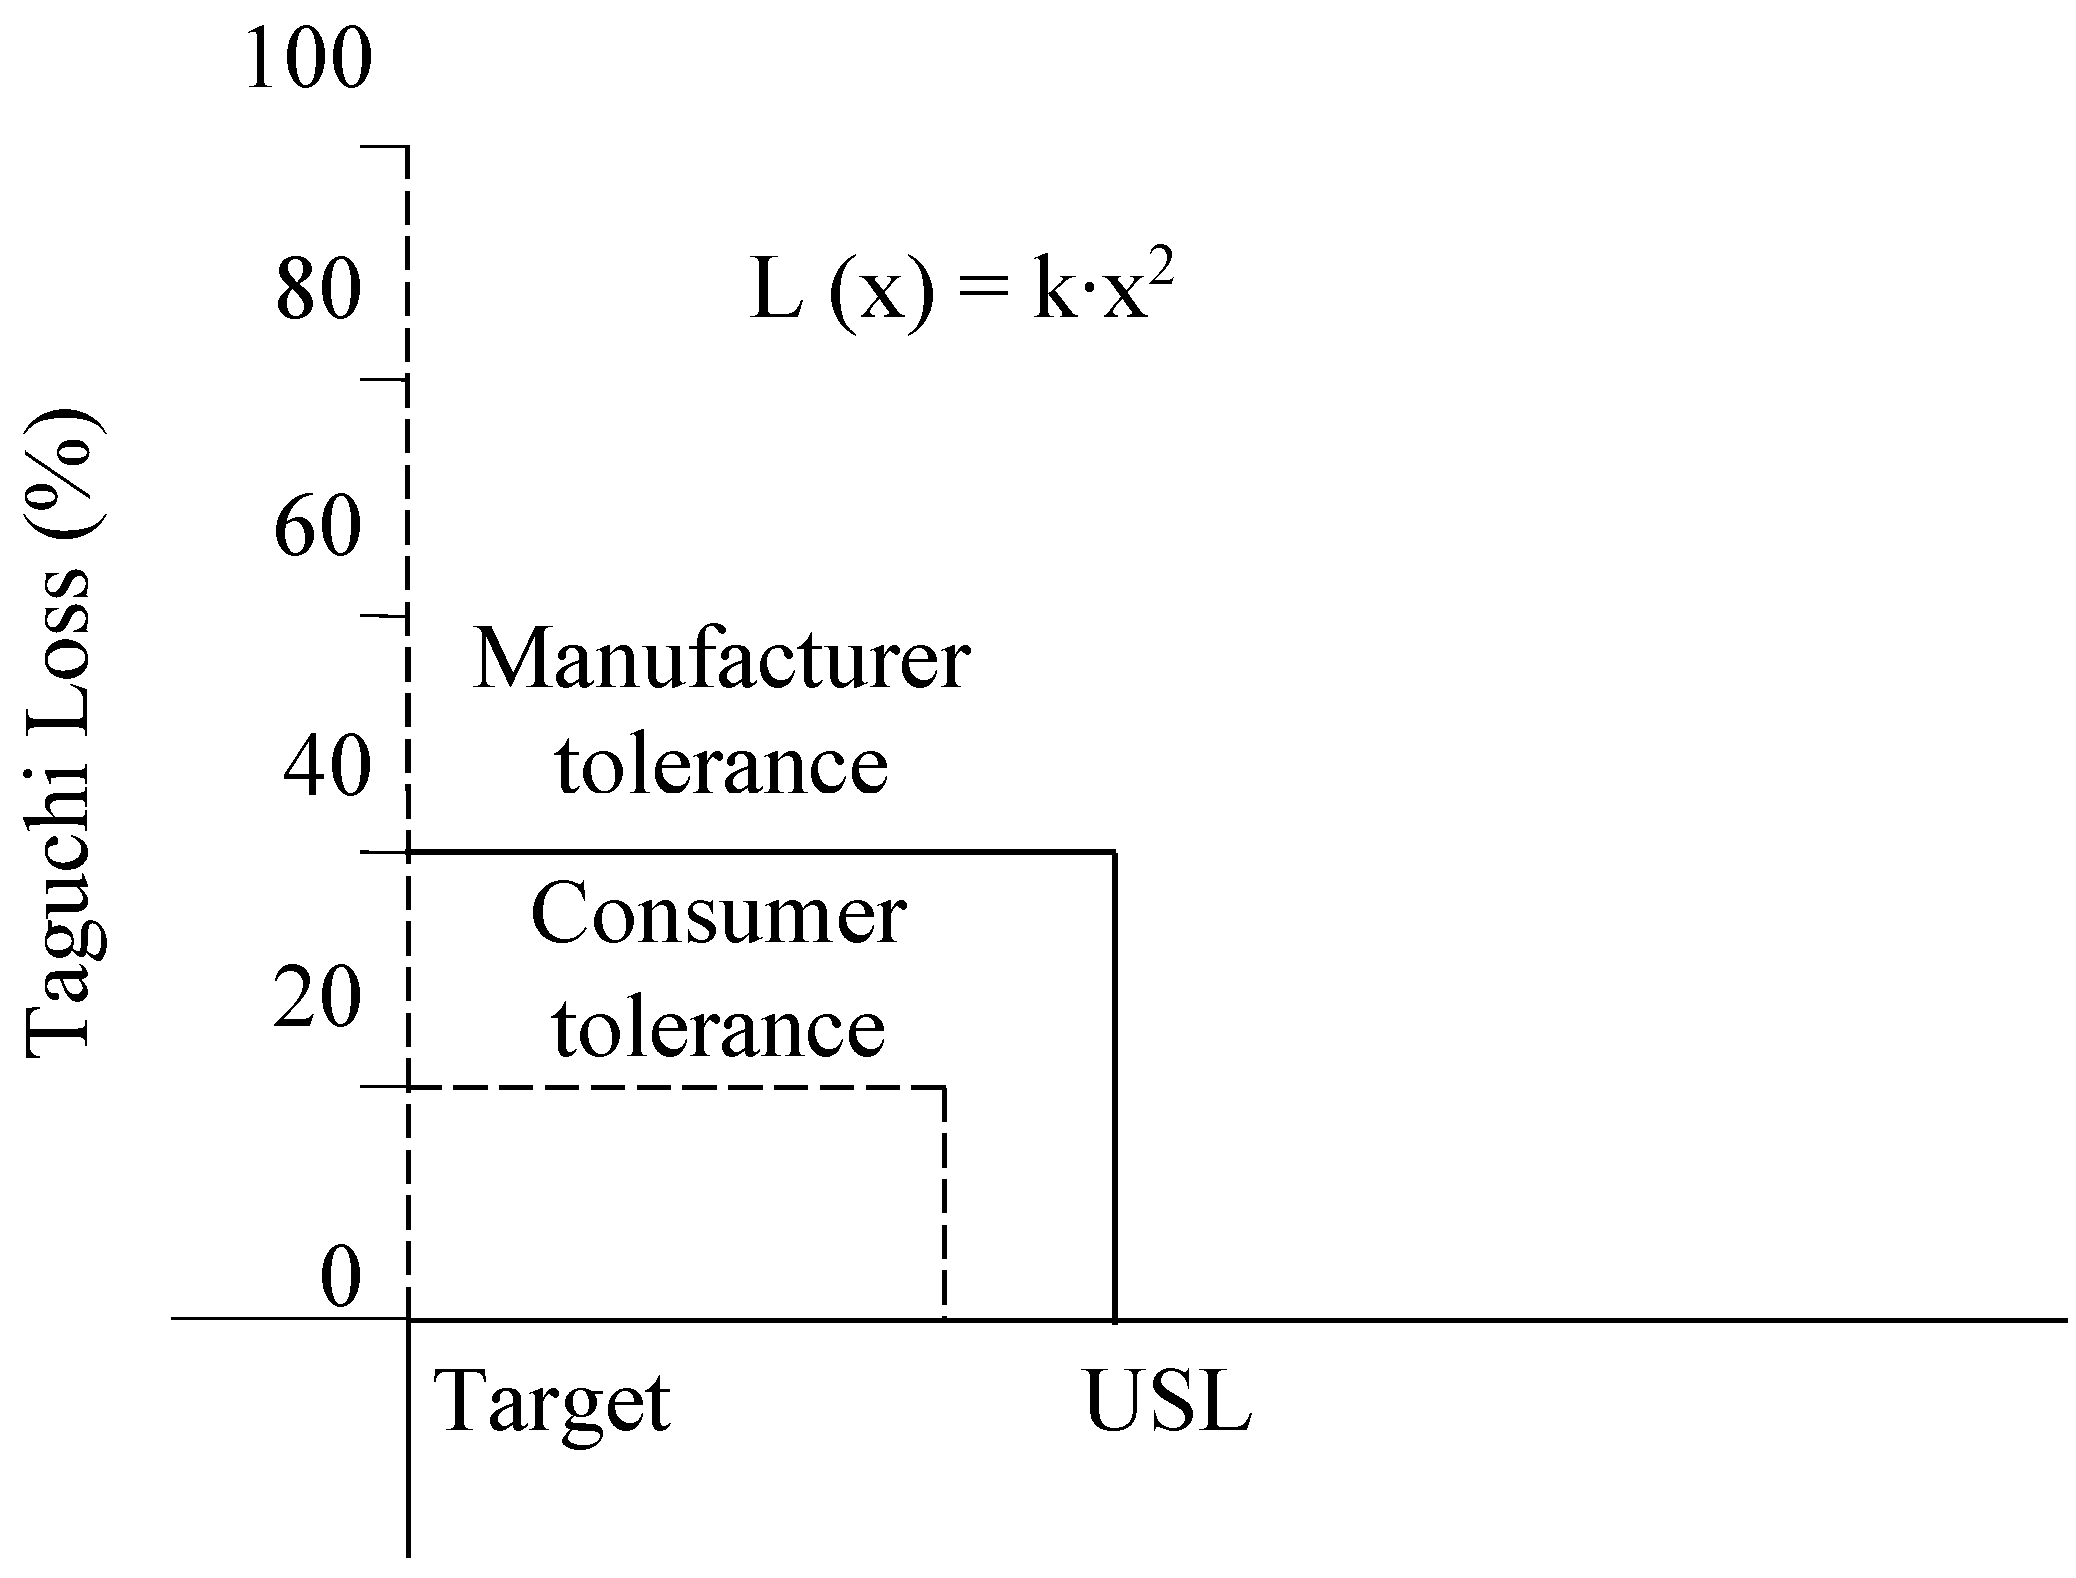
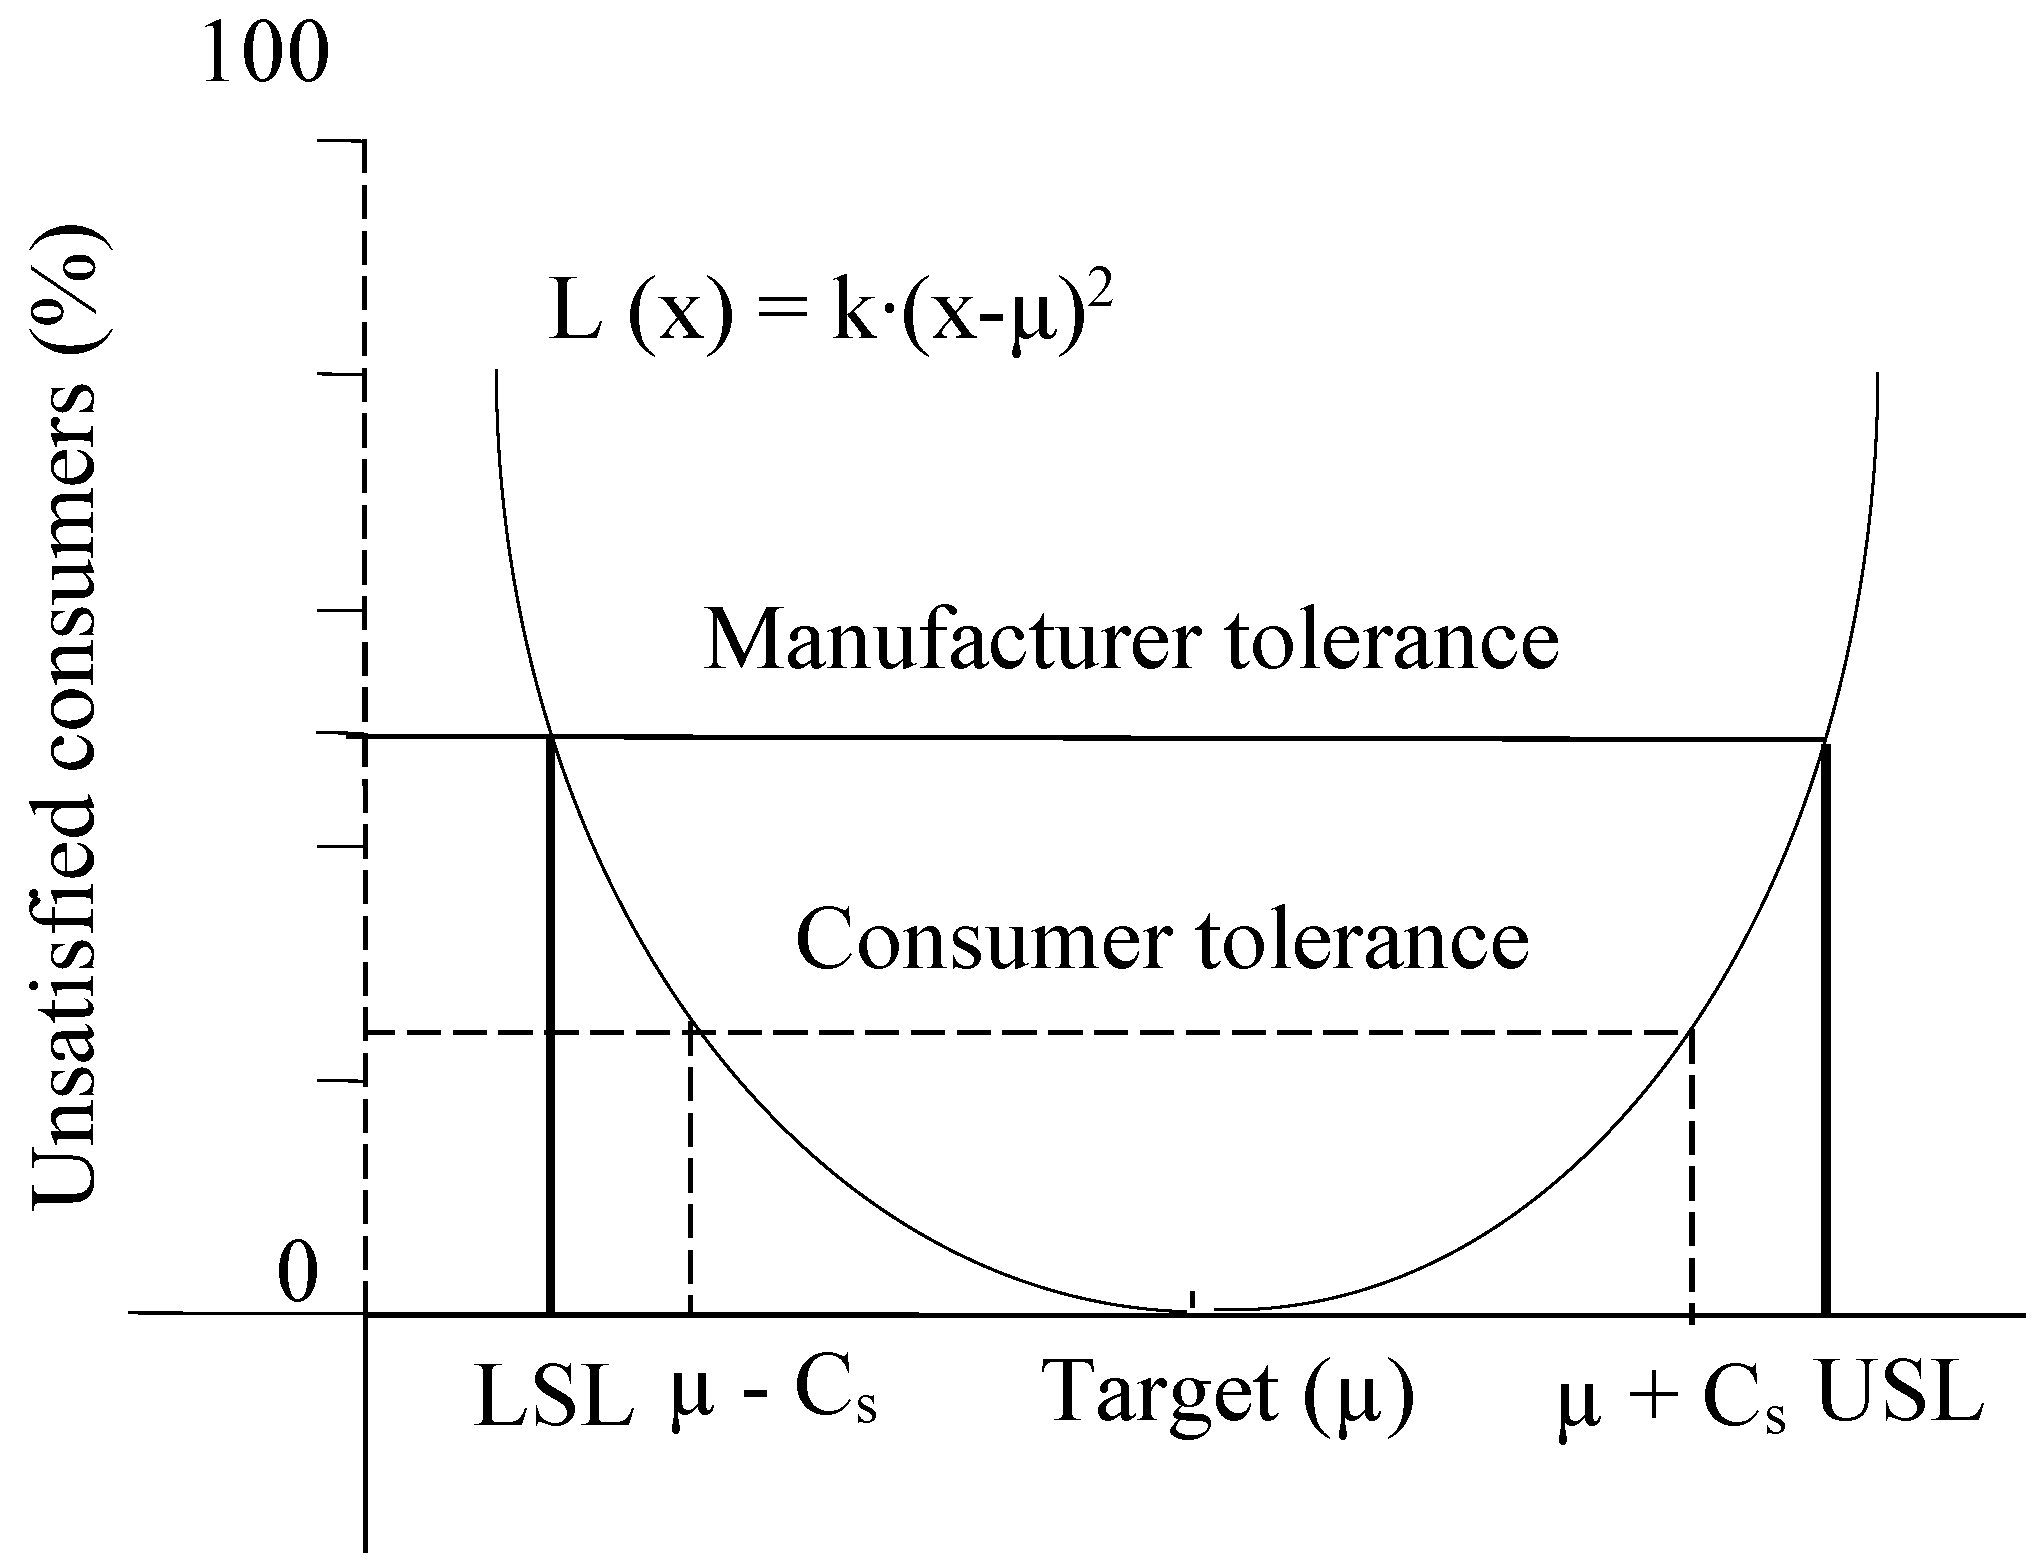
2.8. Taguchi Method
Taguchi Loss Function (TLF)
2.9. Statistical Data Analysis
3. Results and Discussion
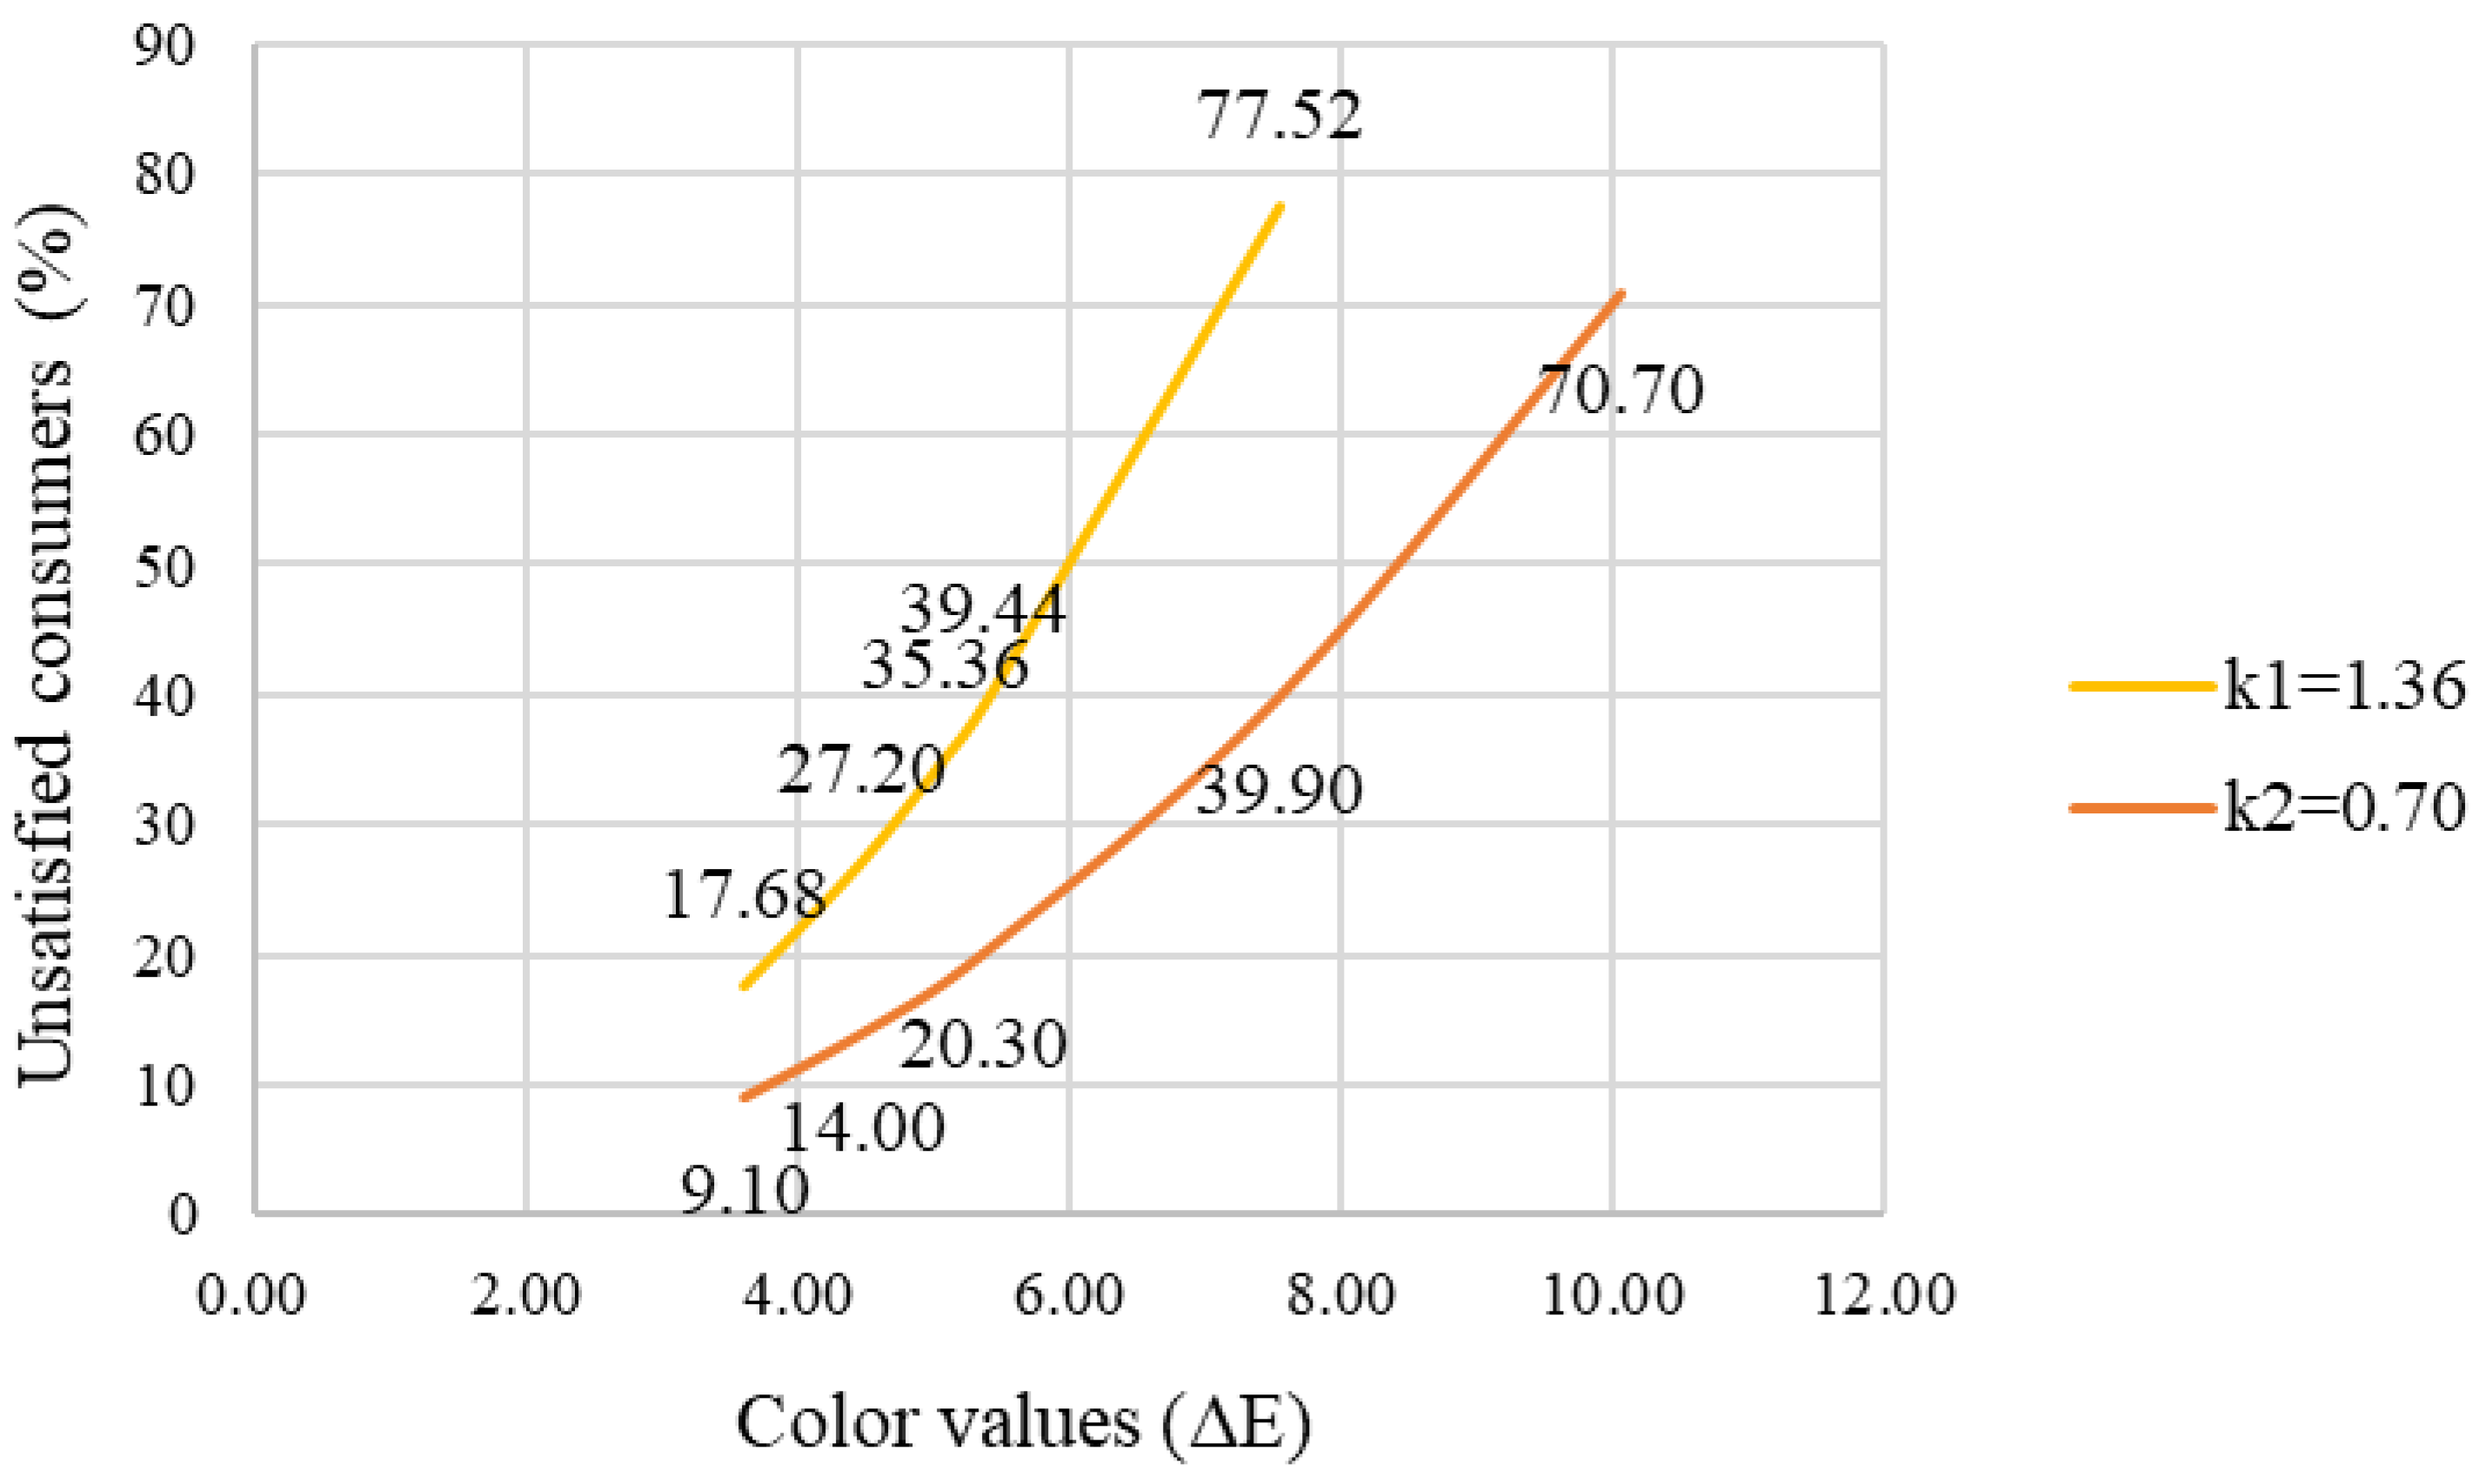
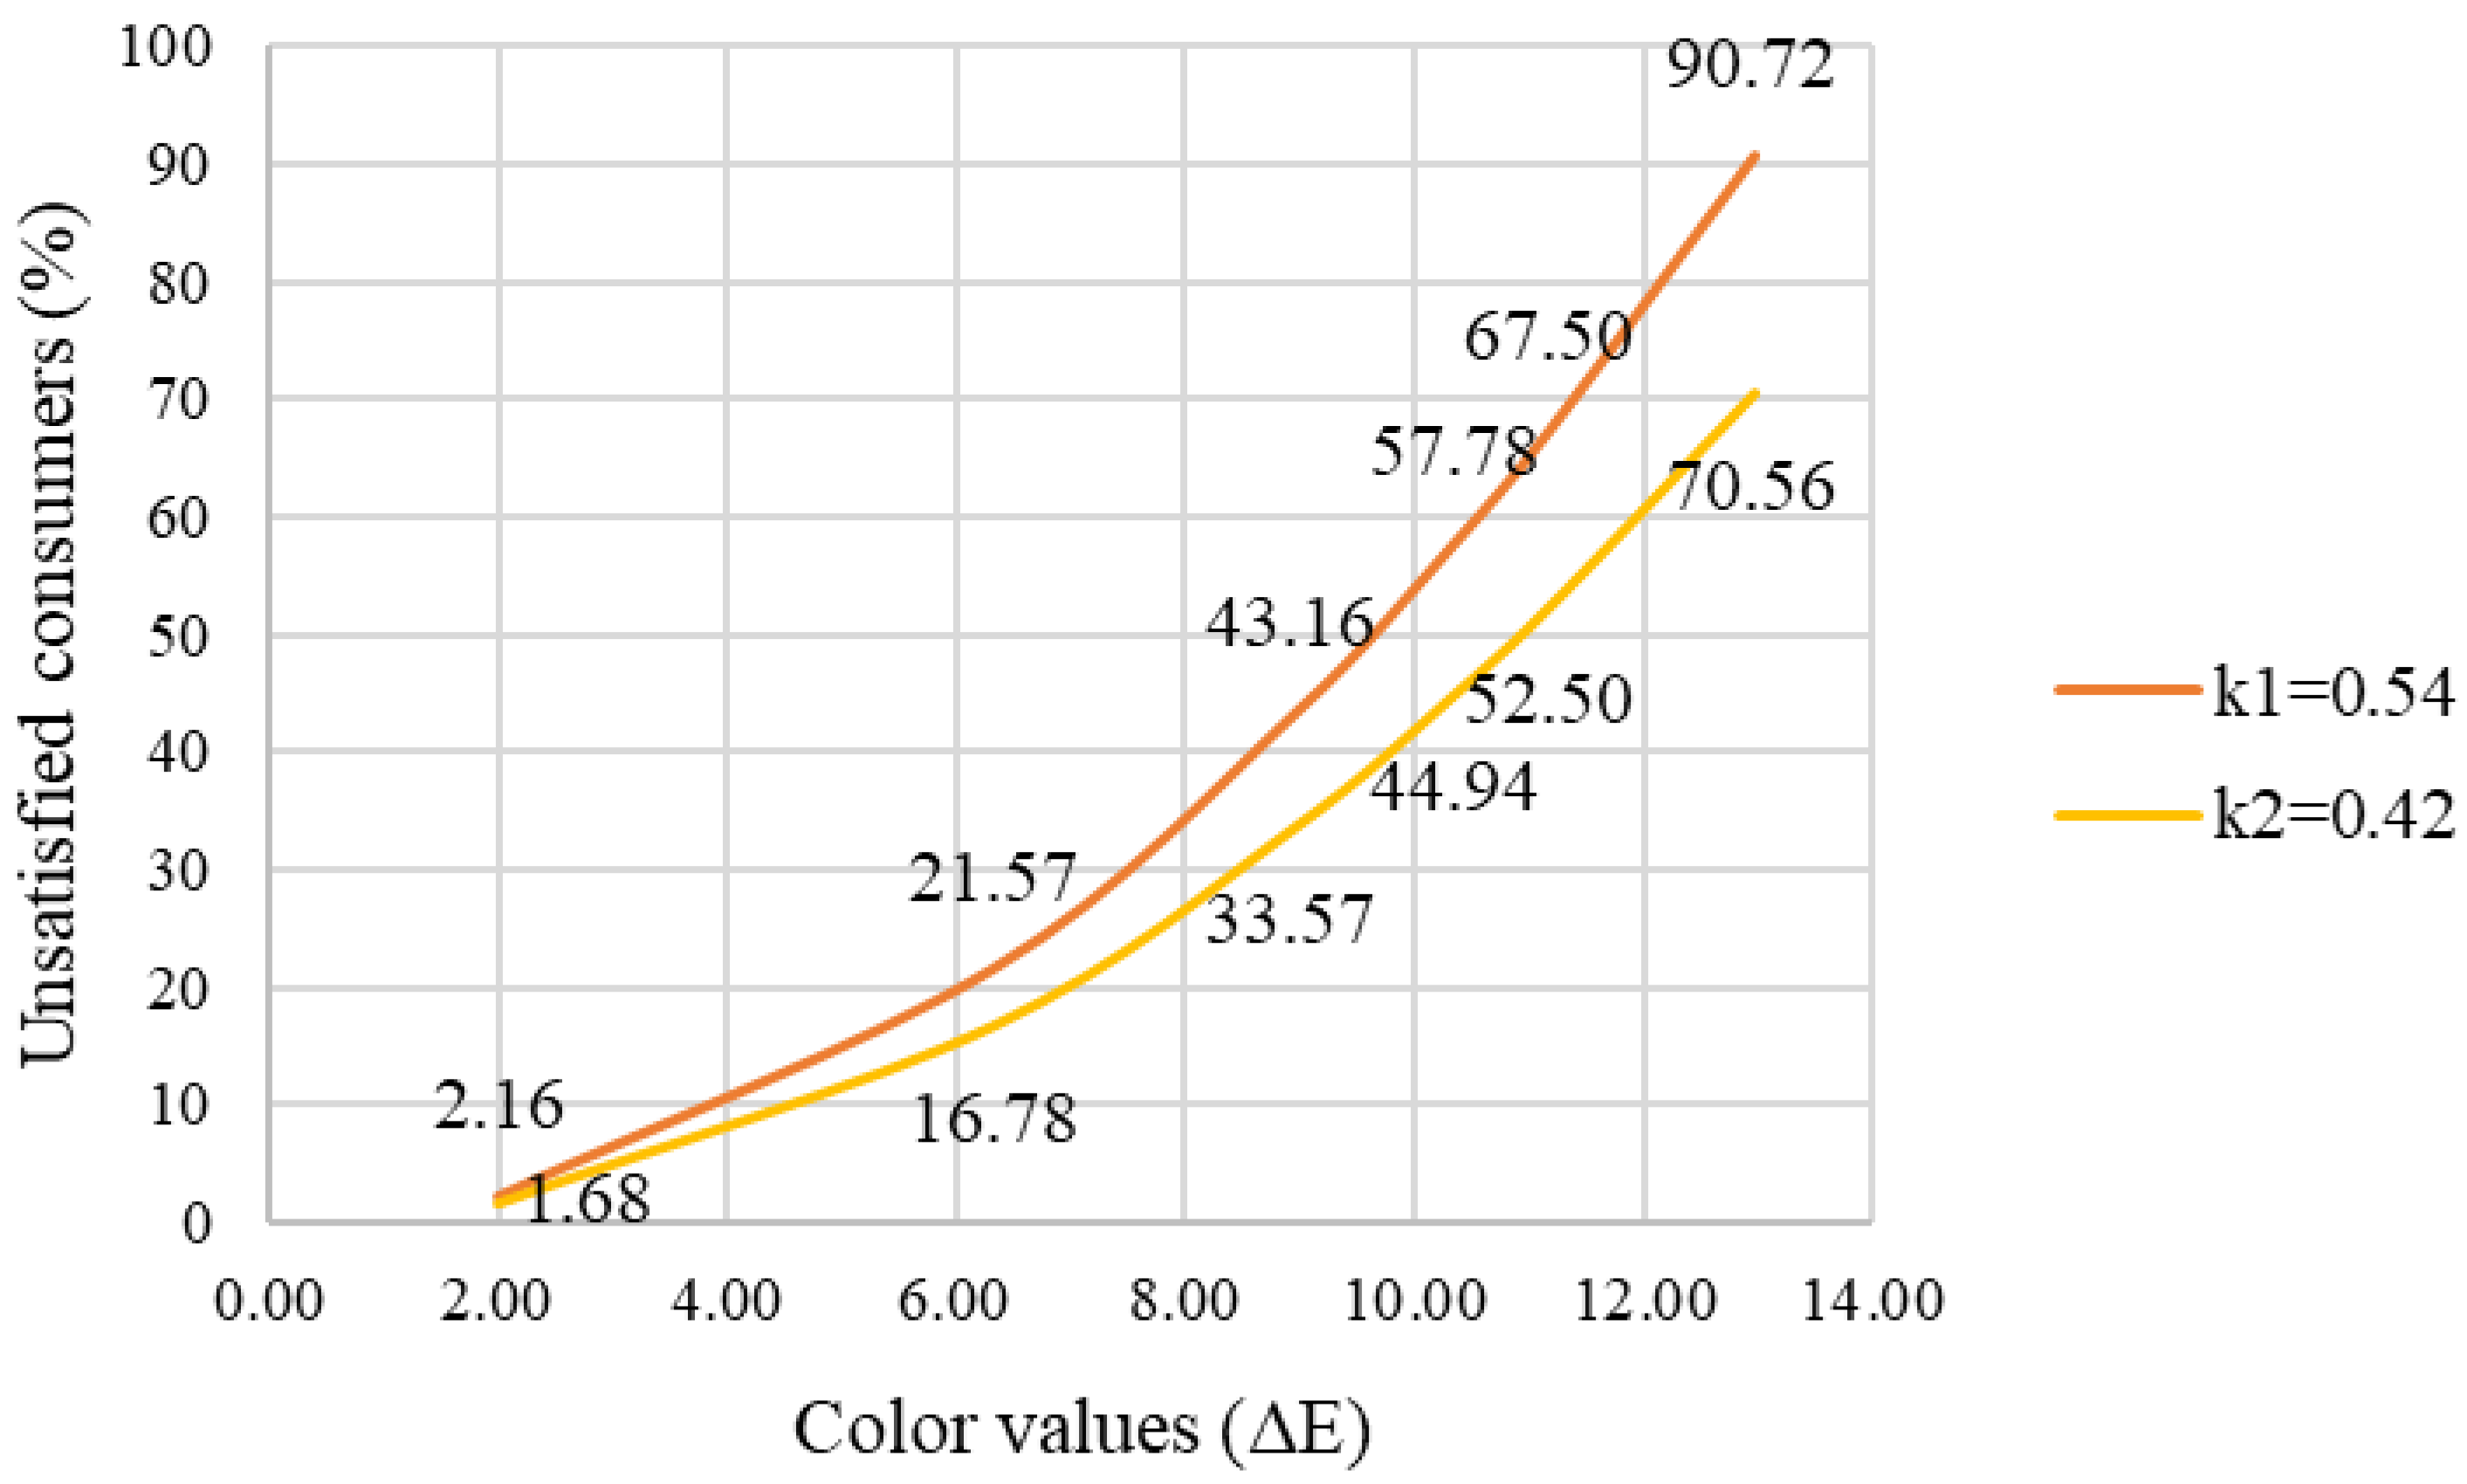
3.1. Taguchi Loss Function for Color
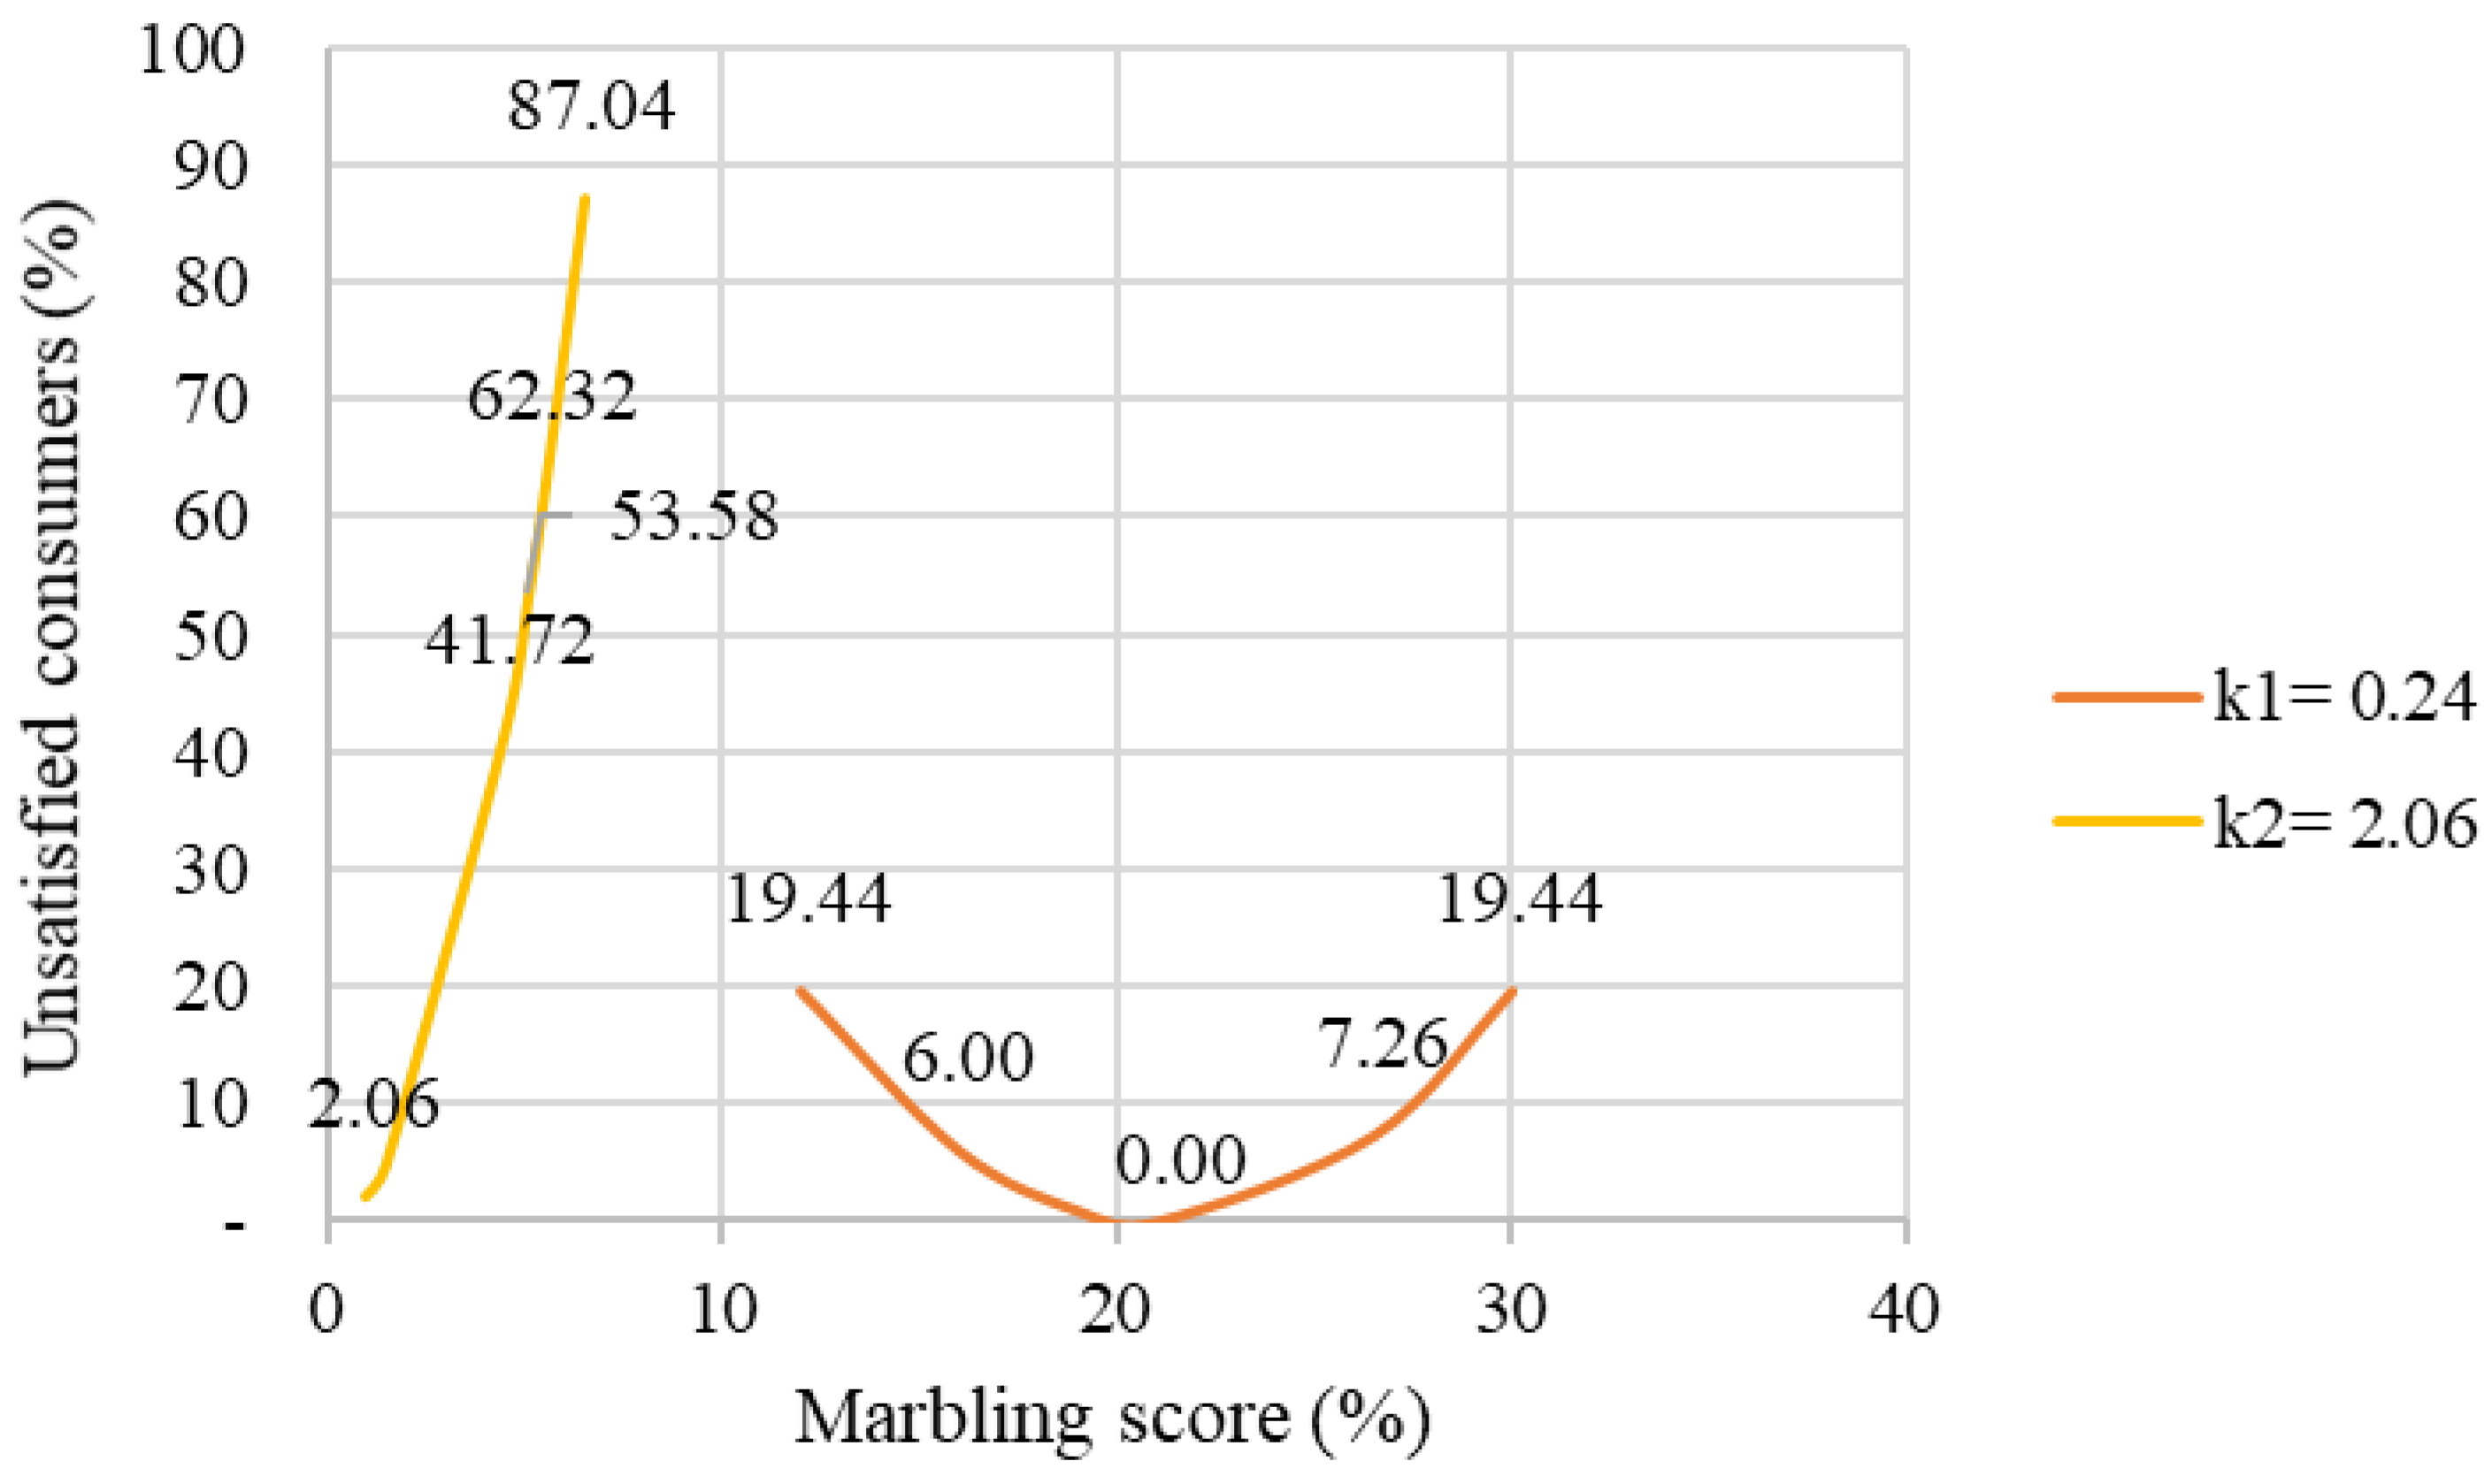
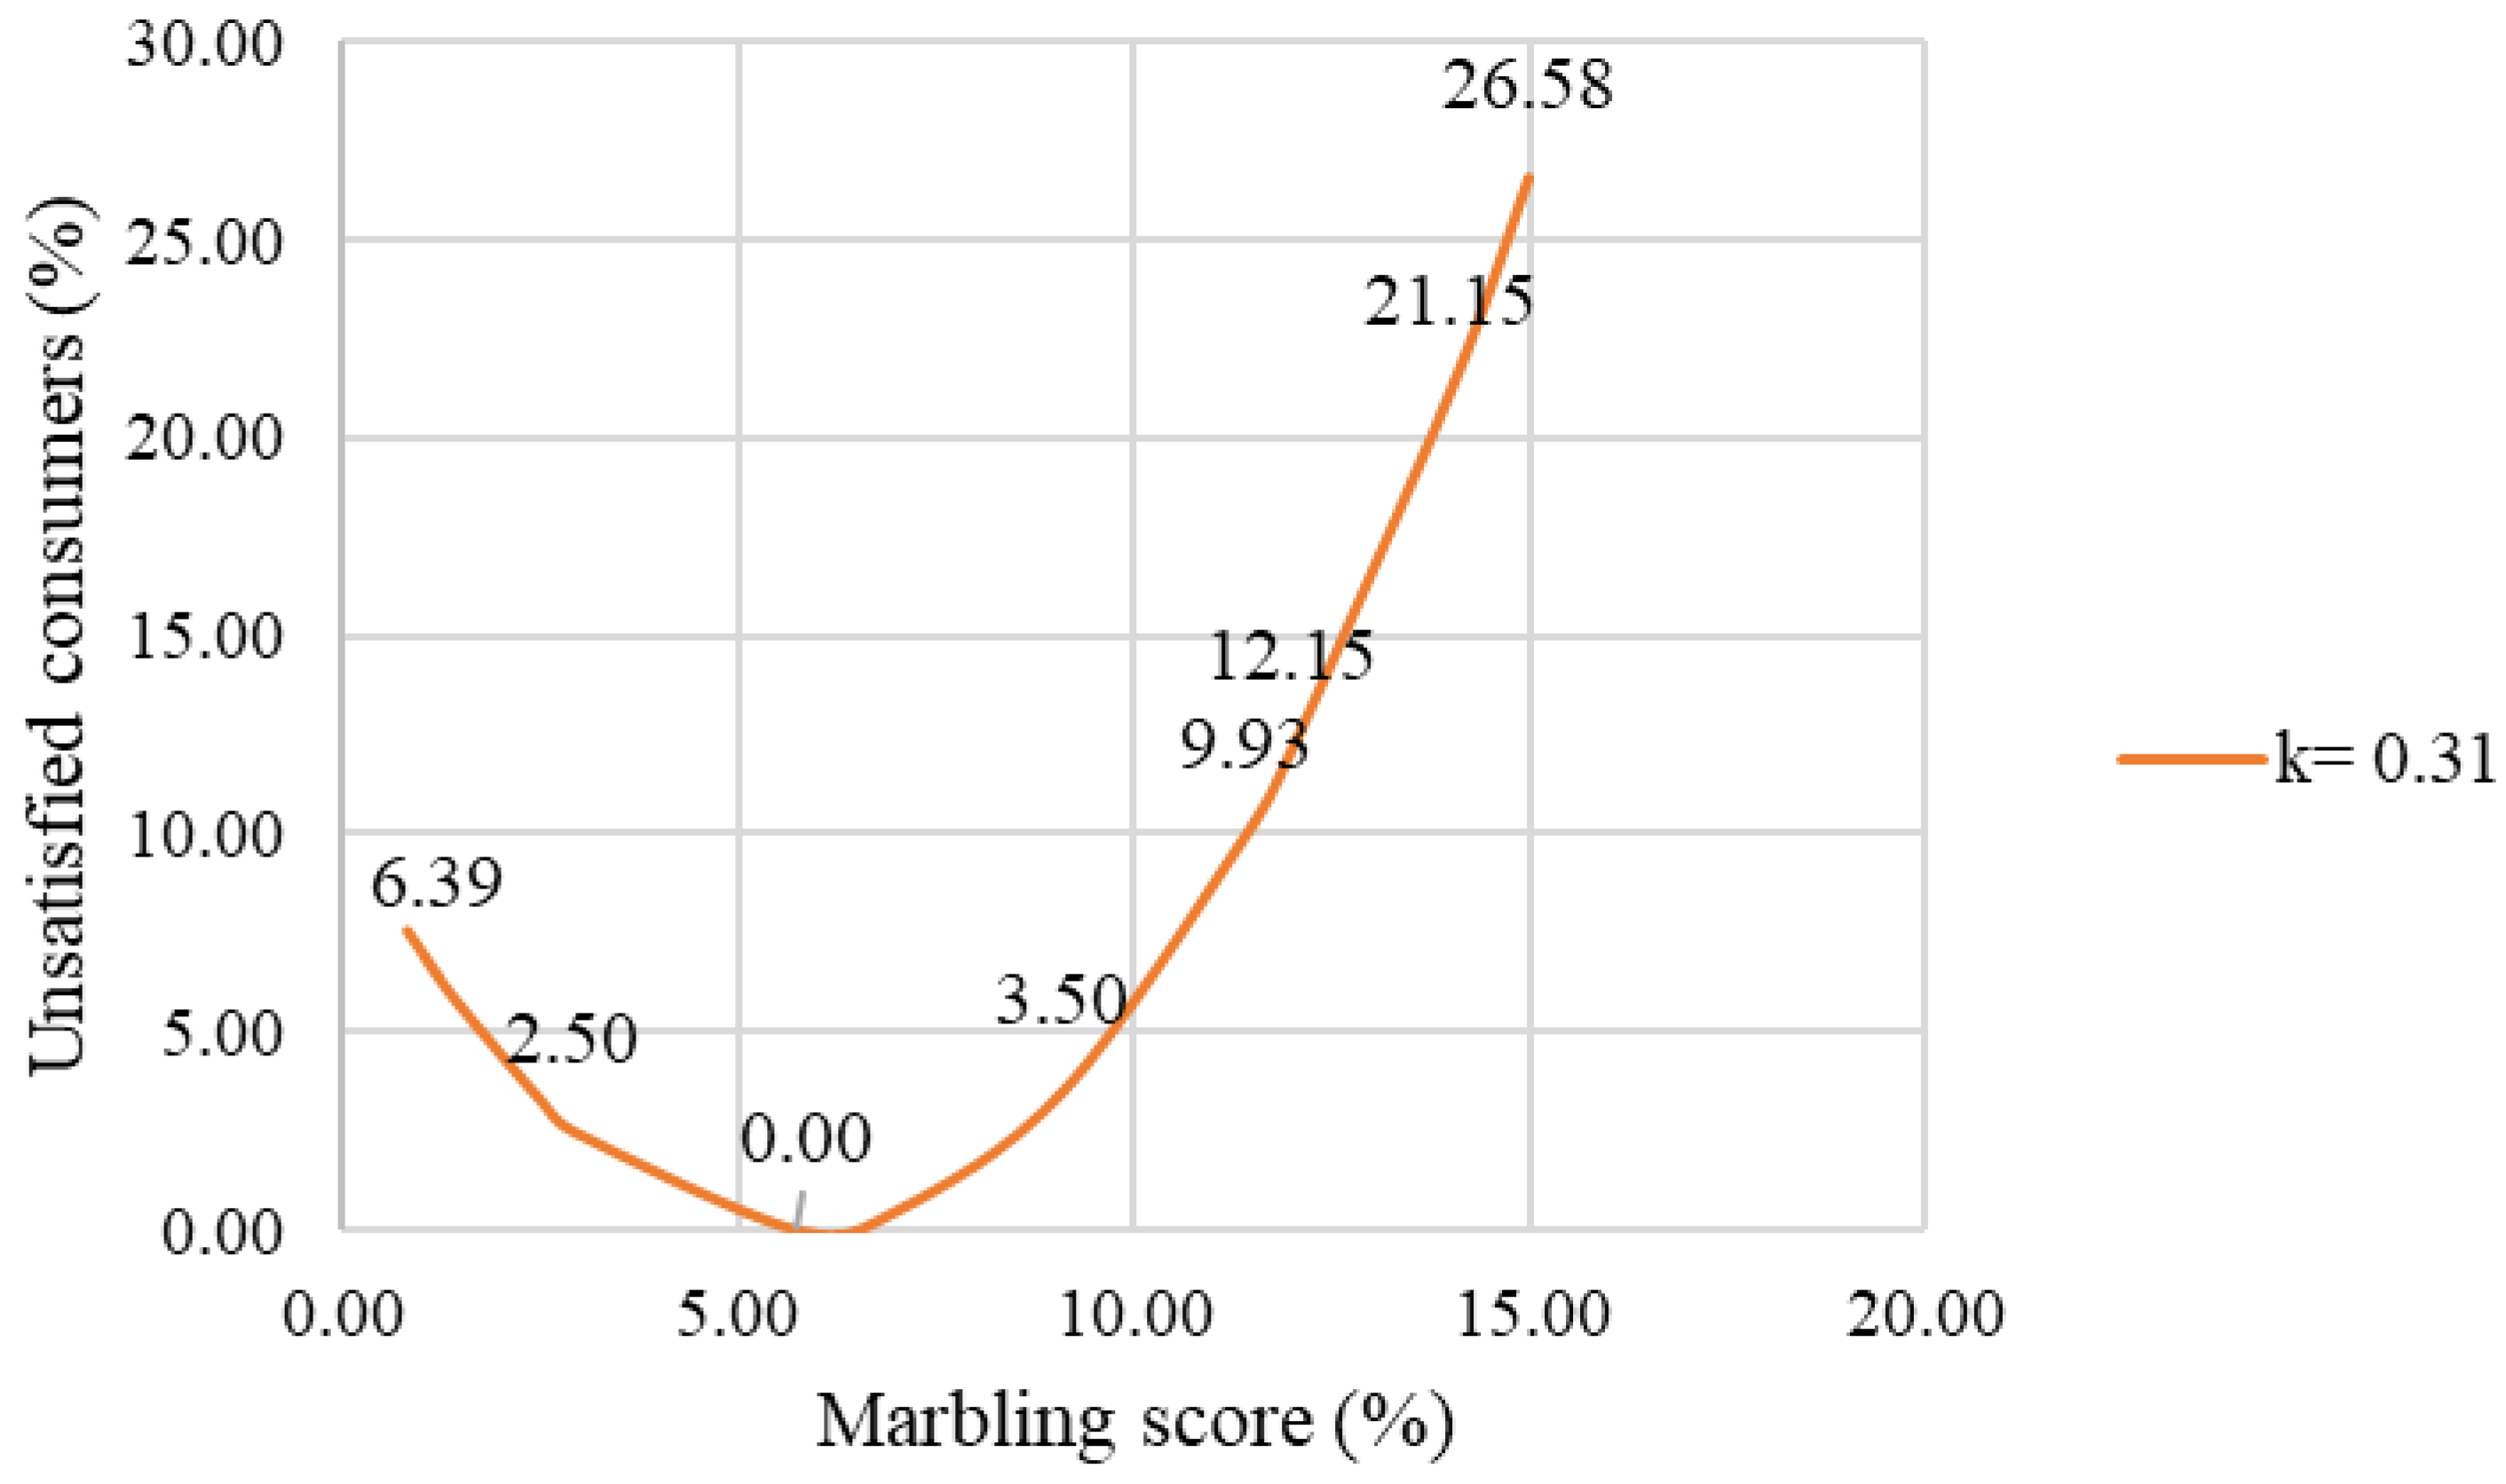
3.2. Taguchi Loss Function for Marbling
3.3. Beef and Pork Defects
4. Conclusions
Author Contributions
Funding
Institutional Review Board Statement
Informed Consent Statement
Data Availability Statement
Conflicts of Interest
References
- Katić, G.; Pavlović, M.; Bradarić, S.; Stančić, K.; Jotev, J.; Pavlović, M. Trendovi Q1; Statistical Office of the Republic of Serbia: Belgrade, Serbia, 2022; ISSN 1820-1148. [Google Scholar]
- OECD; FAO. OECD-FAO Agricultural Outlook 2021–2030; OECD: Paris, France, 2021. [Google Scholar] [CrossRef]
- Bouaziz, M.A.; Bchir, B.; Ben Salah, T.; Mokni, A.; Ben Hlima, H.; Smaoui, S.; Attia, H.; Besbes, S. Use of Endemic Date Palm (Phoenix dactylifera L.) Seeds as an Insoluble Dietary Fiber: Effect on Turkey Meat Quality. J. Food Qual. 2020, 2020, 8889272. [Google Scholar] [CrossRef]
- D’Souza, D.N.; Cleary, D.; Hewitt, R.J.E. Consumers want pork with ‘adjectives’. Anim. Prod. Sci. 2017, 57, 2331–2338. [Google Scholar] [CrossRef]
- Makweya, F.; Oluwatayo, I. Consumers’ preference and willingness to pay for graded beef in Polokwane municipality, South Africa. Ital. J. Food Saf. 2019, 8, 7654. [Google Scholar] [CrossRef] [PubMed]
- Michel, F.; Hartmann, C.; Siegrist, M. Consumers’ associations, perceptions and acceptance of meat and plant-based meat alternatives. Food Qual. Prefer. 2021, 87, 104063. [Google Scholar] [CrossRef]
- Testa, M.L.; Grigioni, G.; Panea, B.; Pavan, E. Color and Marbling as Predictors of Meat Quality Perception of Argentinian Consumers. Foods 2021, 10, 1465. [Google Scholar] [CrossRef] [PubMed]
- Połtowicz, K.; Doktor, J. Effect of slaughter age on performance and meat quality of slow-growing broiler chickens. Ann. Anim. Sci. 2012, 12, 621–631. [Google Scholar] [CrossRef]
- Wojtysiak, D.; Górska, M.; Wojciechowska, J. Muscle Fibre Characteristics and Physico-Chemical Parameters of m. semimembranosusfrom Puławska, Polish Large White and Pietrain Pigs. Folia Biol. 2016, 64, 197–204. [Google Scholar] [CrossRef]
- Panahi, Z.; Khoshbakht, R.; Javadi, B.; Firoozi, E.; Shahbazi, N. The Effect of Sodium Alginate Coating Containing Citrus (Citrus aurantium) and Lemon (Citrus lemon) Extracts on Quality Properties of Chicken Meat. J. Food Qual. 2022, 2022, 6036113. [Google Scholar] [CrossRef]
- Modika, K.; Frylinck, L.; Moloto, W.; Strydom, P.; Heinze, P.; Webb, E. Visual evaluation of beef tenderness by using surface structural observations and its relationship to meat colour. S. Afr. J. Anim. Sci. 2015, 45, 255–262. [Google Scholar] [CrossRef]
- Stewart, S.M.; Gardner, G.E.; McGilchrist, P.; Pethick, D.W.; Polkinghorne, R.; Thompson, J.M.; Tarr, G. Prediction of consumer palatability in beef using visual marbling scores and chemical intramuscular fat percentage. Meat Sci. 2021, 181, 108322. [Google Scholar] [CrossRef]
- King, I. Handbook of Australian Meat 7th Edition (International Red Meat Manual); AUS-MEAT Ltd.: Murarrie, QLD, Australia, 2005; ISBN 0 9578793 69. [Google Scholar]
- MLA. Meat Standards Australia MSA07 Tips & Tools. 2018. Available online: https://www.mla.com.au/marketing-beef-and-lamb/meat-standards-australia/ (accessed on 18 August 2023).
- Scott, N. USDA Quality Grade and Yield Grade; University of Idaho: Moscow, ID, USA, 2011. [Google Scholar]
- Busboom, J.R.; Reeves, J.J. Japanese Meat Grading; Washington State University: Pullman, WA, USA, 2023. [Google Scholar]
- Burson, D.E. Meat Quality Defects; CDE Information for Lab practicum; University of Nebraska, Lincoln: Lincoln, NE, USA, 2023. [Google Scholar]
- MacDougall, D.B.; Jones, S.J. Translucency and Colour Defects of Dark-Cutting Meat and their Detection. In The Problem of Dark-Cutting in Beef: A Seminar in the EEC Programme of Coordination of Research on Animal Welfare, Organised by D.E. Hood and P.V. Tarrant, and Held in Brussels, October 7–8, 1980; Hood, D.E., Tarrant, P.V., Eds.; Springer: Dordrecht, The Netherlands, 1981; pp. 328–343. [Google Scholar]
- Gagaoua, M.; Warner, R.D.; Purslow, P.; Ramanathan, R.; Mullen, A.M.; López-Pedrouso, M.; Franco, D.; Lorenzo, J.M.; Tomasevic, I.; Picard, B.; et al. Dark-cutting beef: A brief review and an integromics meta-analysis at the proteome level to decipher the underlying pathways. Meat Sci. 2021, 181, 108611. [Google Scholar] [CrossRef] [PubMed]
- Maharjan, D. Impact of Winter Feeding and Vaccination Strategies on Carcass Outcomes in Beef Cattle; The University of Manitoba: Winnipeg, MB, Canada, 2019. [Google Scholar]
- Zequan, X.; Yonggang, S.; Guangjuan, L.; Shijun, X.; Li, Z.; Mingrui, Z.; Yanli, X.; Zirong, W. Proteomics analysis as an approach to understand the formation of pale, soft, and exudative (PSE) pork. Meat Sci. 2021, 177, 108353. [Google Scholar] [CrossRef] [PubMed]
- Lesiów, T.; Xiong, Y.L. Heat/Cold Stress and Methods to Mitigate Its Detrimental Impact on Pork and Poultry Meat: A Review. Foods 2024, 13, 1333. [Google Scholar] [CrossRef] [PubMed]
- Cannon, J.E.; Morgan, J.B.; Mckeith, F.K.; Smith, G.C.; Sonka, S.; Heavner, J.; Meeker, D.L. Pork chain quality audit survey: Quantification of pork quality characteristics. J. Muscle Foods 1996, 7, 29–44. [Google Scholar] [CrossRef]
- Kackar, R.N. Off-Line Quality Control, Parameter Design, and the Taguchi Method. J. Qual. Technol. 1985, 17, 176–188. [Google Scholar] [CrossRef]
- Redzic, S. Taguchi’s loss function and inverted probability loss function as tools for advancement of the quality. Naučno-stručni skup KVALITET. 1999; 309–319. [Google Scholar]
- Taguchi, G.; Clausing, D. Robust Quality. Harv. Bus. Rev. 1990, 68, 65–75. [Google Scholar]
- Bharti, P.K.; Khan, M.I.; Singh, H. Taguchi’s off line method and Multivariate loss function approach for quality management and optimization of process parameters—A review. AIP Conf. Proc. 2010, 1298, 486–491. [Google Scholar] [CrossRef]
- Rajic, S.; Djordjevic, V.; Baltic, T.; Simunovic, S. The role of marbling as an intrinsic characteristic at the point of meat purchase–the Taguchi approach. IOP Conf. Ser. Earth Environ. Sci. 2021, 854, 012078. [Google Scholar] [CrossRef]
- Tomasevic, I.; Tomovic, V.; Milovanovic, B.; Lorenzo, J.; Đorđević, V.; Karabasil, N.; Djekic, I. Comparison of a computer vision system vs. traditional colorimeter for color evaluation of meat products with various physical properties. Meat Sci. 2019, 148, 5–12. [Google Scholar] [CrossRef]
- Giaretta, E.; Mordenti, A.L.; Canestrari, G.; Brogna, N.; Palmonari, A.; Formigoni, A. Assessment of muscle Longissimus thoracis et lumborum marbling by image analysis and relationships between meat quality parameters. PLoS ONE 2018, 13, e0202535. [Google Scholar] [CrossRef]
- NPPC. Pork Quality Standards. Available online: https://nppc.org/ (accessed on 1 May 2023).
- Milovanovic, B.; Djekic, I.; Sołowiej, B.; Novakovic, S.; Đorđević, V.; Tomasevic, I. Computer Vision System: A better tool for assessing pork and beef colour than a standard colourimeter. Meat Technol. 2020, 61, 153–160. [Google Scholar] [CrossRef]
- Simunović, S.; Rajić, S.; Đorđević, V.; Tomović, V.; Vujadinović, D.; Đekić, I.; Tomašević, I. Estimation of fat content in fermented sausages by means of Computer Vision System (CVS). Meat Technol. 2021, 62, 27–32. [Google Scholar] [CrossRef]
- Punter, P.H. Free Choice Profiling. In Descriptive Analysis in Sensory Evaluation; John Wiley & Sons Ltd.: Hoboken, NJ, USA, 2018; pp. 493–511. [Google Scholar]
- Tárrega, A.; Tarancón, P. Free-Choice Profile Combined with Repertory Grid Method. In Novel Techniques in Sensory Characterization and Consumer Profiling; Varela, P., Ares, G., Eds.; CRC Press: Boca Raton, FL, USA; Taylor & Francis Group: Oxfordshire, UK, 2014; pp. 157–174. [Google Scholar]
- Chollet, S.; Lelièvre, M.; Abdi, H.; Valentin, D. Sort and beer: Everything you wanted to know about the sorting task but did not dare to ask. Food Qual. Prefer. 2011, 22, 507–520. [Google Scholar] [CrossRef]
- Lelièvre, M.; Chollet, S.; Abdi, H.; Valentin, D. What is the validity of the sorting task for describing beers? A study using trained and untrained assessors. Food Qual. Prefer. 2008, 19, 697–703. [Google Scholar] [CrossRef]
- Ngapo, T.M.; Rubio Lozano, M.S.; Braña Varela, D. Mexican consumers at the point of meat purchase. Pork choice. Meat Sci. 2018, 135, 27–35. [Google Scholar] [CrossRef] [PubMed]
- Djekic, I.; Vunduk, J.; Tomašević, I.; Kozarski, M.; Petrovic, P.; Niksic, M.; Pudja, P.; Klaus, A. Total quality index of Agaricus bisporus mushrooms packed in modified atmosphere. J. Sci. Food Agric. 2017, 97, 3013–3021. [Google Scholar] [CrossRef] [PubMed]
- Shiranita, K.; Hayashi, K.; Otsubo, A.; Tsuneharu, M.; Takiyama, R. Grading meat quality by image processing. Pattern Recognit. 2000, 33, 97–104. [Google Scholar] [CrossRef]
- Jaeger, S.R.; Machín, L.; Aschemann-Witzel, J.; Antúnez, L.; Harker, F.R.; Ares, G. Buy, eat or discard? A case study with apples to explore fruit quality perception and food waste. Food Qual. Prefer. 2018, 69, 10–20. [Google Scholar] [CrossRef]
- Sun, X.; Shi, Z.; Zhu, J. Multiobjective Design Optimization of an IPMSM for EVs Based on Fuzzy Method and Sequential Taguchi Method. IEEE Trans. Ind. Electron. 2021, 68, 10592–10600. [Google Scholar] [CrossRef]
- Shojaei, S.; Shojaei, S.; Band, S.S.; Farizhandi, A.A.K.; Ghoroqi, M.; Mosavi, A. Application of Taguchi method and response surface methodology into the removal of malachite green and auramine-O by NaX nanozeolites. Sci. Rep. 2021, 11, 16054. [Google Scholar] [CrossRef]
- Shi, Z.; Sun, X.; Cai, Y.; Yang, Z. Robust Design Optimization of a Five-Phase PM Hub Motor for Fault-Tolerant Operation Based on Taguchi Method. IEEE Trans. Energy Convers. 2020, 35, 2036–2044. [Google Scholar] [CrossRef]
- Banihashemi, A.; Fallah Nezhad, M.S.; Amiri, A. A new approach in the economic design of acceptance sampling plans based on process yield index and Taguchi loss function. Comput. Ind. Eng. 2021, 159, 107155. [Google Scholar] [CrossRef]
- Wang, M.; Yang, F.; Zhang, B.; Chen, Z. Sustainable Quality Management Based on Metrological Sampling Scheme Design: A Case Study of Food Processor. Sustainability 2023, 15, 5283. [Google Scholar] [CrossRef]
- Oviedo-Trespalacios, O.; Peñabaena-Niebles, R. Multi-Objective Approximation for the Optimal Design of Control Charts with Variable Parameters using the Taguchi Loss Function. In Proceedings of the 2019 6th International Conference on Control, Decision and Information Technologies (CoDIT), Paris, France, 23–26 April 2019; pp. 379–384. [Google Scholar]
- Mayasti, N.K.I.; Ushada, M.; Ainuri, M. Optimization of Gluten Free Spaghetti Products from Local Food with the Taguchi Method Approach. IOP Conf. Ser. Earth Environ. Sci. 2019, 251, 012031. [Google Scholar] [CrossRef]
- Qiu, X.; Wu, Y. Application of Taguchi method to improve the sous vide processed large yellow croaker (Larimichthys crocea) fillet product quality during cold storage. J. Food Process. Preserv. 2021, 45, e15565. [Google Scholar] [CrossRef]
- Chen, S.-P.; Chen, C.-Y. Dynamic markdown decisions based on a quality loss function in on-site direct-sale supply chains for perishable food. J. Oper. Res. Soc. 2021, 72, 822–836. [Google Scholar] [CrossRef]
- Paladini, E.P.; Avilés, B.G.; Schumacher, L.; Lorenz, M.; Urquiza, Y.R. Quality management model for perishable food in a fishing industry. J. Food Process Eng. 2019, 42, e13171. [Google Scholar] [CrossRef]
- Turk, S. Taguchi Loss Function in Intuitionistic Fuzzy Sets along with Personal Perceptions for the Sustainable Supplier Selection Problem. Sustainability 2022, 14, 6178. [Google Scholar] [CrossRef]
- Gagaoua, M.; Suman, S.P.; Purslow, P.P.; Lebret, B. The color of fresh pork: Consumers expectations, underlying farm-to-fork factors, myoglobin chemistry and contribution of proteomics to decipher the biochemical mechanisms. Meat Sci. 2023, 206, 109340. [Google Scholar] [CrossRef]
- Benli, H.; Yildiz, D.G. Consumer perception of marbling and beef quality during purchase and consumer preferences for degree of doneness. Anim. Biosci. 2023, 36, 1274–1284. [Google Scholar] [CrossRef]
- Yancey, E.J., II. Determination of Factors Causing Livery Flavor in Steaks from the Beef Loin and Chuck. Ph.D. Thesis, Kansas State University, Manhattan, KS, USA, 2002; p. 3076129. [Google Scholar]
- Brewer, M.S.; Zhu, L.G.; McKeith, F.K. Marbling effects on quality characteristics of pork loin chops: Consumer purchase intent, visual and sensory characteristics. Meat Sci. 2001, 59, 153–163. [Google Scholar] [CrossRef] [PubMed]
- Rincker, P.J.; Killefer, J.; Ellis, M.; Brewer, M.S.; McKeith, F.K. Intramuscular fat content has little influence on the eating quality of fresh pork loin chops. J. Anim. Sci. 2008, 86, 730–737. [Google Scholar] [CrossRef] [PubMed]

| L* | 65 | 60 | 51 | 49 | 46 | 42 | 40 |
| a* | 37 | 38 | 39 | 36 | 34 | 31 | 30 |
| b* | 24 | 24 | 24 | 23 | 24 | 24 | 15 |
 |  |  |  |  |  |  | |
| Bright brick-red | Moderately bright brick-red | Slightly bright brick-red | Slightly dark brick-red | Moderately dark red | Dark red | Extremely dark red |
| L* | 83 | 80 | 70 | 66 | 57 | 52 | 48 |
| a* | 13 | 17 | 30 | 31 | 41 | 34 | 34 |
| b* | 18 | 18 | 30 | 27 | 28 | 24 | 16 |
 |  |  |  |  |  |  | |
| Pale grayish-pink | Slightly pale grayish-pink | Moderately light grayish pink | Grayish pink | Slightly grayish-pink | Moderately dark red | Dark red |
| Marbling percentage (%) | 1.0 * | 1.5 | 5.5 | 10.6 | 16.0 | 21.0 | 26.5 * |
 |  |  |  |  |  |  | |
| Traces | Slight | Small | Modest | Moderate | Slightly Abundant | Moderately Abundant |
| Marbling percentage (%) | 0.1 * | 1.5 | 5.0 | 10.0 | 15.0 | 19.0 | 24.5 * |
 |  |  |  |  |  |  | |
| Traces | Slight | Small | Modest | Moderate | Slightly Abundant | Moderately Abundant |
| Characteristic | Sample N * (%) |
|---|---|
| Gender | |
| Female | 28 (61%) |
| Male | 18 (39%) |
| Age | |
| 18–29 | 1 (2%) |
| 30–39 | 10 (22%) |
| 40–49 | 21 (46%) |
| 50–59 | 10 (22%) |
| 60 and more | 4 (8%) |
| Education | |
| Primary school | 1 (2%) |
| High school | 12 (26%) |
| Bachelor’s degree | 7 (15%) |
| Master’s | 4 (8%) |
| PhD degree | 22 (48%) |
| Household (members) | |
| 1 | 10 (22%) |
| 2 | 17 (37%) |
| 3 | 15 (33%) |
| 4 and more | 4 (8%) |
| Characteristic | Parameter | TLF | Target Value m * | Consumers’ Tolerance Limit **Doi = xo − m | Cost (Ao % of Unsatisfied Consumers) | Coefficient (k = Ao/Do2 |
|---|---|---|---|---|---|---|
| Color of beef | ΔE | Smaller is better L(x) = k·x2 | 3.61 | Do1 = 6.32 − 3.61 = 2.71 Do2 = 8.95 − 3.61 = 5.34 | Ao1 = 10% Ao2 = 20% | k1 = 10/2.712 = 1.36 k2 = 20/5.342 = 0.70 |
| Color of pork | ΔE | Smaller is better L(x) = k·x2 | 2.00 | Do1 = 6.32 − 2.00 = 4.32 Do2 = 8.94 − 2.00 = 6.94 | Ao1 = 10% Ao2 = 20% | k1 = 10/4.322 = 0.54 k2 = 20/6.942 = 0.42 |
| Marbling of beef | Marbling score (%) of beef | Smaller is better L(x) = k·x2 | / | Do1 = 3.20 − 1.00 = 2.20 Do2 = 4.50 − 1.00 = 3.50 | Ao = 10%Ao = 20% | k1 = 10/2.22 = 2.06 k2 = 20/3.52 = 1.63 |
| Marbling score (%) of beef | The nominal value, the best value L(x) = k·(x − m)2 | Beef 21.00% | Do1 = 27.40 − 21.00 = 6.40 Do2 = 30.00 − 21.00 = 9.00 | Ao = 10%Ao = 20% | k1 = 10/6.42 = 0.24 k2 = 20/92 = 0.24 | |
| Marbling of pork | Marbling score (%) of pork | The nominal value, the best value L(x) = k·(x − m)2 | Pork 5.74% | Do1 = 11.40 − 5.74 = 5.66 Do2 = 14.00 − 5.74 = 8.26 | Ao = 10%Ao = 20% | k1 = 10/5.662 = 0.31 k2 = 20/8.262 = 0.29 |
| Defects | (Mean ± Std. Deviation) | Defects | Mean ± Std. Deviation | Mean Difference | Sig. |
|---|---|---|---|---|---|
| (I) | (J) | (I–J) | |||
| Dark cutting beef | 182 ± 56.628 | Blood splash cuts | 208 ± 56.529 | −26 | 0.783 |
| Excess seam fat | 347 ± 63.927 | −165 * | 0.006 | ||
| Lack of marbling | 469 ± 72.578 | −287 * | 0.008 | ||
| Blood splash cuts | 208 ± 56.529 | Dark cutting beef | 182 ± 56.628 | 26 | 0.783 |
| Excess seam fat | 347 ± 63.927 | −139 * | 0.013 | ||
| Lack of marbling | 469 ± 72.578 | −261 * | 0.007 | ||
| Excess seam fat | 347 ± 63.927 | Dark cutting beef | 182 ± 56.628 | 165 * | 0.006 |
| Blood splash cuts | 208 ± 56.529 | 139 * | 0.013 | ||
| Lack of marbling | 469 ± 72.578 | −122 * | 0.024 | ||
| Lack of marbling | 469 ± 72.578 | Dark cutting beef | 182 ± 56.628 | 287 * | 0.008 |
| Blood splash cuts | 208 ± 56.529 | 261 * | 0.007 | ||
| Excess seam fat | 347 ± 63.927 | 122 * | 0.024 |
| Defects | (Mean ± Std. Deviation) | Defects | Mean ± Std. Deviation | Mean Difference | Sig. |
|---|---|---|---|---|---|
| (I) | (J) | (I–J) | |||
| Pale pork | 212 ± 48.526 | Blood spotting | 149 ± 57.529 | 63 | 0.128 |
| Excess seam fat | 407 ± 55.127 | −195 * | 0.007 | ||
| Lack of marbling | 503 ± 47.812 | −291 * | 0.003 | ||
| Blood spotting | 149 ± 57.529 | Pale pork | 212 ± 48.526 | −63 | 0.128 |
| Excess seam fat | 407 ± 55.127 | −258 * | 0.002 | ||
| Lack of marbling | 503 ± 47.812 | −354 * | 0.001 | ||
| Excess seam fat | 407 ± 55.127 | Pale pork | 212 ± 48.526 | 195 * | 0.007 |
| Blood spotting | 149 ± 57.529 | 258 * | 0.002 | ||
| Lack of marbling | 503 ± 47.812 | −96 | 0.253 | ||
| Lack of marbling | 503 ± 47.812 | Pale pork | 212 ± 48.526 | 291 * | 0.003 |
| Blood spotting | 149 ± 57.529 | 354 * | 0.001 | ||
| Excess seam fat | 407 ± 55.127 | 96 | 0.253 |
Disclaimer/Publisher’s Note: The statements, opinions and data contained in all publications are solely those of the individual author(s) and contributor(s) and not of MDPI and/or the editor(s). MDPI and/or the editor(s) disclaim responsibility for any injury to people or property resulting from any ideas, methods, instructions or products referred to in the content. |
© 2024 by the authors. Licensee MDPI, Basel, Switzerland. This article is an open access article distributed under the terms and conditions of the Creative Commons Attribution (CC BY) license (https://creativecommons.org/licenses/by/4.0/).
Share and Cite
Simunović, S.; Tomasevic, I.; Djordjevic, V.Ž.; Baltić, T.; Simunovic, S.; Ćirić, J.; Djekic, I. Meat Color, Marbling, and the Evaluation of Defects in Beef and Pork at the Point of Purchase. Appl. Sci. 2024, 14, 6797. https://doi.org/10.3390/app14156797
Simunović S, Tomasevic I, Djordjevic VŽ, Baltić T, Simunovic S, Ćirić J, Djekic I. Meat Color, Marbling, and the Evaluation of Defects in Beef and Pork at the Point of Purchase. Applied Sciences. 2024; 14(15):6797. https://doi.org/10.3390/app14156797
Chicago/Turabian StyleSimunović, Sara, Igor Tomasevic, Vesna Ž. Djordjevic, Tatjana Baltić, Stefan Simunovic, Jelena Ćirić, and Ilija Djekic. 2024. "Meat Color, Marbling, and the Evaluation of Defects in Beef and Pork at the Point of Purchase" Applied Sciences 14, no. 15: 6797. https://doi.org/10.3390/app14156797
APA StyleSimunović, S., Tomasevic, I., Djordjevic, V. Ž., Baltić, T., Simunovic, S., Ćirić, J., & Djekic, I. (2024). Meat Color, Marbling, and the Evaluation of Defects in Beef and Pork at the Point of Purchase. Applied Sciences, 14(15), 6797. https://doi.org/10.3390/app14156797