Abstract
The analysis of ground-penetrating radar (GPR) data is of vital importance for detecting various subsurface features that might manifest as hyperbolic peaks, which are indicators of a buried object or grayscale variation in the case of contrast in the soil texture. This method focuses on identifying exaggerated patterns through a series of image-processing steps. Two GPR images are initially read and preprocessed by extracting channels, flipping, and resizing. Then, specific regions of interest (ROIs) are cropped, and the Fourier transform is further applied to turn them into the frequency domain. With the help of their frequency signatures, these patterns are extracted from the images, and binary masks are constructed to obtain features of interest. These masked images were reconstructed and merged to make hyperbolic features visible. Finally, Local Binary Pattern (LBP) analysis is used to emphasize these hyperbolic peaks, thereby facilitating their recognition across the whole image. The proposed approach improves the detection of performance subsurface features in GPR data; hence, it is an important tool for geophysical surveys and other related applications. The results prove the high performance of the proposed procedure in improving GPR image characteristics.
1. Introduction
Significant progress has been made recently in the field of geophysical data analysis. Exploring and defining the subsurface using more potent and extensive approaches has been the driving force behind this advancement. To improve the process evaluation, different fusion approaches are applied to GPR data. The application of Hilbert-Huang transforms and empirical mode decomposition (EMD) to GPR data processing is the subject of [1]. To increase the signal quality and post-processing flexibility in 3D GPR imaging, the authors suggest a fusion algorithm method. The fusion strategy decreases disturbances in the relic positions and improves imaging accuracy by combining linear approaches with non-linear and non-stationary methods.
The employment of two-dimensional wavelet transforms and singular value decomposition (SVD) for combining GPR and magnetic information is discussed in [2]. To improve the quality and accuracy of the data, especially for the detection of hidden structures, the study employs fusion techniques. The authors increase the understanding of the subsurface target by merging datasets from various geophysical techniques, which helps to discover previously unknown support structures. The authors in [3] present the use of forward and inverse S-transforms to fuse multi-frequency GPR data to detect background problems in railways. Therefore, they achieve deeper penetration and higher resolution using dual-frequency GPR profiling, which is crucial for detecting defects in railway infrastructure. The fusion methodology improves upon conventional assessment methods by synthesizing spectra to provide a composite image with enhanced imaging capabilities.
The authors in [4] present a 3D GPR imaging system for subsurface object reconstruction and detection that is based on DNNs. This technology aims to accurately identify and visualize underground objects using optical inertial fusion, improved migration techniques, and DNN-based detection of targets. The authors accomplish high-resolution imaging and precise depth estimates by combining multiple modules, including DepthNet, for depth prediction. The potential benefits of dual-polarization and ultra-wideband GPR for locating underground mines are considered in [5]. The study uses fusion techniques to minimize clutter and enhance target recognition in radar images using Mahalanobis-based algorithms. The authors provide high accuracy and low false alarm rates for real-time minefield identification by generating composite photos with improved contrast.
In [6], how to merge InSAR and GPR datasets for the purpose of monitoring transportation infrastructure is described. The research highlights how data fusion can be used to detect deformation and subsidence in linear infrastructure, enabling detailed assessments and effective maintenance planning. The work in [7] presents the application of common histogram-oriented gradients (HOG) for landmine detection in GPR data. By combining HOG screening and embedded algorithms to achieve high detection rates, the study outperforms current feature extraction techniques. Furthermore, the combination of multi-frequency GPR data and their use in non-destructive testing is reported in [8]. Through numerical simulations and real-world investigations, the research demonstrates the deep penetration and high-resolution capabilities of fusion algorithms.
To improve detection performance, ground-penetrating radar and metal detector algorithms are combined in [9] to investigate fusion decision processors for mine detection scenarios. By considering the statistical variations between the training and test data, the proposed strategy ensures optimal fusion performance in real-world situations. Curve transformation is explored in [10] for image fusion in archaeological applications. The fusion method enhances both the mapping and understanding of the archaeological site while still reducing ambient noise and highlighting the imprints of buried structures in geophysical images.
The authors in [11] highlight the correlation between the visual evaluation index (VEI) and GPR methods for the evaluation of concrete properties. Using a neural network model, the study establishes a connection between the two, allowing the creation of a fused NDE map for enhanced visualization. Similarly, ref. [12] describes the use of ground-penetrating radar data and deep learning techniques, including convolutional neural networks (CNNs) and recurrent neural networks (RNNs), to identify buried explosive items. The work shows increased performance in their identification by comparing various fusion designs and techniques.
The realization of the integration of hyperspectral and ground-penetrating radar (GPR) data for the purpose of calculating soil moisture is investigated by the authors in [13]. The accuracy is improved by combining different datasets with simulated GPR data significantly enhancing the estimation. However, it is emphasized that more research is needed to increase accuracy.
For trying to find buried unexploded ordnance (UXO), the authors in [14] investigate a combination of electromagnetic induction (EMI) and GPR data. Compared to using GPR or EMI data alone, adding characteristics from both sensors using a boost classifier significantly improves clutter detection and rejection. This feature-level fusion method demonstrates how effectively fusing EMI and GPR data can improve target detection for buried UXOs.
The authors in work [15] describe an innovative method to improve GPR imaging: super-resolution electromagnetic imaging (SREMI). It improves near-surface target detection and geologic structure imaging by creating sharper, higher-resolution GPR images by combining the slope and model sparsity through a fast iterative algorithm. Through the proposed method, the analysis is significantly enhanced, and artifacts are reduced. In conclusion, SREMI minimizes the differences between synthetic and observed data to obtain high-resolution subsurface permeability reflectivity images. Likewise, the study in [16] highlights the importance of the higher resolution made possible by high- and super-resolution GPR data for enabling in-depth interpretations that are necessary for cultural resource management, highlighting the need for new achievements in data processing. The authors in [17] address data discontinuity and sparse observation in on-vehicle multi-channel GPR data by calibrating each channel using an improved Sparse Blind Deconvolution (SBD) method and by applying a super-resolution method that interpolates zeros in between sparsely observed data and then applies synthetic aperture processing.
In [18], sophisticated techniques for analyzing GPR data in archaeological settings are presented. These techniques, which include multi-attribute analysis and high-resolution topographic correction, have been successfully used to map buried archaeological features.
In the processing of geophysical data, such as those obtained with the non-destructive method of ground-penetrating radar, it is considered important to extract and isolate the excessive footprints obtained by the antenna receiver. In computer vision and image processing [19,20], feature extraction is often necessary with the aim of either discriminating between textures in an image due to its efficient pattern representation or object recognition based on the extracted features, but also in processes such as image segmentation and others [21,22,23]. The usefulness of the application of the Local Binary Pattern (LBP) algorithm has been observed, for example, in remote sensing data [24,25], as well as in the excessive responses of the ground-penetrating radar system. It finds applications and can isolate the peaks of those in which it is likely to be located and which represent the true location of its target objects underground.
So far, the need to develop advanced fusion techniques for geophysical data analysis has been highlighted, along with the variety of uses and approaches they have in many fields. Each article offers different approaches and results for combining geophysical datasets, highlighting the benefits of innovation and integration in advancing subsurface research and characterization. The innovation of the present work is the application of advanced image-processing techniques and LBPs to enhance and interpret the data obtained using GPR technology. Simple fusion techniques and spectral processing are applied to enhance image presentation.
The whole work is organized as follows. In Section 2, the data used are described. In Section 3, the basic principle of GPR operation is given, while in Section 4, the LBP transformation is explained. In Section 5, the experimental results are presented using the outlined methodology. Finally, the discussion and conclusions are presented in Section 6.
2. Image Data
In the context of carrying out research in the geographical division of Peloponnese to which the University of Patras belongs, scans were acquired in the following geographical areas by means of the GSSI Utility SIR-3000 Scan LT, 400MHz GPR system. With this system, clear information is obtained from a 5 to 6 m depth with a resolution of about 5 cm. The first subsurface scan was carried out in the lowland settlement at the foot of Mount Didyma, which is part of the prefecture of Argolis (Figure 1). Two huge crater-shaped caves and dolines are the main ornaments of the area, which appear in carbonate limestone rocks and have been caused by subsidence of the soil.
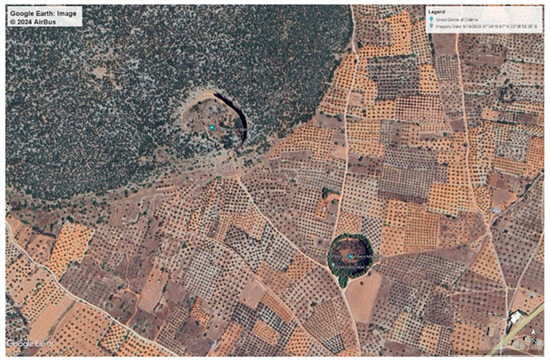
Figure 1.
The two craters at Didyma in the Argolis region. Map Data: Google Earth.
Panagopoula is a coastal area in northern Peloponnese. It is a narrow strip of land between the foothills of Panachaicon Mountain and the Gulf of Corinth. The area of Panagopoula (Figure 2) is prone to slope instability, and in the past, there have been serious landslides that created problems in the road network. For this reason, our visit aimed to study the influence of landslides on the subsoil of the area with ground-penetrating radar.
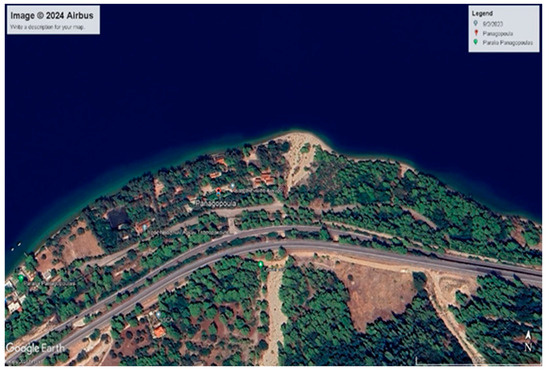
Figure 2.
Panagopoula area in the Achaia region. Map Data: Google Earth.
From both regions, a series of scans were acquired in pairs, forward and backward directions, in order to check the subsoil as the two images illustrated in Figure 3.
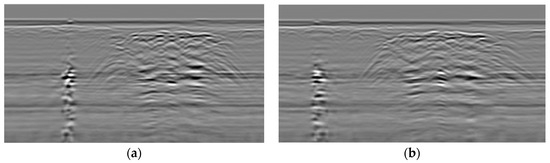
Figure 3.
(a) The forward direction image scan at Didyma’s region. (b) The backward direction image scan at Didyma’s region.
3. GPR Principles
Ground-Penetrating Radar is one of the geophysical methods that revolutionized subsurface exploration. GPR provides high-resolution imaging without any destruction of the target. It is widely used in Archaeology [26], Civil Engineering, Environmental assessment [27], and geology [28].
GPR operates on the concept of the propagation of electromagnetic waves. It sends electromagnetic energy from the surface to the ground in short pulses. These pulses reflect on the surface when they meet the subsurface items of several dielectric elements. Whenever these reflections return, the instrument measures the time taken and the distance and depth to where they reach underground objects.
Afterward, the GPR data are processed by means of a complex algorithm as a two- or three-dimensional image. A plane of the EM wave is spread in a rectangular direction to the plane of the oscillation address of both the electric and magnetic fields: . The propagation equation in the frequency field is given by
How effective and how clear GPR data is depends on how the radar waves interact with subsurface materials. This interaction is affected by many key factors, such as diffusion, propagation speed, resistance properties, and dielectric properties. The radar energy is propagated as it travels through the medium, is affected by the electrical conductivity of the ground, and is described by the scattering effect. Propagation refers to the way radar waves travel through a medium, with the speed affected by the material’s dielectric properties. The specific conductivity , or in other words, the ability of the ground to conduct electricity, affects how quickly the radar signal decays as it travels through the ground. Ground composition with highly conductive materials means that the signal will fade quickly, making it harder for the radar waves to penetrate deeper [29]. In addition, the dielectric constant affects the polarization of the ground by radar waves. Materials that have a high dielectric constant slow down the radar waves and can provide more detailed images, but they can also cause more signal attenuation. Finally, the wave number is one of the most critical parameters, as it combines the speed of the wave and its attenuation. It is a measure of understanding how fast and how far waves can travel in a particular medium. The wavenumber is affected by both the dielectric constant and the conductivity of the soil and is defined as
The radar, through the electromagnetic waves reflected by the electromagnetic fields, allows the GPR antenna to detect the structure and composition of the subsoil, as well as to detect changes in its physical parameters. This happens as the interaction between materials and electromagnetic fields causes reflections, which in turn affect the way the field propagates through the medium. This energy returns to the subsurface when coming across similarly sized, localized features, such as objects or boundaries. Objects generate secondary fields that scatter outwards, serving as masks that are energy absorbers or shadow-casters. GPR instruments have numerous performance requirements but must react promptly to signal travel times, whereas others, like airborne and surveillance radars, require reaction times of minutes to hours. Other essential elements of GPR measurements include time delays and bandwidth. Transmitter electronics send signals to excite the environment through a transmitting antenna, and a receiving antenna measures and translates the transmitted fields into electrical signals. The response in GPR data is artifice by the conical shape of the transmitted signal: both forward and transmitted energy traveled reappears toward the group line. When such energy meets an object, a hyperbolic response is created, with the object always rationalized at its barracks. The reflection will appear at an apparent depth below the receiver because the travel time must obey the hyperbolic equation:
where is the distance from the midpoint of the receiver and transmitter to the target object, and is the distance of the object from the system.
The dissimilar behavior of objects within GPR signals is due to varying electromagnetic properties, mainly dielectric constants. Objects with different dielectric constants bid partial return of the signals, resulting in exaggerated responses, while boundaries drive transmission and the disobedience of signals, thus producing different return shapes. Decoding subsurface properties from radar signals works out well-defined opposition reversals, to sum up the considered data. The ground impulse response, as depicted in Figure 4, antenna system impulse response, and transmitter output are convolved to create the received signal.
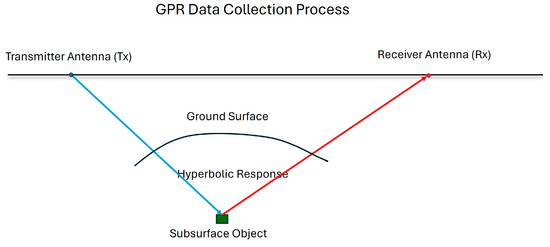
Figure 4.
GPR systems are equipped with two antennas: one as a transmitter and one as a receiver. The transmitter emits electromagnetic waves into the ground, which reflect off subsurface structures. These reflections are captured by the receiver, generating detailed images of hyperbolic responses.
Interpretation implies the method of analyzing the amplitude, frequency, and time of the reflected signals. GPR is one of the most valuable instruments for subsurface surveys due to its imaging, non-invasive methodology, and applicability in many areas. One of the most effective uses of GPR and timewise is its application in research and the evaluation of infrastructure.
This migration technique improves the spatial resolution of GPR images. It involves transforming data from the time-space domain to the frequency-wavenumber domain using Fourier transforms. Kirchhoff migration is a common method used to create subsurface images from GPR data. It calculates the reflection amplitudes by summing the contributions from all points on the reflector surface.
4. Local Binary Pattern Theory
The simplicity of the LBP algorithm in assigning a binary value (0 or 1) to each pixel based on the comparison between the selected central pixel and its neighboring pixels makes it one of the most widely used algorithms. The process is governed by the definition of a circular neighborhood as defined in Figure 5, usually of size 3 × 3 or 5 × 5, and by defining a threshold with the value of which the comparison is made, it is appropriately matched. In this way, combining the received binary values results in a binary string based on which the histogram of the resulting image is constructed [30].
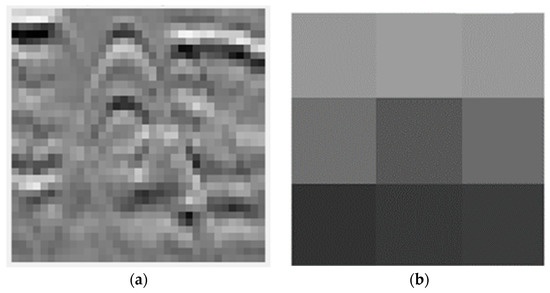
Figure 5.
(a) Indicative of the pixels of a part of the image above in exaggerated response for the representation of one of the neighborhoods where the local binary pattern was realized. (b) The 3 × 3 neighborhood of pixels.
Based on the idea of this algorithm, variants have been developed, such as the Multilevel Local Pattern Histogram finding good application, for example, in the classification of SAR images [24] and Completed Local Binary Patterns (CLBP), which overcome some limitations, such as sensitivity to rotation. This procedure finds application both in the classification of satellite images and in the evaluation of texture for the classification of vegetation of coastal wetlands [31] and in pattern recognition, as in GPR technology, enabling more accurate subsurface imaging [32,33].
The equation that was applied in the proposed method to evaluate the LBP is defined as
where is the center pixel, is the number of sampling points, is the radius, is the gray value of the center pixel, is the gray value of the sampling point, and is the sign function that converts the difference between the gray values and into binary form and defined as:
The binary values are then weighted by to form the LBP.
We need to know if a binary pattern is uniform and if it is, it has at most two bitwise transitions (0 to 1 or 1 to 0), which are useful for texture analysis as they capture fundamental texture information. To check the above condition, an equation is applied:
If , the LBP pattern is considered uniform. Once the LBP values are computed for all pixels in an image or a region of interest, these values can be summarized in a histogram:
where represents the frequency of the LBP in the image, and is an indicator function that equals 1 if the condition is true and 0 otherwise.
5. Methodology and Experimental Results
In the actual procedure, as demonstrated in Figure 6, two of the images are read and prepared for data processing by initially mirroring one of them horizontally to be able to fit the other one and find dimensional similarities. Key regions of interest are extracted from both images, and the 2D Fourier Transform (FFT) is applied to analyze their frequency content. Pattern recognition techniques are then applied by thresholding the images and using LBP for texture analysis. Finally, the processed data are combined to perform reconstruction and highlight important features of the subsurface. The subsequent sections will analyze each step, from image pre-processing and FFT application to pattern recognition and the final image reconstruction.
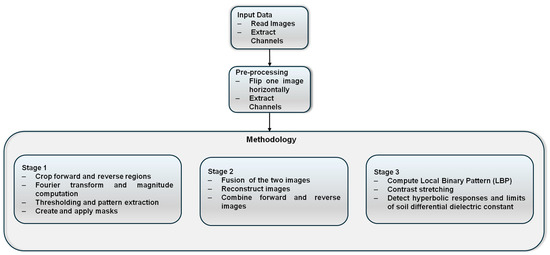
Figure 6.
Block diagram of the pre-processing and GPR image analysis procedures.
When receiving and recording the excessive responses that arise in the process of subsurface investigation with GPR technology, it is understood that the correct and appropriate processing of these data is required so that the interpretation of the subsurface analysis is more detailed and accurate. For this purpose, during the scanning process with the GPR, two images of the same examined path were taken in the present work, the first in one direction and the second in the opposite direction. This procedure was performed for each path so that we had a pair of scans in a different direction. For better illustration, in Figure 7, a piece of the path at Panagopoula’s scan is shown as the initial length of the image is 21,688 pixels.
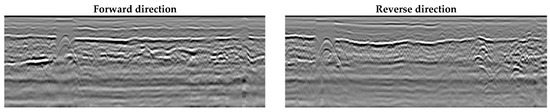
Figure 7.
The forward direction scan (left) and the reverse direction scan (right) of the area are shown here. These scans reveal subsurface structures, providing detailed insights into the geological features of the Panagopoula region. A comparison of both scan directions helps in validating the consistency and accuracy of the detected subsurface features.
The captured images represent the reflectance data from the underground structures in the area. The two “versions” of the image, as will be analyzed below, can help to compare symmetrical patterns and/or to align and compose the two for further analysis. Upon visual comparison of the images and due to the large extent of the path, various footprints from various underground objects and artifacts can be seen. Based on this, the image is inspected to identify ROIs, which will be selected to perform the proposed processing method that will be analyzed. The ROI is chosen to be some excess response from the total captured, as defined in Figure 8.
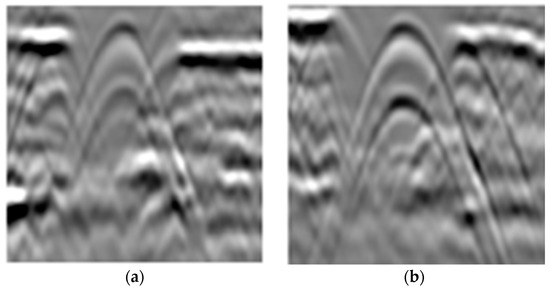
Figure 8.
The regions of interest of the two scans. (a) The ROI of the forward direction of Panagopoula’s scan to be used to export patterns. (b) The ROI of the backward direction of Panagopoula’s scan to be used to export patterns.
The proposed method consists of the following processing steps of the data with the aim of extracting GPR patterns from the ROI and then to be able to identify from the subsidiary image many hyperbolic responses, facilitating the researcher in the targeted discrimination of excessive peaks, which also demonstrates the existence of some buried object or water table etc. Because each shot is also plagued by ringing or objects that may overlap with each other, it usually becomes difficult to distinguish hyperbolic peaks from the overall image. The extracted pattern is approximately hyperbolic in shape (Figure 9) and the evaluation of the Fourier transform is carried out.
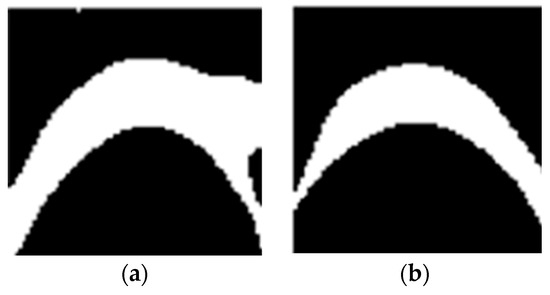
Figure 9.
(a) The binary pattern extraction from a hyperbolic response will serve as the initial input for the subsequent LBP analysis from the forward scan. (b) Binary pattern extraction from a hyperbolic response, which will serve as the initial input for the subsequent LBP analysis from the backward scan.
The Fourier transform helps in the analysis of the frequency components and can reveal periodic structures, such as hyperbolic responses. A binary pattern is created based on the intensity values of the ROI, and through appropriate thresholding, regions with specific intensity values that highlight a hyperbolic shape pattern are isolated (Figure 9). We then analyze the components of each new binary pattern and obtain their magnitude spectrum that demonstrates the dominant frequencies, which correspond to structural features and edges in the spatial domain. Therefore, because excessive patterns create specific frequency components, taking the magnitude spectrum makes them easier to identify and analyze. A circular mask is also applied on the spectrum amplitude to obtain the frequency elements closest to dc, as they contain the most important structural information, helping to focus on the reconstruction of the pattern and to identify the remaining redundant patterns as well. Upon completion of stage 1 of the methodology, DC element hiding is performed, where pixels inside a specified radius in the domain of the spectrum amplitude are set to zero. This operation effectively removes or reduces the effect of the DC component in the subsequent processing stages, which represents the average intensity or average baseline of the image. By removing the DC component, we focus more on the variations and details present in the frequency content of the image, improving the resolution of specific patterns. For the sake of convenience, only a small part of the scan is presented at this intermediate stage in Figure 10.
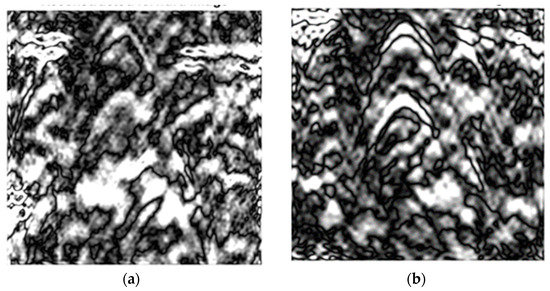
Figure 10.
(a) A reconstructed image, after masking and pattern recognition, highlighting the most powerful hyperbolic responses, and providing a detailed and accurate representation. (b) The same applies to the other image as well.
Thus, by combining components from the magnitude spectrum of the extracted pattern and the phase information of the original image, it is ensured that the phase information they contain and the critical spatial information are preserved in the resulting image. Since the aim of the method is to detect as best as possible the excessive patterns throughout the image and to view the reconstructed one to distinguish them or not, the inverse Fourier transform is applied, and its absolute value is obtained. This method enhances the visibility of subsurface features in GPR data, preserving the spatial information that is vital for the accurate reconstruction of their spatial arrangement. The masking that is applied helps to filter out unwanted high-frequency noise that can alter important features of the underground space.
The process is completed by summing up the two resulting images to better visualize the localized over-response pattern after the filtering process, which was created by capturing and then composing the two scans of the same path but opposite scan directions (Figure 11).
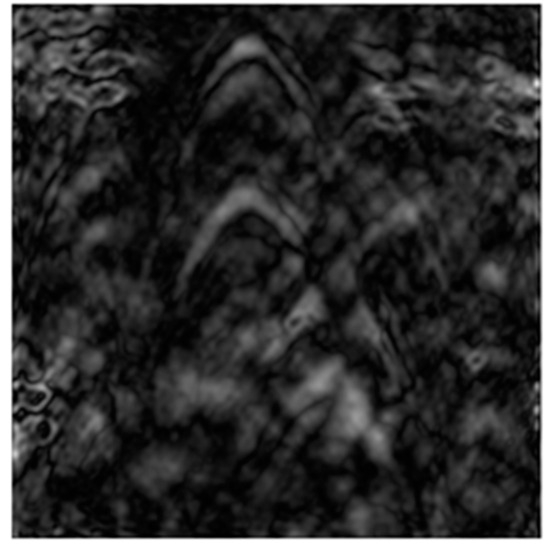
Figure 11.
A part of the result of the summation of the two images, created after applying masking and fusion techniques, effectively highlighting the most powerful hyperbolic responses.
If the summation is performed all over the entire length of the image, the obtained reconstructed image will be as shown in Figure 12. The combination of two GPR images has the advantage of improving the SNR by = 1.41. This is because the signal remains the same while the standard deviation of the noise decreases by (2 is the number of images).
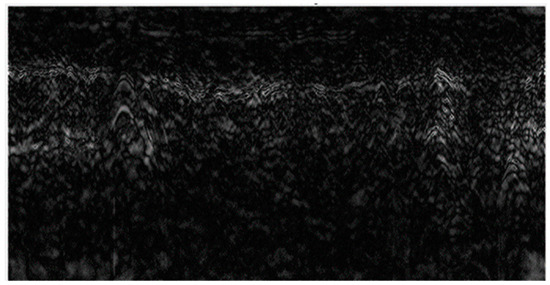
Figure 12.
The summation image created after applying masking and fusion techniques effectively highlights the most powerful hyperbolic responses.
Finally, the image obtained after the summation is further analyzed using the LBP technique to extract detailed textural information, as illustrated in Figure 13. Thus, this information complements the frequency domain analysis performed earlier. While the Fourier transform emphasizes periodic structures and dominant frequencies, LBP provides detailed textural information, enabling a more comprehensive analysis since it captures local variations in pixel intensity by emphasizing edges and boundaries and enhancing the visibility of exaggerated patterns. The application of the LBPs is more attractive than co-occurrence matrixes or other 2D statistical-textural characteristics since the mathematical burden is small and the threshold selection is flexible.
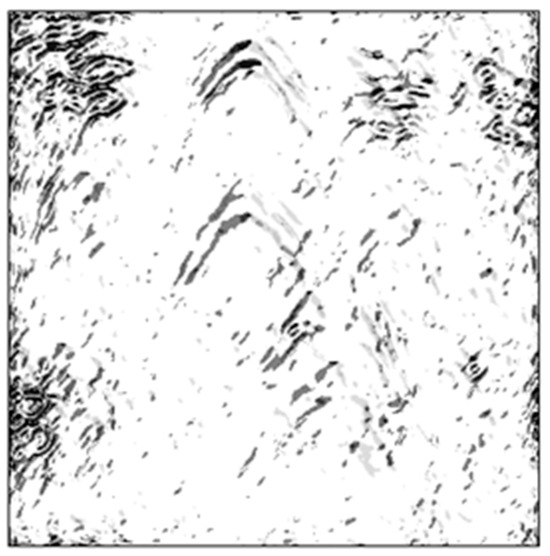
Figure 13.
The result of using LBP analysis on part of the summed image. This provides a clearer and more detailed view of hyperbolics.
Using LBP analysis on the summation of the images, we take the result as defined in Figure 14. In the fusion stage, we chose a specific linear combination between the two images to enhance the most important features. By assigning more weight to the inverse image, as it contains clearer information, the resulting cumulative image provides a balanced and improved representation.
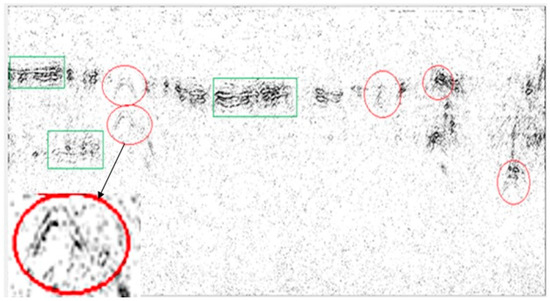
Figure 14.
LBP with the summation of all images. Red Circles: These patterns could represent buried objects. Green Rectangles: Such areas could be voids, different material types, or potential points of interest that differ from the surrounding substrate.
As can be observed, the results of the LBP method differ when it is performed on a part of the image compared to that obtained when it is applied to the entire image. By performing an LBP analysis on a part of the cumulative image, we could obtain an indication of the most relevant and salient features. In contrast, in full-image analysis, irrelevant patterns and noise can cause location interference between neighboring pixels, thereby reducing the clarity and accuracy of the detected features. Combining this targeted approach with an optimized linear combination of forward and inverse reconstruction images significantly improves the detectability and interpretability of subsurface structures.
6. Discussion and Conclusions
The study carried out highlighted the effectiveness of advanced pre-processing techniques as well as basic image processing, specifically for data obtained with GPR technology. Taking the two directional images of the same route ensured the best visualization of each path, and the combination of the two ensured a better interpretation and visualization of the examined subsoil.
The subsequent isolation of specific regions of interest to extract patterns that would become key to basic processing and synthesis helped to enhance the analysis of the GPR data and the overall detection process. This practice of creating binary patterns, in combination with the pattern recognition application through thresholding, effectively enhances the detection of hyperbolic responses throughout the extent of the subsidiary images, proving the usefulness of the method in real scenarios such as the present one for the inspection of subsoil in a seismic area. The application of the Fourier transform to the analysis of the frequency components of the data proved extremely valuable, as this approach highlighted features that were not easily identified in the spatial domain, thus underscoring the importance of frequency analysis in GPR data.
Subsequently, reconstruction and fusion techniques that combined the forward and reverse images successfully enhanced the visibility of hyperbolic occultations. The fusion process was highly effective in integrating the information from both images, resulting in a more detailed and accurate representation of underground structures. This combinatorial analysis helped highlight the strong hyperbolic responses in the entire dataset, a process that can be incorporated into other applications in the future.
Finally, LBP analysis provided texture characterization, contributing to the identification of specific patterns in the image, indicating it is a powerful tool for knowledge about the structure and composition of the subsoil.
In summary, future work could focus on improving pattern recognition techniques by improving the threshold criteria and incorporating machine learning algorithms. In addition, employing additional pre-processing or synthesis techniques can also contribute to more accurate data analysis and visualization. Current research is focused on identifying the material type of the detected objects. However, this constitutes a separate research area that has to do with the exact dielectric properties of underground soil.
Author Contributions
S.T. and G.K. have equally contributed to Conceptualization, Methodology, Validation, and Writing—Original Draft Preparation. All authors have read and agreed to the published version of the manuscript.
Funding
This research received no external funding.
Institutional Review Board Statement
Not applicable.
Informed Consent Statement
Not applicable.
Data Availability Statement
Data availability upon request.
Acknowledgments
Styliani Tassiopoulou was financially supported by a scholarship from the Andreas Mentzelopoulos Foundation.
Conflicts of Interest
The authors declare no conflicts of interest.
References
- Jeng, Y.; Yu, H.-M.; Chen, C.-S. Algorithm Fusion for 3D Ground-Penetrating Radar Imaging with Field Examples. Remote Sens. 2023, 15, 2886. [Google Scholar] [CrossRef]
- Rui, J.O.; Caldeira, B.; Teixidó, T.; Borges, J.F.; Bezzeghoud, M. Geophysical Data Fusion of Ground-Penetrating Radar and Magnetic Datasets Using 2D Wavelet Transform and Singular Value Decomposition. Front. Earth Sci. 2022, 10, 1011999. [Google Scholar] [CrossRef]
- Xiao, J.; Liu, L. Multi-Frequency GPR Signal Fusion Using Forward and Inverse S-Transform for Detecting Railway Subgrade Defects 2015. In Proceedings of the 2015 8th International Workshop on Advanced Ground Penetrating Radar (IWAGPR), Florence, Italy, 7–10 July 2015. [Google Scholar] [CrossRef]
- Feng, J.; Yang, L.; Wang, H.; Song, Y.; Xiao, J. GPR-Based Subsurface Object Detection and Reconstruction Using Random Motion and DepthNet. In Proceedings of the 2020 IEEE International Conference on Robotics and Automation (ICRA), Paris, France, 31 May–31 August 2020. [Google Scholar] [CrossRef]
- Earp, S.L.; Hughes, E.S.; Elkins, T.J.; Vickers, R. Ultra-Wideband Ground-Penetrating Radar for the Detection of Buried Metallic Mines. IEEE Aerosp. Electron. Syst. Mag. 1996, 11, 30–39. [Google Scholar] [CrossRef]
- Bianchini Ciampoli, L.; Gagliardi, V.; Clementini, C.; Latini, D.; Del Frate, F.; Benedetto, A. Transport Infrastructure Monitoring by InSAR and GPR Data Fusion. Surv. Geophys. 2019, 41, 371–394. [Google Scholar] [CrossRef]
- Torrione, P.A.; Morton, K.D.; Sakaguchi, R.; Collins, L.M. Histograms of Oriented Gradients for Landmine Detection in Ground-Penetrating Radar Data. IEEE Trans. Geosci. Remote Sens. 2014, 52, 1539–1550. [Google Scholar] [CrossRef]
- Bi, W.; Zhao, Y.; Shen, R.; Li, B.; Hu, S.; Ge, S. Multi-Frequency GPR Data Fusion and Its Application in NDT. NDT E Int. 2020, 115, 102289. [Google Scholar] [CrossRef]
- Liao, Y.; Nolte, L.W.; Collins, L.M. Decision Fusion of Ground-Penetrating Radar and Metal Detector Algorithms—A Robust Approach. IEEE Trans. Geosci. Remote Sens. 2007, 45, 398–409. [Google Scholar] [CrossRef]
- Karamitrou, A.; Bogiatzis, P.; Tsokas, G.N. Fusion of Geophysical Images in the Study of Archaeological Sites. Archaeol. Prospect. 2020, 27, 119–133. [Google Scholar] [CrossRef]
- Pashoutani, S.; Zhu, J.; Sim, C.; Won, K.; Mazzeo, B.A.; Guthrie, W.S. Multi-Sensor Data Collection and Fusion Using Autoencoders in Condition Evaluation of Concrete Bridge Decks. J. Infrastruct. Preserv. Resil. 2021, 2, 18. [Google Scholar] [CrossRef]
- Moalla, M.; Frigui, H.; Karem, A.; Bouzid, A. Application of Convolutional and Recurrent Neural Networks for Buried Threat Detection Using Ground Penetrating Radar Data. IEEE Trans. Geosci. Remote Sens. 2020, 58, 7022–7034. [Google Scholar] [CrossRef]
- Riese, F.M.; Keller, S. Fusion of Hyper Spectral and Ground Penetrating Radar Data to Estimate Soil Moisture. In Proceedings of the 2018 9th Workshop on Hyperspectral Image and Signal Processing: Evolution in Remote Sensing (WHISPERS), Amsterdam, The Netherlands, 23–26 September 2018. [Google Scholar]
- Masarik, M.P.; Burns, J.; Thelen, B.T.; Kelly, J.; Havens, T.C. Enhanced Buried UXO Detection via GPR/EMI Data Fusion. Int. Soc. Opt. Eng. /Proc. SPIE 2016, 9823, 98230R. [Google Scholar] [CrossRef]
- Gao, K.; Donahue, C.M.; Henderson, B.G.; Modrak, R.T. SREMI: Super-Resolution Electromagnetic Imaging with Single-Channel Ground-Penetrating Radar. Appl. Geophys. 2022, 205, 104777. [Google Scholar] [CrossRef]
- Trinks, I.; Hinterleitner, A.; Neubauer, W.; Nau, E.; Löcker, K.; Wallner, M.; Gabler, M.; Filzwieser, R.; Wilding, J.; Schiel, H.; et al. Large-Area High-Resolution Ground-Penetrating Radar Measurements for Archaeological Prospection. Archaeol. Prospect. 2018, 25, 171–195. [Google Scholar] [CrossRef]
- Imai, T.; Mizutani, T. Super Resolution of Multi-Channel Ground Penetrating Radar Volume Data by Zero-Interpolated 3D Kirchhoff Migration. In Life-Cycle of Structures and Infrastructure Systems; CRC Press: Boca Raton, FL, USA, 2023; pp. 3975–3982. [Google Scholar] [CrossRef]
- Zhao, W.; Forte, E.; Levi, S.T.; Pipan, M.; Tian, G. Improved High-Resolution GPR Imaging and Characterization of Prehistoric Archaeological Features by Means of Attribute Analysis. J. Archaeol. Sci. 2015, 54, 77–85. [Google Scholar] [CrossRef]
- Koukiou, G.; Anastassopoulos, V. Local difference patterns for drunk person identification. Multimed. Tools Appl. 2018, 77, 9293–9305. [Google Scholar] [CrossRef]
- Koukiou, G.; Anastassopoulos, V. Drunk person identification using local difference patterns. In Proceedings of the 2016 IEEE International Conference on Imaging Systems and Techniques (IST), Chania, Greece, 4–6 October 2016; pp. 401–405. [Google Scholar] [CrossRef]
- Kumar, S.; Sagar, V.; Punetha, D. A comparative study on facial expression recognition using local binary patterns, convolutional neural network and frequency neural network. Multimed. Tools Appl. 2023, 82, 24369–24385. [Google Scholar] [CrossRef]
- Tahir, M.; Riaz, F.; Usman, I.; Habib, M.I. Classification of Gastric Lesions Using Gabor Block Local Binary Patterns. Comput. Syst. Sci. Eng. 2023, 46, 4007–4022. [Google Scholar] [CrossRef]
- Aboutabit, N. A modified Local Binary Pattern based on homogeneity criterion for robust edge detection. Signal Image Video Process. 2023, 17, 2315–2322. [Google Scholar] [CrossRef]
- Dai, D.; Yang, W.; Sun, H. Multilevel Local Pattern Histogram for SAR Image Classification. IEEE Geosci. Remote Sens. Lett. 2011, 8, 225–229. [Google Scholar] [CrossRef]
- Musci, M.; Feitosa, R.Q.; Velloso, M.L.F.; Novack, T. An evaluation of texture descriptors based on local binary patterns for classifications of remote sensing images. Bol. Cienc. Geod. 2011, 17, 549–570. [Google Scholar] [CrossRef]
- Conyers, L.B.; Leckebusch, J. Geophysical Archaeology Research Agendas for the Future: Some Ground-Penetrating Radar Examples. Archaeol. Prospect. 2010, 17, 117–123. [Google Scholar] [CrossRef]
- Knight, R. Ground Penetrating Radar for Environmental Applications. Annu. Rev. Earth Planet. Sci. 2001, 29, 229–255. [Google Scholar] [CrossRef]
- Neal, A.; Roberts, C.L. Applications of Ground-Penetrating Radar (GPR) to Sedimentological, Geomorphological and Geoarchaeological Studies in Coastal Environment; Geological Society: London, UK, 2000; Volume 175, pp. 139–171. [Google Scholar] [CrossRef]
- Jol, H. Ground Penetrating Radar Theory and Applications; Elsevier: Amsterdam, The Netherlands, 2009; Chapter 1; pp. 6–14. ISBN 9780444533487. [Google Scholar]
- Huang, D.; Shan, C.; Ardabilian, M.; Wang, Y.; Chen, L. Local Binary Patterns and Its Application to Facial Image Analysis: A Survey. IEEE Trans. Syst. Man Cybern. Part C (Appl. Rev.) 2011, 41, 765–781. [Google Scholar] [CrossRef]
- Wang, M.; Fei, X.; Zhang, Y.; Chen, Z.; Wang, X.; Tsou, J.Y.; Liu, D.; Lu, X. Assessing Texture Features to Classify Coastal Wetland Vegetation from High Spatial Resolution Imagery Using Completed Local Binary Patterns (CLBP). Remote Sens. 2018, 10, 778. [Google Scholar] [CrossRef]
- Harris, S.; Alvey, B.; Ho, D.; Zare, A. LBP Features for Hand-Held Ground Penetrating Radar. Proc. SPIE Int. Soc. Opt. Eng. 2017, 10182, 101820Z. [Google Scholar] [CrossRef]
- Maas, C.; Schmalzl, J. Using Pattern Recognition to Automatically Localize Reflection Hyperbolas in Data from Ground Penetrating Radar. Comput. Geosci. 2013, 58, 116–125. [Google Scholar] [CrossRef]


Disclaimer/Publisher’s Note: The statements, opinions and data contained in all publications are solely those of the individual author(s) and contributor(s) and not of MDPI and/or the editor(s). MDPI and/or the editor(s) disclaim responsibility for any injury to people or property resulting from any ideas, methods, instructions or products referred to in the content. |
© 2024 by the authors. Licensee MDPI, Basel, Switzerland. This article is an open access article distributed under the terms and conditions of the Creative Commons Attribution (CC BY) license (https://creativecommons.org/licenses/by/4.0/).