Article

Effect of Wettability and Permeability on Pore-Scale of CH4–Water Two-Phase Displacement Behavior in the Phase Field Model

1
College of Energy Environment and Safety Engineering, China Jiliang University, Hangzhou 310018, China
2
School of Safety Engineering, China University of Mining and Technology, Xuzhou 221116, China
*
Authors to whom correspondence should be addressed.
Appl. Sci. 2024, 14(15), 6815; https://doi.org/10.3390/app14156815
Submission received: 28 June 2024 / Revised: 29 July 2024 / Accepted: 30 July 2024 / Published: 5 August 2024
(This article belongs to the Special Issue Coalbed Degassing Method and Technology)

Abstract

:
Hydraulic measures such as hydraulic slotting and hydraulic fracturing are commonly used in coal seam pressure relief and permeability enhancement. Two-phase flow patterns of CH4–water in pore-sized coal seams after hydraulic measures are critical to improve gas extraction efficiency. The phase field module in COMSOL Multiphysics™ 5.4 and the classical ordered porous media model were used in this paper. The characteristics of CH4–water two-phase immiscible displacement in coal seams under different capillary numbers (Ca) and viscosity ratios (M) were simulated and quantitatively analyzed. By changing the contact angle of the porous media, the flow patterns of CH4–water two-phase in coal with different wettability were simulated. Results show that wettability significantly affects the displacement efficiency of CH4. Additionally, by constructing a dual-permeability model to simulate the varying local permeability of the coal, the flow patterns of different Ca and M in dual-permeability media were further investigated. It is found that CH4 preferentially invades high-permeability regions, and the displacement efficiency in low-permeability regions increases with higher Ca and M, providing a reference for gas extraction from coal seams after hydraulic measures.

1. Introduction

With the increasing demand for energy and the progressive exhaustion of shallow resources, the focus of resource extraction has gradually shifted to deep underground. However, deep underground mining faces complex geological environments and extreme engineering conditions, posing new challenges to traditional mining technologies [1,2,3,4]. Hydraulic measures such as hydraulic slotting and hydraulic fracturing are commonly used in coal seam pressure relief and permeability enhancement. After these measures, the gas extraction is affected by the water in the coalbed. The gas–liquid two-phase flow in porous media is closely related to many geological engineering fields, including coalbed methane or oil extraction and CO2 geological sequestration [5,6,7,8,9]. The key issues affecting the efficiency of coalbed methane extraction are the flow mechanisms in porous media and the instability of the flow interface in a two-phase flow [10]. Factors such as the heterogeneity of porous media, fluid viscosity, capillarity, and wettability are the main causes of the instability of the two-phase flow interface [11,12].
Micromodels and numerical simulations offer a cost-effective and flexible means to investigate two-phase flow mechanisms at the pore scale, providing a direct reflection of varying flow characteristics. Therefore, micromodels and numerical simulation methods are used to study the mechanisms of water–oil, CO2–water, and other two-phase flows at the pore scale. It is indicated that the mechanical imbalance causes the two-phase flow interface to be unstable, manifesting diverse advancing flow characteristics macroscopically [13]. The instability of this interface is mainly induced by the curved capillary forces and non-local viscous forces present between the fluids [14]. The slow displacement caused by capillary forces is primarily governed by the geometric shape of the pore structure, while the viscous forces generated by friction slow down the flow at the interface [15]. This competition of forces is largely influenced by factors such as pore geometry, wettability, gravity, surface roughness, and disorder [16,17,18]. Despite these influences, Lenormand [19] introduced the classic phase diagram of immiscible displacement through microfluidic experiments, defining the invasion patterns as three modes: capillary fingering, viscous fingering, and stable displacement. Zhang [20] conducted extensive experiments using a two-dimensional homogeneous micromodel to study the effects of viscous and capillary forces on instability fingering and fluid saturation patterns. They plotted the observed displacement states onto a logM-logCa stability phase diagram. By adjusting the capillary number (Ca) and viscosity ratio (M), three flow states—viscous fingering, capillary fingering, and stable displacement—could be identified. H.A. Akhlaghi Amiri [21] studied non-isothermal water–oil displacement in homogeneous porous media through numerical simulations and found that reducing M exacerbated the water channeling effect in high-permeability layers, while lowering Ca might lead to higher water sweep efficiency. Chen [22] further extended the invasion pattern phase diagram proposed by Lenormand on the logM-logCa plane through water–oil displacement experiments in homogeneous porous media, quantifying the dynamic effects of capillary and viscous forces on the immiscible fluid–fluid displacement process.
Heterogeneity affects fluid displacement by altering the state of forces present in the reservoir, while the wettability of the medium influences displacement by determining the microscopic distribution of fluid in the pore space. The wettability of the solid is represented by the contact angle on the wall surface, which is the static contact angle measured when the liquid is stable on a flat solid surface. When the gravity is neglected, and when both wettability and the disorder of the porous media are involved, the competitive effects of capillary and viscous forces become more complex [23]. Gong and Wang [24,25] emphasized the effect of wettability on two-phase flow in heterogeneous porous media, discovering that wettability heterogeneity and transitions significantly impact fluid displacement paths and invasion patterns. Zhao [26] used microfluidic cells to study displacement patterns under various wettability conditions. It was found that the increase in the wall surface contact angle leads to more uniform displacement fronts and higher displacement efficiency. Since the impact of gravity on two-phase flow cannot be entirely ignored in real scenarios, Liu and Chen [27,28] studied immiscible displacement in heterogeneous porous media from the perspective of gravity’s influence. By evaluating the effects of hypergravity and dimensionless analysis, the feasibility of using hypergravity models was systematically analyzed to assess CO2 migration in geological contexts.
Most scholars studying two-phase flow in porous media at the pore scale focus on oil reservoir extraction, with few examining the flow state of gas in coal seams at the pore scale. Therefore, in the field of coal mining, it is urgent to explore the relationship between coal wettability, gas extraction efficiency, and the fingering phenomena resulting from the displacement of multiphase media within pores during and after hydraulic measures. This study simulates coalbed methane extraction by utilizing the Navier–Stokes and Cahn–Hilliard equations to model the gas–water two-phase flow in porous media and solves these equations using the finite element method in COMSOL Multiphysics™ [29]. The model is subsequently applied to address gas–water displacement at the pore scale following hydraulic fracturing of coal seams. The viscous and capillary instabilities under homogeneous conditions as well as the effects of wettability and permeability on flow patterns and fluid saturation are investigated.

2. Theoretical and Numerical Scheme

2.1. Control Equations

In a two-phase flow, the phase field parameter (Φ) is a measure used to describe the distribution of two immiscible fluids, such as liquid and gas. This concept is typically used to indicate the presence of two different phases in a system, such as the distribution of droplets in the gas or bubbles in the liquid. In a two-phase flow, the phase field parameter method can be utilized to simulate the evolution of phase interfaces and the distribution of the two phases. The phase field parameter (Φ) usually takes values between −1 and 1, indicating the proportion of the two different phases. For instance, when Φ = −1, it indicates a point or region entirely occupied by one phase (e.g., liquid). While Φ = 1 indicates the other phase (e.g., gas), with intermediate values representing the extent of the mixed phase. The specific equations are formulated as [30]:
v Φ = 1 + Φ 2 v 1 + 1 Φ 2 v 2
where ν(Φ) is described as a property (such as velocity) of the phase field parameter Φ function, with ν1 as the property of phase 1 and ν2 as the property of phase 2.
To simulate the flow of immiscible two-phase, the interface changes in the two-phase flow can be described by the incompressible Navier–Stokes equations, the continuity equation, and the phase field equation [31]. The Navier–Stokes equations are the fluid momentum conservation equations, which are used to describe the transport characteristics of fluid mass and momentum. In micropores, capillary forces play a significant role in the CH4–water process; thus, surface tension must be considered. The immiscible two-phase flow with surface tension can be described by the Navier–Stokes equations, with the specific formula as follows [32,33]:
ρ u t + ρ u u = p + μ u + u T + F
  u = 0
where ρ is the density of the fluid, u is the velocity vector of the fluid, p is the pressure of the fluid, and T is the temperature, ▽ is the Laplace operator, which is used to describe the diffusion process of the phase field, and µ is the viscosity of the fluid.
F characterizes the contribution of capillary forces to the fluid momentum due to the two-phase fluid interface and can be expressed as [21]:
F = G Φ
G = λ 2 Φ + Φ Φ 2 1 ε 2
where G is the chemical potential, λ is the mixing energy density, and ε is the capillary width with respect to the interface thickness.

2.2. Phase Field Equations

The phase-field method is of high accuracy, stability and wide applicability. It can accurately describe the distribution and interfacial evolution of different phases of a two-phase fluid by introducing continuous phase-field variables. The method can also accurately simulate the dynamic behavior of complex interfaces. Therefore, when considering the interfacial problem of two-phase flow, the Cahn–Hilliard equation is particularly suitable for describing the interfacial motion of two phases that do not mix with time. The specific equations are formulated as [34]:
Φ t + u · Φ = · γ λ ε 2 ψ
ψ = ε 2 Φ + Φ 2 1 Φ + ε 2 λ f Φ
In the above equations, γ is the mobility, which denotes the moving speed of the flowing interface per unit driving force. ε denotes the capillary width with respect to the interface thickness. λ denotes the mixing energy density. Φ is the phase field variable, which is used to characterize the distribution of the different phases in the system. Ψ is the auxiliary variable of the phase field, and ▽ is the Laplace operator, which is used to describe the diffusion process in the phase field. These parameters are related to the surface tension σ as a function of the surface tension as follows [35]:
σ = 2 2 3 ε λ
The mobility rate γ is a function of the mobility adjustment parameter χ and the interface thickness control parameter ε. The mobility rate determines the diffusion time scale of the Cahn–Hilliard equation. Moderate migration rates can maintain a constant interface thickness and prevent excessive suppression of convective terms. The mobility γ is expressed as [36,37]:
γ = χ ε 2
In COMSOL Multiphysics™, the effect of the wettability of the walls of a porous media on the two-phase flow interface is characterized by the following equations [38]:
u = 0
n · γ λ ε 2 ψ = 0
n · ε 2 Φ = ε 2 cos θ w Φ
where n is the normal vector in the Cahn–Hilliard equation indicating the direction of the phase field gradient. θw is the surface contact angle, which is used to characterize the wettability condition of the porous media.

2.3. Numerical Scheme

The actual pore structure of coal rock is similar to the microstructure of most natural porous media, which has extremely complex, variable, and irregular internal network structures. Gas–liquid two-phase flow studies conducted by using the original micropore structure of coal mass directly are quite difficult, and the results are hard to quantify. Therefore, the classical ordered porous media model is selected to study the rules of gas–liquid two-phase displacement and transport.
The model used for simulation is shown in Figure 1. The length and width of this porous media model are 20 mm and 10 mm, respectively. The internal structure is obtained by arranging circles with a radius of 290 μm. The throat width is 50 μm, and the total pore area is 0.48 cm2. The simulation is based on the following assumptions. Firstly, the skeleton of the model is rigid and does not deform under pressure. Secondly, the flow modes of water and gas in the porous media are laminar. Both the water and the gas are incompressible and immiscible fluids. The temperature of the entire porous media model remains constant, and the effects of temperature and gravity on the fluid are ignored. Before the simulation begins, the porous media is filled with gas or water to simulate the actual condition of real coal seams after hydraulic fracturing. Injection is performed at a constant flow rate from the inlet boundary (from left to right), with the outlet pressure set to zero. The top and bottom boundaries are sealed to eliminate disturbances caused by uneven injection distribution.

3. Results and Discussion

3.1. Analysis of Local Flow Patterns

When two immiscible fluids compete for displacement in a porous media, their flow patterns are influenced by numerous factors, including the properties of the fluids (viscosity, density, wettability, etc.) and the dimensions of the porous media (particle size, throat size, surface roughness, etc.). When two immiscible fluids flow in a pore structure dominated by cylindrical particles, their flow mode is primarily crescent motion. Cieplak and Robbins [39,40] analyzed and defined three basic forms of crescent motion: burst, touch, and overlap. As shown in Figure 2, the circular arcs denote stable menisci, menisci at corresponding maximal capillary pressure, and advanced menisci for the respective instability modes, respectively. When the invading phase contacts the defending phase during an invasion, crescent-shaped interfaces are formed, varying with pore size. The curvature of the crescent-shaped interfaces formed by the invading phase is the main determinant of these three forms. The burst mode (Figure 2a) typically appears when the curvature of the crescent-shaped interface begins to decrease gradually, causing a local decrease in capillary pressure, leading the invading phase to invade adjacent pores. The touch mode (Figure 2b) follows the burst mode. In the touch mode, the curvature of the crescent-shaped interface continuously increases, causing an increase in capillary pressure. The advancement of the crescent-shaped interface towards the cylindrical particles is accelerated. Then the crescent-shaped interface and the cylindrical particles contact. The original crescent is disrupted and bifurcated. The overlap mode (Figure 2c,d) requires two adjacent crescents. After the touch mode, the two branches formed by the split invading fluid meet and overlap at the three-phase contact line or fluid–fluid interface due to local geometric factors, forming a new main path. The burst and touch modes are influenced simply by the local geometry of a single channel and its adjacent pores, rather than the filling state of adjacent channels. Unlike the instability of the burst and touch modes, the overlap mode only occurs when there is at least one crescent-shaped interface between adjacent channels, leading to the penetration of the interface.
The basic interface advancement mode is influenced by the contact angle and local geometry and is closely related to capillary pressure. Capillary pressure arises from the surface tension effects at the liquid–gas interface, which provides the main driving force for the invading fluid. Derived from the two-dimensional Young–Laplace equation:
P c = σ 1 R 1 + 1 R 2
where Pc is the capillary pressure, σ is the interfacial tension, and R1 and R2 are the radii of curvature of the invading curved lunar surface.
Lan et al. [41,42] analyzed the triggering process of pore filling in disordered porous media using geometric analysis based on the three basic forms of crescent motion and the size of the curvature radius. To more intuitively study the macroscopic displacement mechanisms of capillary fingering and viscous fingering, magnified local images of the simulation results are used to observe the evolution of the two-phase interface.
When lgCa = −4.25 and lgM = −0.52 (Figure 3), the gas invasion phase exhibited an atypical invasion mode evolving from capillary fingering to viscous fingering during the breakthrough water displacement process. As shown in Figure 3a, when the curvature of the flow interface of the invading phase in pore throat A exceeds the critical curvature, the fluid continuously invades forward under the influence of capillary pressure, resulting in capillary fingering. As the capillary pressure increases, the invading fluid accelerates the displacement of the defending fluid and contacts the cylindrical particles, forming two new advance paths (Figure 3b), namely pore throats B and C. Due to the different local resistances encountered by the invading fluid during splitting, a pressure difference arises, causing the fluid in pore throat B to experience backflow and overlap with the fluid interface of an adjacent branch at the three-phase contact line (Figure 3c), and forming a wider fingering channel (Figure 3d). This represents the transition from capillary fingering to viscous fingering. These three flow patterns effectively explain the formation and transition of capillary fingering, viscous fingering, and stable displacement. The local fluid displacement characteristics are captured and reflected, and the basis for pore-scale fluid numerical simulations is formed.

3.2. Effect of Viscosity (M) and Capillary Force (Ca) on Flow in Porous Media

Capillary forces and viscous forces have a significant correlation in a two-phase flow, affecting the morphology, distribution, and flow characteristics of the fluids. For a specific two-phase flow system, it is necessary to comprehensively consider the influence of these two forces to deeply understand and describe fluid behavior. The impact of viscous forces and capillary forces on interface instability and fluid saturation patterns can be judged from the interface flow state, which is classified into capillary fingering, viscous fingering, and stable displacement.
Capillary forces and viscous forces can be characterized by two dimensionless numbers: capillary number (Ca) and viscosity ratio (M). The capillary number (Ca) is related to capillary forces, and the viscosity ratio (M) is the ratio of the viscosity of the invading non-wetting fluid to the viscosity of the displacing wetting fluid. They are defined as:
C a = μ i   U i σ
M = μ i   μ d
where μ is the dynamic viscosity, U is the characteristic velocity, and σ is the interfacial tension between the two phases. The subscripts i and d denote the “invading phase” and “defending phase”, respectively.
In this simulation, the invading phase is CH4 and the defending phase is water. Under the conditions of σ is 70 mN/m and wetting angle θc is 90°, displacement is carried out at different constant velocities to explore the effects of capillary forces and viscous forces on the CH4–water two-phase flow characteristics. The specific data are shown in Table 1 [13,35].
Figure 4 shows the snapshots of the simulation for different values of lgCa and lgM at the breakthrough moment. The viscosity ratio gradually increases from left to right.
The results shown in Figure 4 qualitatively illustrate the three modes of immiscible displacement: capillary fingering, viscous fingering, and stable displacement. It is clearly observed that the change in displacement mode depends on the Ca and M values. At lower capillary numbers and lower viscosity ratios, i.e., lgCa < −4.37 and lgM < −0.52, the fingering phenomenon is quite pronounced, with the two-phase flow interface becoming unstable and multiple elongated flow channels appearing. However, the fingering phenomenon results from the individual or combined action of capillary force and viscosity ratio, making it difficult to distinguish the type of fingering that occurs. Lenormand and Zhang [19,20] roughly defined capillary fingering and viscous fingering in porous media through extensive experiments. Capillary fingering typically occurs in small pores. Dominated by surface tension, elongated finger shapes are easily formed in porous media. The width of these channels is generally 1–3 pore widths, as shown in Figure 4(a1). It can be observed that three main capillary fingering channels appear due to capillary forces being the primary driving force in Figure 4(a1). As the capillary number Ca increases, the capillary force in the porous media gradually decreases while the viscous force increases. Viscous fingering typically occurs in large pores and high-viscosity conditions. The flow mode transitions from capillary fingering to viscous fingering, as shown in Figure 4(a2,a3). When viscous fingering occurs, the leading edge of the displacement front becomes unstable and irregular, forming multiple channels wider than 3 pore body widths, as shown in Figure 4(b3). At high Ca and M values, the CH4 saturation is high. The capillary number lgCa = −4.07 is the boundary where viscous fingering transitions to stable displacement. The displacement efficiency of CH4 increases with the capillary number, transitioning the flow mode to stable displacement. The two-phase flow interface is stable, manifesting as stable displacement, as shown in Figure 4(c3,d3).
The magnitude of saturation can be used to quantitatively describe the effects of Ca and M on two-phase flow. Figure 5a,b plot the functions of non-wetting phase (CH4) saturation versus Ca and M during CH4 breakthrough and at stability, respectively. As shown in Figure 5a, the saturation of the non-wetting phase generally increases with Ca at different M values. However, an exceptional case occurs at lgM = −1.95, where many interrupted fingering channels appear as shown in Figure 4(a2), resulting in a decrease in non-wetting phase saturation compared to Figure 4(a1). As the capillary number increases, the flow paths of the water phase in the porous media become more complex. Due to the viscosity of water molecules and the constraints of pore geometry, some branch channels may be occupied and blocked by the water phase, preventing CH4 from continuing to advance in these channels, leading to interrupted fingering phenomena, and ultimately affecting the displacement efficiency of CH4. Figure 5b shows the saturation of the non-wetting phase at stability after CH4 breakthrough, which is almost consistent with the breakthrough saturation. However, at lgM = −0.52, a special case occurs where the non-wetting phase saturation first increases, then decreases, and then increases again with increasing Ca. The specific image can be seen in Figure 4 at lgM = −0.52. When lgCa = −4.37, the invading phase CH4 gradually forms five capillary channels during the invasion breakthrough process and converges into one main flow channel after a period, rapidly displacing the defending water phase. The main cause of this phenomenon may be the changes in seepage conditions at the moment of breakthrough, when multiple capillary channels compete to absorb the invading CH4. However, with changes in seepage conditions and adjustments in pore structure at stability, a more favorable seepage path with higher adsorption capacity may emerge. It causes more fluid flow to concentrate in this main channel. The cases of Figure 4(c2,c3), where CH4 saturation decreases from breakthrough to stability, may indicate the differences in seepage velocity at different locations in homogeneous porous media. When the seepage velocity is higher at certain locations and lower at others, some fluid backflow may occur.
Based on the analysis of the changes in flow patterns and CH4 saturation in Figure 4 and Figure 5, it is evident that under different simulated M values, the displacement efficiency of CH4 increases with the gradual increase in lgCa value for any given lgM value. To verify the reliability of this simulation result, it is compared with Song’s [43] experiment of CO2 displacing water in a microchip. It is found that our simulation conclusions highly matched his experimental results, as shown in Figure 6. This provides a certain reference value for improving CH4 extraction efficiency in practice. In actual applications, the Ca value can be altered by changing the extraction speed or the pressure difference. However, when the lgM values reach −1.95 and −0.52, a controversial phenomenon occurs. The CH4 displacement efficiency no longer increases with the increase in lgCa but shows a trend of first decreasing and then increasing, which also highly matches Song’s [43] experimental results, as shown in Figure 7. This is due to the continuous displacement, which creates preferential flow channels in the porous media, causing some branch flow channels to experience backflow, leading to the controversial phenomenon. Therefore, higher capillary numbers and viscosity ratios help to improve CH4 extraction efficiency.

3.3. Effect of Wettability on Flow in Pore Media

Wettability characteristics reflect the adhesion difference between gas and water on the coal pore surface, which is decisive for capillary pressure. The evolution of capillary pressure mainly reflects the interactive displacement ability between gas and water (i.e., the ability of water to displace gas during high-pressure water injection and the ability of gas to push water during the later depressurization and extraction process). The microscopic migration patterns of multiphase media in coal pores reflect not only the effects of wettability and capillary pressure but also the influence of the pore network structure on high-pressure water injection and later extraction.
The behavioral differences exhibited by the immiscible interface during the displacement of the two multiphase fluids can be attributed to the effect of pore wall wettability. Wettability refers to the tendency of a fluid when in contact with a solid surface and is mainly measured by the contact angle. Generally, when θc < 90° (wetting angle), the liquid tends to spread on the solid surface, and the solid particles have a high affinity for the liquid. In this case, we consider the particle surface to be wetting. When θc > 90°, the liquid tends to form small droplets on the particles, and the solid has a low affinity for the liquid. At this time, the particles are considered non-wetting (hydrophobic) [44]. This section discusses the impact of wettability on CH4–water displacement under the conditions of lgCa = −5.79, lgM = −1.95, and inlet velocity v = 0.01 m/s.
Figure 8 shows the simulation results of fluid distribution at the breakthrough of CH4 in coal with contact angles of π/6, π/3, π/2, 2π/3, and 5π/6, corresponding to strongly hydrophilic, weakly hydrophilic, neutral, weakly hydrophobic, and strongly hydrophobic conditions, respectively. When the porous media is hydrophilic, i.e., θc = π/6 and θc = π/3, the invading CH4 forms 2–3 main flow channels during invasion, each about 1–2 pore widths wide. Figure 9 displays velocity snapshots at breakthrough and stability in hydrophilic porous media. It shows that at the initial breakthrough, the flow rate is higher, and the fluid tends to follow low-resistance paths. Over time, each main channel develops branching paths, but only a few side channels break through the porous media. When displacement stabilizes, some branching paths formed at breakthrough disappear. This is because they become preferential paths after some branches break through, causing some stagnant branches to flow back into the preferential paths, eventually leading to the disappearance of branching channels. When the porous medium is neutral, i.e., θc = π/2, five fingering channels with an average width of 2–3 pore widths form. The top and bottom two channels break through the porous media, while the middle fingering channels stagnate. The flow of fluid in the pores is hindered in porous media, forming an uneven fluid pressure distribution. This uneven pressure distribution causes the top and bottom pores to be under greater pressure, making it easier to form fingering channels and break through the porous media. For hydrophobic porous media, i.e., θc = 2π/3 and θc = 5π/6, the width of the fingering channels significantly increases to 4–5 pore widths compared to hydrophilic media. At this time, capillary forces gradually weaken, and viscous forces become the main driving force. Capillary fingering gradually transitions to viscous fingering, and the water-locking effect appears. A lot of elongated and spot-shaped residual water is trapped in the porous media by CH4, making it difficult to expel. This is consistent with the conclusion drawn by Zhao’s work [26] through experiments, which found that viscous fingering is more significant in strongly oil-wet media than in weakly oil-wet or water-wet media.
To quantitatively analyze the CH4–water displacement process under different wettability conditions, the saturation (Sn) curves of methane at breakthrough and after reaching stability under different contact angles are plotted, as well as the methane concentration curves over time. As shown in Figure 10a, both at breakthrough and after stabilization, as the contact angle gradually increases, more water is displaced from the pores, increasing the CH4 saturation and improving displacement efficiency. However, an exceptional case occurs at θc = π/3, caused by backflow due to the formation of preferential paths, which can also be observed in Figure 10a. From Figure 10b, it can be observed that under different wettability conditions, CH4 saturation in the initial stage of entering the porous media generally shows a pattern of initial growth followed by stabilization. Additionally, this growth interval increases with the contact angle. With smaller contact angles, capillary forces are stronger, binding the fluid in smaller pores and making it less mobile. As the contact angle increases, capillary forces weaken, allowing the fluid to move and diffuse more easily within the pores, leading to a rapid increase in the saturation of the non-wetting phase (CH4).
Based on the analysis of Figure 8, Figure 9 and Figure 10, it is evident that when the porous media is hydrophilic, capillary force is the main driving force. The CH4–water two-phase flow pattern is primarily capillary fingering with low displacement efficiency. When the porous media is neutral, both the capillary force and viscous force work together, resulting in a two-phase flow pattern which includes both capillary fingering and viscous fingering. Thus, the CH4 displacement efficiency is improved. When the porous media is hydrophobic, viscous force becomes the main driving force, and the two-phase flow pattern completely shifts to viscous fingering, significantly enhancing CH4 displacement efficiency. Therefore, in the actual CH4 extraction process, the extraction efficiency can be improved by altering the wettability of the coal seam.

3.4. Effect of Permeability and Inhomogeneity on Flow in Pore Media

In real coal seams, the pores are generally of varying sizes, and local permeability also differs. A local porous media often contains many pore networks of varying scales, encompassing multiple permeability ranges. This section constructs a porous media model with dimensions of 0.02 × 0.00514 m2, as shown in Figure 11. The wettability of the porous media is set to neutral, i.e., θc = π/2, with no-slip boundary conditions, and the medium is pre-saturated with water. The temperature of the entire model is constant. The effects of temperature and gravity on the fluid could be ignored. During the injection, displacement is carried out at a constant flow rate of 0.01 m/s from the inlet boundary (left to right), with the outlet pressure set to zero. The top and bottom boundaries are closed, and different permeabilities are simulated by varying the particle size to change the pore throat radius (Rt).
As shown in Figure 12a, the permeability of the porous medium significantly increases with the pore throat radius (Rt). While at Rt = 50 μm and Rt = 150 μm, CH4 partially break through the outlet of the porous media. At smaller pore sizes (Rt = 50 μm), many water regions in the upper part of the porous media are trapped. This is because a smaller pore throat radius means narrower flow channels, which increases fluid flow resistance. Higher flow resistance requires CH4 to exert more pressure to move the water. If the pressure is insufficient to overcome this resistance, CH4 could not smoothly break through the porous media’s outlet. Additionally, the interfacial tension between water and methane causes water to adhere more easily to the pore walls. At smaller pore throat radii, water is more likely to form liquid bridges, further hindering gas flow. As shown in Figure 12b, the volume fraction (Vn) of CH4 in the porous media rapidly increases with the increase in Rt, indicating that the quality of permeability greatly affects the efficiency of fluid transport.
To simulate a realistic permeability scenario within the coal seam, the particle size in the upper part of the porous media in Figure 13 was reduced by 36% to simulate a high permeability region. A dual permeability region was constructed to investigate the effect of heterogeneity on CH4–water two-phase flow, as shown in Figure 13. The labeled blue circles are particles in the highly permeable layer, whose diameter is 36% smaller than the particles in the low-permeable part of the layer. The arrows mark the inlet and outlet.
Figure 14 shows the simulation results of the dual permeability model under different Ca and M values. Figure 14a simulates different capillary numbers with lgM = 0, while Figure 14b simulates different viscous forces with lgCa = −3.15. As expected, CH4 preferentially breaks through in the high permeability region but could not completely expel the water within the medium. As shown in Figure 14a, when lgCa = −5.15, CH4 mainly invades the high permeability region but could not break through the porous media outlet over time. When the lgCa value increases to −4.15, CH4 completely displaces the water in the high permeability region, while the water in the low permeability region is hardly displaced. As the lgCa value continues to increase to −3.15, the CH4 interface in the low permeability region gradually advances to the halfway point of the porous media before stagnating. However, the breakthrough channel width in the high permeability region decreases from 3 pore widths to 2. When the lgCa value reaches −2.15, the water in the low permeability region is almost completely displaced by CH4. As shown in Figure 14b, when the capillary number is constant (lgCa = −3.15), the displacement interface in the low permeability region gradually advances with increasing lgM. The displacement interface in the high permeability region becomes increasingly stable with increasing lgM, but the channel width first decreases and then increases with increasing lgM. Additionally, water displacement efficiency significantly improves when lgM > −1.
To intuitively analyze the relationship between different Ca and M values in the dual permeability region, bar charts of non-wetting phase saturation (Sn) with respect to lgCa and lgM before and after breakthrough are plotted, as shown in Figure 15. When lgM = 0 (Figure 15a), Sn increases with increasing lgCa after breakthrough, indicating that the main driving force for channel formation gradually shifts from capillary force to viscous force, thus increasing drainage efficiency. As shown in Figure 15b, the value of Sn first increases, then decreases, and then increases again with increasing lgM after breakthrough. This is because the change in viscous force increases fluid flow resistance, reducing fingering width, and then the increase in viscous instability causes the fingering width to increase again.

4. Conclusions

The phase field models are used in COMSOL to systematically study the flow pattern of CH4 in coal seams after hydraulic fracturing at the pore scale. The Navier–Stokes equations and Cahn–Hilliard equations are used to simulate the two-phase flow of gas and water in porous media. The flow patterns and fluid saturation are analyzed from the perspectives of viscous and capillary instability, wettability, and permeability. The following conclusions are drawn:
(1)
It is found that during the CH4–water displacement process, fingering phenomena are very pronounced when lgCa < −4.37. The boundary between capillary fingering and viscous fingering is approximately determined to be at lgM = −1.22, lgCa = −4.77, while the boundary between viscous fingering and stable displacement is approximately at lgM = −0.52, lgCa = −4.07.
(2)
The CH4–water two-phase flow patterns and invading phase (CH4) saturation are quantitatively analyzed under different capillary forces (Ca) and viscous forces (M). As Ca and M increased, the invading CH4 gradually transitioned from capillary fingering to viscous fingering and eventually to stable displacement, with higher displacement efficiency. The saturation of invading CH4 at breakthrough and stability is compared. At lgM = −0.52 and lgCa = −4.37, displacement efficiency decreases due to the appearance of preferential paths.
(3)
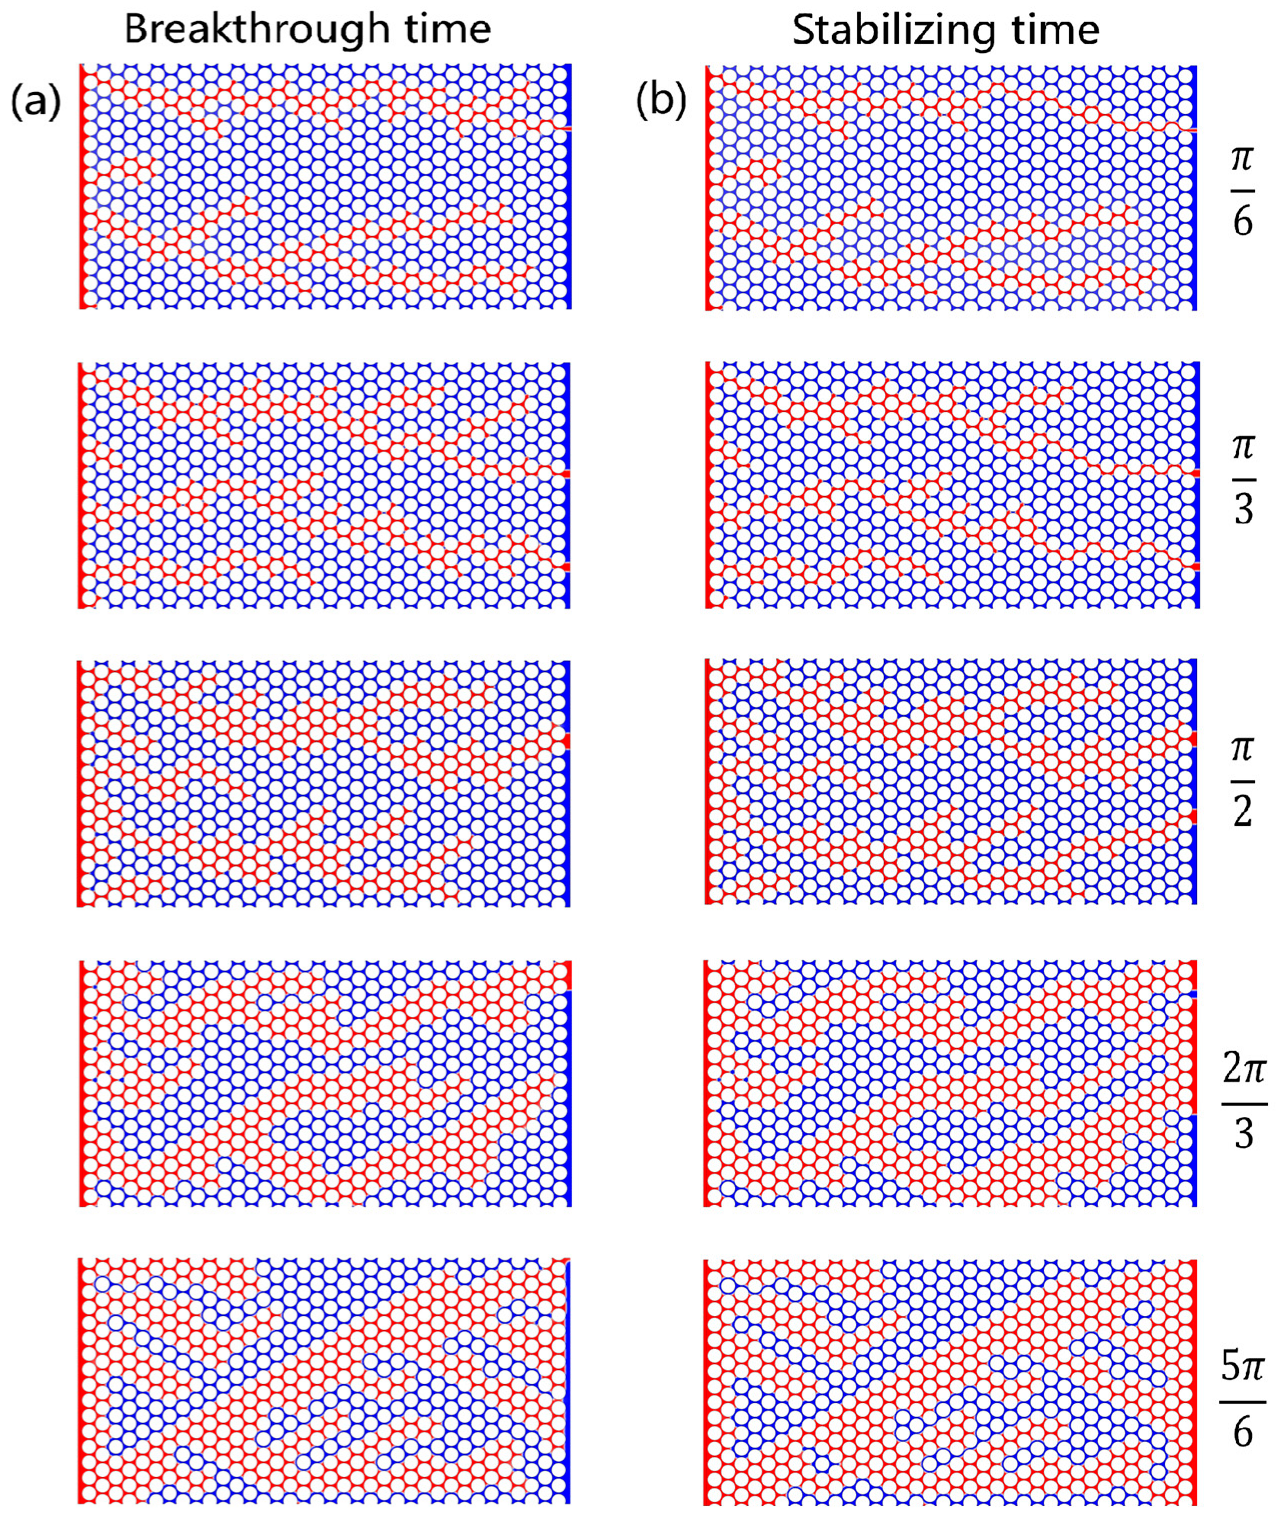
By changing the wettability angle of the porous media, the CH4–water two-phase flow in hydrophilic, neutral, and hydrophobic coal bodies is simulated. The backflow occurs only under hydrophilic conditions and that drainage efficiency increases significantly with increasing wettability angle.
(4)
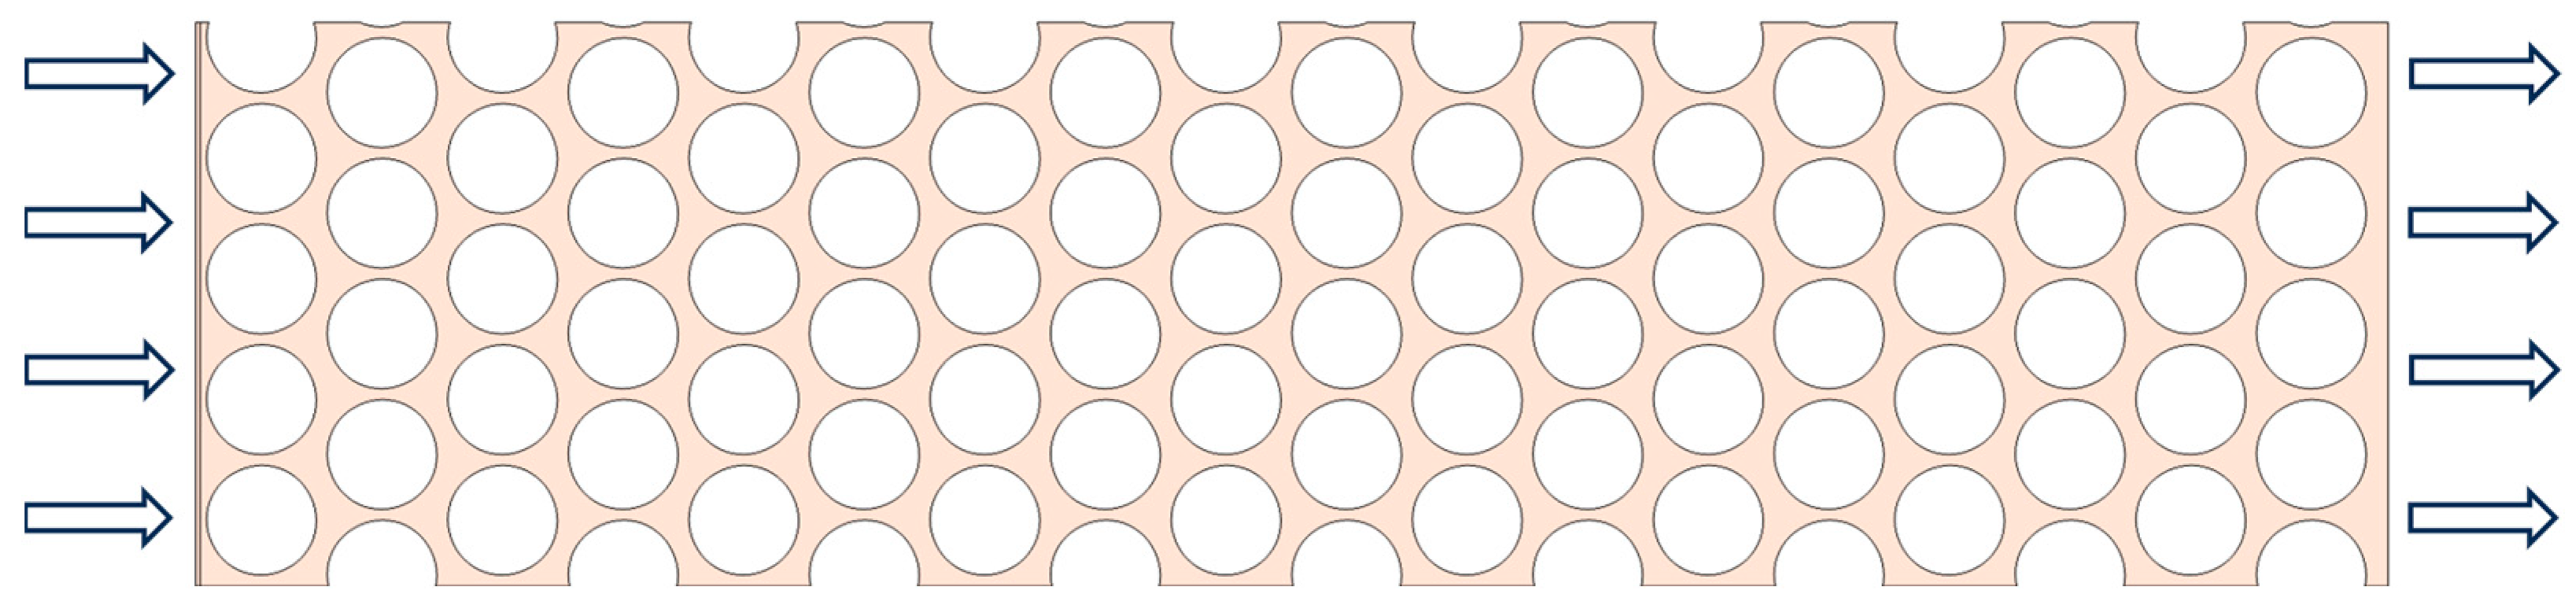
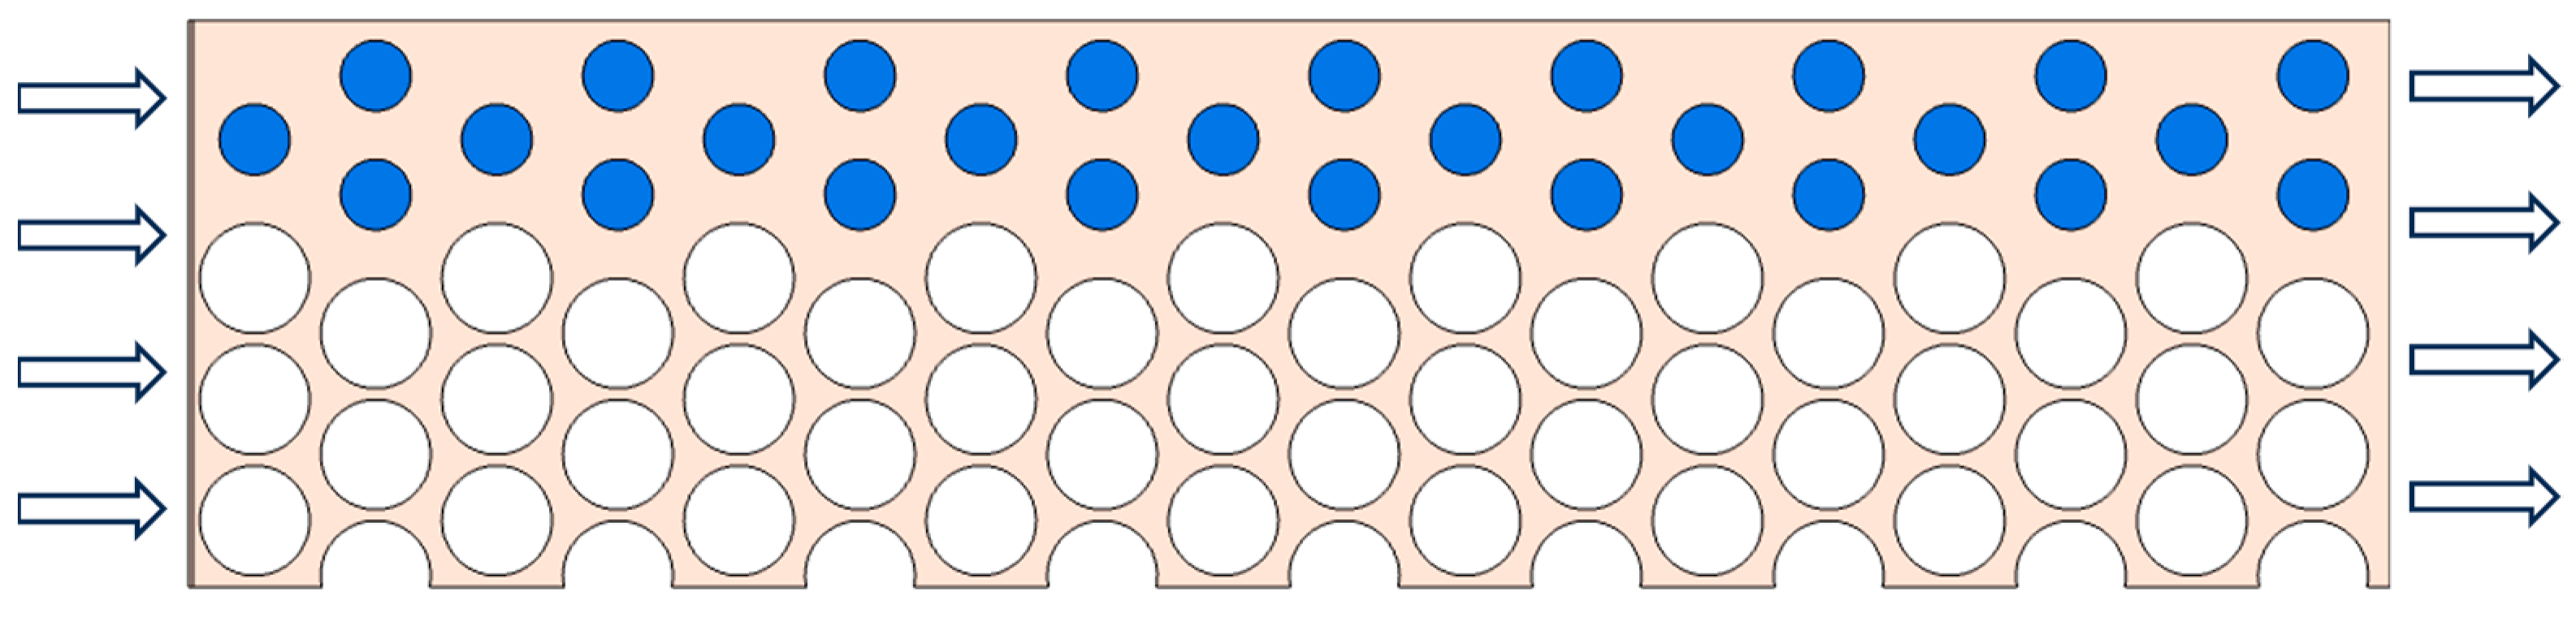
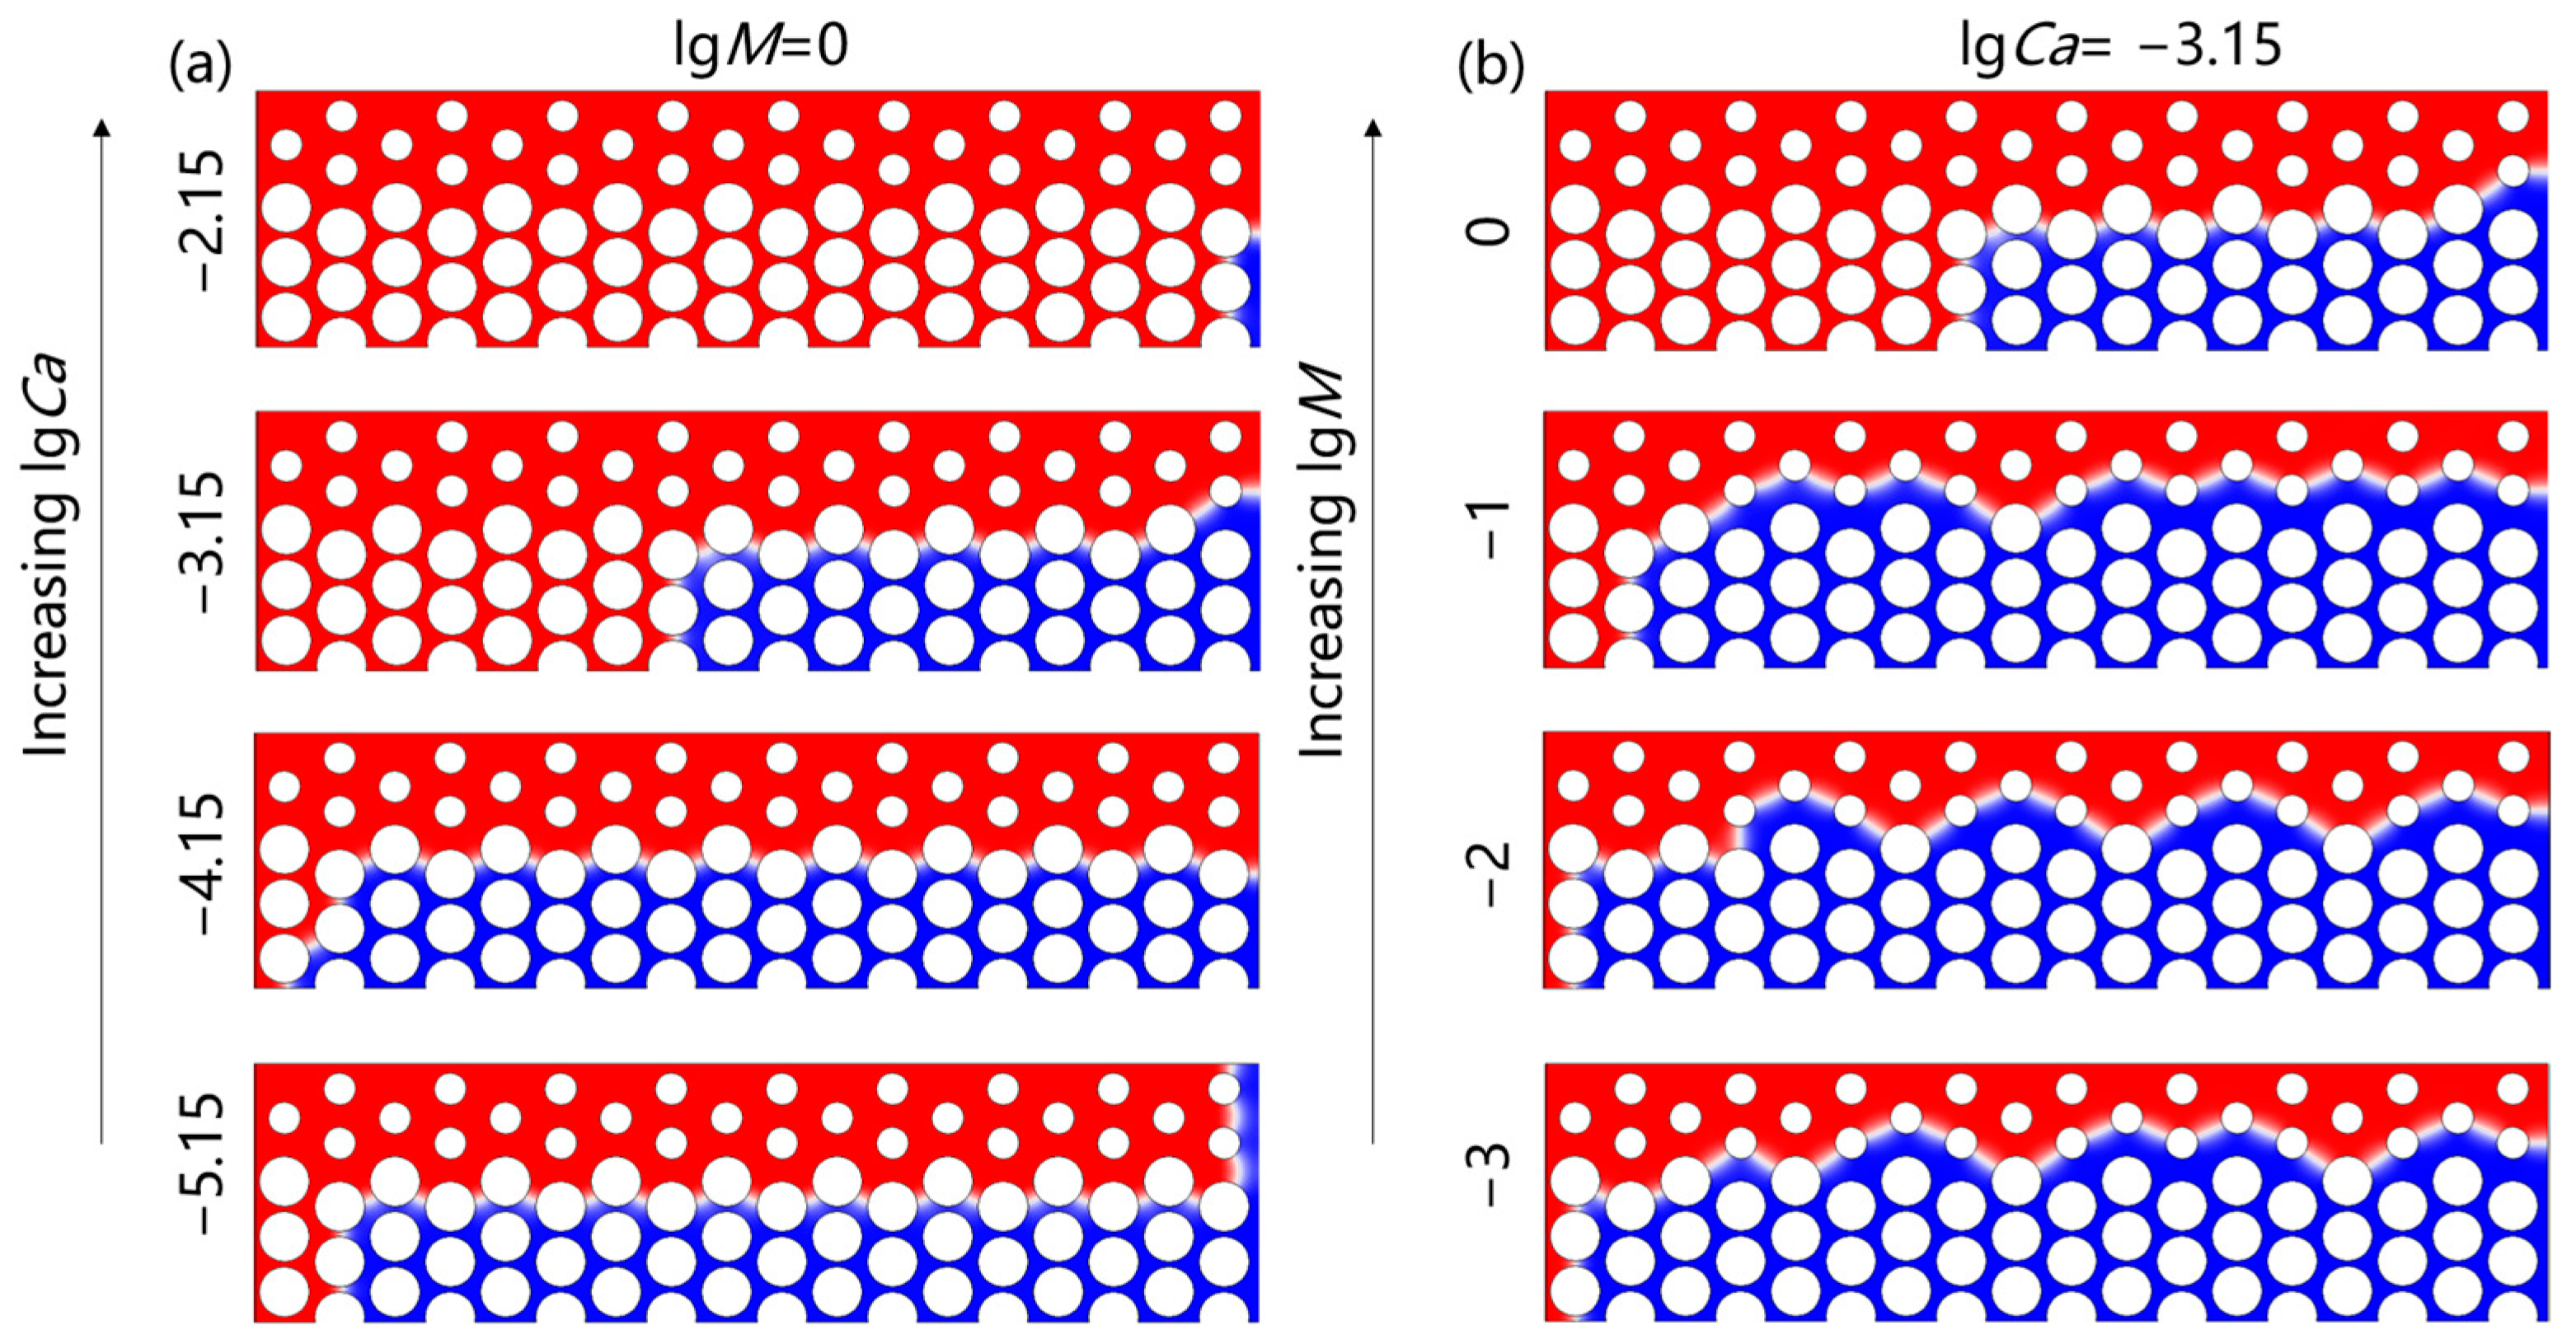
A dual permeability model is constructed under different Ca and M values to simulate the effect of varying local permeability on two-phase displacement in real coal seams. CH4 preferentially invaded high-permeability regions, and displacement efficiency in low-permeability regions increases with unfavorable viscosity ratios (lgM < 0, lgCa = −3.15) and increasing lgCa.
As can be seen from the above conclusions, the phase field method has high accuracy, stability and wide applicability. It can accurately describe the distribution of different phases of two-phase fluids and interface evolution by introducing continuous phase field variables. And it can accurately simulate the dynamic behavior of complex interfaces. Therefore, this method can be used to predict the amount of gas emission in water-bearing coal seam after the hydraulic permeability enhancement of coal seam. Moreover, the method can be used for simulation and validation when considering two-phase flow interface problems in other fields such as petroleum engineering and CO2 sequestration. The simulations in this paper were conducted under the condition of constant temperature and pressure. Future studies will consider more situations such as the flow of high-temperature and high-pressure two-phase fluids.

Author Contributions

Z.W.—writing original draft, data curation and data analysis. C.G. and N.L.—review and editing, conception, methodology and software. K.F.—software. X.Z. and T.L.—data curation, investigation. All authors have read and agreed to the published version of the manuscript.

Funding

This work was funded by the National Natural Science Foundation of China (52204247 and 12302448) and the Natural Science Foundation of Zhejiang Province (LQ21E040005 and LQ23E040009).

Institutional Review Board Statement

Not applicable.

Informed Consent Statement

Not applicable.

Data Availability Statement

The data presented in this study are available on request from the corresponding author. The data are not publicly available due to privacy.

Conflicts of Interest

The authors declare no conflicts of interest.

References

  1. Kang, H.; Gao, F.; Xu, G.; Ren, H. Mechanical Behaviors of Coal Measures and Ground Control Technologies for China’s Deep Coal Mines—A review. J. Rock Mech. Geotech. Eng. 2023, 15, 37–65. [Google Scholar] [CrossRef]
  2. Ranjith, P.G.; Zhao, J.; Ju, M.; De Silva, R.V.S.; Rathnaweera, T.D.; Bandara, A.K.M.S. Opportunities and Challenges in Deep Mining: A Brief Review. Engineering 2017, 3, 546–551. [Google Scholar] [CrossRef]
  3. Li, P.; Cai, M. Challenges and New Insights for Exploitation of Deep Underground Metal Mineral Resources. Trans. Nonferrous Met. Soc. China 2021, 31, 3478–3505. [Google Scholar] [CrossRef]
  4. Xie, H.; Zhao, J.W.; Zhou, H.W.; Ren, S.H.; Zhang, R.X. Secondary Utilizations and Perspectives of Mined Underground Space. Tunn. Undergr. Space Technol. 2020, 96, 103129. [Google Scholar] [CrossRef]
  5. Ershadnia, R.; Wallace, C.D.; Soltanian, M.R. CO2 Geological Sequestration in Heterogeneous Binary Media: Effects of Geological and Operational Conditions. Adv. Geo-Energy Res. 2020, 4, 392–405. [Google Scholar] [CrossRef]
  6. Shabani Afrapoli, M.; Alipour, S.; Torsaeter, O. Fundamental Study of Pore Scale Mechanisms in Microbial Improved Oil Recovery Processes. Transp. Porous Media 2011, 90, 949–964. [Google Scholar] [CrossRef]
  7. Veld, K.V.; Phillips, O.R. The Economics of Enhanced Oil Recovery: Estimating Incremental Oil Supply and CO2 Demand in the Powder River Basin. Energy J. 2010, 31, 31–56. [Google Scholar] [CrossRef]
  8. Li, G.; Zhan, L.; Yun, T.; Dai, S. Pore-Scale Controls on the Gas and Water Transport in Hydrate-Bearing Sediments. Geophys. Res. Lett. 2020, 47, e2020GL086990. [Google Scholar] [CrossRef]
  9. Chang, C.; Kneafsey, T.J.; Wan, J.; Tokunaga, T.K.; Nakagawa, S. Impacts of Mixed-Wettability on Brine Drainage and Supercritical CO2 Storage Efficiency in a 2.5-D Heterogeneous Micromodel. Water Resour. Res. 2020, 56, e2019WR026789. [Google Scholar] [CrossRef]
  10. Yang, W.; Chang, Y.; Cheng, J.; Wang, Z.; Li, X.; Lv, P.; Zhang, B.; Liu, B.; Song, Y. Gravity Effects on Oil–Water Two-Phase Displacement in Homogeneous Porous Media. Phys. Fluids 2021, 33, 102003. [Google Scholar] [CrossRef]
  11. Løvoll, G.; Jankov, M.; Måløy, K.J.; Toussaint, R.; Schmittbuhl, J.; Schäfer, G.; Méheust, Y. Influence of Viscous Fingering on Dynamic Saturation—Pressure Curves in Porous Media. Transp. Porous Media 2011, 86, 305–324. [Google Scholar] [CrossRef]
  12. Lenormand, R. Flow Through Porous Media: Limits of Fractal Patterns. Proc. R. Soc. London. Ser. A. Math. Phys. Sci. 1989, 423, 159–168. [Google Scholar] [CrossRef]
  13. Lenormand, R.; Zarcone, C.; Sarr, A. Mechanisms of the Displacement of One Fluid by Another in a Network of Capillary Ducts. J. Fluid Mech. 1983, 135, 337–353. [Google Scholar] [CrossRef]
  14. He, S.; Kahanda, G.L.M.K.S.; Wong, P. Roughness of Wetting Fluid Invasion Fronts in Porous Media. Phys. Rev. Lett. 1992, 69, 3731–3734. [Google Scholar] [CrossRef] [PubMed]
  15. Frey, S.; Scheller, S.; Karadimitriou, N.; Lee, D.; Reina, G.; Steeb, H.; Ertl, T. Visual Analysis of Two-Phase Flow Displacement Processes in Porous Media. Comput. Graph. Forum 2022, 41, 243–256. [Google Scholar] [CrossRef]
  16. Holtzman, R. Effects of Pore-Scale Disorder on Fluid Displacement in Partially-Wettable Porous Media. Sci. Rep. 2016, 6, 36221. [Google Scholar] [CrossRef] [PubMed]
  17. Lu, N.B.; Browne, C.A.; Amchin, D.B.; Nunes, J.K.; Datta, S.S. Controlling Capillary Fingering Using Pore Size Gradients in Disordered Media. Phys. Rev. Fluids 2019, 4, 084303. [Google Scholar] [CrossRef]
  18. Pak, T.; Rabbani, H.S.; Raeini, A.Q.; Shokri, N. Effects of the Pore Morphology on Multiphase Fluid Displacement in Porous Media—A High-Resolution Modeling Investigation. ACS Omega 2023, 8, 3889–3895. [Google Scholar] [CrossRef] [PubMed]
  19. Lenormand, R.; Touboul, E.; Zarcone, C. Numerical Models and Experiments on Immiscible Displacements in Porous Media. J. Fluid Mech. 1988, 189, 165–187. [Google Scholar] [CrossRef]
  20. Zhang, C.; Oostrom, M.; Wietsma, T.W.; Grate, J.W.; Warner, M.G. Influence of Viscous and Capillary Forces on Immiscible Fluid Displacement: Pore-Scale Experimental Study in a Water-Wet Micromodel Demonstrating Viscous and Capillary Fingering. Energy Fuels 2011, 25, 3493–3505. [Google Scholar] [CrossRef]
  21. Amiri, H.A.A.; Hamouda, A.A. Pore-Scale Modeling of Non-Isothermal Two Phase Flow in 2D Porous Media: Influences of Viscosity, Capillarity, Wettability and Heterogeneity. Int. J. Multiph. Flow 2014, 61, 14–27. [Google Scholar] [CrossRef]
  22. Chen, K.; Liu, P.; Wang, W.; Chen, Y.; Bate, B. Effects of Capillary and Viscous Forces on Two-Phase Fluid Displacement in the Microfluidic Model. Energy Fuels 2023, 37, 17263–17276. [Google Scholar] [CrossRef]
  23. Singh, K.; Jung, M.; Brinkmann, M.; Seemann, R. Capillary-Dominated Fluid Displacement in Porous Media. Annu. Rev. Fluid Mech. 2019, 51, 429–449. [Google Scholar] [CrossRef]
  24. Gong, W.; Liu, J. Effect of Wettability Heterogeneity on Water-Gas Two-Phase Displacement Behavior in a Complex Pore Structure by Phase-Field Model. Energies 2022, 15, 7658. [Google Scholar] [CrossRef]
  25. Wang, Z.; Wei, H.; He, Z.; Liu, X.; Chen, L.; Tao, W.-Q. Effects of Cassie-Wenzel Wetting Transition on Two-Phase Flow in Porous Media. Int. Commun. Heat Mass Transf. 2023, 146, 106931. [Google Scholar] [CrossRef]
  26. Zhao, B.; MacMinn, C.W.; Juanes, R. Wettability Control on Multiphase Flow in Patterned Microfluidics. Proc. Natl. Acad. Sci. USA 2016, 113, 10251–10256. [Google Scholar] [CrossRef] [PubMed]
  27. Liu, Y.; Lv, P.; Liu, Y.; Jiang, L.; Tetsuya, S.; Song, Y.; Wu, B.; Liu, S. CO2/Water Two-Phase Flow in a Two-Dimensional Micromodel of Heterogeneous Pores and Throats. RSC Adv. 2016, 6, 73897–73905. [Google Scholar] [CrossRef]
  28. Chen, R.; Xu, W.; Chen, Y.; Hu, Y.; Li, J.; Zhuang, D.; Bate, B. Modeling Pore-Scale CO2 Plume Migration with a Hypergravity Model. Geoenergy Sci. Eng. 2023, 231, 212294. [Google Scholar] [CrossRef]
  29. Dlotko, T. Navier-Stokes-Cahn-Hilliard System of Equations. J. Math. Phys. 2022, 63, 111511. [Google Scholar] [CrossRef]
  30. Jacqmin, D. Contact-Line Dynamics of a Diffuse Fluid Interface. J. Fluid Mech. 2000, 402, 57–88. [Google Scholar] [CrossRef]
  31. Qiu, Z.; Wang, G. A Blowup Criterion for Nonhomogeneous Incompressible Navier–Stokes–Landau–Lifshitz System in 2-D. Math. Methods Appl. Sci. 2023, 46, 2500–2516. [Google Scholar] [CrossRef]
  32. Yang, J.; Ju, Q. Existence of Global Weak Solutions for Navier-Stokes-Poisson Equations with Quantum Effect and Convergence to Incompressible Navier-Stokes Equations. Math. Methods Appl. Sci. 2015, 38, 3629–3641. [Google Scholar] [CrossRef]
  33. Yang, J.; Wang, S. Convergence of Compressible Navier-Stokes-Maxwell Equations to Incompressible Navier-Stokes Equations. Sci. China Math. 2014, 57, 2153–2162. [Google Scholar] [CrossRef]
  34. Zhang, T.; Wang, Q. Cahn-Hilliard vs Singular Cahn-Hilliard Equations in Phase Field Modeling. Commun. Comput. Phys. 2010, 7, 362–382. [Google Scholar] [CrossRef]
  35. Basirat, F.; Yang, Z.; Niemi, A. Pore-Scale Modeling of Wettability Effects on CO2—Brine Displacement during Geological Storage. Adv. Water Resour. 2017, 109, 181–195. [Google Scholar] [CrossRef]
  36. Jacqmin, D. Calculation of Two-Phase Navier–Stokes Flows Using Phase-Field Modeling. J. Comput. Phys. 1999, 155, 96–127. [Google Scholar] [CrossRef]
  37. Yue, P.; Zhou, C.; Feng, J.J.; Ollivier-Gooch, C.F.; Hu, H.H. Phase-Field Simulations of Interfacial Dynamics in Viscoelastic Fluids Using Finite Elements with Adaptive Meshing. J. Comput. Phys. 2006, 219, 47–67. [Google Scholar] [CrossRef]
  38. Erbil, H.Y. Surface Chemistry: Of Solid and Liquid Interfaces, 1st ed.; Wiley: Hoboken, NJ, USA, 2006; ISBN 978-1-4051-1968-9. [Google Scholar]
  39. Cieplak, M.; Robbins, M.O. Dynamical Transition in Quasistatic Fluid Invasion in Porous Media. Phys. Rev. Lett. 1988, 60, 2042–2045. [Google Scholar] [CrossRef] [PubMed]
  40. Cieplak, M.; Robbins, M.O. Influence of Contact Angle on Quasistatic Fluid Invasion of Porous Media. Phys. Rev. B 1990, 41, 11508–11521. [Google Scholar] [CrossRef]
  41. Lan, T.; Hu, R.; Guo, W.; Wei, G.; Chen, Y.; Zhou, C. Direct Prediction of Fluid-Fluid Displacement Efficiency in Ordered Porous Media Using the Pore Structure. Water Resour. Res. 2022, 58, e2021WR031875. [Google Scholar] [CrossRef]
  42. Hu, R.; Lan, T.; Wei, G.-J.; Chen, Y.-F. Phase Diagram of Quasi-Static Immiscible Displacement in Disordered Porous Media. J. Fluid Mech. 2019, 875, 448–475. [Google Scholar] [CrossRef]
  43. Song, Y.; Zhao, C.; Chen, M.; Chi, Y.; Zhang, Y.; Zhao, J. Pore-Scale Visualization Study on CO2 Displacement of Brine in Micromodels with Circular and Square Cross Sections. Int. J. Greenh. Gas Control. 2020, 95, 102958. [Google Scholar] [CrossRef]
  44. Brown, C.E.; Neustadter, E.L. The Wettability of Oil/Water/Silica Systems with Reference to Oil Recovery. J. Can. Pet. Technol. 1980, 19, PETSOC-80-03-06. [Google Scholar] [CrossRef]
Figure 1. Schematic diagram of the microscopic (The structure in the red circle is zoomed in on the right side).
Applsci 14 06815 g001
Figure 2. Schematic diagram of the three basic modes of crescent movement (The green arrow shows the direction of flow): (a) Burst mode; (b) touch mode; (c) overlap of the three-phase contact lines; (d) overlap of the fluid–fluid interfaces.
Applsci 14 06815 g002
Figure 3. Evolution of the pore-scale CH4–water two-phase interface when lgCa = −4.25, lgM = −0.52 (The green arrow shows the direction of flow): (a) Burst mode in simulation; (b) transformation to touch mode in simulation after burst mode; (c) schematic of transformation of touch mode to overlapping mode in simulation; (d) transformation of capillary fingering to viscous fingering after overlapping of multiple overlapping modes.
Applsci 14 06815 g003
Figure 4. Repulsion patterns at the breakthrough moment for different capillary numbers and viscosity ratios (red and blue regions represent CH4 and water, respectively).
Applsci 14 06815 g004
Figure 5. Relationship between saturation of non-wetting phase and different lgCa, lgM: (a) Relationship between saturation and lgCa, lgM when the non-wetting phase CH4 breaks through the porous media; (b) relationship between saturation and lgCa, lgM when the non-wetting phase CH4 breaks through the porous media and then reaches a steady state.
Applsci 14 06815 g005
Figure 6. Images of CO2 (black) and deionized water (red to yellow) distributions at the quasi-steady state in the micromodel with circular cross-section (lgM = −1.820). (CO2 was injected from left to right. The numbers in the parenthesis indicate (lgCa, SCO2) [43]. Reproduced or adapted with permission from ref [43]. Copyright 2020 Elsevier).
Applsci 14 06815 g006
Figure 7. Images of CO2 (black) and brine (red) distributions at the quasi-steady state in the micromodel with circular cross-section (lgM = −1.849). (CO2 was injected from left to right. The numbers in the parenthesis indicate (lgCa, SCO2) [43]. Reproduced or adapted with permission from ref [43]. Copyright 2020 Elsevier.).
Applsci 14 06815 g007
Figure 8. Flow snapshots of CH4 at breakthrough and stabilization in porous media with different wettabilities: (a) Flow snapshots of CH4 at breakthrough in porous media with different wettabilities; (b) flow snapshots of CH4 at stabilization in porous media with different wettabilities.
Applsci 14 06815 g008
Figure 9. Velocity snapshots of CH4 at breakthrough and stabilization under different wettability conditions with θc = π/6 and π/3 (the upper part shows the breakthrough moment, and the lower part shows the stabilization moment): (a) Flow snapshots at breakthrough and stabilization for porous media with a contact angle of θc = π/6; (b) flow snapshots at breakthrough and stabilization for porous media with a contact angle of θc = π/3.
Applsci 14 06815 g009
Figure 10. Relationship between non-wetting phase CH4 saturation, contact angle, and time: (a) Relationship of non-wetting phase CH4 saturation at breakthrough and stabilization in porous media with different wettabilities; (b) relationship between non-wetting phase CH4 saturation and time under different wettability conditions.
Applsci 14 06815 g010
Figure 11. Model of porous media with Rt = 50 μm.
Applsci 14 06815 g011
Figure 12. Snapshots of CH4–water two-phase flow at different pore scales and volume fraction of the non-wetting phase (CH4) as a function of time. (a) Snapshot of the distribution of the two phases after stabilization of CH4 driven water at Rt = 50 μm, 150 μm and 350 μm; (b) volume fraction of non-wetted phase CH4 as a function of time.
Applsci 14 06815 g012
Figure 13. Schematic diagram of the simulated double-permeable porous media.
Applsci 14 06815 g013
Figure 14. Snapshots of the dual-permeability model after stabilization by CH4 breakthrough: (a) is the case of lgM = 0 for different Ca values; (b) is the case of lgCa = −3.15 for different M values.
Applsci 14 06815 g014
Figure 15. Effect of different Ca and M on CH4 saturation before and after breakthrough. (a) Changes of CH4 concentration before and after breakthrough at different lgCa; (b) Changes of CH4 concentration before and after breakthrough at different lgM.
Applsci 14 06815 g015
Table 1. Effect of flow rate and capillary number on fluid properties.
Invading FluidDefending Fluidσ (mN/m)Contact AngleFlow Rate U (m/s)lgMlgCa
CH4water7090°0.005, 0.01, 0.02, 0.05−1.95−6.09,−5.79,−5.49,−5.09
−1.22−5.37, −5.07, −4.77, −4.37
−0.52−4.67, −4.37, −4.07, −3.67
0−4.15, −3.85, −3.55, −3.15
Disclaimer/Publisher’s Note: The statements, opinions and data contained in all publications are solely those of the individual author(s) and contributor(s) and not of MDPI and/or the editor(s). MDPI and/or the editor(s) disclaim responsibility for any injury to people or property resulting from any ideas, methods, instructions or products referred to in the content.

