
Experimental and Numerical Study of Air Flow Reversal Induced by Fire in an Inclined Mine Working

Abstract
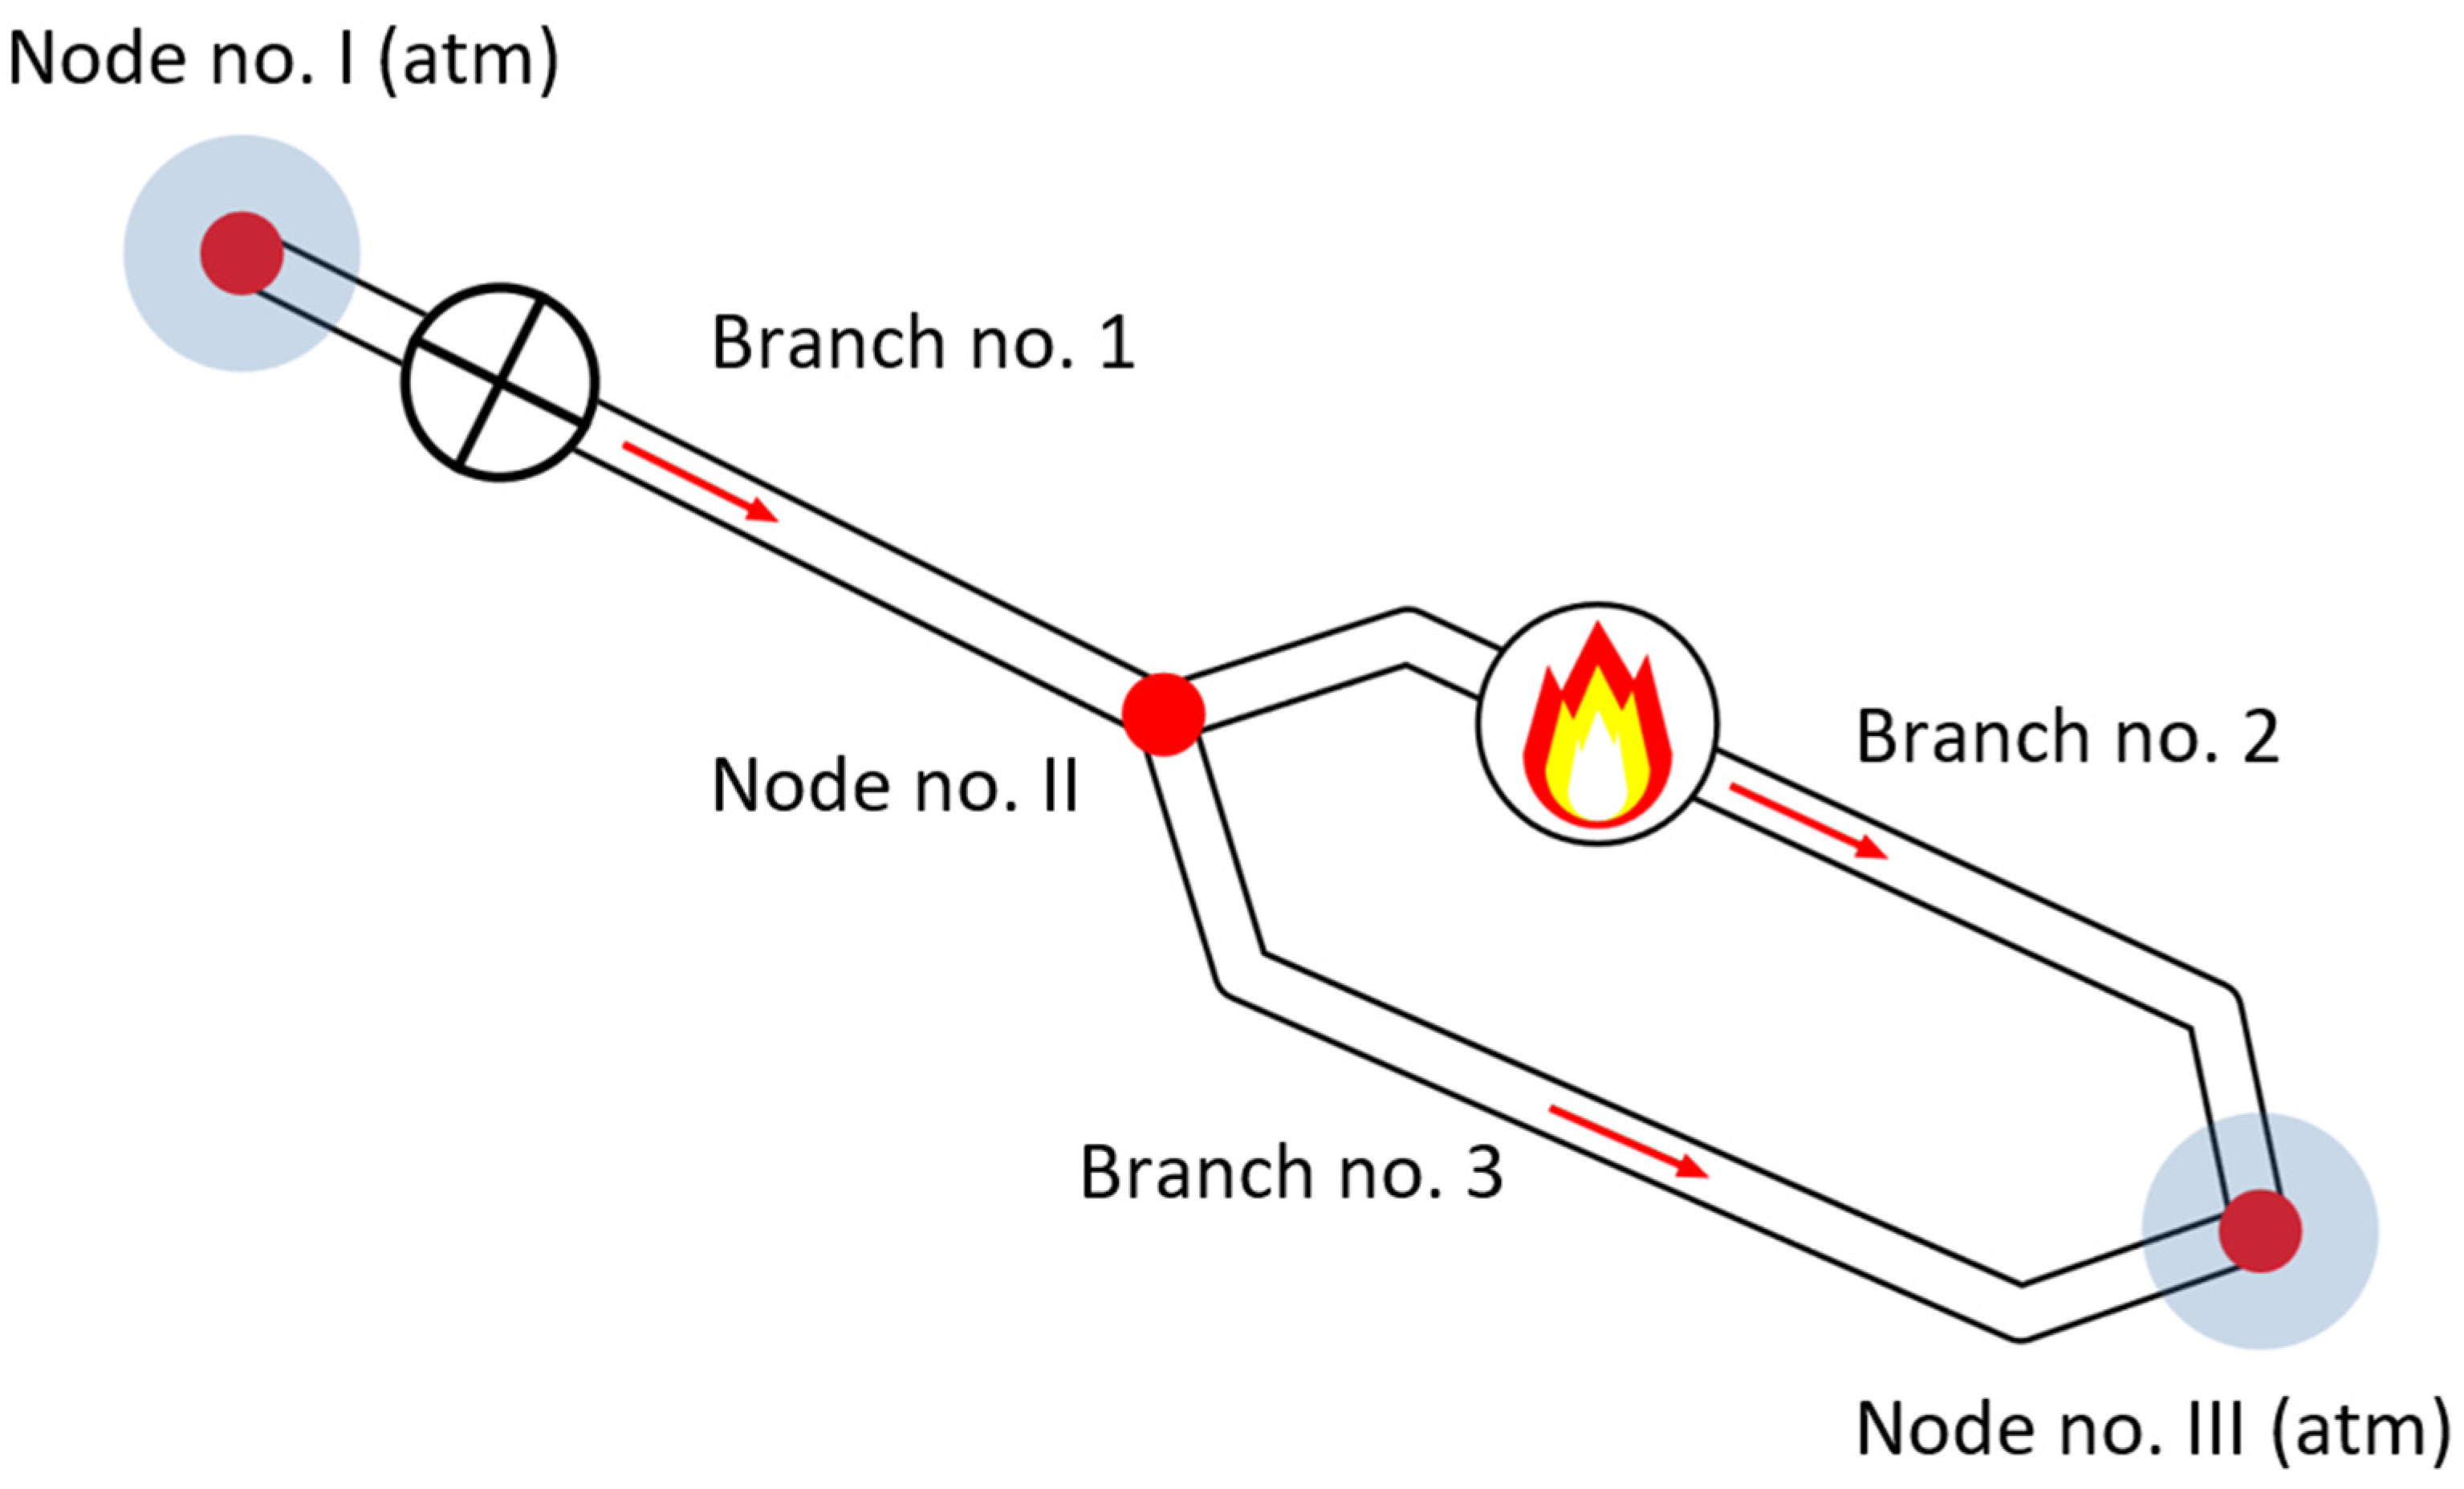
:1. Introduction
- (1)
- Unidirectional flow;
- (2)
- Partial return flows;
- (3)
- Completely reverse flows.
2. Methods
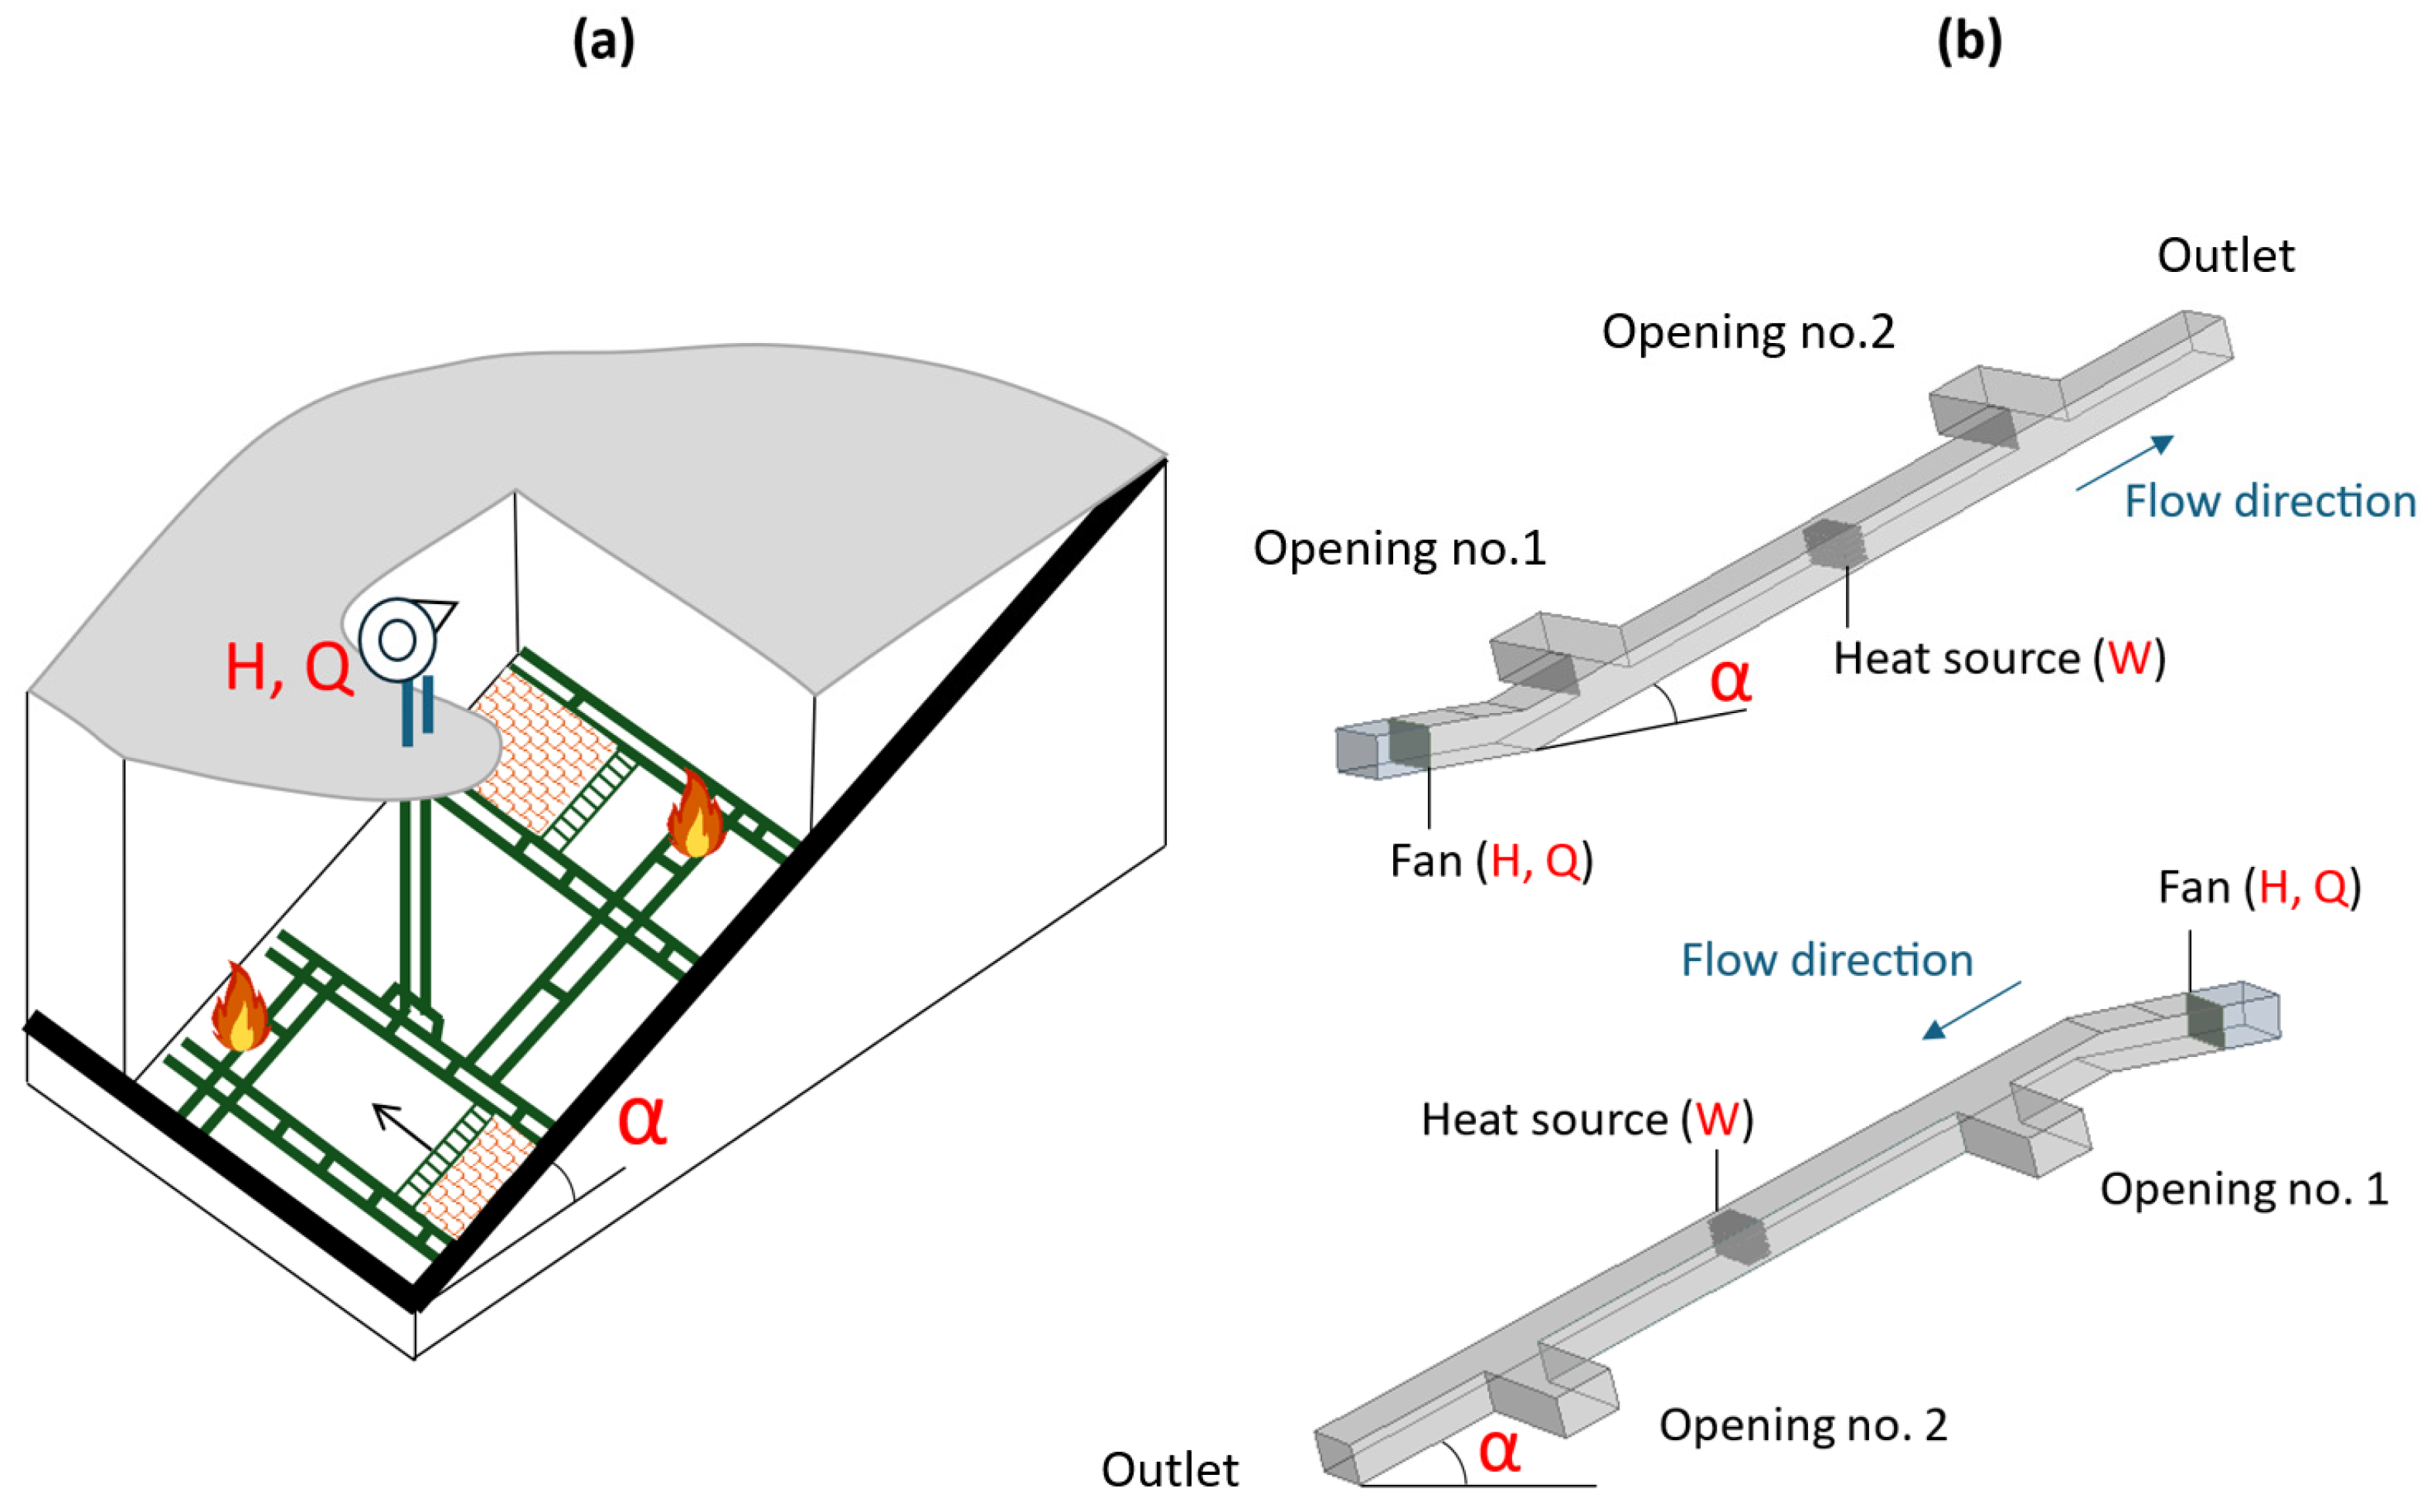
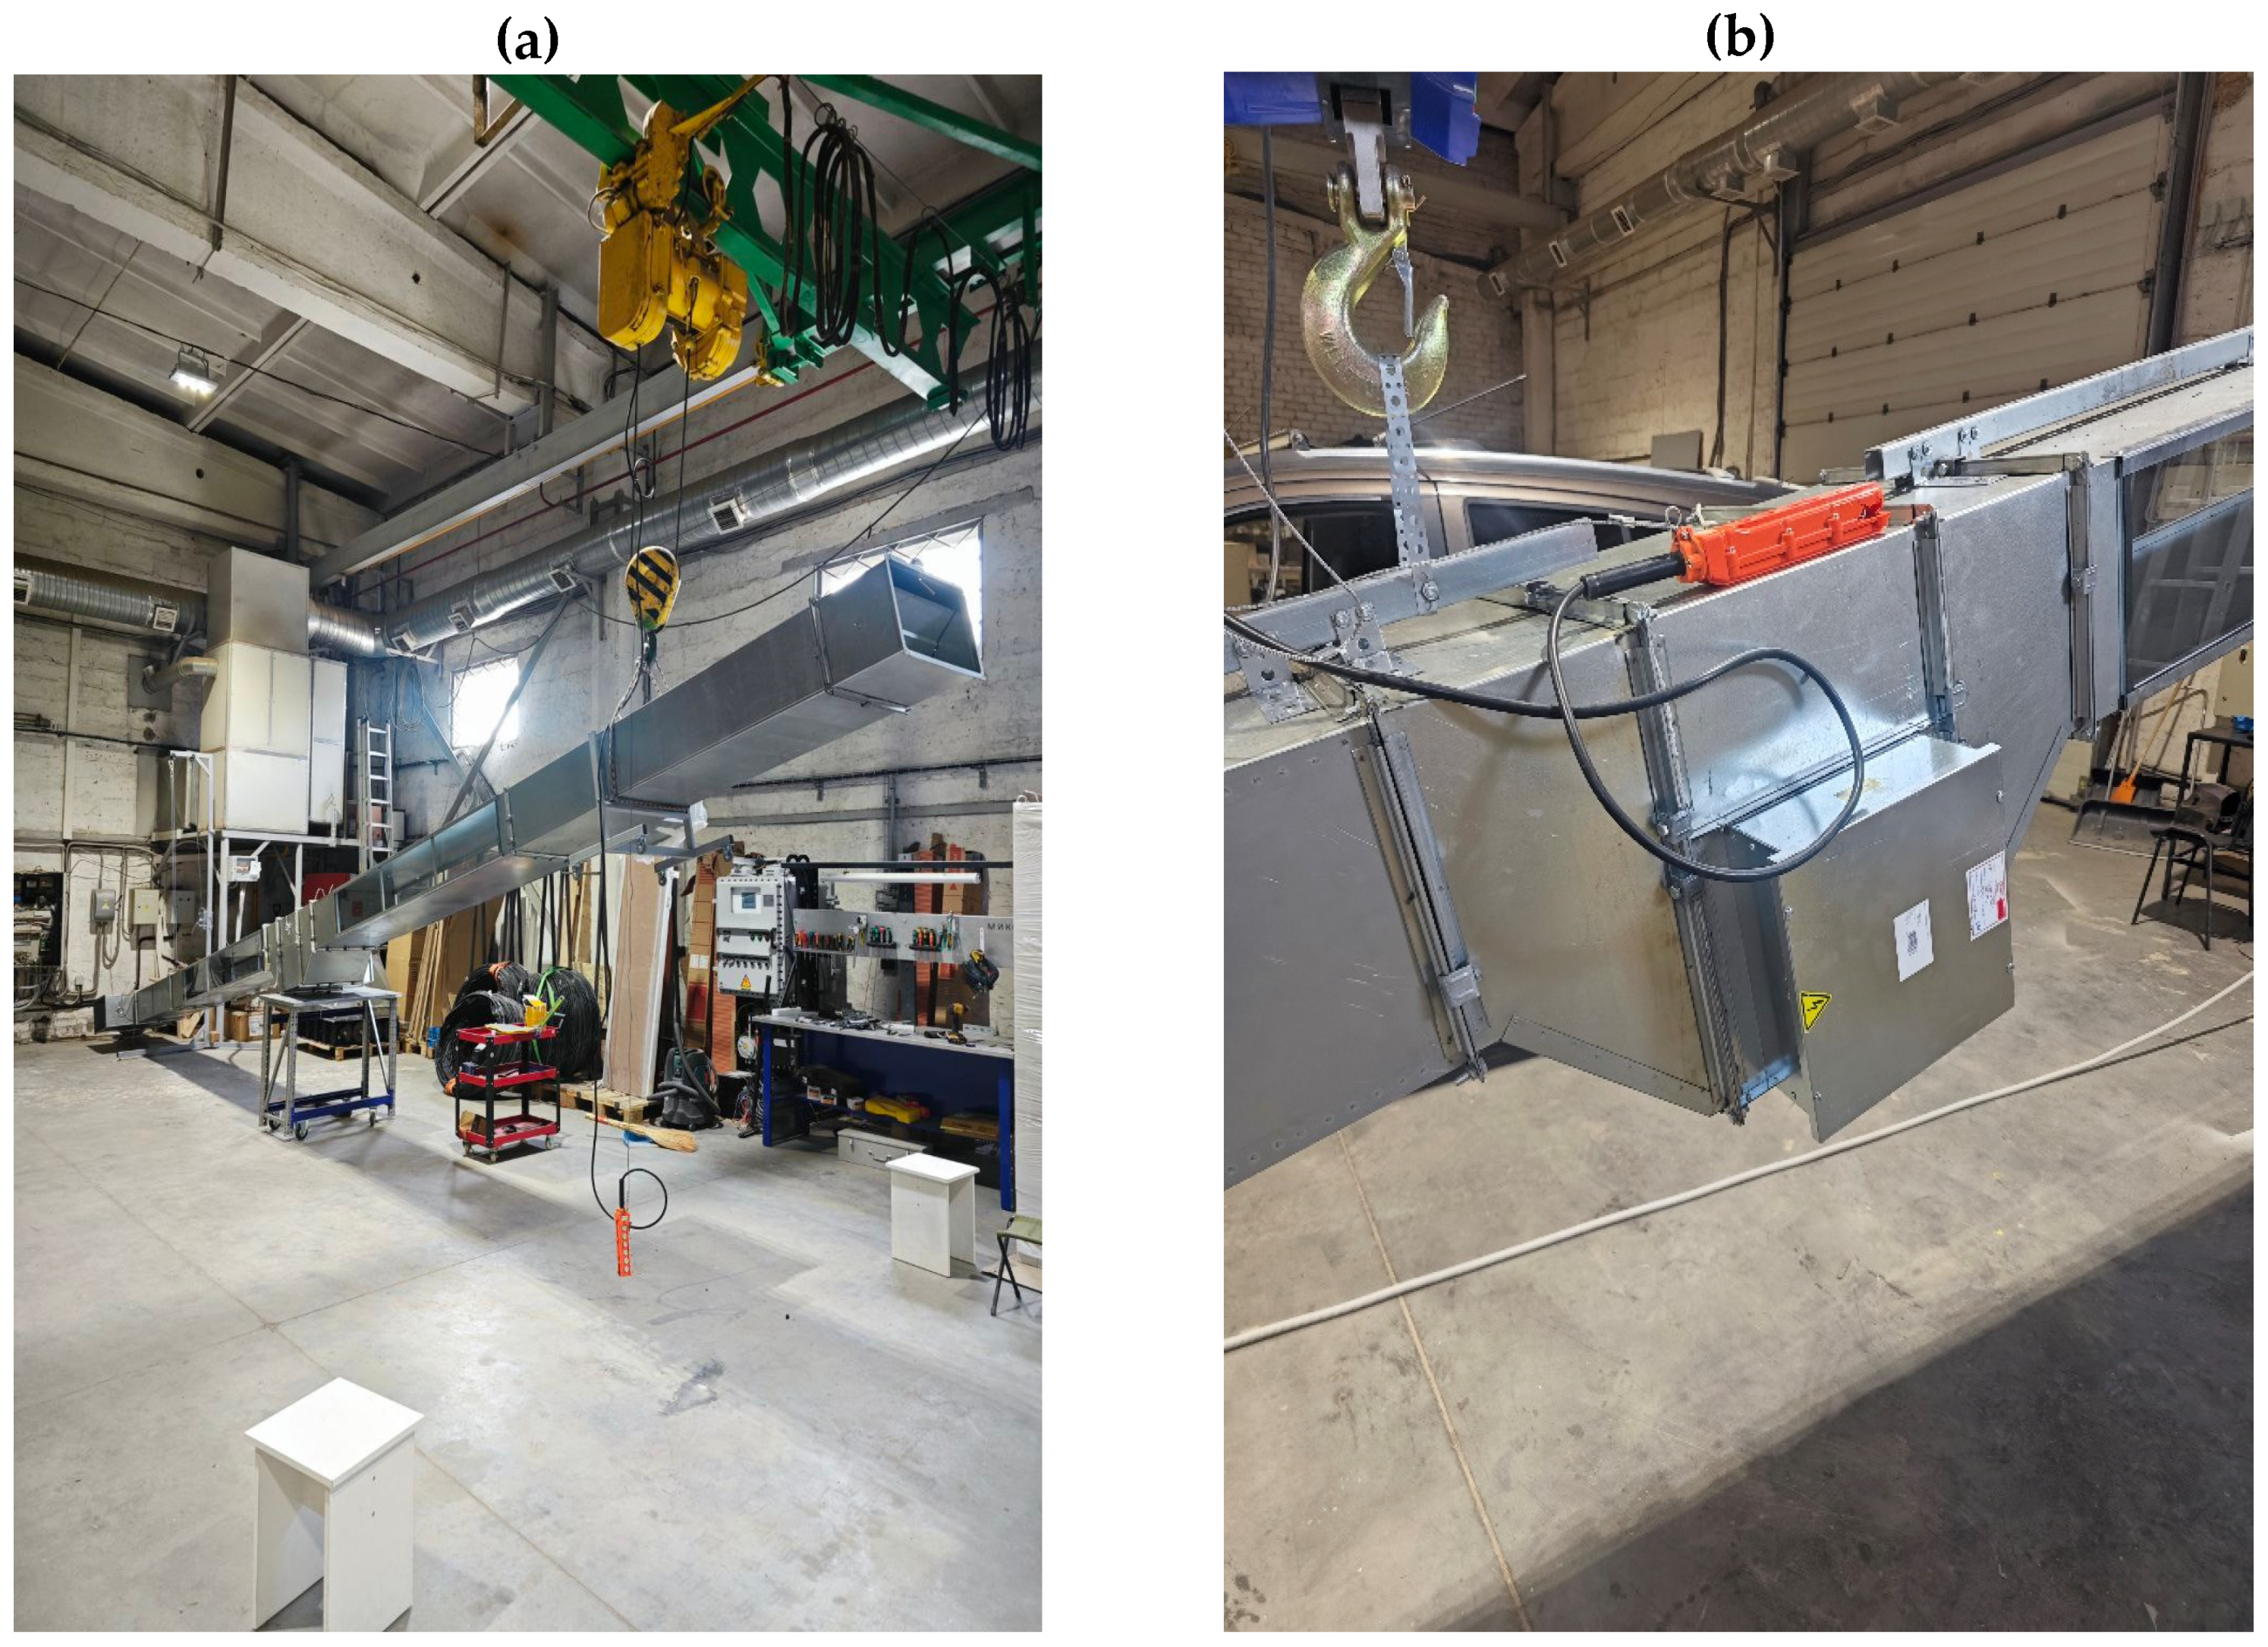
2.1. Experimental Study
- A Testo 405i hot-wire anemometer (Testo SE & Co. KGaA, Titisee-Neustadt, Germany) with absolute measurement errors of m/s for velocity () and ±0.5 °C for temperature ().
- A Testo 405V1 hot-wire anemometer with absolute measurement errors of m/s and ±0.5 °C.
- A Testo 445 multi-function climate measuring instrument with absolute measurement errors of ±(0.1 + 0.01⋅v) m/s and ±0.3 °C.
- A Fluke 922 micromanometer (Fluke Corporation, Everett, WA, USA) with an absolute measurement error of ±1% + 1 Pa.
- A Leica Disto D2 rangefinder (Leica geosystems, Aarau, Switzerland) with an absolute measurement error of ±0.0015 m.
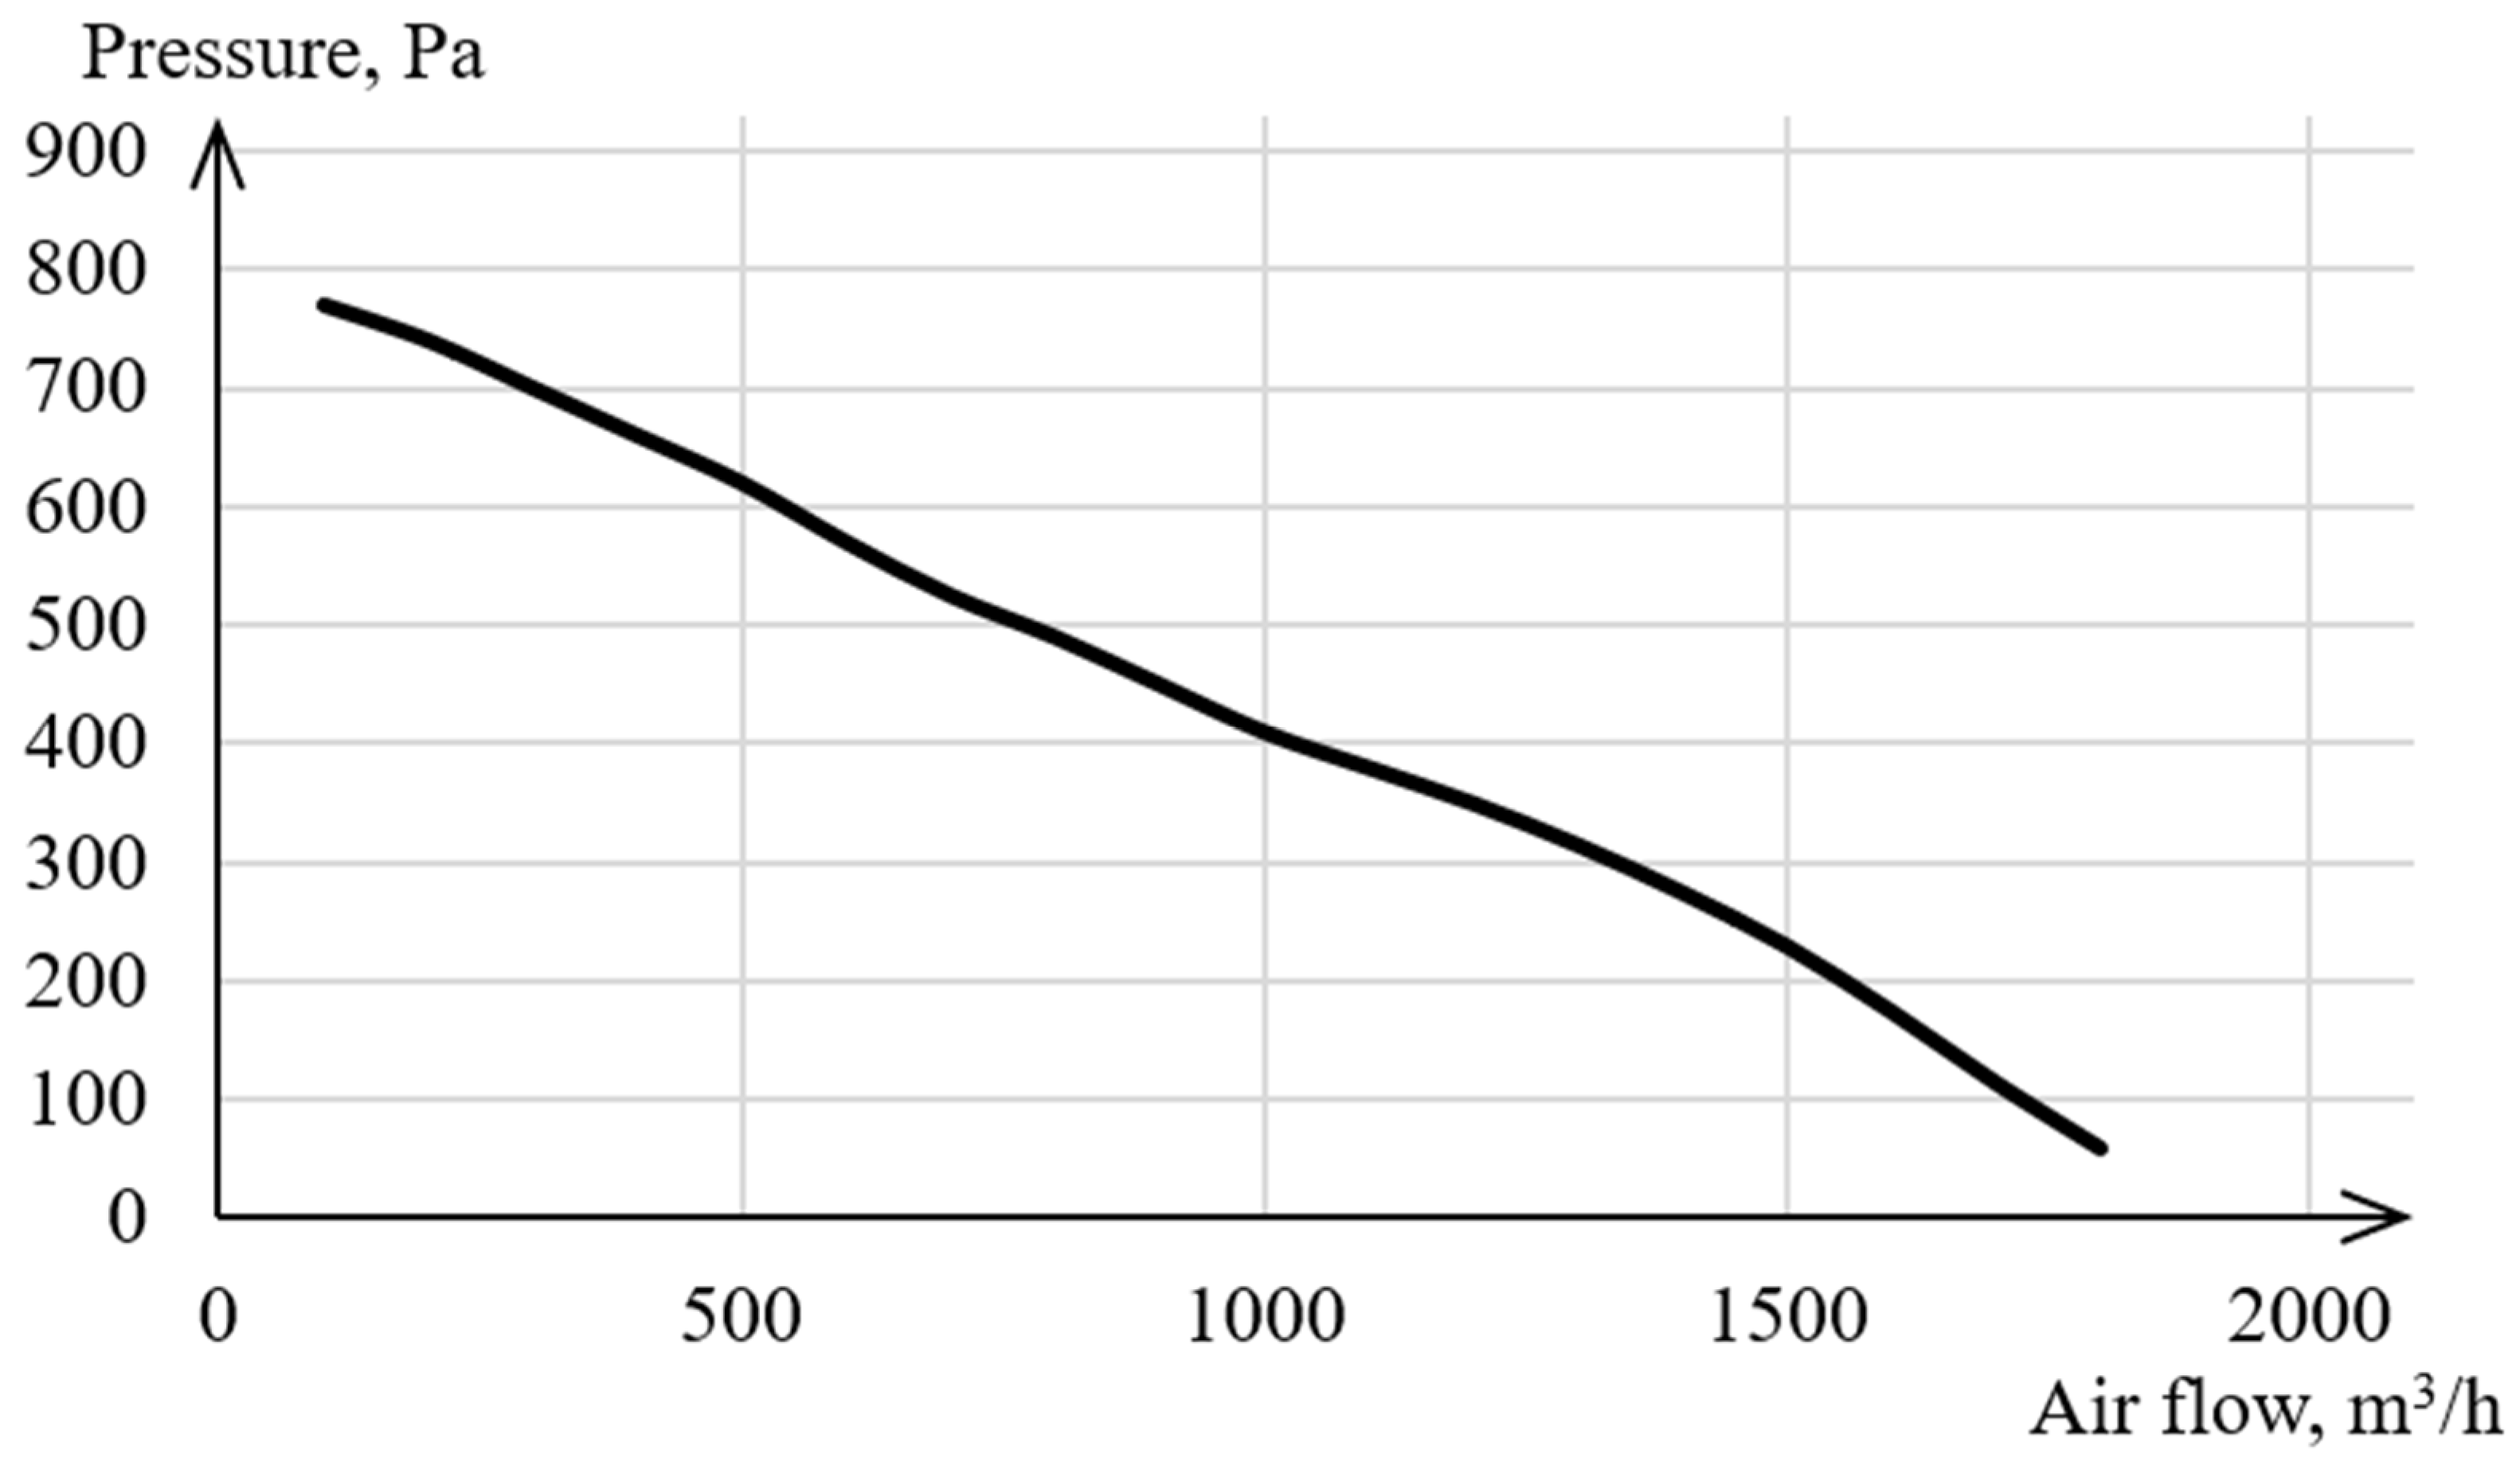
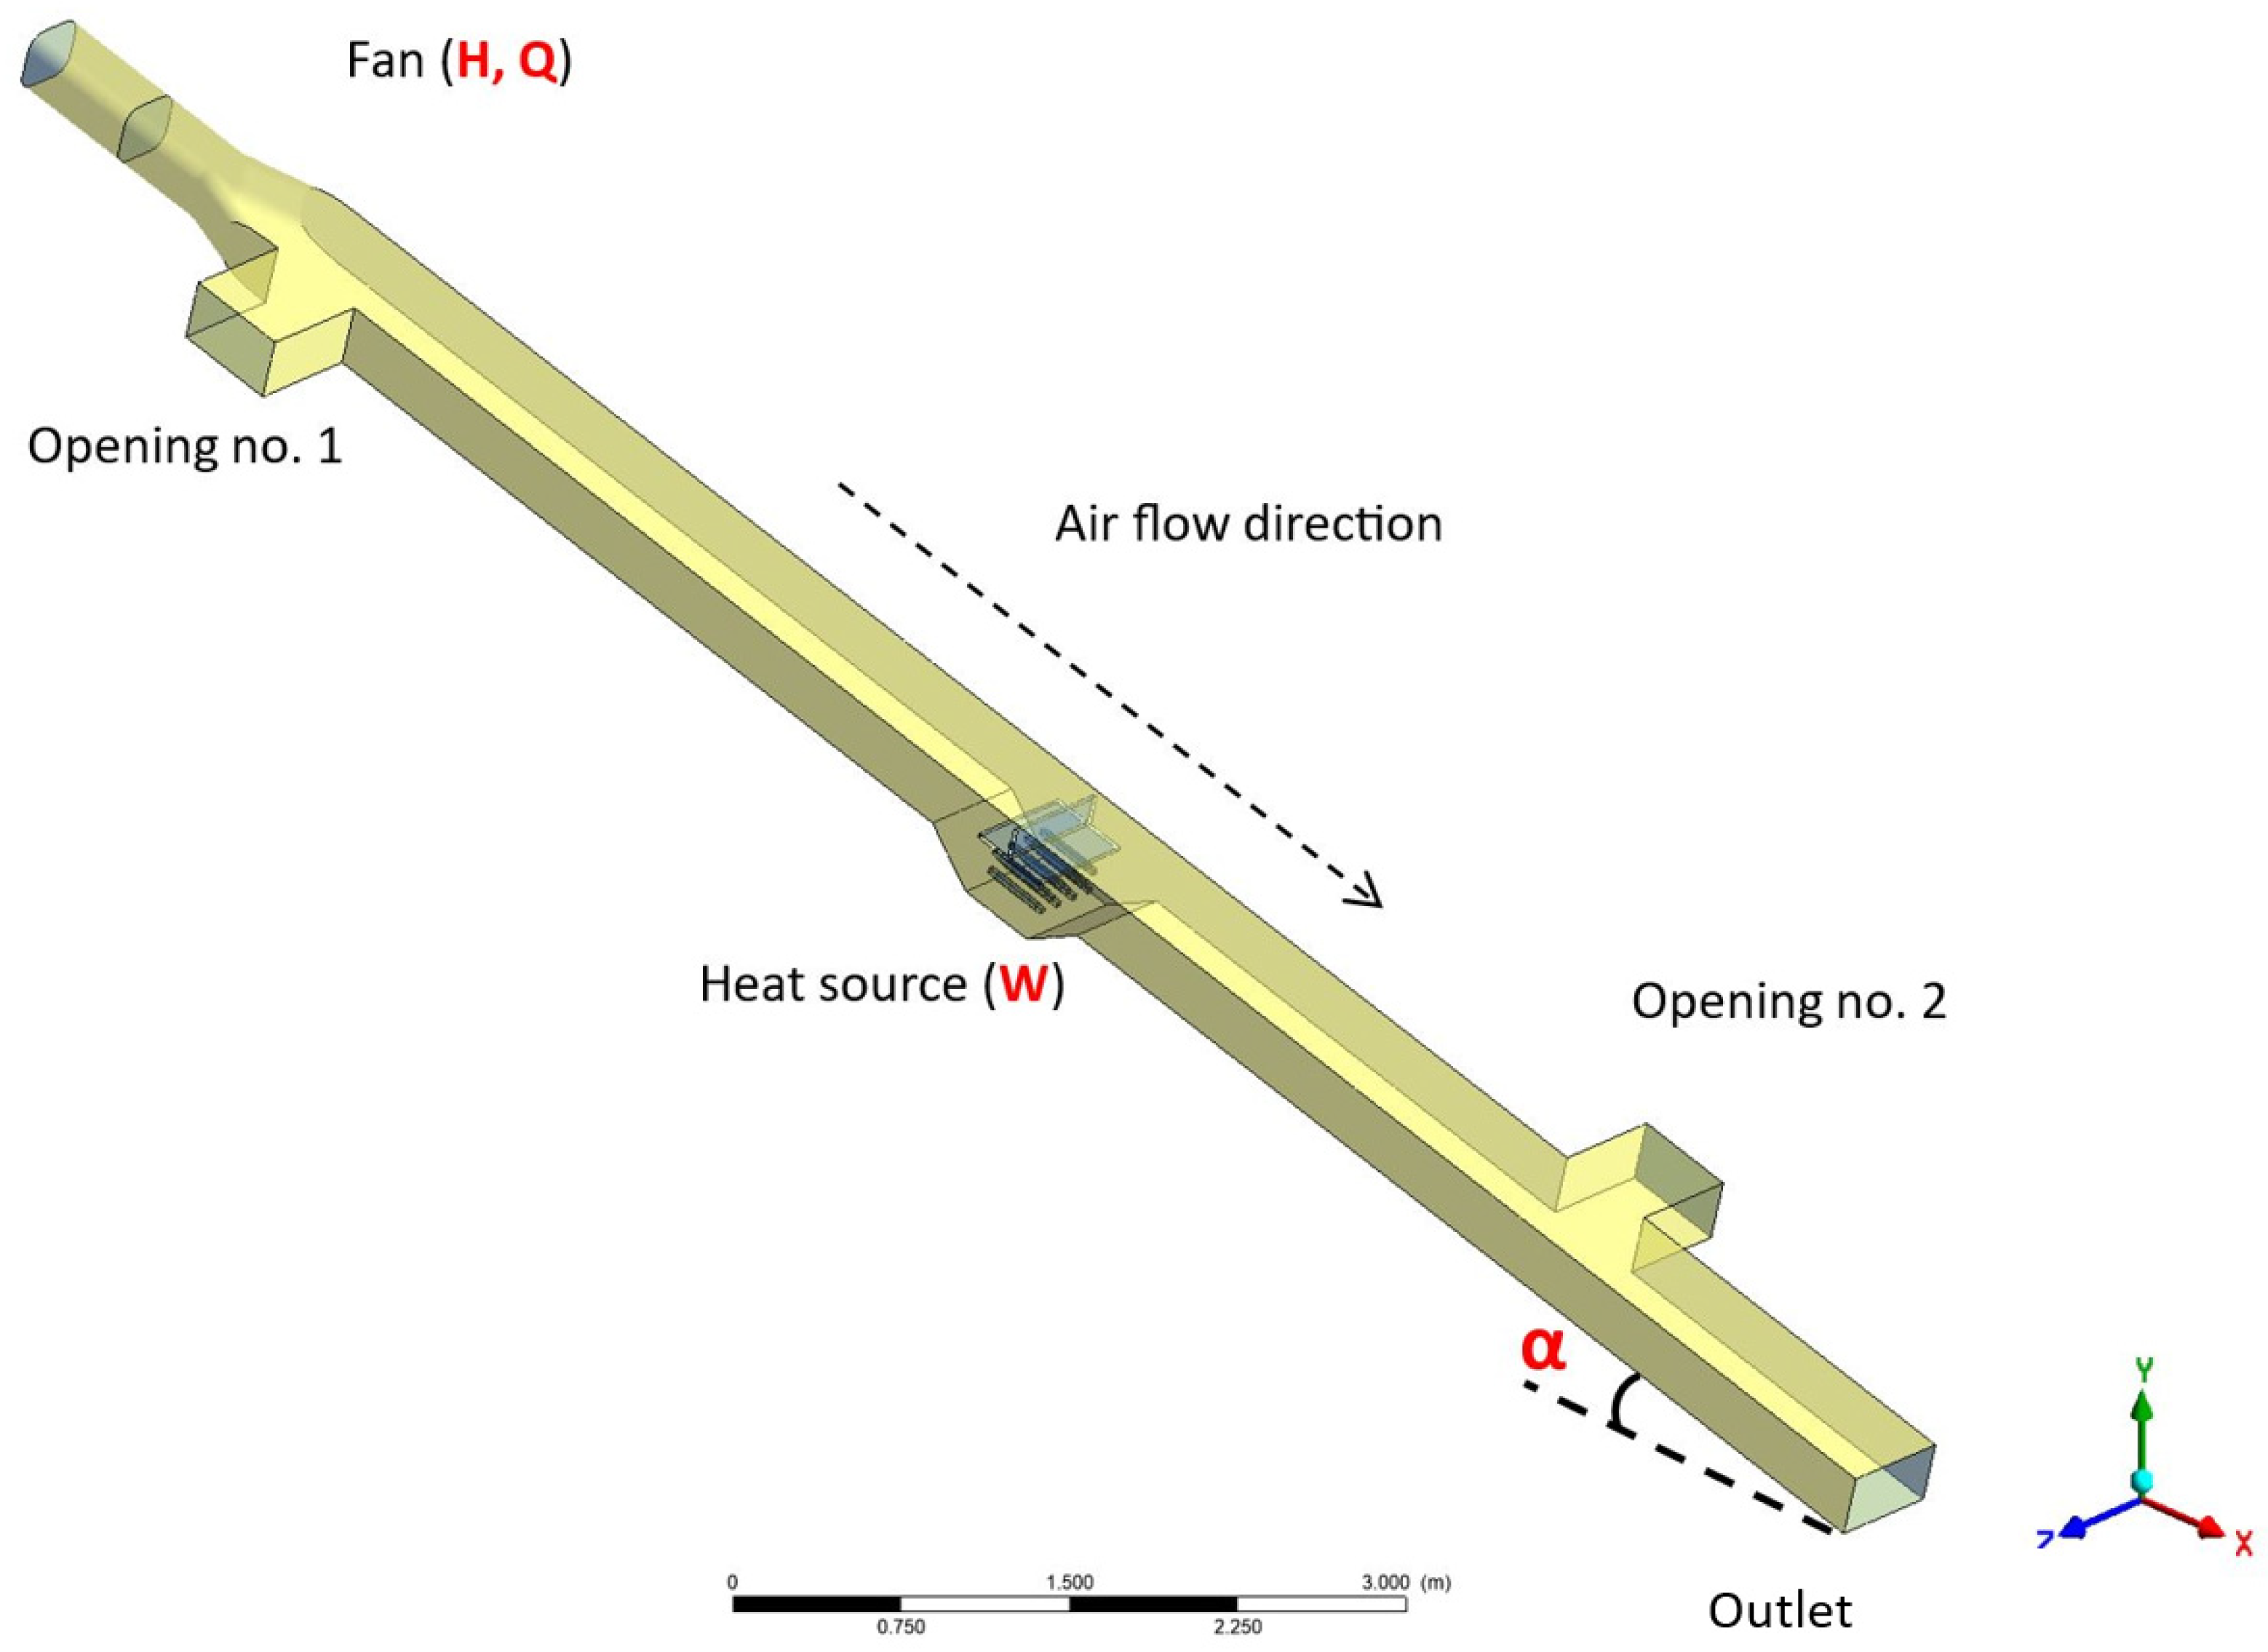
2.2. Theoretical Study
3. Results and Discussion
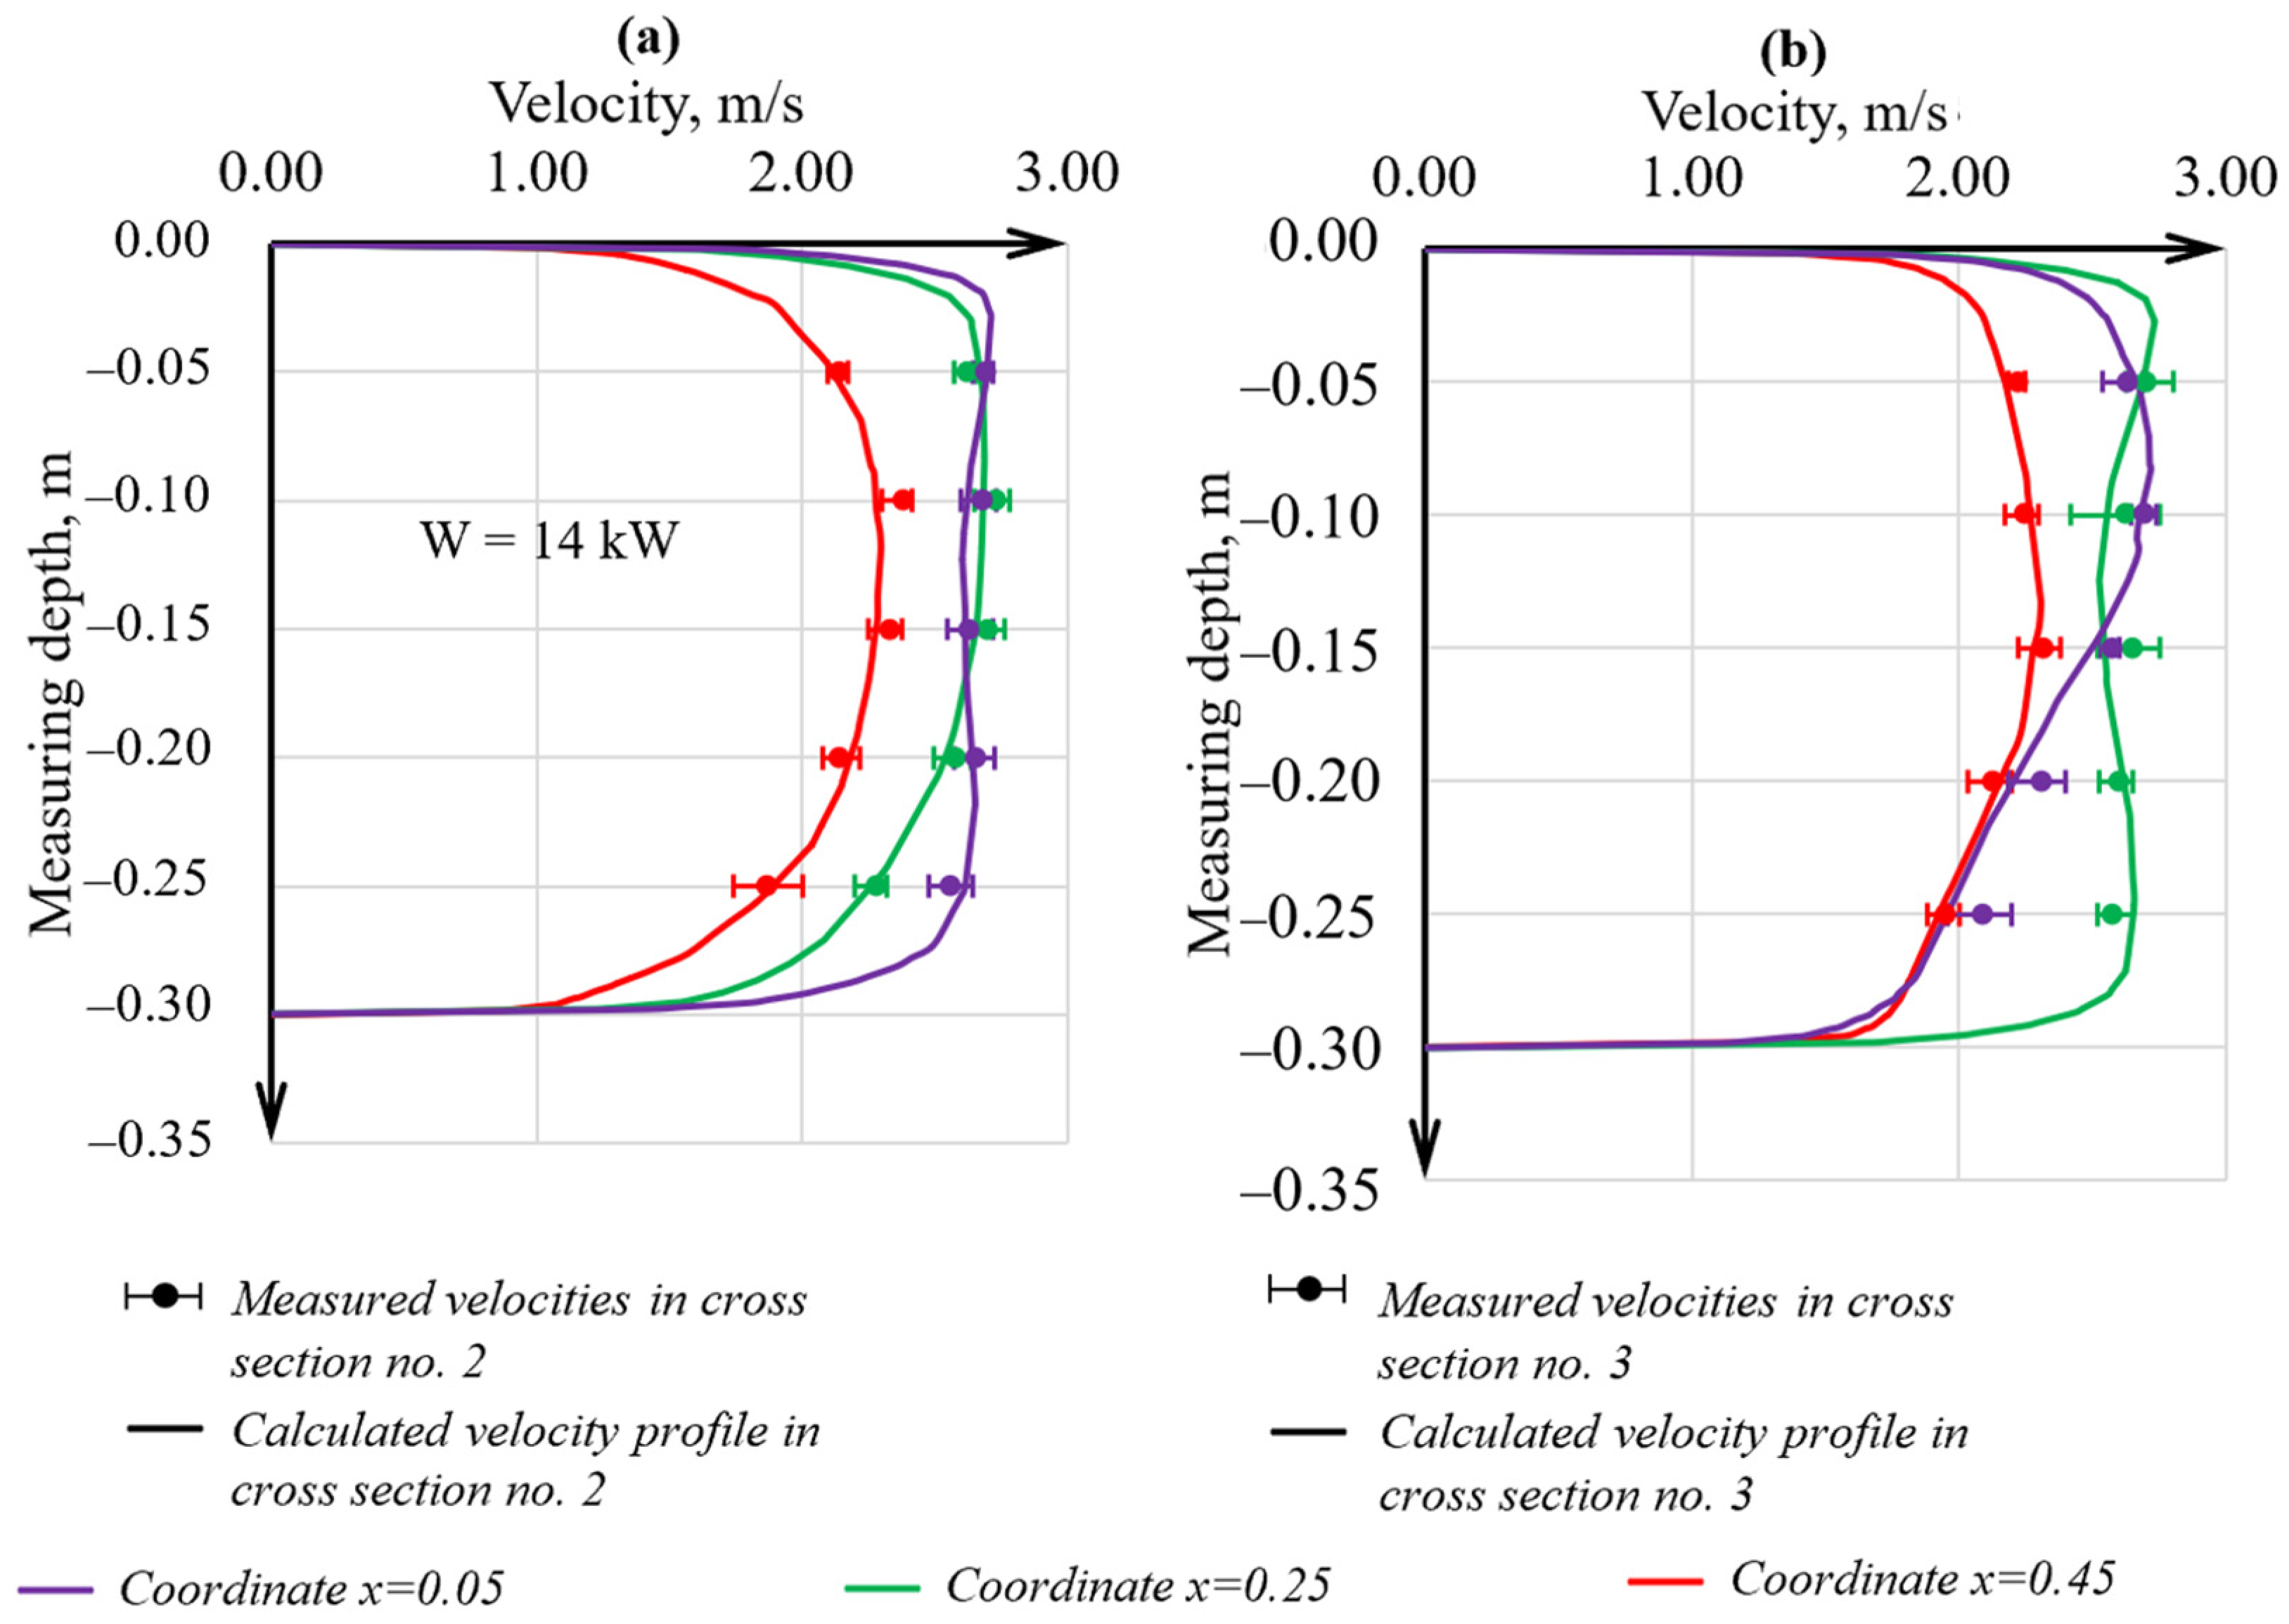
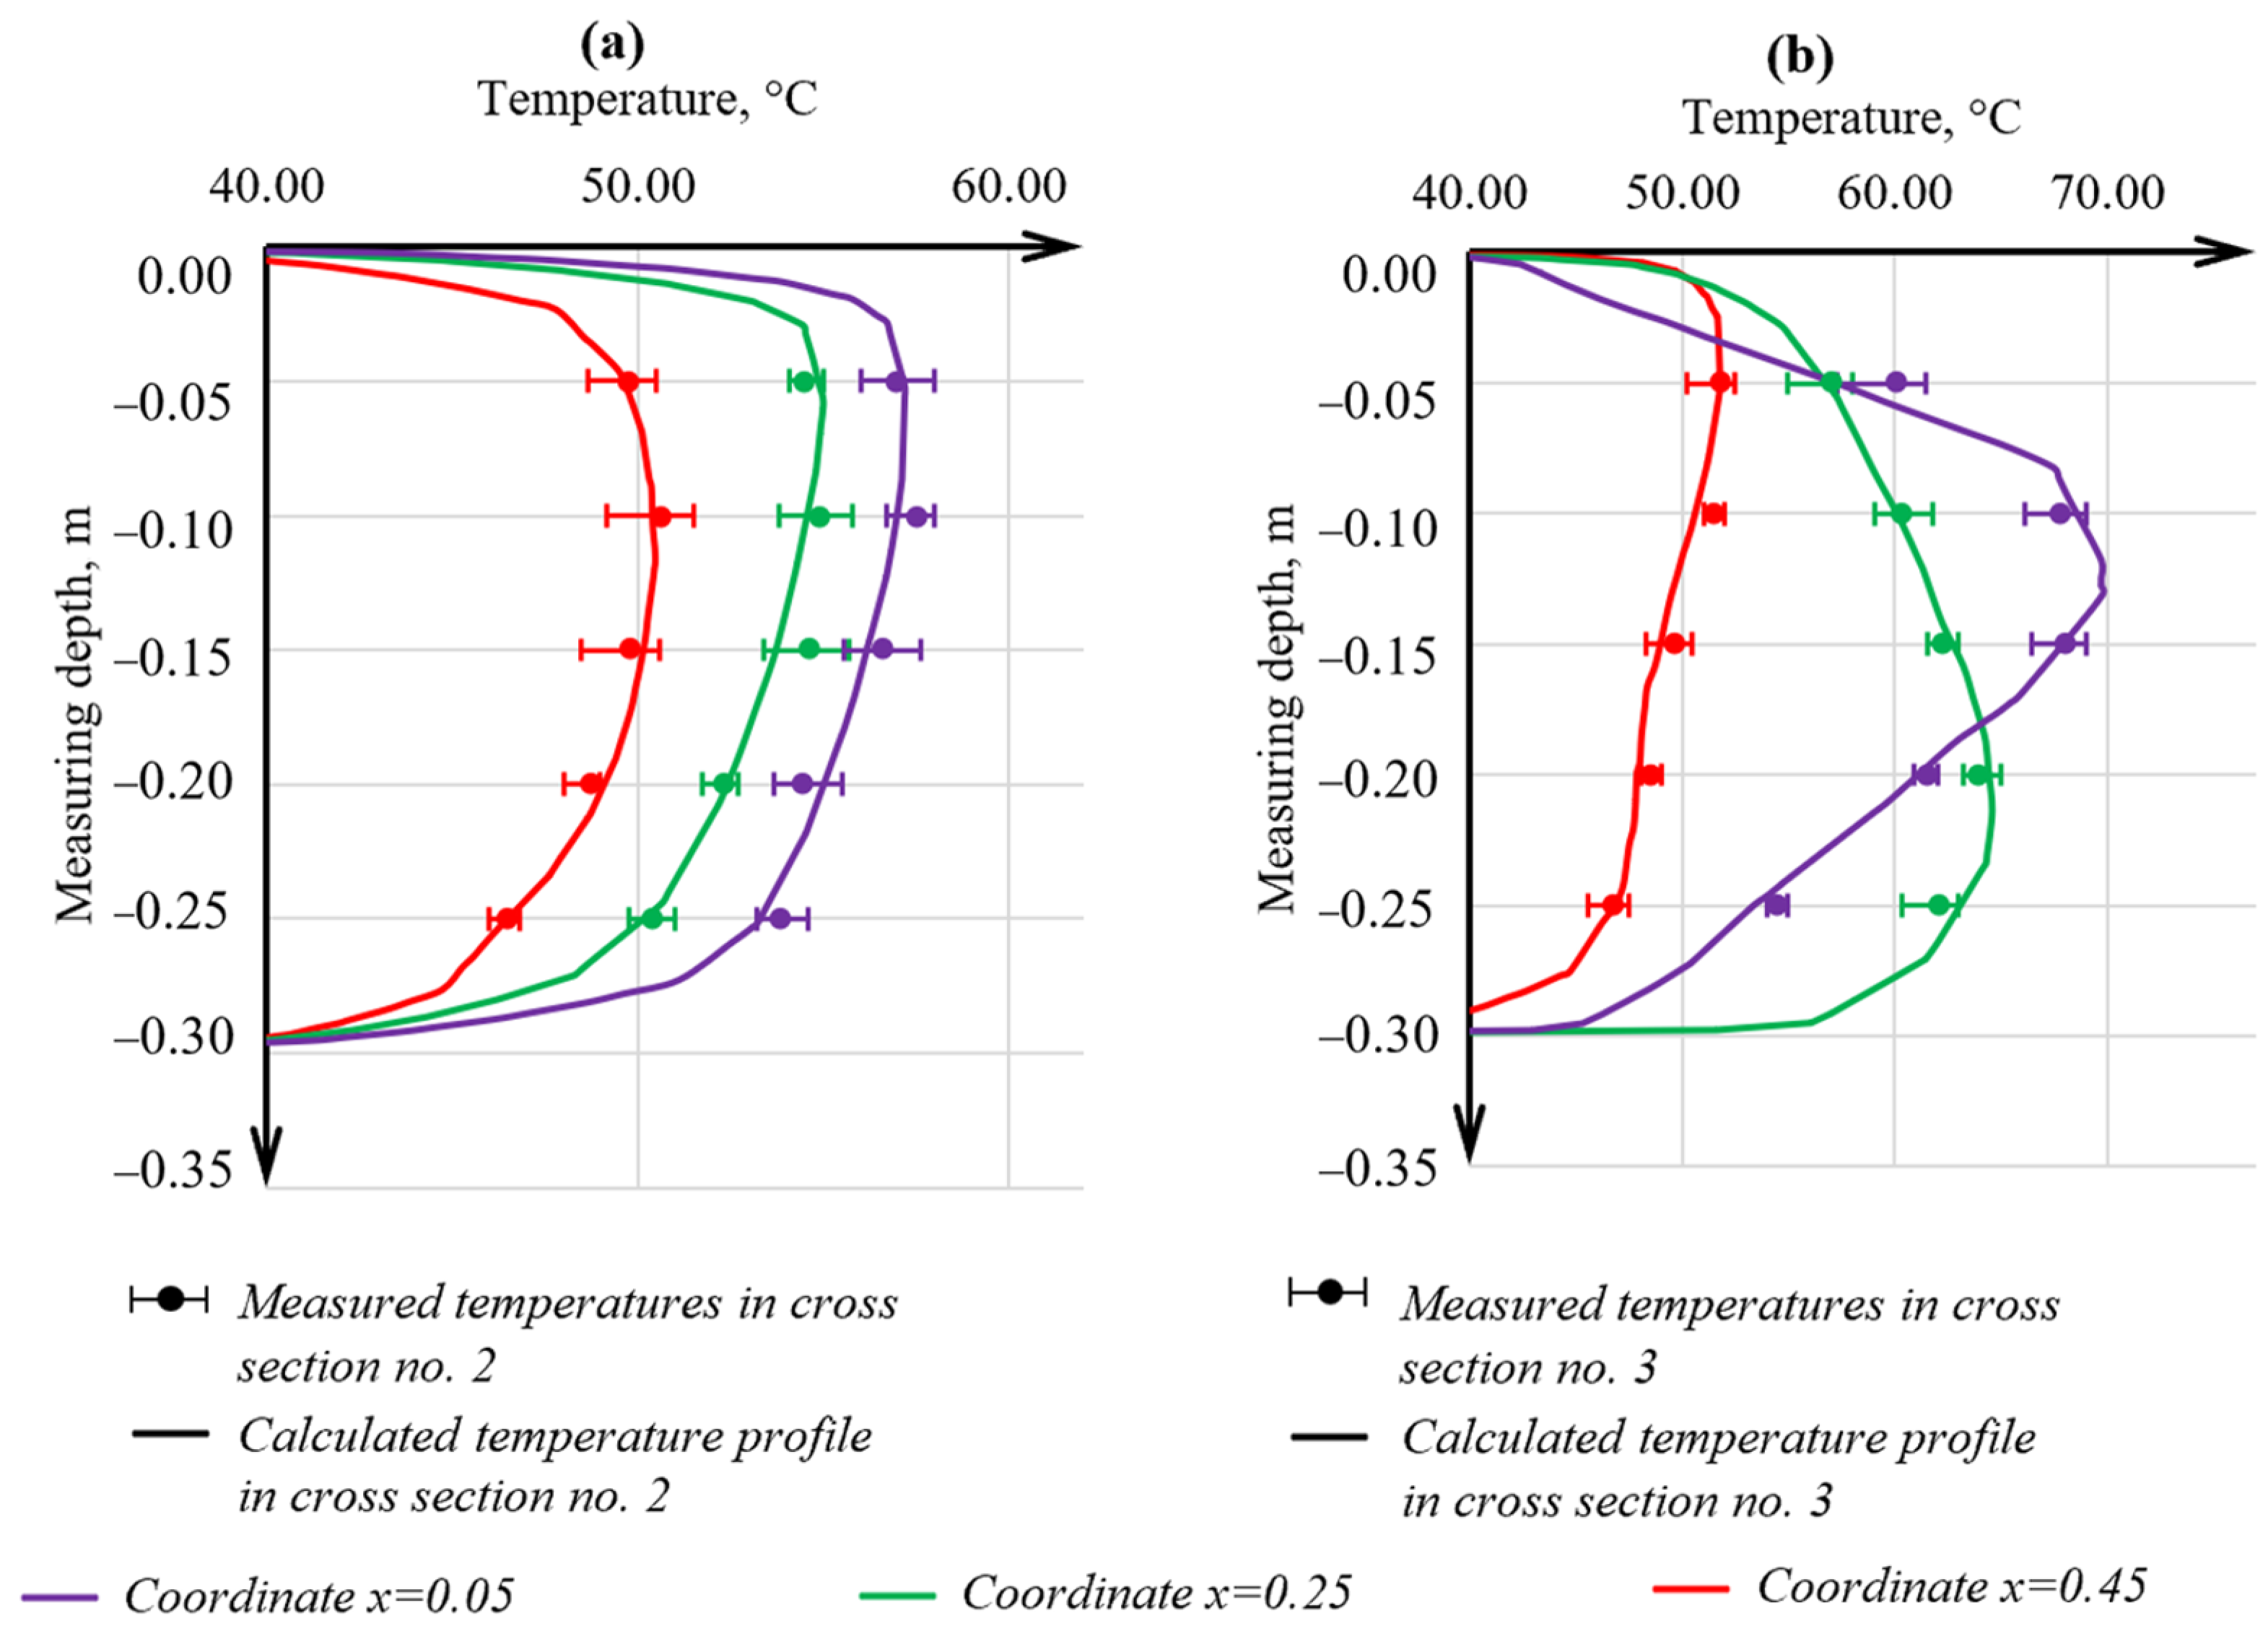
3.1. Model Validation
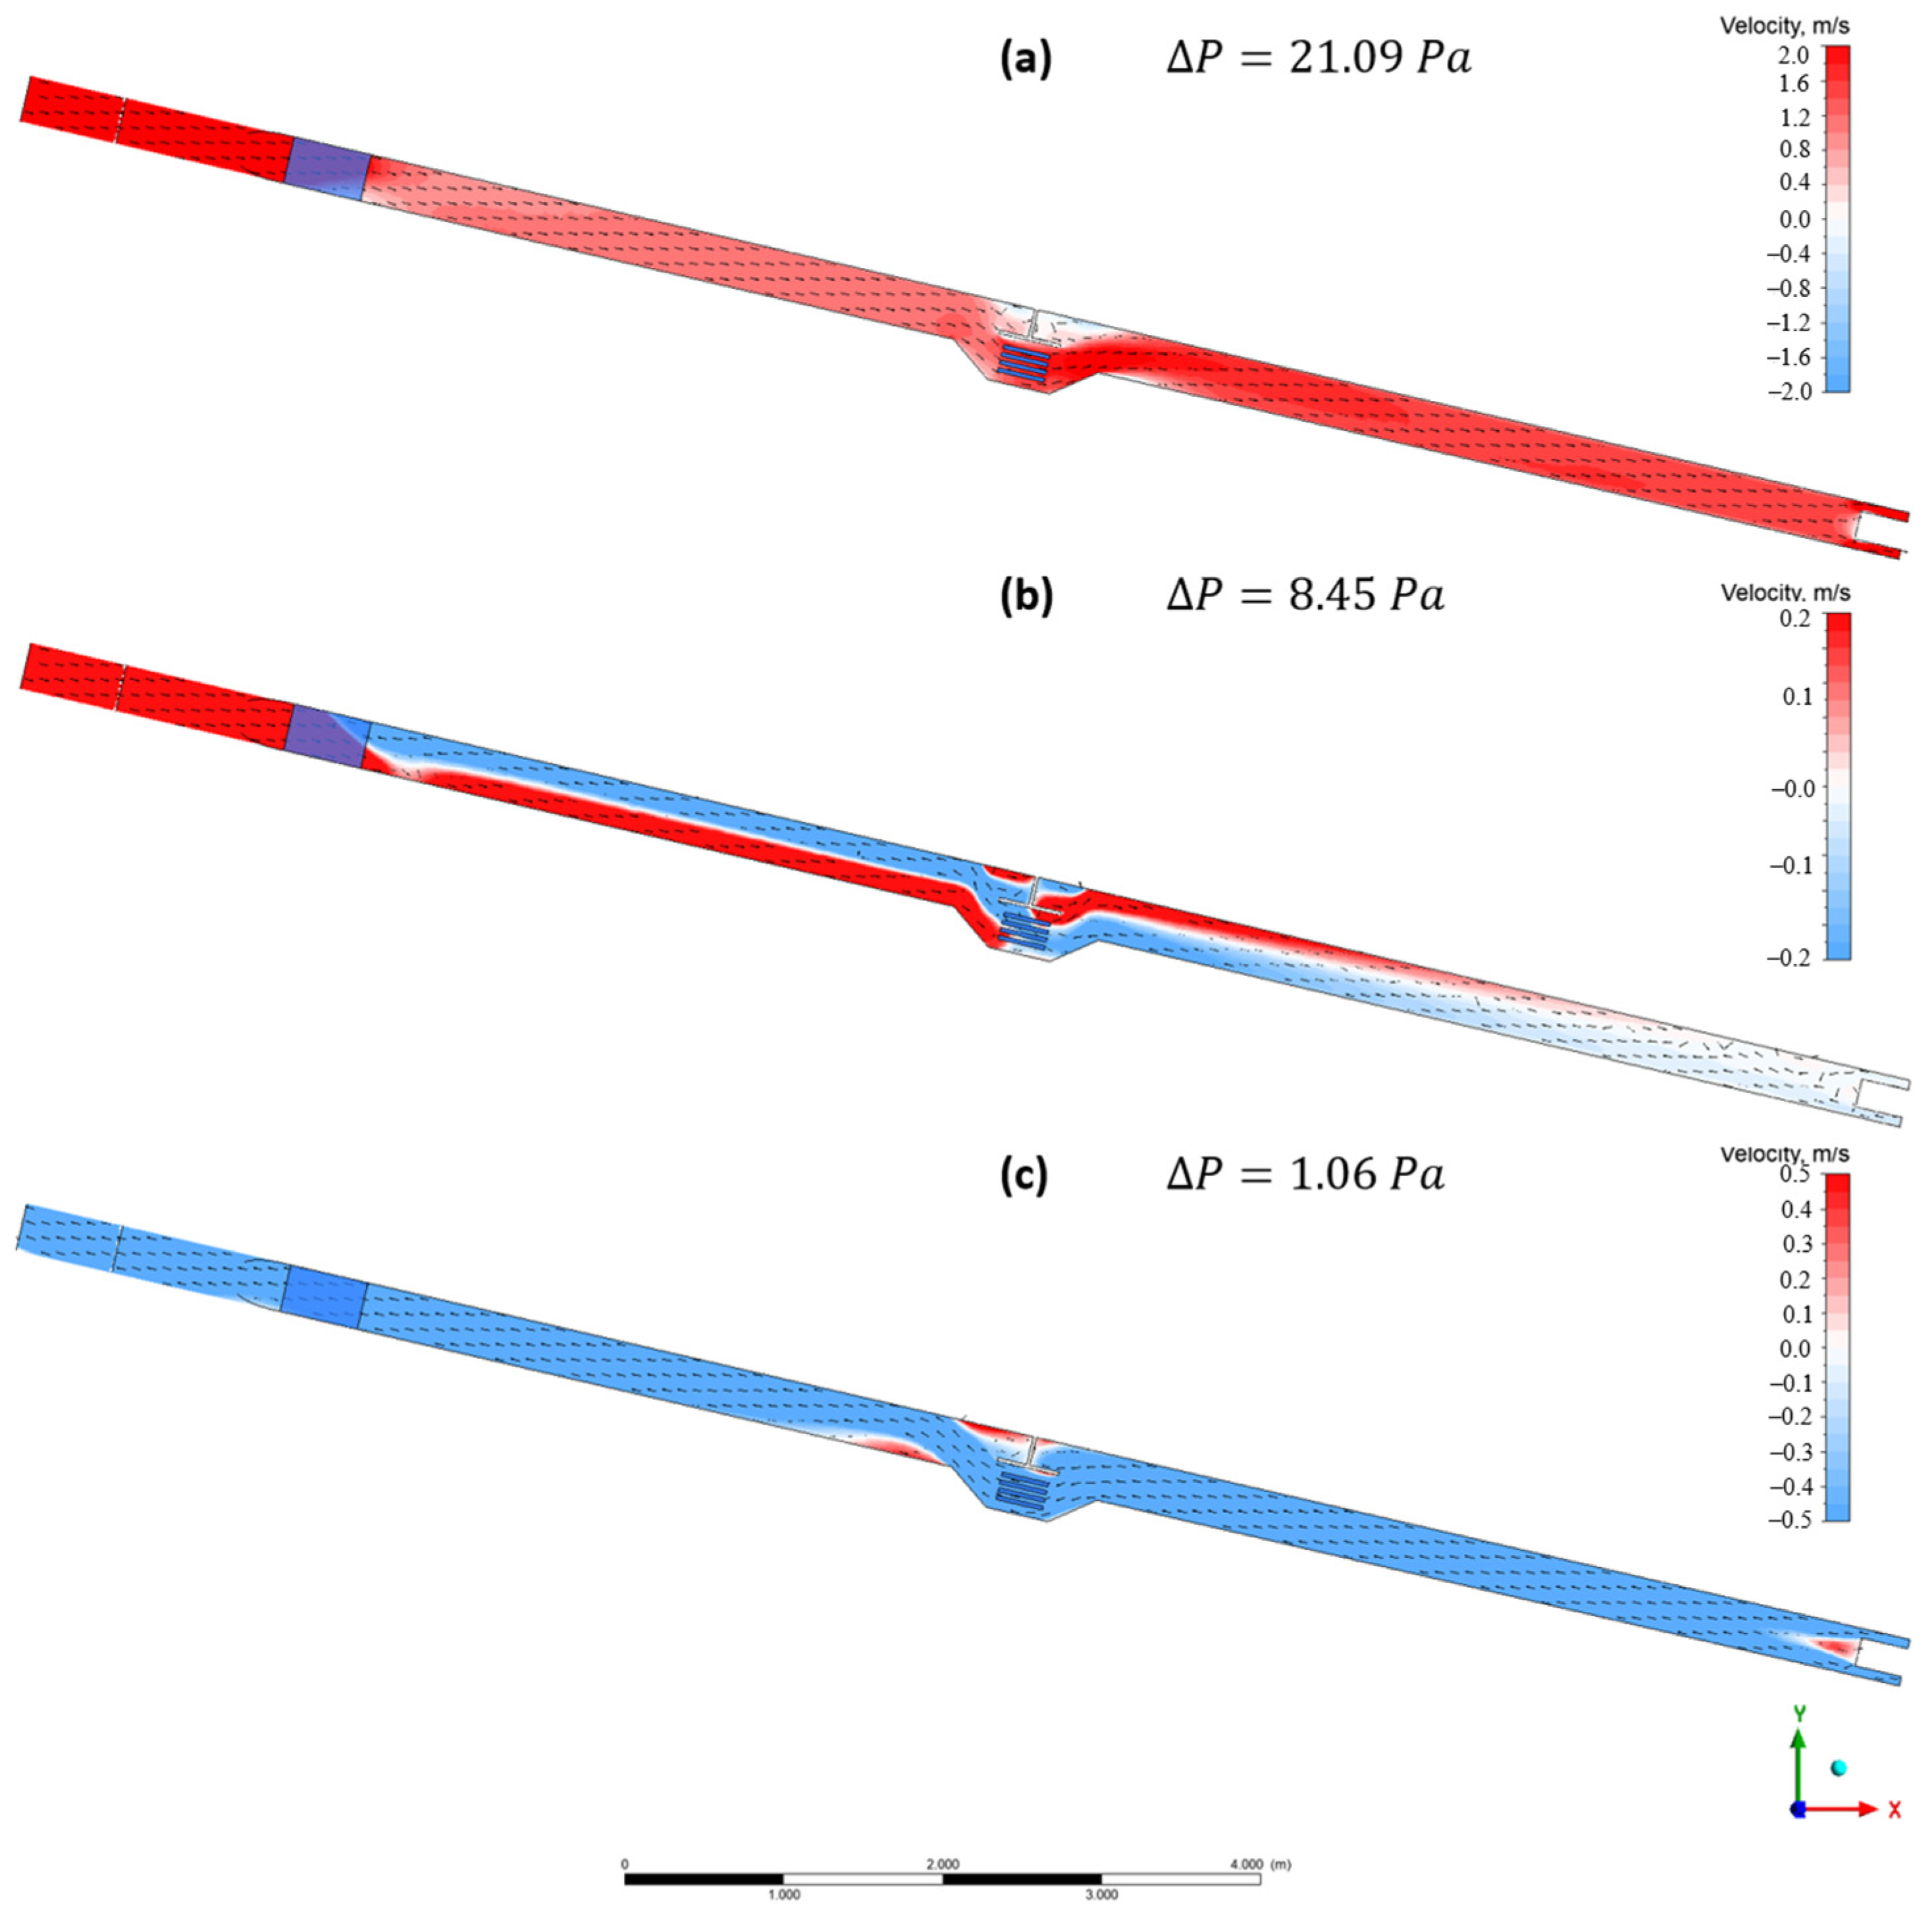
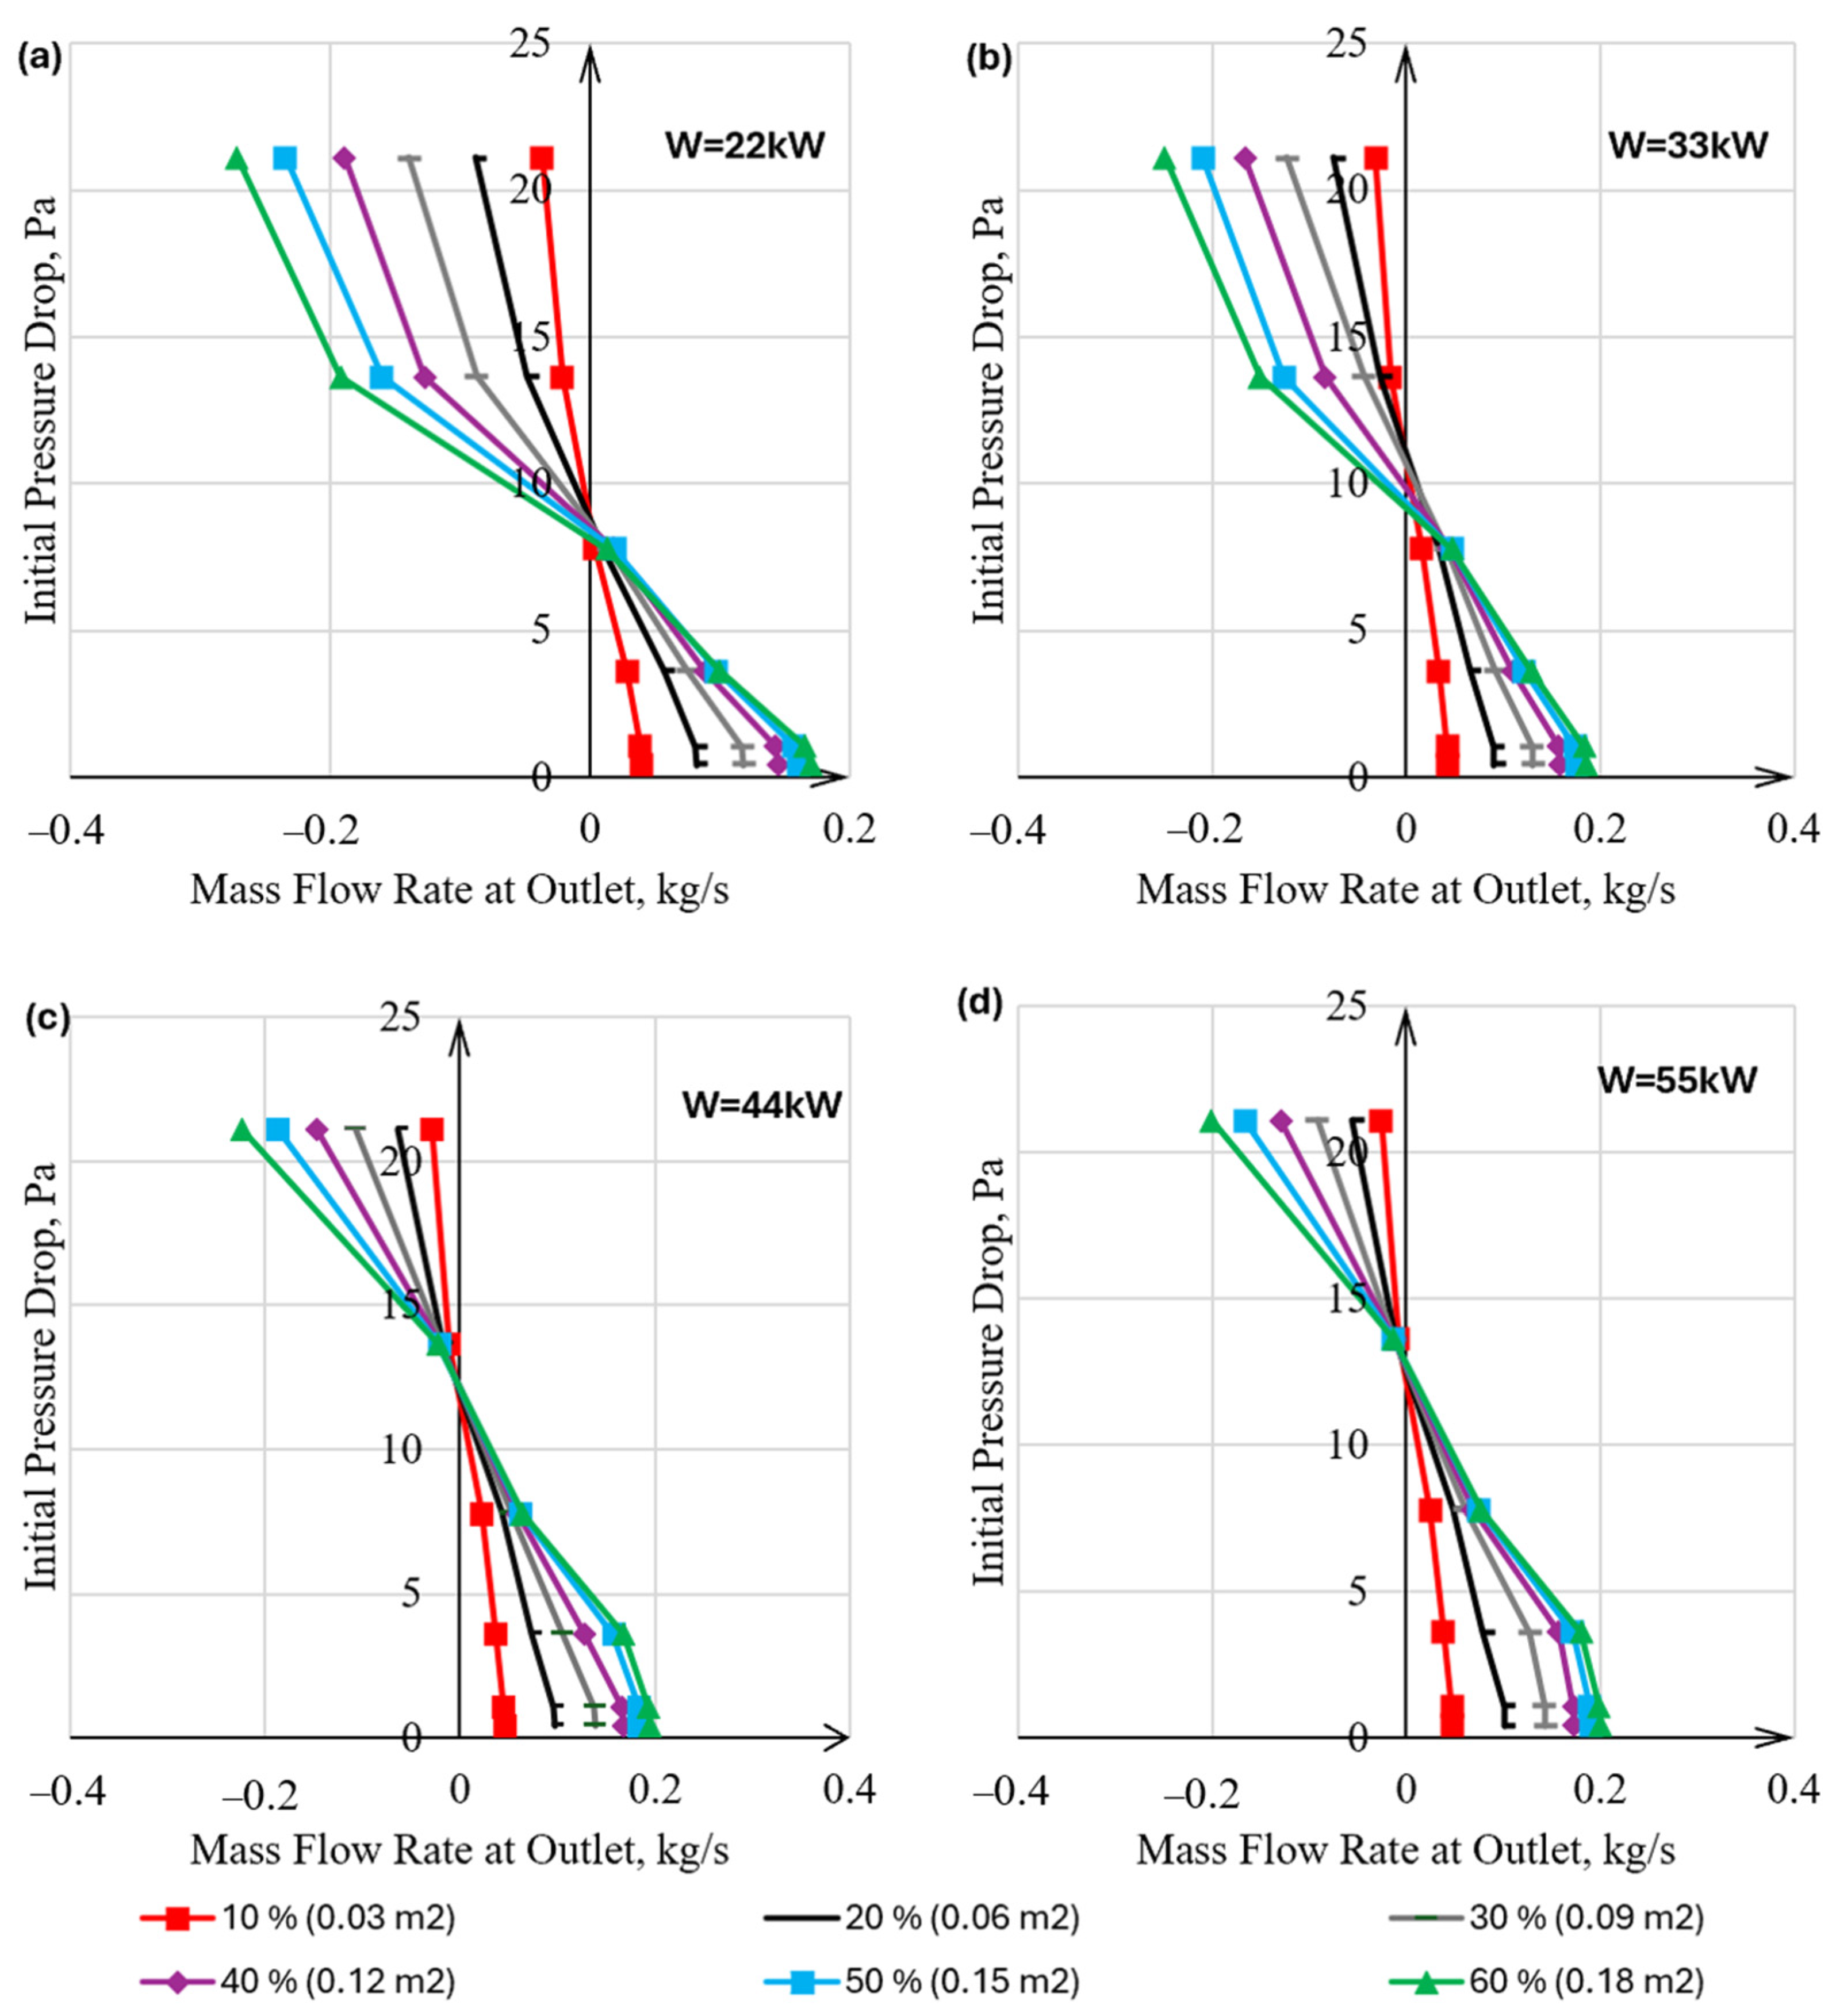
3.2. Numerical Simulation of Air Flow in an Inclined Channel
4. Conclusions
- A test bench was designed and assembled to study the patterns of heat and mass transfer in inclined mine workings with intense heat sources.
- Experimental measurements of temperature and air flow velocity distributions in the test bench at two angles of inclination, different heat release powers, and varying air flow resistances validated the mathematical model of non-isothermal turbulent air flow in an inclined channel.
- Multi-parameter modeling of air flow in an inclined channel was conducted at different heat release rates of the fire source, fan operating modes (pressure drops), and air resistances. The results were processed and generalized to build a linear regression model, which can determine the mass flow of air in an inclined channel under various parameters. This model was used to determine the dependence of the critical heat release rate on the aerodynamic parameters of real mine workings.
- A weak dependence of the moment of reversing the air flow on the air resistance of the ventilation system surrounding the considered inclined channel when a heat source was revealed. The overturning of the air flow largely depended on the heat release rate of the fire and the initial pressure drop in the inclined part of the test bench.
Author Contributions
Funding
Data Availability Statement
Conflicts of Interest
References
- Gehandler, J. Road tunnel fire safety and risk: A review. Fire Sci. Rev. 2015, 4, 1–27. [Google Scholar] [CrossRef]
- Beard, A.N. A theoretical model of major fire spread in a tunnel. Fire Technol. 2006, 42, 303–328. [Google Scholar] [CrossRef]
- Gannouni, S.; Zinoubi, J.; Maad, R.B. Numerical study on the thermal buoyant flow stratification in tunnel fires with longitudinal imposed airflow: Effect of an upstream blockage. Int. J. Therm. Sci. 2019, 136, 230–242. [Google Scholar] [CrossRef]
- Lotero, S.; Androulakis, V.; Khaniani, H.; Hassanalian, M.; Shao, S.; Roghanchi, P. Optimizing fire emergency evacuation routes in underground coal mines: A lightweight network flow approach. Tunn. Undergr. Space Technol. 2024, 146, 105637. [Google Scholar] [CrossRef]
- Ji, J.; Fan, C.G.; Zhong, W.; Shen, X.B.; Sun, J.H. Experimental investigation on influence of different transverse fire locations on maximum smoke temperature under the tunnel ceiling. Int. J. Heat. Mass. Transf. 2012, 55, 4817–4826. [Google Scholar] [CrossRef]
- Brake, D. Fire Modelling in Underground Mines using Ventsim Visual VentFIRE Software. In Proceedings of the Australian Mine Ventilation Conference, Adelaide, SA, Australia, 1–3 July 2013. [Google Scholar]
- Yuan, Q.; Zhu, H.; Zhang, X.; Zhang, B.; Zhang, X. An integrated quantitative risk assessment method for underground engineering fires. Int. J. Environ. Res. Public. Health 2022, 19, 16934. [Google Scholar] [CrossRef] [PubMed]
- Onifade, M.; Genc, B.; Said, K.O.; Fourie, M.; Akinseye, P.O. Overview of mine rescue approaches for underground coal fires: A South African perspective. J. South. Afr. Inst. Min. Metall. 2022, 122, 213–226. [Google Scholar] [CrossRef]
- Oka, Y.; Atkinson, G.T. Control of smoke flow in tunnel fires. Fire Saf. J. 1995, 25, 305–322. [Google Scholar] [CrossRef]
- Mao, J.; Xi, Y.H.; Bai, G.; Fan, H.M.; Ji, H.Z. A model experimental study on backdraught in tunnel fires. Fire Saf. J. 2011, 46, 164–177. [Google Scholar] [CrossRef]
- Lin, J.; Dong, Y.; Duan, J.; Zhang, D.; Zheng, W. Experiment on single-tunnel fire in concrete immersed tunnels. Tunn. Undergr. Space Technol. 2021, 116, 104059. [Google Scholar] [CrossRef]
- Hong, Y.; Kang, J.; Fu, C. Rapid prediction of mine tunnel fire smoke movement with machine learning and supercomputing techniques. Fire Saf. J. 2022, 127, 103492. [Google Scholar] [CrossRef]
- Król, A.; Król, M. Numerical investigation on fire accident and evacuation in a urban tunnel for different traffic conditions. Tunn. Undergr. Space Technol. 2021, 109, 103751. [Google Scholar] [CrossRef]
- Stewart, C.M. Challenges and solutions in the development of the VentFIRE mine network fire simulator. In Mine Ventilation; CRC Press: Boca Raton, FL, USA, 2021; pp. 300–308. [Google Scholar]
- Nematollahi Sarvestani, A.; Oreste, P.; Gennaro, S. Fire Scenarios Inside a Room-and-Pillar Underground Quarry Using Numerical Modeling to Define Emergency Plans. Appl. Sci. 2023, 13, 4607. [Google Scholar] [CrossRef]
- Shi, X.; Gai, W.; Xu, K. Bi-objective rescue path selection optimization for mine fires based on quantitative risk assessment. Saf. Sci. 2022, 146, 105492. [Google Scholar] [CrossRef]
- Zhou, L.; Smith, A.C. Improvement of a mine fire simulation program—Incorporation of smoke rollback into MFIRE 3.0. J. Fire Sci. 2012, 30, 29–39. [Google Scholar] [CrossRef]
- Atkinson, G.T.; Wu, Y. Smoke control in sloping tunnels. Fire Saf. J. 1996, 27, 335–341. [Google Scholar] [CrossRef]
- Wu, Y.; Bakar, M.Z.A. Control of smoke flow in tunnel fires using longitudinal ventilation systems–a study of the critical velocity. Fire Saf. J. 2000, 35, 363–390. [Google Scholar] [CrossRef]
- Lee, S.R.; Ryou, H.S. A numerical study on smoke movement in longitudinal ventilation tunnel fires for different aspect ratio. Build. Environ. 2006, 41, 719–725. [Google Scholar] [CrossRef]
- Vauquelin, O. Parametrical study of the back low occurrence in case of a buoyant release into a rectangular channel. Exp. Therm. Fluid. Sci. 2005, 29, 725–731. [Google Scholar] [CrossRef]
- Kurioka, H.; Oka, Y.; Satoh, H.; Sugawa, O. Fire properties in near field of square fire source with longitudinal ventilation in tunnels. Fire Saf. J. 2003, 38, 319–340. [Google Scholar] [CrossRef]
- Li, Y.Z.; Lei, B.; Ingason, H. The maximum temperature of buoyancy-driven smoke flow beneath the ceiling in tunnel fires. Fire Saf. J. 2011, 46, 204–210. [Google Scholar] [CrossRef]
- Azevedo, J.L.T.; Pereira, J.M.; Pereira, J.C. Numerical Simulation of Unsteady Backlayering in Tunnel Fires. In Proceedings of the International Heat Transfer Conference 13, Sydney, Australia, 13–18 August 2006. [Google Scholar]
- Hu, L.H.; Huo, R.; Chow, W.K. Studies on buoyancy-driven back-layering flow in tunnel fires. Exp. Therm. Fluid. Sci. 2008, 32, 1468–1483. [Google Scholar] [CrossRef]
- Vauquelin, O.; Telle, D. Definition and experimental evaluation of the smoke “confinement velocity” in tunnel fires. Fire Saf. J. 2005, 40, 320–330. [Google Scholar] [CrossRef]
- Tang, Z.; Gao, K.; Tao, C.; Liu, Y.; Qi, Z. The influence of tunnel aspect ratio on the gas temperature distribution in advancing tunnel. Tunn. Undergr. Space Technol. 2024, 149, 105818. [Google Scholar] [CrossRef]
- Zhang, Y.; Ye, J.; Lin, C. Research on Tunnel Vehicle Fire Temperature Field Simulation Considering the Latent Heat of Vaporization Inside Concrete Linings. Case Stud. Therm. Eng. 2024, 60, 104768. [Google Scholar] [CrossRef]
- Zhou, H.; Cong, H.; Wang, Y.; Dou, Z. A computer-vision-based deep learning model of smoke diffusion. Process Saf. Environ. Prot. 2024, 187, 721–735. [Google Scholar] [CrossRef]
- Sun, C.; Weng, M.; Liu, F.; Ling, K. Study on the smoke flow characteristics in inclined tunnel with an upstream shaft under natural ventilation. Tunn. Undergr. Space Technol. 2024, 149, 105806. [Google Scholar] [CrossRef]
- Tan, Y.; Wang, K.; Zhang, Z.; Lu, Z.; Zhang, H. Study on the Effect of Natural Wind on the Smoke Spread Law of Extra-Long Tunnel Fires with Inclined Shafts for Air Supply and Exhaust. Buildings 2024, 14, 1516. [Google Scholar] [CrossRef]
- Chen, J.; Hu, Z.; Yang, S. Simulation of Fire Evacuation in a Naturally Ventilated Bifurcated Tunnel. Fire 2024, 7, 202. [Google Scholar] [CrossRef]
- Krasyuk, A.M.; Lugin, I.V.; Pavlov, S.A. Experimental research into air distribution in a terminal subway station. Tunn. Undergr. Space Technol. 2019, 85, 21–28. [Google Scholar] [CrossRef]
- Semin, M.; Levin, L. Mathematical modeling of air distribution in mines considering different ventilation modes. Mathematics 2023, 11, 989. [Google Scholar] [CrossRef]
- Zhikharev, S.Y.; Rodionov, V.A.; Kormshchikov, D.S.; Nikashin, V.A. Methodological approach to air composition control and evaluation of safe operation conditions in underground mining. Gorn. J. 2023, 2023, 75–80. [Google Scholar] [CrossRef]
- Shalimov, A.V.; Kormshchikov, D.S.; Gazizullin, R.R.; Semin, M.A. Modeling alteration of thermal drop of ventilation pressure and its effects on mine working ventilation. Perm. J. Pet. Min. Eng. 2014, 12, 41–47. [Google Scholar]
- Perestoronin, M.O.; Parshakov, O.S.; Popov, M.D. Parameterization of a ventilation network model for the analysis of mine working emergency ventilation modes. Min. Sci. Technol. 2023, 8, 150–161. [Google Scholar] [CrossRef]
- Singh, R.V.K.; Tripathi, D.D.; Mohalik, N.K.; Khalkho, A.; Pandey, J.; Mishra, R.K. Environmental issues due to fire in coal mines: Its impact and suggestions for implementing precautionary and control measures. In Environmental Pollution: Select Proceedings of ICWEES-2016; Springer: Singapore, 2018. [Google Scholar]
- Stewart, C.M.; Aminossadati, S.M.; Kizil, M.S. Underground fire rollback simulation in large scale ventilation models. In Proceedings of the15th North American Mine Ventilation Symposium, the Virginia Tech campus in Blacksburg, Virginia, Blacksburg, VA, USA, 25 June 2015. [Google Scholar]
- Adjiski, V. Possibilities for simulating the smoke rollback effect in underground mines using CFD software. GeoScience Eng. 2014, 60, 8–18. [Google Scholar] [CrossRef]
- Ingason, H.; Li, Y.Z.; Lönnermark, A. Tunnel Fire Dynamics; Springer: New York, NY, USA, 2015; Volume 51, pp. 1511–1513. [Google Scholar]
- Merci, B. Introduction to fluid mechanics. In The SFPE Handbook of Fire Protection Engineering, 5th ed.; Hurley, J.M., Gottuk, D., Eds.; Springer: New York, NY, USA, 2016; Volume 5, pp. 1–24. [Google Scholar]
- Kazakov, B.P.; Shalimov, A.V.; Semin, M.A. Stability of natural ventilation mode after main fan stoppage. Int. J. Heat Mass Transf. 2015, 86, 288–293. [Google Scholar] [CrossRef]
- Wolstencroft, M.; Davies, J.H.; Davies, D.R. Nusselt–Rayleigh number scaling for spherical shell Earth mantle simulation up to a Rayleigh number of 109. Phys. Earth Planet. Inter. 2009, 176, 132–141. [Google Scholar] [CrossRef]
- Hansen, R. Varying Heat Release Rates per Unit Area–The Impact in Underground Mines. Min. Rev. 2023, 29, 1–28. [Google Scholar] [CrossRef]
- Popov, M.; Tatsiy, A. Calculation of heat release power during distributed and spot fires in mine ventilation networks. Min. Echo 2022, 3, 98–104. (In Russia) [Google Scholar]
- Shih, T.H.; Liou, W.W.; Shabbir, A.; Yang, Z.; Zhu, J. A new k-epsilon eddy viscosity model for high Reynolds number turbulent flows: Model development and validation (No. CMOTT-94-6). Comput. Fluids 1995, 24, 227–238. [Google Scholar] [CrossRef]
- John, J.; Pane, E.A.; Suyitno, B.M.; Rahayu, G.H.; Rhakasywi, D.; Suwandi, A. Computational fluid dynamics simulation of the turbulence models in the tested section on wind tunnel. Ain Shams Eng. J. 2020, 11, 1201–1209. [Google Scholar]
- Smirnyakov, V.V.; Rodionov, V.A.; Smirnyakova, V.V.; Orlov, F.A. The influence of the shape and size of dust fractions on their distribution and accumulation in mine workings when changing the structure of air flow. J. Min. Inst. 2022, 253, 71–81. [Google Scholar] [CrossRef]
- Moraga, N.O.; Marambio, M.A.; Cabrales, R.C. Geometric multigrid technique for solving heat convection-diffusion and phase change problems. Int. Commun. Heat Mass Transf. 2017, 88, 108–119. [Google Scholar] [CrossRef]
- Van Maele, K.; Merci, B. Application of RANS and LES field simulations to predict the critical ventilation velocity in longitudinally ventilated horizontal tunnels. Fire Saf. J. 2008, 43, 598–609. [Google Scholar] [CrossRef]
- Xu, T.; Zhao, D.; Tao, H.; Lei, P. Extended CFD models for numerical simulation of tunnel fire under natural ventilation: Comparative analysis and experimental verification. Case Stud. Therm. Eng. 2022, 31, 101815. [Google Scholar] [CrossRef]
- Tilley, N.; Rauwoens, P.; Merci, B. Verification of the accuracy of CFD simulations in small-scale tunnel and atrium fire configurations. Fire Saf. J. 2011, 46, 186–193. [Google Scholar] [CrossRef]


| Cell Size, m | Number of Cells | Mass Flow at the Inlet | |||||
|---|---|---|---|---|---|---|---|
| 0.5 kg/s | 1 kg/s | 2 kg/s | |||||
| Pressure Drop, Pa | Deviation from Previous Value, % | Pressure drop, Pa | Deviation from Previous Value, % | Pressure Drop, Pa | Deviation from Previous Value, % | ||
| 0.50 | 0.65 · 106 | 53.9 | — | 120.0 | — | 215.3 | — |
| 0.40 | 0.83 · 106 | 46.8 | −13 | 105.3 | −12 | 187.2 | −13 |
| 0.30 | 1.58 · 106 | 48.3 | +3 | 107.6 | +2 | 191.7 | +2 |
| 0.20 | 3.20 · 106 | 46.5 | −4 | 104.7 | −3 | 185.6 | −3 |
| Velocity, m/s | 0.25 | 0.5 | 1 | 1.5 | 2 | 2.5 |
| Pressure jump, Pa | 0.41 | 1.06 | 3.61 | 7.79 | 13.62 | 21.09 |
Disclaimer/Publisher’s Note: The statements, opinions and data contained in all publications are solely those of the individual author(s) and contributor(s) and not of MDPI and/or the editor(s). MDPI and/or the editor(s) disclaim responsibility for any injury to people or property resulting from any ideas, methods, instructions or products referred to in the content. |
© 2024 by the authors. Licensee MDPI, Basel, Switzerland. This article is an open access article distributed under the terms and conditions of the Creative Commons Attribution (CC BY) license (https://creativecommons.org/licenses/by/4.0/).
Share and Cite
Levin, L.; Popov, M.; Semin, M.; Zhikharev, S. Experimental and Numerical Study of Air Flow Reversal Induced by Fire in an Inclined Mine Working. Appl. Sci. 2024, 14, 6840. https://doi.org/10.3390/app14156840
Levin L, Popov M, Semin M, Zhikharev S. Experimental and Numerical Study of Air Flow Reversal Induced by Fire in an Inclined Mine Working. Applied Sciences. 2024; 14(15):6840. https://doi.org/10.3390/app14156840
Chicago/Turabian StyleLevin, Lev, Maksim Popov, Mikhail Semin, and Sergey Zhikharev. 2024. "Experimental and Numerical Study of Air Flow Reversal Induced by Fire in an Inclined Mine Working" Applied Sciences 14, no. 15: 6840. https://doi.org/10.3390/app14156840