Article

Investigation of the Effect of Relative Density on the Dynamic Modulus and Damping Ratio for Coarse Grained Soil

by
Ziying Huang
1,
Sen Cai
2,3,4,
Rongfen Hu
2,3,4,
Jianfeng Wang
2,3,4,
Mingjie Jiang
2,3,4,* and
Jian Gong
2,3,4
1
Faculty of Architecture, Civil and Transportation Engineering, Beijing University of Technology, Beijing 100124, China
2
College of Civil Engineering and Architecture, Guangxi University, Nanning 530004, China
3
Key Laboratory of Disaster Prevention and Structural Safety of Ministry of Education, Guangxi University, Nanning 530004, China
4
d. Key Laboratory of Disaster Prevention and Mitigation and Engineering Safety of Guangxi, Guangxi University, Nanning 530004, China
*
Author to whom correspondence should be addressed.
Appl. Sci. 2024, 14(15), 6847; https://doi.org/10.3390/app14156847 (registering DOI)
Submission received: 18 June 2024 / Revised: 21 July 2024 / Accepted: 24 July 2024 / Published: 5 August 2024

Abstract

:
As the critical dynamic parameters for soil, an extensive examination of the dynamic elastic modulus Ed and damping ratio λ in coarse-grained soil is of significant theoretical and practical importance. Currently, there is a scarcity of experimental equipment and methods for measuring the dynamic elastic modulus and damping ratio of coarse-grained soils. Moreover, studies examining the influence of relative density on these parameters in coarse-grained soils are largely absent. To investigate the behavior of the dynamic elastic modulus and damping ratio in coarse-grained soil under varying relative densities, a number of dynamic triaxial tests were conducted on a specific coarse-grained soil using the DYNTTS type dynamic triaxial test apparatus. The findings reveal that, under various gradations, the Ed of coarse-grained soils exhibits a decreasing trend with increasing dynamic strain, a trend that intensifies with higher relative densities. Additionally, as relative density increases, the degradation rate of the dynamic shear modulus ratio Gd/Gdmax to dynamic shear strain γd curve escalates. The maximum dynamic shear modulus Gdmax rises with increasing relative density Dr, displaying a linear relationship between Gdmax and Dr. Furthermore, both the increasing rate of λ to γd curve and the maximum damping ratio λmax progressively diminish with the escalation of relative density Dr. Notably, the maximum damping ratio has a power function relationship with the relative density.

1. Introduction

Rockfill dams, a type of embankment dam constructed using rockfill materials, are increasingly preferred in Southwest China due to their strong adaptability to geological environments, the feasibility of using local materials, lower construction costs, and superior seismic performance [1,2]. The complex geological conditions and frequent seismic activities in this region make seismic performance a critical factor for the safety of these dams. A failure in seismic resistance could lead to catastrophic societal consequences. Thus, optimizing the seismic design of rockfill dams and enhancing their seismic performance are of paramount importance. In this context, the dynamic elastic modulus and damping ratio, as key parameters for soil dynamics, are the focal points in this analysis.
Coarse-grained soil, often employed as a filling material in rockfill dam projects, is chosen for its excellent engineering characteristics like high permeability, strength, and minimal compression deformation. Accurately determining its dynamic elastic modulus and damping ratio is crucial for the seismic design of rockfill dams. Consequently, in-depth research into these parameters holds significant theoretical and engineering value [3].
There has been substantial research by international scholars on the dynamic elastic modulus, the dynamic shear modulus, and damping ratio of coarse-grained soils. Studies from Sawangsuriya [4], Kokusho [5], Saxena [6], Li Yangbo [7], and others have indicated that the dynamic elastic modulus and damping ratio all trend to increase when pressure and frequency increase. The maximum dynamic elastic modulus of coarse-grained soil was empirically formulated by Wang [8], considering the confining pressure and frequency, based on extensive data from large-scale dynamic triaxial tests. Fang [9] conducted tests on limestone aggregate using a static and dynamic simple shear testing device, developing an estimation formula for the maximum dynamic shear modulus that considers the effects of confining pressure, consolidation ratio, gradation, and porosity characteristics. Du [10] investigated the influence of factors like the consolidation ratio on the dynamic modulus and damping ratio of materials used in dam construction, including dam shell, heart wall, and dam foundation fault materials, through dynamic triaxial tests. Research by Matsui [11] and Yasuhara [12], and subsequent work by Zhou [13], indicated that higher confining pressure and vibration frequencies increase soil stiffness and stabilize soil dynamics, leading to the development of a dynamic strain backbone curve model that considers vibration cycles and confining pressure.
Overall, the investigations into the dynamic modulus and damping ratio of coarse-grained soil have primarily focused on factors like confining pressure, consolidation ratio, vibration, and porosity characteristics. However, studies specifically addressing the impact of relative density on these parameters in coarse-grained soil are less frequent. Limited research, such as that by Fu [14] and Wang [15], has provided only qualitative insights, leaving the quantitative relationship between relative density and the dynamic modulus and damping ratio of coarse-grained soil largely unexplored. This gap highlights the current inadequacy in understanding the influence of relative density on these parameters, emphasizing the need for more quantitative research. Zhu [16,17] underscored the significance of relative density as a mechanical parameter reflecting the physical state of soil, heavily influencing the mechanical characteristics of coarse-grained soil. Therefore, quantitative experimental research into how relative density affects the dynamic modulus and damping ratio of coarse-grained soil is imperative.
Therefore, this study utilizes a GDS large-scale dynamic-static triaxial apparatus for dynamic triaxial testing on compacted samples of a specific coarse-grained soil. Leveraging the results from these tests, this research quantitatively examines the impact of relative density on the dynamic modulus and damping ratio of coarse-grained soil. Additionally, it formulates a computational model that precisely elucidates the correlation between the maximum dynamic shear modulus, the maximum damping ratio, and relative density, thereby contributing to an enhanced comprehension of the seismic behavior exhibited by rockfill dams.

2. Testing Apparatus and Program

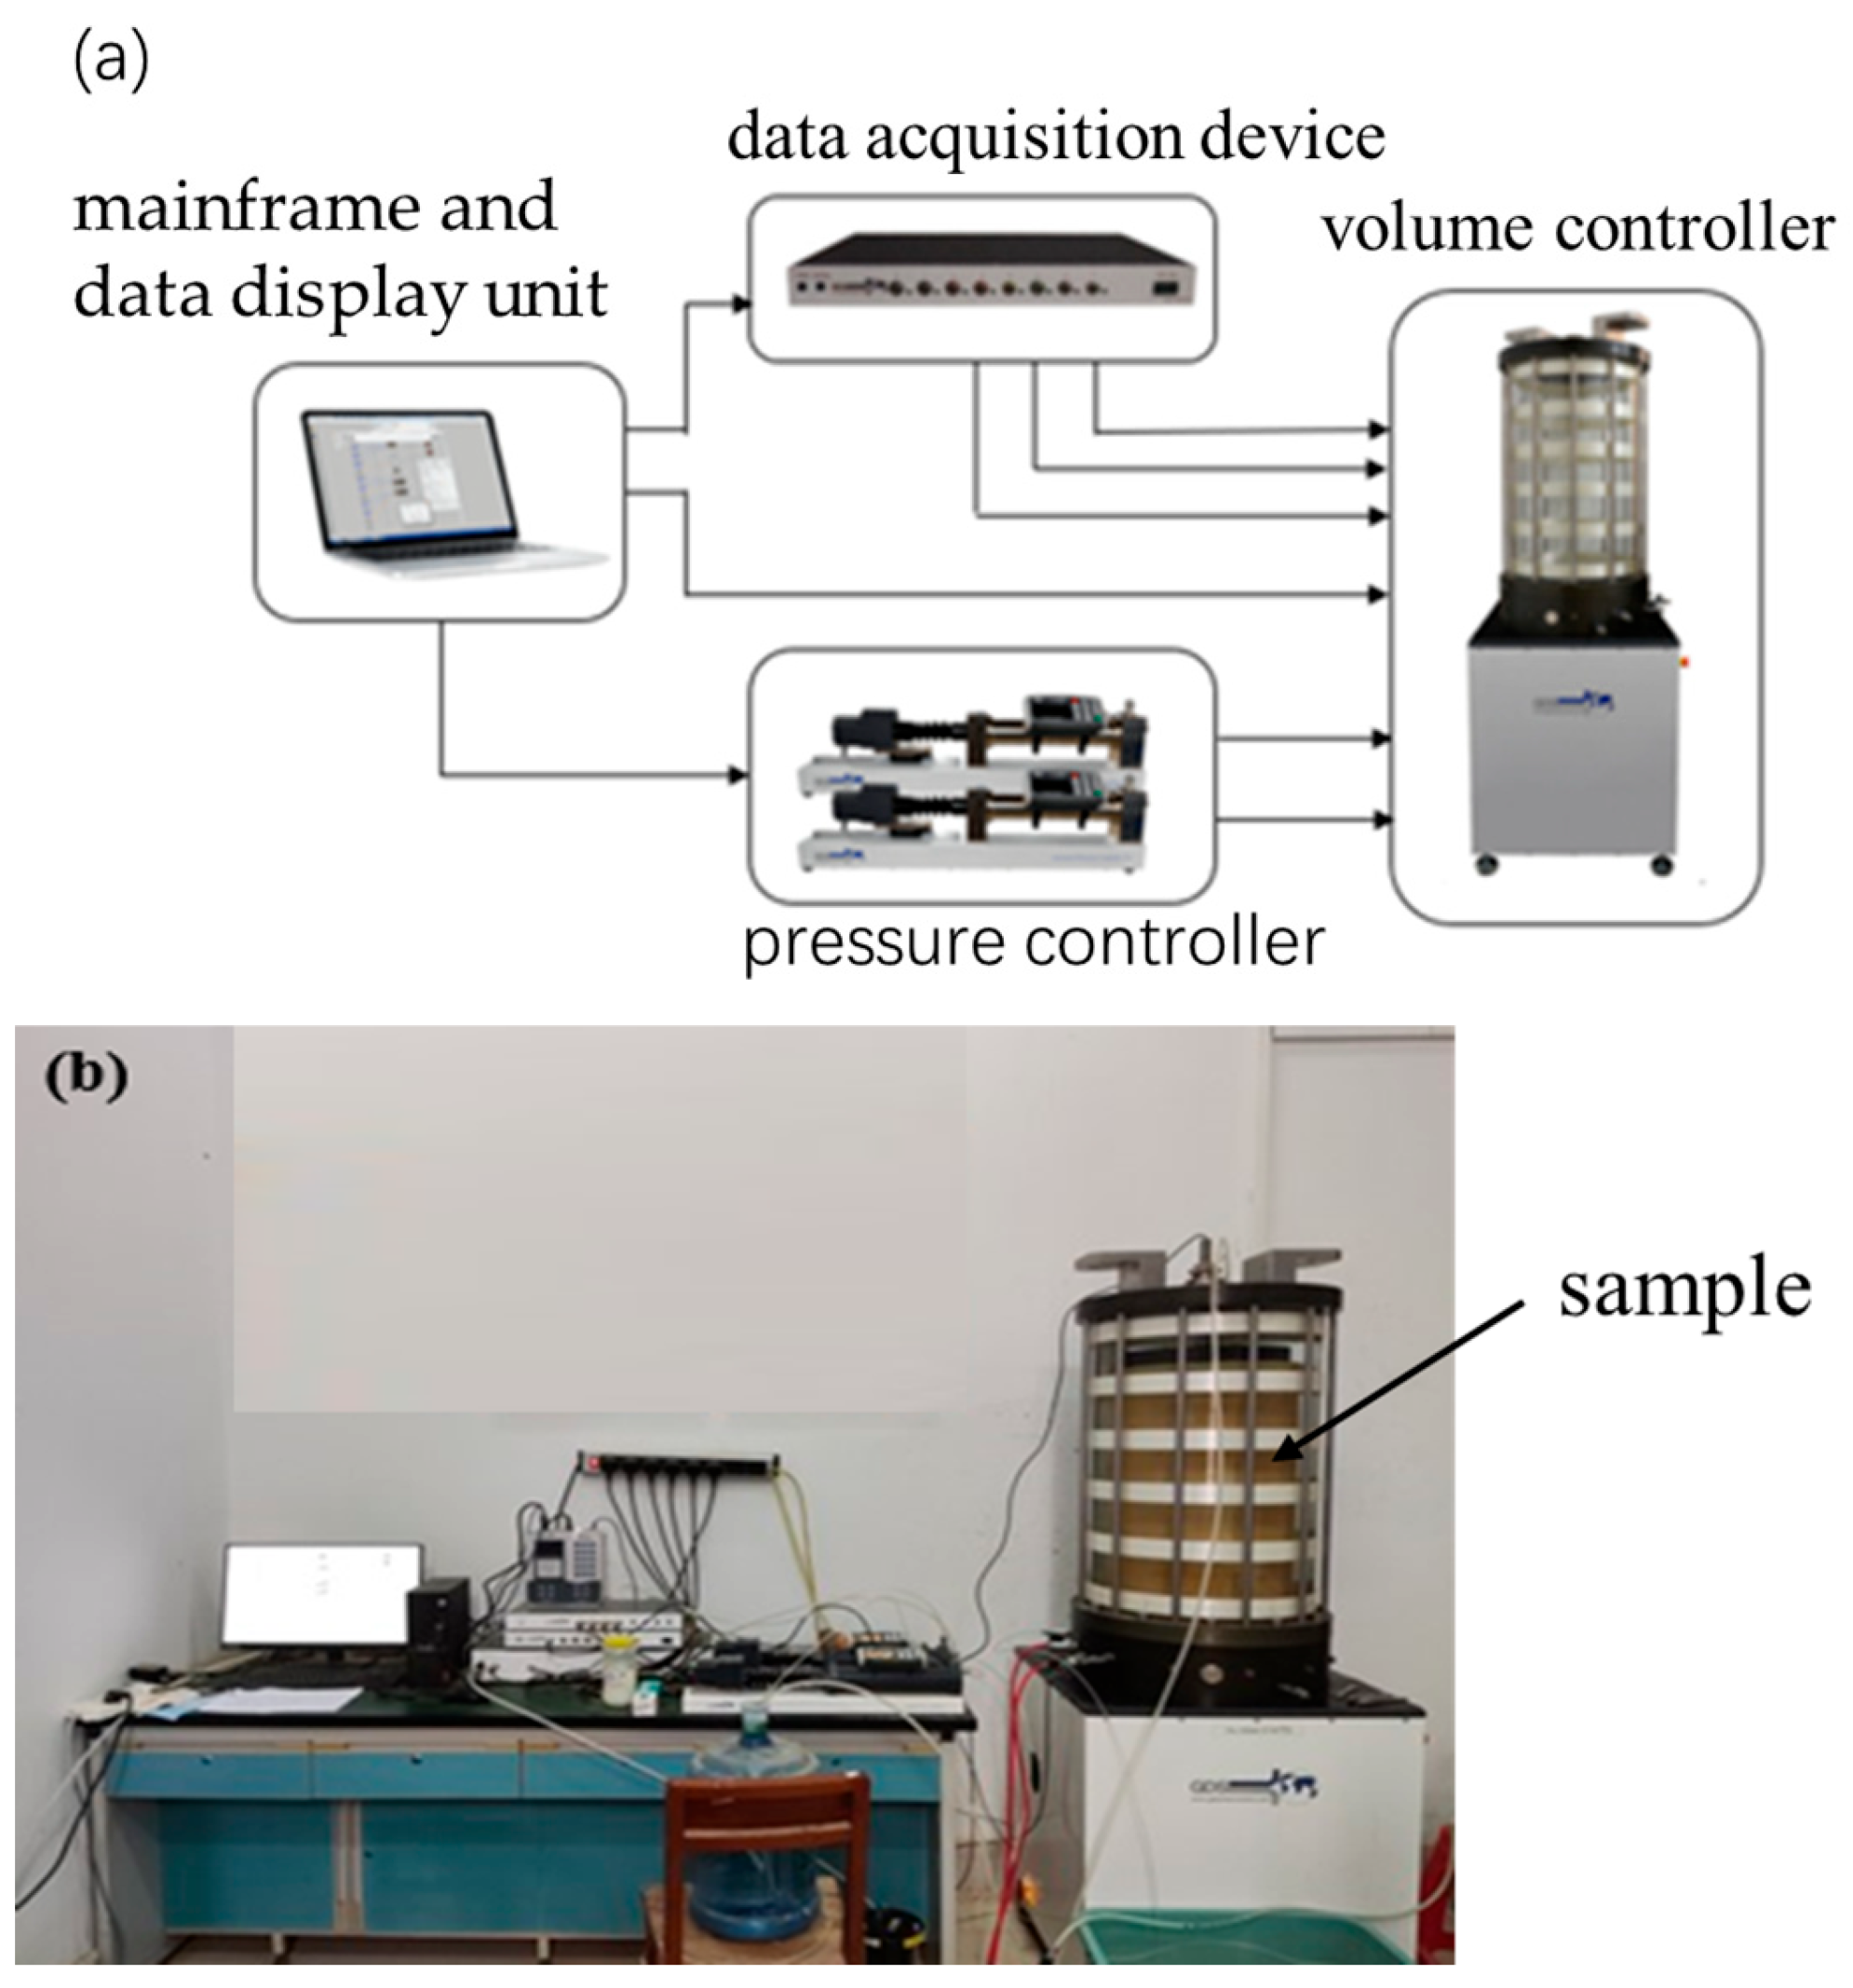
2.1. Instruments and Equipment

In this study, the DYNTTS type coarse-grained soil dynamic triaxial testing system was employed. This system comprises a data acquisition device, a volume controller, a back pressure, a confining pressure controller, a mainframe that governs axial stress and displacement, and a data display unit, as depicted in Figure 1. The instrument’s principal specifications include a maximum confining pressure of 1 MPa, an axial load capacity of 60 kN, a load vibration frequency ranging from 0 to 2 Hz, an axial displacement scope of 0 to 88 mm, and an axial force measurement precision of 0.0001 kN. This system is capable of conducting dynamic performance evaluations on samples measuring 300 mm in diameter and 600 mm in height. The experimental procedure encompasses five phases: sample preparation, saturation, consolidation, loading, and unloading, with further details provided in reference [18].

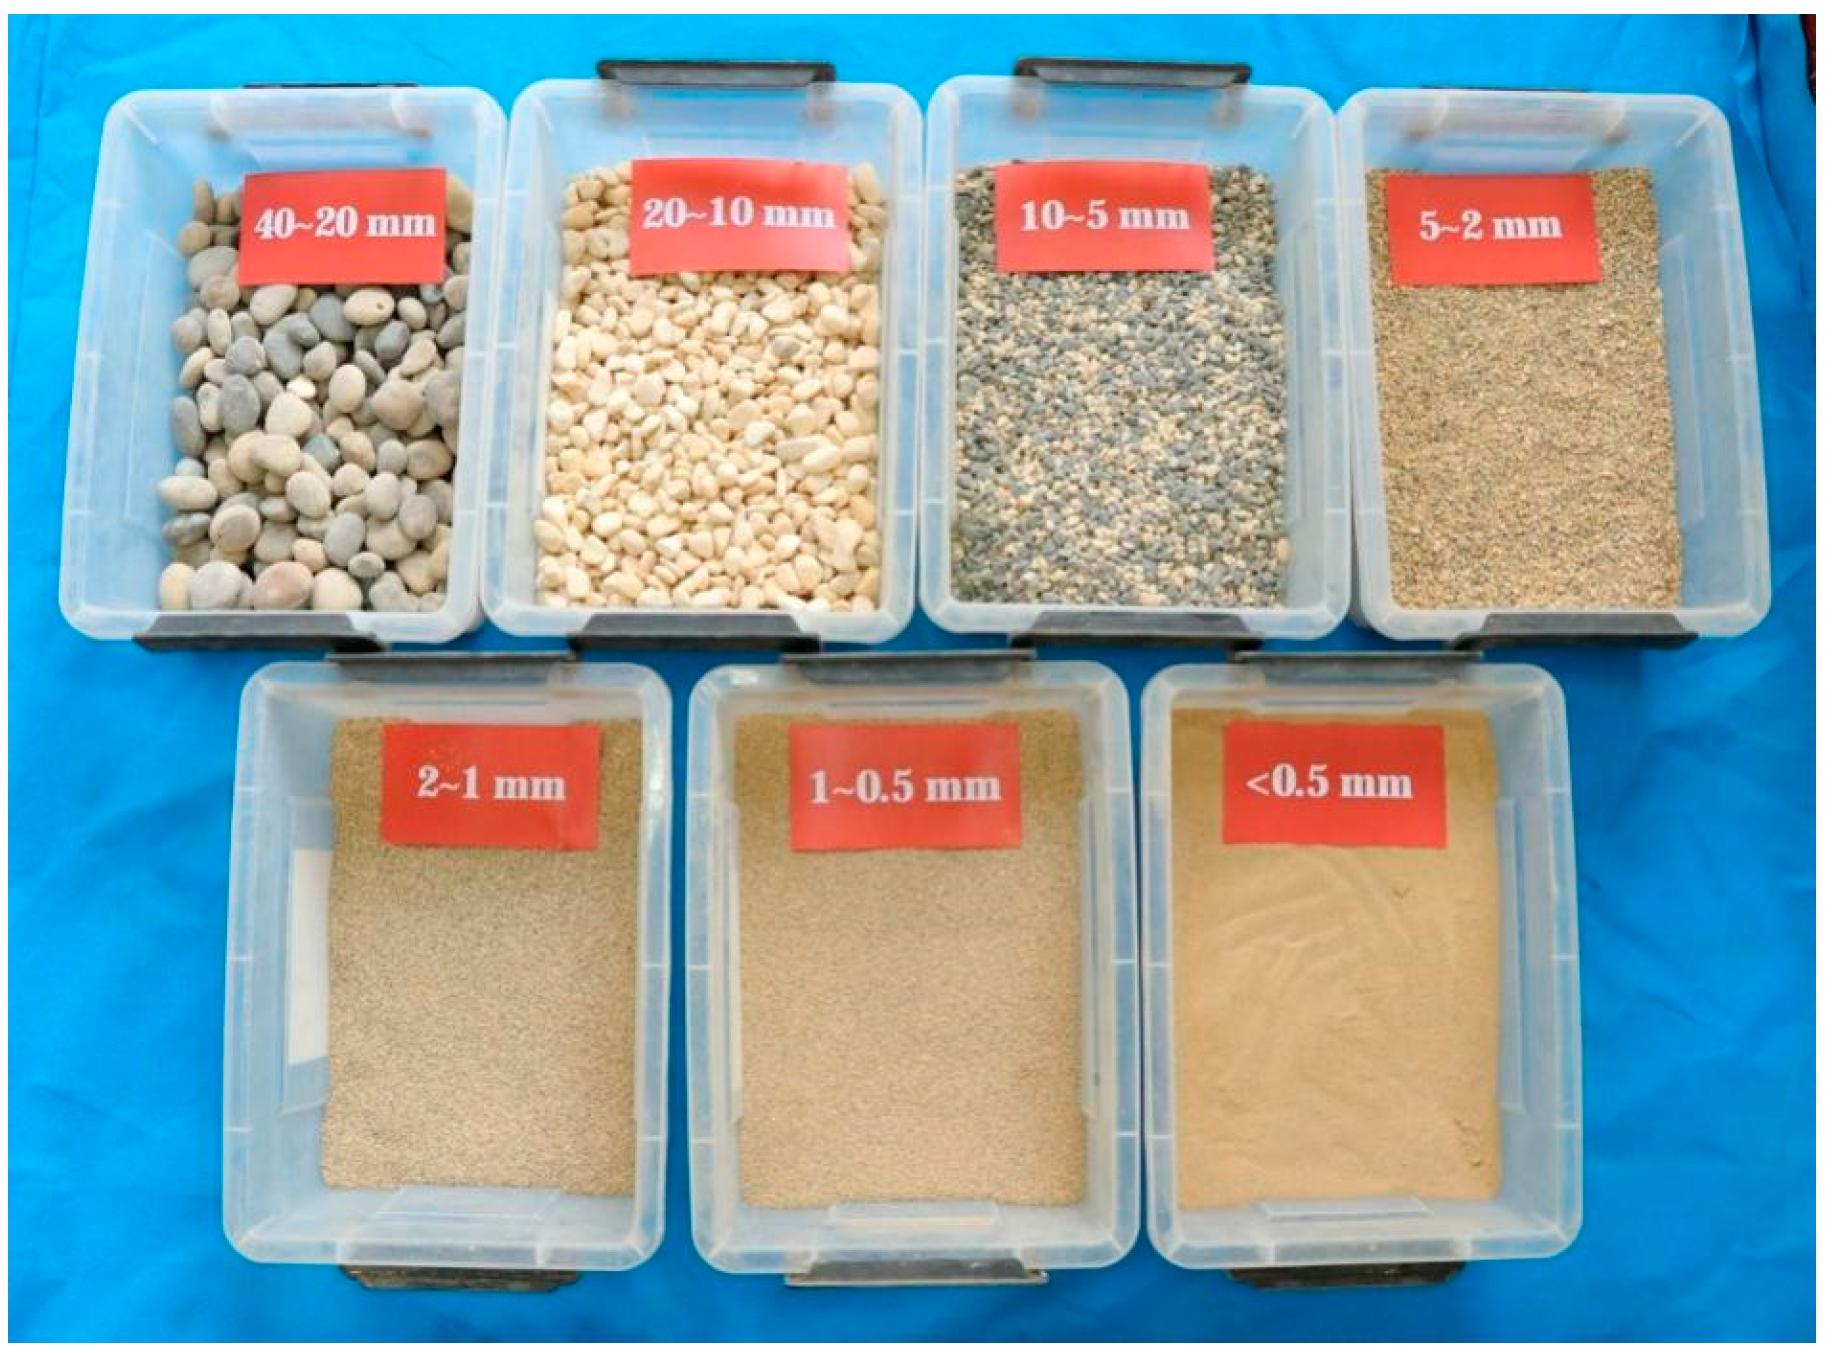
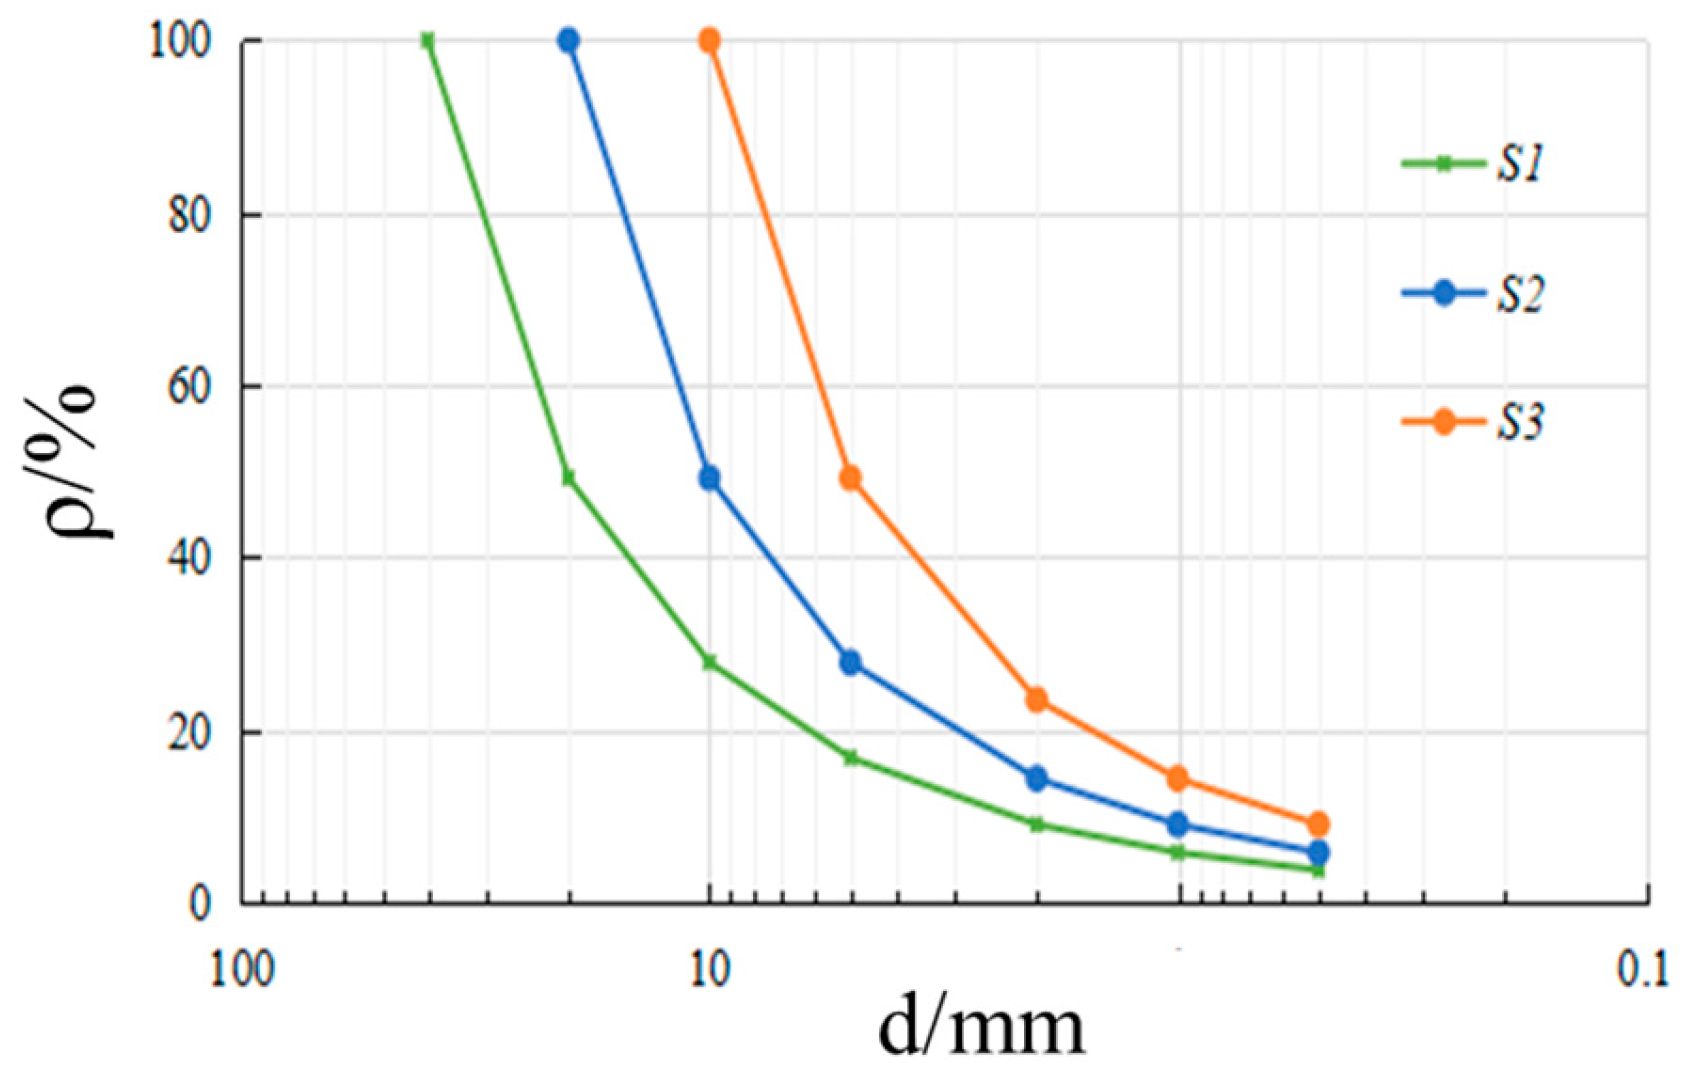
2.2. Specimen Preparation Standard

The soil material utilized by the experiments was sourced from the Pingnan Sanqiao construction site, consisting of sand, pebbles, and gravel. These particles are predominantly rounded and exhibit a grayish-white hue. Figure 2 displays the appearance of the various particle sizes in this material. Samples, labeled S1 to S3, were characterized by gradations, as depicted in Figure 3.
The sample preparation was based on the relative density standard, with the relative densities of each group of samples set at 0.9, 0.7, 0.5, and 0.3, respectively. To ensure the required density for each group during sample preparation, relative density tests were conducted according to the experimental gradation. The relative density tests were carried out using a surface vibratory compactor for coarse-grained soils, as shown in Figure 4. The relevant test parameters for this device are as follows: the inner diameter of the sample cylinder is 28 cm, the volume is 14,200 cm3, the vibration frequency is 47.5 Hz, the excitation force ranges from 10 to 80 kN, and the static pressure exerted by the tamper plate is above 18 kPa.
By controlling the mass of the soil sample, the desired density for each group of samples can be achieved. The maximum dry density (ρmax) of each experimental gradation was determined using the surface vibratory compaction method, and the minimum dry density (ρmin) was determined using the loose filling method. The measured ρmax and ρmin for each gradation were then substituted into the relative density formula to calculate the dry density required to achieve the corresponding relative density, and, subsequently, the required mass of soil for each group of samples was derived.
The corresponding dry density values for these relative densities are detailed in Table 1.

2.3. Test Method

The corresponding dry density values for these relative densities are detailed in Table 1. The experiment was conducted based on the “Standard for Soil Test Method” (GB/T50123-2019) [18], using sample sizes of diameter 300 mm and height 600 mm. The process was divided into five steps: sample preparation, saturation, consolidation, loading, and sample removal. The specific details are as follows:
  • Sample Preparation:
The sample was directly placed on the instrument base. A layer of petroleum jelly was applied around the instrument base and the inside of the membrane holder to prevent water and air leakage during the experiment. After fixing the rubber membrane to the base and installing the membrane holder, a vacuum pump was used to draw air out, causing the rubber membrane to adhere to the holder. The test used air-dried material, forming the sample by controlling the compaction. The weighed test material was evenly divided into six portions, each portion was placed into the membrane holder in four layers, compacted, and roughened to achieve the predetermined dry density. After filling the sample, a vacuum was applied to maintain a negative pressure of 20 kPa, and then the membrane holder was removed.
2.
Saturation:
After sample preparation, to ensure the sealed state during the experiment, the rubber ring around the instrument base was cleaned. After cleaning, the pressure chamber was installed and filled with water. Maintain a constant water temperature to control the environmental temperature during the testing process. The sample was saturated using the water head saturation method: after the pressure chamber was filled with water, water injection was stopped, and CO2 was introduced from the bottom of the sample to replace the air in the pores. Then, air-free water was injected from the bottom, and once water emerged from the top, the water head saturation method was used to gradually saturate the sample from bottom to top. The saturation was considered complete when the pore pressure coefficient B value reached above 0.95.
3.
Consolidation:
The sample was consolidated by controlling the stress. While maintaining constant confining pressure, the sample was subjected to drained consolidation with a consolidation ratio Kc of 2.0. Initially, isotropic consolidation was performed, and once the sample stabilized, the axial pressure was gradually increased to avoid severe deformation due to the sudden application of excessive axial pressure. Throughout the consolidation process, the sample’s drainage was continuously monitored, and consolidation was considered complete when the drainage volume did not exceed 15 mL within 30 min.
4.
Loading:
Stress-controlled loading was used in the experiment. A confining pressure of 200 kPa was selected. After consolidation, while maintaining the confining pressure constant, axial dynamic stress was applied in stages from small to large. Each level of dynamic stress was σd = ± 0.3σ3, 0.4σ3, 0.5σ3, …, and the next level of loading could only proceed after completing the previous level. Each level of dynamic stress was cycled for six cycles, and the data from the third cycle was selected for analysis. Additionally, the vibration waveform used in the experiment was a sine wave with a vibration frequency of 0.33 Hz.
5.
Sample Removal:
After completing all loading tasks, the confining pressure and axial pressure were gradually unloaded, data acquisition and control programs were turned off, the drainage valve was opened to empty the pressure chamber, and the pressure chamber was removed. Finally, the sample was dismantled and the site was cleaned.

3. Interpretation of Experimental Results

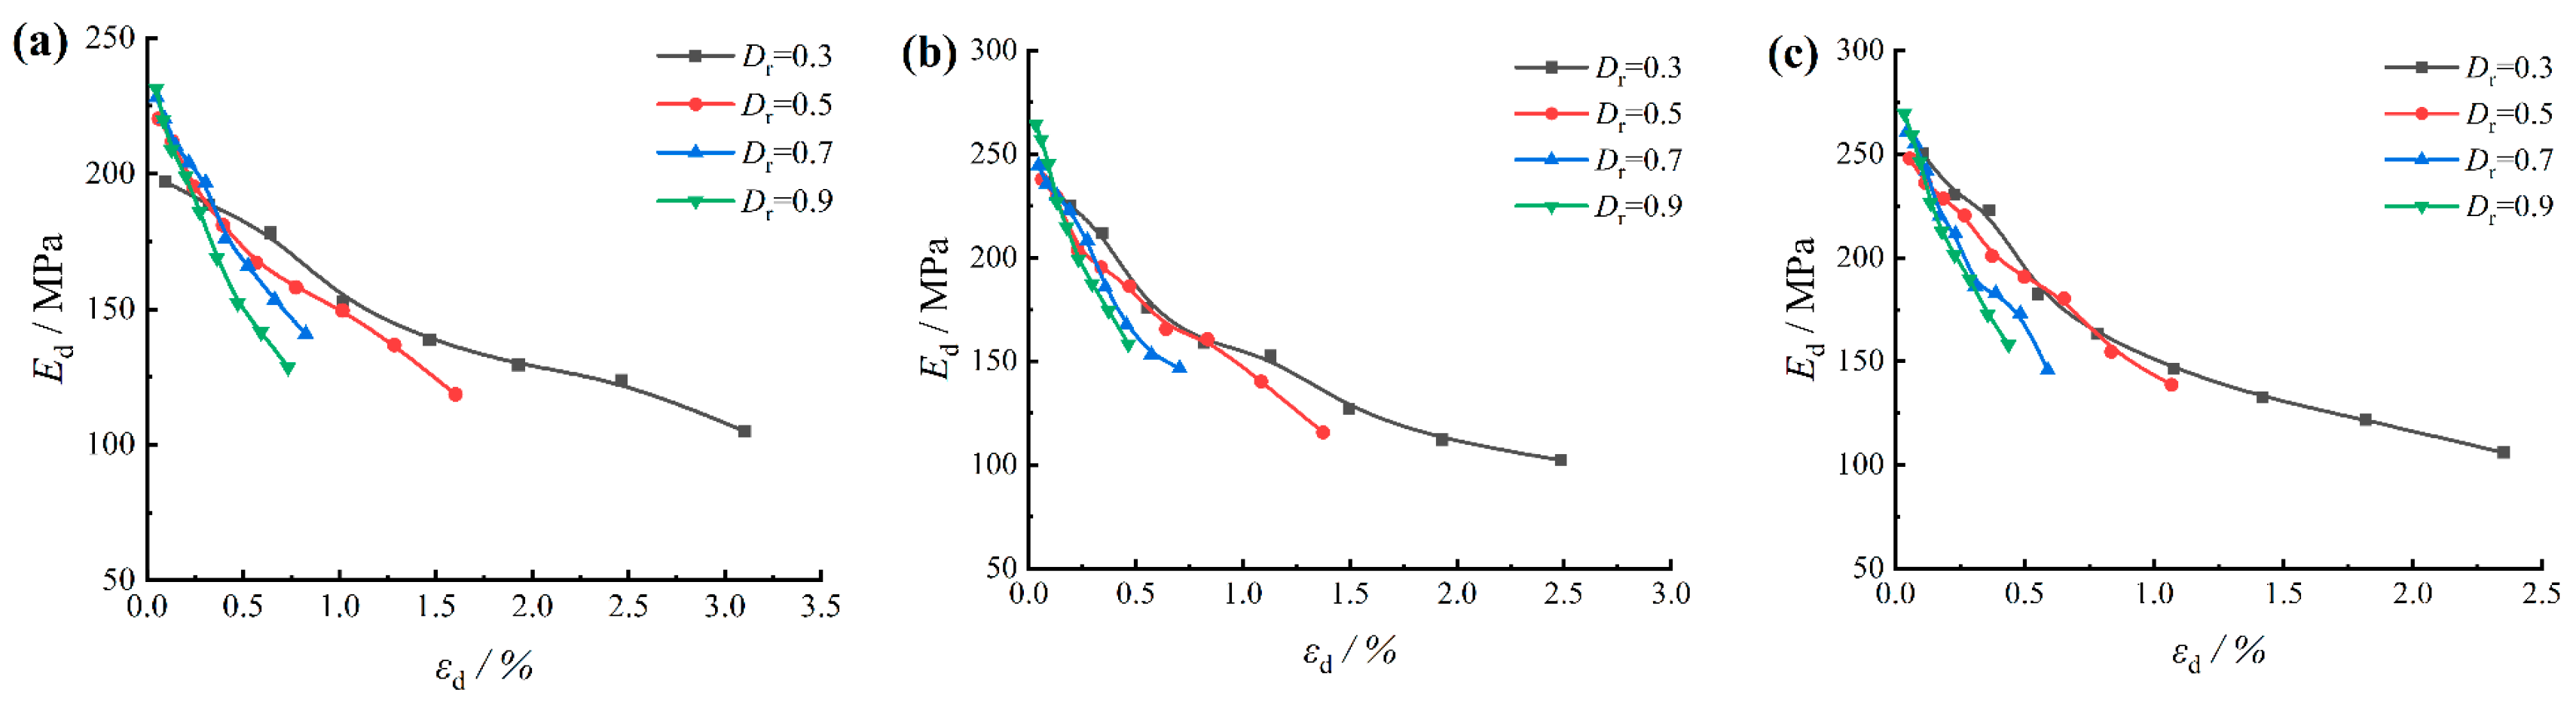
3.1. Relation of Dynamic Elastic Modulus and Dynamic Strain

For this analysis, data from average value to three cycles of each dynamic loading level were employed. The relationship curves depicting the dynamic strain (εd) against dynamic elastic modulus (Ed) for samples S1 to S3 are illustrated in Figure 5. The graph indicates that under a constant dynamic load, the decrease in relative density results in an increase in the dynamic strain experienced by specimens and a reduction in the rate at which the dynamic elastic modulus decreases. Specifically, it can be seen that εd of the sample with the same relative density (Dr) of 0.3 is larger. Under the same dynamic strain conditions, the sample with Dr = 0.9 showed the most significant decrease in the dynamic modulus. This variation is attributed to the transition from tight to loose contact among coarse- and fine-grained particles as Dr decreases, thereby diminishing the structural capacity to resist deformation. Consequently, under identical dynamic loads, a higher dynamic strain is observed. While the contact remains relatively firm at Dr = 0.7, resulting in a minor deviation from the curve with Dr = 0.9, the contact becomes considerably looser at Dr = 0.5 and 0.3, significantly reducing structural resistance, hence the notable disparity from the curve with Dr = 0.9.
A further comparative analysis of Figure 5a–c indicates, under identical density conditions, an increase in maximum particle size correlates with increasing dynamic elastic modulus and decreasing dynamic strain. This trend can be attributed to the denser packing of coarse- and fine-grained particles and enhanced inter-particle contact in samples with larger maximum particle sizes, leading to increased resistance to deformation.

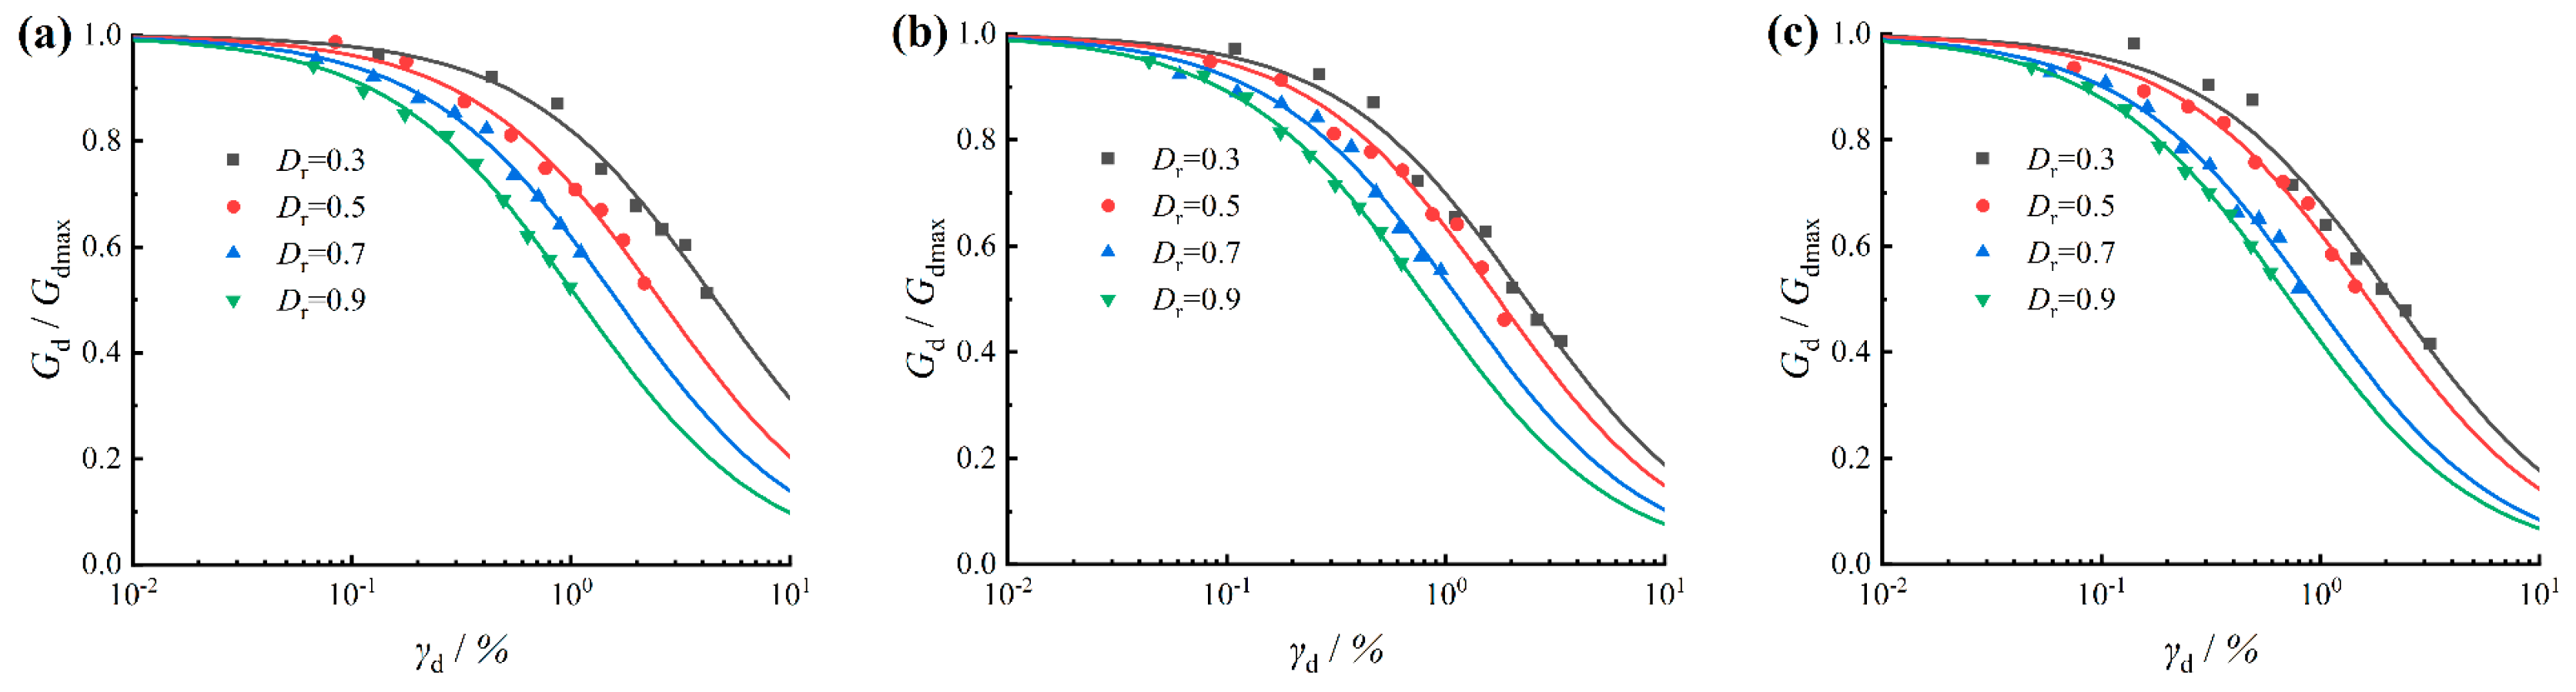
3.2. Relation of the Dynamic Shear Modulus Ratio and Dynamic Shear Strain

Contemporary research on dynamic properties for coarse-grained soils predominantly employs the Hardin-Drnevich model [18]. This model describes the correlation between the dynamic shear strain (γd) and the dynamic shear modulus ratio (Gd/Gdmax) in coarse-grained soils, as per the following relationship:
G d G d max = 1 1 + γ d / γ r
where γr represents the reference shear strain.
Figure 6a–c depict the results of Gd/Gdmax and γd tests for samples S1 to S3 under varying relative densities, alongside their fitting curves based on Equation (1). These Figures demonstrate a strong correlation and a satisfactory fit between the experimental data and the fitting curves. Upon analyzing Figure 6, it is noted that the attenuation rate of Gd/Gdmax varies with different relative densities (Dr). In general, the higher the relative density Dr, the greater the rate of decay of Gd/Gdmax with increasing dynamic shear strain (γd), and the more pronounced the overall decay trend.

3.3. Relation of Dynamic Shear Strain and the Damping Ratio

Based on the existing studies on rockfill materials [19], the relationship of λ of soil and γd can be described as follows:
λ = γ d / c + d γ d
1 / λ = c / γ d + d
where c and d represent experimental parameters, with the inverse of the linear intercept d defining the maximum damping ratio λmax.
Figure 7a–c delineate the relationship of λ of soil and γd samples S1 to S3 under varying relative densities. The curves reveal considerable disparities in the λ-γd relationships across different relative densities. For shear strains below 10−2, λ progressively increases with rising γd. The rate of increase is more pronounced in samples exhibiting lower relative densities. Notably, the sample with a relative density (Dr) of 0.3 exhibits the most rapid augmentation in damping ratio, significantly outpacing those with Dr = 0.5, 0.7, and 0.9. These observations underscore the profound impact of compaction on the soil’s energy dissipation capacity. Looser soils demonstrate easier energy dissipation, leading to higher damping ratios.

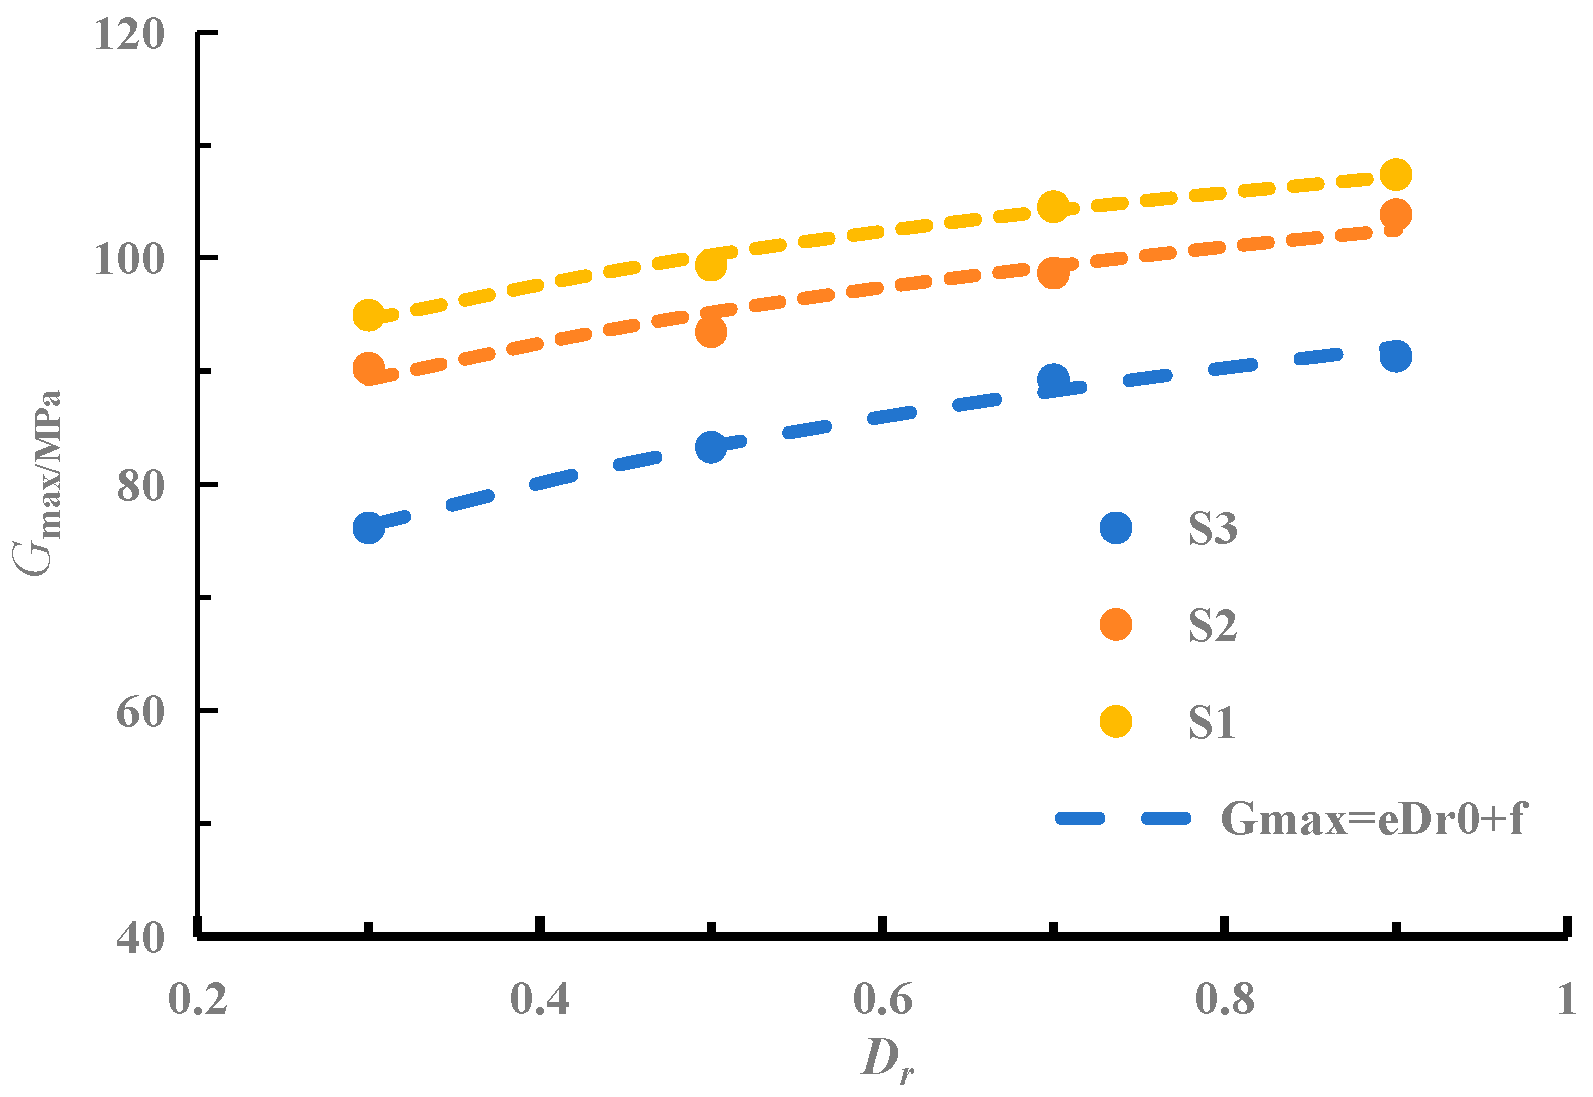
4. Influence of Relative Density on the Maximum Dynamic Shear Modulus

By arranging 12 sets of dynamic triaxial test results of graded samples S1–S3 under different relative compactness Dr of 0.3, 0.5, 0.7, and 0.9, the relationship between the relative compactness Dr and the maximum dynamic shear modulus Gdmax was obtained, as depicted in Figure 8. Figure 8 illustrates that, for a constant maximum particle size, Gdmax incrementally increases with an increase in Dr. Further analysis and fitting of these 12 datasets using fitting software (origin) revealed a linear relationship between Dr and Gdmax, represented by this Equation:
G d max = e D r + f
where e and f are parameters, with e being the slope and f representing the maximum dynamic shear modulus at Dr = 0.
Fitting these 12 datasets with Equation (4) and summarizing the results in Table 2 shows a high congruence between the fitted curves and experimental points, with coefficients of determination exceeding 0.96. The maximum discrepancy between the fitted and experimental values of Gdmax was less than 2%. Consequently, this study posits that the relationship between Dr and Gdmax can be effectively described by Equation (4). Consistent with these findings, Yang [20] reported, in his research using a resonant column apparatus on sand, that the relative density of sand has a linear positive correlation with its maximum dynamic shear modulus.

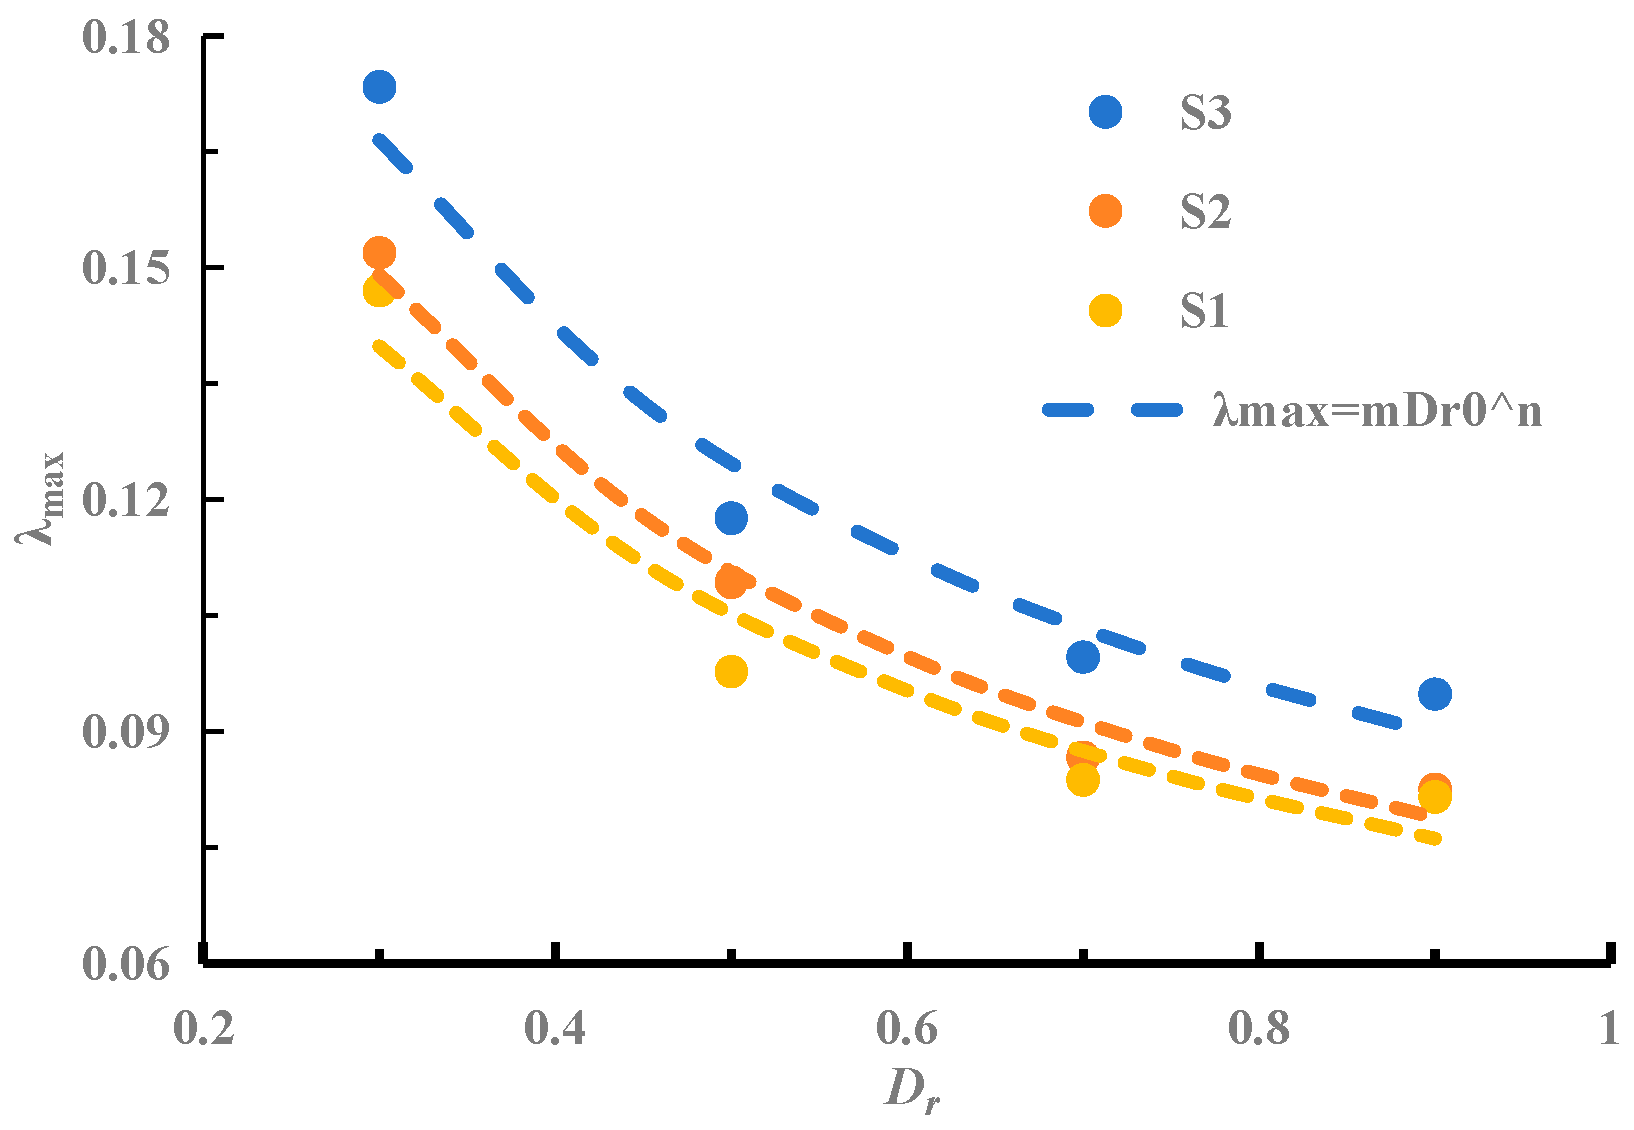
5. Influence of Relative Density on the Maximum Damping Ratio

The maximum damping ratio (λmax) of granular materials at various relative densities (Dr) is presented in Figure 9. Figure 9 shows that λmax inversely correlates with Dr, decreasing as Dr increases, a trend that is opposite to that observed for the maximum dynamic shear modulus.
Figure 9 also reveals that the attenuation rate of λmax progressively diminishes with increasing Dr. This is likely due to tighter particle contacts at higher Dr, resulting in smaller relative displacements under external forces, thereby leading to a reduced damping ratio.
Analysis and fitting of these 12 datasets using fitting software suggest that Dr and λmax exhibit a power law relationship, expressed by this Equation:
λ max = m D r n
where m and n are parameters.
Fitting these 12 datasets with Equation (5) and summarizing the results in Table 3, Table 3 demonstrates a high congruence between the fitting curves and the experimental data, with coefficients of determination exceeding 0.93. The maximum discrepancy between the fitted and experimental values of λmax was under 5%. Hence, this study posits that the relationship between relative density Dr and λmax can be effectively described by Equation (5).

6. Conclusions

This paper, through dynamic triaxial testing of 12 groups of coarse-grained soil samples at varying relative densities, investigates the impact of relative density on the dynamic elastic modulus and the damping ratio (λ) of coarse-grained soils. The conclusions are as follows:
  • The dynamic elastic modulus of coarse-grained soil progressively diminishes with increasing dynamic strain. The attenuation rate of dynamic elastic modulus escalates with increasing relative density; the rate of decay of the coarse-grained soil’s normalized dynamic shear modulus with increasing dynamic shear strain also rises with an increase in relative density, with the attenuation trend becoming more distinct at higher relative density values. Additionally, the rate of increase in the damping ratio–dynamic shear strain relationship curve gradually decreases as relative density increases.
  • The maximum dynamic shear modulus of coarse-grained soil increases with an increase in relative density. An empirical formula has been established to describe the relationship between the maximum dynamic shear modulus and relative density of coarse-grained soil.
  • The maximum damping ratio of coarse-grained soil decreases progressively with increasing relative density. An empirical formula has been developed to delineate the relationship between the maximum damping ratio and relative density of coarse-grained soil.
The conclusions drawn in this article are helpful for the construction of coarse-grained soil engineering such as dams and retaining walls, and the formulas obtained can provide reference for further research on the dynamic performance of coarse-grained soil.

Author Contributions

Conceptualization, Z.H. and M.J.; methodology, R.H.; software, S.C.; formal analysis, J.W. and J.G.; resources, M.J.; data curation, Z.H.; writing—original draft preparation, M.J.; writing—review and editing, M.J.; project administration, M.J. and J.G.; funding acquisition, M.J. and J.G. All authors have read and agreed to the published version of the manuscript.

Funding

The authors gratefully acknowledge the financial support from a project from Guangxi Natural Science Foundation (No. 2021GXNSFBA196091), a project from Guangxi Science and Technology (No. AA23023016), a project from Inner Mongolia Transportation Department Construction Technology (No. NJ-2021-10).

Data Availability Statement

The data presented in this study are available on request from the corresponding author. The data are not publicly available due to privacy restrictions.

Conflicts of Interest

The authors declare no conflicts of interest.

References

  1. Guo, Q. Engineering Properties and Application of Coarse-Grained Soil; Yellow River Conservancy Press: Zhengzhou, China, 1998. [Google Scholar]
  2. Xu, Z. Key Technologies and Geotechnical Problems in Contemporary High Rockfill Dam Construction. J. Geotech. Eng. 2011, 33, 34–40. [Google Scholar]
  3. Menq, F.Y.; Stokoe, K. Linear Dynamic Properties of Sandy and Gravelly Soils from Large-Scale Resonant Tests; A. A. Balkema: Lisse, The Netherlands, 2003. [Google Scholar]
  4. Sawangsuriya, A.; Bosscher, P.J.; Edil, T.B. Alternative Testing Techniques for Modulus of Pavement Bases and Subgrades. In Proceedings of the Great Lakes Geotechnical & Geoenvironmental Conference, Milwaukee, WI, USA, 13 May 2005. [Google Scholar]
  5. Kokusho, T. Cyclic Triaxial Test of Dynamic Soil Properties for Wide Strain Range. Soils Found. 1980, 20, 45–60. [Google Scholar] [CrossRef] [PubMed]
  6. Saxena, S.K.; Reddy, K.R. Dynamic Moduli and Damping Ratios for Monterey No. 0 Sand by Resonant Column Tests. Soils Found. 1989, 29, 37–51. [Google Scholar]
  7. Li, Y.; Zhang, J.; Zhu, Z.; Wang, X.; Shi, X. Research on Dynamic Characteristics of Coarse-Grained Soil for Railway Subgrade under Graded Loading. J. Railw. Sci. Eng. 2019, 16, 620–628. [Google Scholar]
  8. Wang, J. Experimental Study on Dynamic Elastic Modulus and Damping Ratio of Coarse-Grained Soil. Master’s Thesis, Central South University, Changsha, China, 2013. [Google Scholar]
  9. Fang, E. Research on Dynamic Properties of Dam Building Materials. Thesis, Dalian University of Technology, Dalian, China, 2015. [Google Scholar]
  10. Du, C.; Xie, H.; Xiao, M.; He, C.R.; He, J.D. Experimental Study on Dynamic Properties of Dam Building Materials in Seismic Areas. J. Sichuan Univ. Eng. Sci. Ed. 2016, 48, 39–44. [Google Scholar]
  11. Matsui, T.; Bahr, M.A.; Abe, N. Estimation of Shear Characteristics Degradation and Stress-Strain Relationship of Saturated Clays after Cyclic Loading. Soils Found. 1992, 32, 161–172. [Google Scholar] [CrossRef]
  12. Yasuhara, K. Post-cyclic Degradation of Saturated Plasticity Silts. Cycl. Behav. Soils Liq. Phenom. 2004, 275–286. [Google Scholar]
  13. Zhou, W.; Leng, W.; Liu, W.; Nie, R.S.; Yang, Q.; Zhao, C.Y. Study on Dynamic Characteristics and Backbone Curve Model of Saturated Coarse-Grained Soil under Low Confining Pressure Cyclic Loading. Rock Soil Mech. 2016, 37, 415–423. [Google Scholar]
  14. Fu, H.; Han, H.; Ling, H. Experimental Study on the Influence of Density on Dynamic Properties of Coarse Particulate Materials. J. China Inst. Water Resour. Hydropower Res. 2014, 12, 437–441. [Google Scholar]
  15. Wang, B. Study on Static and Dynamic Properties of Saturated Round Gravel Soil in Nanning Metro Area. Ph.D. Thesis, Guangxi University, Nanning, China, 2018. [Google Scholar]
  16. Zhu, J.; Shi, J.; Luo, X.; Xu, J. Experimental Study on Stress-Strain-Strength Behavior of Sand with Different Densities. Chin. J. Geotech. Eng. 2016, 38, 336–341. [Google Scholar]
  17. Zhu, J.; Guo, W.L.; Xu, J.C.; Chu, F.Y. DEM Analysis on Impact of Gradation and Compactness on Coarse-Grained Soil in Tri-Axial Test. J. Chongqing Jiaotong Univ. 2017, 36, 70–74. [Google Scholar]
  18. Liu, X.; Zhang, J.; Liu, M. Exploration of Test Methods in GB/T 50123—2019 “Standards for Soil Test Methods”. Tianjin Constr. Sci. Technol. 2020, 30, 1–4. [Google Scholar]
  19. Hardin, B.O.; Drnevich, V.P. Shear Modulus and Damping in Soils: Design Equations and Curves. Geotech. Spec. Publ. 1972, 98, 667–692. [Google Scholar] [CrossRef]
  20. Yang, P. Study on the Effect of Particle Grading and Compaction on the Dynamic Deformation Characteristics of Sand. Master’s Thesis, Jiangsu University, Zhenjiang, China, 2021. [Google Scholar]
Figure 1. DYNTTS coarse-grained soil dynamic triaxial test system (a,b).
Applsci 14 06847 g001
Figure 2. Sieved soil material for each grain group.
Applsci 14 06847 g002
Figure 3. Gradation curves of experimental coarse-grained soils.
Applsci 14 06847 g003
Figure 4. Surface vibratory compactor for coarse-grained soils.
Applsci 14 06847 g004
Figure 5. Ed-εd relationship curves: (a) D2-1, (b) D2-2, (c) D2-4.
Applsci 14 06847 g005
Figure 6. Gd/Gdmax-γd fitted relationship curves: (a) S1, (b) S2, (c) S3.
Applsci 14 06847 g006
Figure 7. λ-γd fitted relationship curves: (a) S1, (b) S2, (c) S3.
Applsci 14 06847 g007
Figure 8. GdmaxDr fitted relationship curves.
Applsci 14 06847 g008
Figure 9. λmax vs. Dr fitted relationship curves.
Applsci 14 06847 g009
Table 1. Dry density physical parameters.
Specimen NumberMaximum Particle
Diameter/mm
Minimum Dry
Density/(g∙cm−3)
Maximum Dry
Density/(g∙cm−3)
Dry Density/(g∙cm−3)
Dr = 0.9Dr = 0.7Dr = 0.5Dr = 0.3
S1401.8842.2442.2022.1222.0481.979
S2201.8442.1742.1362.0631.9951.932
S3101.7982.12.0651.9991.9371.879
Table 2. Fitting results of Equation (4).
Specimen NumberMaximum Dynamic Shear Modulus
efR2
S125.65369.0600.961
S222.07682.7760.986
S321.06688.0610.975
Table 3. Fitting results of Equation (5).
Specimen NumberMaximum Damping Ratio
mnR2
S10.0072−0.5540.9533
S20.074−0.580.978
S30.085−0.5630.957
Disclaimer/Publisher’s Note: The statements, opinions and data contained in all publications are solely those of the individual author(s) and contributor(s) and not of MDPI and/or the editor(s). MDPI and/or the editor(s) disclaim responsibility for any injury to people or property resulting from any ideas, methods, instructions or products referred to in the content.

