Communication

Precision Calibration and Linearity Assessment of Thin Film Force-Sensing Resistors

1
Department of Robotics Engineering, Daegu Catholic University, Gyeongsan-si 38430, Republic of Korea
2
Department of Semiconductor Electronic Engineering, Daegu Catholic University, Gyeongsan-si 38430, Republic of Korea
*
Author to whom correspondence should be addressed.
Appl. Sci. 2024, 14(16), 6859; https://doi.org/10.3390/app14166859
Submission received: 10 July 2024 / Revised: 1 August 2024 / Accepted: 2 August 2024 / Published: 6 August 2024

Abstract

:
In this study, we thoroughly analyzed the linearity and repeatability of force-sensing resistor (FSR) sensors through static load tests to ensure their reliability. The novelty of this research lies in its comprehensive evaluation and direct comparison of two widely used FSR sensors, i.e., Flexiforce A201-1 and Interlink FSR-402, under various loading conditions by employing a robust calibration methodology. This study provides detailed insights into the sensors’ performances, offering practical calibration equations that enhance measurement precision and reliability, which have not been extensively documented in previous studies. Our results demonstrate that the linearity of thin film FSR sensors is highly accurate, closely resembling a straight line. We employed M1 Class weights, applying loads ranging from 20 g to 300 g. The resistance of the FSR sensors, which varies with the applied load, was measured using a voltage divider circuit and an analog-to-digital converter of a microcontroller. MATLAB was used to calculate the average output voltage for each applied load and fixed resistance. Additionally, we examined the relationships among load, FSR sensor resistance, and conductivity. Our research indicates that with precise calibration, thin film FSR sensors can be highly reliable for force measurement applications.

1. Introduction

Force-sensing resistor (FSR) sensors are widely used in various applications because of their ability to measure force, pressure, and touch [1,2,3,4]. They play a critical role in fields such as robotics, medical devices, wearable technology, and Human–Machine Interactions (HMI) [1,2,3,4,5,6,7,8,9,10,11,12,13,14,15,16,17,18,19,20,21]. For instance, in robotics, FSR sensors can be attached to robot fingers or feet to detect the weight of objects or the contact force [5,6,7,8,9,10,11,12]. In medical devices, they can monitor the physiological data of patients and track force changes during rehabilitation training to analyze therapeutic effects or hospitalization periods to prevent pressure sores [8,10,11,13,14,15,16,17]. In wearable technology, FSR sensors are applied to smart shoes or gloves to collect user activity data and provide personalized feedback [18,19]. Additionally, in the HMI field, FSR sensors are used in touchscreens or buttons to detect user input and improve the responsiveness of interfaces [12,14,15,16,20,21]. Research related to FSR sensors primarily focuses on improving sensor performance, developing new applications, and enhancing data processing techniques [21,22,23,24,25].
Thin film FSR sensors consist of two thin films with a pressure-sensitive material sandwiched between them. These sensors measure force based on the principle that the contact area between the films increases when force is applied, leading to a decrease in resistance [1,2,22]. This characteristic endows thin film FSR sensors with several advantages. First, they have a simple structure and are cost-effective to produce. Second, they are extremely thin and flexible, making them easy to attach to various surfaces. Third, they have a fast response time, allowing for real-time force measurement. Fourth, they can be manufactured in various sizes and shapes, enabling custom designs for specific applications.
Despite their advantages, FSR sensors have some drawbacks in terms of linearity, reliability, and accuracy. First, FSR sensors exhibit nonlinear output characteristics, making accurate force measurement challenging. Second, the repeatability and long-term stability of the sensors can be low, leading to inconsistent results under the same conditions during repeated measurements. These drawbacks are significant factors in evaluating and improving the performance of FSR sensors. There have been various attempts to address this problem using different methods [1,2,22]. Hall et al. [23] introduce a technique for conditioning and calibrating force-sensing resistors to ensure repeatable and reliable measurement of compressive force, highlighting its application in ergonomics and rehabilitation. Leonel et al. [24] analyze the creep response and dynamic loading behaviors of conductive polymer composites in FSRs, highlighting their long-term stability and performance under varying forces. Their study underscores the potential for enhanced durability and accuracy of FSRs. Nacy et al. [25] introduce an apparatus for the static and dynamic calibration of FlexiForce sensors, ensuring accurate force measurements in various conditions and improving sensor reliability and precision. Gutierrez Velasquez et al. [26] present methods to mitigate errors in force-sensing resistors by using a modified astable 555 oscillator circuit, improving sensor performance through self-compensation. Swanson et al. [27] evaluate the use of force-sensing resistors to measure interface pressures in lower limb prosthetics, emphasizing their effectiveness in optimizing prosthetic fit and comfort.
In this study, we aim to measure and analyze the output characteristics of FSR sensors using a voltage divider circuit and multiple fixed resistances. Our goal is to determine the suitability of FSR sensors for accurate pressure measurement under different loading conditions. Specifically, we compare the performance of two widely used FSR sensors, i.e., Flexiforce A201-1 and Interlink FSR-402, to assess their linearity and repeatability [1,2].
Flexiforce A201-1 and Interlink FSR-402 have their own strengths and are suitable for different applications. Flexiforce A201-1, with its high sensitivity, precision, and larger active area, is ideal for applications requiring high-precision force measurement. On the other hand, Interlink FSR-402, with its compact size and lower cost, is suitable for force measurement in limited spaces or applications where cost efficiency is crucial. Selecting the appropriate sensor depends on the intended use and budget considerations.
Manufacturers of FSR sensors typically do not provide detailed calibration data, instead recommending that users perform their own calibration tailored to their specific application conditions [22,23,24,25,26,27]. This gap highlights the need for a thorough investigation into the output characteristics and calibration of FSR sensors under various loading conditions.
By conducting precise calibration and analysis, we seek to derive an equation that relates the output of the FSR sensor to the applied load, thereby enhancing the sensor’s reliability for various practical applications. This study contributes to the body of knowledge by providing a detailed examination of FSR sensor performance and offering insights into their potential improvements for future use in fields such as medical devices, robotics, and consumer electronics.

2. Experimental Method

This study evaluated two types of thin film force-sensitive resistor (FSR) sensors: including Flexiforce A201-1 (Tekscan, Norwood, MA, USA) and Interlink FSR-402 (Interlink Electronics, Irvine, CA, USA), as depicted in Figure 1. Specifications for these sensors, including linearity and repeatability, as provided by the manufacturers, are summarized in Table 1. The sensors’ sensing areas were computed from these specified values.

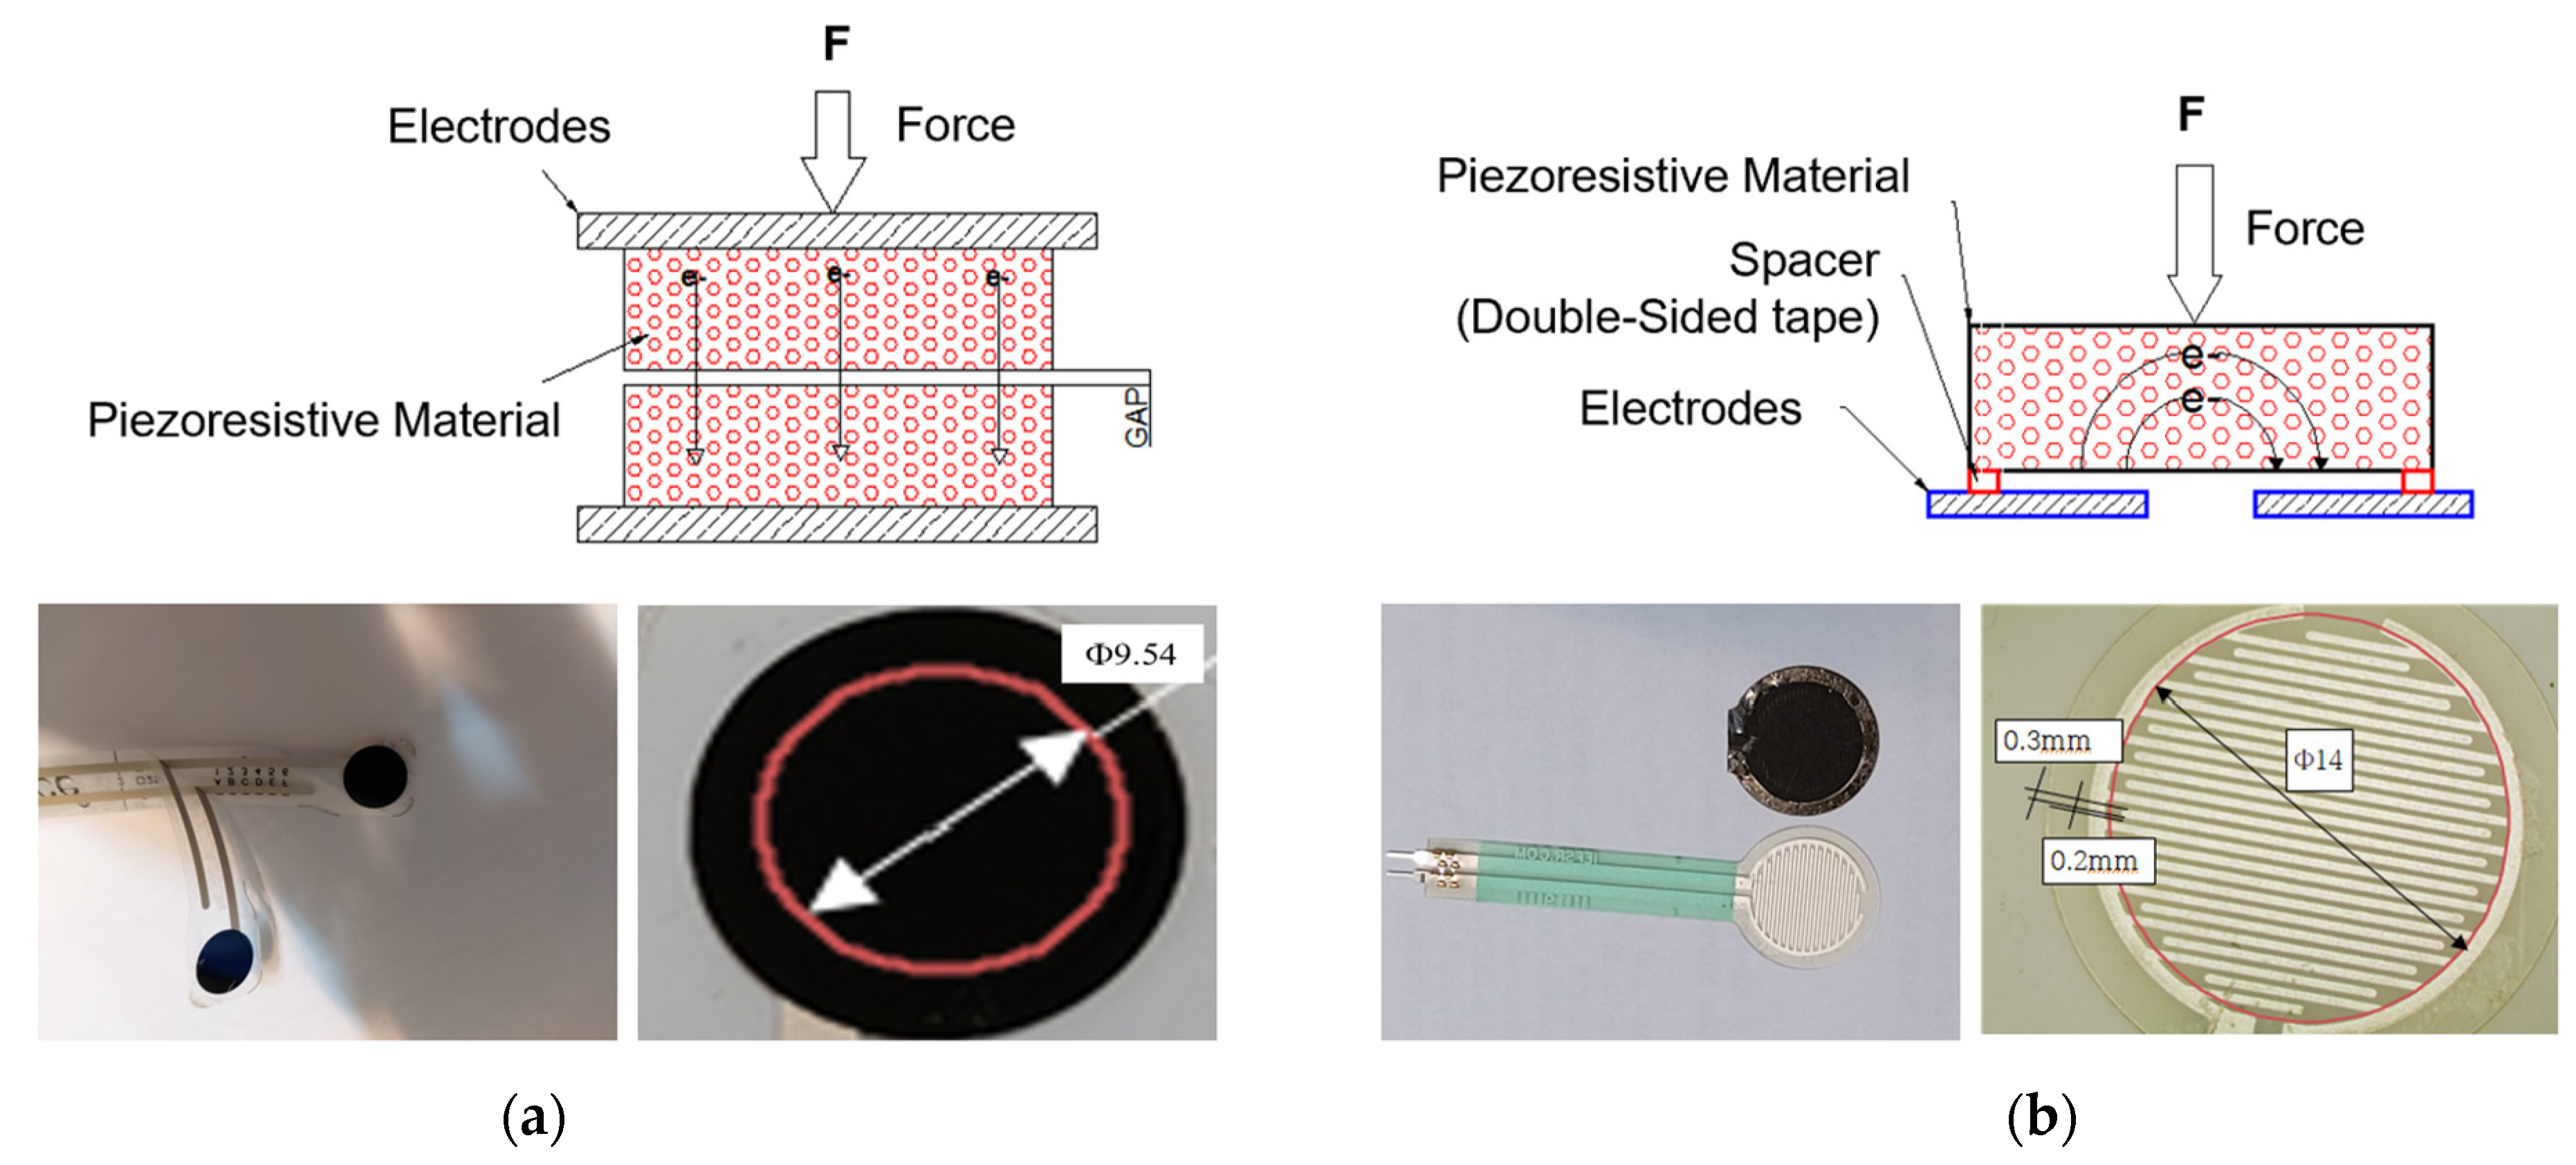
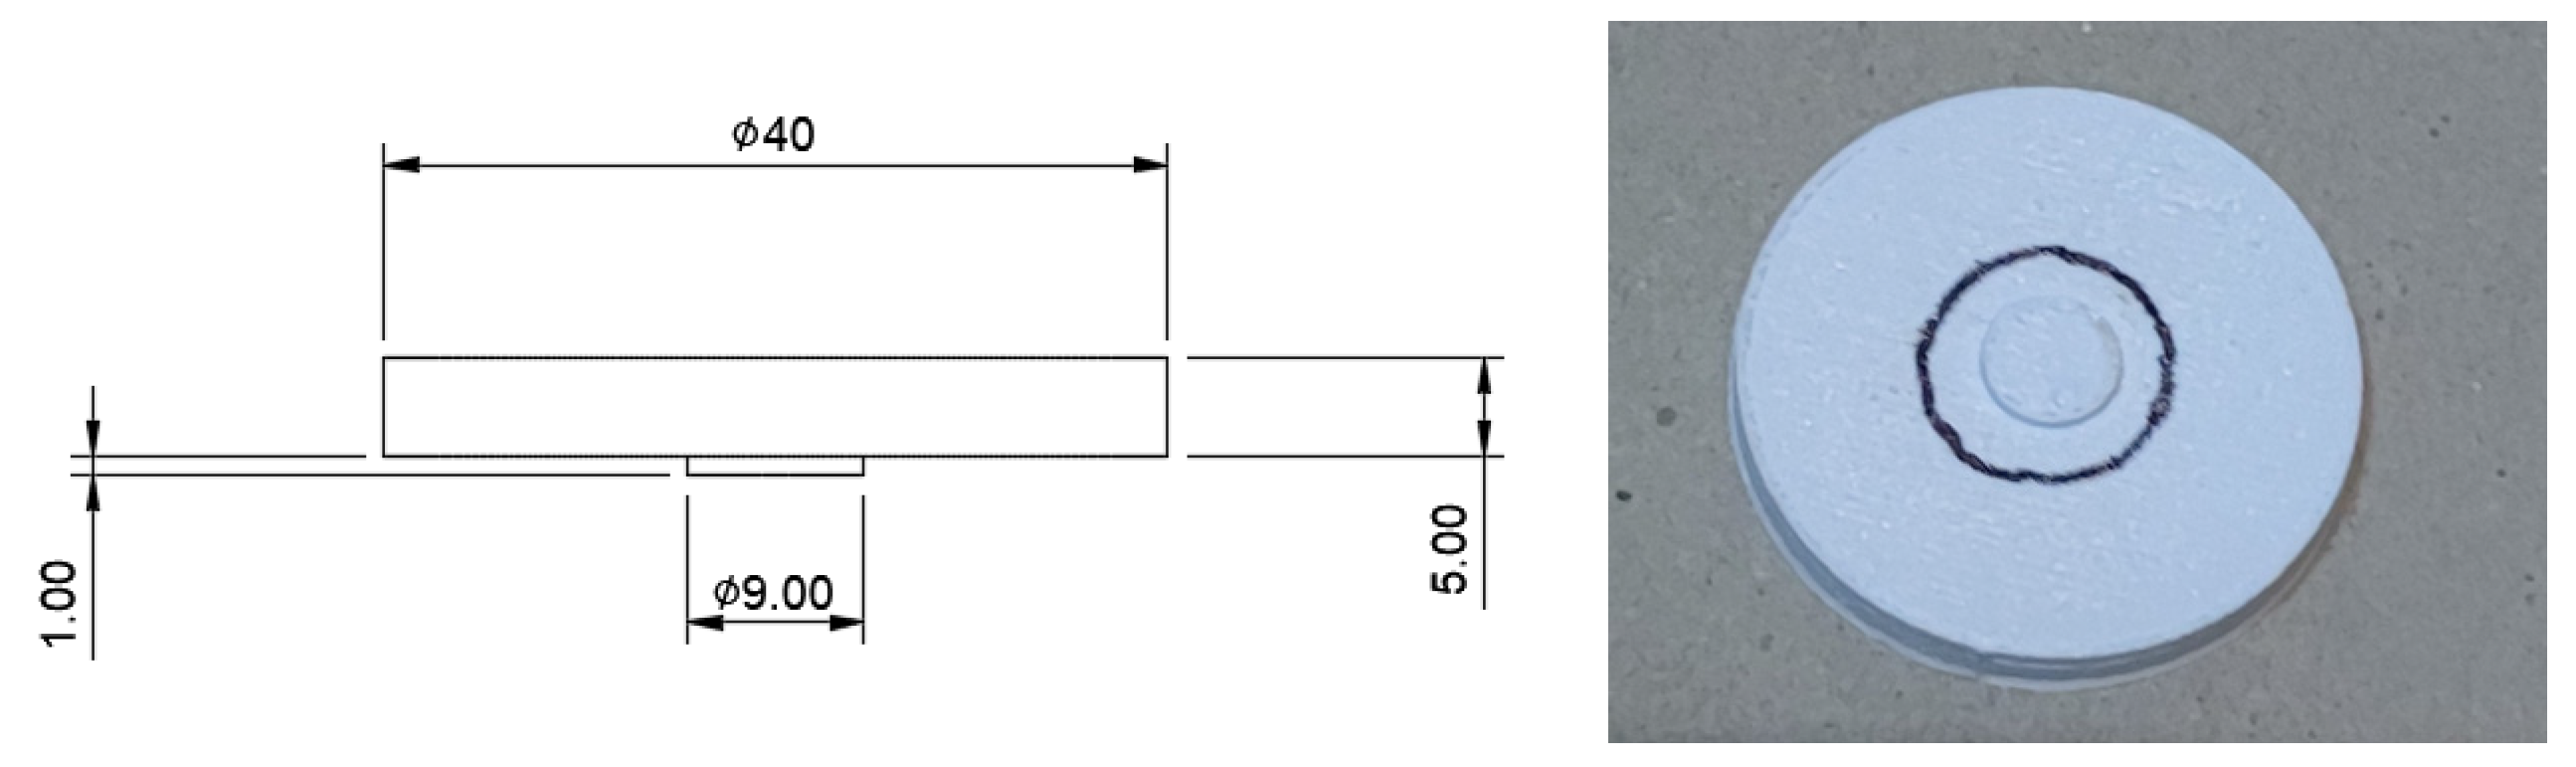
2.1. Sensor Structure

The Flexiforce A201-1 sensor is constructed from a thin plastic film onto which electrodes of silver ink are printed. Beneath these electrodes lies a layer of piezoresistive material. This assembly is sandwiched between two additional plastic films, creating micro-sized gaps between the opposing piezoresistive surfaces (Figure 1a (top)). Application of force causes these surfaces to contact, altering the current flow and resistance across the electrodes. A sectional view of the disassembled Flexiforce sensor, illustrating the uniform coating of the piezoresistive material on the film, is shown in Figure 1a (bottom). Similarly, the Interlink FSR sensor features piezoresistive material attached to either side of an adhesive layer, positioned along the sensor edges with a gap equivalent to the adhesive’s thickness (Figure 1b). Upon force application, the material contacts the electrodes, thereby reducing resistance.

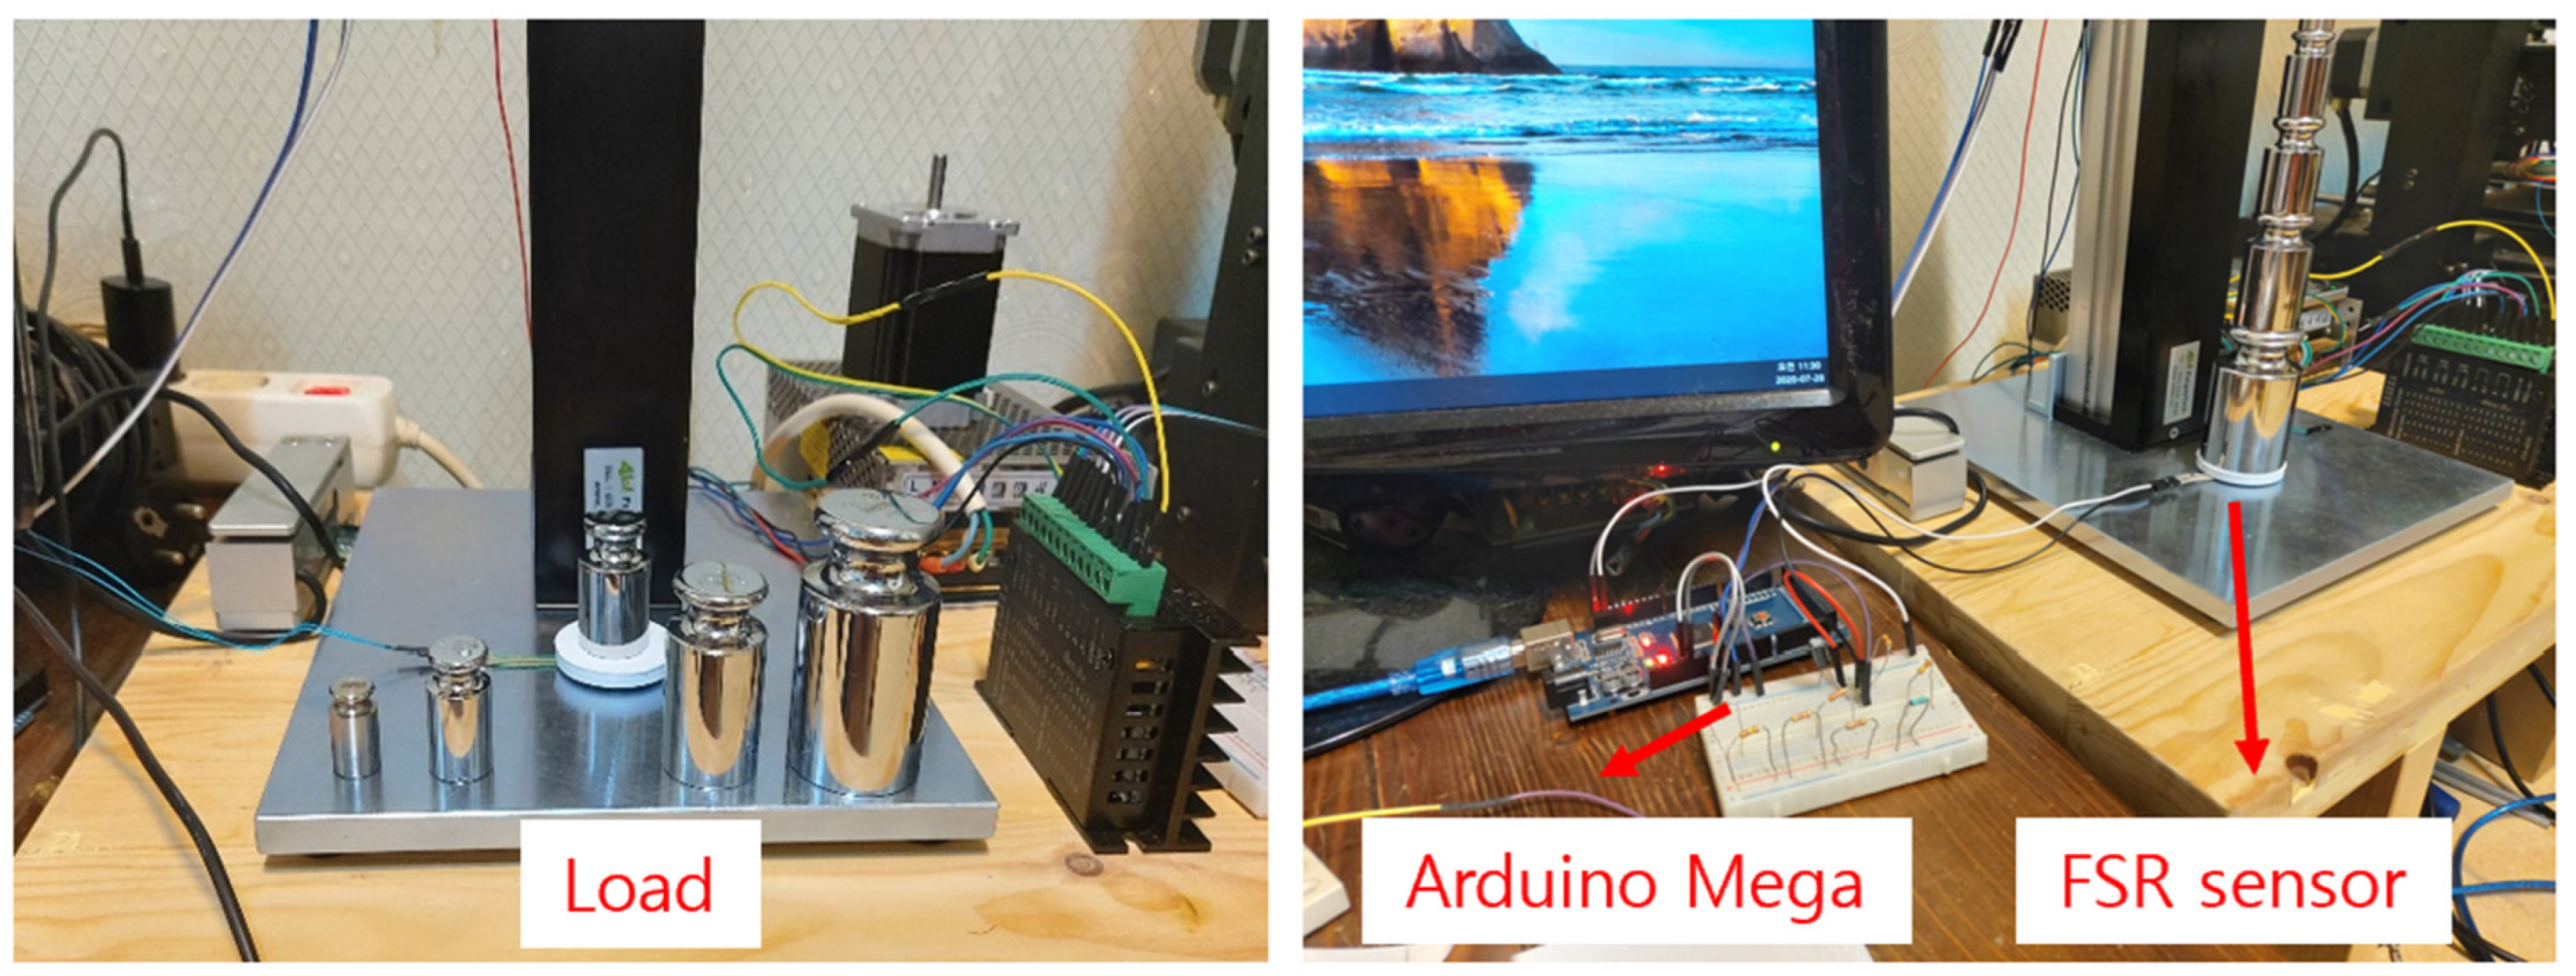
2.2. Load Application

For load tests, M1 class weights adhering to the International Organization of Legal Metrology standards were used, specifically weights of 20, 50, 100, 200, and 300 g, as outlined in Table 2. Given the discrepancy between the diameters of the smallest weight (13 mm) and the Flexiforce sensing area (9.53 mm), direct application of the weights could lead to uneven load distribution. To address this, a custom-made puck produced via 3D printing was utilized to distribute the weight evenly across the sensing area (Figure 2).

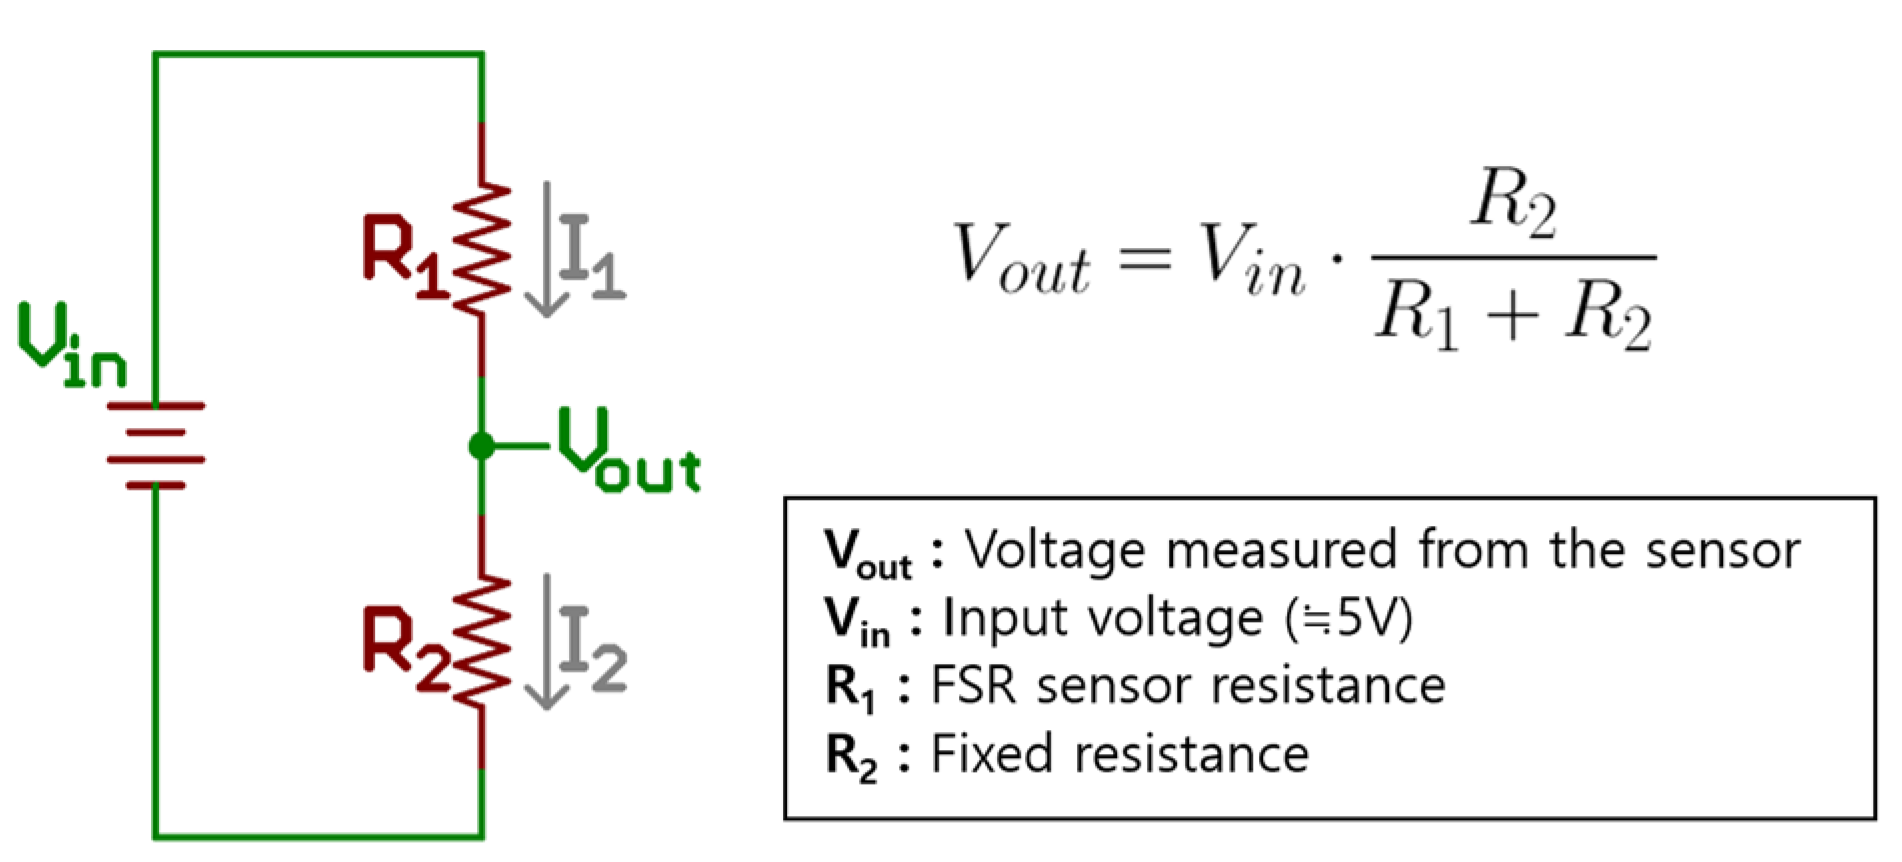
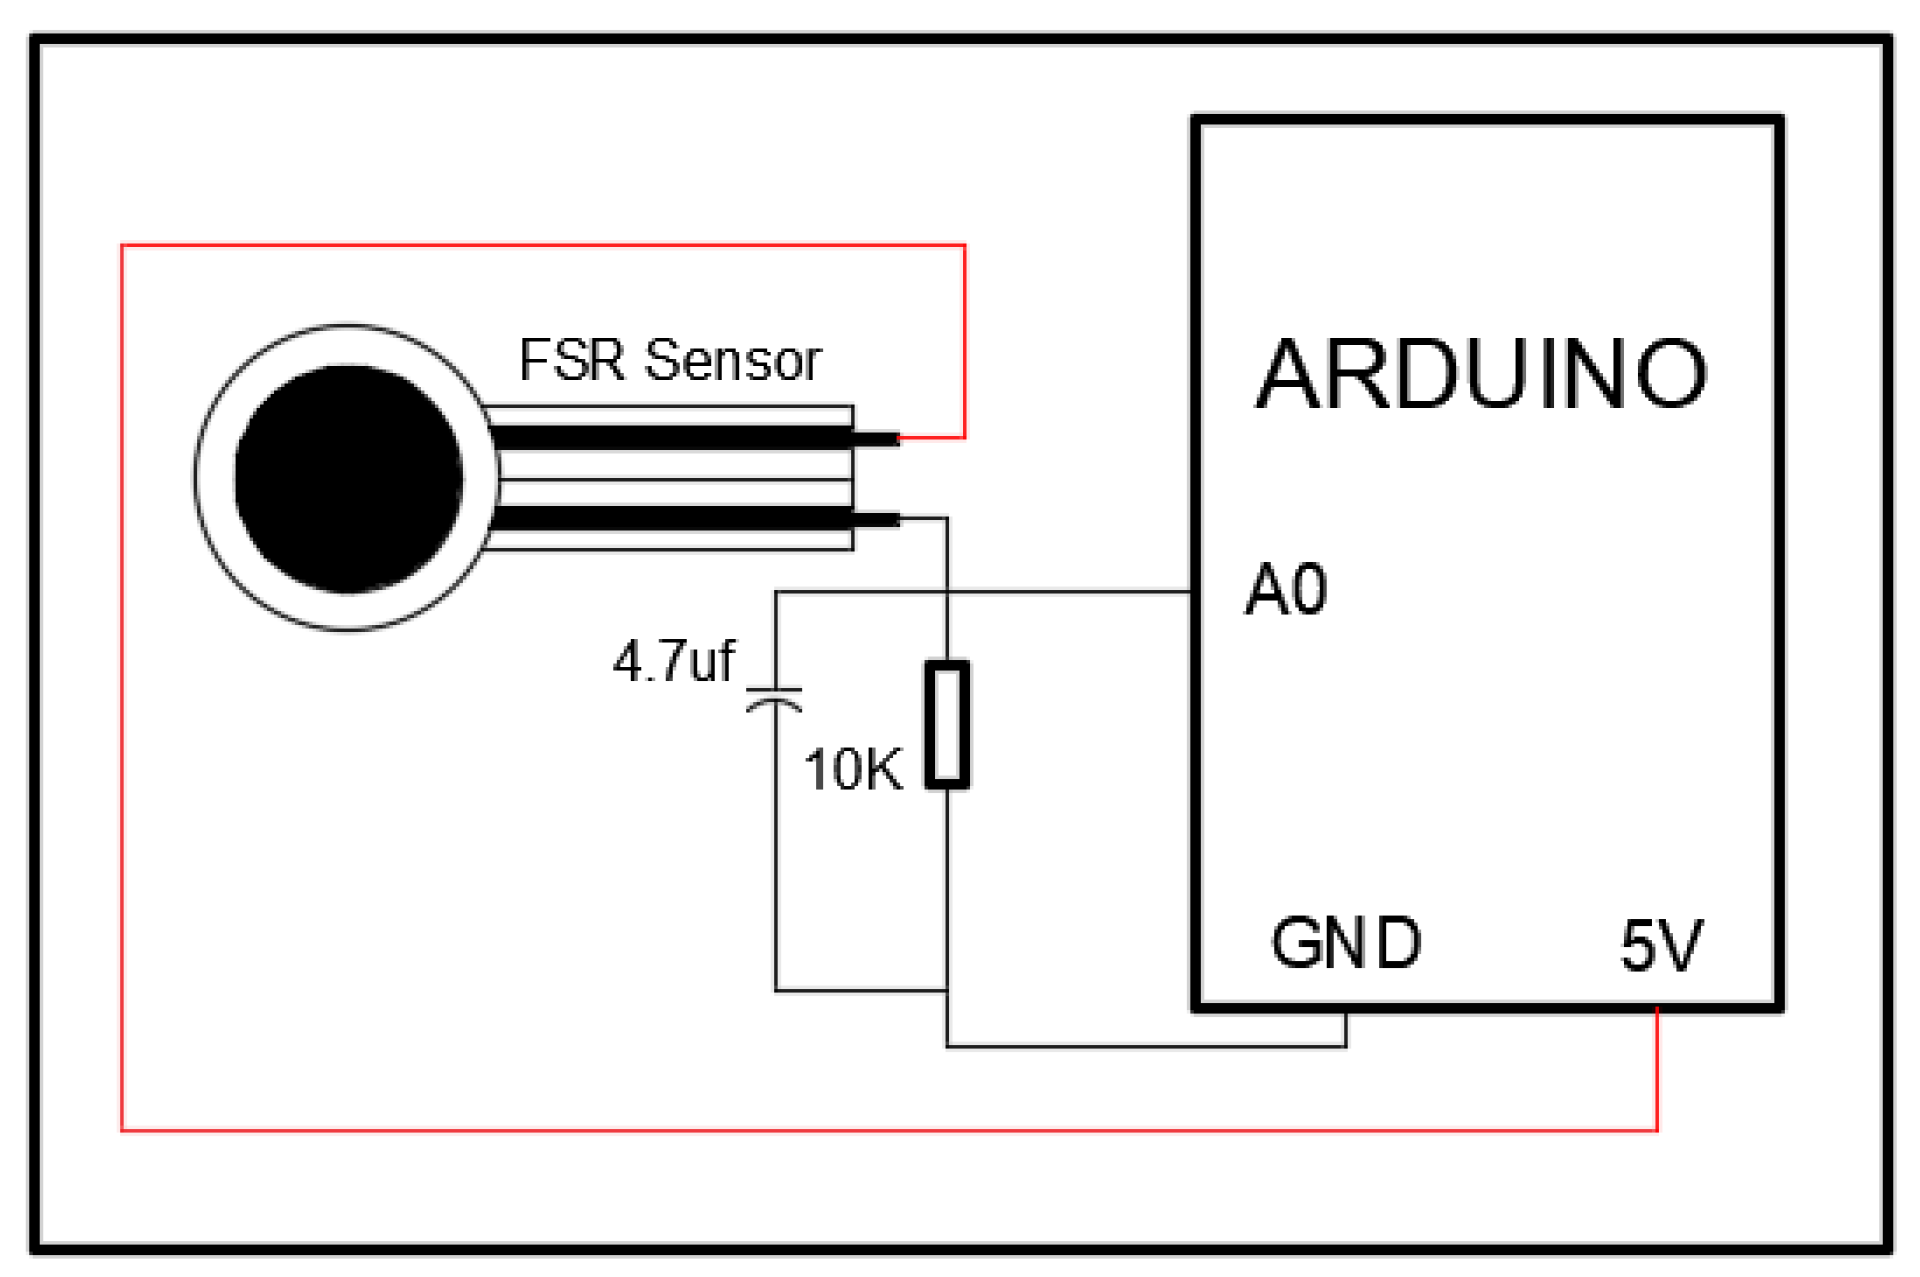
2.3. Resistance Measurement

FSR sensors function as variable resistors, with resistance values that change based on the applied load. Direct measurement of these variable resistance values in a circuit is challenging; hence, a voltage divider method was employed to measure the voltage changes corresponding to different loads. Figure 3 illustrates the circuit configuration used to measure the output voltage of the FSR sensor as the load changes.
The fixed resistor in the circuit was initially set to 10 kΩ, as recommended by the manufacturers. To analyze the output characteristics of the FSR sensors under various conditions, we tested the sensors with fixed resistances of 1 kΩ, 4.7 kΩ, 5.6 kΩ, 10 kΩ, 47 kΩ, 100 kΩ, and 200 kΩ. In the case of commercial FSR sensors, the applicable model is determined according to the load. However, FSR sensors can be used beyond the load limits specified by the manufacturers, depending on the resistance value. Under this premise, it is necessary to verify whether the sensors exhibit the same linearity across different resistance values.

2.4. Data Acquisition

To evaluate the output characteristics of the FSR sensors over time for each load value, a data acquisition (DAQ) program was developed (Figure 4). This program collected 1500 data points at a frequency of 0.1 Hz. The load data were measured using an Arduino Mega2560 equipped with a 10-bit analog-to-digital converter (ADC), and the raw data were converted to output voltages corresponding to the applied loads. Figure 5 shows our experimental setup for the static load characteristic test of the FSR sensor using a weight. The Arduino board, in particular, is known for its low cost and relatively high ADC output linearity. With a 10-bit resolution (output values ranging from 0 to 1024), it is deemed sufficient for measuring resistance changes in this test. While it is possible to use a MATLAB program with an Arduino board for data acquisition, the interface between MATLAB and the Arduino board can sometimes be unstable. Therefore, a separate data logging program was created using C#, and the data files were saved in CSV format. A program was then written to analyze the collected CSV files using MATLAB for data analysis in each experiment.
The Arduino system provided a consistent 5 V input voltage, limiting the measurable output voltage to 5 V or below. MATLAB software was used to process the collected data, calculating the average output voltage for each applied load and fixed resistance. The resistance and conductivity of the FSR sensors were then computed from these voltages to analyze the relationships among the applied load, sensor resistance, and conductivity.
By implementing this detailed experimental methodology, we ensured precise and repeatable measurements, enabling a thorough analysis of the linearity and repeatability of the selected FSR sensors. This rigorous approach allowed us to derive accurate calibration equations, enhancing the reliability of FSR sensors for various practical applications.

3. Results and Discussion

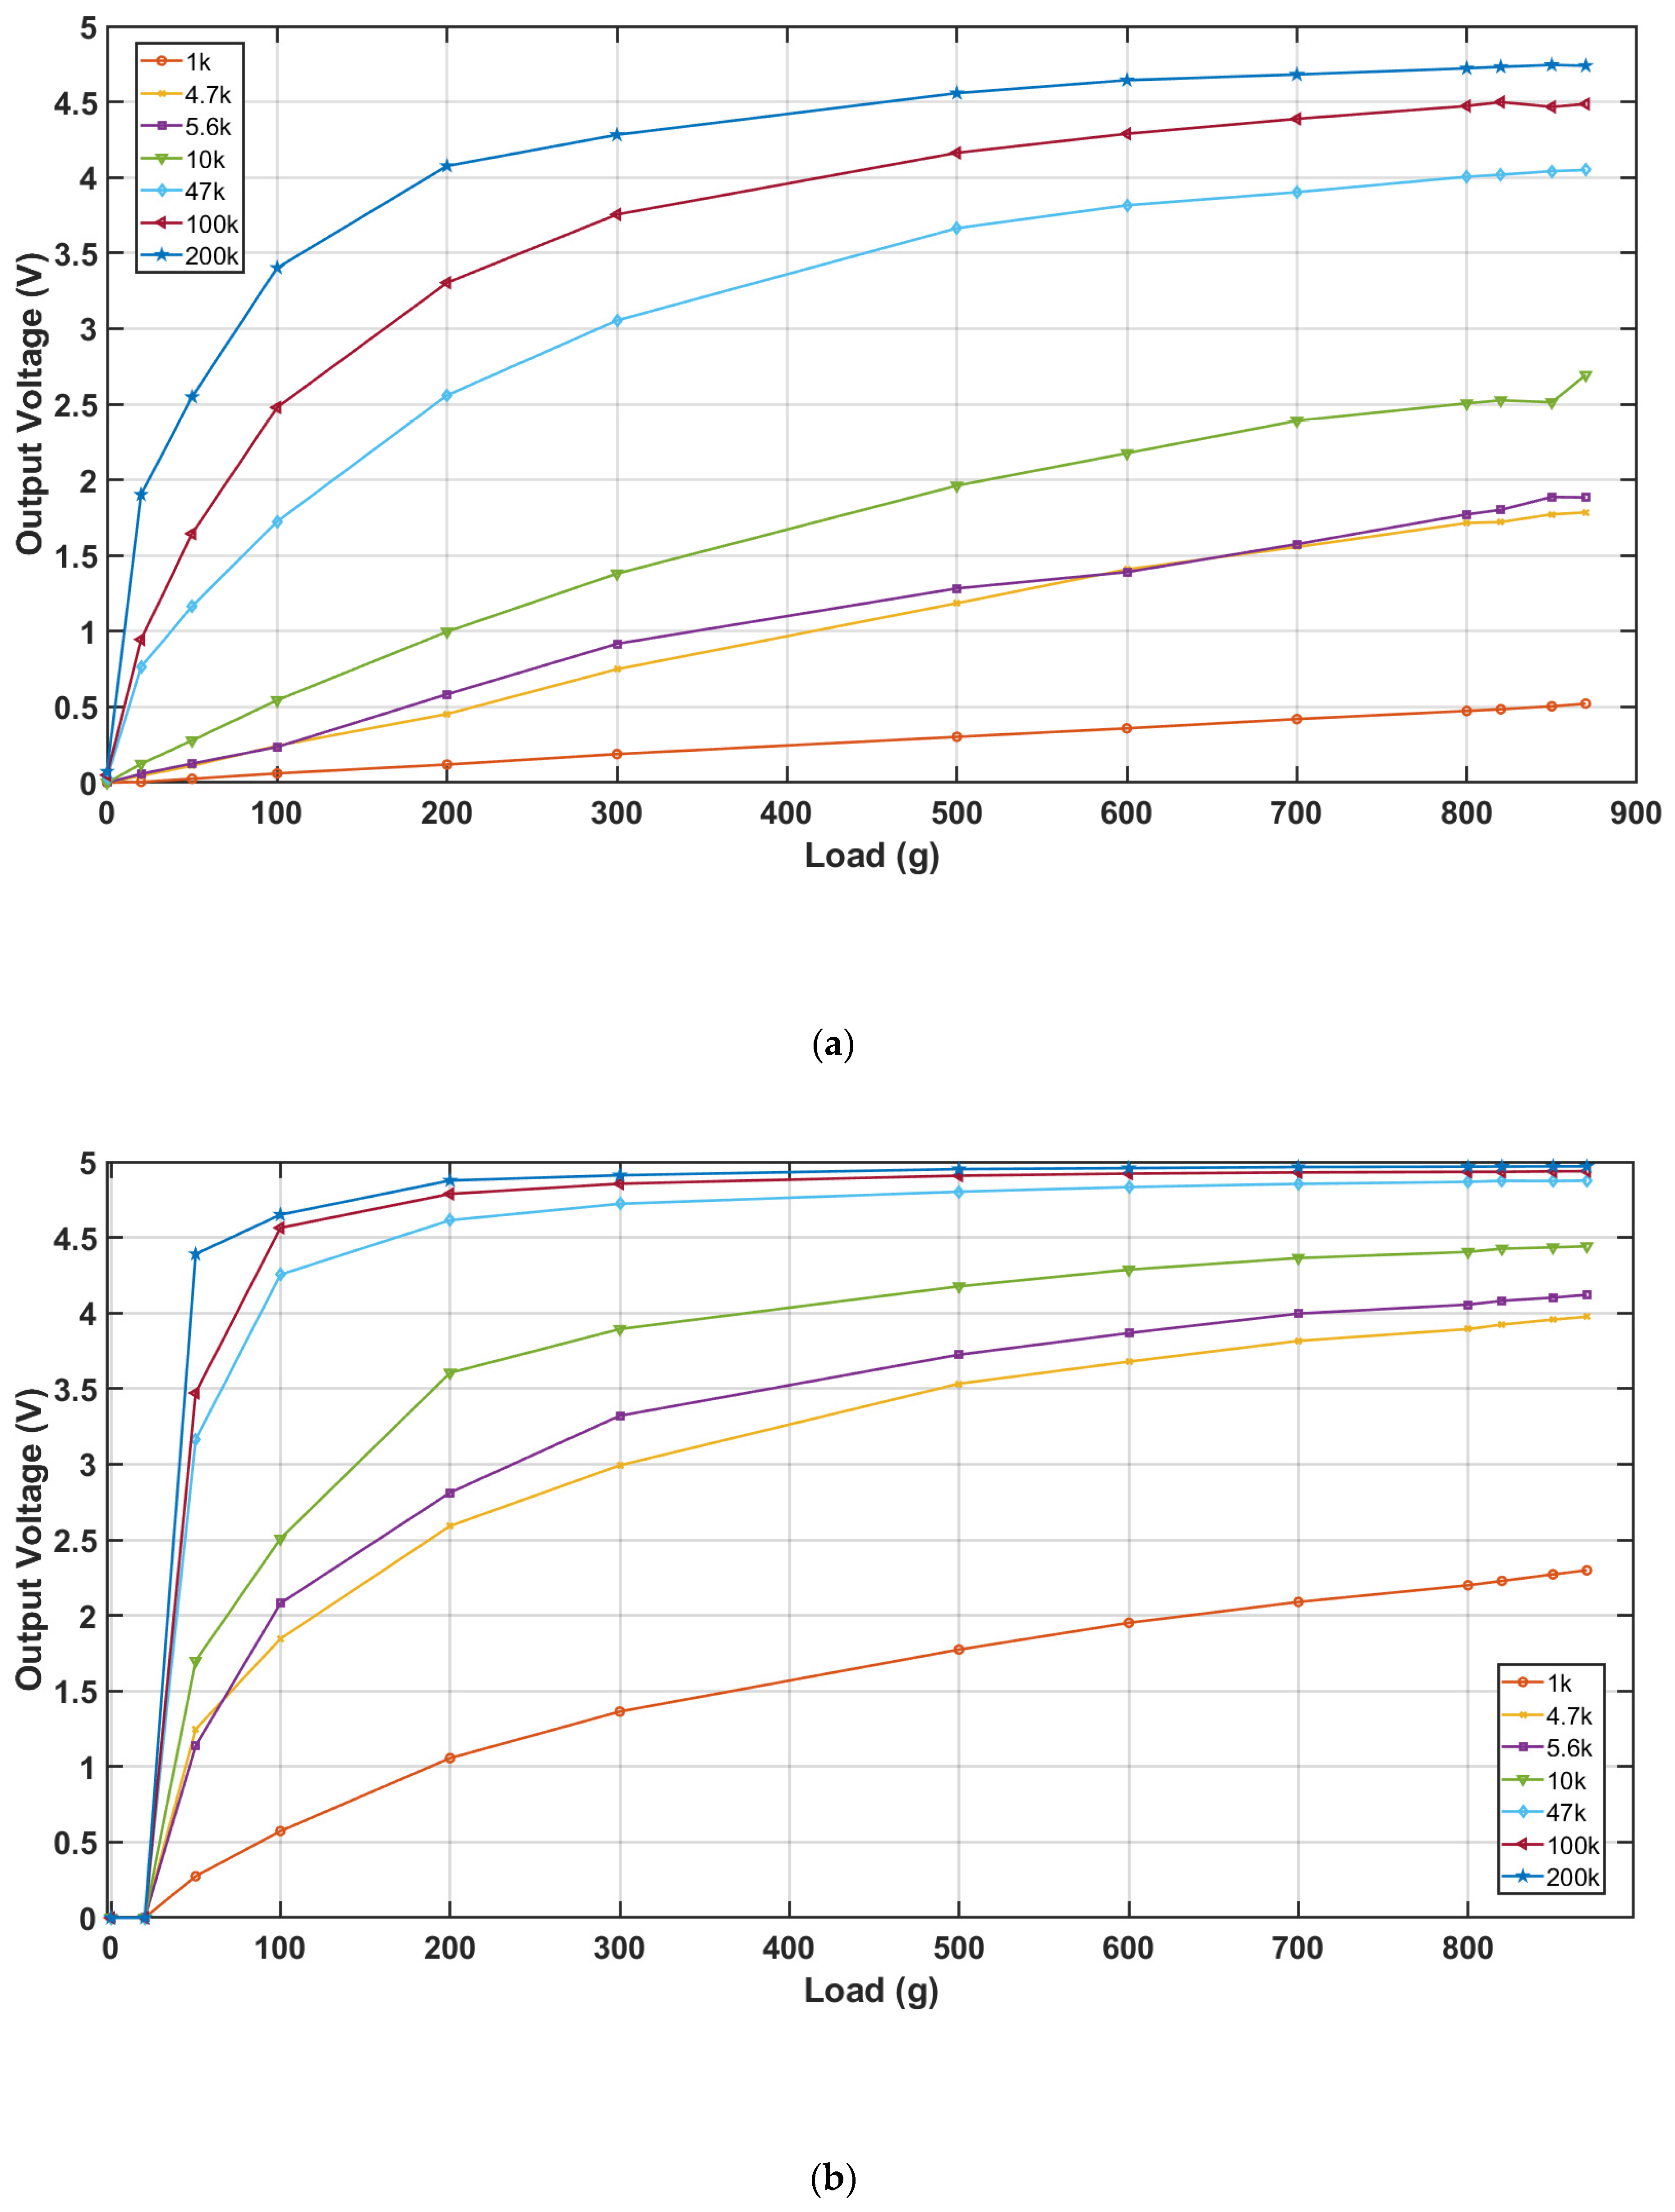
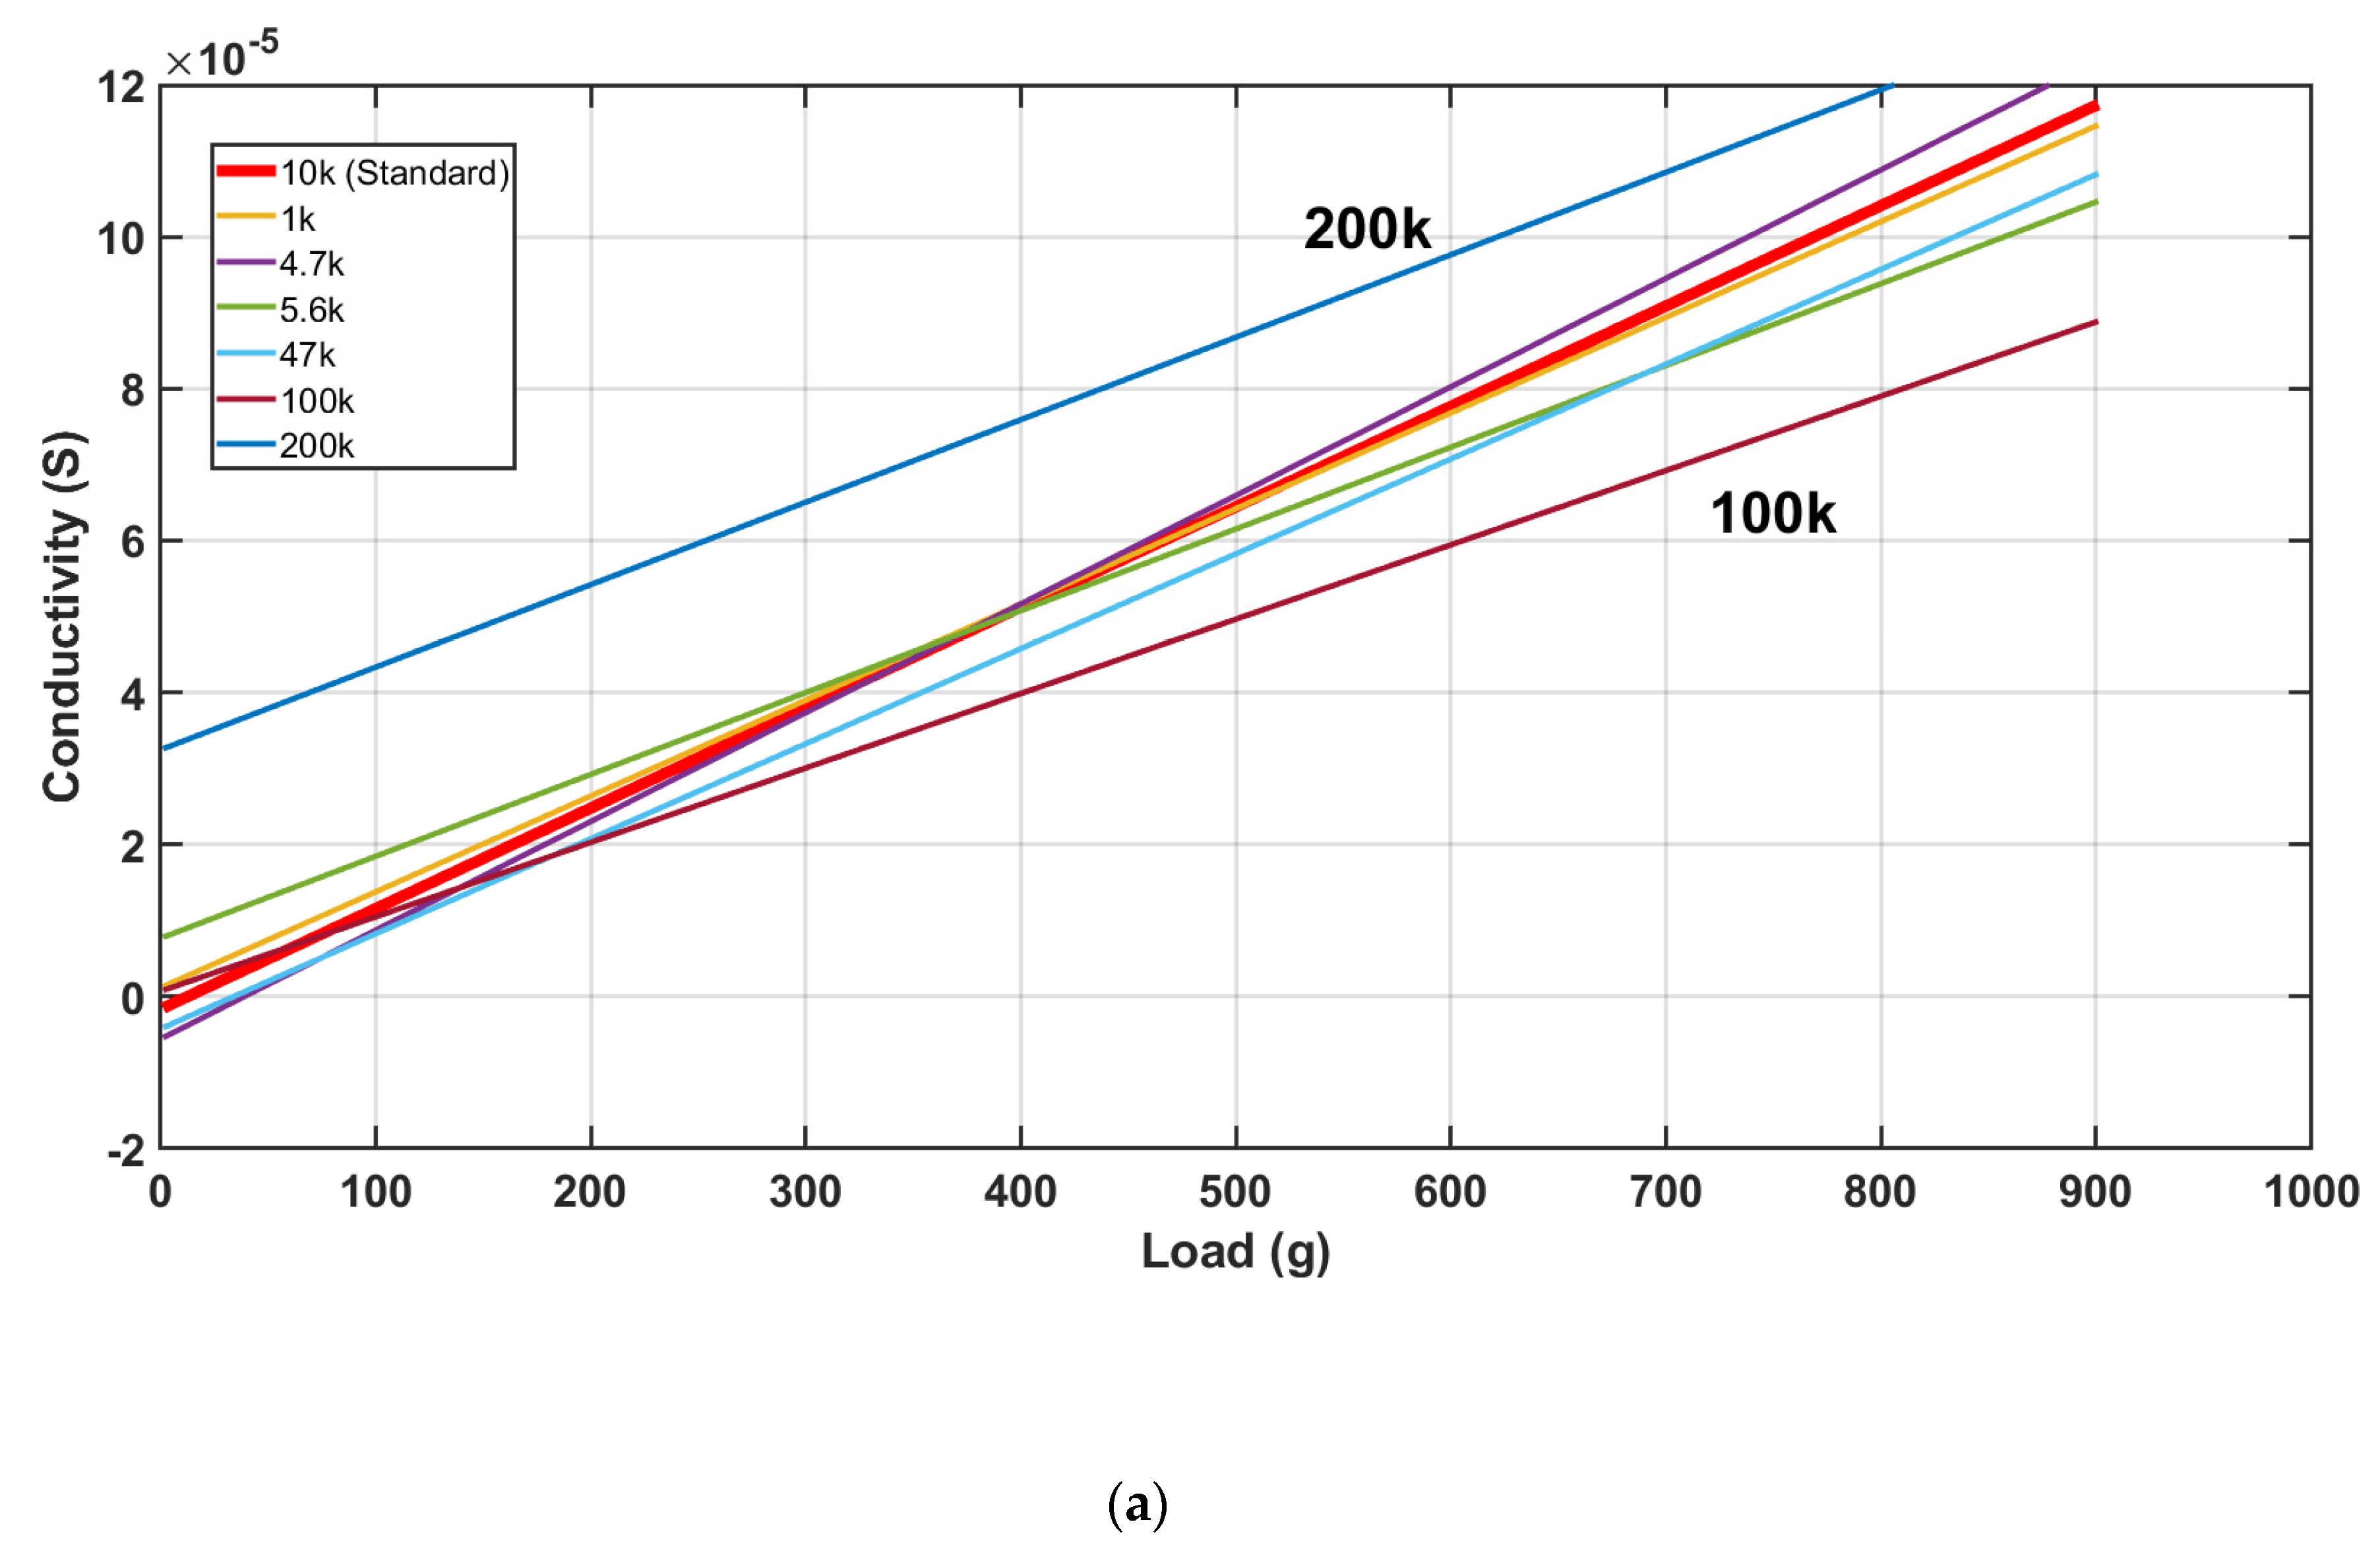
3.1. Analysis of the Average Measured Voltage and Conductivity

Using the MATLAB program, the average output voltage for each applied load and fixed resistance was calculated from the raw data. The resistance and conductivity of the FSR sensors were then derived from these voltages to examine their response to varying loads. The input voltage of the Arduino used in this test was 5 V, thereby capping the measurable output voltage at 5 V.
Figure 6 presents the measured voltages for both the Flexiforce A201-1 and Interlink FSR-402 sensors under applied loads ranging from 20 g to 870 g. The results show a clear relationship between the applied load and the output voltage, with both sensors demonstrating a decrease in voltage as the load increases, consistent with their variable resistor nature.
Figure 7 compares the conductivity of the two FSR sensors under varying loads. The graphs indicate that the conductivity values for both sensors are distributed uniformly across the range of applied loads for each fixed resistance. Notably, the Interlink FSR-402 sensor exhibits slightly higher conductivity than the Flexiforce A201-1 sensor, likely because of differences in their construction and materials.
Considering the issue of electrical noise in the circuit during data logging, the number of sensor measurements taken for each load was set to 1500 (approximately 3 min of measurement). The average of these 1500 measurements was used as the output value for each load. Based on the average value for each load, the voltage, resistance, and conductivity for each load were calculated. Although there was concern about noise from the wiring connected to the sensor during the measurement process, an examination of the 1500 measurements showed no significant external noise.

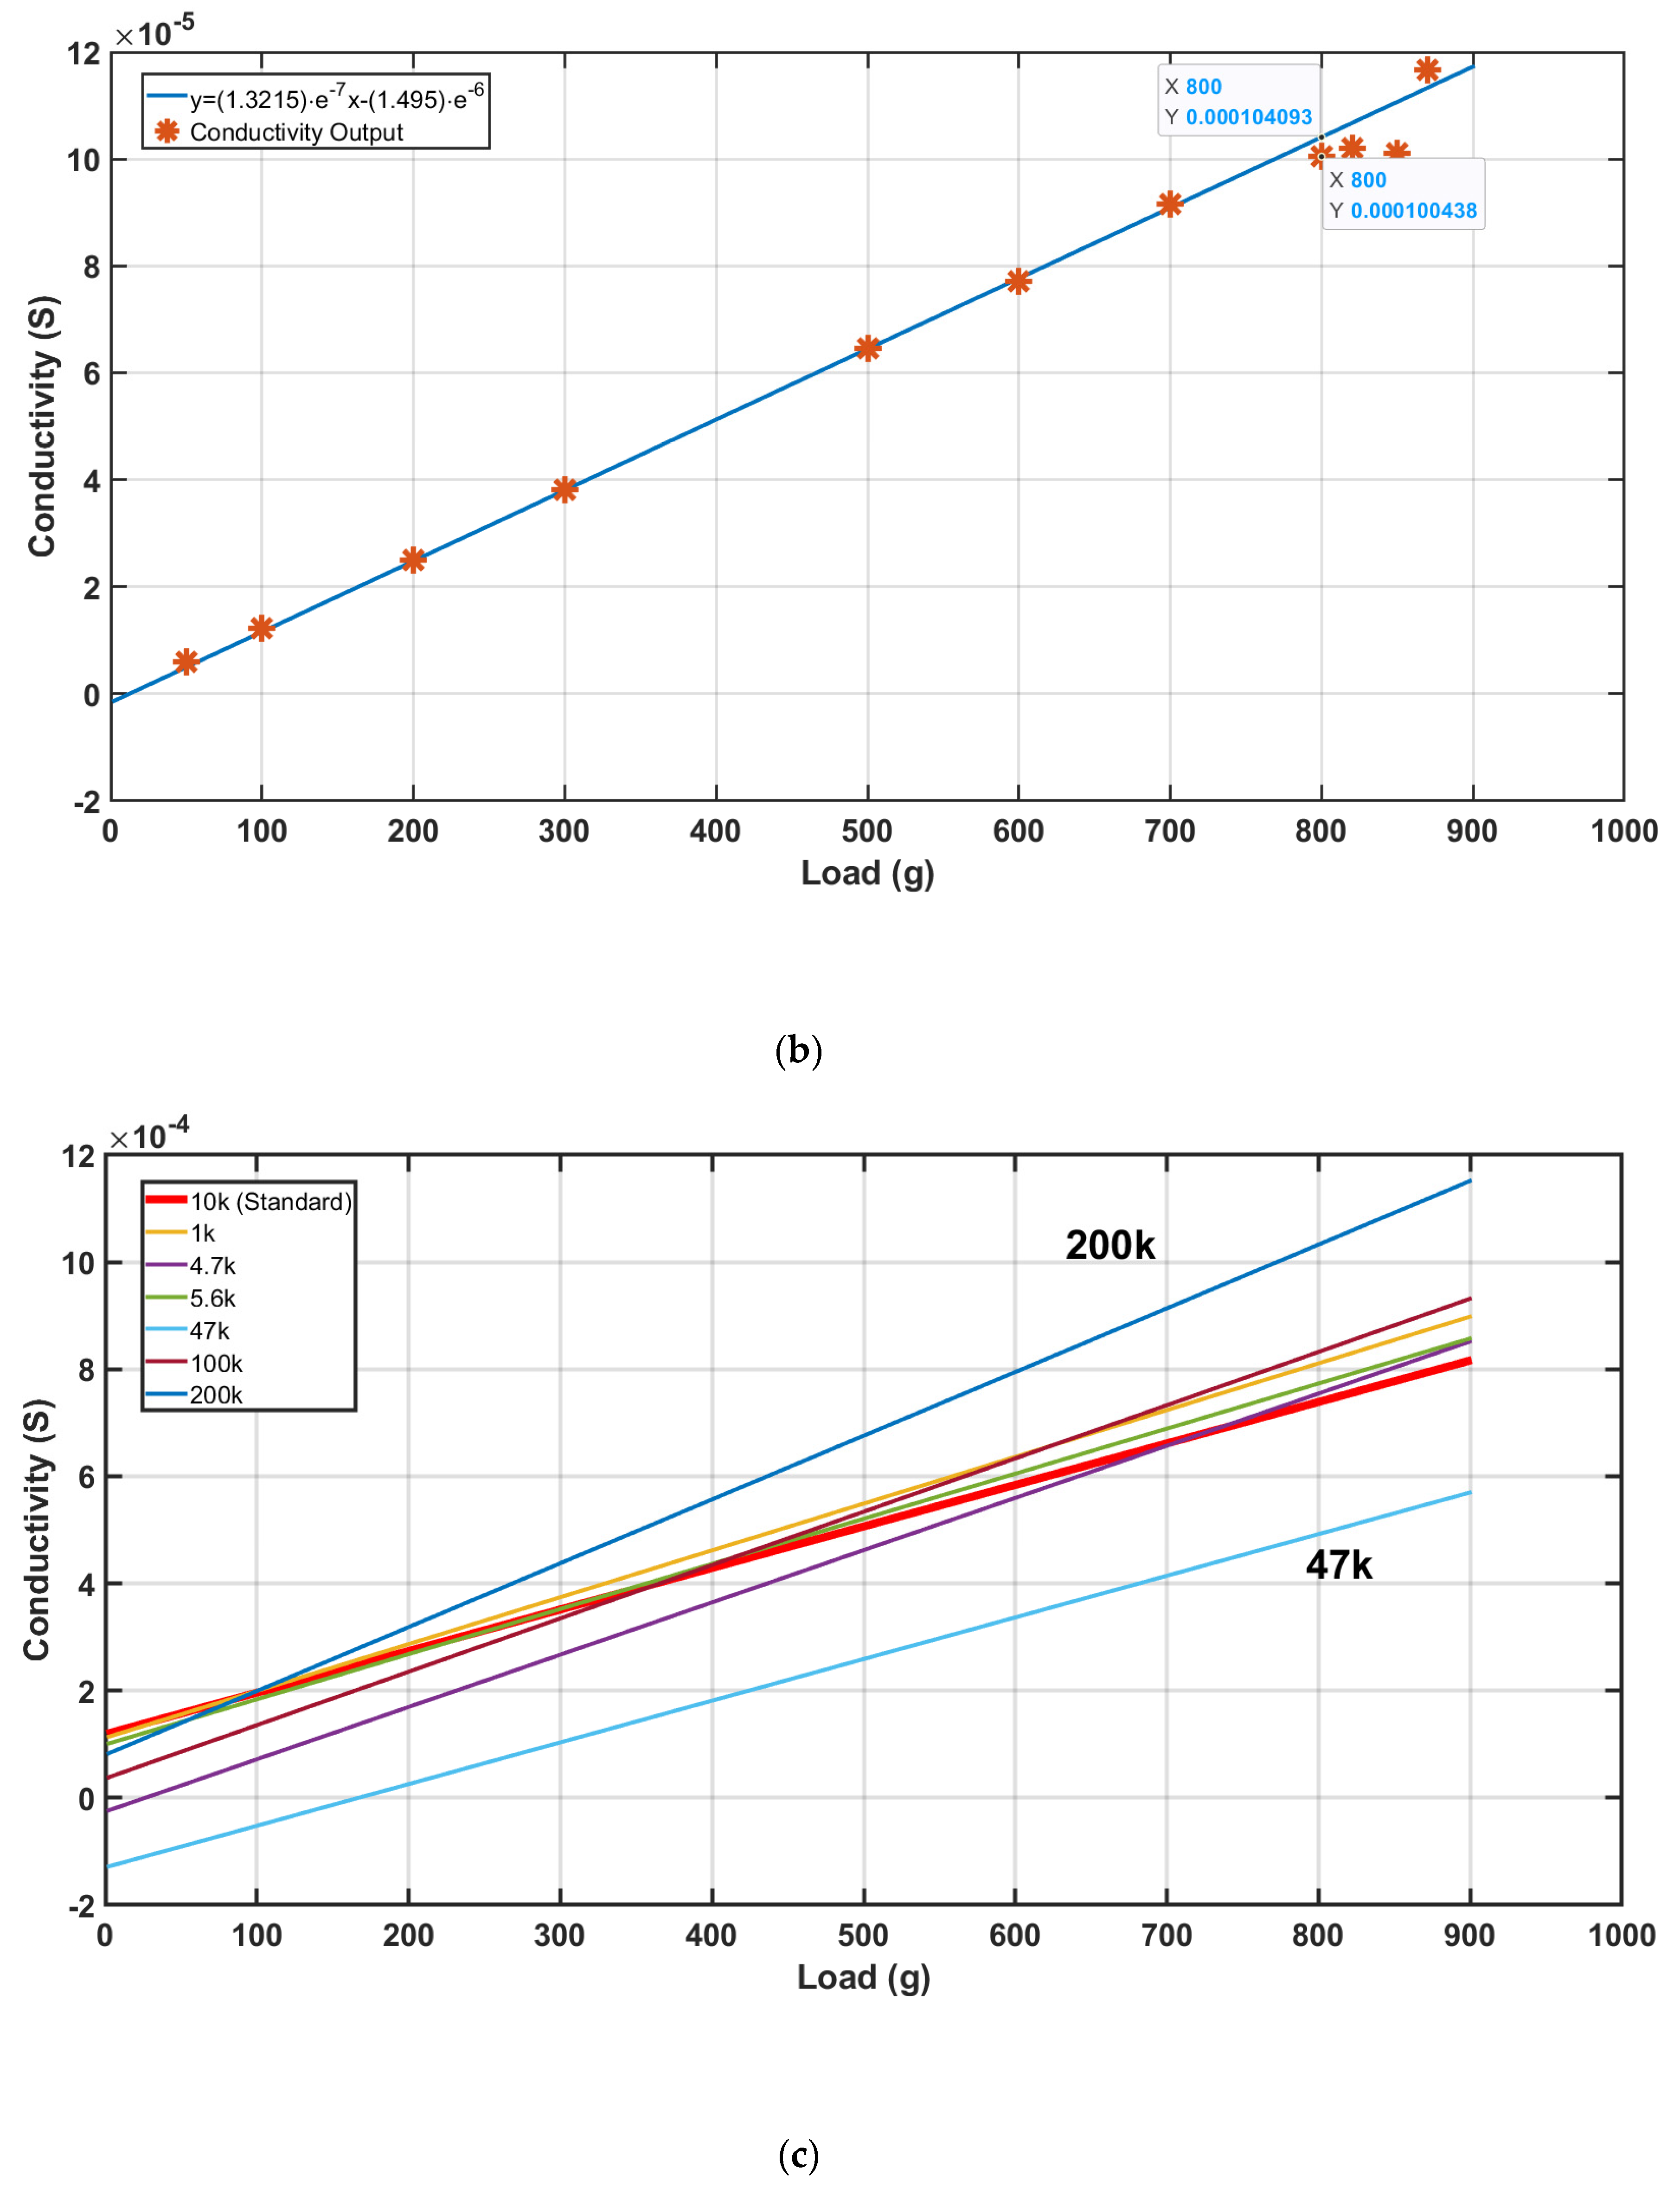
3.2. Equation of the Straight Line of the FSR Sensor Using Conductivity Data

From the conductivity data, we derived equations of straight lines using the conductivity values at two specific loads (300 g and 500 g) within the applied load range for both sensors. Table 3 and Table 4 show the equations for drawing a line based on conductivity data measured from the Flexiforce A201-1 and Interlink FSR-402 sensors, respectively.
These equations allowed us to analyze the distribution of the measured values and assess the linearity of the sensors.
Figure 8a shows the distribution of the conductivity values for the Flexiforce A201-1 sensor with a fixed resistance of 10 kΩ, which is the standard recommended by the manufacturer. The conductivity values at loads other than the two calibration points align closely with a straight line, indicating that the Flexiforce A201-1 sensor exhibits good linearity across the applied loads. Similar trends were observed when using other fixed resistances, with the exception of 100 kΩ and 200 kΩ, where some deviation was noted. This suggests that the Flexiforce A201-1 sensor maintains consistent linearity regardless of the resistance value used in the measurement circuit (Figure 8b).
In Figure 8c, the Interlink FSR-402 sensor shows a similar tendency, with conductivity values at various loads aligning well with the straight line derived from the 10 kΩ resistance data. Although some dispersion is observed, likely because of experimental errors, the overall linearity of the Interlink FSR-402 sensor is considered to be good. When comparing the linear expressions from other fixed resistances, the results generally follow the same trend as the 10 kΩ reference line, except for slight deviations at 47 kΩ and 200 kΩ (Figure 8d).
Overall, the conductivity characteristics of both FSR sensors demonstrated considerable linearity to the applied loads. Despite some deviations observed at higher resistance values, the sensors’ outputs remained almost parallel to the reference straight line, confirming their reliability.

4. Discussion

The results of this study indicate that both the Flexiforce A201-1 and Interlink FSR-402 sensors exhibit excellent linearity and repeatability, making them reliable for accurate force measurements. The linear relationship between applied load and output voltage was consistent across a range of loads for both sensors. This consistency suggests that with proper calibration, these sensors can be effectively used in various applications requiring precise force measurement.
The slightly higher conductivity observed in the Interlink FSR-402 sensor compared with the Flexiforce A201-1 sensor is likely due to differences in their material composition and design. This difference highlights the importance of selecting the appropriate sensor based on the specific requirements of the application, including sensitivity, precision, and cost considerations.
The use of a voltage divider circuit and multiple fixed resistances in this study provided a robust framework for analyzing the output characteristics of the FSR sensors. The derived calibration equations allowed for the accurate translation of sensor output into applied loads, significantly enhancing the precision of force measurements. This methodological approach proved effective in ensuring the reliability of the sensors.
However, this study also revealed some challenges and areas for further research. For instance, while both sensors demonstrated high linearity and repeatability under static loading conditions, their performance under dynamic loading conditions remains to be investigated. Future research should focus on optimizing calibration techniques and exploring new materials and sensor designs to improve sensor performance. Additionally, investigating the sensors’ responses to different types of forces, such as shear and torsional forces, could further expand their applicability.
Although the linearity of sensors is usually provided by the non-linear error percentage to a full-scale voltage output, we tried to utilize the conductivity line in order to check the reliability of the two sensors in the case of using different resistances. Thus, instead of using the data of non-linear errors, we tried to demonstrate good reliability with different resistances by showing how the straight lines of conductivity in Figure 8 are in a close neighborhood.

5. Conclusions

This study presents a comprehensive evaluation of the linearity and repeatability of thin film force-sensitive resistor (FSR) sensors, specifically focusing on the Flexiforce A201-1 and Interlink FSR-402 models. Through rigorous static load testing, we confirmed their reliability and suitability for precise force measurement applications.
The findings of this research have significant practical implications. When precisely calibrated, thin film FSR sensors can be highly reliable for use in medical devices, robotics, and consumer electronics. Their cost-effectiveness, flexibility, and ease of installation make them an attractive option for force and pressure sensing across various fields. However, our study also underscores the necessity for further research to optimize calibration techniques and explore new materials and sensor designs to enhance linearity and repeatability. Additionally, investigating the performance of these sensors under dynamic loading conditions could broaden their applicability to more complex scenarios.
Key points from our study include the following:
  • High Linearity and Repeatability: Both the Flexiforce A201-1 and Interlink FSR-402 sensors demonstrated excellent linearity and repeatability, ensuring reliable and accurate force measurements.
  • Comparison of Sensors: Interlink FSR-402 exhibited slightly higher conductivity compared with Flexiforce A201-1, highlighting differences in material composition and design.
  • Calibration Methodology: Utilizing a voltage divider circuit and multiple fixed resistances, we derived calibration equations that significantly enhance measurement precision.
  • Practical Applications: Precisely calibrated thin film FSR sensors are suitable for use in various applications, including medical devices, robotics, and consumer electronics, because of their cost-effectiveness and flexibility.
In conclusion, thin film FSR sensors, when accurately calibrated, offer a reliable and precise solution for force measurement. This study provides valuable insights and methodologies that contribute to improving the performance of FSR sensors, facilitating their broader adoption in technological and industrial applications.

Author Contributions

Conceptualization, B.K. and K.L.; methodology, J.J.; software, K.L.; validation, K.L. and B.K.; formal analysis, K.L.; investigation, B.K.; writing—original draft preparation, B.K.; writing—review and editing, B.K.; supervision, B.K. All authors have read and agreed to the published version of the manuscript.

Funding

This work was supported by research grants from Daegu Catholic University in 2021.

Institutional Review Board Statement

Not applicable.

Informed Consent Statement

Not applicable.

Data Availability Statement

The datasets used and/or analyzed during the current study are available from the corresponding author upon reasonable request.

Conflicts of Interest

The authors declare no conflict of interest.

References

  1. Saadeh, M.Y.; Carambat, T.D.; Arrieta, A.M. Evaluating and Modeling Force Sensing Resistors for Low Force Applications. In Proceedings of the ASME 2017 Conference on Smart Materials, Adaptive Structures and Intelligent Systems (SMASIS2017), Snowbird, UT, USA, 18–20 September 2017; pp. 1–11. [Google Scholar]
  2. Sadun, A.S.; Jalani, J.; Sukor, J.A. Force Sensing Resistor (FSR): A Brief Overview and the Low-Cost Sensor for Active Compliance Control. Proc. SPIE 2016, 10011, 1001112. [Google Scholar]
  3. Bhargav, S.; Sundara Rajan, J. Force Sensitive Resistors: A New and Emerging Field of Research in Conducting Polymers. J. Mines Met. Fuels 2022, 70, 215–221. [Google Scholar] [CrossRef]
  4. Chen, S.; Zhang, Y.; Li, Y.; Wang, P.; Hu, D. Recent Development of Flexible Force Sensors with Multiple Environmental Adaptations. Nano Energy 2024, 124, 109443. [Google Scholar] [CrossRef]
  5. Dahiya, R.; Navaraj, W.T.; Khan, S.; Polat, E.O. Developing Electronic Skin with Sense of Touch. Inf. Disp. 2015, 31, 6–10. [Google Scholar] [CrossRef]
  6. Qi, Z.; Song, Q.; Liu, Y.; Guo, C. FSM-HSVM-Based Locomotion Mode Recognition for Exoskeleton Robot. Appl. Sci. 2022, 12, 5483. [Google Scholar] [CrossRef]
  7. Yin, Z.; Zheng, J.; Huang, L.; Gao, Y.; Peng, H.; Yin, L. SA-SVM-Based Locomotion Pattern Recognition for Exoskeleton Robot. Appl. Sci. 2021, 11, 5573. [Google Scholar] [CrossRef]
  8. Castellarin, G.; Merlini, M.; Bettinelli, G.; Riso, R.; Bori, E.; Innocenti, B. Effect of an Innovative Biofeedback Insole on Patient Rehabilitation after Total Knee Arthroplasty. Appl. Sci. 2022, 12, 2456. [Google Scholar] [CrossRef]
  9. Lee, S.H.; Son, J. Development of a Safety Management System Tracking the Weight of Heavy Objects Carried by Construction Workers Using FSR Sensors. Appl. Sci. 2021, 11, 1378. [Google Scholar] [CrossRef]
  10. Ascioglu, G.; Senol, Y. Activity Recognition Using Different Sensor Modalities and Deep Learning. Appl. Sci. 2023, 13, 10931. [Google Scholar] [CrossRef]
  11. Seon, M.; Lee, Y.; Moon, C. Medical Robotic Bed to Prevent Pressure Sores. Appl. Sci. 2021, 11, 8459. [Google Scholar] [CrossRef]
  12. Jin, J.; Wang, S.; Zhang, Z.; Mei, D.; Wang, Y. Progress on Flexible Tactile Sensors in Robotic Applications on Objects Properties Recognition, Manipulation, and Human-Machine Interactions. Soft Sci. 2023, 3, 8. [Google Scholar]
  13. Luo, Y.; Matusik, W.; Rus, D.; Palacios, T.; Liu, C.; Lee, Y.J.; DelPreto, J.; Foshey, M.; Torralba, A.; Wu, K.; et al. Adaptive Tactile Interaction Transfer via Digitally Embroidered Smart Gloves. Nature 2023, 15, 868. [Google Scholar] [CrossRef] [PubMed]
  14. Ozioko, O.; Dahiya, R.S. Smart Tactile Gloves for Haptic Interaction, Communication, and Rehabilitation. Adv. Intell. Syst. 2021, 4, 2100091. [Google Scholar] [CrossRef]
  15. Polishchuck, A.; Navaraj, W.T.; Heidari, H.; Dahiya, R. Multisensory Smart Glove for Tactile Feedback in Prosthetic Hand. In Proceedings of the 30th Eurosensors Conference, Budapest, Hungary, 4–7 September 2016; Volume 168, pp. 1605–1608. [Google Scholar]
  16. Esposito, D.; Andreozzl, E.; Fratini, A.; Gargiulo, G. Piezoresistive Sensor to Measure Muscle Contraction and Mechanomyography. Sensors 2018, 18, 2553. [Google Scholar] [CrossRef] [PubMed]
  17. Cheng, M.; Zhu, G.; Zhang, F.; Tang, W.-L.; Jianping, S.; Yang, J.-Q.; Zhu, L.-Y. A Review of Flexible Force Sensors for Human Health Monitoring. J. Adv. Res. 2020, 26, 53–68. [Google Scholar] [CrossRef] [PubMed]
  18. Liu, L.; Zhang, X. A Focused Review on the Flexible Wearable Sensors for Sports: From Kinematics to Physiologies. Micromachines 2022, 13, 1356. [Google Scholar] [CrossRef] [PubMed]
  19. Giovanelli, D.; Farella, E. Force Sensing Resistor and Evaluation of Technology for Wearable Body Pressure Sensing. J. Sens. 2016, 2016, 9391850. [Google Scholar] [CrossRef]
  20. Xu, J.; Pan, J.; Cui, T.; Zhang, S.; Yang, Y.; Ren, T.-L. Recent Progress of Tactile and Force Sensors for Human-Machine Interaction. Sensors 2023, 23, 1868. [Google Scholar] [CrossRef] [PubMed]
  21. Kim, S.H.; Kwon, Y.C.; Kim, K.G.; Cha, Y.S. Estimation of Hand Motion from Piezoelectric Soft Sensor Using Deep Recurrent Network. Appl. Sci. 2020, 10, 2194. [Google Scholar] [CrossRef]
  22. Almassri, A.; Wada, C.; Wan Hasan, W.Z. Evaluation of a Commercial Force Sensor for Real-Time Applications. ICIC Express Lett. 2020, 11, 421–426. [Google Scholar]
  23. Hall, R.S.; Desmoulin, G.T.; Milner, T.E. A Technique for Conditioning and Calibrating Force-Sensing Resistors for Repeatable and Reliable Measurement of Compressive Force. J. Biomech. 2008, 41, 3492–3495. [Google Scholar] [CrossRef] [PubMed]
  24. Leonel, P.-M.; Arnaldo, M.; Jorge, O.B.; Carlos, A.-P.V.; Elkin, I.G.V. Underlying Physics of Conductive Polymer Composites and Force Sensing Resistors (FSRs): A Study on Creep Response and Dynamic Loading. Materials 2017, 10, 1334. [Google Scholar] [CrossRef] [PubMed]
  25. Nacy, S.; Baqer, I.A.; Tawfik, M.A. Static and Dynamic Calibration for FlexiForce Sensor Using a Special Purpose Apparatus. Innov. Syst. Des. Eng. 2013, 4, 2222–2871. [Google Scholar]
  26. Gutierrez Velasquez, E.I.; Gomez, V.I.; Paredes-Madrid, L.; Colorado, H.A. Error Compensation in Force Sensing Resistors. Sens. Bio-Sens. Res. 2019, 26, 100300. [Google Scholar]
  27. Swanson, E.C.; Weathersby, E.J.; Cagle, J.C.; Sanders, J.E. Evaluation of Force Sensing Resistors for the Measurement of Interface Pressures in Lower Limb Prosthetics. J. Biomech. Eng. 2019, 141, 101009. [Google Scholar] [CrossRef]
Figure 1. Schematic diagrams and sensing area of the test FSR sensors. (a) Flexiforce A201-1 and (b) Interlink FSR-402.
Applsci 14 06859 g001
Figure 2. Puck for load testing.
Applsci 14 06859 g002
Figure 3. Voltage divider.
Applsci 14 06859 g003
Figure 4. FSR sensor output measurement circuit diagram.
Applsci 14 06859 g004
Figure 5. Static load characteristic test with loads, Arduino Mega2560, and the FSR sensor.
Applsci 14 06859 g005
Figure 6. The measured voltage as a function of resistance and load. (a) Flexiforce A201-1 and (b) Interlink FSR-402.
Applsci 14 06859 g006
Figure 7. Conductivity load comparison of Flexiforce A201−1 and Interlink FSR−402.
Applsci 14 06859 g007
Figure 8. Conductivity as a function of load. (a) Conductivity as a function of resistor (Flexiforce A201−1), (b) conductivity as a function of the straight line calculated in Table 3 (Flexiforce A201−1), (c) conductivity as a function of resistor (Interlink FSR−402), and (d) conductivity as a function of the straight line calculated in Table 4 (Interlink FSR−402).
Applsci 14 06859 g008aApplsci 14 06859 g008bApplsci 14 06859 g008c
Table 1. Test sensor specifications.
FlexiforceInterlink Electronics
Model no.A201-1FSR-402
Sensor typeThruShunt
Force-sensing range0~4.4 N0.1~10 N
Actuation force-0.1 N
Size 19.53 mm18.28 mm
Sensing area71.29 mm292.32 mm2calculated value
Response time<5 µs
1 indicates the sensor outer diameter in the case of Interlink and the sensing diameter in the case of Flexiforce.
Table 2. Weights for the static load test (M1 class).
Weight Load (g) ± Tolerance (mg)
20 ± 2.550 ± 3100 ± 5200 ± 10300 ± 15
Test load (g)
2050100200300500600700800820850870
Table 3. The equations of straight lines for Flexiforce A201-1 with fixed resistance.
Fixed Resistance (Ω)ConductivityEquation of the Straight LineNote
300 g500 g
1 k 3.912 × 10 5 6.432 × 10 5 y = 1.26 × 10 7 x + 1.32 × 10 6
4.7 k3 . 749 × 10 5 6.608 × 10 5 y = 1.4295 × 10 7 x + 5.935 × 10 6
5.6 k 4.010 × 10 5 6.163 × 10 5 y = 1.0765 × 10 7 x + 7.805 × 10 6
10 k 3.815 × 10 5 6.458 × 10 5 y = 1.3215 × 10 7 x 1.495 × 10 6 Standard
47 k 3.339 × 10 5 5.837 × 10 5 y = 1.249 × 10 7 x 4.08 × 10 6
100 k 3.017 × 10 5 4.974 × 10 5 y = 0.9785 × 10 7 x 0.815 × 10 6
200 k3 . 749 × 10 5 5.154 × 10 5 y = 1.086 × 10 7 x + 3.258 × 10 6
Table 4. The equations of straight lines for Interlink FSR-402 with fixed resistance.
Fixed Resistance (Ω)ConductivityEquation of the Straight LineNote
300 g500 g
1 k 3.750 × 10 4 5.497 × 10 4 y = 8.735 × 10 7 x + 1.1295 × 10 4
4.7 k 3.171 × 10 4 5.121 × 10 4 y = 9.75 × 10 7 x + 0.246 × 10 4
5.6 k 3.530 × 10 4 5.214 × 10 4 y = 8.42 × 10 7 x + 1.004 × 10 4
10 k 3.520 × 10 4 5.070 × 10 4 y = 7 .75  ×   10 7 x + 1.195 × 10 4 Standard
47 k 3.620 × 10 4 5.174 × 10 4 y = 7.77 × 10 7 x + 1.289 × 10 4
100 k 3.357 × 10 4 5.352 × 10 4 y = 9.95 × 10 7 x + 0.372 × 10 4
200 k 2.756 × 10 4 5.137 × 10 4 y = 11.91 × 10 7 x 0.816 × 10 4
Disclaimer/Publisher’s Note: The statements, opinions and data contained in all publications are solely those of the individual author(s) and contributor(s) and not of MDPI and/or the editor(s). MDPI and/or the editor(s) disclaim responsibility for any injury to people or property resulting from any ideas, methods, instructions or products referred to in the content.

