Article

Strength and Ultrasonic Testing of Acrylic Foam Adhesive Tape

Faculty of Civil and Transport Engineering, Institute of Machines and Motor Vehicles, Poznan University of Technology, 60-965 Poznan, Poland
*
Author to whom correspondence should be addressed.
Appl. Sci. 2024, 14(16), 6877; https://doi.org/10.3390/app14166877
Submission received: 16 July 2024 / Revised: 27 July 2024 / Accepted: 5 August 2024 / Published: 6 August 2024

Abstract

:
Adhesive joints are some of the oldest inseparable connections, and were used much earlier than other non-separable connections (e.g., welded, soldered). Adhesives are widely used in the manufacture of vehicles, household appliances, aircraft, and medicine. One disadvantage of adhesive joints is their long bonding time (amounting, for example, to 72 h for polyurethane adhesives used in bus roof bonding), and another is their production of harmful waste. Tapes that are adhesive coated on both sides are increasingly being used to join parts during production. Such tapes have lower strength than traditional adhesives, but their bonding time is much shorter. In addition, the amount of waste remaining after production is minimized. Tapes, like adhesives, dampen vibrations well and seal the materials being joined. The purpose of this study was to evaluate the influence of selected factors on the quality of tape–steel sheet joints and to assess the possibility of testing acrylic tape–steel sheet joints using ultrasonic methods. It was found that the preparation of a surface for bonding has a significant effect on the quality of the joint, and it was confirmed that non-destructive evaluation of the quality of the tested joints by the ultrasonic method is possible. The decibel drop in the height of the first and fifth pulses obtained on the screen of the ultrasonic defectoscope was proposed as an ultrasonic measure. The highest-quality joints were characterized by a measure in the range of 12 dB, lower-quality areas of about 8 dB, and tape-free areas of about 5 dB. At the same time, it was noted that in the case of proper surface preparation, there was cohesive failure of the joint during breakage.

1. Introduction

Adhesive joints are increasingly used in modern industry [1,2,3]. Testing the reliability of technical objects, including joints, is the subject of many articles [4,5,6] and constitutes a major basis for improving manufactured machines and vehicles. A particularly significant share of adhesive joints is observed in the automotive industry [7,8,9]. Other joints used in industry include welded joints [10], spot-welded joints [11], ultrasonic welding [12,13], and soldering [14,15]. Adhesive joints have numerous advantages, the most important of which include the ability to join different materials with uniform stress distribution, high fatigue life, protection against vibration and noise, weight reduction, and no effect on the structure of the material. However, they also have disadvantages, including the relatively long bonding times of adhesives, their limited mechanical and thermal resistance, the need to follow the rules of manufacturing technology (e.g., sanding, degreasing, surface activation, and ensuring proper temperature and humidity), and their negative impacts on the environment and health. Despite these disadvantages, their share of use in bonding in modern industry is steadily growing. A valuable solution that reduces the disadvantages of adhesive bonding to a limited extent, while retaining its advantages, is the use of tapes covered on both sides with tack adhesive. Manufacturers are replacing traditional adhesives with such tapes in many areas, including fixing side panels in buses, fastening covers and lids, and fixing roof sheathing in buses and door sheathing in railroads. At room temperature, the adhesion of such tapes reaches an initial strength of 50 percent of the short-term strength after 20 min, and 85 percent of the mechanical strength is secured after 24 h. In the case of polyurethane adhesives used to fix side wall panels or roof sheathing, these periods are many times longer. To a limited extent, hybrid joints are used, which are characterized by the properties of both adhesive and tape joints.
The purpose of this research was to evaluate the influence of selected factors on the quality of the tape–steel sheet joint and to assess the possibility of testing the acrylic tape–steel sheet joint using the ultrasonic method. In [16], the literature in the area of hybrid joints using structural adhesives was reviewed, highlighting the scope of their application and presenting the latest developments in the field. Section 1 provided an introduction to the main types of adhesives, categorized by their chemical nature: epoxy, polyurethane, acrylic and cyanoacrylic, anaerobic, and high-temperature adhesives. Section 2 outlined the most commonly used hybrid joining (HJ) techniques, including mechanical mounting and bonding, as well as welding and bonding processes. Section 3 discussed the use of adhesives in hybrid joining processes, highlighting their performance, benefits, and drawbacks. Finally, the conclusions and perspectives addressed the critical challenges, future prospects, and ongoing research activities. The study concluded that hybrid bonding technology could be a viable solution in various industries for reducing weight and production costs. Hybrid joints were studied in another paper [17]. The tests conducted confirmed the effectiveness of creating hybrid joints for steel sheets using hybrid adhesives. The average shear force of the adhesive joints was 476 N, whereas for sheet metal clinching joints, it was 965 N, indicating a difference of nearly 500 N. The hybrid joint exhibited significantly higher strength compared to both the adhesive and clinching joints alone. For specimens where the clinching joint was made immediately after forming the adhesive joint, the strength was 312% higher than that of the adhesive joint and 154% higher than that of the clinching joint. The study highlighted the importance of timing in forming the clinching joint, showing that it is preferable to form it immediately after the adhesive bond. This approach increased the mechanical strength by 37%. When splices were made right after the adhesive bonds, the adhesive layer was much thinner. In hybrid joints where clinching was performed after the adhesive joints were fully cured, the adhesive thickness averaged 322 µm, while in specimens where clinching was performed right after forming the adhesive joints, the thickness was about eight times less, at approximately 40 µm.
Joints using tapes are a special type of bonded joint and have been studied from various perspectives. The technology involved in making these connections is just one aspect. Another important aspect is the creep testing of joints, as discussed in the article [18]. This article provides a detailed description of the concept and construction of a stand for cyclic creep testing of joints using straps. The stand was designed to test various joints, including lap joints, using pressure-sensitive adhesives (PSAs). Tests were conducted under different stresses and temperatures. The stand featured a mechanism that periodically applied a hanging weight, thereby subjecting the bonded joint to varying loads. After validation, preliminary results were presented. The study confirmed that the developed test stand was effective in characterizing the behavior of PSA under cyclic loading.
Research on the design and manufacture of adhesive bonding was conducted in the study [19]. This study confirmed that adhesive bonding can be considered a viable alternative to traditional bonding methods due to its numerous advantages. Adhesive joints are used in lightweight composite structures because of their uniform stress distribution, low cost, ease of bonding, and other benefits. As lightweight and composite structures find applications in the aerospace and automotive industries, their popularity is increasing, enabling the production of lighter, safer, and more efficient vehicles. The strength of adhesive methods and the influence of parameters such as adhesive composition, surface pretreatment methods, surface preparation materials, adhesive placement procedures, tooling, and curing processes were explained in detail in the aforementioned study. A comparison between metal-to-metal and metal-to-composite adhesive bonds showed that adhesive bond strength is superior for heterogeneous substrates compared to similar substrates (metals and composites) due to unbalanced stiffness. The mixed adhesive system shows promise for maintaining manufacturing tolerances. This research is particularly important because the joining of composite materials is often accomplished with adhesives. The study confirmed that many car components are joined using permanent or temporary fasteners, such as rivets, welded joints, and glued joints. The increased use of bonded structures is expected to reduce the number of fasteners and riveted joints, thereby significantly reducing assembly costs.
Adhesive bonding has been successfully applied in many technologies. This article reviews and discusses scientific papers on adhesive-bonded composites and hybrid composites. Several parameters, such as surface treatment, joint configuration, material properties, geometric parameters, and failure modes, that affect the performance of bonded joints are discussed. Environmental factors, such as humidity and temperature before bonding, as well as the method of adhesive application, are also detailed. The specific case of bonded joints in hybrid bolted joints is examined. As new applications in the field of composite and adhesive bonding expand, it is necessary to utilize information on various adhesives and their behavior under different environmental conditions to develop improved adhesive joint structures for mechanical applications.
In terms of the work carried out, significant research was presented in publication [20], where the authors examined the use of VHB straps for mounting photovoltaic cells. It was discovered that mechanical fasteners created punctures in the waterproof layer of the roof, while ballasted footing fasteners added significant additional weight to the roof support structure. Therefore, adhesive bonding emerged as a favorable alternative. Acrylic adhesive tapes, specifically VHBTM tapes, offer sufficient strength without the need for mechanical fasteners or ballasts. These tapes also facilitate a convenient, fast, and efficient bonding process, as they do not require curing, unlike liquid adhesives. However, the water resistance of load-bearing joints has not been sufficiently studied and may be crucial for joints exposed to external environments. This study aims to determine the water resistance and durability of GPH-series VHBTM tapes, which are commonly used to bond various substrates, including many metals. The mechanical properties and failure modes of the samples were compared before and after a 21-day immersion in water. A significant decrease in strength was observed depending on the substrate material. Examination of the chemical changes in the acrylic tape and its leachate by means of infrared spectroscopy (FT-IR), X-ray fluorescence, and X-ray diffraction analysis explained the reduction in mechanical properties. The selected VHBTM tape showed high water resistance. However, the overall bond strength after immersion was significantly affected by a decrease in adhesion to the specified substrate.
The water resistance of the acrylic adhesive tape GPH-110GF was investigated to quantify the reduction in bond strength when water was applied to the adhesive bond. The tensile samples showed an average tensile strength of 0.13 MPa for the longitudinal system and 0.19 MPa for the longitudinal system. The average shear strength of the reference joint was determined to be 0.47 MPa for all tested substrates and 0.30 MPa for all tested substrates after immersion. Chemical analyses showed only minor changes in the chemical structure of the adhesive. After shear strength and shear modulus reduction analyses, it was shown that the smooth-surfaced samples had reduced shear strength by more than 39% due to poor interfacing between the adhesive tape and the substrate.
Tapes are also used in construction, and research has also been conducted in this area. The purpose of the work [21] was to evaluate the airtightness of various building surfaces and adhesive tape systems by carrying out artificial aging. It was found that self-adhesive tapes based on acrylic adhesive provide full system tightness. In all cases, tapes applied to surfaces such as plywood, gypsum board, cement board, plastered cement board, and plastic board provided sufficient sealing.
The non-destructive evaluation of adhesive joints, especially those used in automotive applications, is a significant concern. By the end of the last century, R.D. Adams [22] had proposed various non-destructive methods for assessing adhesive joints. According to his research, the ultrasonic method provides a fairly good understanding of the properties of an adhesive joint. The quality of adhesive joints, examined using non-destructive methods, was also studied in [23]. In this study, three different composite-adhesive joints were examined. An immersion ultrasonic method and induction thermography were used. The researchers increased the efficiency of defect localization by using data fusion. The induction thermography method is very good at detecting defects related to current conduction. However, it cannot detect defects through which no current is flowing. Ultrasonic testing is far better at detecting inclusions of release film. Brass inclusions are more effectively detected by induction thermography.
Different variants of bonded materials have been studied. In one study [24], the effect of adhesive distribution across the overlap area in bonded joints was examined. Incorrect adhesive application during manufacturing can lead to improper adhesive distribution. Three adhesive sizes and two shapes (circular and elliptical) with two orientations were investigated. Overlap shear strength tests showed that adhesive distribution along the transverse direction to the applied load affects joint strength. Specimens with complete adhesive coverage in the transverse direction, specifically circular and elliptical shapes with one axis length equal to the weld width, showed higher lap shear strength. The elliptical shape with the main axis oriented along the load direction had the lowest strength despite the same coverage area. Ultrasonic scanning was used to identify adhesive distribution shapes in the overlap area. Comparing damaged specimens after shear tests revealed a correlation between the shapes identified by ultrasonic C-scans. These scan images can provide bond geometry data for generating three-dimensional adhesive distribution models for finite element analysis. Ultrasonic testing was also conducted in the study [25]. In this study, aluminum single-lap adhesive joints were tested in pulse-echo mode. The joints contained defects. The goal of the study was to increase the probability of detecting defects and to estimate their size. The authors identified the ultrasonic features most suitable for detecting different types of defects. Subsequently, a comparative analysis was performed, which revealed that determining the size of inclusion-type defects is more challenging compared to delamination. The proposed method showed the highest performance for features such as inter-peak amplitude, aspect ratios, absolute energy, absolute transition time, average amplitude, standard deviation, and coefficient of variation for both types of defects. The maximum relative error in defect size compared to the actual size was 16.9% for inclusions and 3.6% for delamination, with minimum errors of 11.4% and 2.2%, respectively. It was noted that analyzing data from repeated reflections, especially the second and third reflections, increased the probability of detecting a defect.

2. Research

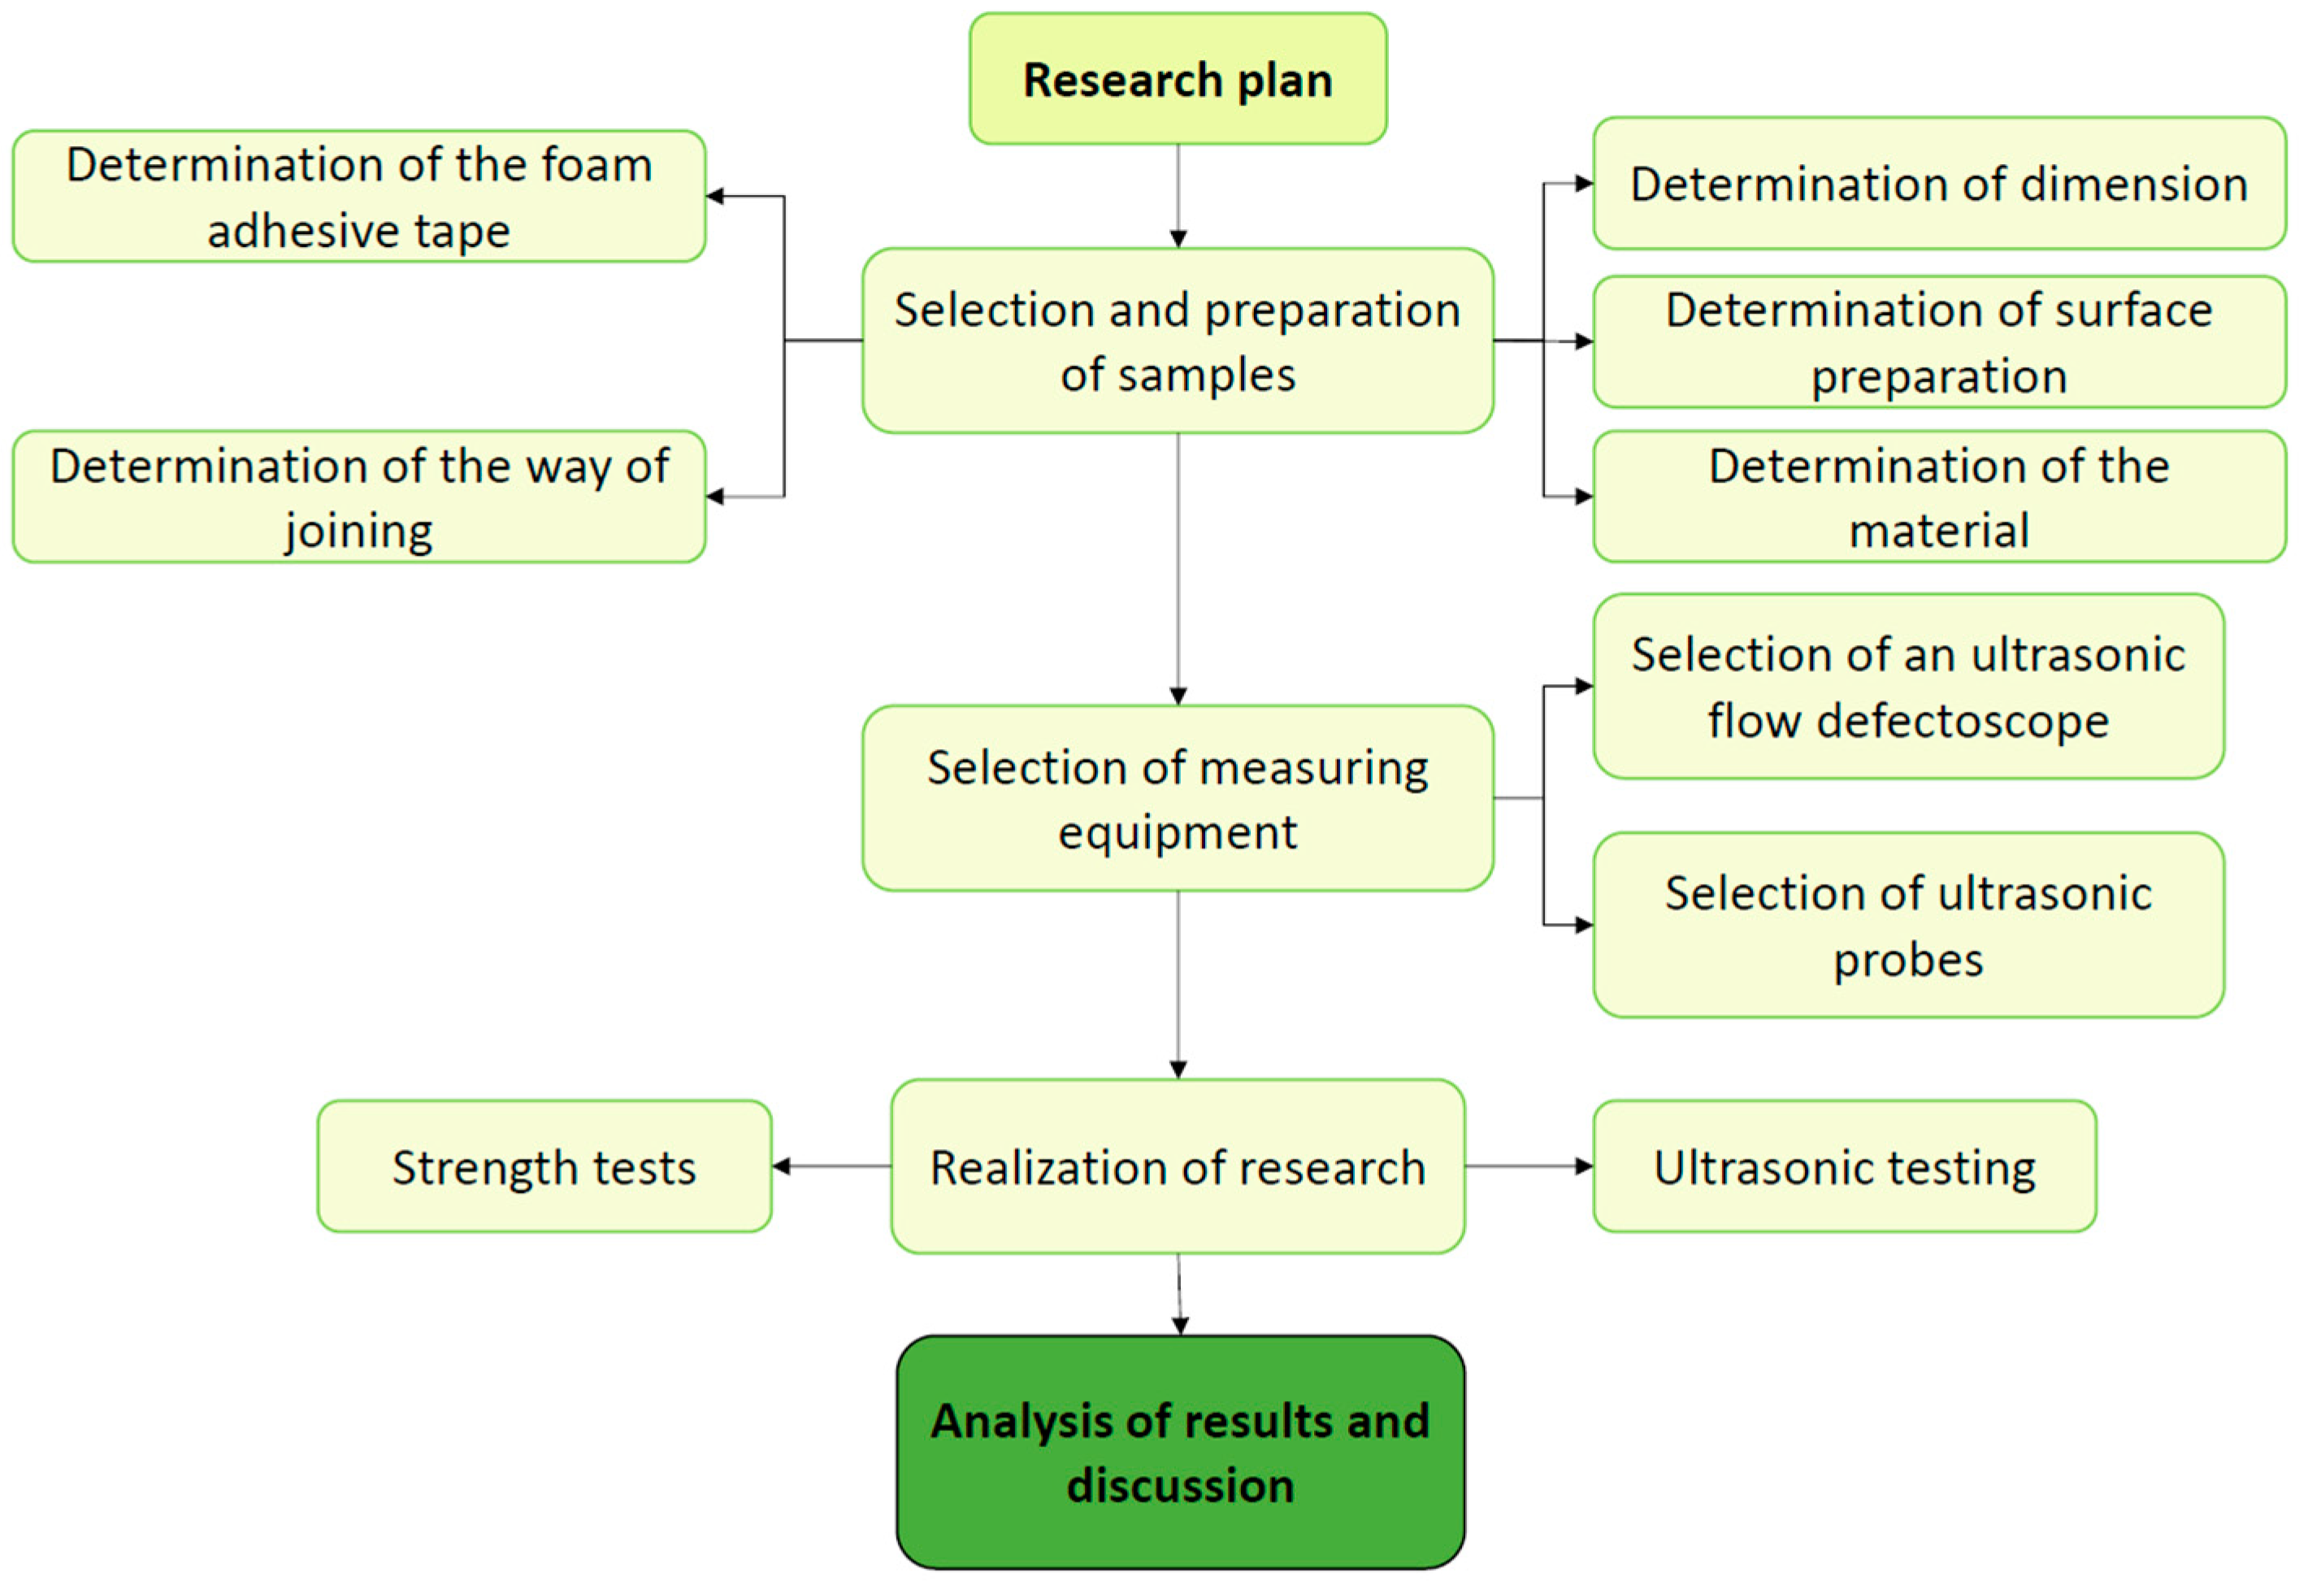
2.1. Research Procedure

The present experiment consisted of testing the quality of adhesive joints on a testing machine and using an ultrasonic defectoscope. An industrial digital defectoscope and a high-frequency ultrasonic head were used for this study. The method of preparing the surface for testing and the method of making the joint were varied. In this study, all of the test work was carried out based on the test procedure shown in Figure 1.

2.2. Materials and Methods

In the first stage of the experiment, samples were selected for testing. The tests conducted reflected production conditions. An analysis of the use of double-sided adhesive-coated tapes was carried out, and it was noted that they are most often used for joining parts made of thin sheets. Therefore, it was decided to use the zinc-coated steel sheet DC01 in the study. Table 1 shows the chemical composition of the DC01 sheet used. The surface of the sheet was degreased with isopropanol before the adhesive was applied, and its most important roughness parameters were, on average, Ra = 0.49 µm and Rz = 2.6 µm. Measurements were made in accordance with the EN ISO 4287 [26] and EN ISO 4288 [27] standards.
Since acrylic strips are used to join thin sheets, a 1 mm thick sheet was chosen for testing, which means that the sheet was susceptible to deformation, and the loads on the testing machine of the joint were close to shear. It was assumed that the specimens would be overlapped, and the length of the sheet metal strips would be 150 mm. A 1.6 mm thick acrylic foam adhesive was chosen, one that not only bonded, but also sealed and dampened vibrations. The strips were available in 6, 9, 12, 15, 19, 25, 50 and 210 × 197 mm format sheets. Based on previous research, a 19 mm wide tape was selected for this work, and the width of the sheet strips was 20 mm. Acrylic tape, VHB with a thickness of 1.6 mm was selected for the test, which according to the manufacturer, has high mechanical, thermal, and chemical resistance. A drawing showing the dimensions of the sample is shown in Figure 2.
The metal sheets were divided into three groups, with twenty samples in each group. In the first, the surface was properly prepared, and the joined sheets were pressed according to the technology recommended by the manufacturer. In the second group, the surface was also prepared according to the rules, but the joined sheets were not pressed. In the third group of samples, the surface was not prepared in any way and the sheets were pressed correctly.

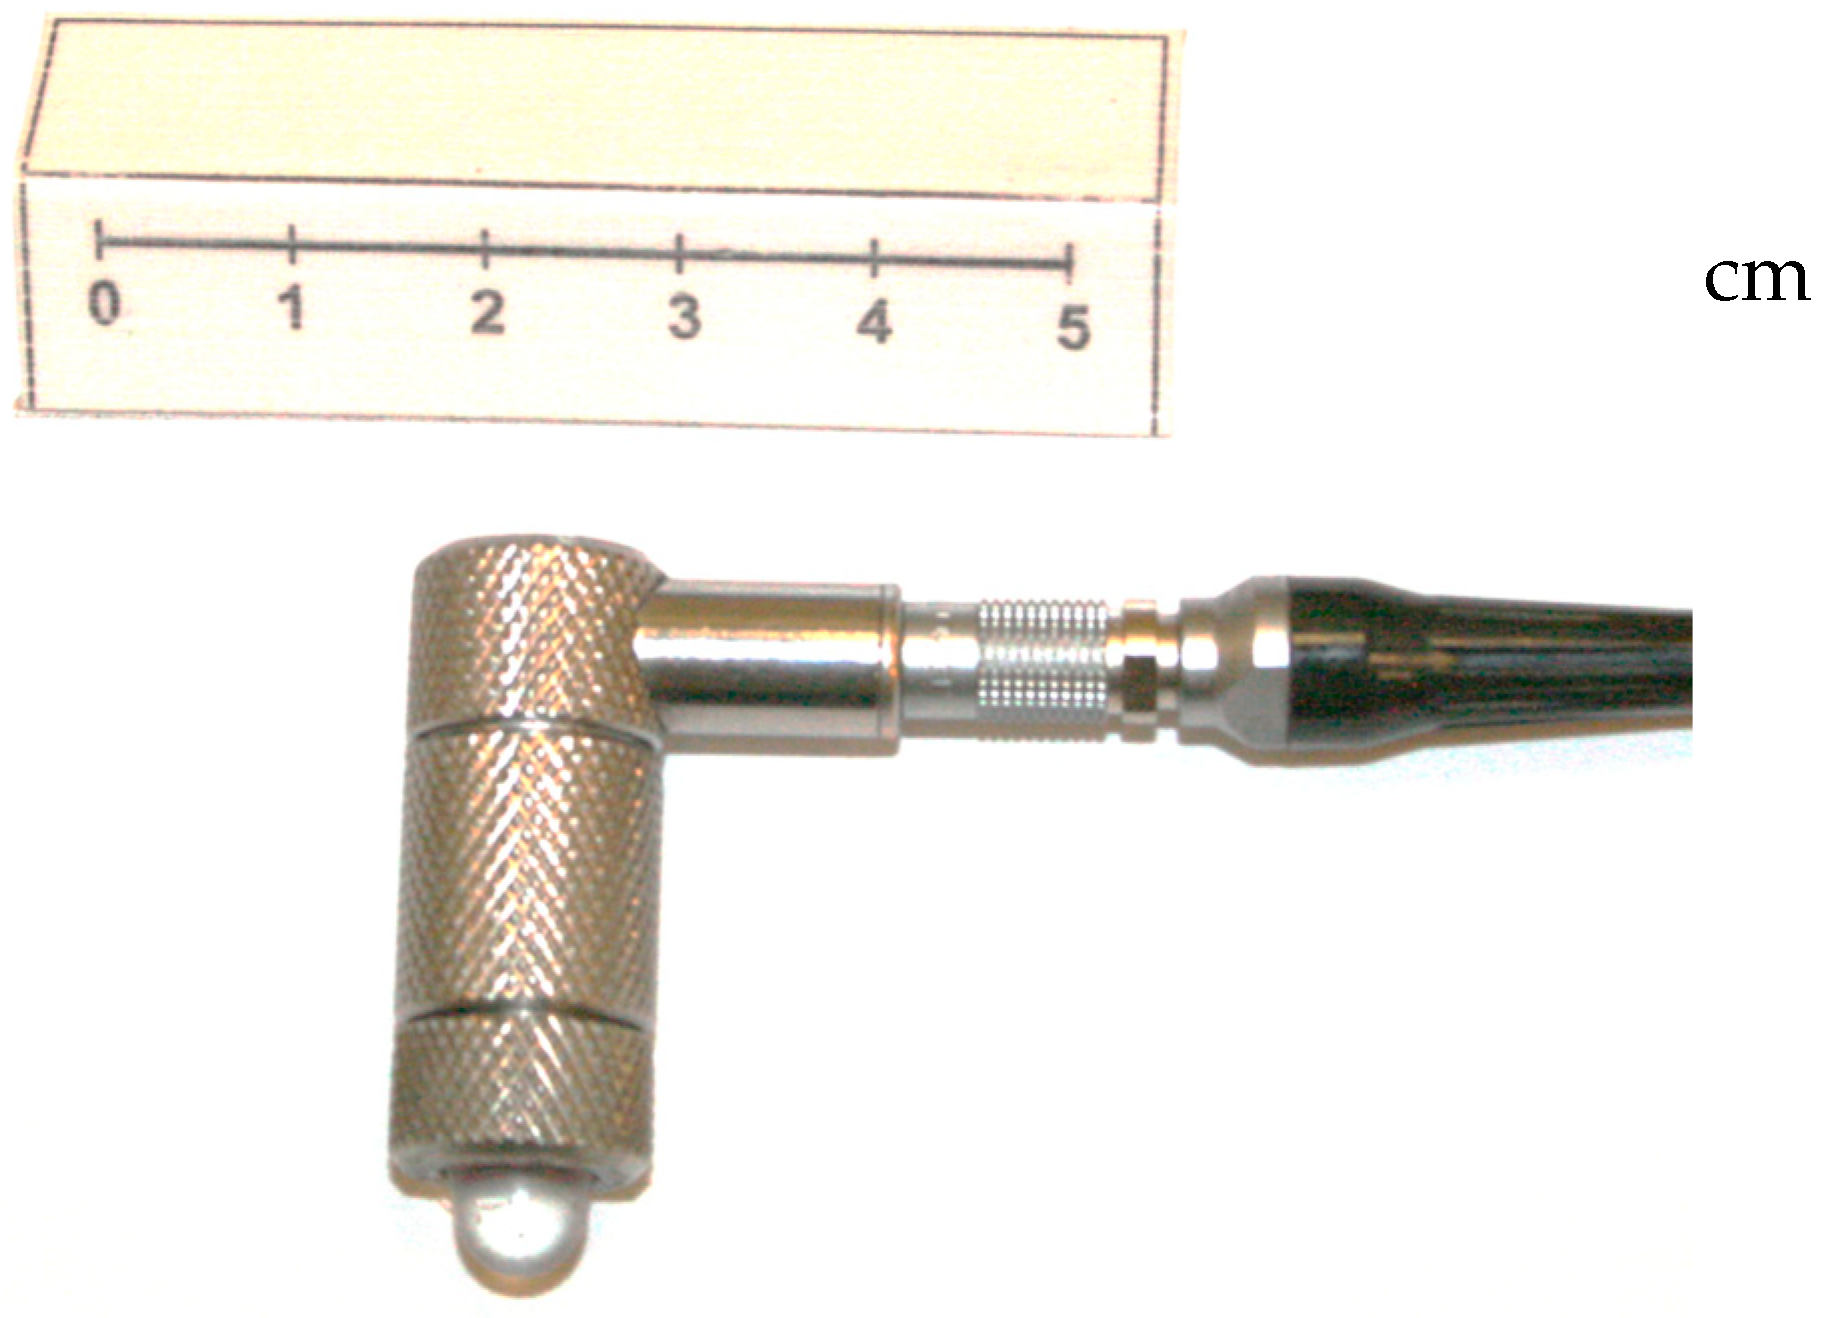
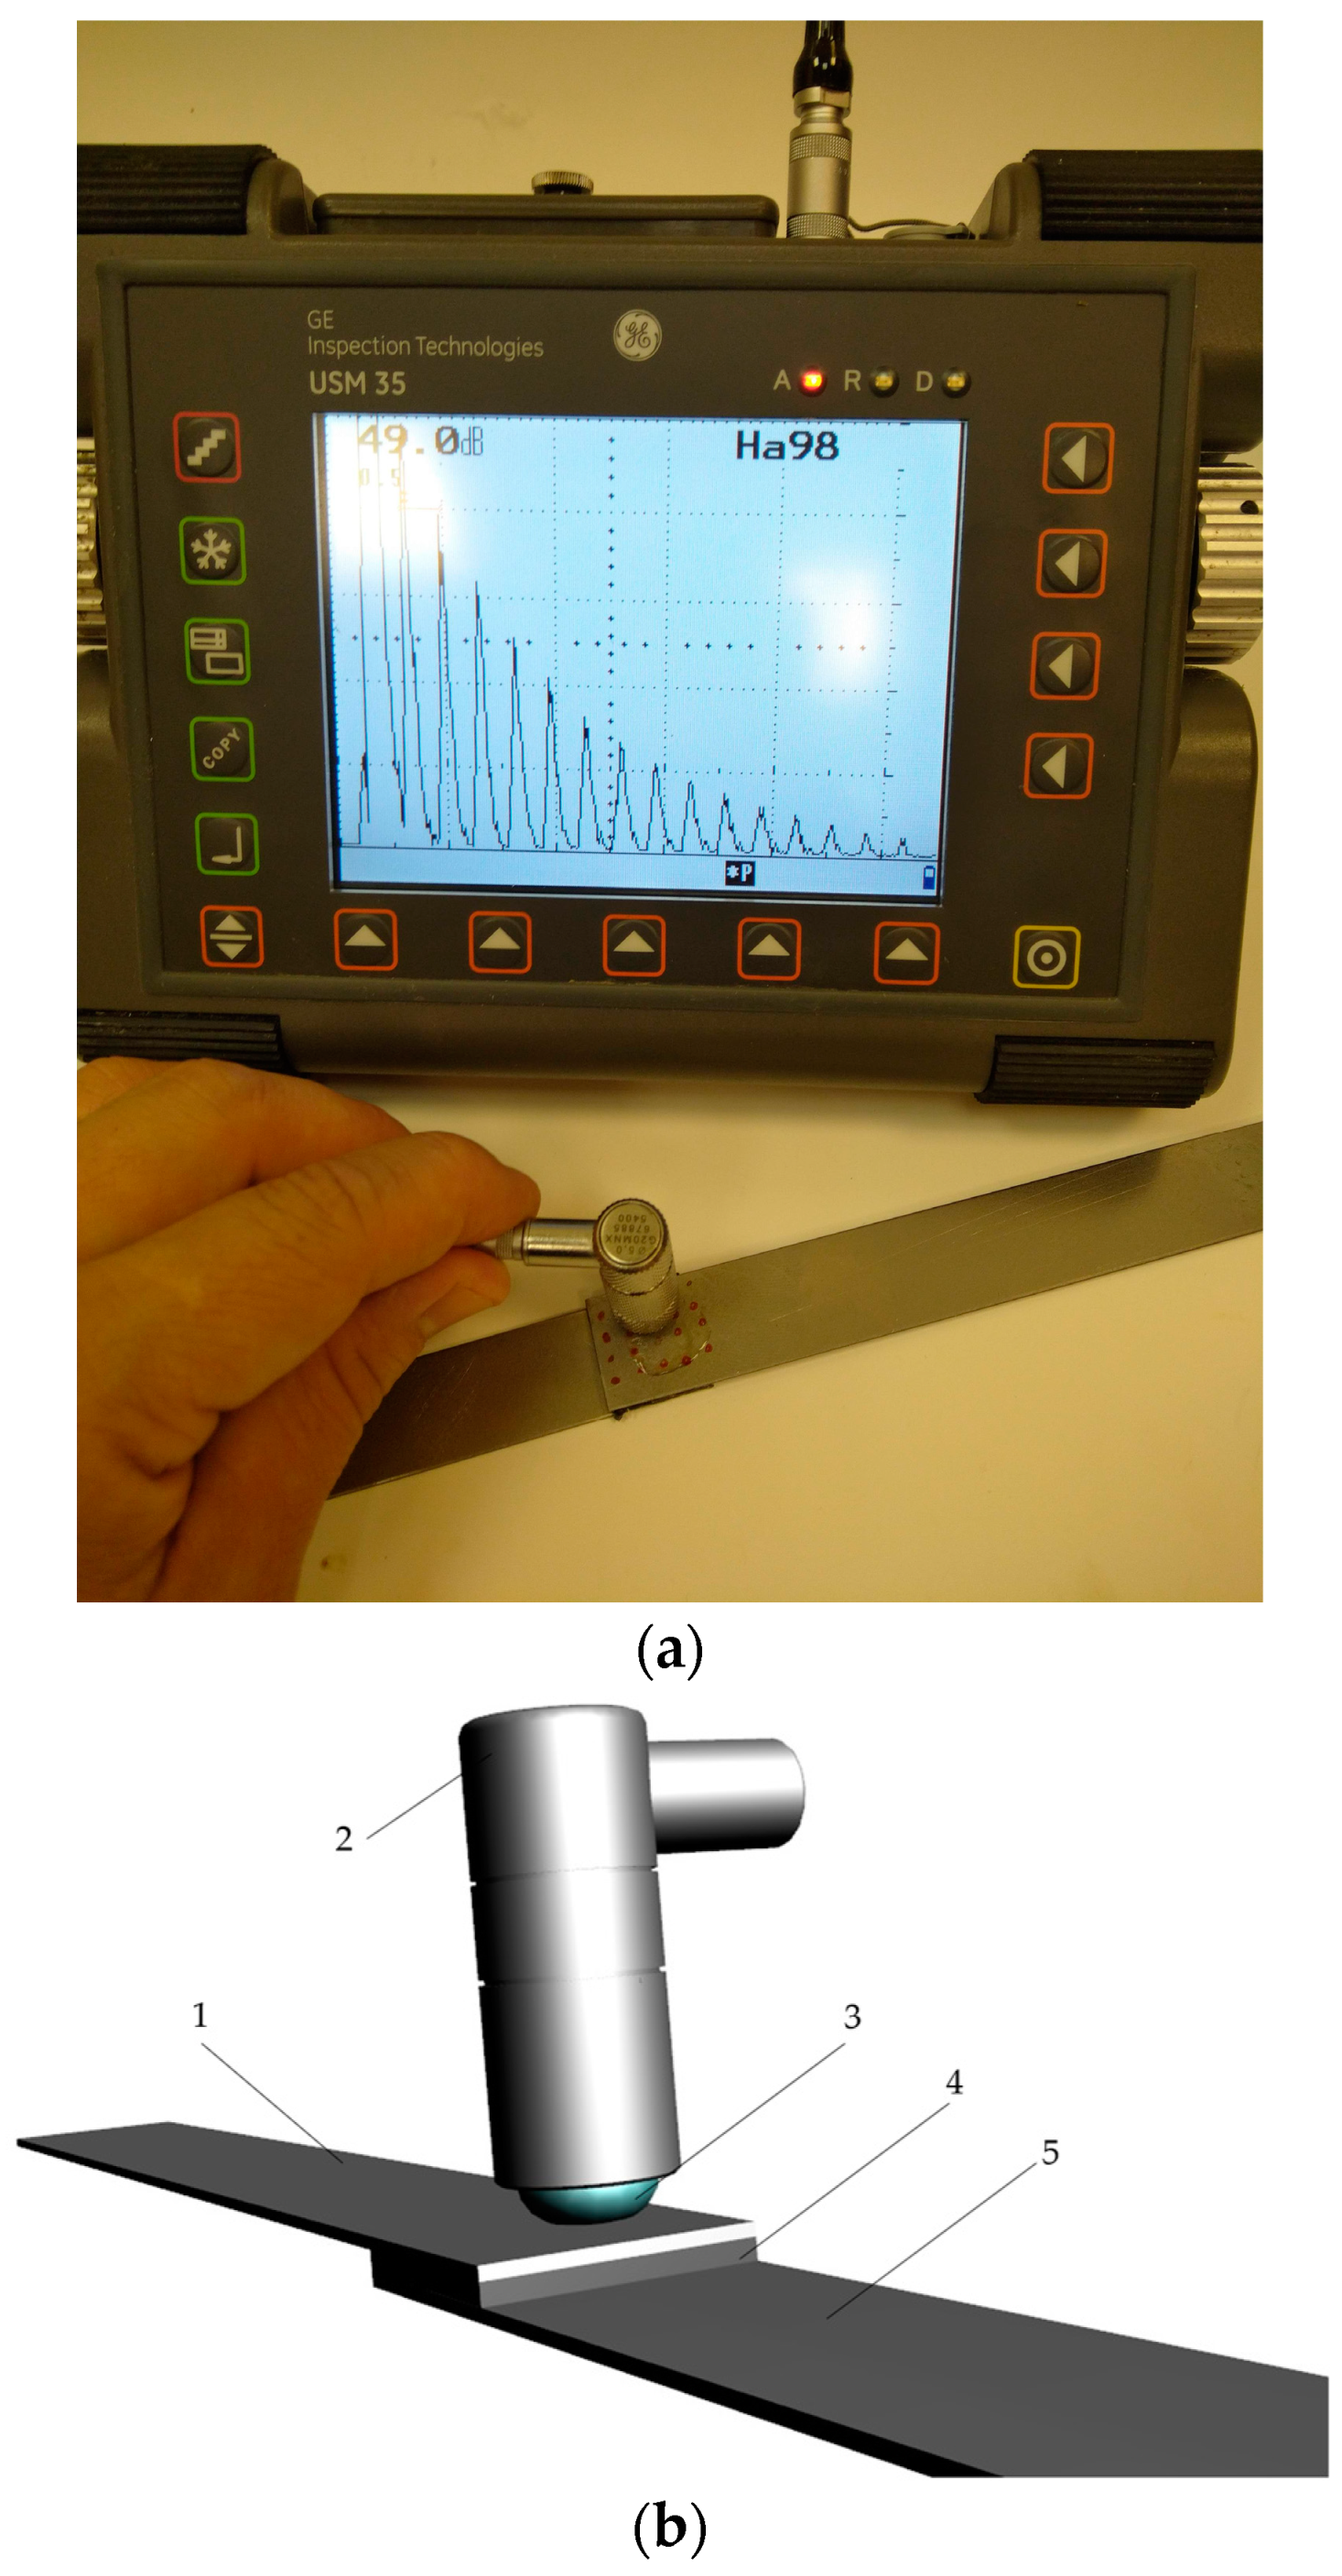
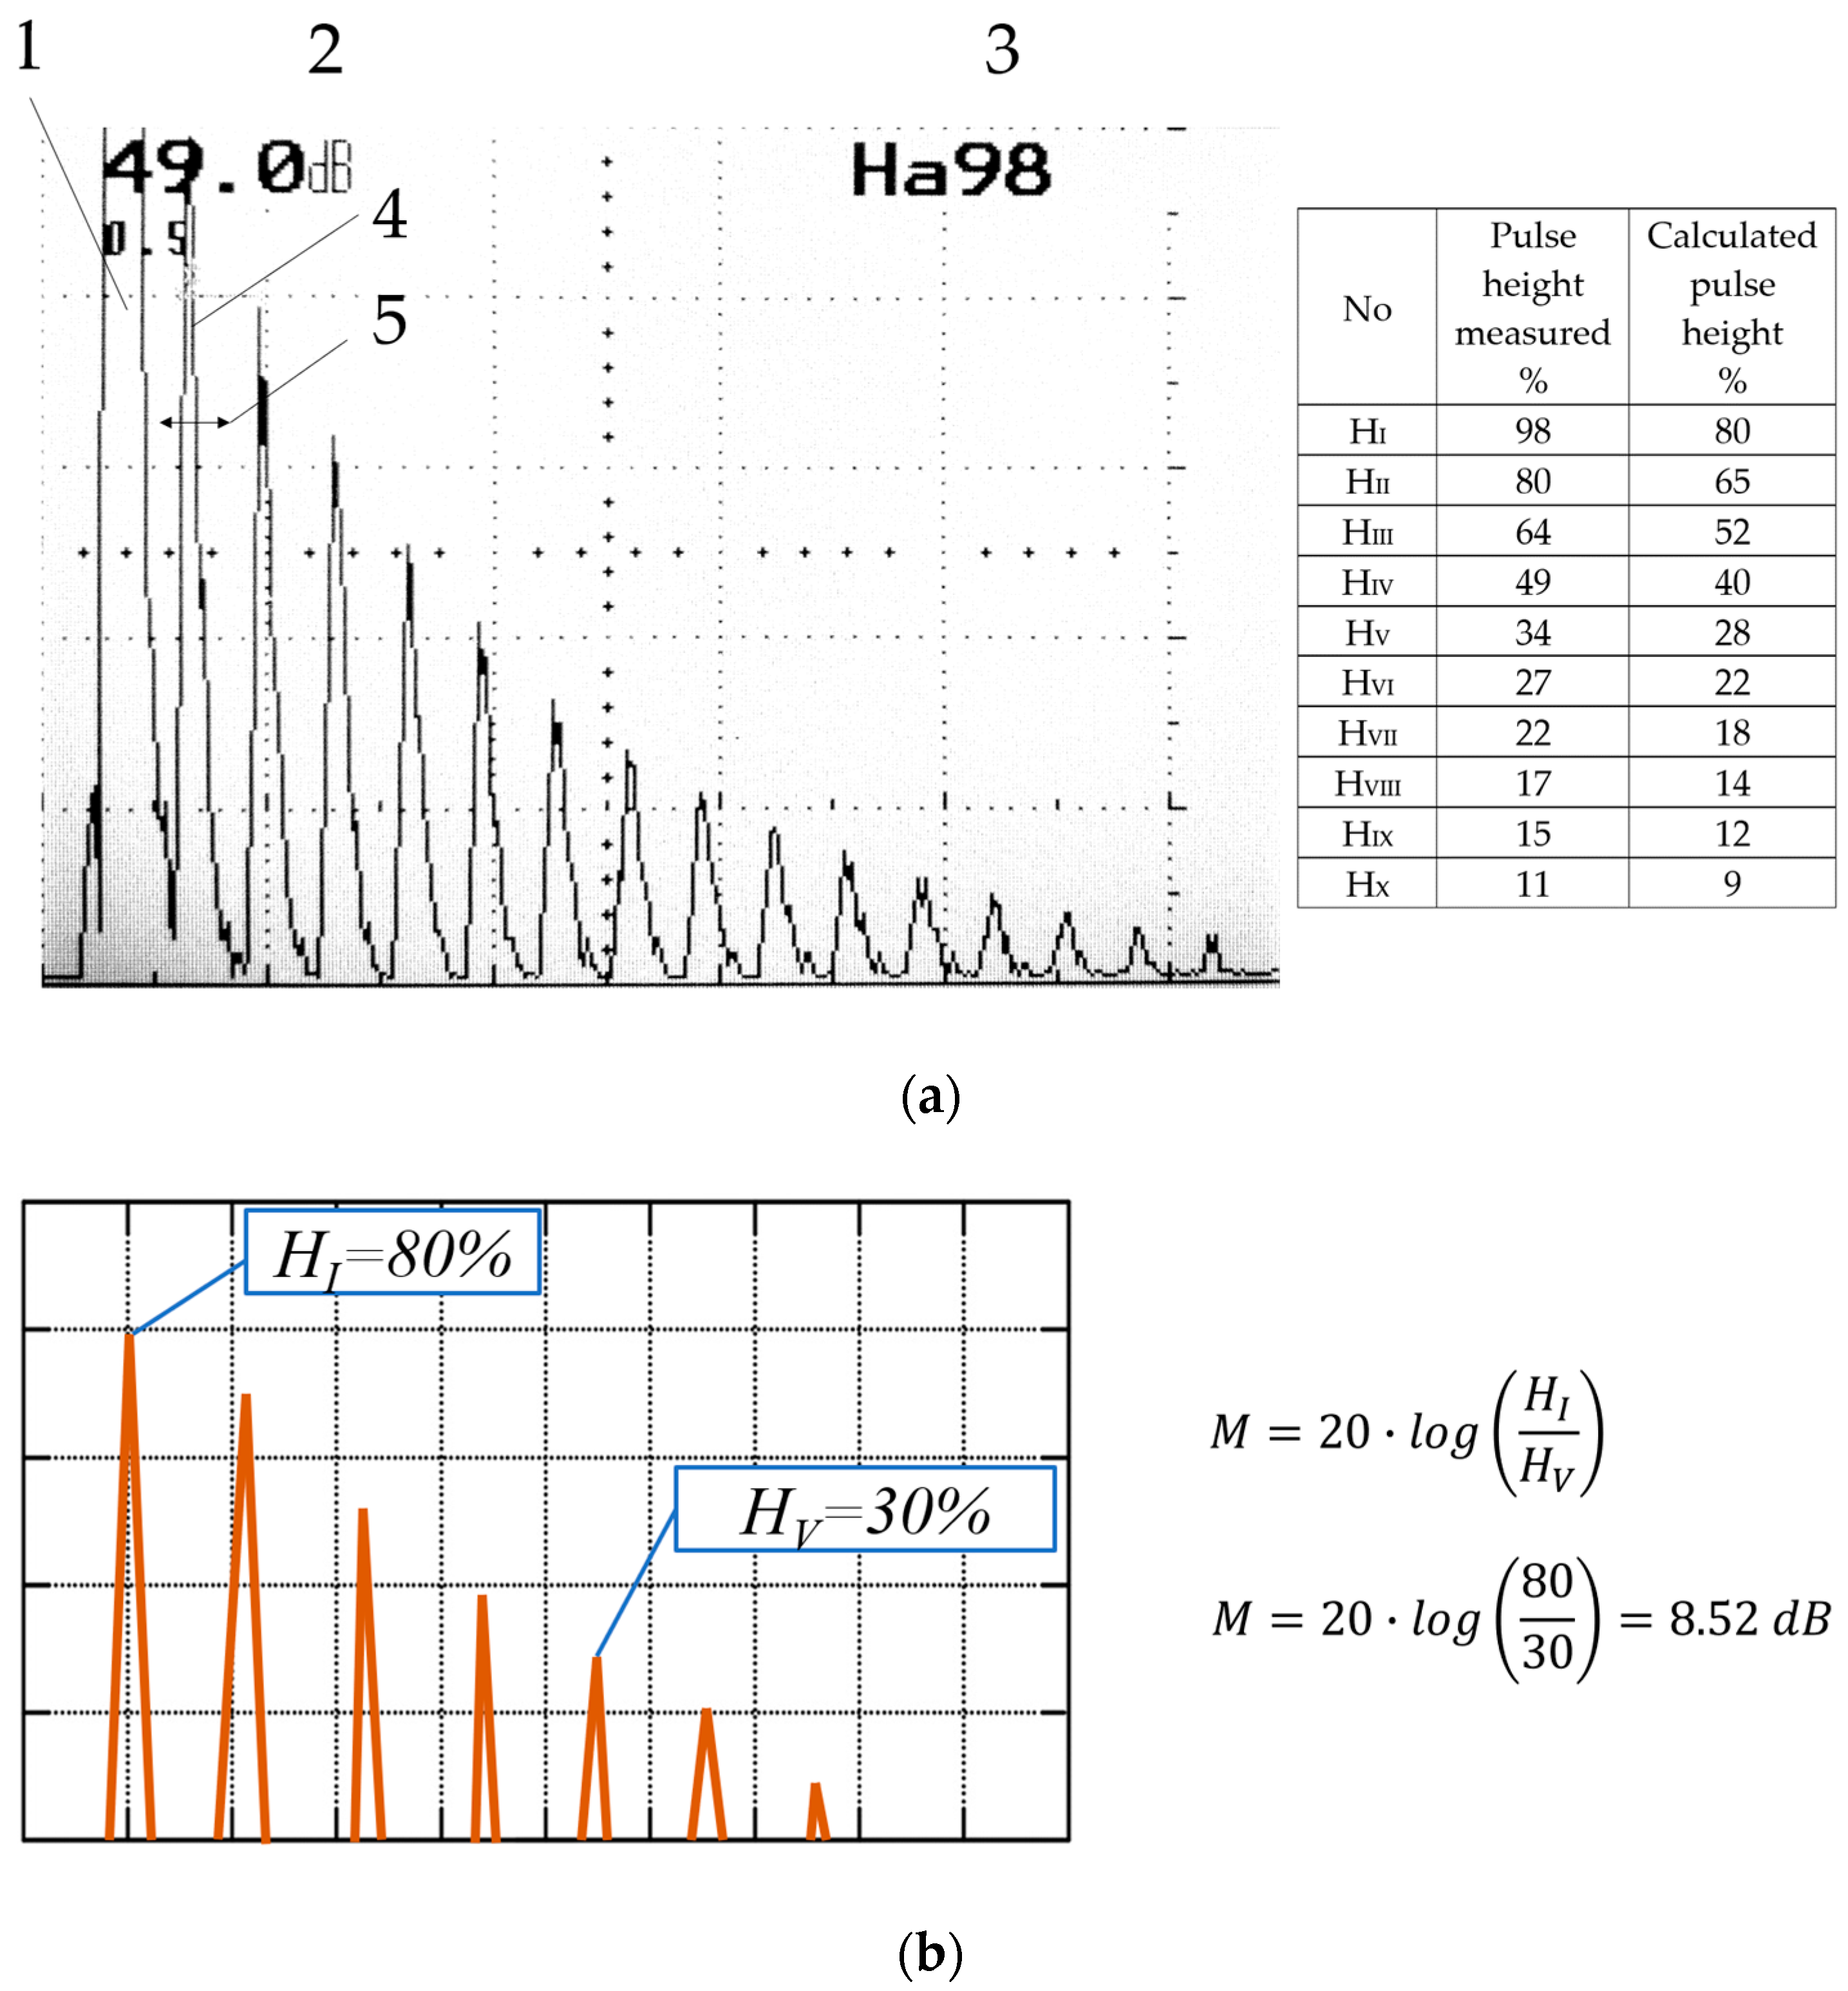
2.3. Ultrasonic Apparatus
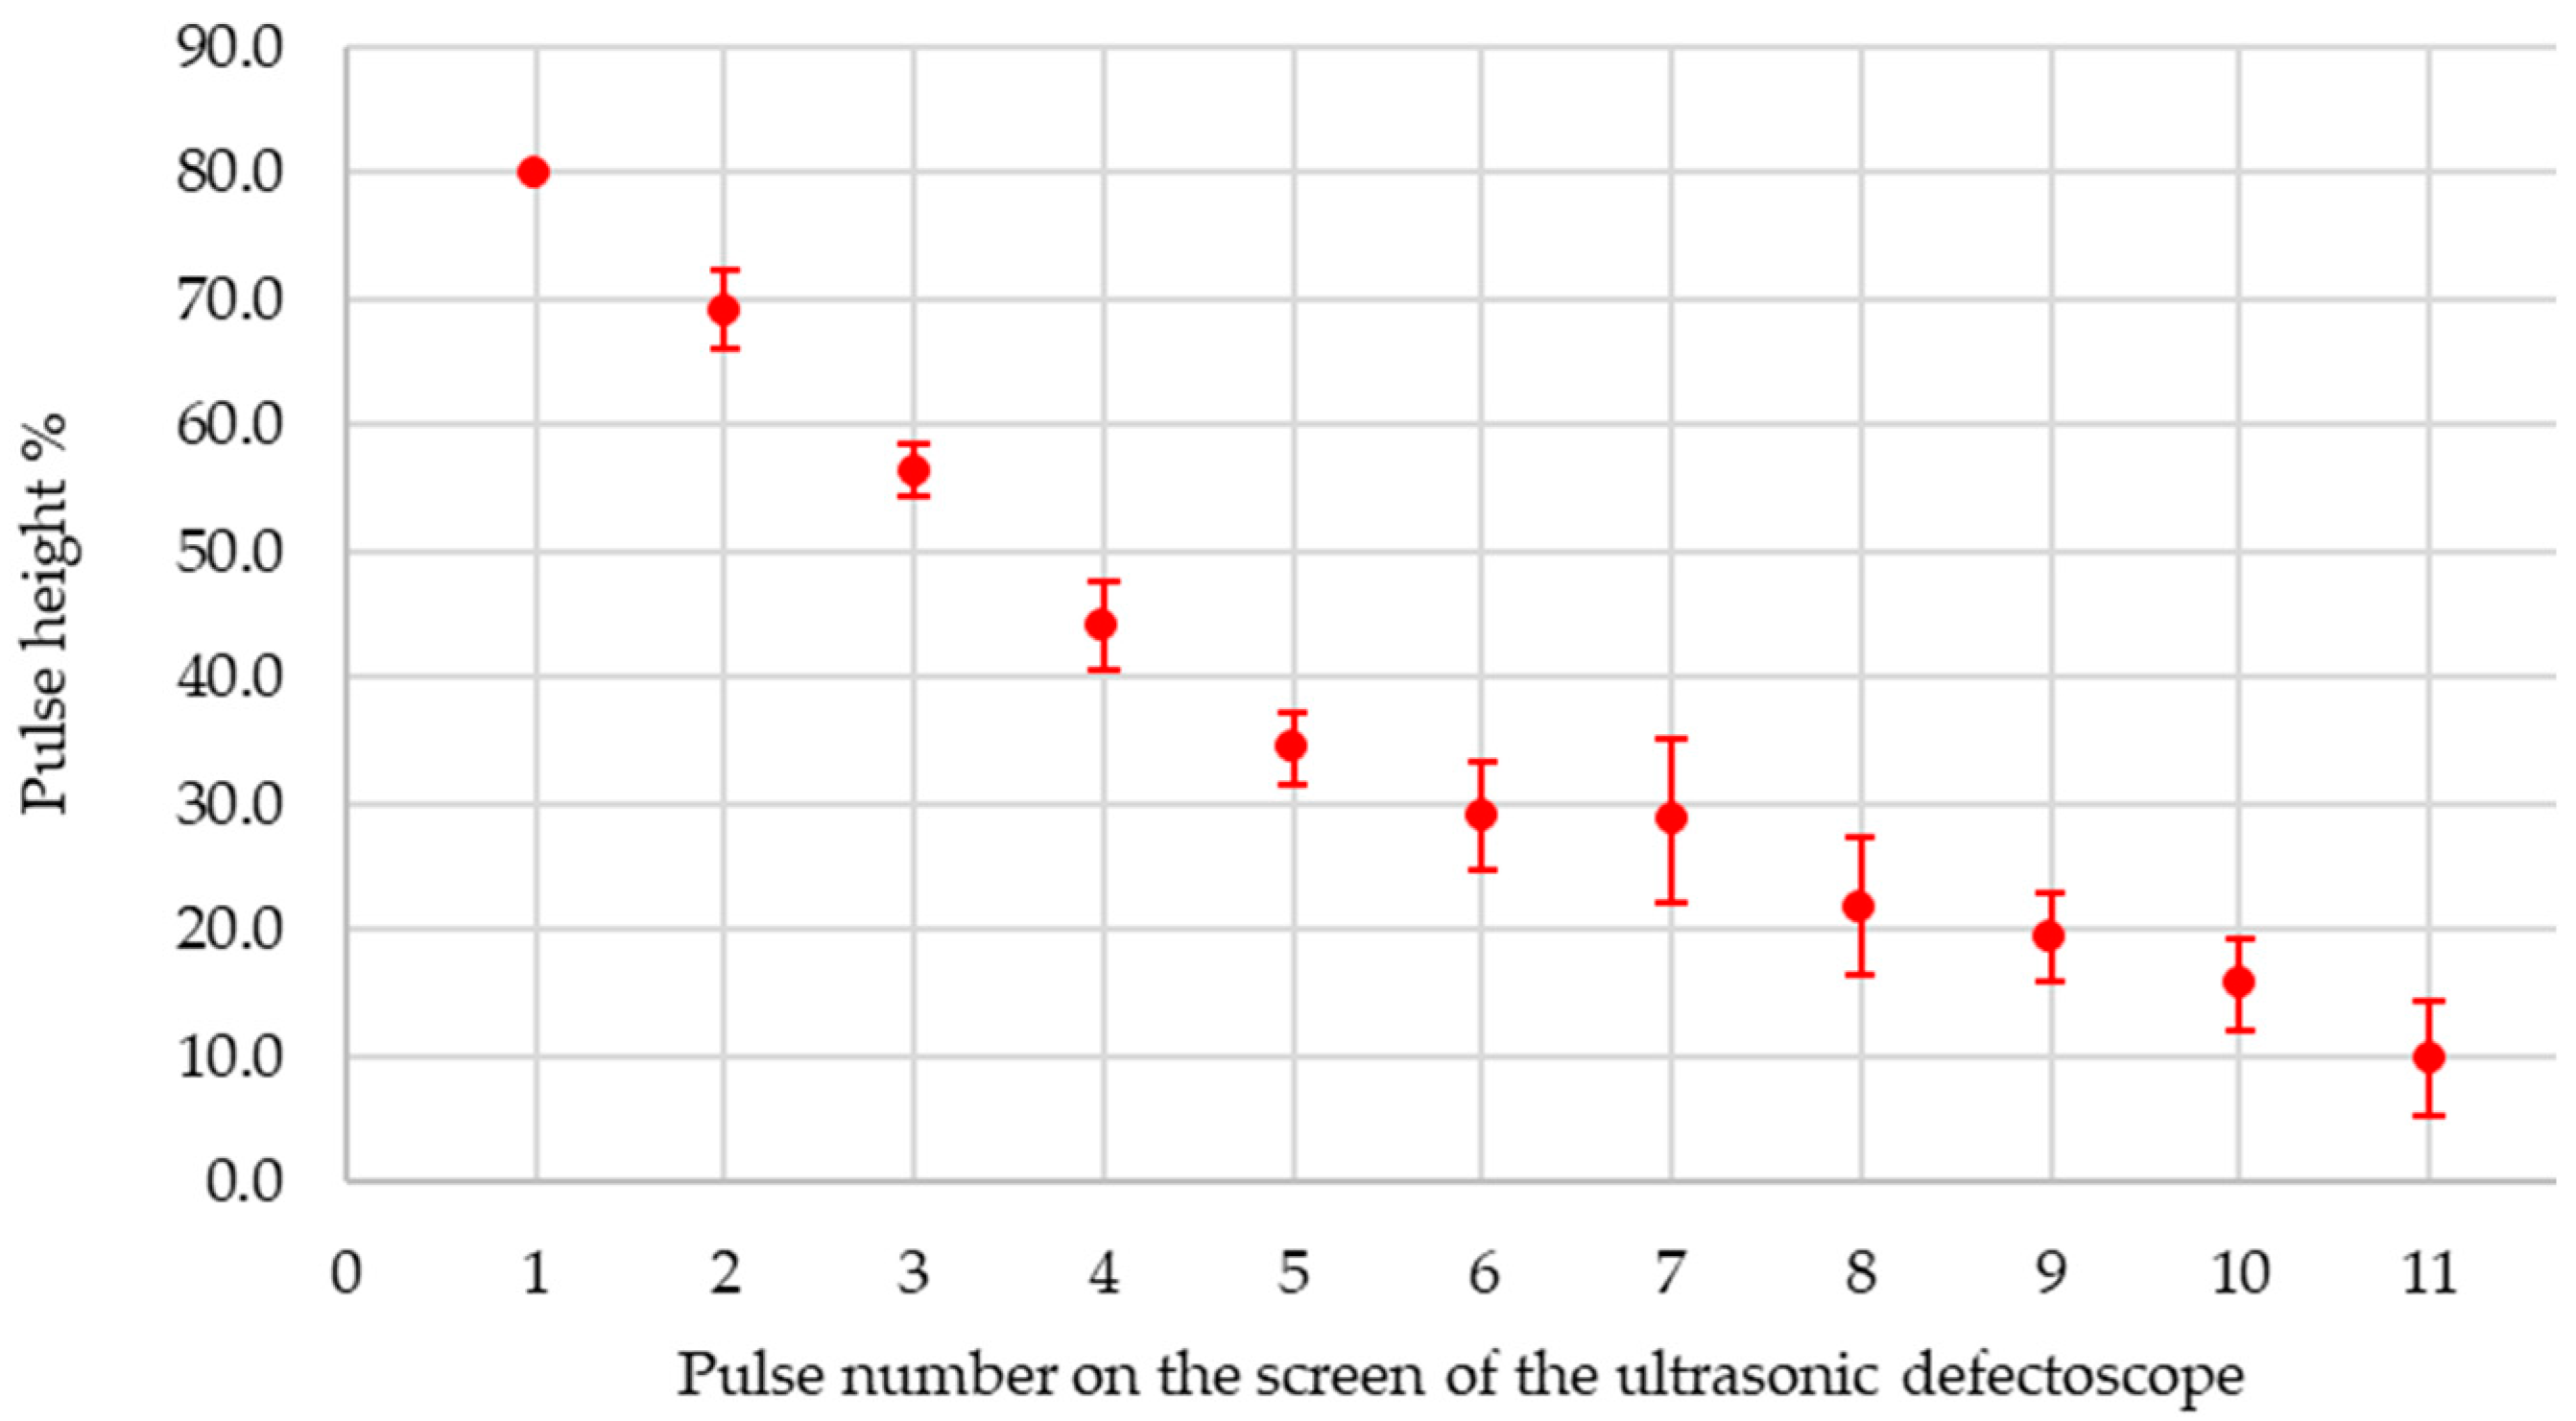
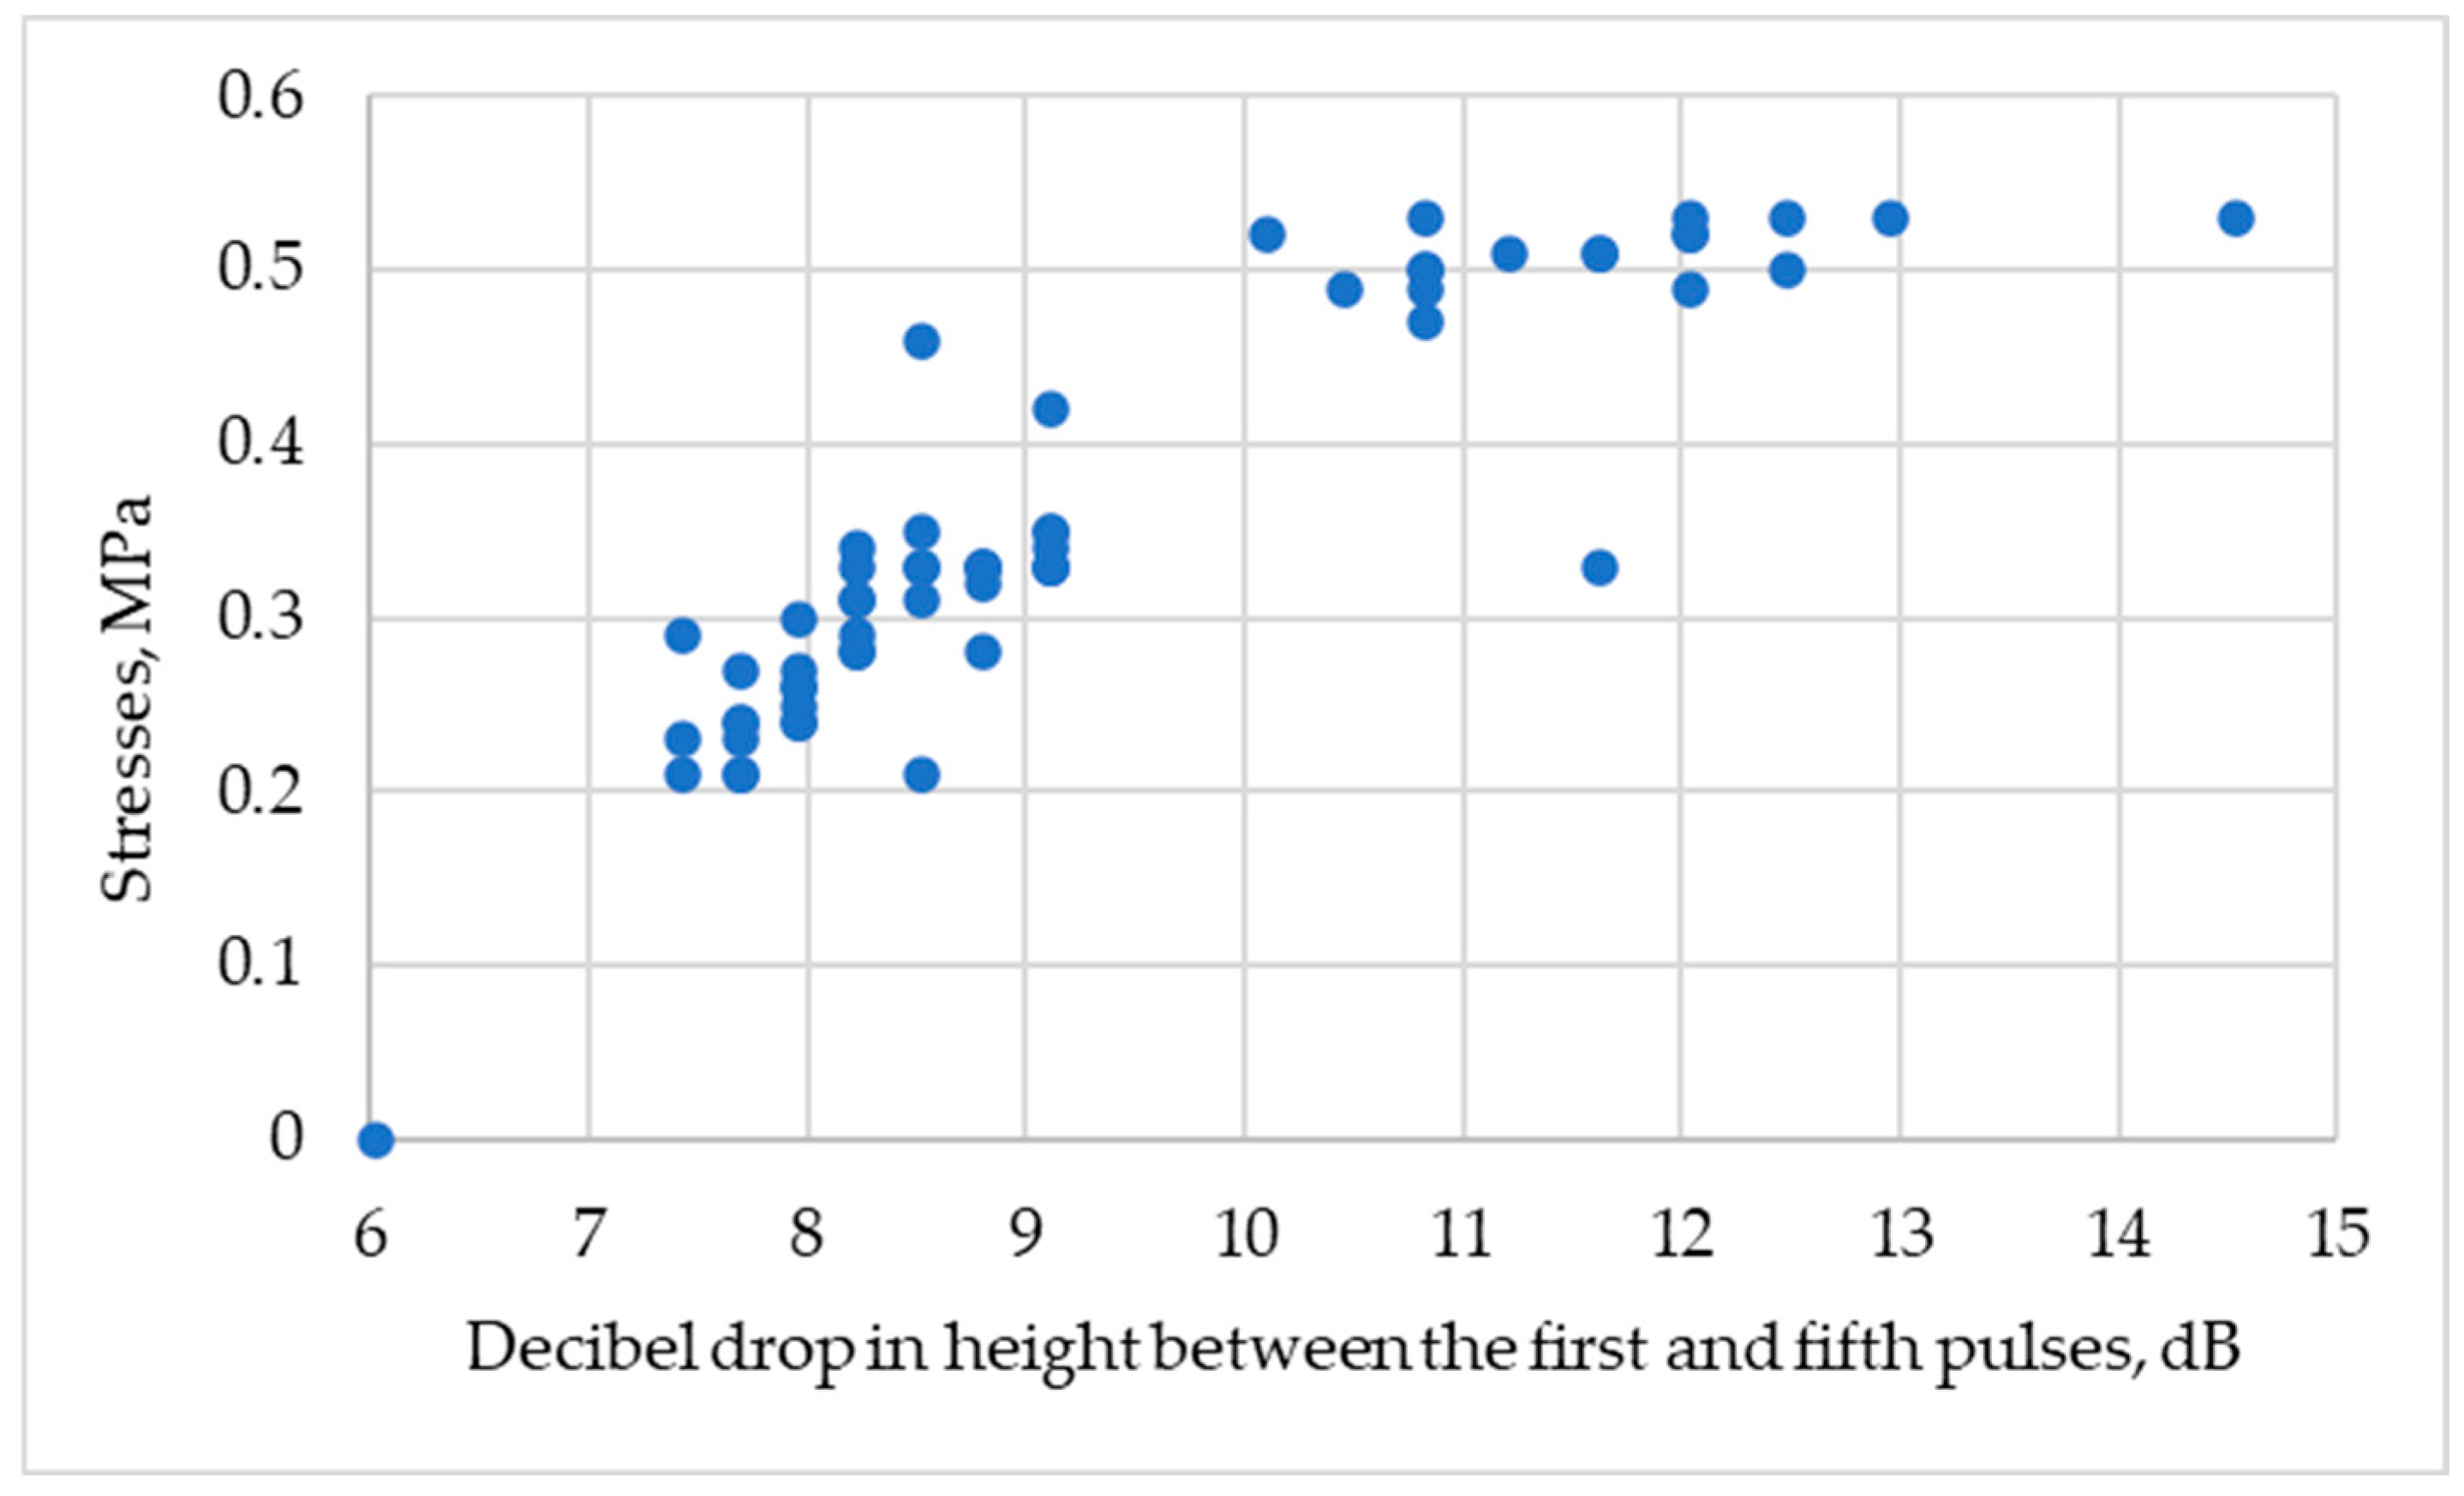
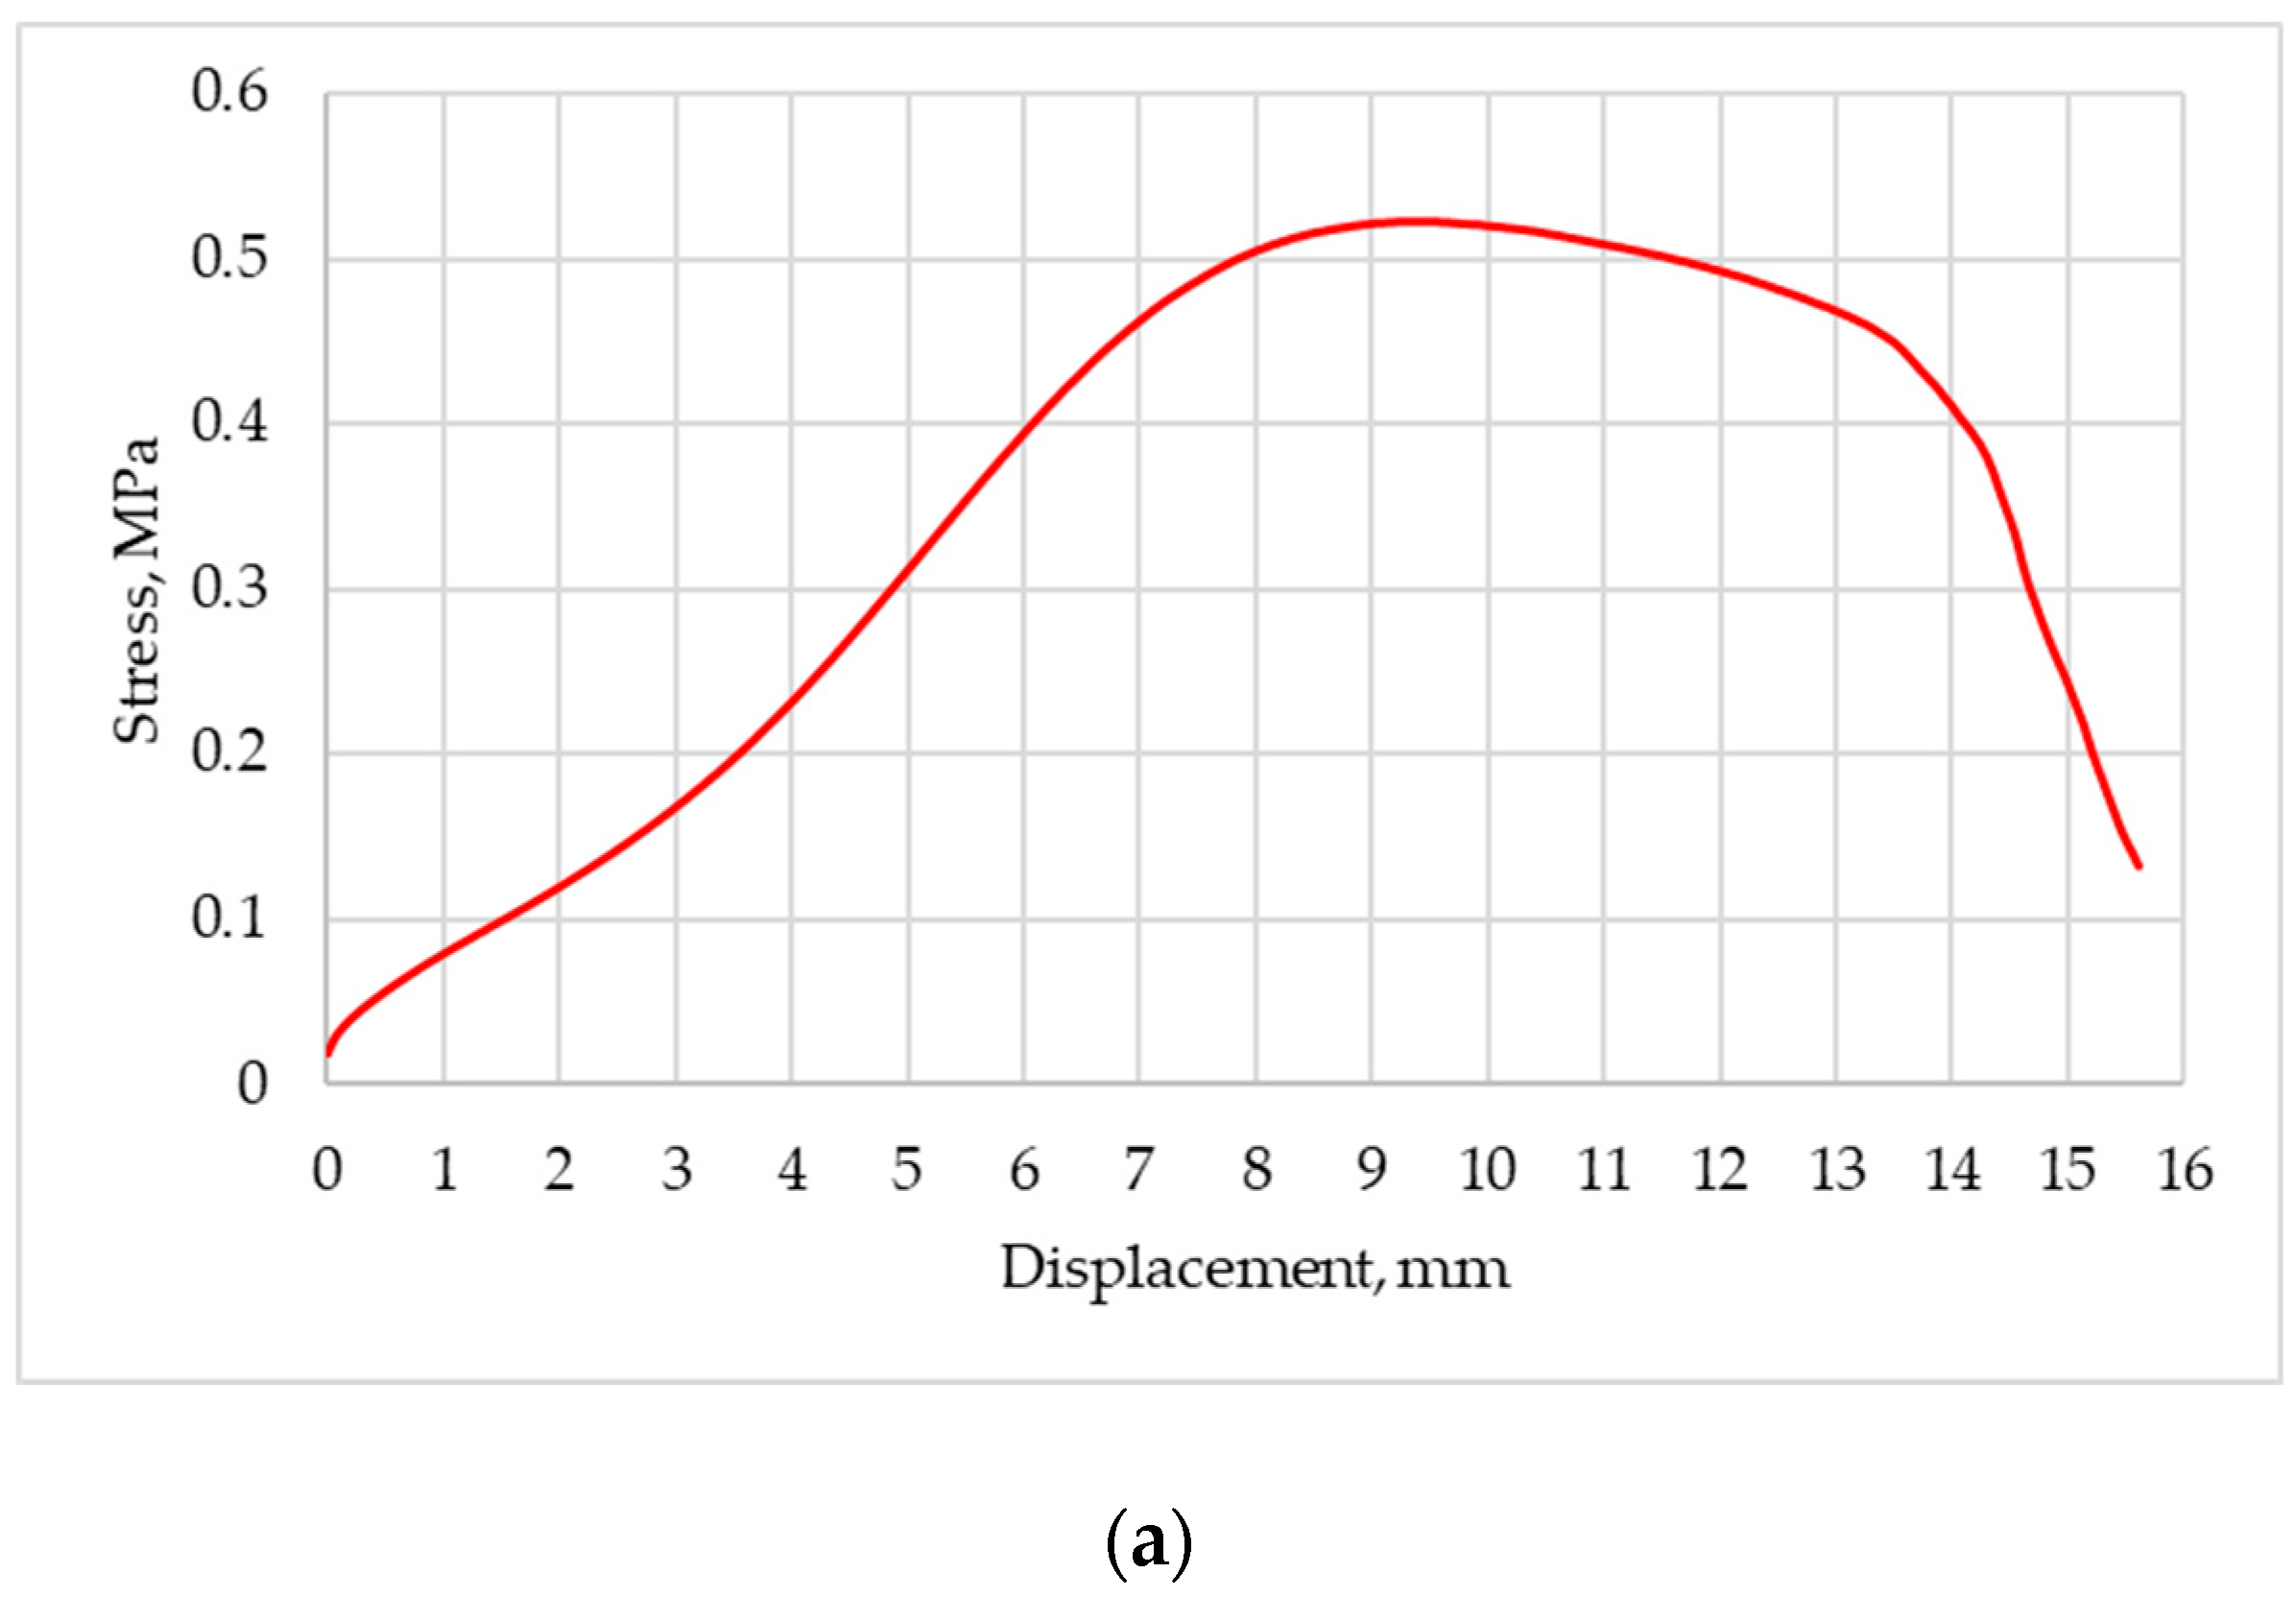
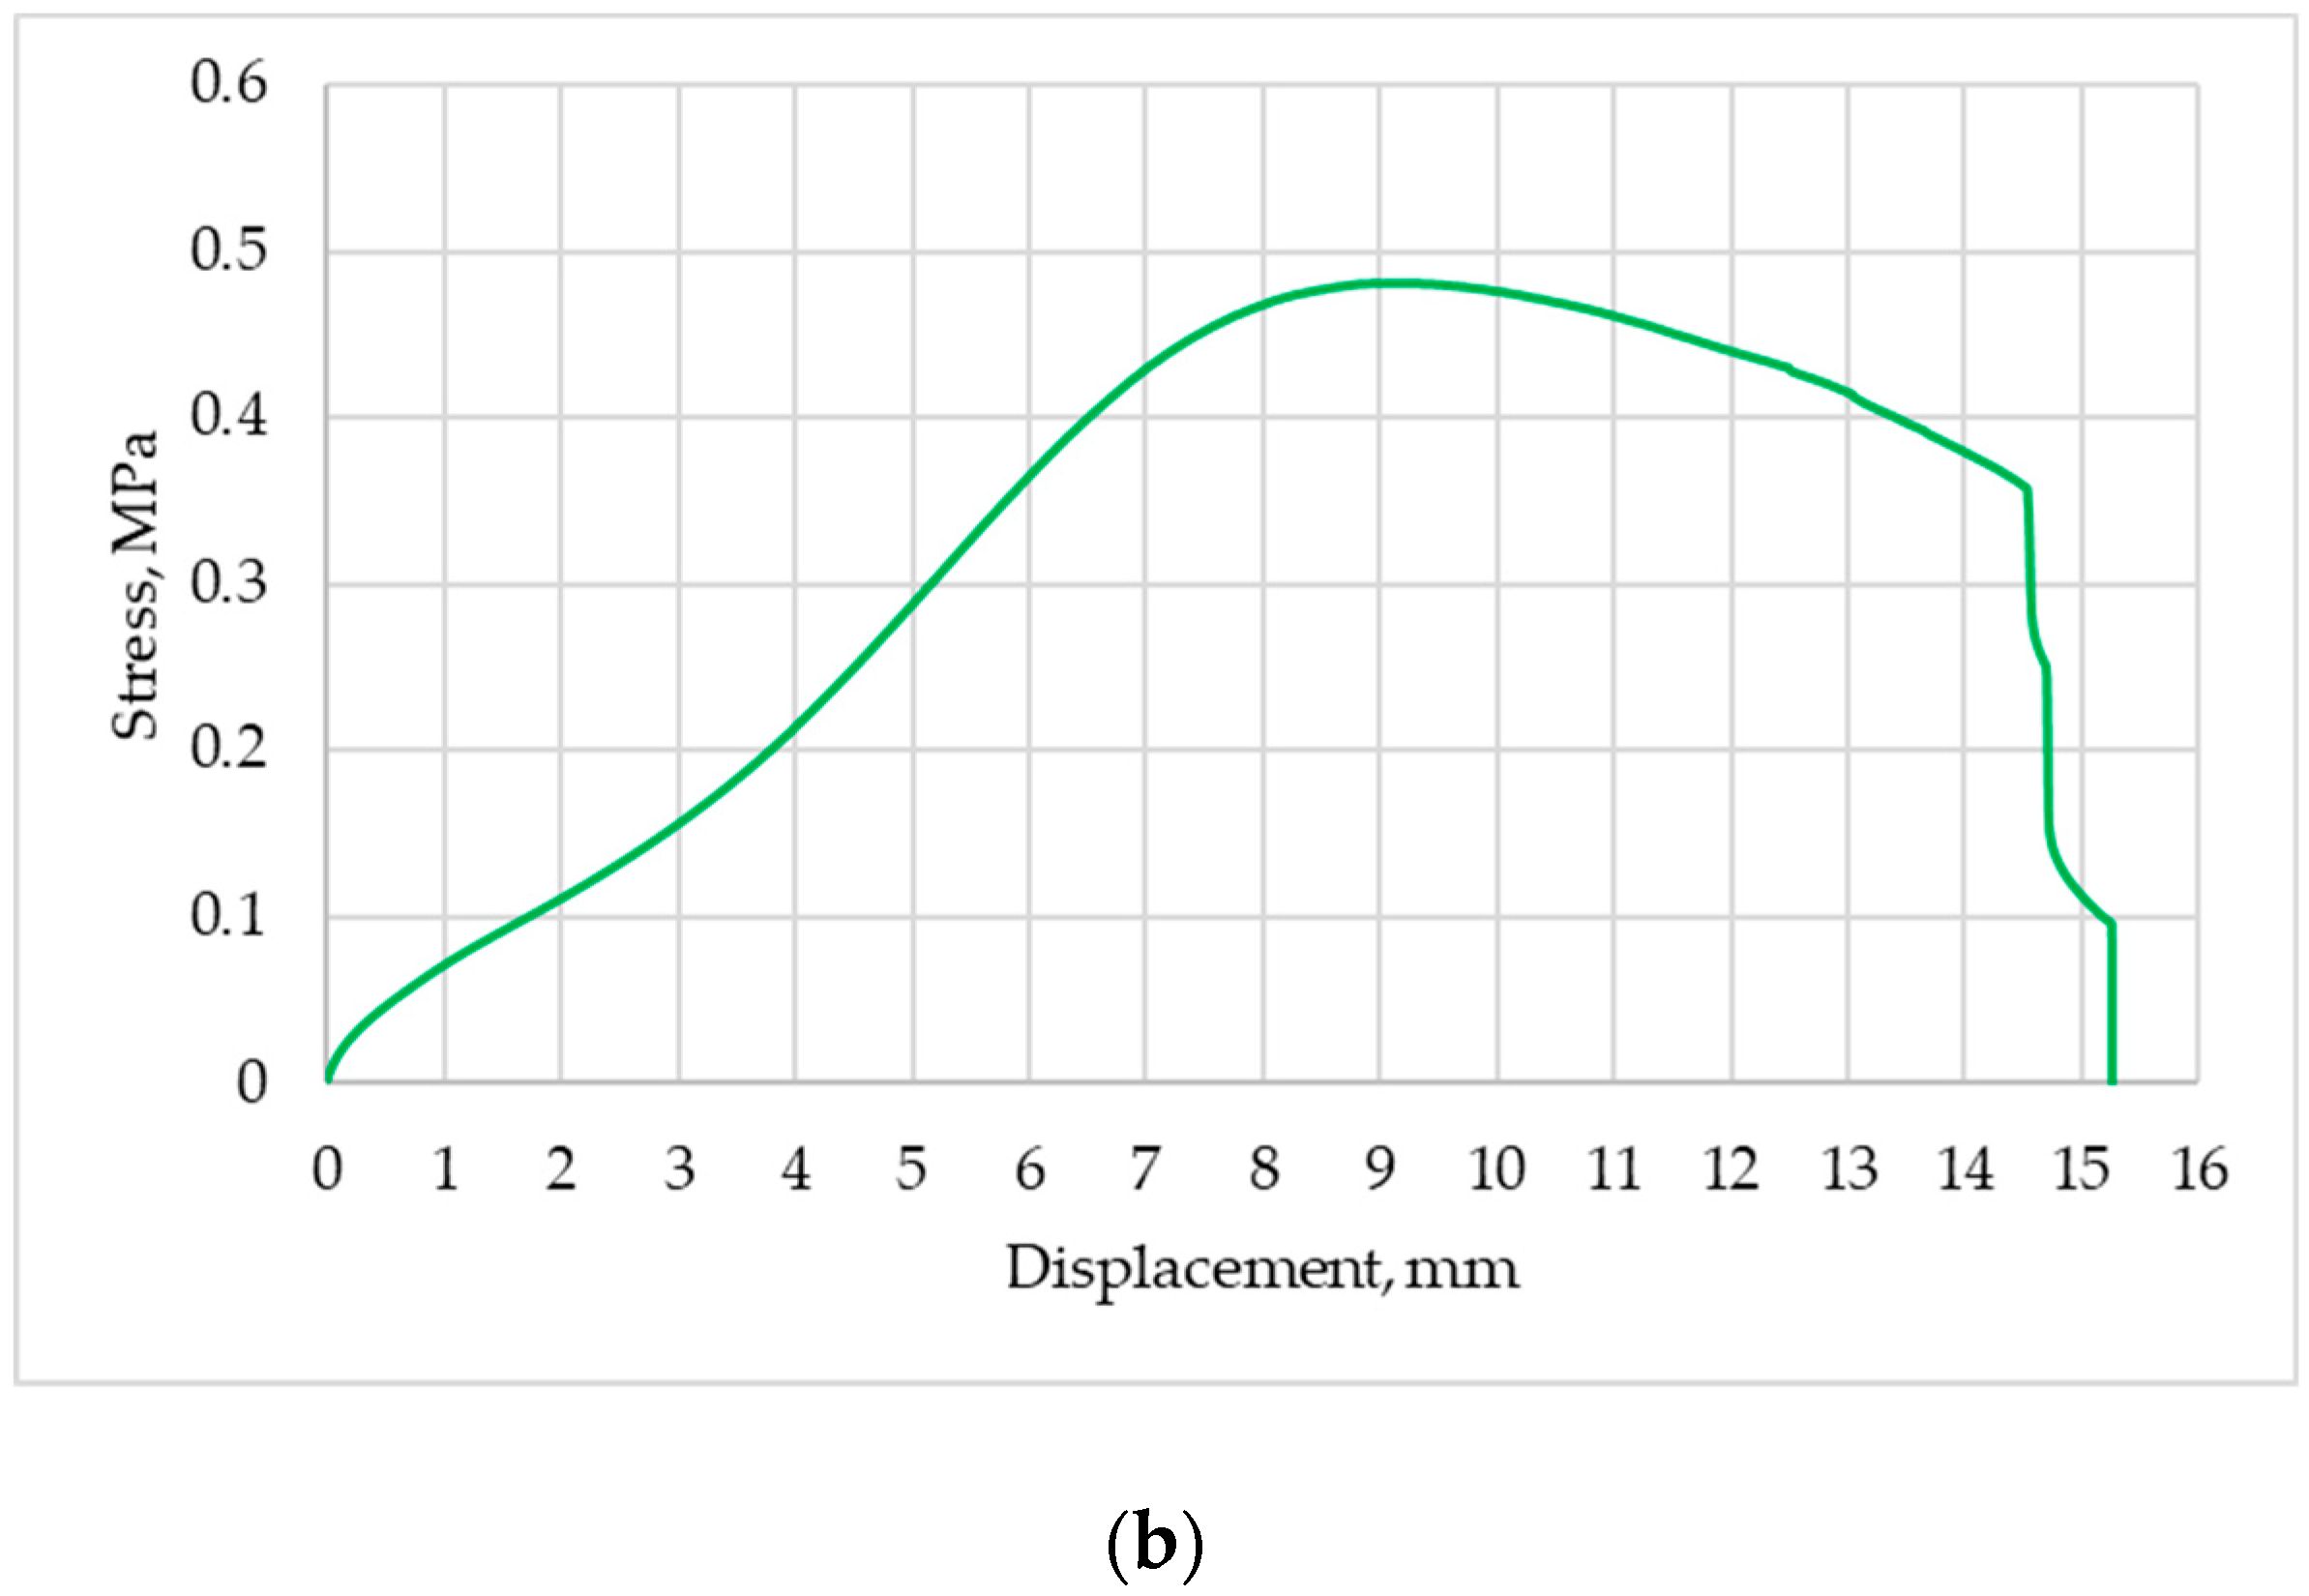
Due to the practical nature of the research, an industrial digital ultrasonic defectoscope USM35XS (Krautkramer, GE Electronic, Boston, MA, USA) was used for the measurements, along with an ultrasonic probe. Because the samples used in the study were small in thickness, a high-frequency probe had to be used so that a short wavelength could be obtained. The wavelength is the quotient of its speed and its frequency. It was assumed that the wavelength should be at least three times smaller than the thickness of the sheet to be tested. Taking into account the above assumptions and the speed of the ultrasonic wave in the steel sheet of about 5940 m/s, it was calculated that the frequency of the wave used should be about 20 MHz. Due to the near-field and dead zone and the impossibility of immersion testing (due to possible degradation of the joint), it was decided to use a head with a water delay line. A probe from GE Electronic with a transducer diameter of 5 mm, designated by the manufacturer as G20MNX, was selected. This head is equipped with a flexible diaphragm that adapts to the shape of the surface to be tested. The selected ultrasonic probe is shown in Figure 3. The basic parameters of the ultrasonic transducer are shown in Table 2.
The schematic of the measurement system is shown in Figure 4.
Prior to the study, measurement errors were determined experimentally. For this purpose, 30 measurements were taken at a single location, the mean value was determined, and the confidence subinterval was set at 0.95, which allowed the percentage errors to be determined. The results of the calculations are presented in Table 3, while graphically, they are shown in Figure 5. The results of all measurements are presented in Appendix A.
Analyzing the results obtained, it was assumed that for further work, the fifth pulse would be used, since it came from multiple reflections, which increased the accuracy; additionally, the measurement error was about 8 percent, and with subsequent pulses, it increased up to 46 percent.
In the tests, a sequence of pulses was obtained on the defectoscope screen, and the heights of all pulses were measured. The decibel drop between the heights of the first and fifth pulses on the defectoscope screen was used as an ultrasonic measure of the quality of the adhesive bond, according to the following expression:
M = 20 · l o g H I H V
The settings of ultrasonic defectoscope were chosen so that the height of the first pulse in the joint area was 80% of the screen height; in the event that the defectoscope screen could not be frozen at this value, a conversion was made. An example view of the defectoscope screen and the principle of determining the ultrasonic measure is shown in Figure 6.

3. Results

Before making the samples, measurements were taken on a strip of metal sheet. These measurements were post-reference measurements. No significant differences were found in the attenuation of the metal sheets for all samples. The average value of the ultrasonic measure M for the sheet was 5.49 dB with a measurement error of 0.187 dB.
Measurements were also carried out after gluing all 60 samples together. The measurements were taken 24 h after the samples were prepared. After the ultrasonic measurements were executed, the specimens were broken on a testing machine.
The test results were divided into three main groups. Table 4 shows the results for the joints, for which the surface was prepared according to the tape manufacturer’s guidelines and the joined sheets were torn, while at the same time the breaking force was measured. Measurement of the force made it possible to determine the shear stress of the joint.
Table 5 shows the results for those specimens where the surfaces were degreased before gluing, but were not pressed together. Table 6 shows the results for those specimens where the surfaces were not degreased.
The average wall stress for the samples prepared according to the tape manufacturers’ recommendations was 0.497 MPa. For the samples in which the glued surfaces were not pressed, this value was 0.333 MPa, while for the surfaces that were not degreased, it was 0.252 MPa.
A summary of the results from all of the samples in graphical form is shown in Figure 7. In this figure, the value of the ultrasonic measure for the measurement on the sheet without tape is also included. Based on the graph, it is possible to distinguish between high-quality (shear resistance about 0.5 MPa) and low-quality joints (shear resistance between 0.2 and 0.45 MPa).
An example graph showing the dependence of the stress on the displacement of the jaws of the testing machine is shown in Figure 8. This figure shows the variable nature of the graph for cohesive rupture (8a) and cohesive-adhesive rupture (8b). A decrease in stress was observed when the jaws of the testing machine were moved by about 9 mm, with full specimen rupture occurring when as much as about 75 percent of the strip width was moved. No adhesion failure occurred in any of the specimens tested.
Cohesive, adhesive, and cohesive-adhesive rupture are possible. In cohesive rupture, there is an internal tear in the tape. In adhesive rupture, tearing of the tape from the material occurs. In cohesive-adhesive rupture, both forms of rupture are observed. It was noted that the failure of the joints for which the stresses were highest had the character of cohesive failure. This means that the surface was properly prepared. An ultrasonic measure of joint quality above 10 dB indicates an adhesion joint of the highest quality. For adhesive joints for which the ultrasonic measure was 7 to 9 dB, joints with shear strengths of 0.2 to 0.4 MPa were found, with mixed rupture, i.e., adhesion-cohesion rupture. For higher stresses, the proportion of cohesive rupture increased.
Sample results from the surface of the specimens are shown in Figure 9, Figure 10, Figure 11 and Figure 12, where the view of the specimens both after rupture and the ultrasonic measure distribution are shown. In these figures, the characteristic area, that is, the area where the connection had the highest quality, can be seen. This area was detected by ultrasonic testing.

4. Conclusions

The tests carried out confirmed that it was possible to test the quality of the bond between the adhesive tape and the steel plate using the ultrasonic echo method within the specified range. It was possible to identify high-quality joints for which the shear stresses exceeded 0.4 MPa. The stresses reached a maximum value of 0.53 MPa. Significantly, within this range, the strength of the joint was determined by the cohesive strength of the strip and not by the adhesive bond. It was confirmed that both sheet pressure and surface preparation significantly affect the quality of the joint. The average strength of joints prepared according to the tape manufacturer’s recommendations was 0.497 MPa. The average strength of those specimens where the surface was prepared properly, but the bonded surfaces were not pressed, was 0.333 MPa, about 30% lower, while where the surface was not properly cleaned, the strength was about 50% lower, averaging 0.252 MPa. The proposed ultrasonic measure (the decibel drop in height between the first and fifth pulses on the defectoscope screen) allowed a correct assessment of the quality of the joint.
The results obtained can be used not only during laboratory testing, but also under industrial production conditions, for quality control during the manufacture of adhesive joints.

Author Contributions

Conceptualization, J.K. and M.J.; methodology, J.K. and M.J.; validation, M.J.; resources, J.K. and M.J.; data curation, J.K.; writing—original draft preparation, M.J. and J.K.; writing—review and editing, M.J.; visualization, J.K. All authors have read and agreed to the published version of the manuscript.

Funding

The presented research results were funded by grants for education allocated by the Ministry of Higher Education in Poland.

Institutional Review Board Statement

Not applicable.

Informed Consent Statement

Not applicable.

Data Availability Statement

The raw data supporting the conclusions of this article will be made available by the authors on request.

Conflicts of Interest

The authors declare no conflicts of interest.

Appendix A

Table A1. Measurement results determining measurement errors.
No.HI %HII %HIII %HIV %HV %HVI %HVII %HVIII %HIX %HX %HXI %
806858433424231918171480
80685843353328262214980
80685545333032241716880
80695542363129221918980
806955433627252322161380
806857483729332517161380
806956433427312119141380
80705742353033211817580
80695647362831191813980
806857433331292820141380
807157443428322222151080
80675846342932261819980
80685743363033222114880
807256483328282220171080
807057443331262122131380
807356453330312520171080
80695645363126232014980
806958443428311821131180
807056433630252218161080
80695845342632231915780
80665542372623211817880
80705645343125202014780
80705543332730272218880
806957433426281818161180
807158423432292020141080
807155453328322218181380
806956433229281822141080
80675742373223202119980
80675647333128201718980
80715546353126201716780

References

  1. Mbithi, F.; Worsley, P.R. Adhesives for medical application—Peel strength testing and evaluation of biophysical skin response. J. Mech. Behav. Biomed. Mater. 2023, 148, 106168. [Google Scholar] [CrossRef] [PubMed]
  2. Gulcicek, E.; Diler, E.A.; Ertugrul, O. Synergistic effect of surface treatment and adhesive type on bonding performance of thin Al6061 joints for automotive applications. Int. J. Adhes. Adhes. 2024, 130, 103641. [Google Scholar] [CrossRef]
  3. Karaboga, F.; Golec, F.; Yunus, D.E.; Toros, S.; Oz, Y. Mechanical response of carbon fiber reinforced epoxy composite parts joined with varying bonding techniques for aerospace applications. Compos. Struct. 2024, 331, 117920. [Google Scholar] [CrossRef]
  4. Durczak, K.; Selech, J.; Ekielski, A.; Żelaziński, T.; Waleński, M.; Witaszek, K. Using the Kaplan–Meier Estimator to Assess the Reliability of Agricultural Machinery. Agronomy 2022, 12, 1364. [Google Scholar] [CrossRef]
  5. Przystupa, K.; Beshley, M.; Hordiichuk-Bublivska, O.; Kyryk, M.; Beshley, H.; Pyrih, J.; Selech, J. Distributed Singular Value Decomposition Method for Fast Data Processing in Recommendation Systems. Energies 2021, 14, 2284. [Google Scholar] [CrossRef]
  6. Durczak, K.; Selech, J. The Quantification of Operational Reliability of Agricultural Tractors with the Competing Risks Method. Teh. Vjesn. 2022, 29, 628–633. [Google Scholar] [CrossRef]
  7. Kowalczyk, J.; Matysiak, W.; Sawczuk, W.; Wieczorek, D.; Sędłak, K.; Nowak, M. Quality Tests of Hybrid Joint—Clinching and Adhesive—Case Study. Appl. Sci. 2022, 12, 11782. [Google Scholar] [CrossRef]
  8. Pereira, A.; Fenollera, M.; Prado, T.; Wieczorowski, M. Effect of Surface Texture on the Structural Adhesive Joining Properties of Aluminum 7075 and TEPEX®. Materials 2022, 15, 887. [Google Scholar] [CrossRef]
  9. Varga, J.; Brezinová, J.; Brezina, J. Quality Analysis of Bonded Joints in the Renovation of Plastic Automotive Parts. Appl. Sci. 2024, 14, 271. [Google Scholar] [CrossRef]
  10. Trembach, B.; Balenko, O.; Davydov, V.; Brechko, V.; Trembach, I.; Kabatskyi, O. Prediction the Melting Characteristics of Self-Shielded Flux Cored arc Welding (FCAW-S) with Exothermic Addition (CuO-Al). In Proceedings of the IEEE 4th International Conference on Modern Electrical and Energy System (MEES), Kremenchuk, Ukraine, 20–23 October 2022; pp. 1–6. [Google Scholar] [CrossRef]
  11. Ulbrich, D.; Kańczurzewska, M. Correlation Tests of Ultrasonic Wave and Mechanical Parameters of Spot-Welded Joints. Materials 2022, 15, 1701. [Google Scholar] [CrossRef]
  12. Logar, A.; Klobčar, D.; Nagode, A.; Trdan, U.; Černivec, G.; Sharma, A. Advanced Analysis of the Properties of Solid-Wire Electric Contacts Produced by Ultrasonic Welding and Soldering. Materials 2024, 17, 334. [Google Scholar] [CrossRef] [PubMed]
  13. Kim, S.H.; Choi, Y.; Kim, Y.; Paik, K.W. Flux function added solder anisotropic conductive films (ACFs) for high power and fine pitch assemblies. In Proceedings of the 2013 IEEE 63rd on Electronic Components and Technology Conference (ECTC), Las Vegas, NV, USA, 28–31 May 2013; pp. 1713–1716. [Google Scholar]
  14. Zhang, S.; Yang, M.; Jin, M.; Huang, W.-C.; Lin, T.; He, P.; Lin, P.; Paik, K.-W. Mechanism of Solder Joint Cracks in Anisotropic Conductive Films Bonding and Solutions: Delaying Hot-Bar Lift-Up Time and Adding Silica Fillers. Metals 2018, 8, 42. [Google Scholar] [CrossRef]
  15. Zhang, S.; Paik, K.W. A study on the failure mechanism and enhanced reliability of Sn58Bi solder anisotropic conductive film joints in a pressure cooker test due to polymer viscoelastic properties and hydroswelling. IEEE Trans. Compon. Packag. Manaf. Technol. 2016, 6, 216–223. [Google Scholar] [CrossRef]
  16. Maggiore, S.; Banea, M.D.; Stagnaro, P.; Luciano, G. A Review of Structural Adhesive Joints in Hybrid Joining Processes. Polymers 2021, 13, 3961. [Google Scholar] [CrossRef] [PubMed] [PubMed Central]
  17. Simões, B.D.; Fernandes, É.M.D.; Marques, E.A.S.; Carbas, R.J.C.; Maul, S.; Stihler, P.; Weißgraeber, P.; da Silva, L.F.M. Development of a Cyclic Creep Testing Station Tailored to Pressure-Sensitive Adhesives. Machines 2024, 12, 76. [Google Scholar] [CrossRef]
  18. Jeevi, G.; Nayak, S.K.; Abdul Kader, M. Review on adhesive joints and their application in hybrid composite structures. J. Adhes. Sci. Technol. 2019, 33, 1497–1520. [Google Scholar] [CrossRef]
  19. Banea, M.D.; da Silva, L.F.M. Adhesively bonded joints in composite materials: An overview. Proc. Inst. Mech. Eng. Part L J. Mater. Des. Appl. 2009, 223, 1–18. [Google Scholar] [CrossRef]
  20. Machalická, K.V.; Sejkot, P.; Vokáč, M.; Pokorný, P.; Obradović, V. Water Resistance of Acrylic Adhesive Tapes for Rooftop Fastening. Buildings 2024, 14, 1636. [Google Scholar] [CrossRef]
  21. Jucienė, M.; Dobilaitė, V.; Kumžienė, J.; Banionis, K.; Paukštys, V.; Stonkuvienė, A. Development of a Systematic Approach for the Assessment of Adhesive Tape Suitability to Ensure Airtightness. Buildings 2024, 14, 1346. [Google Scholar] [CrossRef]
  22. Adams, R.D.; Drinkwater, B.W. Nondestructive testing of adhesively-bonded joints. NDTE Int. 1997, 30, 93–98. [Google Scholar] [CrossRef]
  23. Yilmaz, B.; Ba, A.; Jasiuniene, E.; Bui, H.-K.; Berthiau, G. Evaluation of Bonding Quality with Advanced Nonde-structive Testing (NDT) and Data Fusion. Sensors 2020, 20, 5127. [Google Scholar] [CrossRef] [PubMed]
  24. Pisharody, A.P.; Blandford, B.; Smith, D.E.; Jack, D.A. An experimental investigation on the effect of adhesive distribution on strength of bonded joints. Appl. Adhes. Sci. 2019, 7, 6. [Google Scholar] [CrossRef]
  25. Smagulova, D.; Yilmaz, B.; Jasiuniene, E. Ultrasonic Features for Evaluation of Adhesive Joints: A Comparative Study of Interface Defects. Sensors 2024, 24, 176. [Google Scholar] [CrossRef] [PubMed]
  26. EN ISO 4287; Geometrical Product Specifications (GPS)—Surface Texture: Profile Method—Terms, definitions and Surface Texture Parameters. ISO: Geneva, Switzerland, 1997.
  27. EN ISO 4288; Geometrical Product Specifications (GPS)—Surface Texture: Profile Method—Rules and Procedures for the Assessment of Surface Texture. ISO: Geneva, Switzerland, 1996.
Figure 1. Research plan.
Applsci 14 06877 g001
Figure 2. Sample used in the study: dimensions.
Applsci 14 06877 g002
Figure 3. Ultrasonic probe used in research.
Applsci 14 06877 g003
Figure 4. Measurement stand: (a) general view, (b) sample and probe model; 1, metal sheet; 2, ultrasonic probe; 3, flexible membrane, 4, adhesive tape; and 5, metal sheet.
Applsci 14 06877 g004
Figure 5. Measurement errors for the obtained pulses.
Applsci 14 06877 g005
Figure 6. Example view of the defectoscope screen. (a) Real image; 1, initial pulse; 2, gain of signal; 3, pulse height read automatically from the measuring gate (5); 4, first pulse (HI). (b) The principle of making measurements with the demonstration of the ultrasonic signal waveform.
Applsci 14 06877 g006
Figure 7. Relationship between ultrasonic measure and shear stresses.
Applsci 14 06877 g007
Figure 8. Plot of the dependence of the stress as a function of the punch path; (a) a joint in which cohesive rupture has occurred, and (b) a joint in which cohesive-adhesive rupture has occurred.
Applsci 14 06877 g008aApplsci 14 06877 g008b
Figure 9. View of a sample after rupture, along with a map showing the value of the ultrasonic measure; the dashed line marks the characteristic area.
Applsci 14 06877 g009
Figure 10. View of a sample after rupture, along with a map showing the value of the ultrasonic measure; the dashed line marks the characteristic area.
Applsci 14 06877 g010
Figure 11. View of a sample after rupture, along with a map showing the value of the ultrasonic measure; the dashed line marks the characteristic area.
Applsci 14 06877 g011
Figure 12. View of a sample after rupture, along with a map showing the value of the ultrasonic measure; the dashed line marks the characteristic area.
Applsci 14 06877 g012
Table 1. Chemical composition of metal sheet (%).
DesignationNumerical ClassificationC [%]Mn [%].P [%]S [%]SiTiAlNb
DC011.033≤0.12≤0.6≤0.045≤0.045----
Table 2. Parameters of the ultrasonic transducer used.
Parameter
frequency20MHz
diameter of the transducer5.0mm
effective diameter4.5mm
wave speed of tested material5940m/s
wave length0.297mm
near field17.0mm
the coefficient of decrease of decibels K0.87-
sin the angle of divergence of the beam0.06-
divergence angle degrees3.29°
distance from the transducer20mm
beam width2.3mm
Table 3. Determination of measurement errors (the complete set of results is available in Appendix A, Table A1).
Pulse
Number
Average
Pulse High
Standard
Deviation
Confidence
Interval
Percent Error
180.00.000.000%
269.21.553.175%
356.41.052.164%
444.11.773.618%
534.51.412.888%
629.12.124.3515%
728.73.146.4222%
821.92.635.3825%
919.51.733.5318%
1015.71.813.6923%
119.82.214.5146%
Table 4. Individual pulse heights and shear stresses for joints made according to the tape manufacturer’s guidelines.
No.HI
%
HII
%
HIII
%
HIV
%
HV
%
M
dB
Stresses
MPa
10.800.620.470.340.2310.830.49
20.800.610.440.290.2012.040.52
30.800.610.450.300.2111.620.33
40.800.590.420.290.2012.040.49
50.800.630.470.30.2111.620.51
60.800.610.460.30.1912.490.53
70.800.680.470.330.2410.460.49
80.800.620.430.320.2510.100.52
90.800.550.380.240.1514.540.53
100.800.550.400.270.2012.040.52
110.800.630.460.310.2310.830.47
120.800.670.480.360.289.120.42
130.800.680.530.330.2310.830.50
140.800.560.380.260.1812.960.53
150.800.610.450.290.1912.490.50
160.800.630.500.310.2012.040.53
170.800.660.440.300.2211.210.51
180.800.630.450.330.2310.830.50
190.800.540.450.350.2310.830.53
200.800.630.410.290.2111.620.51
Table 5. Individual pulse heights and shear stresses for joints in which the bonded surfaces were not pressed together.
No.HI
%
HII
%
HIII
%
HIV
%
HV
%
M
dB
Stresses
MPa
10.800.690.480.380.308.520.46
20.800.690.470.390.289.120.33
30.800.620.530.390.308.520.31
40.800.710.530.420.289.120.33
50.800.660.480.420.289.120.34
60.800.610.530.370.308.520.35
70.800.670.470.410.308.520.33
80.800.660.470.410.289.120.35
90.800.640.480.370.298.810.32
100.800.640.480.370.298.810.33
110.800.680.520.370.327.960.30
120.800.630.520.380.298.810.33
130.800.630.470.380.289.120.35
140.800.660.460.400.298.810.28
150.800.650.460.380.318.230.31
160.800.690.470.380.298.810.33
170.800.700.490.400.318.230.34
180.800.600.530.410.318.230.31
190.800.610.510.390.308.520.33
200.800.670.500.390.289.120.33
Table 6. Individual pulse heights and shear stresses for joints in which the bonded surfaces were not degreased, but were pressed together.
No.HI
%
HII
%
HIII
%
HIV
%
HV
%
M
dB
Stresses
MPa
10.800.640.450.370.337.690.21
20.800.650.480.420.347.430.21
30.800.700.490.410.337.690.27
40.800.670.460.430.347.430.29
50.800.590.520.380.327.960.24
60.800.600.530.410.318.230.33
70.800.660.520.400.347.430.23
80.800.600.490.410.308.520.21
90.800.660.520.410.318.230.28
100.800.680.520.410.318.230.28
110.800.630.530.400.327.960.27
120.800.630.510.420.337.690.23
130.800.640.510.410.337.690.24
140.800.660.520.410.318.230.29
150.800.670.510.420.337.690.24
160.800.650.510.420.327.960.26
170.800.670.510.410.327.960.26
180.800.650.520.400.327.960.25
190.800.640.530.420.327.960.24
200.800.630.540.410.337.690.21
Disclaimer/Publisher’s Note: The statements, opinions and data contained in all publications are solely those of the individual author(s) and contributor(s) and not of MDPI and/or the editor(s). MDPI and/or the editor(s) disclaim responsibility for any injury to people or property resulting from any ideas, methods, instructions or products referred to in the content.

