Article

Risk Assessment of Hydrogen Cyanide for Available Safe Egress Time in Fire Simulation

1
Department of Fire and Disaster Prevention, Graduate School, Daejeon University, 62 Daehak-ro, Dong-gu, Daejeon 34520, Republic of Korea
2
Department of Disaster Prevention, Graduate School, Daejeon University, 62 Daehak-ro, Dong-gu, Daejeon 34520, Republic of Korea
*
Author to whom correspondence should be addressed.
Appl. Sci. 2024, 14(16), 6890; https://doi.org/10.3390/app14166890
Submission received: 17 July 2024 / Revised: 2 August 2024 / Accepted: 5 August 2024 / Published: 6 August 2024

Abstract

:
The majority of fatalities in building fires are attributed to asphyxiation caused by toxic gases. Hydrogen cyanide (HCN) is one of the toxic gases that can be released during a fire, posing a lethal risk to humans even at low concentrations. However, analysis of the risk posed by HCN in fire risk assessments using fire simulations is relatively rare. This study conducted fire simulations to examine the potential risks of HCN to occupants during a fire. The simulations considered various fire conditions in residential buildings by varying fuel types, fire growth rates, and HCN yields. The relative risk score (RRS) was derived based on the time to reach the threshold values of parameters considered critical for life safety. The results of the fire simulations indicated that the RRS for HCN was approximately 20–40 points higher than that of O2, CO, and CO2, reaching a maximum of 92 points. However, the risk posed by HCN was found to be limited in comparison to the risks associated with temperature and visibility. Nevertheless, considering that the primary cause of fatalities in fires is asphyxiation due to toxic gases, HCN must be regarded as a critical factor in fire risk assessments. Additionally, since HCN yield values can increase up to nine times depending on temperature and ventilation conditions, the risk posed by HCN could be significantly higher.

1. Introduction

To mitigate the increased fire hazards in high-rise and complex buildings, many countries have adopted and implemented performance-based designs (PBDs) [1]. PBDs involve complex considerations of various factors that can influence fire hazard assessment, posing significant challenges. Therefore, evaluations are conducted through the comparison of available safe egress time (ASET) and required safe egress time (RSET) based on a simple timeline technique [2]. ASET is determined using the predicted results from fire simulations conducted for spaces and fire scenarios with relatively high fire hazards, in accordance with the objectives of PBDs. Specifically, ASET is calculated based on the earliest time to reach the threshold values for various parameters outlined in life safety codes. Recent PBD assessment results in the Republic of Korea indicate that 94% of the ASET calculations are determined by visibility [3]. However, validation and verification (V&V) results of fire simulations have shown that there is significant uncertainty in predicting visibility through smoke concentration, with an overestimation factor of approximately 2.6 [4]. This suggests that the reliability of ASET determined by visibility may be significantly compromised. Furthermore, annual statistical data compiled by the National Fire Protection Association (NFPA) and the United States Fire Administration (USFA) indicate that inhalation of smoke and toxic gases is the primary cause of deaths and injuries in fires [5,6]. Therefore, there is a notable discrepancy between the finding that visibility is the main parameter determining ASET and the fact that the direct cause of fire-related casualties is largely due to the inhalation of toxic gases.
In a fire environment, toxic gases that can be generated include carbon monoxide (CO) and carbon dioxide (CO2), in addition to hydrogen cyanide (HCN), nitrogen oxides (NOx), ammonia (NH3), hydrogen chloride (HCl), and formaldehyde (CH2O) [7]. Among these, except for CO, CO2, and HCN, the remaining toxic gases are inherently lethal but require a longer time to exert toxic effects on humans, making them less likely to be the primary cause of death. In contrast, HCN is approximately 25 times more toxic than CO, which is a major cause of death in fires [8]. Furthermore, HCN has a faster binding rate to hemoglobin than CO, reducing the amount of oxygen supplied to body tissues in a short time, thereby incapacitating the body [9,10]. HCN is primarily generated during combustion reactions of polymers and can be produced from combustibles readily encountered in daily life, such as furniture, clothing, and building materials [11]. Additionally, the yield of HCN is proportional to temperature, meaning that as the fire grows, the yield increases, posing an even greater hazard [12].
Table 1 summarizes the parameters and threshold values considered in life safety codes for various countries [13,14,15,16,17,18]. Common parameters include gas temperature, visibility, and the concentrations of O2, CO2, and CO. However, it can be noted that HCN concentration is only considered in specific countries’ regulations. Even when HCN concentration is taken into account, studies assessing the risk of HCN using fire simulation for performance-based design (PBD) are scarce. In the Republic of Korea, HCN concentration was considered during the initial phase of PBD implementation (2010–2015), but it has been excluded since 2015. This exclusion is due to the difficulty in determining the cause of death from toxic gases in fires, as well as the complexity and high cost of measurement, resulting in limited information on the chemical mechanism of HCN generation in fires. Consequently, the absence of input parameters for predicting HCN concentration in fire simulations led to its exclusion. Although the Republic of Korea’s current PBD does not consider HCN concentration, the high risk posed by toxic gases in terms of life safety during fires has recently been highlighted [19]. Additionally, the increasing proportion of polymer-based materials raises the likelihood of HCN generation [19]. Therefore, it is necessary to evaluate the potential risk of HCN in fire simulations for PBD.
In this study, fire simulations were conducted to evaluate the potential risks of HCN during a fire. To objectively assess the risk posed by HCN concentration, the predicted results were compared with the parameters specified in the life safety code applied in the Republic of Korea. The fire scenario selected was a residential building fire, which is commonly used in PBD assessments. Four types of combustibles applicable to residential buildings were considered as fire sources. Considering that fire simulations for specific scenarios can yield limited results, fire growth rates were varied to account for different fire environments. Additionally, a sensitivity analysis was performed to address the uncertainties related to the non-generalizable HCN yield. The results were analyzed by calculating the relative risk score (RRS) based on the time to reach the threshold values specified in the life safety code.

2. Description of Fire Simulation

2.1. Computational Domain and Fire Source for Fire Simulation

The fire model applied for the fire simulation is the representative field model Fire Dynamics Simulator (FDS, ver. 6.7.9) [20]. The subgrid turbulence model of FDS, which employs the large eddy simulation (LES) technique, utilizes the Deardorff model, and the combustion model uses the mixing-controlled fast chemistry (MCFC) approach. Additionally, efficient prediction of the mixture fraction is achieved through lumped species.
Figure 1 shows the computational domain for the fire simulation. Among the various spatial types applicable to performance-based design (PBD), a residential building was selected [21]. All spaces except the fire room are assumed to be closed off by fire doors. Additionally, the floors, ceilings, and walls of the building were uniformly assumed to be concrete [19]. Typically, the configuration of apartment buildings is more complex, with various structures that may exist. However, since the purpose of the fire simulation is to evaluate the potential hazards of HCN during a residential building fire, a simplified layout was considered to minimize the impact of spatial geometry, as referenced from similar previous studies [20]. The doorway of the fire room was fully open (dimensions: 1.0 m (x) × 2.0 m (z)). Additionally, an evacuation exit (1.0 m (x) × 2.0 m (z)) was opened to allow the heat and smoke generated in the fire room to be vented. The fire source was set to have an area of 1 m2 in the center of the floor of the fire room. To assess the risk of HCN in the fire simulation, physical quantities considered in life safety codes were selected for comparison. Specifically, these quantities were predicted at a height of 1.8 m, corresponding to the breathing zone, measured from the center of the floor of the evacuation exit. The predicted physical quantities included gas temperature, visibility, and concentrations of O2, CO, CO2, and HCN.
To determine the impact of HCN on fire hazard assessment, the specific fire scenario selected may yield limited results compared to the general outcomes. In other words, the selected space type, types of combustibles, and heat release rate (HRR) for fire simulation may not encompass all fire conditions. Therefore, to derive generalized conclusions, it is necessary to conduct fire simulations for a multitude of fire scenarios. However, realistically, performing fire simulations for an extensive range of conditions can be challenging. Thus, this study confined the space type to residential buildings and evaluated the hazard posed by HCN based on variations in combustible types, changes in HRR, and sensitivity analysis of HCN yield.
The time-dependent HRR set for the fire simulation is illustrated in Figure 2. To select the HRR, recent reports from the Republic of Korea over a five-year period for PBD were statistically analyzed. Typically, for conducting fire simulations for PBD, HRR is simplified using information provided by the design fire curve, which is derived from measurements in fire experiments. The design fire curve quantitatively provides key factors such as the fire growth rate (FGR, α) and peak HRR ( Q ˙ p e a k ), enabling a statistical approach. For residential buildings, approximately 70% of FGR was found to be ‘Medium (α = 0.01172 kW/s2)’. Additionally, with Q ˙ p e a k averaging around 1700 kW [22], a statistical fire growth curve for residential buildings can be established.
To assess the fire hazards posed by HCN in residential building configurations, four types of combustibles were selected. The HRR was set identically regardless of the combustible type chosen. In reality, different combustibles exhibit varying burning rates and release different amounts of thermal energy. Consequently, this could result in different HRR values. However, the purpose and scope of this study are to evaluate the risks associated with HCN based on the type of combustibles and input parameters. Both HCN yield and concentration can vary depending on the type of combustible as well as the HRR. In other words, by keeping the HRR constant, this study focuses on examining the impact of changes in combustible type on HCN.
Table 2 summarizes the combustion properties of combustibles applied in fire simulations [23]. First, GM21 is a type of flexible polyurethane foam known for its elasticity and commonly used in household furniture such as mattresses, sofas, and chairs [24]. PIR (polyisocyanurate) exhibits excellent insulation performance and is utilized as insulation material in refrigerators, as well as walls, roofs, and floors of residential buildings [25]. PAN (polyacrylonitrile) is a polymer material that is widely used in various industrial sectors and known for its durability and excellent thermal stability. It is used in fiber products such as clothing and textiles or processed into carbon fiber for use in household appliances through carbonization processes [26]. Wool is a natural fiber used in materials for indoor items such as clothing and carpets. These four combustibles commonly encountered in residential spaces share the common characteristic of potentially generating HCN [27].
The combustion properties of each combustible listed in Table 2 are measured under over-ventilation fire (OVF) conditions [23]. Generally, the yields of CO, soot, and HCN can vary significantly depending on the ventilation conditions [28,29,30]. Specifically, for PAN, the measured HCN yield ( y H C N ) under OVF conditions is 0.0080 g/g, whereas under under-ventilation fire (UVF) conditions, y H C N increases approximately nine times to 0.0720 g/g. Similarly, for PIR, y H C N under OVF conditions is approximately 0.0030 g/g, while under UVF conditions, it increases by approximately seven times to 0.0200 g/g. Furthermore, unlike CO yield ( y C O ) or soot yield ( y s ), there is relatively limited information available regarding y H C N . The utilization of y H C N values obtained from specific fire experiments may result in limited fire simulation outcomes.
To ensure the validity of the assessment regarding the potential impact of HCN on fire hazard assessment, various fire simulation conditions were considered. Specifically, different types of combustibles, variations in HRR, and sensitivity analyses of y H C N were conducted. Regarding HRR, variations were based on the fire growth curve presented in Figure 2. The considered fire growth curves were derived through statistical approaches based on PBD reports; generalizing the results obtained under these conditions is challenging. Therefore, fire simulations were conducted by gradually changing the fire growth rate (FGR) from ‘Slow’ (α = 0.00293 kW/s2) to ‘Ultra-fast’ (α = 0.1876 kW/s2) to analyze the impact of HCN. y H C N is not only limited in available data but can also vary sensitively with temperature and ventilation conditions. Thus, uncertainty regarding the input information for predicting HCN concentration in fire simulations can be significant. Therefore, a sensitivity analysis was additionally considered by applying ±50% variations based on the y H C N values presented in Table 3.

2.2. Grid Sensitivity Analysis

Based on the large eddy simulation (LES) concept implemented in FDS, the grid size ( ¯ ) is directly associated with the dependencies of turbulence and combustion models, significantly impacting the prediction of physical quantities generated during fires. In this study, an appropriate grid size for obtaining accurate prediction results was selected through a step-by-step grid sensitivity analysis. Generally, it is well established that FDS provides satisfactory results when the grid size encompasses 4 to 16 grids per characteristic fire diameter ( D * ), as specified in Equation (1) [31].
D * = Q ˙ p e a k ρ c p T g 2 / 5
In this equation, ρ is the air density (kg/m3), c p is the air specific heat (kJ/kg·K), and T is the ambient temperature (K). In the fire simulation for grid sensitivity analysis, with the combustible material being PIR, the FGR was ‘Medium’, Q ˙ p e a k was 1700 kW, and D * was determined to be 0.9 m. Accordingly, a step-by-step grid sensitivity analysis was conducted for grid sizes of ¯ = 0.05, 0.10, and 0.20 m, which can include 4, 10, and 18 grids in D * , respectively.
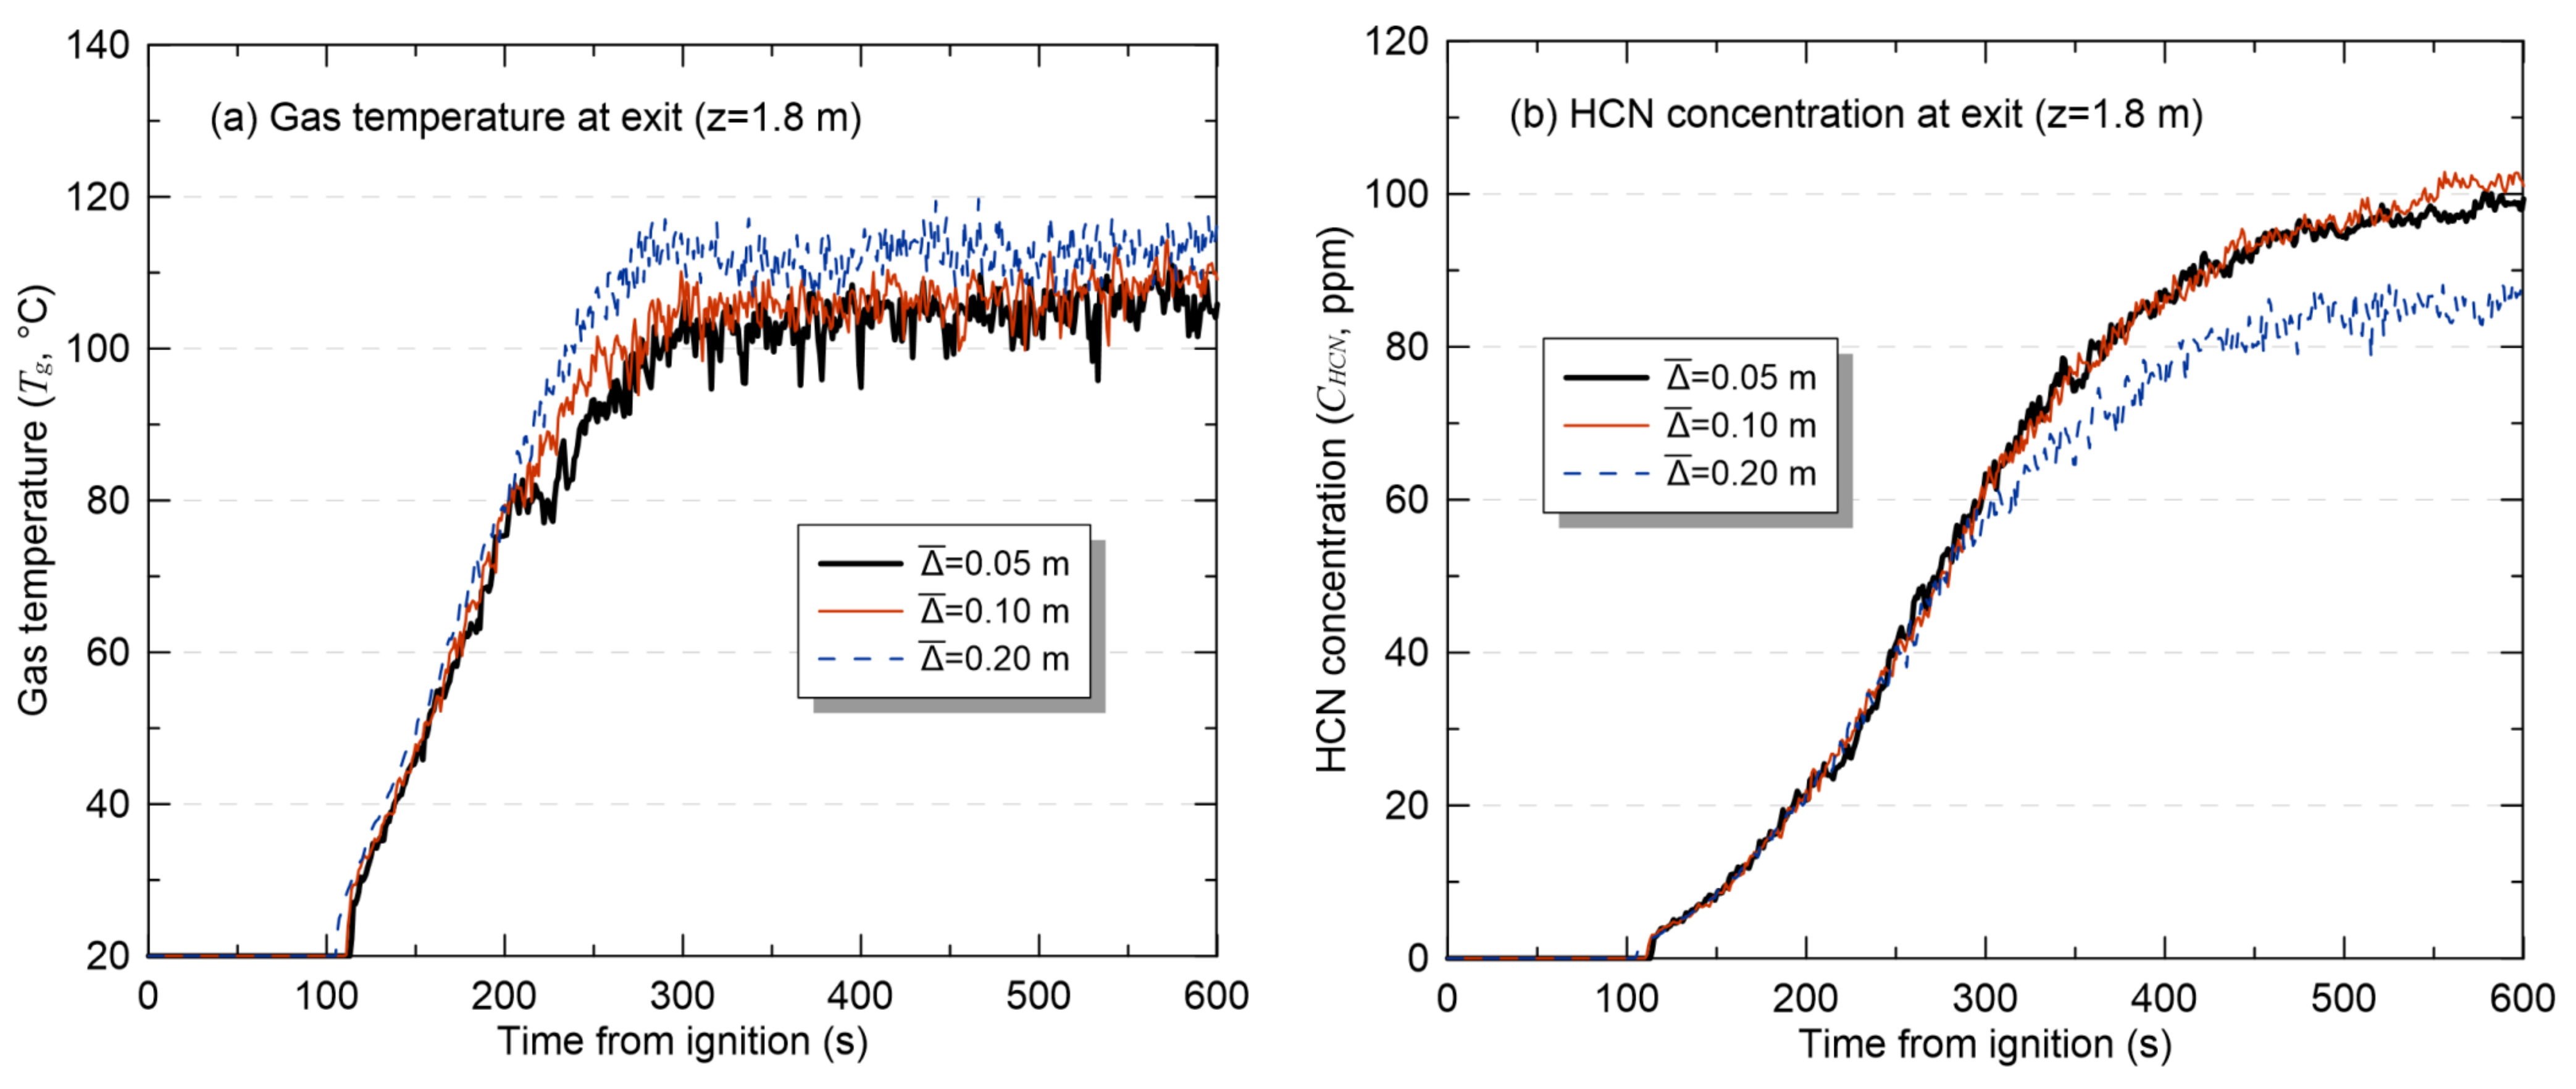
Figure 3 presents the results of the step-by-step grid sensitivity analysis. The predicted physical quantities were compared based on the selected ¯ . The basic physical quantities of the fire (gas temperature (a)) and the main physical quantity (HCN concentration (b)) were selected at a height of 1.8 m above the level of the floor of the evacuation exit, which can be seen in Figure 1. Upon examining the results, it was observed that under the condition of ¯ = 0.20 m, the gas temperature exhibited an overprediction compared to the conditions of ¯ = 0.10 and 0.05 m, while HCN concentration was underpredicted. Additionally, the predicted results for ¯ set at 0.10 m and 0.05 m showed very similar values. To minimize prediction uncertainty in fire simulations caused by grid size and enhance computational efficiency, a grid size of ¯ = 0.05 m was set for the fire room and ¯ = 0.10 m for the corridor. Accordingly, the total number of grids configured was 156,000.

2.3. Analysis Method with V&V Results

NUREG-1824, published by the US Nuclear Regulatory Commission (NRC) and the Electric Power Research Institute (EPRI), provides verification and validation (V&V) of fire models to reduce errors that may occur in fire modeling [32]. To achieve this, approximately 340 fire experiments were conducted to compare the measured physical quantities with those predicted by fire simulations, thereby presenting prediction uncertainty [4]. Table 3 presents the prediction uncertainty of FDS, where σ ~ M represents the relative standard deviation and δ denotes the bias factor. If the predicted result from fire simulation is denoted as M , then μ = M / δ becomes the ‘true value’ adjusted by the V&V results or the mean value of the probability density function. Recently, a method has been proposed to apply V&V results to fire simulation predictions in fire hazard assessment [33]. In this study, the impact of HCN on fire hazard assessment was examined based on the predicted μ using V&V results applied to fire simulation predictions. V&V results from the fire model for HCN concentration are not currently available, as shown in Table 3. As an alternative to considering prediction uncertainty for HCN concentration, V&V results for species concentration were applied to the predicted HCN concentration results, as indicated in Table 3.

2.4. Analysis Method with Relative Risk Score (RRS)

As a primary approach to evaluating the impact of HCN on fire hazard assessment, the time to reach the threshold value for each parameter specified in the life safety code was compared. This comparison allows identifying which parameters exhibit higher fire risks relative to others, although quantitatively assessing their importance poses challenges. Therefore, as a secondary approach, the relative risk score (RRS) evaluation method, was applied to assess parameters with relatively higher risks. RRS can be calculated using Equations (2)–(4), where shorter times for parameters to reach the threshold values indicate relatively higher risks, employing a downward indicator. V a l u e is the time it takes for each of the six physical quantities to reach the threshold value for each combustible; V a l u e m a x is the longest time among the six physical quantities to reach their threshold values; I n v e r t e d   v a l u e is calculated by subtracting the normalized value from 1, following a downscaling approach; and I n v e r t e d   v a l u e m a x is the maximum value among the inverted values. The RRS is then calculated by converting these values into a score ranging from 0 to 100. For some fire simulation conditions, if the threshold value was not exceeded, an assumption was made that it was exceeded at simulation time 600 s.
V a l u e V a l u e m a x = N o r m a l i z e d   v a l u e
I n v e r t e d   v a l u e = 1 N o r m a l i z e d   v a l u e
R R S = I n v e r t e d   v a l u e I n v e r t e d   v a l u e m a x × 100

3. Simulation Results and Discussion of Fire Scenarios

3.1. Predicted Results by Combustible Type

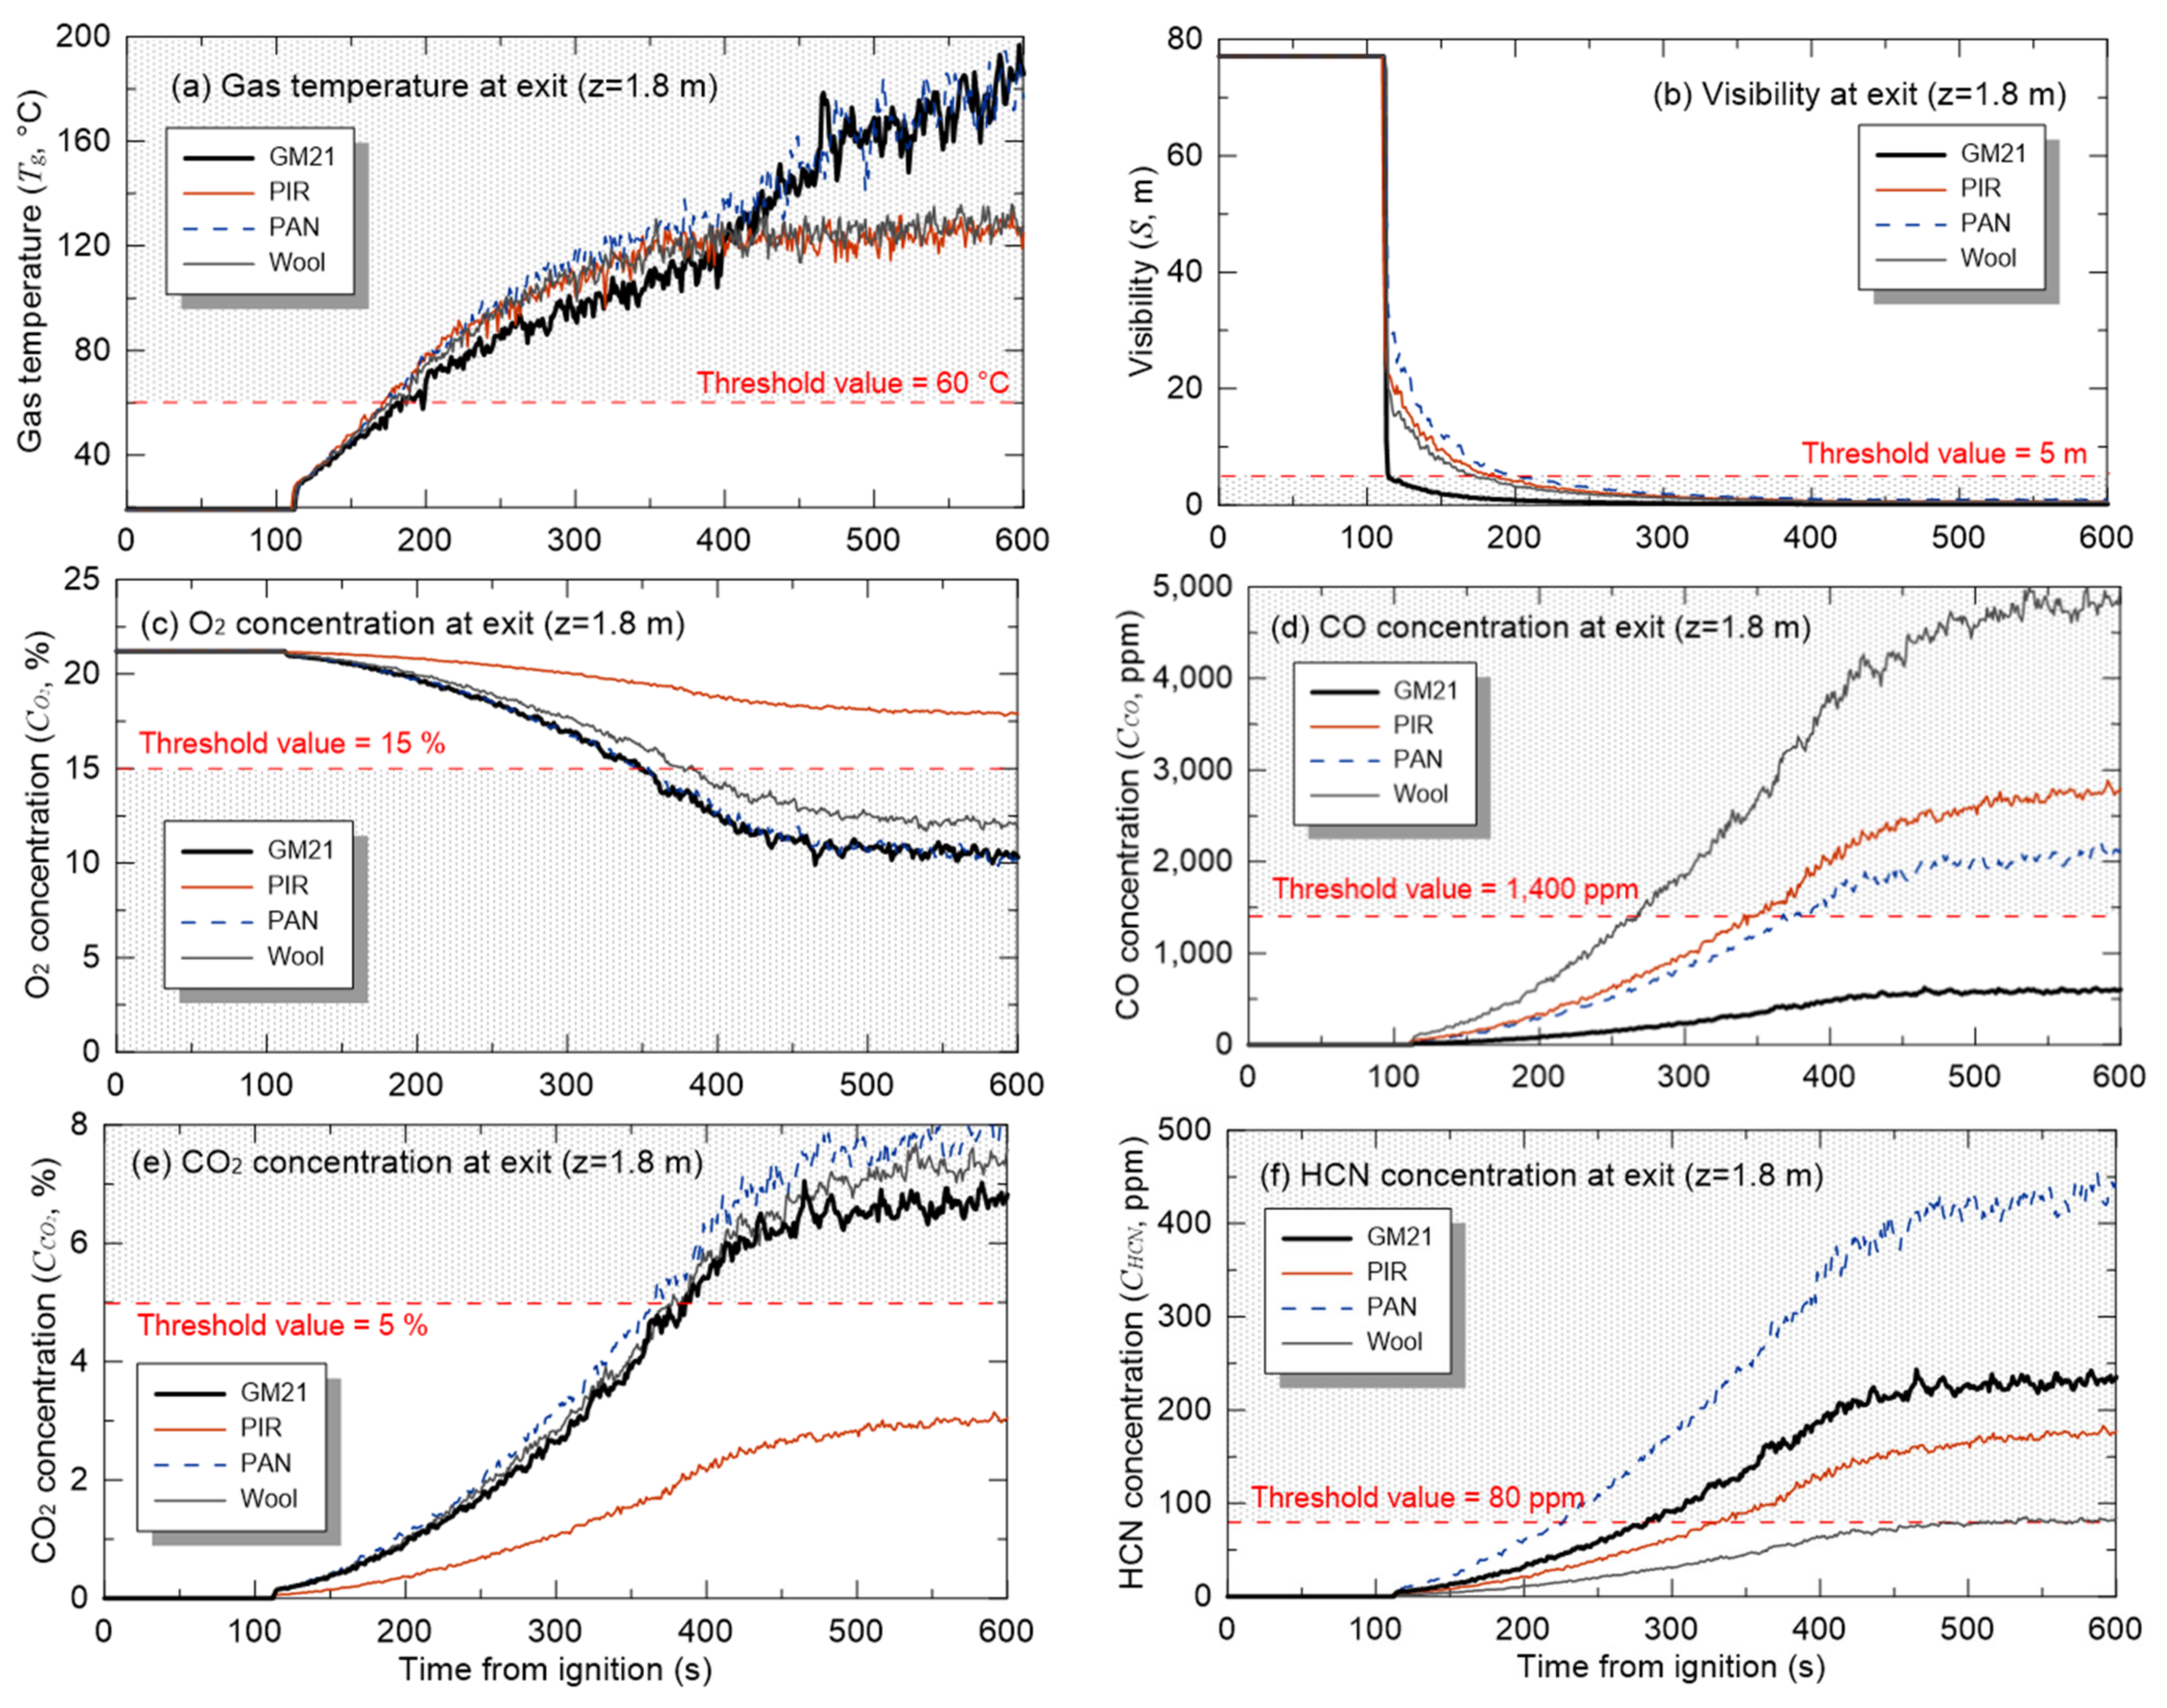
Figure 4 shows the predicted results of parameters over time for different types of combustibles when the FGR is ‘Medium’. The parameters observed include gas temperature, visibility, and concentrations of O2, CO, CO2, and HCN at a height of 1.8 m at the evacuation exit. Additionally, the threshold values for each parameter as specified in the life safety code are represented in the graph, allowing the identification of the times at which the changing parameters exceed these threshold values. First, from Figure 4a, it can be seen that similar gas temperatures are predicted up to approximately 300 s after ignition. However, despite applying the same fire growth curve as presented in Figure 2, different trends emerge after 300 s depending on the type of combustible. This difference may be attributed to variations in the heat of combustion of each combustible, leading to varying quantities of combustibles required. Moreover, considering factors such as the stoichiometric air–fuel ratio listed in Table 2, which indicates the different amounts of oxygen needed for combustion reactions for each combustible, it should be noted that gas temperatures and concentrations of chemical species may vary accordingly. Figure 4b–f show that the predicted results also differ depending on the application of different y C O , y S , and y H C N for each combustible. Ultimately, despite applying the same fire growth curve in the fire simulations, there are significant differences in the time taken to reach the threshold values.
Figure 5 shows the results of the RRS evaluation based on the time each parameter reaches its threshold value, as observed in Figure 4. First, examining the predicted results for visibility and gas temperature, it can be observed that the RRS scores for all four combustibles are close to 100 points. On average, visibility is evaluated at 97.7 points and gas temperature at 96.4 points. In contrast, the RRS evaluation results for O2, CO, and CO2 concentrations indicate relatively lower scores. Specifically, the average scores are 40.5 points for O2 concentration, 47.9 points for CO concentration, and 37.7 points for CO2 concentration. Finally, the RRS evaluation results for HCN concentration showed a maximum score of 87.7 points, with an average of 59.0 points. This indicates that the RRS scores for visibility and gas temperature are close to 100 points and are even higher than the scores for HCN concentration, suggesting that the impacts of visibility and temperature in a fire are greater than that of HCN concentration. However, insufficient visibility for evacuation and high temperatures causing burns are not typically direct causes of casualties and can be considered minor factors. In contrast, the concentrations of chemical species related to the inhalation of toxic gases, which are major causes of fire-related fatalities, show that HCN concentration has the highest RRS score. Accordingly, this study conducted a sensitivity analysis on FGR and y H C N for GM21 and PAN, the combustibles with the highest RRS scores for HCN concentration.

3.2. Fire Growth Rate Sensitivity Analysis Results

The simulation results using the fire growth curve of the residential building presented in Figure 2 were analyzed through Figure 4 and Figure 5. Although the ‘Medium’ FGR applied in the fire growth curve is based on statistical data from PBD assessment reports, it does not represent all fire scenarios. Since simulation results for specific fire scenarios can yield limited insights, it is necessary to consider a broader range of fire scenarios. Therefore, this study examined the impact of varying fire growth rates to determine how the fire risk related to HCN can increase by varying the FGR across seven conditions from ‘Slow’ to ‘Ultra-fast’.
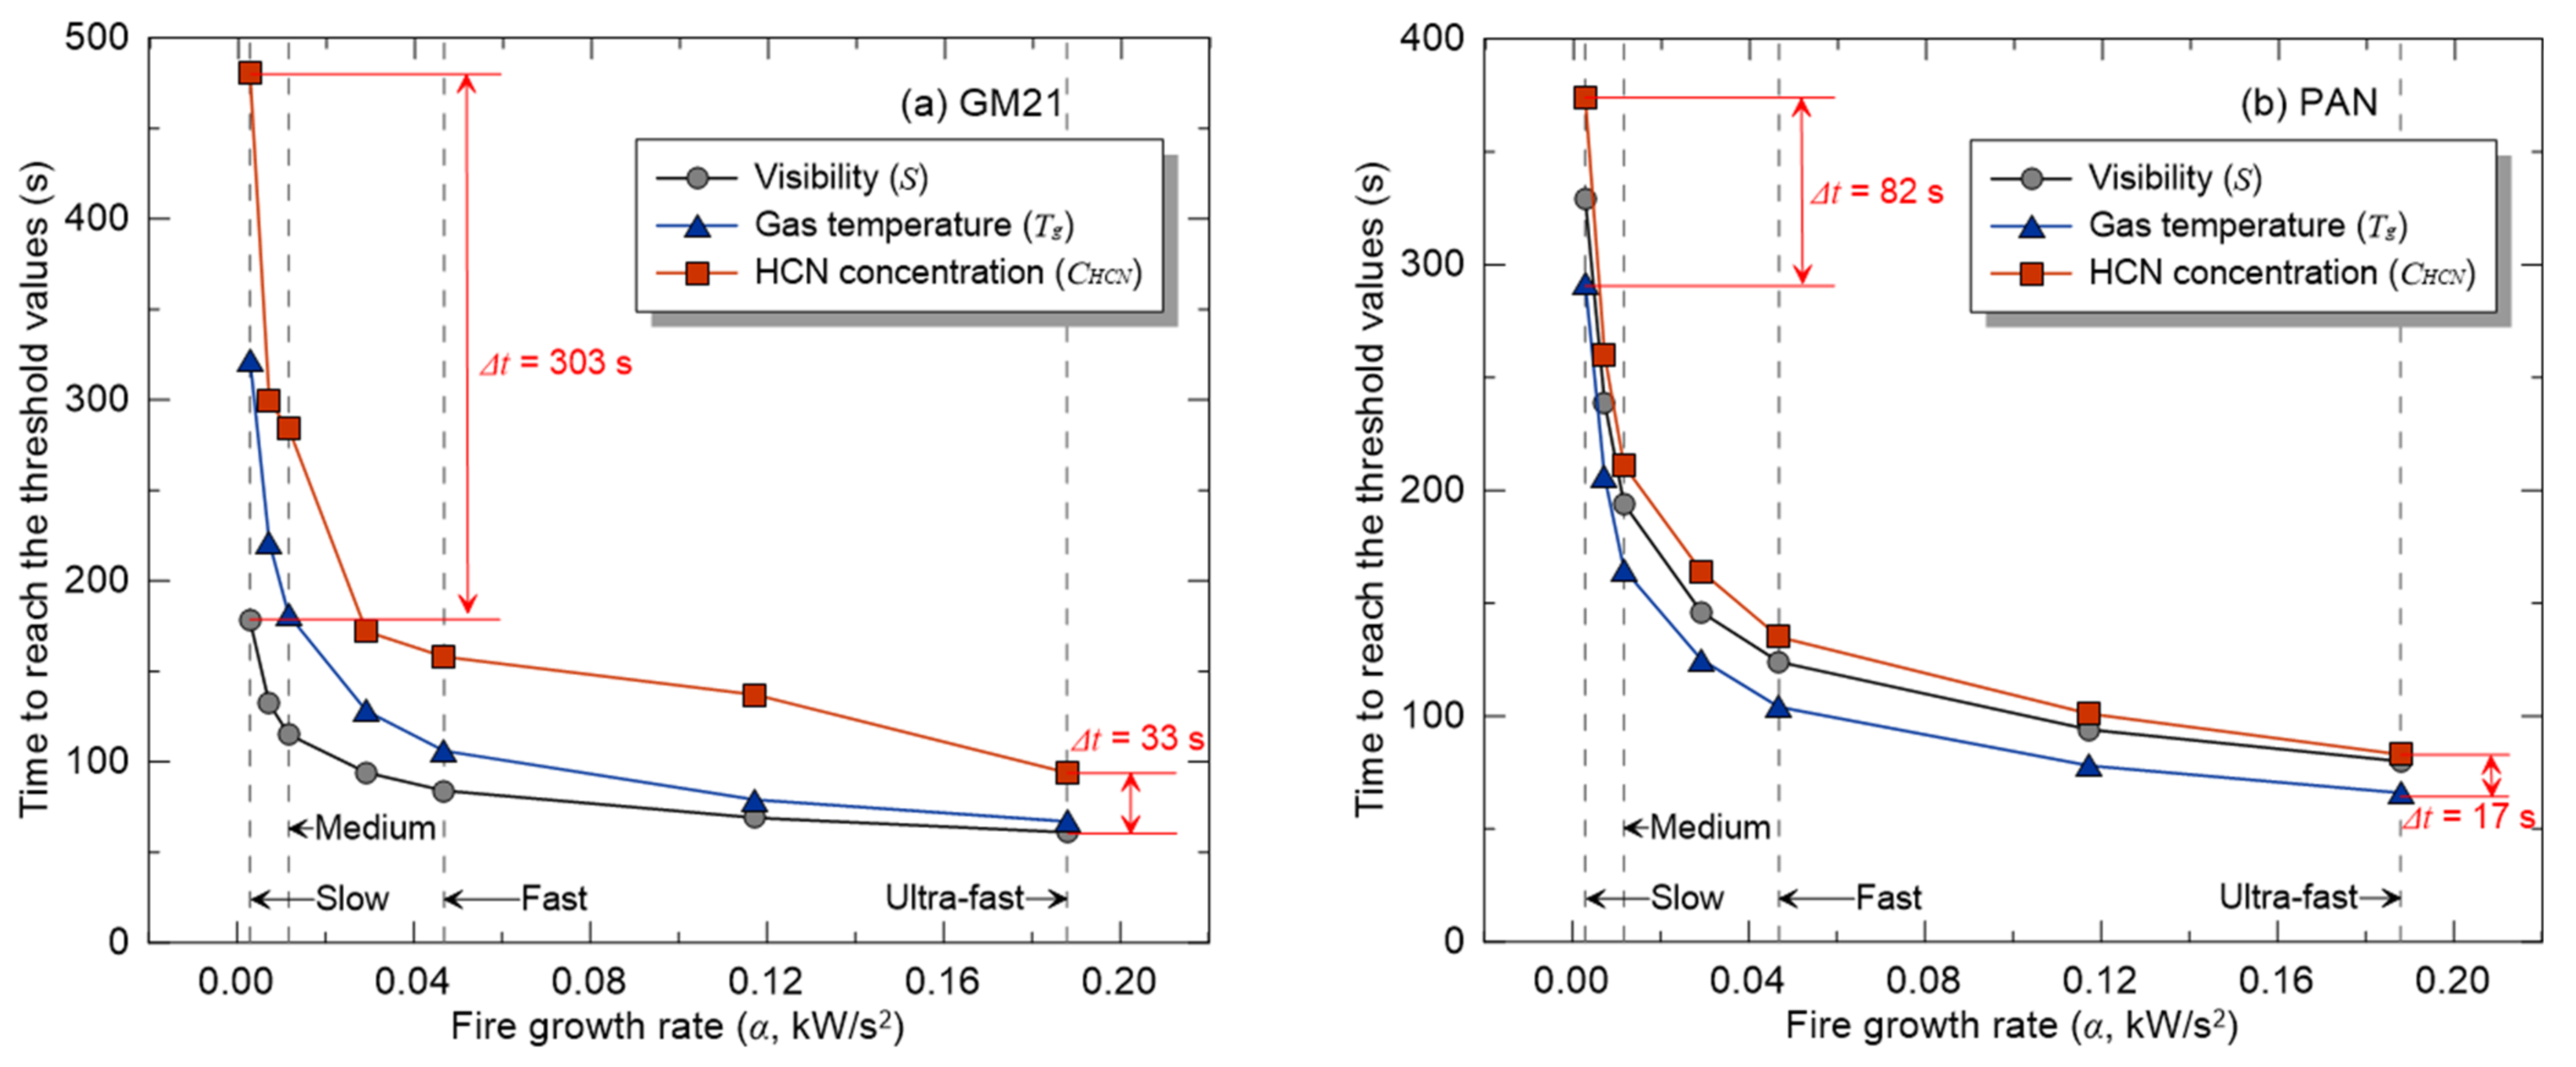
Figure 6 compares the times at which each parameter reaches the threshold values specified in the life safety code under varying FGR conditions. In this analysis, only the parameters with the highest RRS identified in Figure 5 (visibility, gas temperature, and HCN concentration) are shown. From the results of GM21 in Figure 6a, under the ‘Slow’ FGR condition, visibility reaches the threshold value at 178 s, while HCN concentration reaches the threshold at 481 s, indicating a difference of 303 s. As FGR increases, the time for each parameter to reach the threshold value decreases in an inverse proportionality manner, with a difference of approximately 33 s under the ‘Ultra-fast’ condition. From the results in Figure 6b, the gas temperature reaches the threshold value first, with gas temperature reaching it at 292 s and HCN concentration at 374 s under the ‘Slow’ FGR condition. In summary, the difference in the time for gas temperature and HCN concentration to reach the threshold value is 82 s under the ‘Slow’ condition and 17 s under the ‘Ultra-fast’ condition. Overall, as FGR increases, the time for each parameter to reach the threshold value decreases inversely, indicating a potential increase in the risk posed by HCN concentration.
Figure 7 shows the RRS evaluation results for the times at which each parameter identified in Figure 6 reaches the threshold values of the life safety code under varying FGR conditions. For GM21, as FGR increases, the RRS of all parameters except CO concentration exceeds approximately 80 points. Specifically, under the ‘Ultra-fast’ FGR condition, the RRS for visibility, gas temperature, and HCN concentration are evaluated to be 100, 99, and 91.8 points, respectively. Notably, as FGR increases from ‘Slow’ to ‘Ultra-fast’, the RRS for HCN concentration increases from 28.2 points to 91.8 points, showing scores similar to those of visibility and gas temperature. Similarly, for PAN, the RRS for HCN concentration also shows a high score of up to 79.5 points. Consequently, as FGR increases, the RRS for all parameters generally increases, and HCN concentration, in particular, shows results comparable to the risk scores for visibility and gas temperature.

3.3. HCN Yield Sensitivity Analysis Results

As part of evaluating the hazards of HCN in fires, a study was conducted to examine the impact of predicted HCN concentration results on ASET outcomes during fire simulations. The factor most directly related to the predicted HCN concentration is y H C N . Unlike y C O and y S , the information on y H C N is relatively limited in the field of fire engineering. Moreover, y H C N can vary significantly depending on ventilation conditions, and this factor should be considered when utilizing this information. Therefore, this study aimed to assess the potential risk by evaluating the variation in the time to reach the threshold through a sensitivity analysis of the y H C N values presented in Table 2, adjusted by ±50%. This considers the challenges and uncertainties in y H C N measurements, as well as variations due to ventilation conditions, under the selected fire simulation conditions.
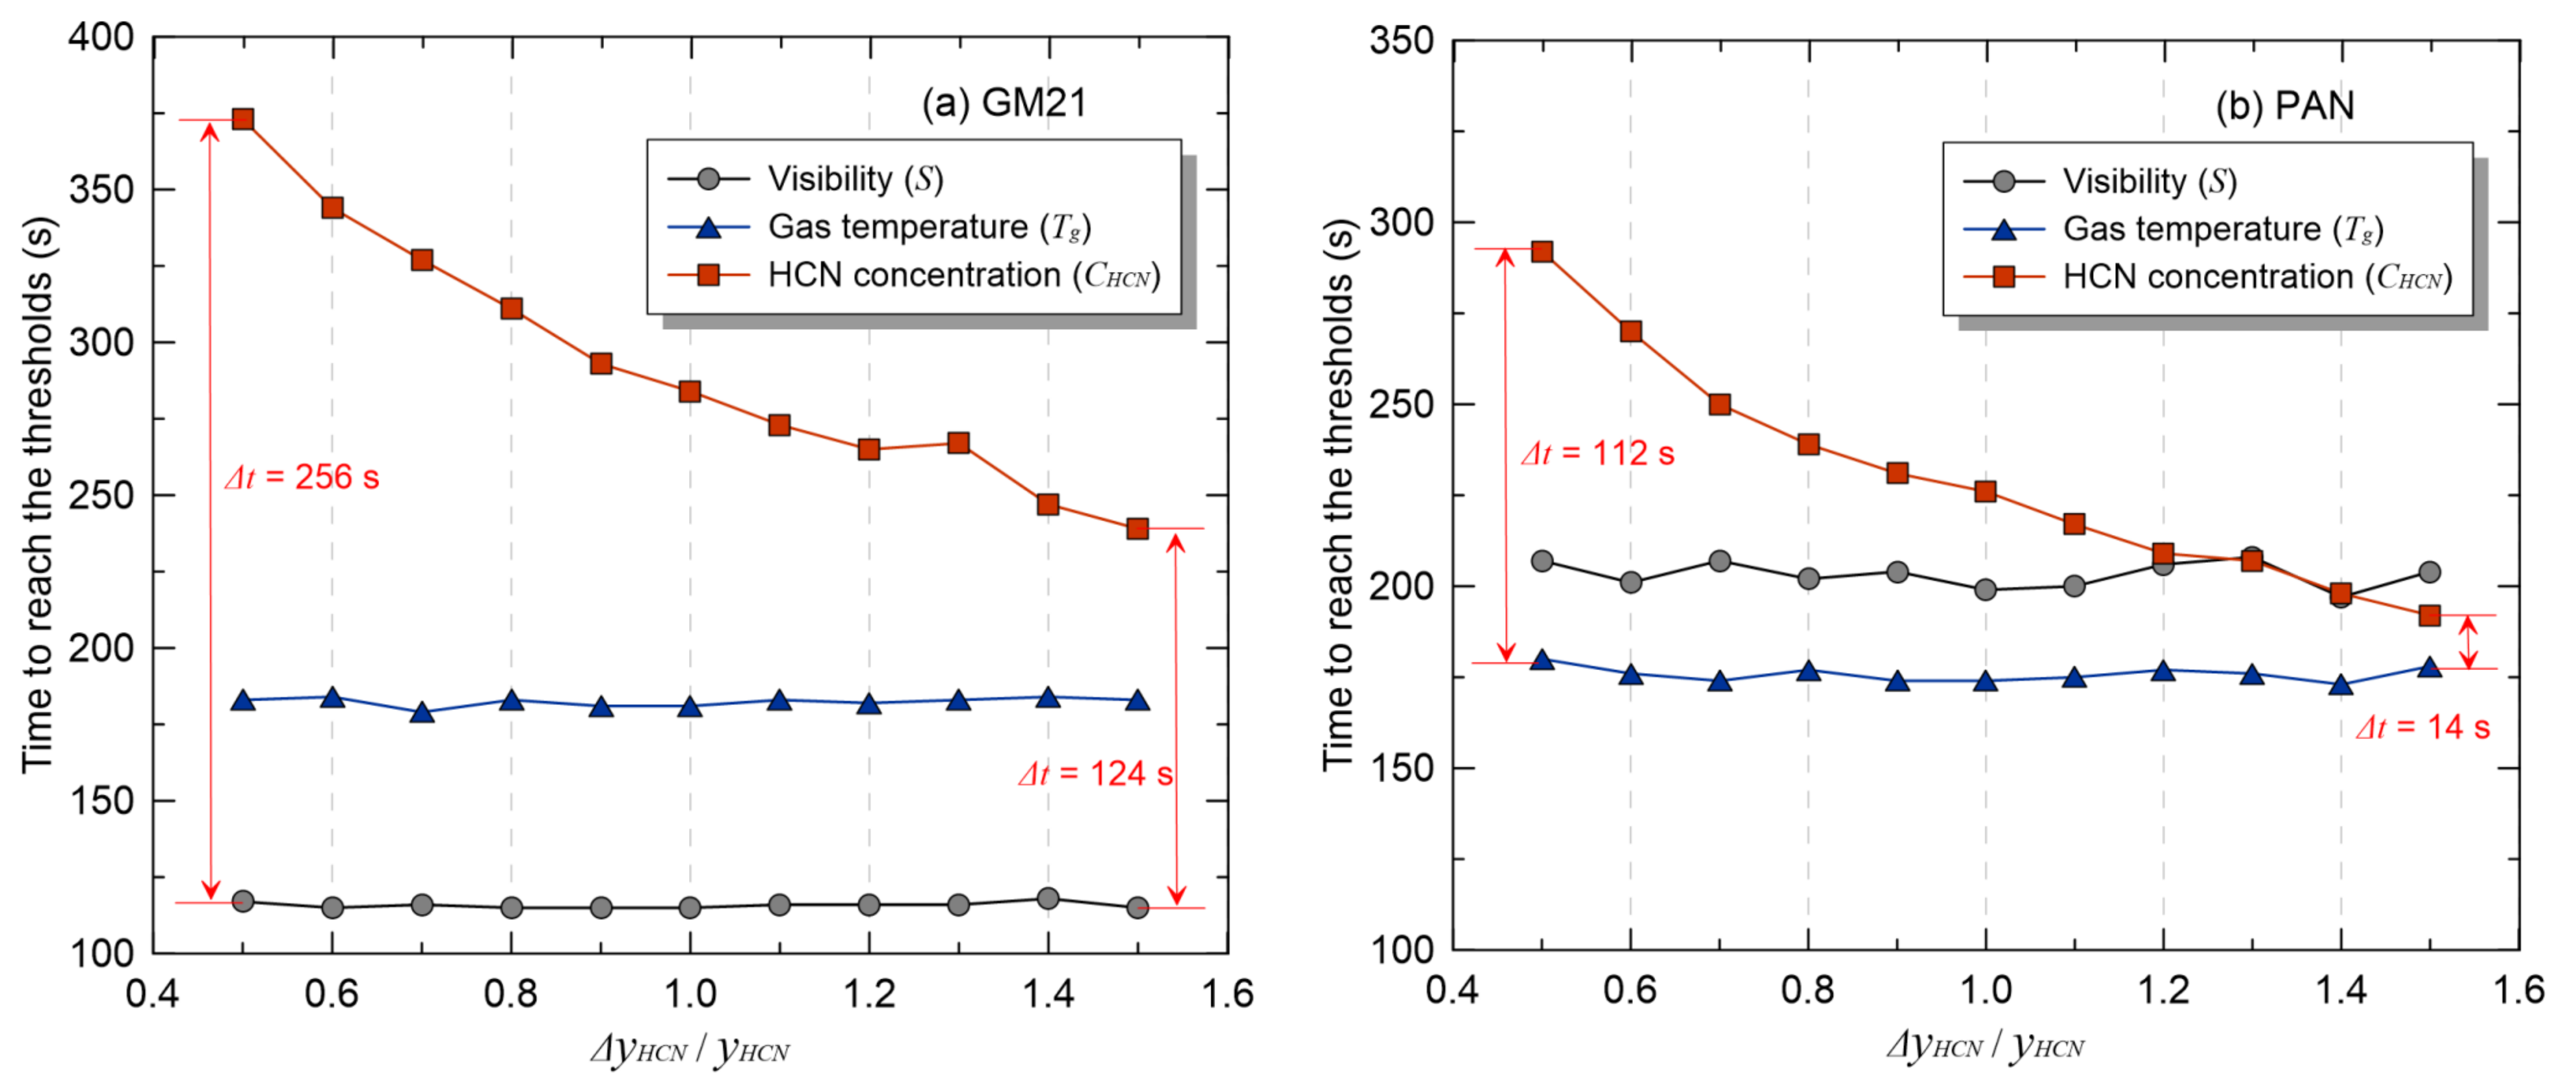
Figure 8 compares the times at which each parameter reaches the threshold values based on the sensitivity analysis of y H C N . Due to the sensitivity analysis on y H C N , the results for visibility and gas temperature show minimal differences but are remarkably similar. Examining the results for HCN concentration in Figure 8a for GM21, it is evident that, as expected, increasing the input y H C N in the fire simulation leads to a significant decrease in the time to exceed the threshold value. As the y H C N for GM21 increased by 1.5 times, the time for HCN concentration to exceed the threshold value decreased from 373 s to 239 s. Comparatively, this represented a difference of approximately 124 s compared to the fastest time to reach the threshold value for visibility. Similarly, Figure 8b shows that as y H C N increases, there is a sharp decrease in the time for HCN concentration to exceed the threshold value. Compared to the gas temperature, which exceeds the threshold value in the fastest time, the difference decreases dramatically from 112 s to 14 s according to the change in y H C N .
Figure 9 shows the results of evaluating the time to reach the threshold value of each parameter as RRS, based on the variation in y H C N observed in Figure 8. Since this is a sensitivity analysis on y H C N , only the RRS for HCN concentration changes. For GM21, when y H C N / y H C N = 0.5, the RRS is 47.0 points, but when y H C N / y H C N = 1.5, it increases to 74.4 points, indicating a rise of 27.4 points. Examining the results for PAN, RRS increases from 40.7 points to 92.7 points according to the change in y H C N , indicating that it could be comparable to the RRS for visibility and gas temperature. Previous studies measuring y H C N have shown that y H C N can increase by about 7 to 10 times depending on ventilation conditions, and thus, it can be deduced that the risk score for HCN concentration could increase significantly.
Consequently, within the fire simulation conditions considered in this study, the RRS evaluation results for HCN concentration showed a high score of up to approximately 92 points. ASET is determined according to the parameter that first reaches the threshold value of the life safety code, and it could be determined by visibility or gas temperature, which are close to 100 points in RRS. However, HCN concentration, which can indicate relatively high risk as a direct cause of casualties in fires, was found to be significant. Furthermore, considering the uncertainty in the measurement results and the need for expanded information on the input parameters required for predicting HCN, the impact of HCN on ASET is expected to be even greater.

4. Conclusions

Recently, the increasing proportion of polymer materials in building construction and interior furnishings, which generate HCN during combustion, has led to an elevated risk associated with HCN in fires. Despite this, current fire hazard assessments for PBD do not adequately consider the hazards posed by HCN. Therefore, this study conducted fire simulations to assess the potential risk posed by HCN during fires. The main conclusions are as follows:
In the evaluated fire simulation results, the RRS assessed based on the time each parameter reaches the threshold value indicated a maximum RRS of approximately 92 points for HCN concentration. With RRS values for visibility and gas temperature approaching 100 points, their relative risks were assessed as lower. However, compared to the RRS evaluations of O2, CO, and CO2 concentrations, HCN exhibited relatively higher RRS values. This reaffirms through fire simulation that, among the chemical species implicated in fatalities and injuries due to inhalation during fires, the risk associated with HCN is relatively high, as indicated by previous research [20].
The measurement of y H C N required for predicting HCN concentration in fire simulations is technically complex and entails significant time and costs. Therefore, compared to y C O and y s , there is limited accessible information, and establishing reliability for measured values is challenging. Moreover, under UVF conditions and hot gas temperature conditions, y H C N can increase by up to nine times [29]. Thus, it has been confirmed that expanding information on y H C N , ensuring the reliability of the measurements, and considering yield variations in fire environments could lead to a higher assessment of the risk associated with HCN.
To accurately evaluate the potential hazards associated with HCN in fire hazard assessments, it is necessary to first review the combustibles capable of generating HCN during combustion and select spaces and combustibles exposed to HCN hazards in the event of a fire. Additionally, for a precise prediction of HCN concentration in fire simulations, an accurate measurement of y H C N and an analysis of its variability based on fire environment and temperature are essential. While this approach may require significant time and costs, it is expected that such efforts will lead to a more accurate assessment of the potential risks associated with HCN in the future.

Author Contributions

Conceptualization, C.-H.H. and H.-S.H.; methodology, O.-S.K. and H.-S.H.; formal analysis, C.-H.H.; investigation, O.-S.K.; resources, C.-H.H.; data curation, O.-S.K.; writing—original draft preparation, H.-S.H.; writing—review and editing, O.-S.K.; visualization, O.-S.K.; supervision, C.-H.H.; project administration, C.-H.H.; funding acquisition, C.-H.H. All authors have read and agreed to the published version of the manuscript.

Funding

This paper was supported by the Korea Agency for Infrastructure Technology Advancement (KAIA) grant funded by the Ministry of Land, Infrastructure, and Transport (Grant RS-2022-00156237).

Institutional Review Board Statement

Not applicable.

Informed Consent Statement

Not applicable.

Data Availability Statement

The data used to support the findings of this study are available from the corresponding author upon request.

Conflicts of Interest

The authors declare no conflicts of interest.

References

  1. Beck, V.R. Performance-based Fire Engineering Design and Its Application in Australia. Fire Saf. Sci. 1997, 5, 23–40. [Google Scholar] [CrossRef]
  2. Babrauskas, V.; Fleming, J.M.; Russell, B.D. RSET/ASET, A flawed concept for fire safety assessment. Fire Mater. 2010, 40, 738–755. [Google Scholar] [CrossRef]
  3. Han, H.S.; Mun, S.Y.; Hwang, C.H. Effects of User Dependence on the Prediction Results of Visibility in Fire Simulations. Korean Inst. Fire Sci. Eng. 2021, 35, 14–22. [Google Scholar] [CrossRef]
  4. McGrattan, K.; Hostikka, S.; McDermott, R.; Flo, J.; Wein, C.; Over, K. Fire Dynamics Simulator: Technical Reference Guide, NIST SP 1018-1; National Institute of Standards and Technology: Gaithersburg, MD, USA, 2022; p. 6. [Google Scholar]
  5. Karter, M.J., Jr. Fire Loss in the United States during 2013; Fire Analysis Research Division; National Fire Protection Association: Quincy, MA, USA, 2014. [Google Scholar]
  6. McKenna, S.T.; Hull, T.R. The fire toxicity of polyurethane foams. Fire Sci. Rev. 2016, 5, 3. [Google Scholar] [CrossRef]
  7. Terrill, J.B.; Montgomery, R.R.; Reinhardt, C.F. Toxic Gases from Fires. Science 1978, 200, 1343–1347. [Google Scholar] [CrossRef] [PubMed]
  8. Hartzell, G.E. Overview of Combustion Toxicology. Toxicology 1996, 115, 7–23. [Google Scholar] [CrossRef] [PubMed]
  9. Purser, D.A.; Grimshaw, P. The Incapacitative Effects of Exposure to the thermal decomposition products of polyurethane foams. Fire Mater. 1984, 8, 10–16. [Google Scholar] [CrossRef]
  10. Purser, D.A. Toxic product yields and hazard assessment for fully enclosed design fires. Polym. Int. 2000, 49, 1033–1265. [Google Scholar] [CrossRef]
  11. Mori, T. Toxicity Evaluation of Fire Effluent Gases from Experimental Fires in building. Fire Sci. 1976, 5, 248–271. [Google Scholar]
  12. Mori, T. Evaluation of Toxic Gases from Building Polymeric Materials in a Small-scale Box Model. Fire Mater. 1988, 12, 43–49. [Google Scholar] [CrossRef]
  13. National Standards of the Republic of Korea. Performance Based Design Methods and Standards on Fire-Fighting System Design Installation Act; National Fire Agency: Sejong-si, Republic of Korea, 2013; Annex 1, p. 3-a. [Google Scholar]
  14. Buchanan, A.H. Fire Engineering Design Guide; Centre for Advanced Engineering, University of Canterbury: Canterbury, New Zealand, 1994. [Google Scholar]
  15. Hurley, M.J.; Rosebaum, E.R. Performance-Based Design. In The SFPE Handbook of Fire Protection Engineering; National Fire Protection Association: Quincy, MA, USA, 2016; pp. 1233–1261. [Google Scholar] [CrossRef]
  16. Hadjisophocleous, G.V.; Bénichou, N. NRCC-43976, Development of performance-based codes performance criteria and fire safety engineering methods. Int. J. Eng. Perform. Based Fire Codes 2000, 2, 127–142. [Google Scholar]
  17. BSI, PD 7974-6; The Application of Fire Safety Engineering Principles to Fire Safety Design of Buildings Part 6: Human factors: Life Safety strategies—Occupant Evacuation, Behavior and Condition. British Standards: London, UK, 2004.
  18. Hartzell, G.E.; Emmons, H.W. The Fractional Effective Dose Model for Assessment of Toxic Hazards in Fires. J. Fire Sci. 1988, 6, 356–362. [Google Scholar] [CrossRef]
  19. McGrattan, K.; Hostikka, S.; Floyd, J.; McDermott, R.; Vanella, M. Fire Dynamics Simulator: User’s Guide, NIST SP 1019; NIST: Gaithersburg, MD, USA, 2022; Volume 6. [CrossRef]
  20. Anderson, R.A.; Harland, W.A. Fire Deaths in the Glasgow Area: III the Role of Hydrogen Cyanide. Med. Sci. Law 1982, 22, 318–321. [Google Scholar] [CrossRef] [PubMed]
  21. He, Y. Evaluating visibility using FDS modeling result. In Proceedings of the Fire Safety Engineering International Conference, Melbourne, VIC, Australia, 18–19 March 2009. [Google Scholar]
  22. An, S.H.; Mun, S.Y.; Ryu, I.H.; Choi, J.H.; Hwang, C.H. Analysis on the Implementation Status of Domestic PBD (Performance Based Design)—Focusing on the Fire Scenario and Simulation. J. Korean Soc. Saf. 2017, 32, 32–40. [Google Scholar] [CrossRef]
  23. Purser, D.A. Combustion Toxicity. In The SFPE Handbook of Fire Protection Engineering; National Fire Protection Association: Quincy, MA, USA, 2016; Volume 5, pp. 2207–2307. [Google Scholar] [CrossRef]
  24. Orzel, R.A.; Womble, S.E.; Ahmed, F.; Brasted, H.S. Flexible Polyurethane Foam: A Literature Review of Thermal Decomposition Products and Toxicity. J. Am. Coll. Toxicol. 1989, 8, 1139–1175. [Google Scholar] [CrossRef]
  25. Hidalgo, J.P.; Torero, J.L.; Welch, S. Fire performance of charring closed-cell polymeric insulation materials: Polyisocyanurate and phenolic foam. Fire Mater. 2018, 42, 358–373. [Google Scholar] [CrossRef]
  26. Levin, B.C.; Paabo, M.; Fultz, M.L.; Bailey, C.S. Generation of Hydrogen Cyanide from Flexible Polyurethane Foam Decomposed under Different Combustion Condition. Fire Mater. 1985, 9, 125–134. [Google Scholar] [CrossRef]
  27. Witkowski, A.; Stec, A.; Hull, T.R. Thermal Decomposition of Polymeric Materials. In The SFPE Handbook of Fire Protection Engineering; National Fire Protection Association: Quincy, MA, USA, 2016; Volume 5, pp. 167–254. [Google Scholar] [CrossRef]
  28. Purser, D.A.; Purser, J.A. HCN Yields and Fate of Fuel Nitrogen for Materials under Different Combustion Conditions in the ISO 19700 Tube Furnace and Large-scale Fires. Fire Saf. Sci. 2008, 9, 1117–1128. [Google Scholar] [CrossRef]
  29. Stec, A.A.; Hull, T.R.; Lebek, K.; Purser, J.A.; Purser, D.A. The effect of temperature and ventilation condition on the toxic product yields from burning polymers. Fire Mater. 2008, 32, 49–60. [Google Scholar] [CrossRef]
  30. Purser, D.A.; Maynard, R.L.; Wakefield, J.C. Toxicology, Survival and Health Hazards of Combustion Products; Issues in Toxicology No. 23; The Royal Society of Chemistry: Cambridge, UK, 2015. [Google Scholar] [CrossRef]
  31. Bounagui, A.; Benichou, N.; McCartney, C.; Kashef, A. Optimizing the Grid Size Used in CFD Simulations to Evaluate Fire Safety in Houses. In Proceedings of the 3rd NRC Symposium on Computational Fluid Dynamics, High Performance Computing and Virtual Reality, Ottawa, ON, Canada, 4 December 2003. [Google Scholar]
  32. U.S. Nuclear Regulatory Commission (NRC); Electric Power Research Institute (EPRI). Verification and Validation of Selected Fire Models for Nuclear Power Plant Applications; NUREG-1824 and EPRI 3002002182, Final Report; U.S. Nuclear Regulatory Commission: Washington, DC, USA, 2016.
  33. Han, H.S.; Hwang, C.H. Study on the Available Safe Egress Time (ASET) Considering the Input Parameters and Model Uncertainties in Fire Simulation. Korean Inst. Fire Sci. Eng. 2019, 33, 112–120. [Google Scholar] [CrossRef]
Figure 1. Computational domain for residential building.
Applsci 14 06890 g001
Figure 2. Fire growth curve for residential building fire scenario.
Applsci 14 06890 g002
Figure 3. Gas temperature and HCN concentration with changes in grid size.
Applsci 14 06890 g003
Figure 4. Time history of predicted results of parameters related to ASET with changes in combustibles.
Applsci 14 06890 g004
Figure 5. Relative risk score evaluation of parameters using time to reach threshold value.
Applsci 14 06890 g005
Figure 6. Comparison of time to reach threshold values of parameters with fire growth rate.
Applsci 14 06890 g006
Figure 7. Relative risk score evaluation of parameters with fire growth rate.
Applsci 14 06890 g007
Figure 8. Comparison of time to reach threshold values of parameters with HCN yield.
Applsci 14 06890 g008
Figure 9. Relative risk score evaluation of parameters with HCN yield.
Applsci 14 06890 g009
Table 1. Comparison of life safety codes among countries.
Critical CriterionRepublic of Korea
[13]
New Zealand
[14]
Unite States of America
[15,18]
Canada [16]United Kingdom
[17]
LowerUpper
Layer Height1.8 m2.0 m2.5 m-2.5 m
Gas Temperature60 °C65 °C60 °C183 °C
(Upper Layer)
200 °C
(Upper Layer)
200 °C
(Upper Layer)
* Visibility10 m
7 m
5 m
5 m
10 m
-2 m
10 m
3 m
-
5 m
10 m
O2 Concentration15%12%FED ≤ 0.310%15%FED ≤ 0.3
CO2 Concentration5%5%FED ≤ 0.35%6%FED ≤ 0.3
CO Concentration1400 ppm1400 ppmFED ≤ 0.31400 ppm1700 ppmFED ≤ 0.3
HCN Concentration-80 ppmFED ≤ 0.3-80 ppm-
HCl Concentration--5 ppm---
* Republic of Korea: Visibility not less than 10 m for assembly or retail facilities; 7 m for guide lamps and guide signs; 5 m for other facilities. New Zealand: Visibility not less than 5 m for room/space ≤ 100 m2; 10 m for room/space > 100 m2. Canada: Visibility not less than 2 m or 3 m for primary fire compartments; 10 m for other rooms. UK: Visibility not less than 5 m for room/space ≤ 100 m2; 10 m for room/space > 100 m2.
Table 2. Combustion properties of combustibles used in fire scenarios [23].
CombustiblesFormula A / F s t o i c h Δ H c
(kJ/kg)
y C O
(g/g)
y s
(g/g)
y H C N
(g/g)
GM21CH1.8O0.3N0.053.1926,2000.0100.1310.0038
PIRC3H3O3N30.5631,3000.0480.0330.0030
PANC3H3N2.2630,8000.0390.0250.0080
WoolC6H10O51.1820,5000.0600.0260.0010
Table 3. Summary of uncertainty in fire model for quantities of interest.
Output Quantity σ ~ M δ
HGL Temperature0.071.05
Oxygen Concentration0.120.99
Carbon Dioxide Concentration0.110.98
Carbon Monoxide Concentration0.420.98
Smoke Concentration0.592.57
Species Concentration0.150.97
σ ~ M : relative standard deviation. δ : bias factor based on the results of the V&V study.
Disclaimer/Publisher’s Note: The statements, opinions and data contained in all publications are solely those of the individual author(s) and contributor(s) and not of MDPI and/or the editor(s). MDPI and/or the editor(s) disclaim responsibility for any injury to people or property resulting from any ideas, methods, instructions or products referred to in the content.