Article

Cortical and Subjective Measures of Individual Noise Tolerance Predict Hearing Outcomes with Varying Noise Reduction Strength

Department of Communication Sciences and Disorders, Montclair State University, Montclair, NJ 07043, USA
*
Author to whom correspondence should be addressed.
Appl. Sci. 2024, 14(16), 6892; https://doi.org/10.3390/app14166892
Submission received: 2 July 2024 / Revised: 30 July 2024 / Accepted: 3 August 2024 / Published: 6 August 2024
(This article belongs to the Section Applied Neuroscience and Neural Engineering)

Abstract

:
Noise reduction (NR) algorithms are employed in nearly all commercially available hearing aids to attenuate background noise. However, NR processing also involves undesirable speech distortions, leading to variability in hearing outcomes among individuals with different noise tolerance. Leveraging 30 participants with normal hearing engaged in speech-in-noise tasks, the present study examined whether the cortical measure of neural signal-to-noise ratio (SNR)—the amplitude ratio of auditory evoked responses to target speech onset and noise onset—could predict individual variability in NR outcomes with varying strength, thus serving as a reliable indicator of individual noise tolerance. In addition, we also measured subjective ratings of noise tolerance to see if these measures could capture different perspectives on individual noise tolerance. Results indicated a significant correlation between neural SNR and NR outcomes that intensified with increasing strength of NR processing. While subjective ratings of noise tolerance were not correlated with the neural SNR, noise-tolerance ratings could predict outcomes with stronger NR processing and account for additional variance in the regression model, although the effect was limited. Our findings underscore the importance of accurately assessing an individual’s noise tolerance characteristics in predicting perceptual benefits from various NR processing methods and suggest the advantage of incorporating both cortical and subjective measures in the relevant methodologies.

1. Introduction

Digital hearing aids have greatly advanced their ability to adapt to different listening environments. Typically, if a patient has good word recognition scores, once appropriate amplification is provided, the patient generally perceives great benefit in quiet. This is not always the case with noise [1,2,3]. Due to the complexity of hearing in a noisy environment, most digital hearing aids implement various noise-reduction (NR) algorithms to mitigate those challenges posed by background noise [4,5,6]. However, NR processing introduces a trade-off between the beneficial effect of noise attenuation and an undesired distortion of speech cues [e.g., Kates [7], Arehart, Souza [8]]. Individual responses to the conflicting effects introduced by NR vary based on patient perception; some hearing aid users may value the reduced noise level, whereas others are more detrimentally impacted by speech distortions [9,10,11]. The literature suggests that these varying responses among users are fairly stable individual characteristics [12,13] that are observed to apply across different NR strengths, indicating the importance of and need for personalizing NR processing [14,15,16,17].
In this study, the term noise tolerance is used to denote individual characteristics that encompass a listener’s sensitivity to noise itself, the ability to process speech embedded in noise, and the cognitive effort required to do so [18,19]. Although previous studies successfully highlighted individual variability in NR outcomes by employing various psychoacoustical and audiological measures, those approaches only partially accounted for individual noise tolerance that may drive this variability [9,16,20,21], suggesting the need for alternative methods sensitive enough to capture the neurophysiological mechanisms underlying the variability in individual noise tolerance and NR outcomes. Several studies indicated that cortical auditory evoked potential measurements, such as N1 and P2 latency and amplitude, can be predictive of individual speech perception ability in noise in populations of various ages and hearing statuses [22,23,24]. Emerging studies have also shown that neural tracking of the speech envelope might serve as an objective predictor of speech understanding performance in noisy environments [25,26,27] and that it could indicate enhanced neural representation of speech due to NR schemes [28,29]. Although critical, both the aspect of an individual’s ability to suppress the noise—potentially by engaging top-down attentional modulation even before encountering target speech sounds [30]—and the relationship between said ability and hearing outcomes have been largely overlooked in existing studies. More specifically, developing cortical measures that reflect an individual’s efficiency in both suppression of noise and neural encoding of target speech remains understudied, and using those cortical measures to empirically investigate the neurophysiological mechanisms underlying individual variability in NR outcomes has been minimally addressed within the field.
Our recent work introduced a novel cortical measure for quantifying individual noise tolerance at the sensor- or source-space level [30,31]. This approach hinged on respective cortical auditory responses to target speech onset and responses to noise onset, computing the amplitude ratio between these responses, named the neural signal-to-noise ratio (SNR) [31]. The neural SNR can provide a unique means of measuring noise tolerance, consistent with the literature indicating the increased neural form of target-to-masker ratios due to successful auditory scene analysis [32,33]. Our latest studies showed that the neural SNR can predict behavioral speech-in-noise performance in people with normal hearing [30] and in a large cohort of cochlear implant users [34,35], and NR outcomes in another cohort of people with normal hearing [31]. However, a gap in our knowledge remains concerning whether the neural SNR is capable of accounting for the variability in hearing outcomes with varying NR strength among the same individuals. If the neural SNR indeed captures the essence of individual noise tolerance, it should illuminate the variability observed in outcomes with stronger NR processing, which is characterized by more noise attenuation and more severe speech distortions. This would validate the neural SNR as a reliable measure of individual noise tolerance and enhance our understanding of complexities in NR outcomes associated with personal characteristics in response to the conflicting effects of NR processing.
Mackersie, Kim [18] suggested that subjective criteria for noise-tolerance judgments, including noise annoyance, speech interference, loudness, or distraction, could differ depending on an individual’s hearing status; people with normal hearing seemed more inclined to the aspects of noise itself (i.e., noise annoyance), whereas people with hearing impairment gave more weight to how the noise interfered with understanding speech (i.e., speech interference). Likewise, the cortical measures of noise tolerance (i.e., neural SNR) encompass the respective evoked responses to target speech onsets and noise onsets [31]. Our recent work on the neural SNR indicated different weighting of cortical processes between people with normal hearing, whose efficiency in inhibiting noise mainly predicted speech-in-noise performance [30], and those with hearing impairment, whose variance in perceptual performance was primarily explained by responses to target speech onset [34]. Notably, both subjective noise annoyance and cortical active suppression of background noise gauged using neural SNR together emerged as a significant factor in noise tolerance among people with normal hearing [18,30]. Considering both cortical and subjective measures together raises the pivotal question of whether these measures are reflective of the same aspects of individual noise tolerance (e.g., noise annoyance), and whether they collectively offer a comprehensive understanding of the variability in NR outcomes.
The present study aimed to investigate whether the variability in hearing outcomes with varying NR strength would be accounted for by individual noise tolerance using cortical and subjective measures, addressing the need to develop novel measures to characterize individual characteristics that predict benefits from NR strategies. We hypothesized that both cortical and subjective measures of noise tolerance would correlate with NR outcomes. Further, we expected to find that these measures would capture different facets of individual noise tolerance and collectively provide a comprehensive understanding of how noise tolerance impacts individual NR outcomes.

2. Materials and Methods

2.1. Participants

The study included thirty adults recruited from the student population at Montclair State University and the local community. Participants were between the ages of 18 and 35 (mean = 23.13 years, SD = 4.45 years). Hearing sensitivity was measured using a GSI AudioStar Pro (Grason-Stadler Inc., Littleton, MA, USA) with TDH-39P supra-aural headphones (Telephonics Corporation, Farmingdale, NY, USA). All participants had normal hearing, with pure-tone hearing thresholds no greater than 20 dB HL at 0.5, 1, 2, and 4 kHz in both ears, and hearing symmetry within 20 dB for each frequency. The participants reported that American English was their primary language of communication.

2.2. Task Design and Procedures

The experiment utilized consonant-vowel-consonant monosyllabic English words [36] embedded in stationary speech-shaped noise. The SNR level of the experiment was set at 0 dB, which aimed for a medium level of difficulty at around 75% accuracy based on our preliminary data. The composite stimuli, normalized to 80 dB A through root mean square (RMS) amplitude adjustments, were presented monoaurally to the better ear through ER-2 insert earphones (Etymotic Research, Elk Grove, IL, USA). The better ear was chosen based on pure-tone air conduction thresholds averaged across 0.5, 1, 2, and 4 kHz.
Participants were seated in a chair in a single-walled sound booth. A computer monitor was placed in front of the participants 0.5 m away from them at eye level. Every trial started with the indication of the trial number on the screen in silence for a half second, followed by another half second of the “+” sign centered on the screen. This plus sign continued throughout the trial, and participants were instructed to maintain focus on the sign to minimize the ocular artifacts. After the silent fixation to the plus sign for a half second, the stationary noise began 0.5 s before the onset of a target word and continued for 1.5 s (Figure 1 top panel). After the noise stimuli ended, participants were given four options on the screen and answered using a keyboard; for example, four words with a different initial consonant, in this case “sat”, “pat”, fat”, and “that”, were given for the target word “sat”. No feedback (i.e., correct or incorrect) was provided. Behavioral response accuracy and electroencephalographic (EEG) responses were recorded for each trial. Three sets of 55 target words (i.e., 165 different target words overall), balanced across initial phonemes regarding voicing, manner, and place of articulation, were randomly assigned to each of three experimental conditions: NR off, NR 1, and NR 2. The details regarding the implementation of NR algorithms and calculations of the neural SNR are described in later sections. The experiment was implemented in MATLAB (R2022b, MathWorks, Natick, MA) with the Psychtoolbox-3 [37].
Further, participants were asked to complete the abbreviated version of the Weinstein Noise Sensitivity Questionnaire [38,39], with ten items to evaluate subjective ratings of noise tolerance in daily life. The sample questions included the statement, ‘I get used to most noises without much difficulty’. using a Likert scale from 1 (strongly disagree) to 6 (strongly agree). Scales for the questions with opposite directions (i.e., negative statements) were reversed during the calculation process; the greater the score, the greater the noise tolerance they may have. Mackersie, Kim [18] suggested that the Weinstein Questionnaire scores were highly correlated with the noise annoyance criterion rather than other noise-tolerance domains of loudness, distraction, or speech interference.

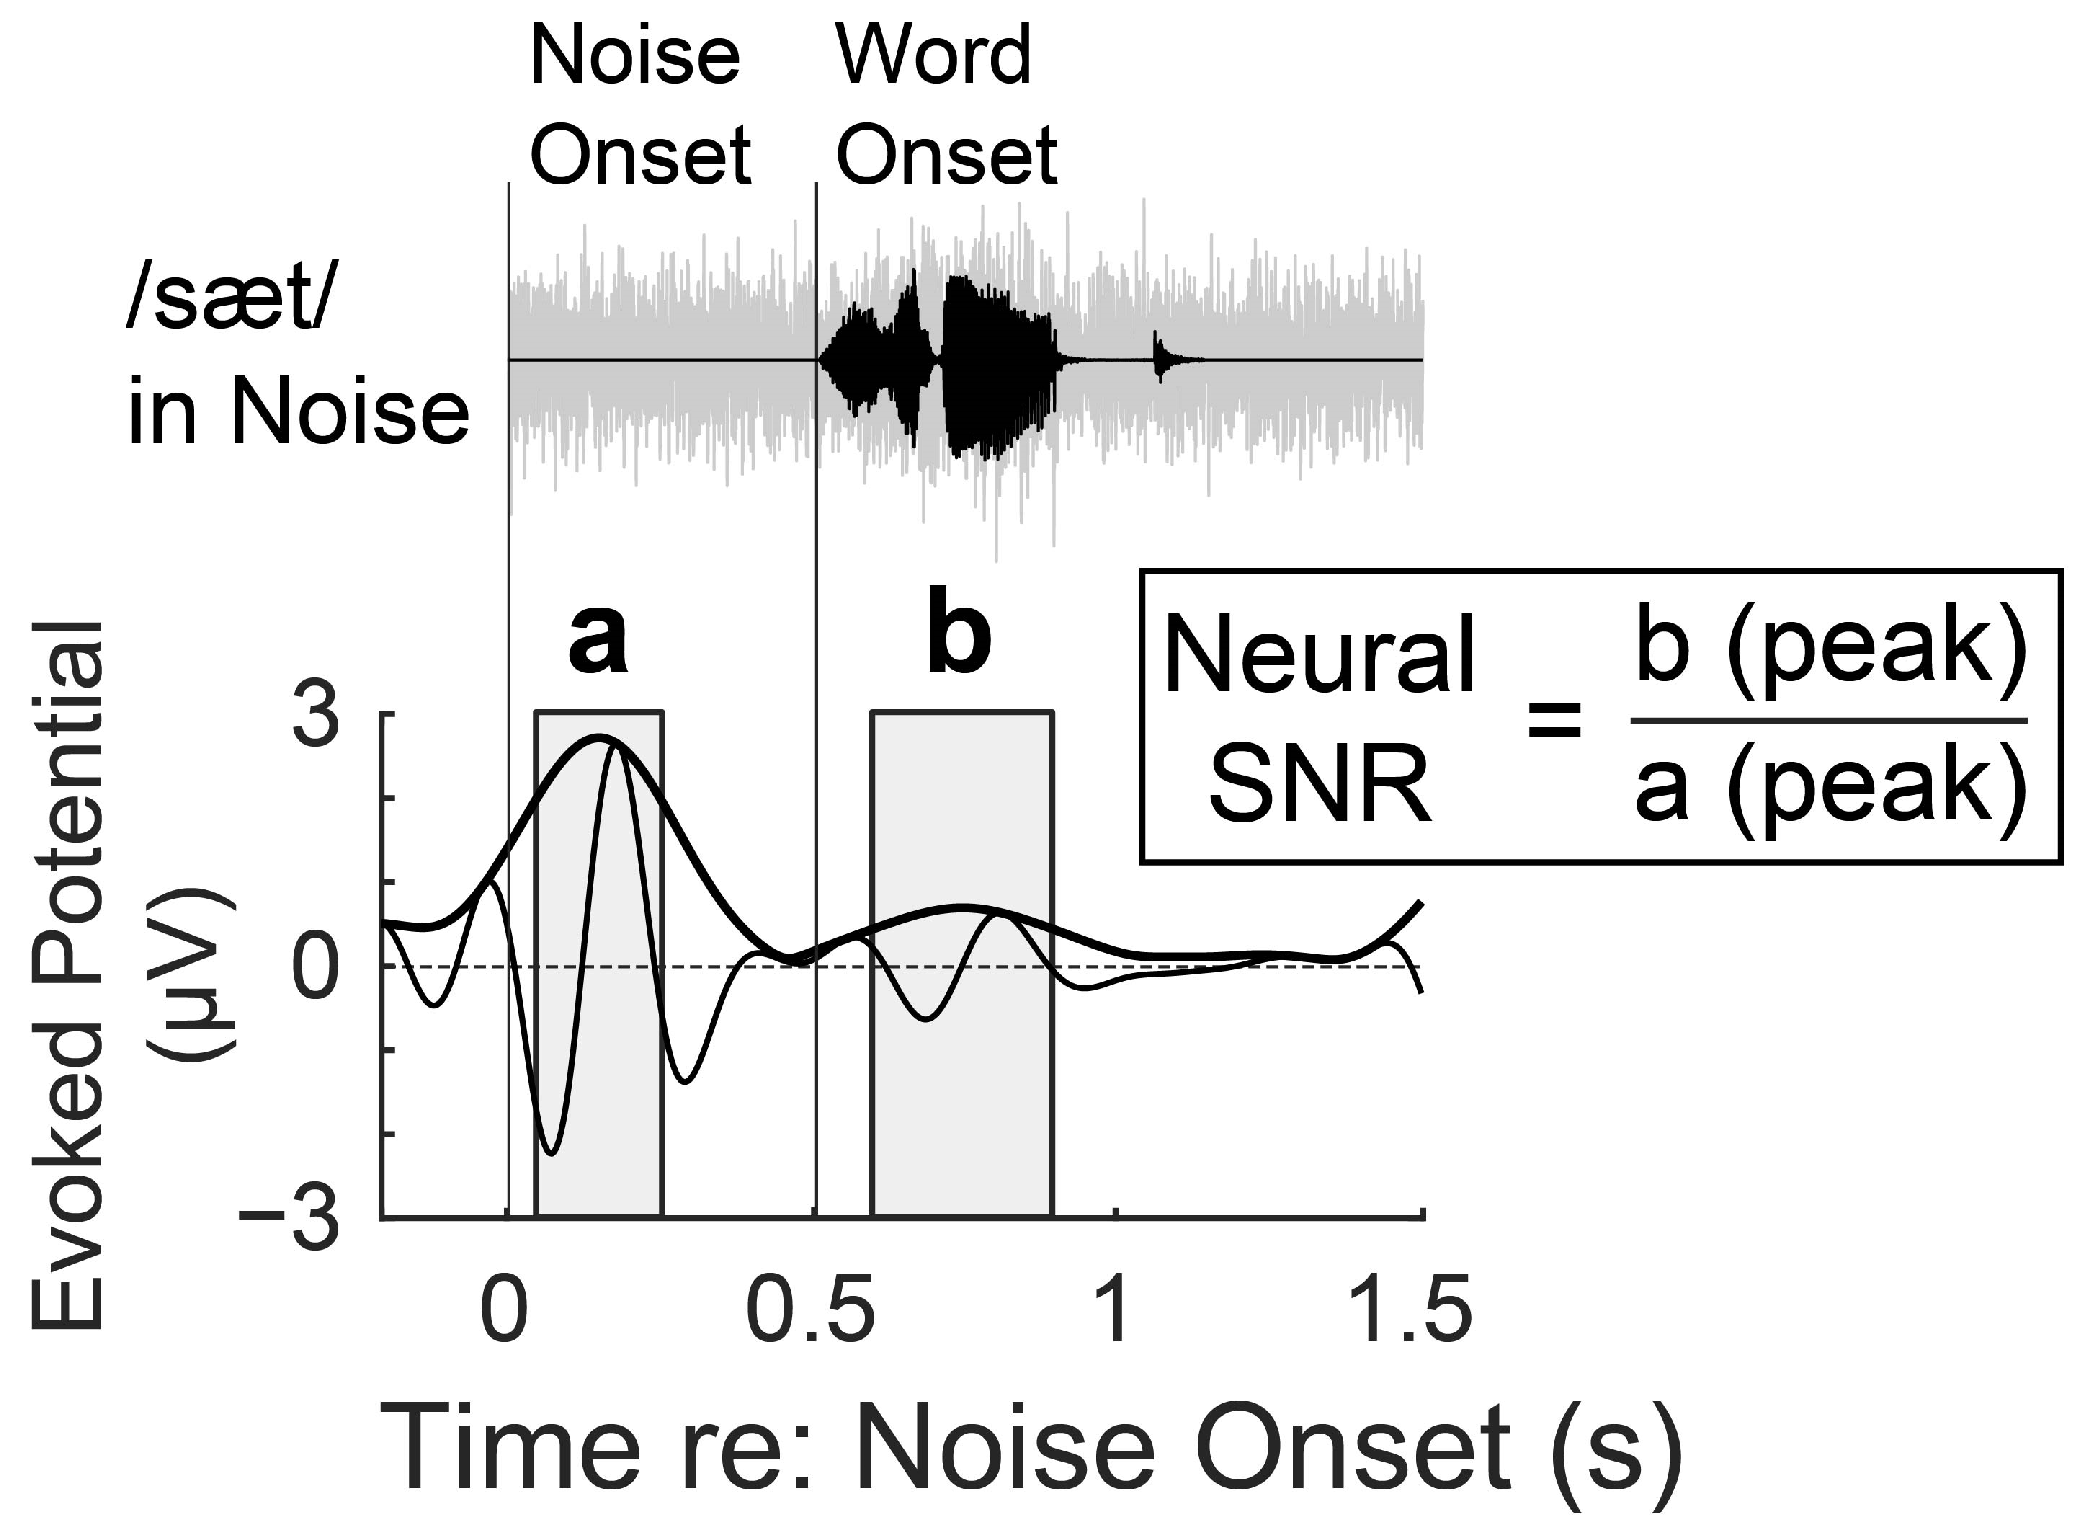
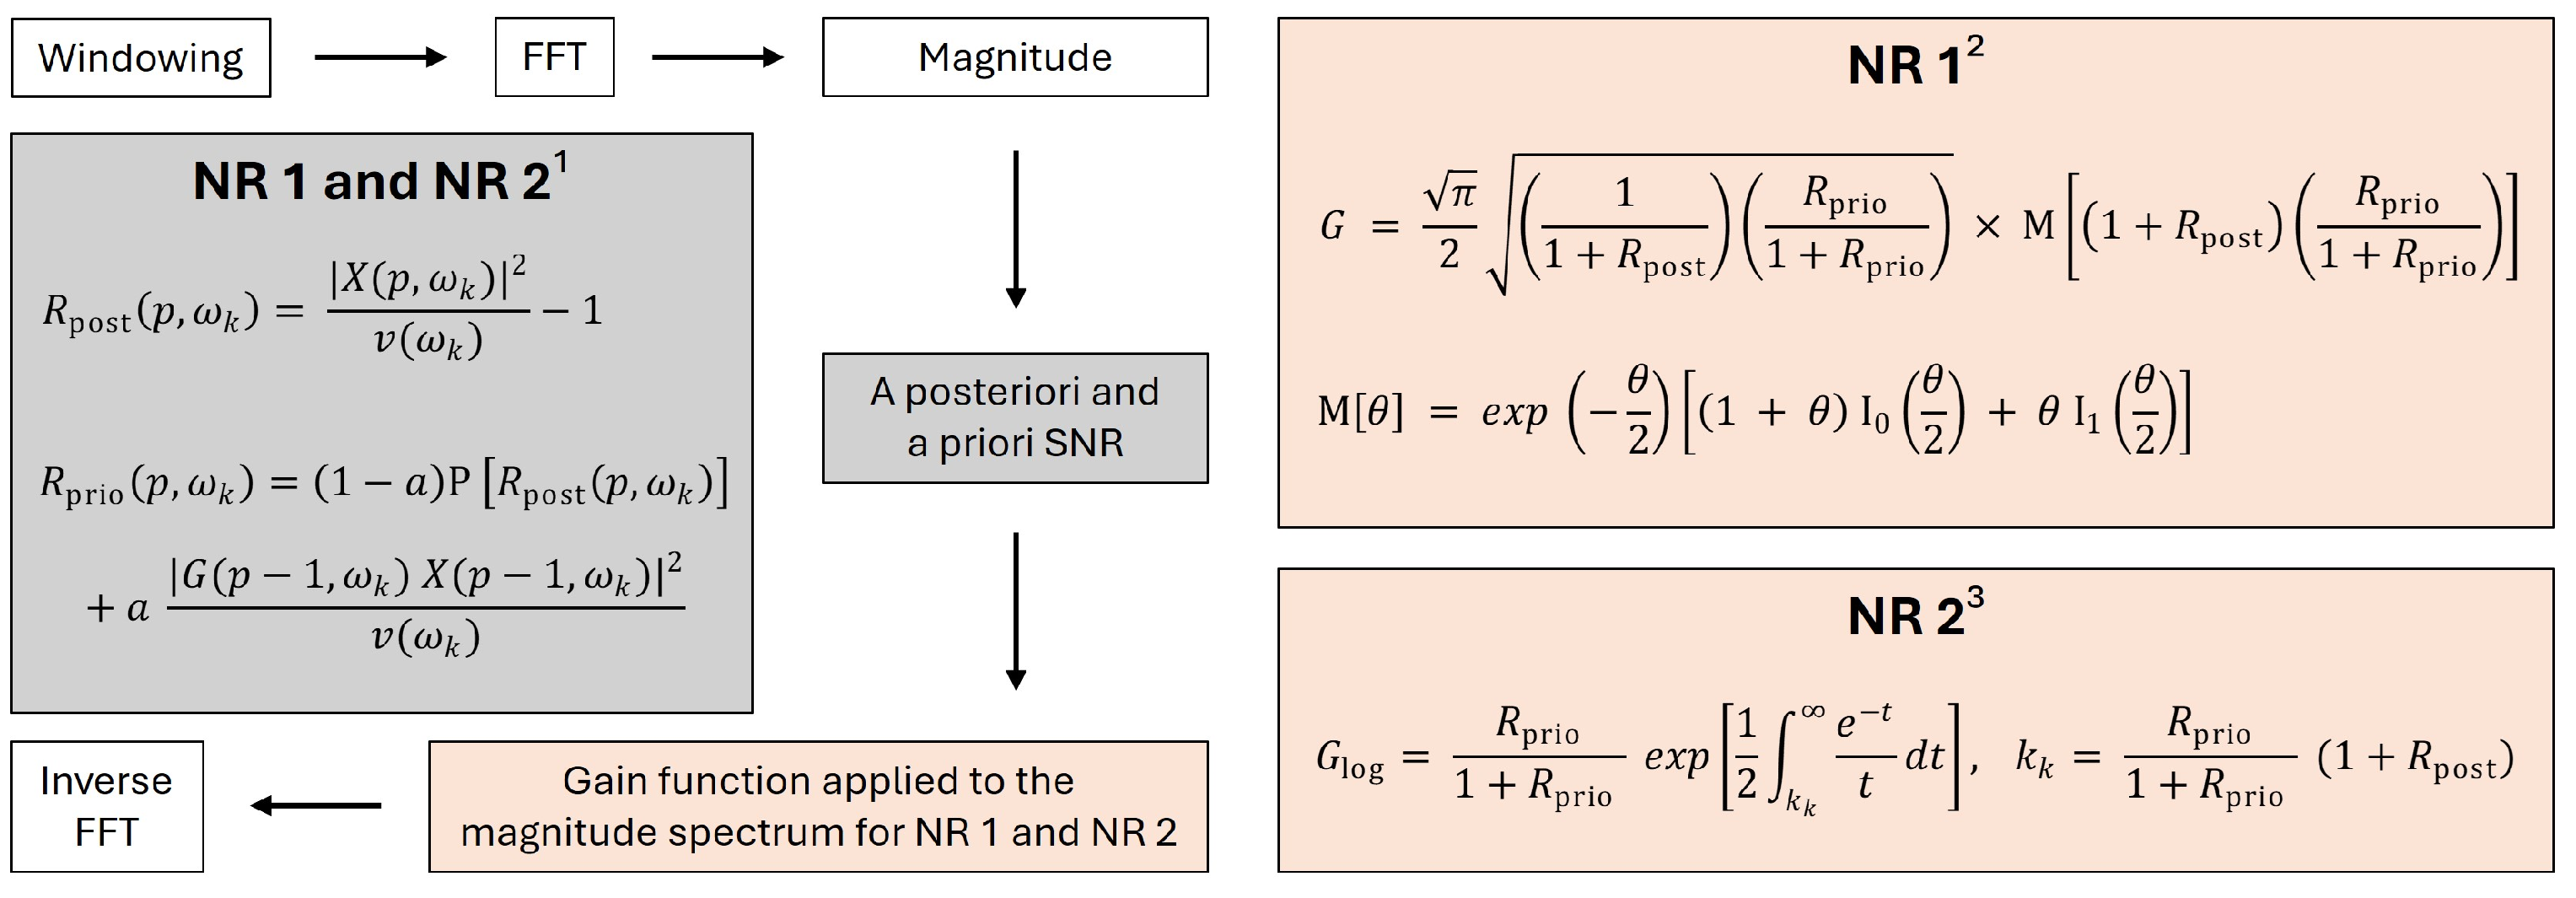
2.3. Quantification of NR Effects on Stimuli

The current study used two spectral subtraction-based NR algorithms [40,41]: one with a minimum mean-square error (MMSE) estimator (hereafter referred to as NR 1) and the other algorithm (hereafter referred to as NR 2) that extends the MMSE estimation to the log-spectral domain to further attenuate noise. These Ephraim-Malah NR algorithms [40,41] are known for having relatively few artifacts in the residual noise (i.e., stochastic musical noise phenomenon), low computational load, and no dependence on previously learned noise sets (Cappé, 1994; Marzinzik, 2001). Both NR algorithms process the input signal frame by frame, with each 20-ms frame defined using the Hamming window. They start by applying a fast Fourier transform (FFT) and calculating the magnitude spectrum of the short-time frame, followed by estimating a priori and a posteriori SNR to determine the spectral gain for each frame, and then apply the inverse FFT to convert the signal into the temporal domain [for the detailed process, see Figure 2 with notation adopted from Cappé (1994); Marzinzik (2001)]. These modified spectral-subtraction algorithms were implemented in several digital hearing aids [e.g., Sarampalis, Kalluri [42], Stelmachowicz, Lewis [43]] and have provided foundational work for applying contemporary machine learning techniques to NR [e.g., Park, Cho [44]].
Accurate quantification of the SNR improvement and the speech distortion induced by the NR algorithms is critical to gaining a comprehensive understanding of how these NR algorithms affect changes in behavioral and physiological outcomes [45]. The phase-inversion technique [46] was employed to measure the SNR after applying NR. This approach, commonly used in hearing-aid studies [20,47,48], combines two NR-processed noisy signals that are identical but have a different (inverted) noise phase. By adding or subtracting two outputs, the post-NR speech signal and noise stimuli were extracted and used to measure SNR changes. Further, the degree of spectral distortion driven by NR was evaluated using the magnitude-squared coherence method [49]. This spectral analysis technique is frequently used in studies of signal-processing schemes [e.g., Kates and Arehart [50], Lewis, Goodman [51], Fynn, Nordholm [52]] to assess the coherence between input and output signals in a range from zero to one, where zero indicates two signals are totally different and one indicates they are identical. The current study measured the spectral coherence between NR-processed speech stimulus extracted by the phase-inversion method and unprocessed speech stimulus.
Figure 3 illustrates how both NR algorithms affect speech and noise stimuli when a target word is embedded in stationary speech-shaped noise that mimics the spectral properties of speech stimuli at 0 dB SNR. In the current study, NR 1 and NR 2 provided about a 3.5-dB and a 5-dB increase in SNR calculated based on the unweighted long-term RMS levels, respectively. The spectral coherence, which averaged up to 22 kHz between a pair of unprocessed and NR-processed speech stimuli, was around 0.60 and 0.26 for NR 1 and NR 2, respectively, showing that NR 2 provides stronger noise attenuation but induces more spectral distortion in speech than NR 1.

2.4. Data Acquisition and Preprocessing

EEG data was recorded during the speech-in-noise task at a rate of 4096 Hz using the BioSemi ActiveTwo system (BioSemi B.V., Amsterdam, The Netherlands). Electrodes with 64-channels were placed in line with the international 10–20 layout. The data from each electrode were bandpass filtered from 1 to 50 Hz, using a zero-phase finite-impulse-response filter with symmetric, non-causal response patterns [53], and re-referenced to the average amplitude from two reference electrodes at the mastoids. 3-s long epochs were extracted from 0.5 s before the stimulus onset to 1 s after the offset. Each epoch was baseline-corrected by subtracting the average amplitude of the pre-stimulus period from −200 ms to 0 ms relative to the stimulus onset and down-sampled to 256 Hz. Then, the Infomax algorithm (Makeig et al., 1996) implemented in EEGLAB [54] was used to decompose a set of epochs into independent components of multiple sources. The ocular artifact components were identified and removed from the data by visually examining the standard patterns (e.g., a robust frontal-channel activity or decreasing magnitude on the spectrum as a function of frequency) from the component scalp map, time course, and power spectrum. The reconstructed and cleaned epochs were averaged for each experimental condition, regardless of behavioral accuracy, to generate event-related potentials (ERPs) per condition at each electrode.
The neural SNR was calculated using ERPs in the “NR-off” condition averaged across the front-central channels (FZ, FCz, FC1, FC2, and Cz). After ERP data were bandpass-filtered between 2 and 7 Hz again with zero-phase distortion, Hilbert transformation was applied, and then the absolute value was taken to derive the temporal envelopes. ERP temporal envelopes were used, as we evaluated the overall temporal dynamics of evoked potentials in the sensor space rather than focusing on a single ERP component. The peak amplitude of temporal envelopes obtained across 100 to 400 ms after the word onset was compared to that across 50 to 250 ms after the noise onset to compute the neural SNR in a dB scale (Figure 1 bottom panel). The concept of the neural SNR aligns well with the literature illustrating the enhanced neural representation of target-to-masker ratios due to efficient auditory scene analysis [32,33]. Since its introduction by Kim, Schwalje [30], the neural SNR has been used as an EEG measure of how individuals react differently to background noise and target words in multiple studies with varying hearing populations [31,34,35]. The original study [30] validated this cortical index by comparing two performance groups (good vs. poor); significantly different evoked responses occurred at the onset of task stimuli, whereas evoked responses to the neutral cue phrase “check the word” (not included in the current study) were not different between the two groups, indicating that individual differences in neural SNR were directly related to the speech-in-noise task.

2.5. Statistical Analysis

First, a one-way repeated-measures ANOVA was conducted on behavioral performance (accuracy) to evaluate the NR effects, followed by post hoc analyses to investigate whether NR algorithms used in the present study significantly changed the accuracy. Then, Pearson correlation analysis was conducted to investigate if the neural SNR and subjective noise-tolerance ratings correlated with accuracy changes. The neural SNR was calculated for each individual using leave-one-out grand averages of ERP temporal envelopes obtained from jackknife analysis, while individual subjective ratings were calculated by averaging scores across ten items from the Weinstein Questionnaire. Further, the relationship between the neural SNR and subjective ratings was evaluated using Pearson correlation coefficients. Lastly, in the case of both neural SNR and subjective ratings showing significant correlations with changes in accuracy, a multiple linear regression model was constructed incorporating both predictors in a stepwise manner, given that cortical and subjective measures may reflect different perspectives of individual noise tolerance.

3. Results

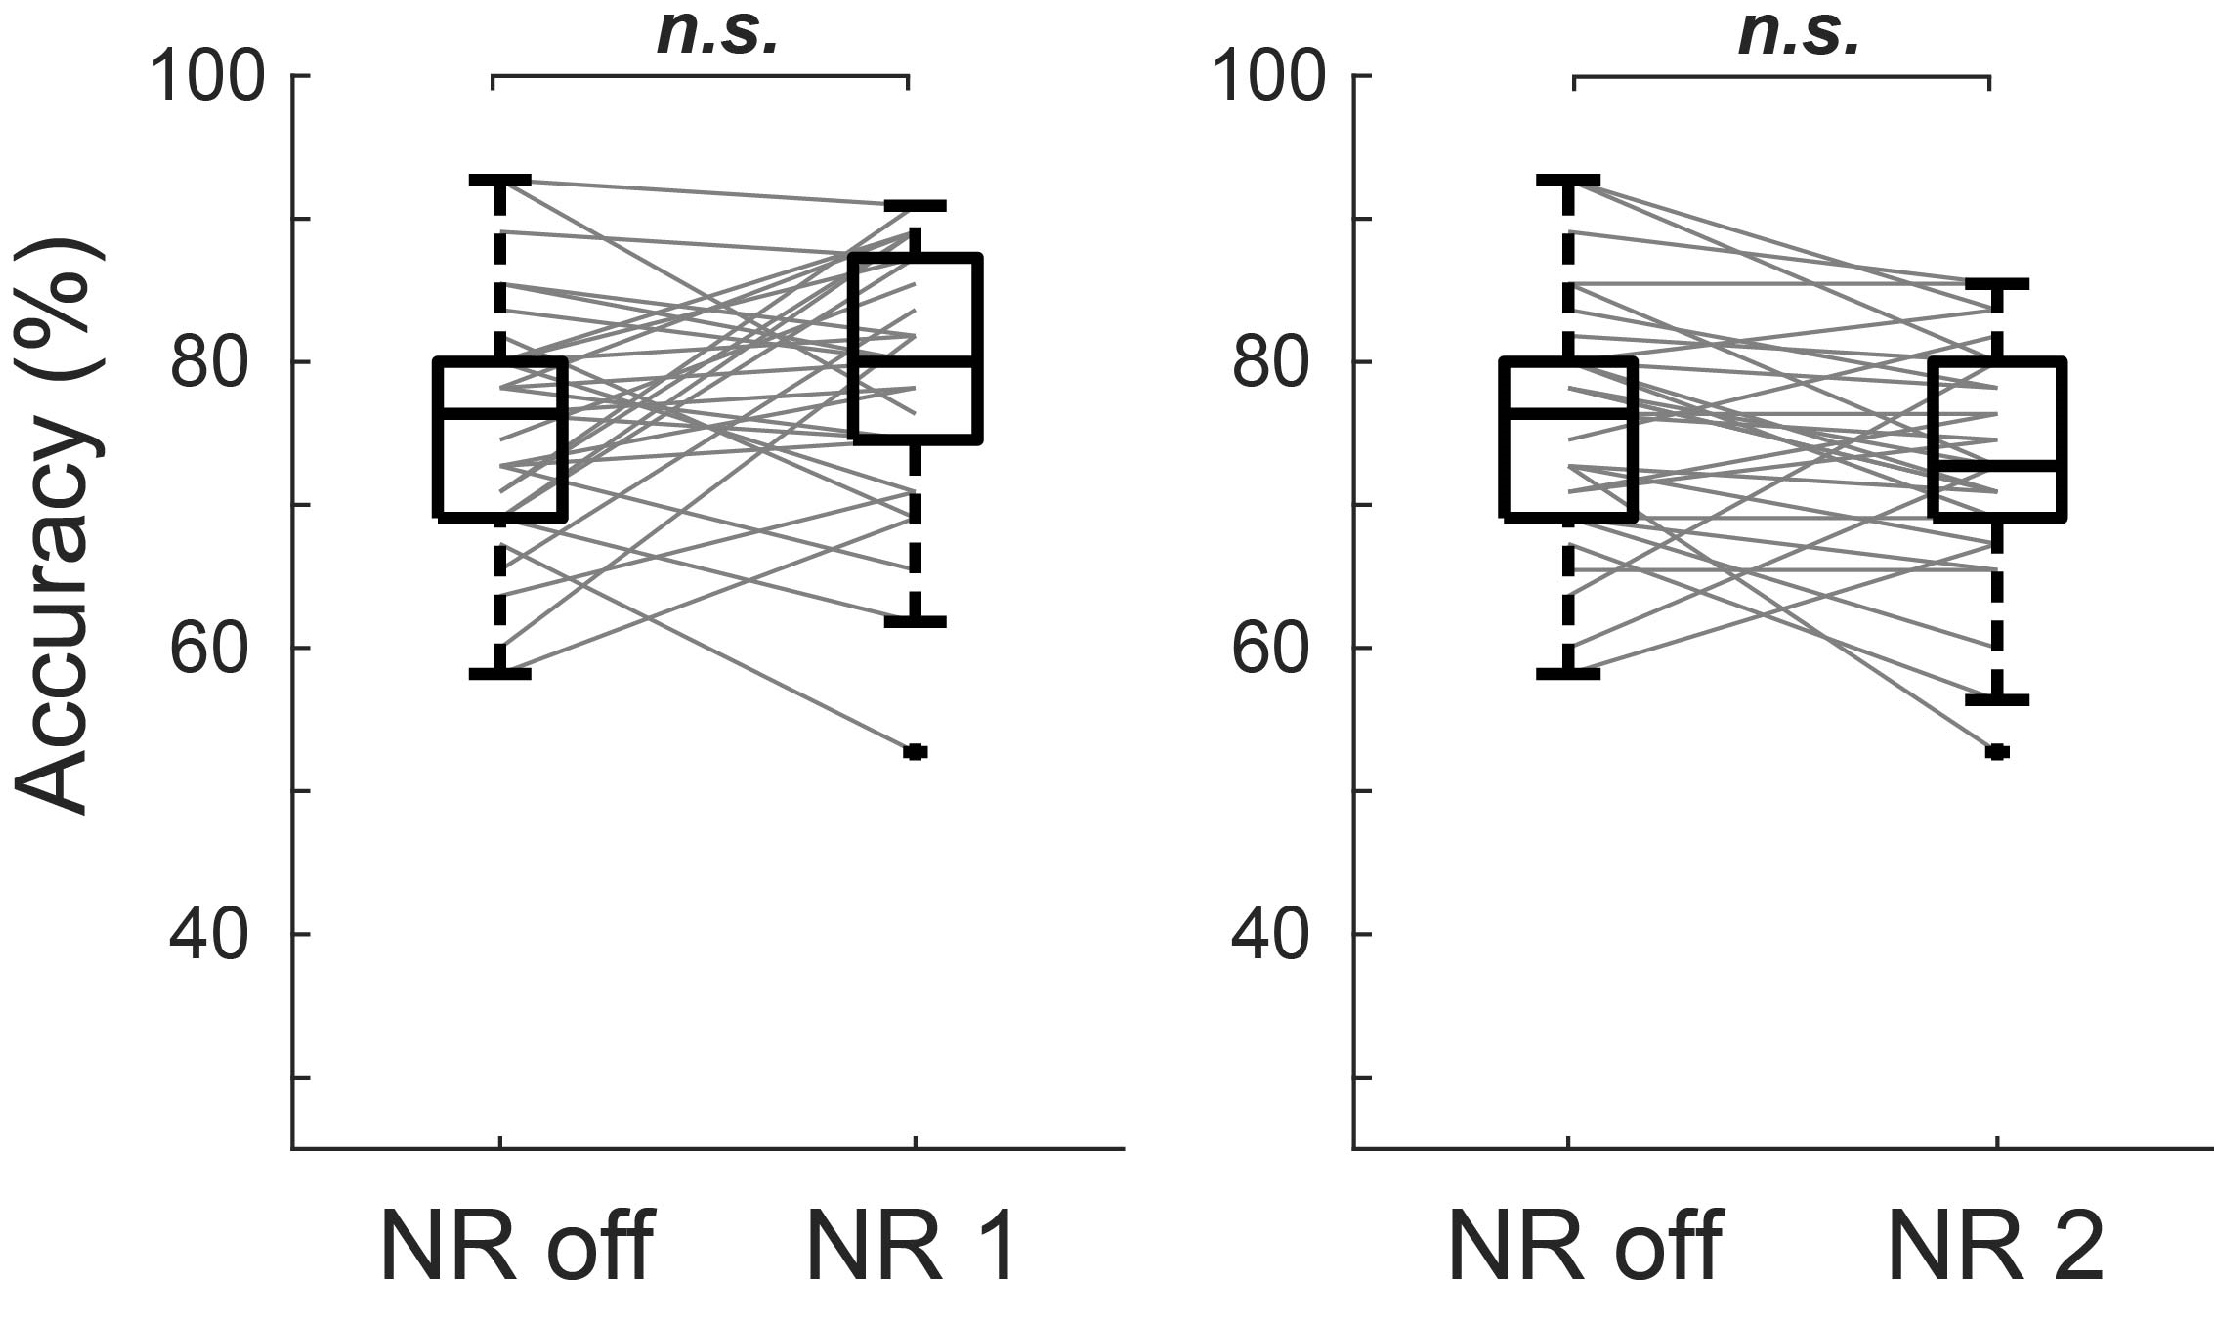
3.1. Behavioral Performance

Participants showed a large variance in their behavioral accuracy performance (NR off: mean = 75.82%, median = 76.36%, SD = 8.75%; NR 1: mean = 79.03%, median = 80.00%, SD = 9.38%; NR 2: mean = 73.09%, median = 72.73%, SD = 8.15%). A one-way repeated-measures ANOVA showed the significant effect of NR on behavioral accuracy (F2,58 = 6.00, p = 0.004). Post hoc analysis with Bonferroni corrections indicated that although performances from NR 1 and NR 2 were significantly different (t(29) = 3.46, adjusted p = 0.003), none of the NR conditions were different from NR-off conditions (NR 1 vs. NR off: t(29) = 1.87, adjusted p = 0.20, NR 2 vs. NR off: t(29) = −1.59, adjusted p = 0.35). These results are consistent with the literature, which reported no enhancement in behavioral performance with NR processing [e.g., Bentler, Wu [5], Ricketts and Hornsby [55]]. However, Figure 4 revealed a large individual variance in performance change due to NR; 17 people (57%) had better or the same performance when NR 1 was provided, as opposed to 11 people (37%) when NR 2 was provided. Note that 9 out of those 11 people (about 82%) also showed increased performance when NR 1 was given, suggesting that the same underlying individual characteristics might affect performance changes in both conditions. Indeed, NR 1-driven accuracy changes (NR 1 minus NR off) and NR 2-driven accuracy changes (NR 2 minus NR off) were highly correlated (r = 0.58, p < 0.001) among all participants. The following section discusses how the variance in NR-driven accuracy change (Δaccuracy) correlated with cortical and subjective measures of individual noise tolerance.

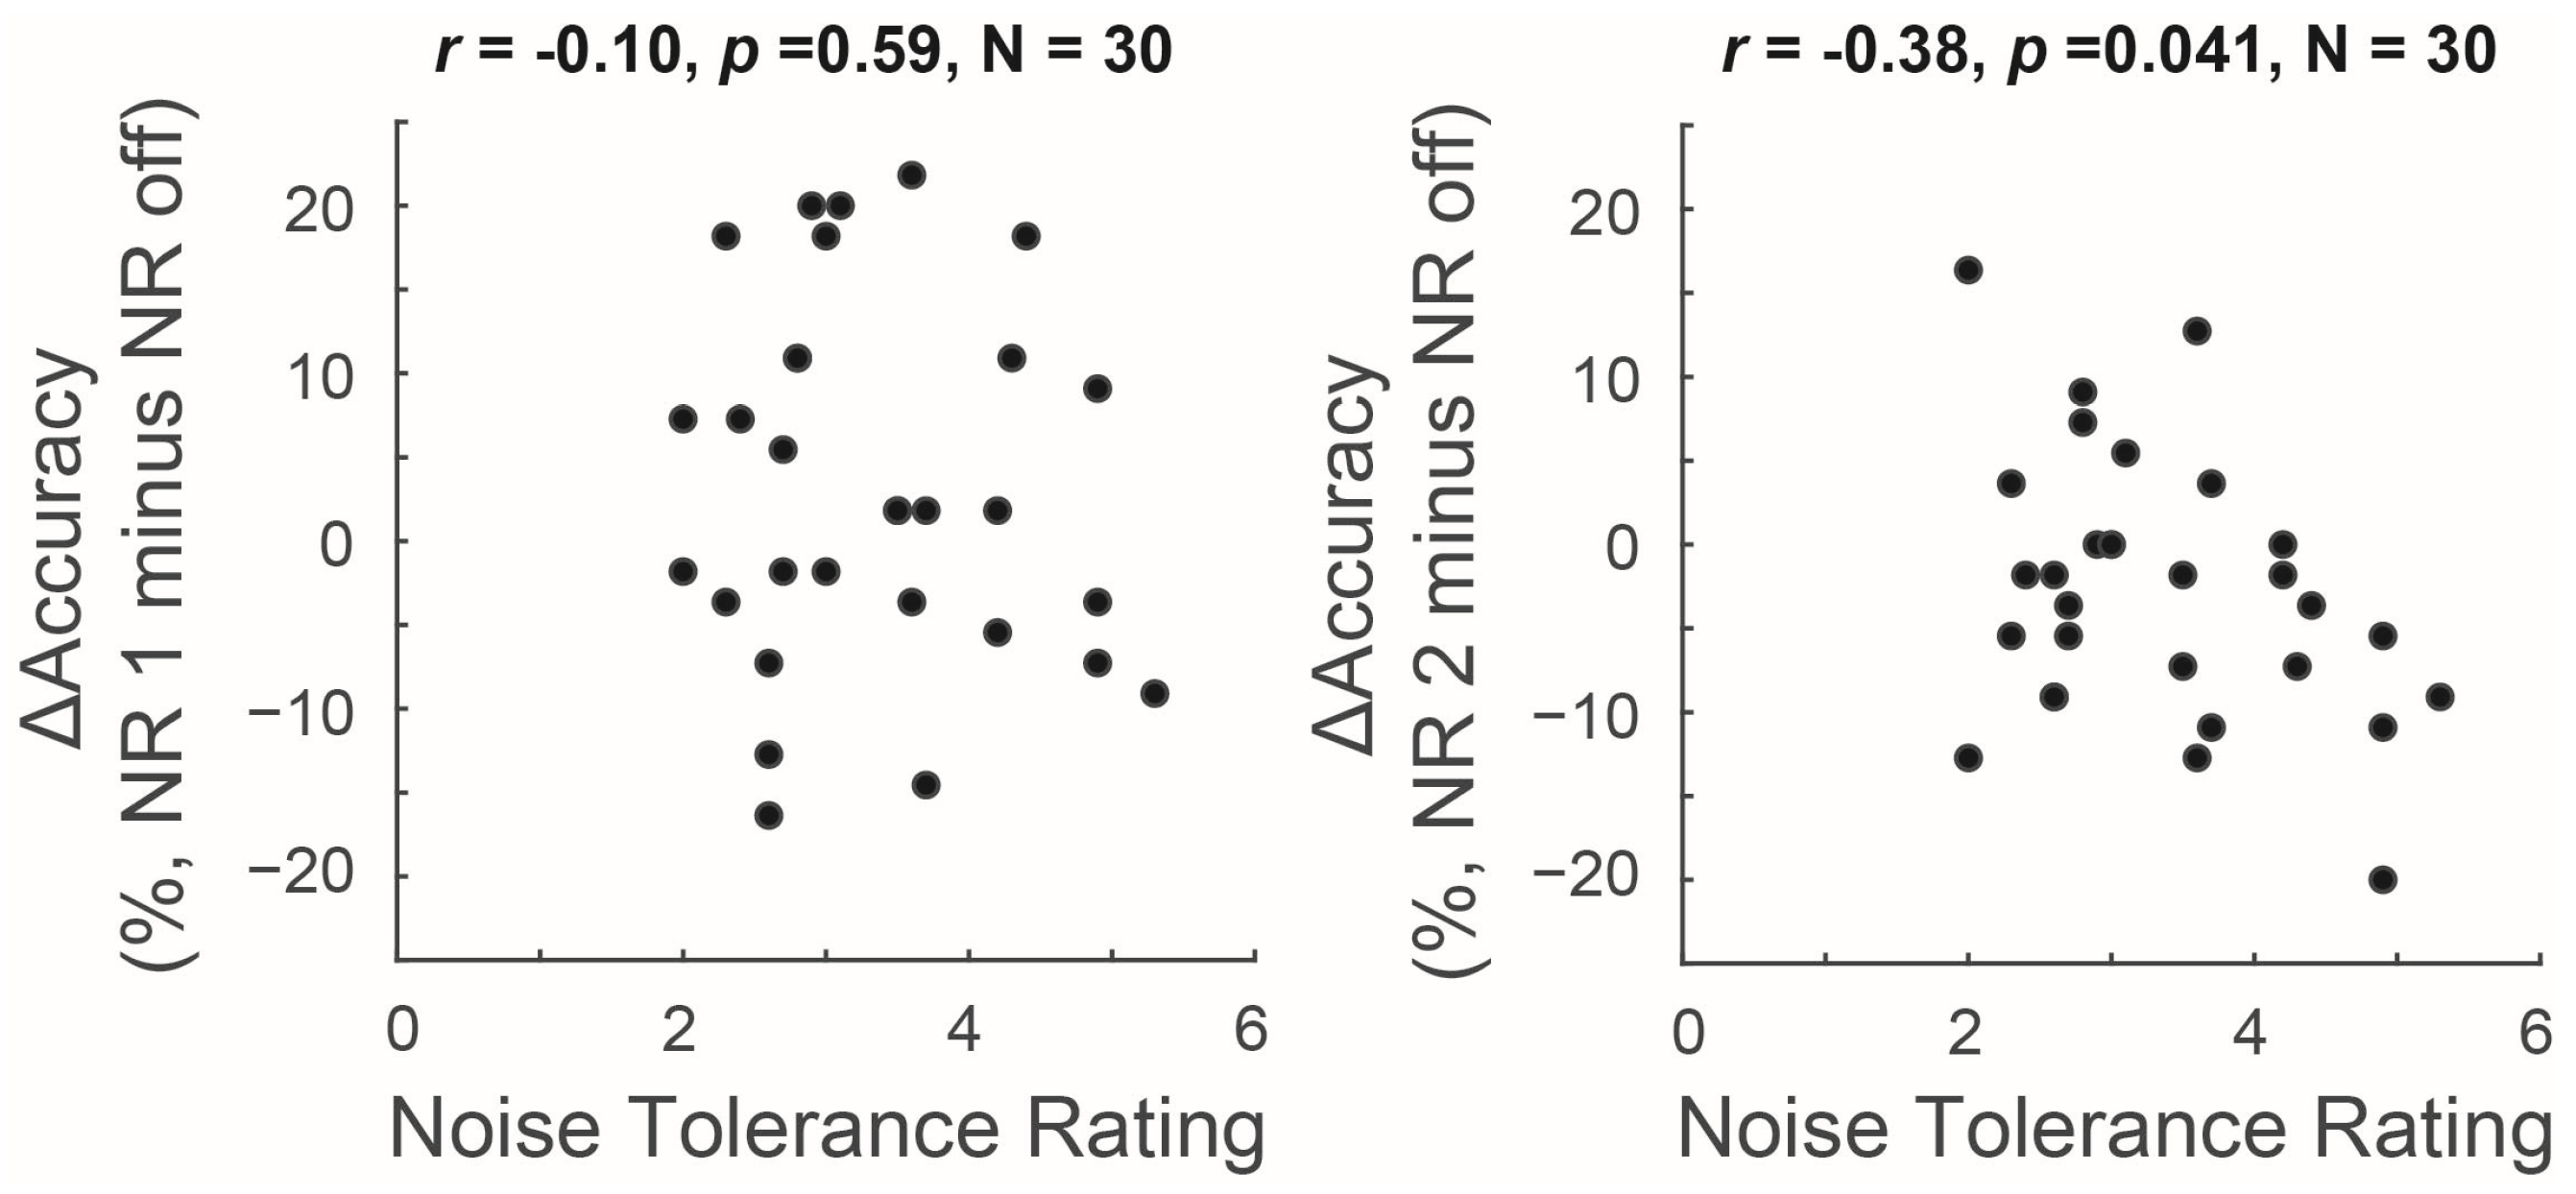
3.2. Relationship between Measures of Noise Tolerance and NR Outcomes

Pearson correlation analyses were performed to investigate the relationship between cortical and subjective noise tolerance measures and NR-driven accuracy changes. The neural SNR significantly correlated with behavioral accuracy changes (Δaccuracy) by NR 1 (r = −0.42, p = 0.021) and NR 2 (r = −0.52, p = 0.0031), respectively, indicating that people with lower neural SNR (i.e., lower noise tolerance) may get more benefit from the use of NR algorithms (Figure 5).
Noise-tolerance ratings that varied among participants (mean = 3.35, median = 3.05, SD = 0.93) significantly correlated with NR 2-driven accuracy changes (r = −0.38, p = 0.041) but not with NR 1-driven changes (r = −0.10, p = 0.59), indicating that people with lower self-reported noise tolerance may get a better chance to benefit from relatively strong NR processing (i.e., NR 2) and that subjective measure of noise tolerance might not be sensitive enough to capture changes in performance driven by relatively mild NR processing (i.e., NR 1) (Figure 6). No significant correlation was found between the neural SNR and noise-tolerance ratings (r = 0.27, p = 0.14).

3.3. Stepwise Regression: Modeling the Influence of Cortical and Subjective Measures of Noise Tolerance on NR Outcomes

Individually, both neural SNRs and noise-tolerance ratings exhibited significant correlations with NR 2-driven changes in behavioral accuracy during the preliminary correlation analyses above. Given that no correlation between neural SNR and noise-tolerance rating was found while both predictors showed potential relevance to variance in NR 2-driven accuracy changes, a multiple linear regression model was constructed stepwise. The initial model only included neural SNR as a predictor, and subsequently, another predictor (i.e., noise-tolerance rating) was added to the model to assess if additional variance in NR 2-driven changes could be explained (see Table 1).
In the initial model, the neural SNR explained a significant portion of the variance in accuracy changes by NR 2 (R2 = 0.273, F = 10.51, p = 0.003). When the noise-tolerance rating was added to the model, the R2-value increased to 0.331, indicating that the model slightly better explained the overall variance with the secondary predictor. However, the F-value decreased to 6.69, indicating that the model became less significant. Further, the final model coefficients showed that only the neural SNR remained significant (p = 0.01), while the tolerance rating was no longer significant (p = 0.136), when both predictors were considered together, although multicollinearity was not an issue in the model given a variance inflation factor (VIF) of 1.08. These results suggest that, although the subjective ratings may explain some portion of the variance, the cortical measures of noise tolerance (i.e., neural SNR) work as the more robust driver in explaining the variance in NR benefits in speech perception.

4. Discussion

In line with the literature [e.g., Bentler, Wu [5], Ricketts and Hornsby [55]], our findings corroborated no improvement in speech intelligibility in noise with NR processing, while showing considerable variability in NR-driven changes in performance among individuals with similar hearing sensitivity. Given that most people who experienced an increase in performance with NR 2 also showed enhanced performance with NR 1, the same underlying individual characteristics, such as noise tolerance, may be responsible for such performance changes due to NR. The present study utilized both cortical and subjective measures to comprehensively capture the multifaceted nature of individual noise tolerance and to ensure a holistic assessment of variability in NR outcomes.
Our findings indicated that the neural SNR, the amplitude ratio of cortical auditory responses to target speech relative to background noise, can predict NR outcomes. These findings were consistent with Kim, Wu [31], who reported a significant negative correlation between neural SNR and hearing outcomes with mild NR processing (i.e., same as NR 1 in the present study); individuals with higher neural SNR tended to get lower NR benefits in perceptual outcomes. Further, the neural SNR exhibited a stronger correlation with the hearing outcome associated with stronger NR processing (i.e., NR 2) than that observed between the neural SNR and the NR 1 outcome. This differential correlation suggests that the neural SNR is an efficient measure that reflects the underlying neurophysiological dynamic of individual noise tolerance and offers acute responsiveness to the nuances of NR’s mixed effects between noise attenuation and speech distortions. The neural SNR uniquely incorporates an individual’s efficiency in inhibiting background noise, a critical aspect of noise tolerance previously underexplored in auditory evoked potential studies [22,23,24] and studies of neural tracking of the speech envelope [25,26,27]. By computing the amplitude ratio between the respective responses to target speech onset and noise onset, the index of neural SNR offers a better understanding of varying perceptual benefits of NR processing among individuals with different noise-tolerance characteristics. Our recent findings indicated that within normal-hearing individuals, the variability in neural SNR was mainly attributed to individual differences in noise-onset evoked responses [30]. This suggests that how well an individual can utilize selective attentional control to suppress background noise significantly influences the degree of their noise tolerance and leads to different needs for external signal processing (e.g., NR strength) to aid the perception of target speech embedded in noise.
Although both measures in the current study served to index individual noise tolerance, the neural SNR and the subjective noise-tolerance ratings did not correlate. The lack of correlation between these measures could be advantageous, allowing each measure to capture different perspectives on individual noise tolerance and independently explain variability in hearing outcomes. In fact, noise-tolerance rating correlated with outcomes in the NR 2 condition and accounted for extra variance in NR 2 outcomes in the stepwise regression model. Even a relatively modest increase in the variance explained by subjective ratings can provide valuable insights into understanding the complexity of individual noise tolerance and its relationship to NR outcomes. According to the literature, when making judgments on noise tolerance in a given listening situation, listeners employ multiple criteria: for instance, noise annoyance, speech interference, and cognitive effort [18,19]. One of the reasons that subjective ratings in the current study, taken from the Weinstein Questionnaire, were not sensitive enough to capture individual noise tolerance characteristics was that those ratings solely reflected noise annoyance criteria, and there was a lack of a systematic approach using paired comparison with other criteria to determine the dominant criteria for noise-tolerance judgment for each individual [18]. Developing more sensitive measures to capture subjective correlates of individual noise tolerance and integrating them with a physiological index, such as the neural SNR, would offer a more comprehensive and accurate assessment of noise tolerance in a way neither measure could accomplish alone.
One of the limitations of this study was that the measure of neural SNR fell short of disentangling the source of variability between peripheral hearing deficits and top-down attentional efficacy. An individual’s high neural SNR may result from successful auditory scene analysis involving a chain of neurophysiological processes [32,33,56], including sensory encoding of acoustic features [57,58,59,60], auditory object formation by grouping those features [61,62], and selectively attending to target objects embedded in background noise [63,64,65,66,67]. It is evident that these sensory and central processes exhibit significant variability among individuals with similar audiograms, influencing their hearing outcomes [68,69,70,71,72]. Future studies could benefit from employing both sensory and selective-attention measures in the same individual participants to assess the relative contributions of peripheral and top-down processes to the cortical index of individual noise tolerance (i.e., neural SNR). Emerging evidence shows that selective attentional efficacy varies even in people with normal hearing and that it can modulate cortical representation of speech sounds [73,74,75,76]. Exploring variability in peripheral hearing damage would provide deeper insights into the influence of cochlear frequency tuning [77,78,79], cochlear tonotopy [80,81,82], and auditory nerve integrity [83,84] on the neural SNR. To build on the groundwork laid by our findings, future research should incorporate people with mild-to-moderate hearing loss and employ peripheral and downstream measures, which are believed to influence the neural SNR, to comprehensively assess the neurophysiological mechanisms underlying individual variability in NR outcomes.
Future studies could also benefit from adopting alternative methodologies or advanced technologies. One idea is to have a longer interstimulus interval (ISI) to obtain more robust auditory cortical responses to target speech that are less interfered with by relatively strong noise-onset evoked responses. Having distinct obligatory responses to target speech is even more important when measuring the neural SNR from individuals with hearing impairment whose perceptual performance may rely more on clear speech cues than noise itself [18,34]. A longer ISI and more precise distinction between evoked responses to target speech and noise onsets would increase neural SNR’s predictive power regarding the variability in NR outcomes among individuals with different noise tolerance characteristics. Nowadays, nearly all digital hearing aids are equipped with NR algorithms, and often offer multiple preset options of NR strength ranging from no NR to strong NR, to which users react very differently [85]. With the integration of artificial intelligence technology, more variations of hearing-aid signal processing schemes will be employed to reduce background noise at given auditory scenes, potentially leading to an even wider range of preferred signal processing in hearing aids. As technology progresses, it becomes increasingly crucial to accurately quantify the extent of reduced noise and speech distortions and understand how individuals with different noise tolerance characteristics would perceive such varying effects due to a range of signal processing. With precise quantification of NR effects, future research could improve our experimental design by incorporating advanced NR algorithms, widening the scope of application to contemporary hearing aid technologies.

5. Conclusions

The current study used cortical and subjective measures to characterize individual noise tolerance and predict perceptual benefits (or lack thereof) from NR algorithms with varying strength. Our findings revealed a robust relationship between the cortical measure of neural SNR and NR outcomes that intensified with increasing NR strength, whereas subjective ratings of noise tolerance showed a relatively modest correlation with NR outcomes. The lack of a direct relationship between cortical and subjective measures underscores the importance of incorporating both measures in the methodologies of future research to comprehensively explore individual characteristics driving the variability in NR outcomes.

Author Contributions

Conceptualization, S.K.; methodology, S.K.; software, S.K.; validation, S.K., S.A., N.D., J.D., N.G., K.N. and A.R.; formal analysis, S.K.; investigation, S.A., N.D., J.D., N.G. and K.N.; resources, S.K.; data curation, S.A., N.D., J.D., N.G. and K.N.; writing—original draft preparation, S.K.; writing—review and editing, S.K., S.A., N.D., J.D., N.G., K.N. and A.R.; visualization, S.K.; supervision, S.K.; project administration, S.K.; funding acquisition, S.K. All authors have read and agreed to the published version of the manuscript.

Funding

This research was funded by the Hearing Health Foundation Emerging Research Grant (2022, 2023) awarded to Kim.

Institutional Review Board Statement

The study was conducted in accordance with the Declaration of Helsinki, and approved by the Institutional Review Board of Montclair State University (IRB-FY22-23-2727).

Informed Consent Statement

Informed consent was obtained from all subjects involved in the study.

Data Availability Statement

The data that support the findings of the present study have been made publicly available in the Mendeley Data at https://dx.doi.org/10.17632/8ywtzy25t5.1 accessed on 28 March 2024.

Conflicts of Interest

The authors declare no conflicts of interest. The funders had no role in the design of the study; in the collection, analyses, or interpretation of data; in the writing of the manuscript; or in the decision to publish the results.

References

  1. Plomp, R. Noise, amplification, and compression: Considerations of three main issues in hearing aid design. Ear Hear. 1994, 15, 2–12. [Google Scholar] [CrossRef] [PubMed]
  2. Takahashi, G.; Martinez, C.D.; Beamer, S.; Bridges, J.; Noffsinger, D.; Sugiura, K.; Bratt, G.W.; Williams, D.W. Subjective measures of hearing aid benefit and satisfaction in the NIDCD/VA follow-up study. J. Am. Acad. Audiol. 2007, 18, 323–349. [Google Scholar] [CrossRef]
  3. Davidson, A.; Marrone, N.; Wong, B.; Musiek, F. Predicting Hearing Aid Satisfaction in Adults: A Systematic Review of Speech-in-noise Tests and Other Behavioral Measures. Ear Hear. 2021, 42, 1485–1498. [Google Scholar] [CrossRef]
  4. Bentler, R.; Chiou, L.-K. Digital Noise Reduction: An Overview. Trends Amplif. 2006, 10, 67–82. [Google Scholar] [CrossRef] [PubMed]
  5. Bentler, R.; Wu, Y.-H.; Kettel, J.; Hurtig, R. Digital noise reduction: Outcomes from laboratory and field studies. Int. J. Audiol. 2008, 47, 447–460. [Google Scholar] [CrossRef] [PubMed]
  6. Hoetink, A.E.; Körössy, L.; Dreschler, W.A. Classification of steady state gain reduction produced by amplitude modulation based noise reduction in digital hearing aids. Int. J. Audiol. 2009, 48, 444–455. [Google Scholar] [CrossRef] [PubMed]
  7. Kates, J.M. Digital Hearing Aids; Plural Pub: San Diego, CA, USA, 2008. [Google Scholar]
  8. Arehart, K.; Souza, P.; Lunner, T.; Pedersen, M.S.; Kates, J.M. Relationship between distortion and working memory for digital noise-reduction processing in hearing aids. J. Acoust. Soc. Am. 2013, 133 (Suppl. S5), 3382. [Google Scholar] [CrossRef]
  9. Brons, I.; Dreschler, W.A.; Houben, R. Detection threshold for sound distortion resulting from noise reduction in normal-hearing and hearing-impaired listeners. J. Acoust. Soc. Am. 2014, 136, 1375–1384. [Google Scholar] [CrossRef]
  10. Brons, I.; Houben, R.; Dreschler, W.A. Effects of Noise Reduction on Speech Intelligibility, Perceived Listening Effort, and Personal Preference in Hearing-Impaired Listeners. Trends Hear. 2014, 18, 2331216514553924. [Google Scholar] [CrossRef]
  11. Kubiak, A.M.; Rennies, J.; Ewert, S.D.; Kollmeier, B. Relation between hearing abilities and preferred playback settings for speech perception in complex listening conditions. Int. J. Audiol. 2022, 61, 965–974. [Google Scholar] [CrossRef]
  12. Cox, R.M.; Alexander, G.C.; Gray, G.A. Personality, hearing problems, and amplification characteristics: Contributions to self-report hearing aid outcomes. Ear Hear. 2007, 28, 141–162. [Google Scholar] [CrossRef] [PubMed]
  13. Nabelek, A.K.; Freyaldenhoven, M.C.; Tampas, J.W.; Burchfield, S.B.; Muenchen, R.A. Acceptable Noise Level as a Predictor of Hearing Aid Use. J. Am. Acad. Audiol. 2006, 17, 626–639. [Google Scholar] [CrossRef] [PubMed]
  14. Neher, T. Relating hearing loss and executive functions to hearing aid users’ preference for, and speech recognition with, different combinations of binaural noise reduction and microphone directionality. Front. Neurosci. 2014, 8, 391. [Google Scholar] [CrossRef] [PubMed]
  15. Neher, T.; Grimm, G.; Hohmann, V.; Kollmeier, B. Do hearing loss and cognitive function modulate benefit from different binaural noise-reduction settings? Ear Hear. 2014, 35, e52–e62. [Google Scholar] [CrossRef] [PubMed]
  16. Neher, T.; Wagener, K.C. Investigating differences in preferred noise reduction strength among hearing aid users. Trends Hear. 2016, 20, 1–14. [Google Scholar] [CrossRef] [PubMed]
  17. Neher, T.; Wagener, K.C.; Fischer, R.-L. Directional processing and noise reduction in hearing aids: Individual and situational influences on preferred setting. J. Am. Acad. Audiol. 2016, 27, 628–646. [Google Scholar] [CrossRef] [PubMed]
  18. Mackersie, C.L.; Kim, N.K.; Lockshaw, S.A.; Nash, M.N. Subjective criteria underlying noise-tolerance in the presence of speech. Int. J. Audiol. 2021, 60, 89–95. [Google Scholar] [CrossRef] [PubMed]
  19. Recker, K.L.; Micheyl, C. Speech Intelligibility as a Cue for Acceptable Noise Levels. Ear Hear. 2017, 38, 465–474. [Google Scholar] [CrossRef] [PubMed]
  20. Wu, Y.H.; Stangl, E. The effect of hearing aid signal-processing schemes on acceptable noise levels: Perception and prediction. Ear Hear. 2013, 34, 333–341. [Google Scholar] [CrossRef]
  21. Mueller, H.G.; Weber, J.; Hornsby, B.W.Y. The effects of digital noise reduction on the acceptance of background noise. Trends Amplif. 2006, 10, 83–93. [Google Scholar] [CrossRef]
  22. Billings, C.J.; McMillan, G.P.; Penman, T.M.; Gille, S.M. Predicting perception in noise using cortical auditory evoked potentials. J. Assoc. Res. Otolaryngol. 2013, 14, 891–903. [Google Scholar] [CrossRef]
  23. Billings, C.J.; Penman, T.M.; McMillan, G.P.; Ellis, E.M. Electrophysiology and perception of speech in noise in older listeners: Effects of hearing impairment & age. Ear Hear. 2015, 36, 710–722. [Google Scholar] [PubMed]
  24. Benítez-Barrera, C.R.; Key, A.P.; Ricketts, T.A.; Tharpe, A.M. Central auditory system responses from children while listening to speech in noise. Hear. Res. 2021, 403, 108165. [Google Scholar] [CrossRef] [PubMed]
  25. Decruy, L.; Vanthornhout, J.; Francart, T. Hearing impairment is associated with enhanced neural tracking of the speech envelope. Hear. Res. 2020, 393, 107961. [Google Scholar] [CrossRef] [PubMed]
  26. Vanthornhout, J.; Decruy, L.; Wouters, J.; Simon, J.Z.; Francart, T. Speech Intelligibility Predicted from Neural Entrainment of the Speech Envelope. J. Assoc. Res. Otolaryngol. 2018, 19, 181–191. [Google Scholar] [CrossRef]
  27. Gillis, M.; Van Canneyt, J.; Francart, T.; Vanthornhout, J. Neural tracking as a diagnostic tool to assess the auditory pathway. Hear. Res. 2022, 426, 108607. [Google Scholar] [CrossRef]
  28. Alickovic, E.; Lunner, T.; Wendt, D.; Fiedler, L.; Hietkamp, R.; Ng, E.H.N.; Graversen, C. Neural Representation Enhanced for Speech and Reduced for Background Noise with a Hearing Aid Noise Reduction Scheme during a Selective Attention Task. Front. Neurosci. 2020, 14, 846. [Google Scholar] [CrossRef]
  29. Alickovic, E.; Ng, E.H.N.; Fiedler, L.; Santurette, S.; Innes-Brown, H.; Graversen, C. Effects of Hearing Aid Noise Reduction on Early and Late Cortical Representations of Competing Talkers in Noise. Front. Neurosci. 2021, 15, 636060. [Google Scholar] [CrossRef]
  30. Kim, S.; Schwalje, A.T.; Liu, A.S.; Gander, P.E.; McMurray, B.; Griffiths, T.D.; Choi, I. Pre- and post-target cortical processes predict speech-in-noise performance. NeuroImage 2021, 228, 117699. [Google Scholar] [CrossRef]
  31. Kim, S.; Wu, Y.-H.; Bharadwaj, H.M.; Choi, I. Effect of noise reduction on cortical speech-in-noise processing and its variance due to individual noise tolerance. Ear Hear. 2022, 43, 849–861. [Google Scholar] [CrossRef]
  32. Mesgarani, N.; Chang, E.F. Selective cortical representation of attended speaker in multi-talker speech perception. Nature 2012, 485, 233–236. [Google Scholar] [CrossRef] [PubMed]
  33. Hillyard, S.A.; Vogel, E.K.; Luck, S.J. Sensory gain control (amplification) as a mechanism of selective attention: Electrophysiological and neuroimaging evidence. Philos. Trans. R. Soc. Lond. B Biol. Sci. 1998, 353, 1257–1270. [Google Scholar] [CrossRef] [PubMed]
  34. Berger, J.I.; Gander, P.E.; Kim, S.; Schwalje, A.T.; Woo, J.; Na, Y.-M.; Holmes, A.; Hong, J.M.; Dunn, C.C.; Hansen, M.R.; et al. Neural Correlates of Individual Differences in Speech-in-Noise Performance in a Large Cohort of Cochlear Implant Users. Ear Hear. 2023, 44, 1107–1120. [Google Scholar] [CrossRef] [PubMed]
  35. Shim, H.; Kim, S.; Hong, J.; Na, Y.; Woo, J.; Hansen, M.; Gantz, B.; Choi, I. Differences in neural encoding of speech in noise between cochlear implant users with and without preserved acoustic hearing. Hear. Res. 2023, 427, 108649. [Google Scholar] [CrossRef] [PubMed]
  36. Geller, J.; Holmes, A.; Schwalje, A.; Berger, J.I.; Gander, P.E.; Choi, I.; McMurray, B. Validation of the Iowa Test of Consonant Perception. J. Acoust. Soc. Am. 2021, 150, 2131–2153. [Google Scholar] [CrossRef] [PubMed]
  37. Brainard, D.H. The Psychophysics Toolbox. Spat. Vis. 1997, 10, 433–436. [Google Scholar] [CrossRef] [PubMed]
  38. Weinstein, N.D. Individual differences in reactions to noise: A longitudinal study in a college dormitory. J. Appl. Psychol. 1978, 63, 458–466. [Google Scholar] [CrossRef] [PubMed]
  39. Kishikawa, H.; Matsui, T.; Uchiyama, I.; Miyakawa, M.; Hiramatsu, K.; Stansfeld, S. The development of Weinstein′s noise sensitivity scale. Noise Health 2006, 8, 154–160. [Google Scholar] [CrossRef]
  40. Ephraim, Y.; Malah, D. Speech enhancement using a minimum mean-square error log-spectral amplitude estimator. IEEE Trans. Acoust. Speech Signal Process. 1985, 33, 443–445. [Google Scholar] [CrossRef]
  41. Ephraim, Y.; Malah, D. Speech enhancement using a minimum-mean square error short-time spectral amplitude estimator. IEEE Trans. Acoust. Speech Signal Process. 1984, 32, 1109–1121. [Google Scholar] [CrossRef]
  42. Sarampalis, A.; Kalluri, S.; Edwards, B.; Hafter, E. Objective measures of listening effort: Effects of background noise and noise reduction. J. Speech Lang. Hearth Res. 2009, 52, 1230–1240. [Google Scholar] [CrossRef] [PubMed]
  43. Stelmachowicz, P.; Lewis, D.; Hoover, B.; Nishi, K.; McCreery, R.; Woods, W. Effects of Digital Noise Reduction on Speech Perception for Children with Hearing Loss. Ear Hear. 2010, 31, 345–355. [Google Scholar] [CrossRef] [PubMed]
  44. Park, G.; Cho, W.; Kim, K.-S.; Lee, S. Speech Enhancement for Hearing Aids with Deep Learning on Environmental Noises. Appl. Sci. 2020, 10, 6077. [Google Scholar] [CrossRef]
  45. Gustafson, S.; McCreery, R.; Hoover, B.; Kopun, J.G.; Stelmachowicz, P. Listening effort and perceived clarity for normal-hearing children with the use of digital noise reduction. Ear Hear. 2014, 35, 183–194. [Google Scholar] [CrossRef] [PubMed]
  46. Hagerman, B.; Olofsson, Å. A method to measure the effect of noise reduction algorithms using simultaneous speech and noise. Acta Acust. United Acust. 2004, 90, 356–361. [Google Scholar]
  47. Yun, D.; Shen, Y.; Lentz, J.J. Verification of Estimated Output Signal-to-Noise Ratios From a Phase Inversion Technique Using a Simulated Hearing Aid. Am. J. Audiol. 2023, 32, 197–209. [Google Scholar] [CrossRef]
  48. Miller, C.W.; Bentler, R.A.; Wu, Y.-H.; Lewis, J.; Tremblay, K. Output signal-to-noise ratio and speech perception in noise: Effects of algorithm. Int. J. Audiol. 2017, 56, 568–579. [Google Scholar] [CrossRef] [PubMed]
  49. Kay, S.M. Modern Spectral Estimation: Theory and Application; Prentice-Hall Signal Processing Series; Prentice Hall: Englewood Cliffs, NJ, USA, 1988. [Google Scholar]
  50. Kates, J.M.; Arehart, K.H. Multichannel Dynamic-Range Compression Using Digital Frequency Warping. EURASIP J. Adv. Signal Process. 2005, 2005, 483486. [Google Scholar] [CrossRef]
  51. Lewis, J.D.; Goodman, S.S.; Bentler, R.A. Measurement of hearing aid internal noise. J. Acoust. Soc. Am. 2010, 127, 2521–2528. [Google Scholar] [CrossRef]
  52. Fynn, M.; Nordholm, S.; Rong, Y. Coherence Function and Adaptive Noise Cancellation Performance of an Acoustic Sensor System for Use in Detecting Coronary Artery Disease. Sensors 2022, 22, 6591. [Google Scholar] [CrossRef]
  53. de Cheveigné, A.; Nelken, I. Filters: When, why, and how (not) to use them. Neuron 2019, 102, 280–293. [Google Scholar] [CrossRef] [PubMed]
  54. Delorme, A.; Makeig, S. EEGLAB: An open source toolbox for analysis of single-trial EEG dynamics including independent component analysis. J. Neurosci. Methods 2004, 134, 9–21. [Google Scholar] [CrossRef] [PubMed]
  55. Ricketts, T.A.; Hornsby, B.W. Sound quality measures for speech in noise through a commercial hearing aid implementing digital noise reduction. J. Am. Acad. Audiol. 2005, 16, 270–277. [Google Scholar] [CrossRef] [PubMed]
  56. Bregman, A.S. Auditory Scene Analysis: The Perceptual Organization of Sound; The MIT Press: Cambridge, MA, USA, 1990. [Google Scholar]
  57. Liberman, M.C.; Epstein, M.J.; Cleveland, S.S.; Wang, H.; Maison, S.F. Toward a differential diagnosis of hidden hearing loss in humans. PLoS ONE 2016, 11, e0162726. [Google Scholar] [CrossRef] [PubMed]
  58. Wan, G.; Corfas, G. Transient auditory nerve demyelination as a new mechanism for hidden hearing loss. Nat. Commun. 2017, 8, 14487. [Google Scholar] [CrossRef] [PubMed]
  59. Choi, J.E.; Seok, J.M.; Ahn, J.; Ji, Y.S.; Lee, K.M.; Hong, S.H.; Choi, B.-O.; Moon, I.J. Hidden hearing loss in patients with Charcot-Marie-Tooth disease type 1A. Sci. Rep. 2018, 8, 10335. [Google Scholar] [CrossRef] [PubMed]
  60. Bharadwaj, H.M.; Verhulst, S.; Shaheen, L.; Liberman, M.C.; Shinn-Cunningham, B.G. Cochlear neuropathy and the coding of supra-threshold sound. Front. Syst. Neurosci. 2014, 8, 26. [Google Scholar] [CrossRef] [PubMed]
  61. Darwin, C.J. Auditory grouping. Trends Cogn. Sci. 1997, 1, 327–333. [Google Scholar] [CrossRef] [PubMed]
  62. Zuijen, T.L.V.; Sussman, E.; Winkler, I.; Näätänen, R.; Tervaniemi, M. Grouping of Sequential Sounds—An Event-Related Potential Study Comparing Musicians and Nonmusicians. J. Cogn. Neurosci. 2004, 16, 331–338. [Google Scholar] [CrossRef]
  63. Auksztulewicz, R.; Friston, K. Attentional Enhancement of Auditory Mismatch Responses: A DCM/MEG Study. Cereb. Cortex 2015, 25, 4273–4283. [Google Scholar] [CrossRef]
  64. Choi, I.; Rajaram, S.; Varghese, L.A.; Shinn-Cunningham, B.G. Quantifying attentional modulation of auditory-evoked cortical responses from single-trial electroencephalography. Front. Hum. Neurosci. 2013, 7, 115. [Google Scholar] [CrossRef] [PubMed]
  65. Choi, I.; Wang, L.; Bharadwaj, H.; Shinn-Cunningham, B. Individual differences in attentional modulation of cortical responses correlate with selective attention performance. Hear. Res. 2014, 314, 10–19. [Google Scholar] [CrossRef] [PubMed]
  66. Hillyard, S.A.; Hink, R.F.; Schwent, V.L.; Picton, T.W. Electrical signs of selective attention in the human brain. Science 1973, 182, 177–180. [Google Scholar] [CrossRef] [PubMed]
  67. Woldorff, M.G.; Gallen, C.C.; Hampson, S.A.; Hillyard, S.A.; Pantev, C.; Sobel, D.; E Bloom, F. Modulation of early sensory processing in human auditory cortex during auditory selective attention. Proc. Natl. Acad. Sci. USA 1993, 90, 8722–8726. [Google Scholar] [CrossRef] [PubMed]
  68. Shinn-Cunningham, B. Cortical and Sensory Causes of Individual Differences in Selective Attention Ability Among Listeners With Normal Hearing Thresholds. J. Speech Lang. Hear. Res. 2017, 60, 2976–2988. [Google Scholar] [CrossRef] [PubMed]
  69. Oberfeld, D.; Klöckner-Nowotny, F. Individual differences in selective attention predict speech identification at a cocktail party. eLife 2016, 5, e16747. [Google Scholar] [CrossRef]
  70. Monaghan, J.J.; Garcia-Lazaro, J.A.; McAlpine, D.; Schaette, R. Hidden Hearing Loss Impacts the Neural Representation of Speech in Background Noise. Curr. Biol. 2020, 30, 4710–4721.e4. [Google Scholar] [CrossRef] [PubMed]
  71. Bharadwaj, H.M.; Masud, S.; Mehraei, G.; Verhulst, S.; Shinn-Cunningham, B.G. Individual differences reveal correlates of hidden hearing deficits. J. Neurosci. 2015, 35, 2161–2172. [Google Scholar] [CrossRef]
  72. Bressler, S.; Goldberg, H.; Shinn-Cunningham, B. Sensory coding and cognitive processing of sound in Veterans with blast exposure. Hear. Res. 2017, 349, 98–110. [Google Scholar] [CrossRef]
  73. Viswanathan, V.; Bharadwaj, H.M.; Shinn-Cunningham, B.G. Electroencephalographic signatures of the neural representation of speech during selective attention. eneuro 2019, 6, ENEURO.0057-19.2019. [Google Scholar] [CrossRef]
  74. O’sullivan, J.; Herrero, J.; Smith, E.; Schevon, C.; McKhann, G.M.; Sheth, S.A.; Mehta, A.D.; Mesgarani, N. Hierarchical encoding of attended auditory objects in multi-talker speech perception. Neuron 2019, 104, 1195–1209.e3. [Google Scholar] [CrossRef] [PubMed]
  75. Teoh, E.S.; Ahmed, F.; Lalor, E.C. Attention Differentially Affects Acoustic and Phonetic Feature Encoding in a Multispeaker Environment. J. Neurosci. 2022, 42, 682–691. [Google Scholar] [CrossRef] [PubMed]
  76. Kim, S.; Emory, C.; Choi, I. Neurofeedback Training of Auditory Selective Attention Enhances Speech-In-Noise Perception. Front. Hum. Neurosci. 2021, 15, 676992. [Google Scholar] [CrossRef] [PubMed]
  77. Moore, B.C.J. Cochlear Hearing Loss: Physiological, Psychological and Technical Issues, 2nd ed.; John Wiley & Sons: Hoboken, NJ, USA, 2007. [Google Scholar]
  78. Horst, J.W. Frequency discrimination of complex signals, frequency selectivity, and speech perception in hearing-impaired subjects. J. Acoust. Soc. Am. 1987, 82, 874–885. [Google Scholar] [CrossRef] [PubMed]
  79. Liberman, M.C.; Dodds, L.W. Single-neuron labeling and chronic cochlear pathology. III: Stereocilia damage and alterations of threshold tuning curves. Hear. Res. 1984, 16, 55–74. [Google Scholar] [CrossRef] [PubMed]
  80. Henry, K.S.; Kale, S.; Heinz, M.G. Distorted Tonotopic Coding of Temporal Envelope and Fine Structure with Noise-Induced Hearing Loss. J. Neurosci. 2016, 36, 2227–2237. [Google Scholar] [CrossRef]
  81. Henry, K.S.; Sayles, M.; Hickox, A.E.; Heinz, M.G. Divergent Auditory Nerve Encoding Deficits Between Two Common Etiologies of Sensorineural Hearing Loss. J. Neurosci. 2019, 39, 6879–6887. [Google Scholar] [CrossRef]
  82. Parida, S.; Heinz, M.G. Distorted tonotopy severely degrades neural representations of connected speech in noise following acoustic trauma. J. Neurosci. 2022, 42, 1477–1490. [Google Scholar] [CrossRef]
  83. Bharadwaj, H.M.; Hustedt-Mai, A.R.; Ginsberg, H.M.; Dougherty, K.M.; Muthaiah, V.P.K.; Hagedorn, A.; Simpson, J.M.; Heinz, M.G. Cross-species experiments reveal widespread cochlear neural damage in normal hearing. Commun. Biol. 2022, 5, 733. [Google Scholar] [CrossRef]
  84. Bharadwaj, H.M.; Mai, A.R.; Simpson, J.M.; Choi, I.; Heinz, M.G.; Shinn-Cunningham, B.G. Non-invasive assays of cochlear synaptopathy—Candidates and considerations. Neuroscience 2019, 407, 53–66. [Google Scholar] [CrossRef]
  85. Houben, R.; Reinten, I.; Dreschler, W.A.; Mathijssen, R.; Dijkstra, T.M.H. Preferred Strength of Noise Reduction for Normally Hearing and Hearing-Impaired Listeners. Trends Hear. 2023, 27, 23312165231211437. [Google Scholar] [CrossRef] [PubMed]
Figure 1. Stimulus and electroencephalographic recording structure of the speech-in-noise task. The target word (for example, a monosyllabic word like “sat”) is presented a half second after the noise onset. Individuals’ neural signal-to-noise ratio (SNR) is calculated based on the ratio (b/a) of peak amplitude of temporal envelopes obtained from cortical auditory-evoked responses within a time window (gray colored period in the bottom panel) following the word and noise onset, respectively.
Applsci 14 06892 g001
Figure 2. Illustration of implementation details of noise reduction (NR) algorithms with relevant equations and parameters. 1 The a posteriori signal-to-noise ratio (SNR) R p o s t p , ω k denotes the SNR in the current short-time frame and should be computed in each 20-ms frame p and each spectral component ω k by comparing the magnitude of signal X ( p , ω k ) and noise spectrum v ( ω k ) . The a priori SNR R p r i o p , ω k represents the SNR estimated in the last frame p 1 by incorporating the previous frame with a weight of α parameter (0.98) and the current frame with a weight of 1 − α. 2 The spectral gain G for each short-time frame in NR 1 is determined by R p o s t , R p r i o , and the function M, where I 0 and I 1 represent the modified Bessel functions with zero and first order, respectively. 3 The spectral gain G l o g for each short-time frame in NR 2 is determined utilizing R p o s t , R p r i o , and the exponential integral E 1 x .
Applsci 14 06892 g002
Figure 3. Illustration of the effect of noise reduction (NR) algorithms on speech and noise stimuli. (A). Power spectral density of speech (solid line) and noise stimuli (dotted line) in each condition is compared. Speech and noise stimuli for NR 1 (purple line) and NR 2 conditions (red line) are extracted using the phase-inversion technique. (B). Magnitude-squared coherence is shown across frequencies up to 22 kHz between a pair of speech stimuli: NR 1 vs. NR off (purple line) and NR 2 vs. NR off (red line), respectively.
Applsci 14 06892 g003
Figure 4. Post hoc comparison of behavioral accuracy between experimental conditions: Noise reduction (NR) 1 vs. NR off and NR 2 vs. NR off, respectively. The center of the box plots indicates the median, and the edges indicate the 25th and 75th percentiles. Solid black lines denote individuals’ performance. n.s., not significant.
Applsci 14 06892 g004
Figure 5. Neural signal-to-noise ratio (SNR), the cortical measures of individual noise tolerance, correlates with changes in behavioral accuracy (Left panel: Noise reduction (NR) 1 vs. NR off, right panel: NR 2 vs. NR off).
Applsci 14 06892 g005
Figure 6. Subjective rating of individual noise tolerance correlates with changes in behavioral accuracy with NR 2 (right panel), whereas it does not correlate with accuracy changes with NR 1 (left panel).
Applsci 14 06892 g006
Table 1. Summary of stepwise regression results for the dependent variable (behavioral accuracy changes by noise-reduction 2 algorithm) with the neural signal-to-noise ratio (SNR) and noise-tolerance rating as predictors.
Model Fit Measures
ModelRR2Adjusted R2Fdf1df2p
10.5220.2730.24710.511280.003
20.5760.3310.2826.692270.004
ComparisonsModelModelΔR2Fdf1df2p
120.0592.371270.136
Model Coefficients
ModelUnstandardizedStandardizedtpCollinearity
BSEBetaToleranceVIF
1(Constant)−0.1090.025 −4.32<0.001
Neural SNR−0.0080.003−0.522−3.240.00311
2(Constant)−0.0270.059 −0.450.656
Neural SNR−0.0070.003−0.454−2.770.010.9261.08
Tolerance Rating−0.0210.014−0.252−1.540.1360.9261.08
Disclaimer/Publisher’s Note: The statements, opinions and data contained in all publications are solely those of the individual author(s) and contributor(s) and not of MDPI and/or the editor(s). MDPI and/or the editor(s) disclaim responsibility for any injury to people or property resulting from any ideas, methods, instructions or products referred to in the content.

