Article

Artificial Intelligence Software Adoption in Manufacturing Companies

1
Faculty of Mechanical Engineering, University of Maribor, 2000 Maribor, Slovenia
2
Faculty of Economics and Business, University of Maribor, 2000 Maribor, Slovenia
3
Faculty of Economics & Business, University of Zagreb, 10000 Zagreb, Croatia
*
Author to whom correspondence should be addressed.
Appl. Sci. 2024, 14(16), 6959; https://doi.org/10.3390/app14166959
Submission received: 2 July 2024 / Revised: 2 August 2024 / Accepted: 4 August 2024 / Published: 8 August 2024
(This article belongs to the Special Issue Advancement in Smart Manufacturing and Industry 4.0)

Abstract

:
This study investigates the adoption of artificial intelligence (AI) software in manufacturing companies in Slovenia, Slovakia and Croatia, and across six production areas. This research ad-dresses a gap in the literature regarding AI software implementation in relation to company size, technology intensity and supply chain role, and examines whether Industry 4.0 (I4.0) readiness influences AI adoption. Data from the European Manufacturing Survey 2022 were analyzed, and showed that the use of AI is still relatively low. On average only 18.4% of companies use AI software in at least one production area. Logistic regression analysis revealed that neither company size nor role in the supply chain or technology intensity are statistically significantly related to AI usage. However, a significant positive relationship was found between I4.0 readiness and AI adoption, suggesting that companies with advanced digital infrastructures and integrated cyber-physical systems are more likely to adopt AI. This finding underlines the importance of digital transformation for the integration of AI software. The study concludes that while company characteristics such as size and the role of the company in the supply chain are not statistically significantly related to the use of AI, the level of digital readiness is crucial.

1. Introduction

Manufacturing is a critical component of the global economy and serves as an important driver of innovation and competitiveness [1]. For this reason, various governments have launched initiatives to support and modernize the manufacturing sector in order to remain competitive on the international stage. One notable initiative launched in Germany in 2013 was a strategic response to the transformative potential of new and emerging information and communication technologies (ICTs) and manufacturing technologies [2]. This strategy aimed to promote the digitalization of processes and accelerate the adoption of new technologies in manufacturing companies. This initiative, known as “Industrie 4.0” or Industry 4.0, has become synonymous with the fourth industrial revolution [3]. At its core, Industry 4.0 integrates cutting-edge technologies such as the Internet of Things (IoT), cloud computing, cyber-physical systems (CPSs), additive manufacturing, advanced robotics and artificial intelligence (AI) into existing manufacturing systems [4,5]. In the context of Industry 4.0 and manufacturing, AI is considered a crucial component for securing a competitive advantage in business [6]. The increasing availability of data and the emergence of publicly accessible AI chatbots in the last year have sparked a growing interest in AI research. The current research mainly focuses on different areas of AI implementation and shows its positive impact on manufacturing processes, especially in the areas of quality control, product design, predictive maintenance, creativity and innovation [7,8]. Given these benefits, it is important to empirically investigate the current state of AI implementation in manufacturing organizations to better understand how these research findings are applied in practice.
In recent years, both academics and practitioners have faced the challenge of determining the current maturity and readiness of companies for Industry 4.0 concepts [9]. There is an ongoing search for the development and improvement of self-assessment models that can be used to determine the readiness of organizations for Industry 4.0 [10]. These models focus on different dimensions of manufacturing companies, including the technologies that are the pillars of the Industry 4.0 concept. The use of various technologies, especially digital technologies, is one of the most important factors in assessing the I4.0 readiness of the manufacturing company. AI is a complementary technology to other digital technologies as it focuses on data analysis. Therefore, it can be assumed that the use of various digital technologies also fosters the use of AI solutions.
This study aims to assess the diffusion of AI tools in specific production areas in European manufacturing companies and to answer several important research questions. We consider that there is a gap in the literature regarding the use of AI solutions in manufacturing companies in relation to specific manufacturing company characteristics, such as company size, industry intensity and position in the supply chain. Additionally, we did not find any study that investigates the relationship between I4.0 readiness and AI adoption, i.e., whether I4.0 readiness affects AI adoption. To address these research questions, this study uses a subset of data from the 2022 European Manufacturing Survey (EMS), focusing specifically on responses from Slovenia, Slovakia and Croatia. These exact countries were chosen for the following reasons: First, their cultural similarity and geographical location; second, their strong trade relations with Germany due to the automobile industry; and third, access to relevant data from the EMS analysis.
This paper is organized as follows: Section 2 provides an overview of the literature on the use of AI in manufacturing and current domain-specific implementations. It then explains the concept of Industry 4.0 and Industry 4.0 readiness models and how they relate to the use of AI. Finally, three factors are examined, namely company size, the role of the company as a supplier or OEM producer and the technology sector, which are thought to be a significant contributor to AI adoption. At the end of each subsection, corresponding hypotheses are developed. Section 3 describes the methodology of data collection and analysis. Section 4 presents the results using descriptive and inferential statistics. Section 5 discusses these results and Section 6 concludes with implications, limitations and suggestions for future research.

2. Literature Review

2.1. AI in Manufacturing

While research interest in the use of AI in business is growing, the use of AI in manufacturing is still underrepresented [8]. The existing literature mainly describes task-specific AI implementation in manufacturing companies, often used for quality assurance (quality control) [11], predictive maintenance [12], energy consumption prediction, supply chain management, process optimization, process and product design, and simulation and experimentation [13]. For the purposes of quality control, AI has shown significant advantages in defect detection. One such case is the manufacture of heat exchangers for motor vehicles, where many different parameters affect the tightness of the joints and the entire assembly, which in turn affects the efficiency of the heat exchanger and consequently the failure of the engine. Artificial neural networks have been shown to provide an effective solution with an accuracy of almost 99% in fault detection under real-world conditions [14]. In the context of production equipment and machinery maintenance, predictive maintenance directly contributes to reducing costs due to machine downtime by accurately predicting the remaining lifetime of key components and reducing the frequency and duration of unplanned downtime [15]. While maintenance is important to ensure the longevity of current machinery and equipment, well-organized and scheduled maintenance activities can increase both plant capacity and overall productivity—in some cases by as much as 60% [16]. In addition to well-organized maintenance activities, it is also important for companies to manage their energy consumption and requirements. Recent global events and the goal of achieving net zero emissions worldwide are forcing companies to look for solutions to their energy needs, and AI offers advantages to address these issues [17]. As has already been shown, energy consumption can be improved either by implementing AI to optimize parameter settings [18], or by optimizing material flow to reduce energy consumption, cost and production time per part [19]. When considering material and material flow, it is also crucial to manage sufficient inventory levels, which can depend on various factors in the supply chain. This can either be due to a change in market demand or lead times for certain products and components. By using AI, the entire supply chain can be optimized and improved [20,21]. As already mentioned, AI can be used to optimize production processes by changing production parameters, but also without changing them. While it is possible to determine the optimal production parameters for specific products, this could lead to unintended consequences or produce results that are not reproducible. If the production processes need to be improved without changing the parameters, this can be done by identifying the causes of defects or failures, predicting production outcomes early to avoid unnecessary actions or adjustments, and diagnosing certain unexpected behaviors in processes to detect problems before they affect the final product [22]. Some production problems can already be avoided in the design phase of the product. Here, AI can help with conceptual design (deriving the product concept based on needs), embodiment design (confirmation of the primary functions) and even detailed design (full, detailed specification of the best design) [23]. In the conceptual phase, AI can help to properly translate the market or customer needs through online reviews [24,25] or offer alternative concept design options for further review [26]. In the later stages of design, AI can help in selecting the optimal material based on the required properties [27] or by providing the optimal CAD model based on the design requirements [28,29].
Various AI techniques, such as deep learning, neural networks, expert systems, machine learning and fuzzy logic, are slowly being adopted by small and medium-sized manufacturing companies [30]. Techniques such as deep learning and neural networks are used for complex pattern recognition, defect detection, predictive maintenance and real-time process optimization [31,32]. Expert systems help in decision-making for process control and troubleshooting [33], while machine learning algorithms are used in predictive analysis for demand forecasting, inventory optimization and supply chain management [34]. Fuzzy logic deals with uncertainties and inaccuracies in processes and improves quality management and decision-making [35]. In addition, reinforcement learning optimizes production schedules and resource allocation by learning from trial and error. Together, these methods aim to increase productivity, ensure quality, reduce operating costs and adapt quickly to changing market demands, ultimately leading to more efficient and competitive production operations [36,37].

2.2. Industry 4.0 and AI Adoption

Industry 4.0 (I4.0) is a complex and important concept for modern and future manufacturing. At its core, it is a collection of current concepts that cannot be classified as such. Some of these concepts include fully autonomous smart factories, cyber-physical systems (CPSs) that merge the physical and digital worlds, self-organizing manufacturing systems, new distribution and procurement systems, new systems for individualizing products and services, human-centric manufacturing systems, sustainability and resource efficiency [38]. Although it is clear what I4.0 encompasses or should encompass, there is still no common and generally accepted definition [39]. This could possibly be due to the fact that research has focused on specific, individual technologies and domain-specific applications, while other aspects, such as the role and challenges of management, have been less explored [40,41]. Due to this uncertainty, empirical evidence has shown that companies are struggling with the concept of I4.0 and its implementation. Due to the limited understanding of the importance and benefits of I4.0, companies need support in identifying relevant strategic actions, programs and projects that enable the transition to I4.0 [42]. While high investment, cost, complexity and required knowledge are the main barriers to I4.0 adoption, the existing company-specific IT infrastructure (hardware, software, networks and connectivity of devices) and technologies (including machines and business processes) hinder the successful adoption of advanced technologies [43]. As there is no guideline for the implementation of I4.0 concepts, many different readiness and maturity models have been developed. Their main goal is to help companies successfully transition into the new era of manufacturing. These models are important for several reasons. The first reason is that they enable the assessment of current capabilities, i.e., the level of technological and digital maturity within the organization. This can help companies analyze the gaps between their current state and the desired state of I4.0 integration. The second reason is that they provide a guide for implementation. With clear steps to improve systems, processes and capabilities, companies can create strategic plans and prioritize investments in technology and innovation, which in turn ensures that resources for digital transformation are allocated efficiently. The third reason is that these models can contribute to benchmarking against industry standards due to clear criteria and maturity levels. This can lead to a better understanding of the competitive position and areas that need to be improved in order to increase operational efficiency and innovation capabilities. While the models differ in scope, focus and complexity, technology remains a key component in all frameworks. Some provide comprehensive insights into operational, people, strategic and technology implications, while others focus more on digital technologies or process automation. The level of detail varies widely, ranging from in-depth, detailed analysis to broader overviews. Each model can focus on different aspects such as technology, people, processes or strategy. However, technology forms the basis for each model as it enables detailed assessments and facilitates adaptation to evolving industry trends. The methods of the models, which come from academia, industry or consulting firms, range from rigorous empirical research to expert consensus. Some models are static, while others can be adapted to specific user inputs and changing conditions. Through integration with other standards, such as ISO, they are further adapted to broader industry practice [10,44,45,46,47]. It can be concluded that this new industrial paradigm is largely due to digitalization and the increasing connectivity of devices and machines [48]. Both concepts have a common component that they either generate or exchange: data. In the context of I4.0, data are seen as the new, most valuable and important resource for further value creation [49]. In reviewing the literature, no work was found that examined a direct relationship between readiness for I4.0 and the implementation of AI. Since data are an important ingredient for AI and AI is a part of I4.0, we develop the following hypothesis:
H1. 
Readiness for Industry 4.0 is positively related to the adoption of AI in manufacturing companies.

2.3. AI Adoption in the Organizational and Technological Classification Context

In the past, it has been shown that there is a positive correlation between the size of a company and the likelihood of introducing new technologies [50,51,52]. Since AI is regarded as a new technology, it is logical to assume that larger companies will lead in the adoption of AI. This assumption is supported by recent studies that show that larger companies are more likely to not only prepare strategies for AI implementation, but also to follow through and implement AI [53,54,55]. It is assumed that greater financial resources and more human capital due to better implemented databases for AI training are mainly responsible for greater adoption. Although Kinkel et al. suggest that company size is a poor predictor of AI implementation [54], other studies suggest otherwise. Therefore, we develop the following hypothesis:
H2. 
Company size is related to the adoption of AI in manufacturing companies.
The industrial sector in which a company operates often determines the pace of technology adoption and reflects the different product characteristics, production conditions and technological contexts within similar groups of firms [56]. Previous research has shown that there are industry-specific differences in the adoption of AI technology. The high-tech and automotive industries, known for their early adoption of digital technologies and advanced robotics, are leading the adoption of AI [57]. Industry size also appears to correlate positively with the level of AI adoption, suggesting that technology intensity within sectors influences their readiness and ability to adopt AI technologies [57]. In contrast to previous assumptions, Kinkel et al. found that individual industrial sectors do not contribute significantly to the adoption of AI technologies [54]. They believe that this is partly due to the design of their study and argue that direct measurement of product and production characteristics is a better approach to determine AI adoption. However, since it is generally assumed that industry sectors that fall into higher technology intensity categories are more likely to adopt new technologies, we develop the following hypothesis:
H3. 
Technology intensity is related to the adoption of AI in manufacturing companies.
The supply chain is a larger network of companies that collaborate in adding value to the final product or service [58]. It is therefore subject to constant decision-making in terms of supplier selection, inventory management, logistics and other complex challenges [59,60]. Some researchers believe that AI will be able to address these challenges and autonomously perform various tasks throughout the entire supply chain [61]. Most of the research focuses on the potential applications and benefits of AI in supply chain management [62]; however, some have attempted to define the driving forces and critical success factors that determine the adoption of AI in organizations [63,64]. Although there is limited research exploring the role of companies in the supply chain (e.g., whether it is an OEM producer or a pure supplier) in AI implementation outcomes, Kutz et al. conducted semi-structured interviews with ten German OEM manufacturers to examine the elements of successful AI implementation [65]. Since no clear relationship between the role of the company and the implementation of AI could be proven, we develop the following hypothesis:
H4. 
The company’s role in the supply chain as a supplier or OEM producer is related to the adoption of AI in manufacturing companies.

3. Methodology

3.1. European Manufacturing Survey

Numerous studies aim to track innovation activities within the economy, highlight lagging sectors or regions, and compare the performance of national economies with other nations. These studies focus primarily on metrics that measure product innovation rather than process innovation, which is either overlooked or only considered at a highly aggregated level.
To address this shortfall, the Fraunhofer Institute for Systems and Innovation Research (ISI) initiated the “Modernisation of Production” survey in 1993. This survey was internationalized in 2001 and further developed into the European Manufacturing Survey (EMS). The EMS uses a standardized questionnaire that is translated into the respective languages of the participating countries in order to collect internationally comparable data that enable comprehensive analyses across national borders [66].
The EMS, which is coordinated by the Fraunhofer ISI, extensively covers innovation in the manufacturing sector and focuses on the technical modernization of value creation processes, the introduction of innovative organizational concepts and processes, as well as the development of new business models that complement the traditional product portfolio with innovative services. The methodology of the survey has been harmonized for all participating countries, with a core set of questions that remain consistent across the different iterations of the survey and are complemented by additional questions that address current issues and challenges in the field of production innovation. This approach allows the survey to adapt to the evolving landscape of industrial innovation.
In most participating countries, the EMS is conducted through a written survey at company level. To prepare for the multinational analysis, the national datasets undergo a rigorous validation and harmonization process.
The analyses of the national EMS dataset improve scientific understanding and provide policy advice by evaluating technological and economic measures and informing associations and trade unions in the participating countries. In addition, multinational comparative analyses are carried out as part of research collaborations.
The data from the EMS also form the basis for comprehensive performance benchmarking, enabling companies to compare their performance both nationally and internationally with other firms.

3.2. Sampling Strategy

The authors of this article are active participants in the EMS consortium and were responsible for conducting the surveys and collecting and analyzing the data in Slovenia and Croatia. The Slovakian EMS partners have consented to the use of their data for this study. As there is no prescribed common sampling strategy in the EMS consortium, each country decides for itself how to conduct its sampling. The sampling strategies for Slovakia, Croatia and Slovenia are briefly described below.
In Slovakia, around 2500 companies met the criteria for the entire sample (NACE 10-33, at least 20 employees). From this pool, 1200 companies were selected using a stratified random sample, of which around 900 were contacted. These efforts resulted in 114 responses, which corresponds to a response rate of 13%. In contrast, in both Slovenia and Croatia, due to their smaller size, all companies in the manufacturing sector that met the criteria were contacted. In Croatia, the survey was sent to 1211 companies, of which 140 responded after three months and three reminders, corresponding to a response rate of 9%. In Slovenia, a list of 960 companies was identified via the Business Register of Slovenia (PRS) and Business Directory of Slovenia (PIRS) that met the criteria. After three months, 146 responses had been received, which corresponds to a response rate of 15%. The questionnaire was distributed either by post or by e-mail as a .pdf file in all three countries. Due to a large number of invalid responses, some surveys had to be discarded. In the case of Slovakia this was 12 surveys, and in the case of Croatia it was 2 surveys.

3.3. Industry 4.0 Readiness Index

As the influence of Industry 4.0 readiness on the adoption of AI has not yet been directly investigated, it was of great interest to include this in the study. For this purpose, an “Industry 4.0 readiness index” developed by Fraunhofer ISI within the EMS consortium was chosen. This index categorizes the Industry 4.0 readiness of companies based on their use of seven digital technologies that are considered as Industry 4.0 enablers [67]. This particular index was chosen because it was developed based on data from previous EMS studies and the core questions about technology use remained the same. This makes it possible to determine the readiness level of companies each time the survey is repeated. It is important to note that this model only assesses the degree of readiness for Industry 4.0 and not the implementation of Industry 4.0 concepts themselves. These technologies were then divided into three groups:
Group 1: Digital management systems
  • Enterprise resource planning—ERP and
  • Product Lifecycle Management—PLM.
Group 2: Wireless human-machine communication
  • Digital visualization technologies and
  • Mobile devices.
Group 3: Cyber-physical system (CPS)-related processes
  • Near-real-time production control systems,
  • Technologies for automation and management of internal logistics,
  • Technologies for digital data exchange.
Companies were categorized into the appropriate level of Industry 4.0 readiness according to the following rules:
  • Level 0—Company does not use any of the seven technologies.
  • Level 1—Company uses one technology in either of the three technology groups.
  • Level 2—Company uses two technologies in two of the three technology groups.
  • Level 3—Company uses at least one technology in the first two groups and at least one technology in group cyber-physical system (CPS)-related processes.
  • Level 4—Company uses at least one technology in the first two groups and at least two technologies in group cyber-physical system (CPS)-related processes.
  • Level 5—Company uses at least one technology in the first two groups and all three technologies in group cyber-physical system (CPS)-related processes.

3.4. Variables

This section describes the operationalization of the variables used in this study. The dependent variable represents the use of AI and the independent variables represent the level of readiness for Industry 4.0, company size, role in the supply chain and technology sector. It was hypothesized that these independent variables influence the adoption of AI in manufacturing companies.
Let us start with the explanation of the dependent variable: AI usage. This is derived from the responses to the EMS questions “Do you use specific software solutions for the following six production areas?” and “Does the software offer self-learning functionality/capability?” The six production areas indicated were as follows:
  • Management of production processes (e.g., process monitoring).
  • Quality control (e.g., defect detection).
  • Maintenance of machinery and equipment (e.g., condition monitoring).
  • Management of internal logistics (e.g., warehouse, transport, etc.).
  • Energy management.
  • Improvement or innovation of production processes.
Participants answered “yes” or “no” for each area, indicating whether the software they use has self-learning capabilities that are considered indicative of AI. An initial descriptive statistics analysis revealed that some companies use AI software in more than one production. Therefore, for the purpose of this study, the total number of AI software solutions was calculated (sum of all “yes” answers for the different production areas) and a company was classified as an AI user if it reported using at least one AI-enabled software solution in any of the listed production areas.
Once the dependent value had been correctly coded, we continued with the independent variables. For the variable “company size”, the categories small (1), medium (2) and large (3) were used and the companies were categorized according to the number of employees in each category.
When coding the variable for the company’s role in the supply chain, the question and corresponding answers were used, as follows: “Regarding your main line of products, is your factory predominantly a producer of finished products or a supplier of systems or components?”. The possible answers were:
  • Producer of finished goods—for consumers.
  • Producer of finished goods for companies—capital goods.
  • Producer of finished goods for companies—operating resources, other products.
  • Supplier—parts/components supplier.
  • Supplier—system supplier.
Participants were categorized as an “OEM producer” if they ticked any of the answers that related to producing finished goods and as a “Supplier” if they ticked only answers that related to suppliers. Participants who ticked answers that included both the OEM production and supplier roles were categorized as “Both”. This categorization was then used in our analysis.
For the high-tech classification, a glossary was used to determine the technology intensity of the companies. In the questionnaire, companies reported their two-digit NACE classification, which was then used to categorize companies into four levels of technology intensity: low, medium-low, medium-high and high.
Finally, the companies were categorized into different levels of I4.0 readiness according to the Fraunhofer Industry 4.0 Readiness Index.
Table 1 summarizes the variables that were used in our study.
We used descriptive statistics and logistic regression to analyze the data. The descriptive statistics gave us an overview of the data in our sample. The frequency analysis helped us to understand the distribution of the data within the different categories of the variables. Logistic regression was used to model the relationship between the likelihood of AI adoption (dependent variable) and various predictors such as company size, role in the supply chain, technology intensity and level of Industry 4.0 readiness (independent variables).

3.5. Logistic Regression

To analyze relationships between the dependent variable “AI usage” and each independent variable, logistic regression was used. This statistical method is particularly suitable for modeling binary outcomes and allows us to assess the impact of individual predictors on the probability of AI adoption. Tabachnik [68] describes the process of this regression as follows.
Let Y be a binary or dichotomous variable with values 0 or 1. The probability that the variable Y takes the value 1, depending on the k explanatory variables Xi, i = 1,2,…, k is given by the following nonlinear equation:
P ( Y = 1 ) = p = e β X 1 + e β X = 1 1 + e β X
where
  • Β is the transposed vector of regression coefficients, β = ( β 0 , β 1 , β 2 , . . . , β k )
  • X is the vector of k explanatory variables.
The above equation represents the logistic cumulative distribution function, and the model is called the logistic regression model (Tabachnick and Fidell, 2012). From Equation (1), it follows:
l i m β X P ( Y = 1 ) = 1
l i m β X P ( Y = 1 ) = 0
Equation (1) can also be written in the following form:
p 1 p = e β X
where the left-hand side represents the odds:
p 1 p = o d d s   ( Y = 1 X 1 , X 2 , . . . , X k )
If we take the logarithm of Equation (2), we get:
ln p 1 p = β X = β 0 + β 1 X 1 + β 2 X 2 + . . . + β k X k
Equation (3) represents the logistic regression model. It is evident from Equation (3) that the relationship between the logarithm of the odds and the independent variables is linear.

4. Results

4.1. Descriptive Statistics

The study analyzed data from a sample of 386 manufacturing companies: 138 from Croatia, 102 From Slovakia and 146 from Slovenia. We begin by presenting the share of users of specialized software (SW) and AI in each production area and share of AI users in the overall sample. SW for process management is at the top with a share of 55.7% of companies, but only 14.4% of these users use AI. In the overall sample, only 8% of all companies in our sample use AI for the management of production processes. In the area of quality control, the share of companies using any type of SW is around 40%, while the share of AI users is the second highest at 22%. Overall, this area has the largest share of AI users in the entire sample at 8.8%. The areas of maintenance and internal logistics have a similar share of SW users, but with a share of 20.4%, maintenance has a larger share of AI users than internal logistics, where only 14.6% of users of SW for internal logistics use AI. The areas of energy management and improvement or innovation have the lowest share of SW users. While the share of users of SW for energy management (22.8%) is slightly higher than the share of users of SW for improvement or innovation (19.4%), the proportion of AI users is slightly higher for the latter (22.7%). In the overall sample, 4.4% of companies use AI for improvement or innovation, and AI is least used for energy management. Overall, 18.4% of companies in our total sample use AI software in at least one area of production and can therefore be classified as AI users. The following Table 2 shows a breakdown of AI users in the individual production areas.
Next, the companies were analyzed based on their size and AI usage. In this analysis, the information on company size was incomplete for two respondents, so they had to be excluded. In total, there were 112 small companies, 195 medium-sized companies and 77 large companies. Medium-sized companies make up half of the companies in our sample, followed by small companies, which make up about 30% of our sample, and large companies, which make up 20% of our sample. Regarding the use of AI, almost 25% of large companies use AI in at least one area of production, while only 18% of medium and 15% of small companies use AI. A detailed breakdown of the results in terms of company size and AI usage can be found in Table 3.
The distribution and share of companies were then examined on the basis of their role and AI usage. Overall, suppliers account for 30%, OEM producers account for 64%, and companies that are both suppliers and OEM producers account for 5% of the companies in our sample. When analyzing the share of AI users across the three categories, we found that 20% of suppliers, 17% of OEM producers, and 19% of both suppliers and OEM producers use AI in at least one area of production. A detailed breakdown of the company role and the share of AI users can be found in Table 4.
Next, the respondents were divided into different categories of technology intensity and AI usage. The majority of respondents fall into the medium to low technology intensity group. They make up around 43% of respondents, while the low technology group accounts for 27%. Together, they represent around 70% of all companies in the sample. The medium to high technology group represents around 24% of respondents. The lowest number of respondents falls into the high technology group, which accounts for only 6% of all respondents. While the high technology group represents the smallest share of companies, it has the largest share of AI users. Around 30% of companies in this category use AI in at least one area of production. This is followed by the medium-low technology group, in which almost 19% of companies use AI. The share of AI users in the “medium-high” group is slightly lower—around 17%. As already suspected, the low technology group has the lowest share of AI users, although this share is not significantly lower. Table 5 shows the results of the analysis.
Finally, the distribution of companies is presented according to their I4.0 readiness level. The majority of companies fall into the lower levels of I4.0 readiness. A share of 17.4% of companies have not implemented any of the seven basic technologies and are therefore not ready for I4.0 according to the model used. Companies that have implemented at least one I4.0 technology account for 19.9%. Almost a third, i.e., 29.5% of companies, fall into level 2 of I4.0 readiness. Companies that have at least one enabling technology in the CPS group and one in one of the first two groups fall into the level 3 category of I4.0 readiness and account for 14.8% of the companies in this sample. The last two readiness levels represent the lowest share of companies in this sample. Companies that fall into readiness level 4 account for 9.6% and companies that fall into the highest readiness category account for 8.8%. These results suggest that, based on the model that we used, only two-thirds of the companies in our sample have barely reached level 2 of Industry 4.0 readiness. This shows that the majority of companies are still lagging behind in adoption of enabling technologies. Table 6 shows the distribution of companies for every readiness level.

4.2. Logistic Regression Results

In this study, a logistic regression was used to assess the relationship of I4.0 readiness levels, company size, role in the supply chain and technology intensity with the likelihood of AI technology adoption. It is important to note that separate logistic regressions were performed to test the hypothesized relationships between the dependent and selected independent variables. Because of this, it is not necessary to test the assumption of collinearity. First, we tested the relationship between company size and the likelihood of using AI. Small companies were chosen as the reference category and are shown in the first row of the table. The last row in the table represents the constant (also known as the intercept), which is the initial level of the dependent variable when the independent variables are equal to zero. The probability of adopting AI was then compared for medium and large companies with that for small companies. The first column β (beta coefficient) represents the change in the log odds of the dependent variable when the independent or predictive variable changes by one unit. If it is positive, this means that an increase in the predictor variable increases the log odds of the dependent variable, and a negative β means the opposite. Column S.E. provides the results of the standard error, which measures the variability or uncertainty of β. The next column shows the results for the Wald statistic, which is used to test the null hypothesis that the independent variable (or predictor variable) has no effect or that the coefficient is zero. Larger values of this statistic indicate that the coefficient is actually significantly different from zero. Column df refers to the degrees of freedom or the number of independent values that can vary in the analysis. Column Sig. shows the significance value or p-value, which indicates the probability that the observed effect is due to chance. Common significance levels are 0.01, 0.05 (the most common significance level) and 0.1. The next column, Exp(β), is the exponentiated beta coefficient, which represents the odds ratio for a one-unit change in the predictor variable. If Exp(β) > 1, this means that the probability of the outcome increases with an increase in the predictor. If Exp(β) < 1, this means that the probability of the outcome decreases as the predictor increases. If Exp(β) = 1 the predictor has no effect on the odds of the outcome. The last two columns LB and UB are the lower bound and the upper bound of the confidence interval for Exp(β). The results of the logistic regression for the relationship between company size and AI are shown in Table 7. While the results show that medium and large companies have a positive beta coefficient, the Sig. column shows that the statistical significance for both medium and large companies is above the (maximum) threshold of 10% (or 0.1), which means that the risk of a Type I error is too high and the results therefore imply that larger companies are not more likely to use AI than smaller companies. We can interpret this to mean that company size has no statistically significant relationship with the likelihood of AI adoption in manufacturing companies.
For the relationship between the role of the manufacturer and AI usage, the category “Supplier” was used as a reference group. The results are shown in Table 8. Although the results show slightly negative beta coefficients, the corresponding significant values exceed the maximum threshold of 0.1, with the exception of the variable “Constant”, which only represents the log odds of AI usage when the role of the manufacturer is not taken into account. This is also confirmed by the small values of the Wald statistic for the variables “OEM producer” and “Both”. Thus, the results show that the role of the manufacturer does not contribute to an increased probability of using AI.
Next, the relationship between technology intensity and the probability of AI adoption was analyzed. Table 9 shows the results of the logistic regression. In this case, the companies that fall into the “low technology intensity” group were selected as the reference category. When higher intensity groups are compared to the group “low”, none of the categories show statistical significance due to their Sig. values exceeding the maximum threshold. While the “high” technology group has a Sig. value very close to the threshold, there is still a high risk of Type I error, and it cannot be claimed that this group of manufacturers is more likely to adopt AI. Based on these results it can be stated that compared to the reference category, no other technology intensity category has a higher probability of adopting AI. Therefore, the manufacturers that fall into either “low-medium, “medium-high” and “high” technology intensity groups are not statistically more likely to adopt AI than manufacturers that fall into the group of low technology intensity.
Finally, the relationship between readiness for Industry 4.0 and the use of AI was examined. Industry 4.0 readiness is ordinal by nature, as readiness levels follow a ranking from level 0 to level 5. This characteristic indicates that it is an ordinal variable that has a clear ranking, but does not necessarily imply equal distances between categories. If we assume that the distances between the readiness levels are approximately equal, we can treat this variable as continuous and do not need to include the different readiness levels as separate categories. As Robitzsch has shown in his work, treating ordinal variables as continuous still leads to valid results [59]. This allows us to interpret the regression coefficients more easily, i.e., an increase in the predictor variable by one unit corresponds to a change in the log odds of the result. In connection with the readiness for Industry 4.0 and the probability of using AI, the results of the logistic regression can be found in Table 10. Since the results show that for I4.0 readiness the value in the Sig. column is below the maximum significance threshold of 0.1 (and even 0.05), we can interpret the values of the beta coefficient, exponentiated beta Exp(β), and LB and UB. Given that the independent variable is now continuous, each unit increase in I4.0 readiness raises the log odds of AI adoption by 0.19, with an approximate standard error of 0.09. The Exp(β) value of 1.21 indicates that for each unit increase in I4.0 readiness, the odds of AI adoption rise by a factor of 1.21, or 21%. This means that higher levels of I4.0 readiness are associated with a 21% increase in the odds of adopting AI. The 95% confidence interval for the odds ratio, provided by the LB and UB columns, ranges from 1.02 to 1.43. This suggests that the true odds ratio is likely between these values, and since the interval is entirely above 1, it confirms the statistical significance of this variable. In conclusion, these results demonstrate that I4.0 readiness is a significant predictor of AI adoption, with higher readiness levels leading to increased odds of adopting AI. This version maintains the essential details while improving clarity and readability.
This model is statistically significant and indicates that readiness for I4.0 has a positive effect on the use of AI, i.e., it increases the likelihood of using AI. For this reason, we can also analyze the probability of AI usage at different levels of readiness. Figure 1 visualizes the results of the logistic regression. It shows the probabilities of using AI at each readiness level and shows that the higher the level of readiness for I4.0, the higher the probability of AI use in manufacturing companies.

5. Discussion

The results of our study show that the use of AI in the manufacturing companies is still quite low. As AI is an emerging technology, this was one of the initial expectations. About 18% of the respondents in our study can be classified as AI users, as they use at least one AI software solution in their production processes.
Originally, it was assumed that larger companies were more likely to use some kind of AI-powered software. Although the results of the descriptive statistics in Table 3 indicate that larger companies more frequently use AI software, the logistic regression revealed that company size is not a significant predictor of AI usage. An important finding of our study is, therefore, that the use of AI software in manufacturing companies appears not to be statistically significantly related to the company size. This finding suggests that small, medium and large companies are equally likely to adopt AI technologies, which is in contrast to some previous studies that indicated a potential advantage for larger companies due to their greater resources and capabilities [53,54,55]. Our findings reject the main findings of Kinkel et al. [54], who argue that company size positively influences AI implementation. Instead of directly using company size as a factor, the authors measured this by the number of employees, which was further transformed using natural logarithms. In their study, they first carried out a multiple linear regression to model the relationship between different company characteristics, technological context, environmental context and the dependent variable “AI Index”, which was calculated as a mean of values of AI intensity for three different tasks. In the first and second multiple linear regression models, it was shown that AI index increases with the number of employees. However, in this same study, Kinkel et al. used the logistic regression to model the relationship between companies that implemented AI only at their domestic location and not at their foreign location. In this case, company size turned out to not be statistically significant. Ransbotham [69] argues that companies of all sizes are adopting AI technologies and emphasizes the role of cloud-based AI services in making these technologies accessible to smaller companies. One explanation for this finding is the increasing availability of scalable AI solutions. Cloud-based AI services, for example, offer flexible and cost-effective options for companies of all sizes. These services eliminate the need for significant upfront investment in hardware and infrastructure, making AI accessible to smaller companies. The practical implications of this finding are significant. It suggests that small manufacturing companies should not be deterred by their size when considering the use of AI. On the contrary, they can use AI to compete more effectively with larger companies by driving innovation and efficiency in their operations. As already mentioned, the emergence of cloud-based services and AI-as-a-service business models enables manufacturing companies to implement AI capabilities without the need for in-house experts or extensive infrastructure. Therefore, small and medium-sized manufacturing companies have access to cost-effective solutions that do not require significant upfront investment in necessary infrastructure. These solutions can be then tailored to specific needs while improving operational efficiency by automating routine tasks and enabling human experts to work on more complex activities. Based on our findings, we reject H2 and conclude that company size is not statistically significantly related to the use of AI.
No currently available study has addressed a direct relationship between the different roles of manufacturing companies in the supply chain [21,60] and the likelihood of AI adoption. Therefore, we investigated the relationship between the role of the manufacturer in the supply chain and the adoption of AI. An initial analysis revealed that the proportion of AI users in the three categories is quite similar. Further tests with logistic regression confirmed that the role of the manufacturer does not contribute to a higher likelihood of AI use. Contrary to what might be expected, the use of AI appears to be robust across both types of companies, but the type and focus of AI applications may differ. Suppliers are more likely to focus their AI efforts on improving production processes, quality control and supply chain management, while OEMs are using AI to manage the complexity of large-scale manufacturing and extensive supply chains. For suppliers, AI provides a competitive advantage by improving production quality and operational efficiency. For OEMs, AI’s ability to streamline complex manufacturing processes and optimize supply chains means higher productivity and cost savings. Nevertheless, based on our findings, we can reject H3 and conclude that companies that are solely suppliers of parts or components to other companies are no more likely to use AI than OEM manufacturers or companies that are both suppliers and OEMs. We originally hypothesized that the role of the manufacturer plays a role in the adoption of AI, but the regression results prove otherwise. Therefore, we reject this hypothesis and conclude that the role of a company is not statistically significantly related to the AI usage and that there are other, more important factors that influence it.
Regarding the technology intensity of manufacturing companies, it was hypothesized that the higher the technology intensity of a company, the more likely it is to use AI. It is assumed that high-tech industries such as electronics will adopt AI technologies faster, as they are inherently familiar with advanced technological tools and allocate more financial resources to research and development. Conversely, low-tech industries, such as textiles and basic materials, are assumed to be slower to adopt AI. While the results of our descriptive statistics show that manufacturing companies in the high-tech group have the highest proportion of AI users (30% of companies in this group use AI), the logistic regression rejects the hypothesized relationship. The introduction of AI obviously brings advantages for high-tech and low-tech companies. For manufacturing companies in low-tech industries, AI offers the opportunity to optimize existing processes and improve quality control, thereby increasing competitiveness. The implementation of AI solutions can help these industries achieve greater efficiency and cost savings, and make them more resilient in a rapidly evolving market environment. In addition, the use of AI in high-tech industries can drive significant innovation, streamline complex manufacturing processes and improve product design.
Finally, the relationship between the level of I4.0 readiness and AI usage was examined. For the purposes of our study, an I4.0 readiness model was used that was developed based on previous EMS studies. This model is based only on technologies that are seen as enablers of I4.0. Since AI is part of a broader concept of I4.0, we were interested in whether there is a relationship between a higher level of readiness (and thus more enabling technologies) and the use of AI. Our analysis confirms a positive relationship and shows that the higher the level of readiness, the greater the likelihood of using AI in at least one production area. Therefore, we can accept the hypothesis that the level of I4.0 readiness is statistically significantly related to the use of AI. This means that the use of AI solutions in manufacturing companies is closely related to the readiness for Industry 4.0 (I4.0), especially with the use of other (enabling) digital technologies used in the company. In other words, manufacturing companies that were better prepared for I4.0 were more likely to adopt AI solutions that can increase their efficiency, productivity and competitiveness. Our findings clearly show that manufacturing companies characterized by advanced digital infrastructures, integrated cyber-physical systems and a strong emphasis on data analytics and IoT tend to adopt AI technologies faster and more extensively. Manufacturing companies with a low readiness for Industry 4.0 are at an early stage of digital transformation and typically have limited integration of digital technologies. These companies focus on basic AI applications such as quality control. For some companies with low Industry 4.0 readiness, the introduction of AI can serve as a catalyst for digital transformation in the future. As this iteration of EMS is the first to include questions about AI software in various production areas, and to our knowledge this is the first study to address the relationship between Industry 4.0 technologies and AI, some limited recommendations can be made for companies looking to increase their AI usage. The first and most obvious recommendation is to analyze the current use of technologies in the manufacturing company and see if they can be associated or categorized with any of these seven enabling technologies. These technologies generate data and allow for easier data collection if they are connected to a central database or if they allow data to be exported in a readable format. As long as the company has access to data, it can use various AI solutions from the cloud or hire external specialists to develop specialized AI software that is better tailored to the company’s goals. By gradually implementing and integrating enabling technologies, these companies can implement AI more efficiently and increase operational efficiency, improve quality control and prepare for the future integration of Industry 4.0.
Even though our results show that company size and technology intensity do not have a significant impact on the likelihood of AI adoption, this can be partly attributed to the sample size. In the case of the logistic regression for the relationship between company size and AI adoption, the results for large companies are very close to the significance threshold of 10%. This suggests that a larger sample size might yield different results and that it is a complex concept that requires a larger sample size and other methods for modeling complex relationships such as structural equation modeling (SEM).

6. Conclusions

The aim of our study was to investigate the diffusion of AI tools in manufacturing companies in the three selected countries and the potential influence of company size, role, technological sector and I4.0 readiness on the likelihood of AI implementation. The following main conclusions can be made:
  • Company size does not contribute to a higher likelihood of AI adoption.
  • Technology intensity does not contribute to a higher likelihood of AI adoption.
  • The role of the manufacturer in the supply chain does not contribute to a higher likelihood of AI adoption.
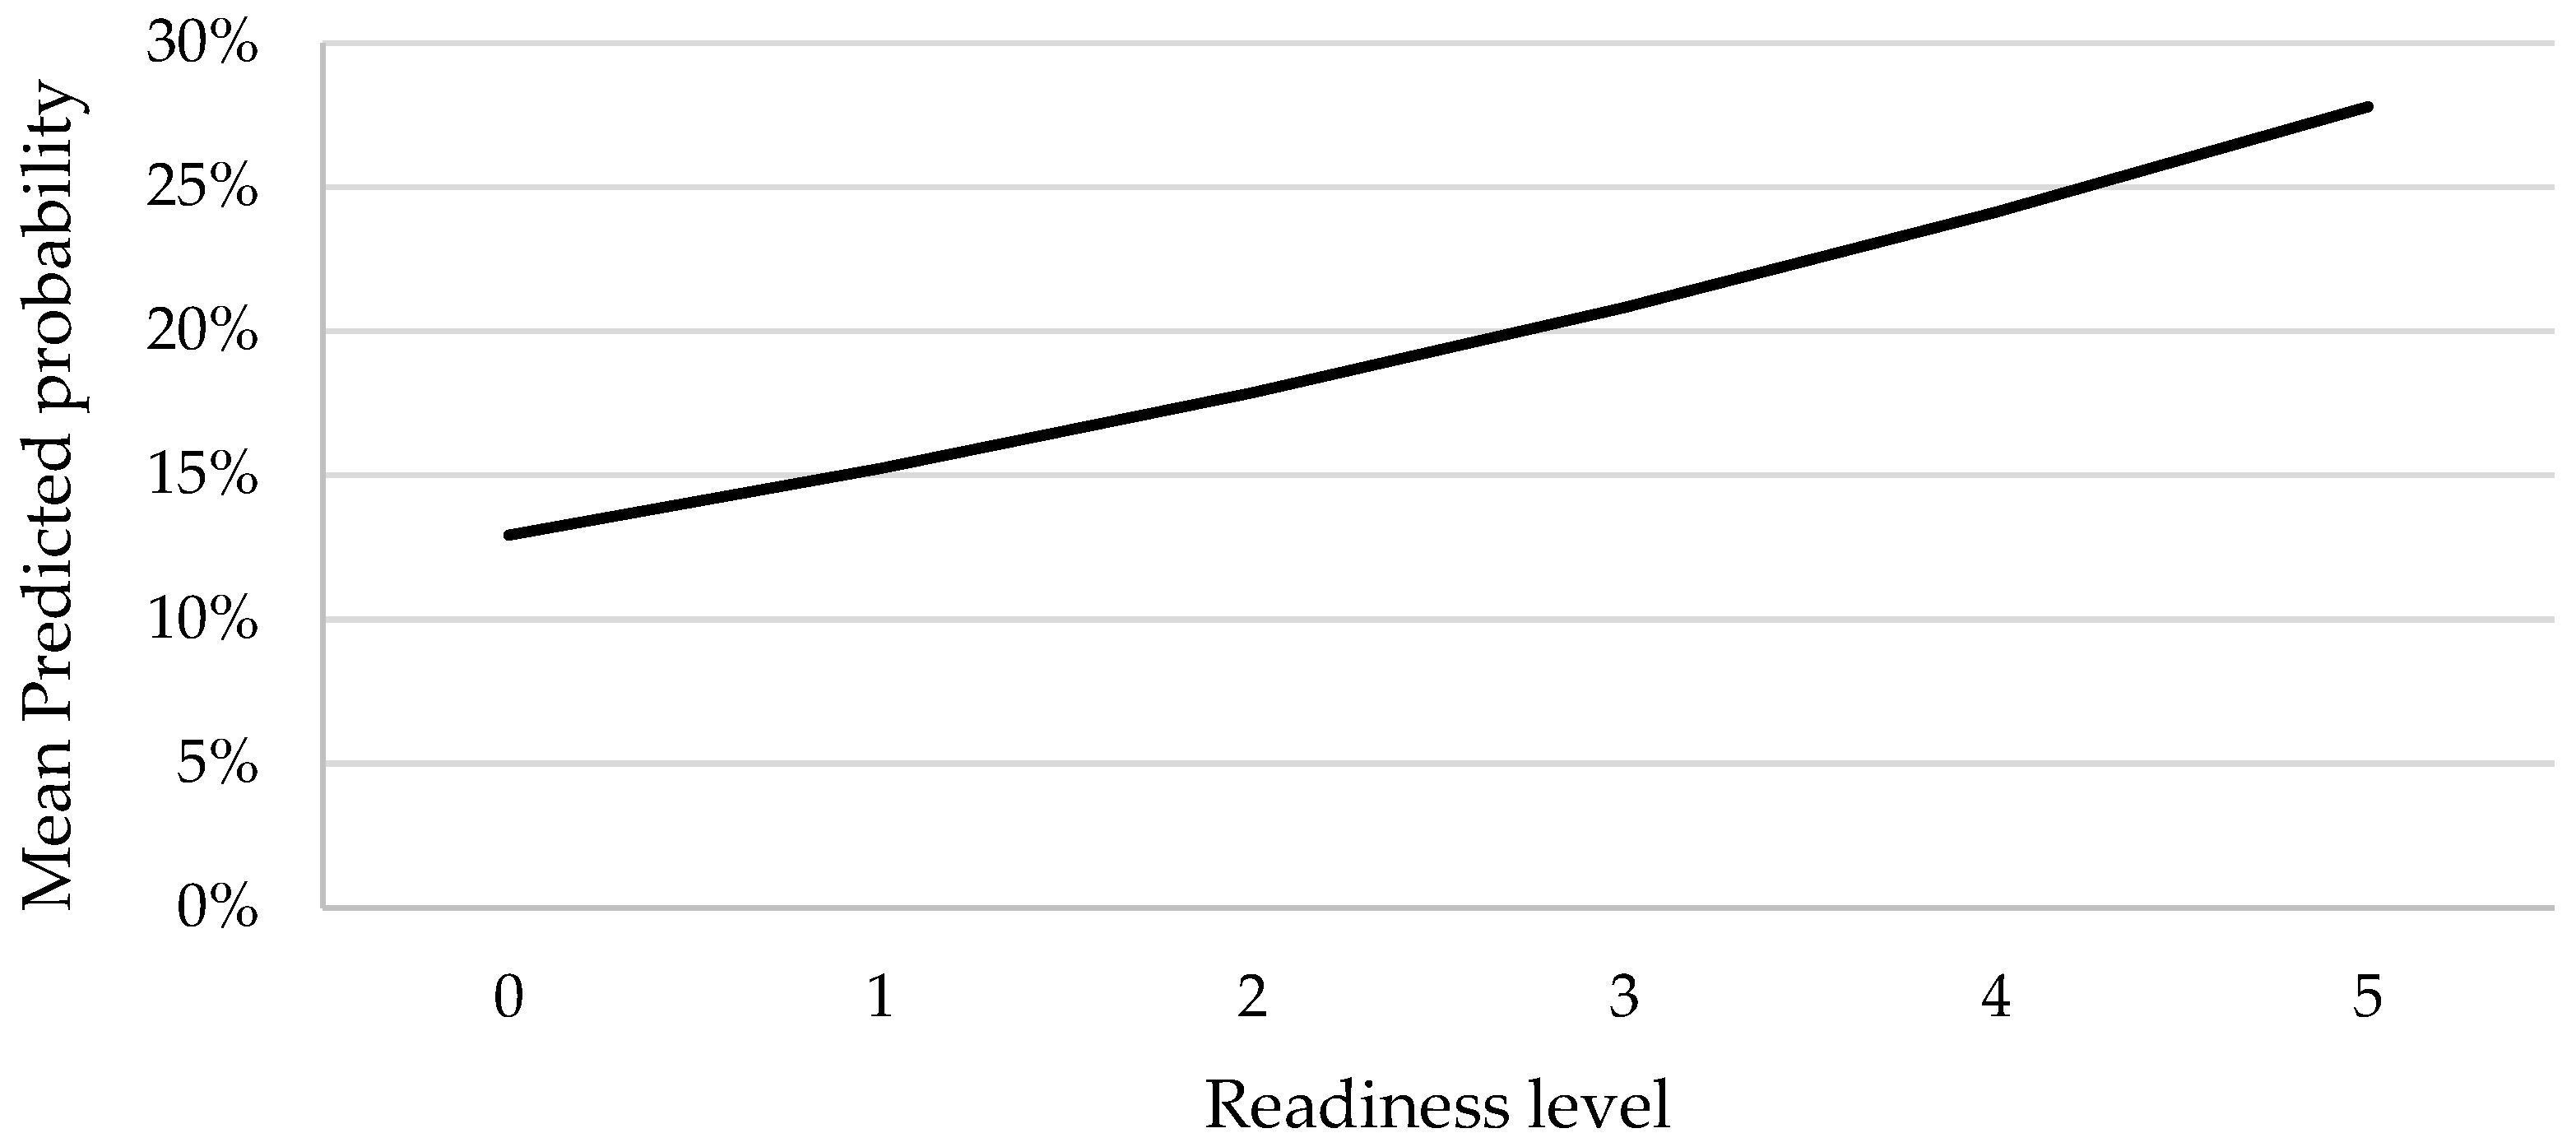
  • Higher I4.0 readiness contributes to the likelihood of AI adoption.
Our study has several contributions. First, it contributes to the current state of knowledge about the use of AI in manufacturing. It shows that the share of manufacturing companies using AI is quite low. It also confirms some of the established findings of Kinkel et al. [54]. Although it may initially appear that larger companies have more resources and knowledge in terms of adopting new technologies, this is not the case with AI. Even companies that fall into the high technology intensity category do not use AI more frequently than companies in other categories. This study also makes a small contribution to the area of supply chain management. It shows that the role of the company in the supply chain in relation to the adoption of AI is not statistically significant. The final contribution of this study looks at the relationship between the readiness of companies for I4.0 and the likelihood of AI adoption. It confirms that companies that have reached a higher level of I4.0 readiness (in our case, they use more I4.0-enabling technologies) are more likely to use AI.
This study offers some limited managerial implications. Based on previous findings, it is still assumed that companies with more know-how and more resources are more likely to adopt new technologies. These findings challenge the previous assumption and suggest that pure organizational characteristics do not matter in the context of AI adoption. Therefore, managers or consultants should not rely solely on company resources when adopting AI. However, the positive relationship between AI use and the selected I4.0 readiness model shows that a higher level leads to a higher likelihood of AI use. Since the selected I4.0 model consists only of technologies that are believed to be enablers of I4.0, our results imply that certain technologies have a greater impact on the likelihood of AI use. This is an important managerial implication since it motivates managers to analyze their current processes and identify missing technologies that would enable easier implementation of AI. However, for a more detailed overview of AI-enabling technologies and factors, further studies need to be conducted. Our results suggest that a manufacturing company still has about a 14% chance of using AI even without adopting enabling technologies. This suggests that there are other, non-technological factors contributing to AI adoption that merit further investigation. However, the more of these technologies and combinations of them that are implemented, the higher the likelihood of AI adoption. A common denominator of these technologies is their role in data generation. ERP systems consolidate different business processes into a unified system and generate data from different departments such as finance, supply chain, manufacturing and human resources. PLM systems monitor data throughout a product’s lifecycle, including specifications, design changes, manufacturing processes and performance metrics. Digital visualization technologies generate data by capturing real-time information from various sources and transforming it into visual formats such as dashboards, 3D models and simulations. Mobile devices facilitate real-time access to information and improve communication and collaboration between employees, generating data. Near-real-time production control systems generate data by constantly monitoring production processes and capturing information on machine performance, production rate and quality metrics. Automation and internal logistics management technologies generate data on material movement and handling within a facility, including inventory levels, material flows and equipment performance. Finally, digital data exchange technologies ensure accurate and secure data transfer between different systems, devices and organizations, promoting seamless integration and collaboration throughout the supply chain. Managers of manufacturing companies should therefore pay special attention to the availability and quality of data that can be used either for training specialized AI software or for analysis through the use of cloud-based services.
The main limitation of this study is the sample of manufacturing companies. As only companies from Eastern and Southern Europe were analyzed, this could influence the results regarding AI usage. Another limitation concerns the sample size. Although a total of 386 companies were surveyed, this sample size may not be able to provide adequate statistical power. Therefore, further studies need to include companies from Western Europe, which in turn would lead to a larger sample size and more robust results regarding AI use. Another limitation is that the survey is only designed for manufacturers and does not include other sectors such as agriculture, construction or retail, and the results cannot be generalized to other sectors. To this end, a new cross-country and cross-industry survey, similar to the one used by Poba-Nzao and Tchibozo [55] in their work, would be more appropriate and would show the differences in the use of AI in different industries and sectors. Further studies are needed to identify the most important factors for the introduction of AI in manufacturing using more complex methods such as SEM. As technologies have been shown to be associated with a higher probability of AI adoption, further research is needed to identify which specific technologies are associated with higher AI adoption. For this reason, future research must also address potential barriers or drivers that are not necessarily technological in nature, but rather related to culture, organization, business models and other company characteristics. While the use of AI has been shown to be influenced by Industry 4.0-enabling technologies, a detailed investigation into the exact technologies influencing the adoption of AI has yet to be conducted. Despite the limitations of this study, the findings contribute to the understanding of the factors that could drive the adoption of AI in manufacturing. While the factors that can be described as company characteristics (i.e., size, role and technological intensity) were not found to be significant in predicting AI adoption, they do provide suggestions for further research into technologies that may be associated with AI adoption.

Author Contributions

Conceptualization, I.P. and K.K.; methodology, K.K., P.T. and J.P.; validation, P.T., J.P. and I.P.; formal analysis, K.K.; investigation, K.K.; writing—original draft preparation, K.K.; writing—review and editing, I.P., P.T. and J.P.; supervision, I.P. All authors have read and agreed to the published version of the manuscript.

Funding

This research was funded by the Slovenian Research Agency (Research Core Funding No. P2-0190).

Institutional Review Board Statement

Not applicable.

Informed Consent Statement

Not applicable.

Data Availability Statement

The datasets presented in this article are not readily available because of the commitments to the research consortium. Requests to access the datasets should be directed to Fraunhofer Institute for Systems and Innovation Research ISI.

Conflicts of Interest

The authors declare no conflicts of interest.

References

  1. Haraguchi, N.; Cheng, C.F.C.; Smeets, E. The Importance of Manufacturing in Economic Development: Has This Changed? World Dev. 2017, 93, 293–315. [Google Scholar] [CrossRef]
  2. Kagermann, H.; Wahlster, W.; Helbig, J. Recommendations for Implementing the Strategic Initiative Industrie 4.0: Final Report of the Industrie 4.0 Working Group; Forschungsunion: Berlin, Germany, 2013. [Google Scholar]
  3. Hermann, M.; Pentek, T.; Otto, B. Design Principles for Industrie 4.0 Scenarios. In Proceedings of the 2016 49th Hawaii International Conference on System Sciences (HICSS), Koloa, HI, USA; 2016; pp. 3928–3937. [Google Scholar] [CrossRef]
  4. Xu, L.D.; Xu, E.L.; Li, L. Industry 4.0: State of the Art and Future Trends. Int. J. Prod. Res. 2018, 56, 2941–2962. [Google Scholar] [CrossRef]
  5. Oztemel, E.; Gursev, S. Literature Review of Industry 4.0 and Related Technologies. J. Intell. Manuf. 2020, 31, 127–182. [Google Scholar] [CrossRef]
  6. Wamba-Taguimdje, S.L.; Fosso Wamba, S.; Kala Kamdjoug, J.R.; Tchatchouang Wanko, C.E. Influence of Artificial Intelligence (AI) on Firm Performance: The Business Value of AI-Based Transformation Projects. Bus. Process Manag. J. 2020, 26, 1893–1924. [Google Scholar] [CrossRef]
  7. Makar, K.Š. Driven by Artificial Intelligence (AI)—Improving Operational Efficiency and Competitiveness in Business. In Proceedings of the 2023 46th MIPRO ICT and Electronics Convention (MIPRO), Opatija, Croatia, 22–26 May 2023; pp. 1142–1147. [Google Scholar] [CrossRef]
  8. Lee, M.C.M.; Scheepers, H.; Lui, A.K.H.; Ngai, E.W.T. The Implementation of Artificial Intelligence in Organizations: A Systematic Literature Review. Inf. Manag. 2023, 60, 103816. [Google Scholar] [CrossRef]
  9. Elibal, K.; Özceylan, E. A Systematic Literature Review for Industry 4.0 Maturity Modeling: State-of-the-Art and Future Challenges. Kybernetes 2020, 50, 2957–2994. [Google Scholar] [CrossRef]
  10. Hizam-Hanafiah, M.; Soomro, M.A.; Abdullah, N.L. Industry 4.0 Readiness Models: A Systematic Literature Review of Model Dimensions. Information 2020, 11, 364. [Google Scholar] [CrossRef]
  11. Nguyen, T.P.Q.; Yang, C.L.; Le, M.D.; Nguyen, T.T.; Luu, M.T. Enhancing Automated Defect Detection through Sequential Clustering and Classification: An Industrial Case Study Using the Sine-Cosine Algorithm, Possibilistic Fuzzy c-Means, and Artificial Neural Network. Adv. Prod. Eng. Manag. 2023, 18, 237–249. [Google Scholar] [CrossRef]
  12. Pang, J.L. Adaptive Fault Prediction and Maintenance in Production Lines Using Deep Learning. Int. J. Simul. Model. 2023, 22, 734–745. [Google Scholar] [CrossRef]
  13. Plathottam, S.J.; Rzonca, A.; Lakhnori, R.; Iloeje, C.O. A Review of Artificial Intelligence Applications in Manufacturing Operations. J. Adv. Manuf. Process. 2023, 5, e10159. [Google Scholar] [CrossRef]
  14. Peta, K.; Żurek, J. Prediction of Air Leakage in Heat Exchangers for Automotive Applications Using Artificial Neural Networks. In Proceedings of the 2018 9th IEEE Annual Ubiquitous Computing, Electronics & Mobile Communication Conference (UEMCON), New York, NY, USA, 8–10 November 2018; pp. 721–725. [Google Scholar] [CrossRef]
  15. Zonta, T.; da Costa, C.A.; da Rosa Righi, R.; de Lima, M.J.; da Trindade, E.S.; Li, G.P. Predictive Maintenance in the Industry 4.0: A Systematic Literature Review. Comput. Ind. Eng. 2020, 150, 106889. [Google Scholar] [CrossRef]
  16. Mobley, R.K. An Introduction to Predictive Maintenance; Butterworth-Heinemann: Oxford, UK, 2002; ISBN 0750675314. [Google Scholar]
  17. Hsu, C.C.; Jiang, B.H.; Lin, C.C. A Survey on Recent Applications of Artificial Intelligence and Optimization for Smart Grids in Smart Manufacturing. Energies 2023, 16, 7660. [Google Scholar] [CrossRef]
  18. Willenbacher, M.; Wohlgemuth, V.; Risch, L. Neural Networks for Energy Optimization of Production Processes in Small and Medium Sized Enterprises. In Proceedings of the Advances and New Trends in Environmental Informatics (EnviroInfo 2022), University of Hamburg, Hamburg, Germany, 26–28 September 2022; pp. 129–145. [Google Scholar] [CrossRef]
  19. Danishvar, M.; Danishvar, S.; Katsou, E.; Mansouri, S.A.; Mousavi, A. Energy-Aware Flowshop Scheduling: A Case for AI-Driven Sustainable Manufacturing. IEEE Access 2021, 9, 141678–141692. [Google Scholar] [CrossRef]
  20. Helo, P.; Hao, Y. Artificial Intelligence in Operations Management and Supply Chain Management: An Exploratory Case Study. Prod. Plan. Control 2022, 33, 1573–1590. [Google Scholar] [CrossRef]
  21. Dash, R.; McMurtrey, M.; Rebman, C.; Kar, U.K. Application of Artificial Intelligence in Automation of Supply Chain Management. J. Strateg. Innov. Sustain. 2019, 14. [Google Scholar] [CrossRef]
  22. Weichert, D.; Link, P.; Stoll, A.; Rüping, S.; Ihlenfeldt, S.; Wrobel, S. A Review of Machine Learning for the Optimization of Production Processes. Int. J. Adv. Manuf. Technol. 2019, 104, 1889–1902. [Google Scholar] [CrossRef]
  23. Aphirakmethawong, J.; Yang, E.; Mehnen, J. An Overview of Artificial Intelligence in Product Design for Smart Manufacturing. In Proceedings of the 2022 27th International Conference on Automation and Computing (ICAC), Bristol, UK, 1–3 September 2022; pp. 1–6. [Google Scholar] [CrossRef]
  24. Wang, Y.; Mo, D.Y.; Tseng, M.M. Mapping Customer Needs to Design Parameters in the Front End of Product Design by Applying Deep Learning. CIRP Ann. 2018, 67, 145–148. [Google Scholar] [CrossRef]
  25. Zhou, F.; Ayoub, J.; Xu, Q.; Yang, X.J. A Machine Learning Approach to Customer Needs Analysis for Product Ecosystems. J. Mech. Des. 2020, 142, 011101. [Google Scholar] [CrossRef]
  26. Yoo, S.; Lee, S.; Kim, S.; Hwang, K.H.; Park, J.H.; Kang, N. Integrating Deep Learning into CAD/CAE System: Generative Design and Evaluation of 3D Conceptual Wheel. Struct. Multidiscip. Optim. 2021, 64, 2725–2747. [Google Scholar] [CrossRef]
  27. Merayo, D.; Rodríguez-Prieto, A.; Camacho, A.M. Comparative Analysis of Artificial Intelligence Techniques for Material Selection Applied to Manufacturing in Industry 4.0. Procedia Manuf. 2019, 41, 42–49. [Google Scholar] [CrossRef]
  28. Bermejillo Barrera, M.D.; Franco-Martínez, F.; Díaz Lantada, A. Artificial Intelligence Aided Design of Tissue Engineering Scaffolds Employing Virtual Tomography and 3D Convolutional Neural Networks. Materials 2021, 14, 5278. [Google Scholar] [CrossRef] [PubMed]
  29. Vasantha, G.; Purves, D.; Quigley, J.; Corney, J.; Sherlock, A.; Randika, G. Assessment of Predictive Probability Models for Effective Mechanical Design Feature Reuse. Artif. Intell. Eng. Des. Anal. Manuf. 2022, 36, e17. [Google Scholar] [CrossRef]
  30. Borah, S.; Kama, C.; Rakshit, S.; Vajjhala, N.R. Applications of Artificial Intelligence in Small- and Medium-Sized Enterprises (SMEs). In Cognitive Informatics and Soft Computing; Mallick, P.K., Bhoi, A.K., Barsocchi, P., de Albuquerque, V.H.C., Eds.; Springer: Singapore, 2022; pp. 717–726. [Google Scholar] [CrossRef]
  31. Kusiak, A. Convolutional and Generative Adversarial Neural Networks in Manufacturing. Int. J. Prod. Res. 2020, 58, 1594–1604. [Google Scholar] [CrossRef]
  32. Malhan, R.; Gupta, S.K. The Role of Deep Learning in Manufacturing Applications: Challenges and Opportunities. J. Comput. Inf. Sci. Eng. 2023, 23. [Google Scholar] [CrossRef]
  33. Monek, G.D.; Fischer, S. Expert Twin: A Digital Twin with an Integrated Fuzzy-Based Decision-Making Module. Decis. Mak. Appl. Manag. Eng. 2024, 8, 1–21. [Google Scholar] [CrossRef]
  34. Ghodake, S.P.; Ramchandra Malkar, V.; Santosh, K.; Jabasheela, L.; Abdufattokhov, S.; Gopi, A.; Tashkent, I. Enhancing Supply Chain Management Efficiency: A Data-Driven Approach Using Predictive Analytics and Machine Learning Algorithms. Int. J. Adv. Comput. Sci. Appl. 2024, 15, 672–686. [Google Scholar] [CrossRef]
  35. William, P.; Nirsanametla, Y.; Al-Samalek, A.; Hussain, A.; Varshney, N.; Rao, A. AI and Machine Learning Techniques for Managing Complexity, Changes and Uncertainties in Manufacturing. In Proceedings of the 2024 4th International Conference on Innovative Practices in Technology and Management (ICIPTM), Noida, India, 21–23 February 2024; pp. 1–6. [Google Scholar] [CrossRef]
  36. Fahle, S.; Prinz, C.; Kuhlenkötter, B. Systematic Review on Machine Learning (ML) Methods for Manufacturing Processes—Identifying Artificial Intelligence (AI) Methods for Field Application. Procedia CIRP 2020, 93, 413–418. [Google Scholar] [CrossRef]
  37. Paturi, U.M.R.; Cheruku, S. Application and Performance of Machine Learning Techniques in Manufacturing Sector from the Past Two Decades: A Review. Mater. Today Proc. 2021, 38, 2392–2401. [Google Scholar] [CrossRef]
  38. Lasi, H.; Fettke, P.; Kemper, H.-G.; Feld, T.; Hoffmann, M. Industry 4.0. Bus. Inf. Syst. Eng. 2014, 6, 239–242. [Google Scholar] [CrossRef]
  39. Hofmann, E.; Rüsch, M. Industry 4.0 and the Current Status as Well as Future Prospects on Logistics. Comput. Ind. 2017, 89, 23–34. [Google Scholar] [CrossRef]
  40. Piccarozzi, M.; Aquilani, B.; Gatti, C. Industry 4.0 in Management Studies: A Systematic Literature Review. Sustainability 2018, 10, 3821. [Google Scholar] [CrossRef]
  41. Schneider, P. Managerial Challenges of Industry 4.0: An Empirically Backed Research Agenda for a Nascent Field. Rev. Manag. Sci. 2018, 12, 803–848. [Google Scholar] [CrossRef]
  42. Erol, S.; Schumacher, A.; Sihn, W. Strategic Guidance towards Industry 4.0–A Three-Stage Process Model. In Proceedings of the International Conference on Competitive Manufacturing Proceedings of the International Conference on Competitive Manufacturing (COMA), Stellenbosch, South Africa, 27–29 January 2016; pp. 495–501. [Google Scholar]
  43. Bauer, W.; Schlund, S.; Marrenbach, D.; Ganschar, O. Studie: Industrie 4.0—Volkswirtschaftliches Potenzial Für Deutschland. Available online: https://www.bitkom.org/Publikationen/2014/Studien/Studie-Industrie-4-0-Volkswirtschaftliches-Potenzial-fuer-Deutschland/Studie-Industrie-40.pdf (accessed on 31 May 2024).
  44. Ünlü, H.; Demirörs, O.; Garousi, V. Readiness and Maturity Models for Industry 4.0: A Systematic Literature Review. J. Softw. Evol. Process 2023, 36, e2641. [Google Scholar] [CrossRef]
  45. Zamora Iribarren, M.; Garay-Rondero, C.L.; Lemus-Aguilar, I.; Peimbert-García, R.E. A Review of Industry 4.0 Assessment Instruments for Digital Transformation. Appl. Sci. 2024, 14, 1693. [Google Scholar] [CrossRef]
  46. Angreani, L.S.; Vijaya, A.; Wicaksono, H. Systematic Literature Review of Industry 4.0 Maturity Model for Manufacturing and Logistics Sectors. Procedia Manuf. 2020, 52, 337–343. [Google Scholar] [CrossRef]
  47. Mittal, S.; Khan, M.A.; Romero, D.; Wuest, T. A Critical Review of Smart Manufacturing & Industry 4.0 Maturity Models: Implications for Small and Medium-Sized Enterprises (SMEs). J. Manuf. Syst. 2018, 49, 194–214. [Google Scholar] [CrossRef]
  48. Müller, J.M.; Kiel, D.; Voigt, K.I. What Drives the Implementation of Industry 4.0? The Role of Opportunities and Challenges in the Context of Sustainability. Sustainability 2018, 10, 247. [Google Scholar] [CrossRef]
  49. Klingenberg, C.O.; Borges, M.A.V.; Antunes, J.A.V., Jr. Industry 4.0 as a Data-Driven Paradigm: A Systematic Literature Review on Technologies. J. Manuf. Technol. Manag. 2019, 32, 570–592. [Google Scholar] [CrossRef]
  50. Camisón-Zornoza, C.; Lapiedra-Alcamí, R.; Segarra-Ciprés, M.; Boronat-Navarro, M. A Meta-Analysis of Innovation and Organizational Size. Organ Stud. 2004, 25, 331–361. [Google Scholar] [CrossRef]
  51. Clohessy, T.; Acton, T. Investigating the Influence of Organizational Factors on Blockchain Adoption. Ind. Manag. Data Syst. 2019, 119, 1457–1491. [Google Scholar] [CrossRef]
  52. Yao, J.E.; Xu, X.; Liu, C.; Lu, J.; Yao, J. Organizational Size: A Significant Predictor of IT Innovation Adoption. J. Comput. Inf. Syst. 2003, 43, 76–82. [Google Scholar] [CrossRef]
  53. Na, S.; Heo, S.; Choi, W.; Han, S.; Kim, C. Firm Size and Artificial Intelligence (AI)-Based Technology Adoption: The Role of Corporate Size in South Korean Construction Companies. Buildings 2023, 13, 1066. [Google Scholar] [CrossRef]
  54. Kinkel, S.; Baumgartner, M.; Cherubini, E. Prerequisites for the Adoption of AI Technologies in Manufacturing—Evidence from a Worldwide Sample of Manufacturing Companies. Technovation 2022, 110, 102375. [Google Scholar] [CrossRef]
  55. Poba-Nzaou, P.; Tchibozo, A.S. Understanding Artificial Intelligence Adoption Predictors: Empirical Insights from A Large-Scale Survey. In Proceedings of the 2022 International Conference on Information Management and Technology (ICIMTech), Semarang, Indonesia, 11–12 August 2022; pp. 323–326. [Google Scholar] [CrossRef]
  56. Dachs, B.; Kinkel, S.; Jäger, A. Bringing It All Back Home? Backshoring of Manufacturing Activities and the Adoption of Industry 4.0 Technologies. J. World Bus. 2019, 54, 101017. [Google Scholar] [CrossRef]
  57. Bughin, J.; Hazan, E.; Sree Ramaswamy, P.; DC, W.; Chu, M. Artificial Intelligence the Next Digital Frontier. Available online: https://www.mckinsey.com/~/media/mckinsey/industries/advanced%20electronics/our%20insights/how%20artificial%20intelligence%20can%20deliver%20real%20value%20to%20companies/mgi-artificial-intelligence-discussion-paper.pdf (accessed on 31 May 2024).
  58. Lu, D. Fundamentals of Supply Chain Management; Bookboon: Copenhagen, Denmark, 2011. [Google Scholar]
  59. Benjamin, R.; Rolf, I.; Jackson, M.M.S.L.T.R.; Ivanov, D. A Review on Reinforcement Learning Algorithms and Applications in Supply Chain Management. Int. J. Prod. Res. 2023, 61, 7151–7179. [Google Scholar] [CrossRef]
  60. Sharma, R.; Shishodia, A.; Munim, Z.H. The Role of Artificial Intelligence in Supply Chain Management: Mapping the Territory. Int. J. Prod. Res. 2022, 60, 7527–7550. [Google Scholar] [CrossRef]
  61. Hendriksen, C. Artificial Intelligence for Supply Chain Management: Disruptive Innovation or Innovative Disruption? J. Supply Chain Manag. 2023, 59, 65–76. [Google Scholar] [CrossRef]
  62. Zamani, E.D.; Smyth, C.; Gupta, S.; Dennehy, D. Artificial Intelligence and Big Data Analytics for Supply Chain Resilience: A Systematic Literature Review. Ann. Oper. Res. 2023, 327, 605–632. [Google Scholar] [CrossRef] [PubMed]
  63. Wang, M.; Pan, X. Drivers of Artificial Intelligence and Their Effects on Supply Chain Resilience and Performance: An Empirical Analysis on an Emerging Market. Sustainability 2022, 14, 16836. [Google Scholar] [CrossRef]
  64. Dora, M.; Kumar, A.; Mangla, S.K.; Pant, A.; Kamal, M.M. Critical Success Factors Influencing Artificial Intelligence Adoption in Food Supply Chains. Int. J. Prod. Res. 2022, 60, 4621–4640. [Google Scholar] [CrossRef]
  65. Kutz, J.; Neuhüttler, J.; Spilski, J.; Lachmann, T. Implementation of AI Technologies in Manufacturing—Success Factors and Challenges. Hum. Side Serv. Eng. 2022, 62, 256–261. [Google Scholar] [CrossRef]
  66. European Manufacturing Survey. Available online: https://www.isi.fraunhofer.de/en/themen/wertschoepfung/fems.html (accessed on 26 April 2024).
  67. Lerch, C.; Jäger, A.; Meyer, N. I4.0-Readiness-Baden-Württemberg Auf Dem Weg Zur Industrie 4.0? Available online: https://kmu-digital.eu/de/service-kompetenz/publikationen/dokumente/studien/327-i4-0-readiness-baden-wuerttemberg-auf-dem-weg-zur-industrie-4-0 (accessed on 31 May 2024).
  68. Tabachnick, B.G.; Fidell, L.S. Using Multivariate Statistics: International Edition, 6th ed.; Pearson: London, UK, 2012; ISBN 9780205849574. [Google Scholar]
  69. Ransbotham, S.; Khodabandeh, S.; Kiron, D.; Candelon, F.; Chu, M.; Lafountain, B. Expanding AI’s Impact with Organizational Learning. Available online: https://sloanreview.mit.edu/projects/expanding-ais-impact-with-organizational-learning/ (accessed on 24 June 2024).
Figure 1. Probability of AI usage for every I4.0 readiness level.
Applsci 14 06959 g001
Table 1. Variables included in this study.
Variable CategoryVariable NameVariable Description
DependentAI usageYes
No
IndependentCompany sizeLarge (>250 employees)
Medium (50–249 employees)
Small (20–49 employees)
RoleOEM producer
Supplier
Both
Technology intensityHigh
Medium-high
Medium-low
Low
Industry 4.0 readinessLevel 5—Very high users
Level 4—High users
Level 3—Advanced users
Level 2—Advanced beginners
Level 1—Beginners
Level 0—Non-users
Table 2. Breakdown of SW and AI users across individual production areas.
Production AreaSpecialized SW
[%]
Share of AI Users [%]Total Share of AI Users [%]
Process management 55.7%14.4%8.0%
Quality control 39.6%22.2%8.8%
Maintenance 36.8%20.4%7.5%
Internal logistics 37.3%14.6%5.4%
Energy management 22.8%18.2%4.1%
Improvement or innovation 19.4%22.7%4.4%
Table 3. Share of companies that use AI regarding the company size.
SizeShare of Companies [%]Share of AI Users [%]
Small29.215.2
Medium50.817.9
Large20.124.7
Total100
Table 4. Share of companies that use AI regarding the role in the supply chain.
Role in the Supply ChainShare of Companies [%]Share of AI Users [%]
Supplier30.620.3
OEM producer64.017.4
Both5.419.0
Total100
Table 5. Share of companies that use AI regarding their technology intensity.
Technology IntensityShare of Companies [%]Share of AI Users [%]
Low27.216.2
Medium-low42.718.8
Medium-high24.117.2
High6.030.4
Total100
Table 6. Share of companies for every readiness level.
Readiness LevelShare of Companies [%]
Level 017.4
Level 119.9
Level 229.5
Level 314.8
Level 49.6
Level 58.8
Table 7. Logistic regression results (reference category: small companies).
VariableβS.E.WalddfSig.Exp(β)LBUB
Small 2.77120.250
Medium0.2010.3230.38710.5341.2220.6492.301
Large0.6050.3732.62610.1051.8310.8813.804
Constant−1.7210.26342.6921<0.0010.179
Model information:Χ2 = 2.706Sig. = 0.258Nagelkerke r2 = 0.01
Table 8. Logistic regression results for role of the manufacturer (reference category: supplier).
VariableβS.E.WalddfSig.Exp(β)LBUB
Supplier 0.4622
OEM producer−0.1920.2840.45710.4990.8260.471.44
Both−0.0820.6010.01810.8920.9220.282.99
Constant−1.3650.22935.63510.0000.255
Model information:Χ2 = 0.458Sig. = 0.795Nagelkerke r2 = 0.002
Table 9. Logistic regression results for technology intensity (reference category: low technology intensity).
VariableβS.E.WalddfSig.Exp(β)LBUB
Low 2.57930.461
Low-medium0.1800.3320.29610.5871.1980.6252.293
Medium-high0.0730.3820.03610.8491.0760.5092.273
High0.8170.5252.42510.1192.2650.8096.336
Constant−1.6440.26538.5131<0.0010.193
Model information:Χ2 = 2.398Sig. = 0.494Nagelkerke r2 = 0.01
Table 10. Logistic regression results for Industry 4.0 readiness.
VariableβS.E.WalddfSig.Exp(β)LBUB
I4.0 readiness0.190.0874.78310.029 *1.211.021.43
Constant−1.910.24162.3901<0.0010.15
Model information:Χ2 = 4.771Sig. = 0.029Nagelkerke r2 = 0.02
* Value is statistically significant.
Disclaimer/Publisher’s Note: The statements, opinions and data contained in all publications are solely those of the individual author(s) and contributor(s) and not of MDPI and/or the editor(s). MDPI and/or the editor(s) disclaim responsibility for any injury to people or property resulting from any ideas, methods, instructions or products referred to in the content.

