Abstract
Bridges are a crucial component of social infrastructure, playing a vital role in transportation, logistics and transit. Several bridges in South Korea were constructed during the rapid development period of the 1990s and 2000s, with RC slab bridges making up a significant portion of these structures. Over time, many of these bridges have aged considerably. To address this, the “Special Act on the Safety Control and Maintenance of Establishments” was enacted in South Korea to improve bridge maintenance. However, maintenance for aging small- to medium-sized bridges, except for Type 1 bridges, remains inadequate due to budget and personnel shortages. In this study, we developed a damage assessment method to evaluate the deterioration and analyze the current state of small- to medium-sized RC slab bridges. We derived the correlation between the deflection response ratio and the stiffness reduction rate of a bridge through structural analysis. This correlation data were then used to assess the damage to actual in-service bridges. Finally, we analyzed the current state of the target bridge and validated the damage assessment method.
1. Introduction
The rapid development of South Korea has been accompanied by the construction of various infrastructure facilities. Among these, bridges play a critical role in transportation, logistics and transit. Different departments, such as the Facility Management System (FMS) and the Bridge and Tunnel Information System (BTI), are involved in the operation and management of these structures. The FMS manages comprehensive infrastructure, including bridges, tunnels and retaining walls, while the BTI focuses specifically on bridges and tunnels.
The status of facilities managed by the FMS is presented in Table 1 [1]. Excluding buildings, bridges account for approximately 57.2% of the social infrastructure. As listed in Table 2 [1], bridges are classified into three types (Type 1, Type 2 and Type 3) based on their length and form. After the collapse of the Seongsu Bridge on 21 October 1994, South Korea enacted several laws to improve bridge maintenance, including the “Special Act on the Safety Control and Maintenance of Establishments”, the “Framework Act on Sustainable Infrastructure Management” and the “Detailed Guidelines for the Safety and Maintenance of Facilities” [2,3,4]. Significant efforts, including meticulous inspections and the implementation of self-management systems, are invested in maintaining Type 1 bridges, which are classified as major social infrastructure. However, most bridges in South Korea are Type 2 and Type 3, and their maintenance is relatively neglected compared to Type 1 bridges. Therefore, establishing relevant safety measures is necessary.

Table 1.
Status of infrastructure facilities in South Korea (as of 23 January 2024).
Table 2.
Criteria for bridge facility classification.
According to the BTI, South Korea has a total of 38,598 bridges. Among them, reinforced concrete (RC) slab bridges (including RC hollow slab bridges) account for approximately 24.1% of all bridges (Figure 1), making them the most common type of bridge in the country. As shown in Figure 2, approximately 87.1% of these RC slab bridges are over 20 years old, indicating significant aging. Additionally, as depicted in Figure 3, approximately 89.9% of the bridges are less than 20 m long, indicating that most are small-to-medium sized [5].
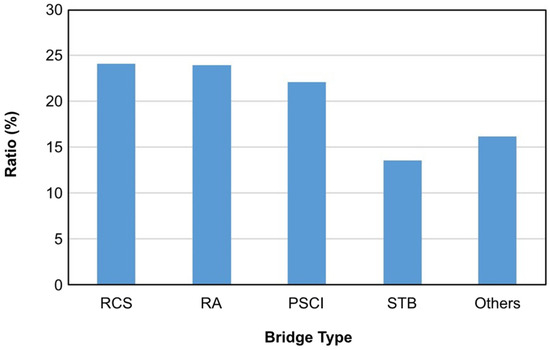
Figure 1.
Ratio of bridge types in South Korea.
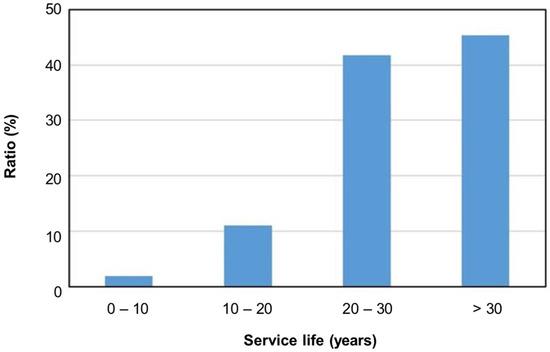
Figure 2.
Ratio of service life of RC slab bridges in South Korea.
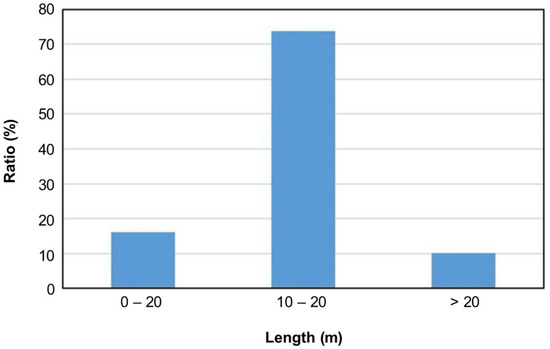
Figure 3.
Ratio of length of RC slab bridges in South Korea.
In South Korea, the maintenance of small- to medium-sized RC slab bridges relies on condition assessments. This involves visual inspections of the target bridge and expressing the results as a quantitative grade from A to E. Although an accurate evaluation requires structural analysis, budget and personnel constraints hinder conducting structural analysis for all in-service bridges during each maintenance cycle.
Looking at bridge inspection standards abroad, in the UK, Safety Inspections and Special Inspections are carried out based on the needs of the managing agency, while General Inspections and Principal Inspections are conducted periodically. General Inspections involve only visual inspection without the use of inspection vehicles or access equipment. In contrast, Principal Inspections involve a more detailed assessment of the bridge’s condition from close range using inspection equipment and vehicles when necessary. In Japan, only regular inspections are mandated for bridges. According to the Bridge Regular Inspection Guidelines, an initial inspection is conducted within two years of the bridge’s opening, and regular inspections are carried out every five years thereafter. There are no specific regulations for inspections beyond the regular ones; instead, such inspections are determined based on the judgment of the technician. Thus, bridge inspection methods both domestically and internationally make it difficult to achieve efficient maintenance [6].
Many researchers have conducted studies to estimate the displacement of bridges using signal data such as acceleration for the purpose of assessing bridge stability. Park et al. developed an algorithm for estimating displacement using measured acceleration. However, this method calculates displacement through integration without considering the initial conditions of the bridge [7]. Gindy et al. conducted research to minimize errors due to frequency components using a developed model. However, this model also calculated displacement through integration [8]. Joh et al. estimated the displacement of a bridge using measured signals, but frequency calibration of the measured data was necessary [9]. While it is possible to assess stability by estimating the displacement of bridges, methods using acceleration data for displacement estimation have lower reliability. The acceleration data measured on-site often show considerable variation rather than a consistent pattern. Additionally, even when noise is removed and displacement is estimated, there can be significant differences compared to the results obtained from actual structural analysis. Therefore, this study aimed to develop a method for assessing the structural stability of bridges using the correlation between deflection response ratios and stiffness degradation rates, rather than relying on traditional displacement estimation methods using acceleration. This approach could provide an efficient maintenance strategy for aging small- to medium-sized RC slab bridges. We propose a theoretical bridge damage assessment method and develop an evaluation process that can continuously assess the damage state through structural analysis and field load tests of in-service bridges.
2. Materials and Methods
2.1. Damage Assessment Method
As bridges age, damage occurs, reducing stiffness and increasing structural responses such as deflection and member forces, which, in turn, decreases their load-carrying capacity [10]. The main components of an RC slab bridge are the deck, piers and abutments. The damage to an RC slab bridge is defined by the damage to its individual components. The structural performance of an RC bridge is primarily related to the deck. For example, mid-span flexural cracks are a common type of deck damage. This type of damage can be simulated and analyzed using a structural analysis program. Figure 4 [11] shows the results of a simulation, indicating a linear relationship between the deflection response ratio and the stiffness reduction rate of a bridge.
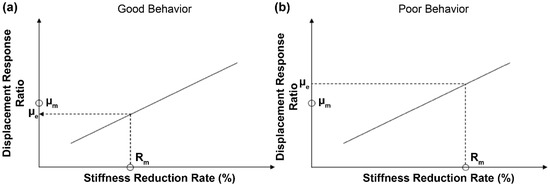
Figure 4.
Correlation between RC bridge displacement response ratio and stiffness reduction rate under (a) good behavior and (b) poor behavior.
The measured deflection response ratio and measured stiffness reduction rate indicated in Figure 4 are defined as follows:
where is the measured deflection response ratio, and are the measured and analyzed deflections, respectively, is the measured stiffness reduction rate, and and are the measured and analyzed natural frequencies, respectively.
During damage assessment, the response behavior of the bridge is considered relatively good compared to the damage level if the measured deflection response ratio is smaller than the theoretical deflection response ratio (Figure 4a). In contrast, if the measured deflection response ratio is larger than the theoretical deflection response ratio (Figure 4b), the response behavior is considered poor, necessitating appropriate maintenance measures. This judgment is based on the additional damage affecting structural responses beyond typical deflection due to the general reduction in stiffness. In this paper, we propose a method to evaluate the damage to RC slab bridges using deflection and natural frequency. Figure 5 shows a schematic of the proposed method. This method is not a quantitative damage assessment tool but an approximate evaluation of bridge damage using deflection and natural frequency. This study was conducted by selecting a target bridge, performing structural analysis and field load tests, and ultimately validating the proposed damage assessment method.
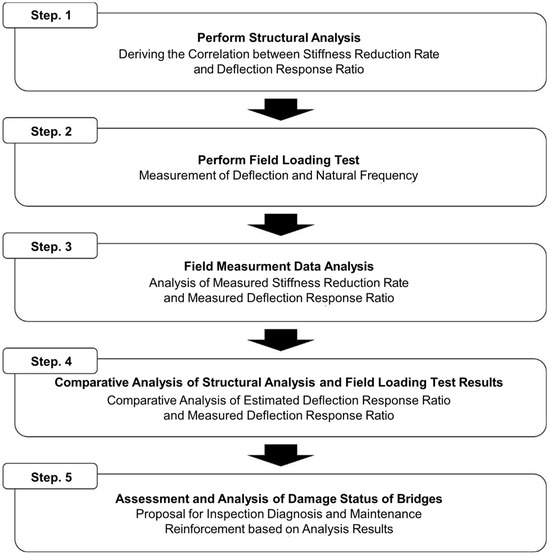
Figure 5.
Damage assessment process for RC slab bridges.
2.2. Target Bridge Selection
We selected a target bridge to verify the proposed damage assessment method, and an overview of the target bridge is shown in Figure 6. The selected bridge is a four-span continuous RC slab bridge that was completed in 1994. It has a total length of 60 m, a width of 10 m and was constructed with a DB-24 design load. The target bridge is an RC slab bridge with a service life of approximately 30 years, which is the most common bridge type and service duration mentioned in the Introduction. While the majority of these bridges have lengths ranging from 10 to 20 m, this particular bridge was chosen for its relatively high traffic volume and its suitability for span-by-span analysis, as opposed to single-span bridges. We modeled the bridge based on the construction drawings, as shown in Figure 7. The model was used for structural analysis and field load tests.
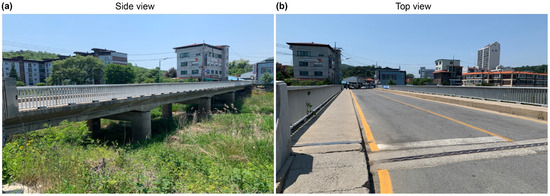
Figure 6.
(a) Side view and (b) top view of the target bridge.
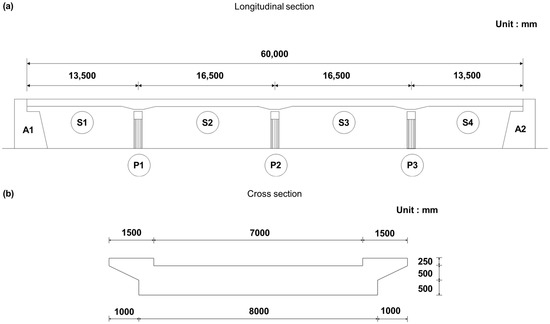
Figure 7.
(a) Longitudinal and (b) Cross-section specifications of the target bridge.
2.3. Structural Analysis
The target bridge is a four-span continuous bridge. As shown in Figure 8, each span was modeled as a plate element using Midas Civil (V940), a structural analysis software. As the curbs of the bridge affect the actual structural stiffness, they were included in the modeling to reflect realistic behavior [12]. The overall behavior of a bridge is significantly influenced by its bearings. According to on-site investigation results, the bearings of the target bridge showed no special damage and were assessed as not affecting the bridge’s behavior. Therefore, boundary conditions were reflected based on the design drawings, and the sections where the bearings are installed were treated as varying cross-sections to closely resemble the actual bridge. Although there was some damage to the asphalt pavement in certain areas, it was judged not to significantly affect structural behavior, so it was considered and applied as an equivalent mass with uniformly distributed loads. To account for the potential reduction in stiffness of the target bridge, the height of the reference model slab was assumed to be 1.0 h, and the cross-section was gradually reduced. The slab heights for the stiffness reduction models were planned as 0.95 h, 0.90 h, 0.85 h, 0.80 h, 0.70 h and 0.60 h, totaling six variations. The range of slab reductions for the stiffness reduction models is shown in Figure 9, and analyses were conducted by varying the cross-sectional height.
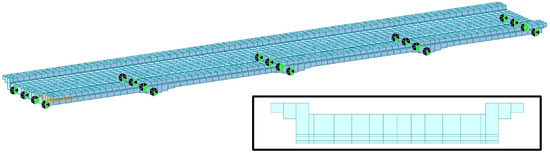
Figure 8.
Structural analysis modeling of the target bridge for longitudinal and cross-sections.
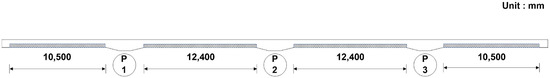
Figure 9.
Reduction range in RC slab bridge stiffness reduction models.
The load cases to be applied to the target bridge were classified as shown in Figure 10. Loads LC1–LC3 were applied to span S1, and loads LC4 and LC5 were applied to span S2. The loads were applied using a dump truck weighing 249.4 kN, loaded on three axes through the vehicle’s front, middle and rear wheels. Finally, the natural frequency of the bridge was determined via eigenvalue analysis, and the deflections for each load were measured at a distance of 1.5 m from both ends of the lower bridge deck.
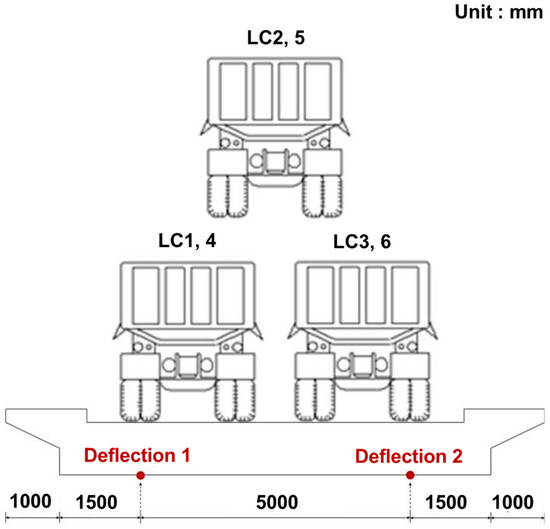
Figure 10.
Load cases applied to the target bridge.
2.4. Field Load Tests
The damage to the target bridge was assessed via static and dynamic load tests. As shown in Figure 11, deflection gauges and accelerometers were installed to obtain the data for damage assessment. The deflection gauges were installed at a distance of 1.5 m from both ends of the deck on the undersides of spans S1 and S2; a total of four gauges were installed. The accelerometers were installed at the center of the curbs; two accelerometers were used in total. Figure 12 shows photographs of the actual deflection gauges and accelerometers installed on the bridge.
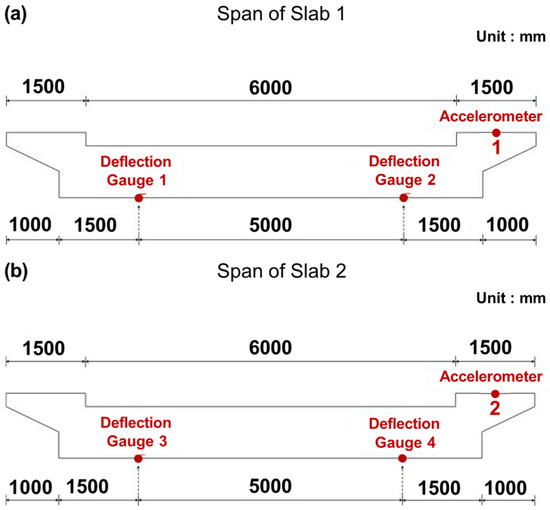
Figure 11.
Sensors installation of (a) span of slab 1, (b) span of slab 2 on the target bridge.
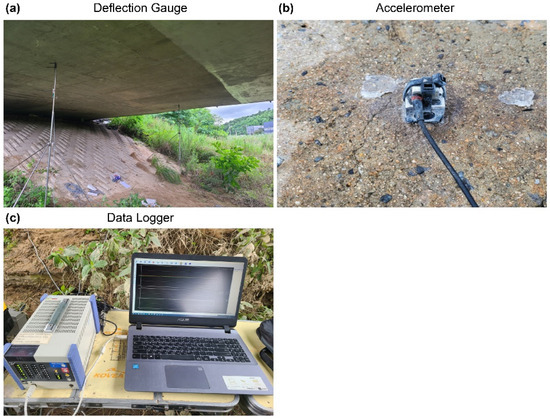
Figure 12.
Field installation of (a) deflection gauge, (b) accelerometer and (c) data logger on the target bridge.
Similar to the structural analysis, the load was applied using a real vehicle, as shown in Figure 13. The load was applied to the central parts of both lanes and the middle section of the bridge. Static load tests were repeated twice for each load case to ensure the reliability of the test results. The deflection of spans at different driving speeds, namely 5, 20, 40 and 55 km/h, was measured during the dynamic load tests [13,14].
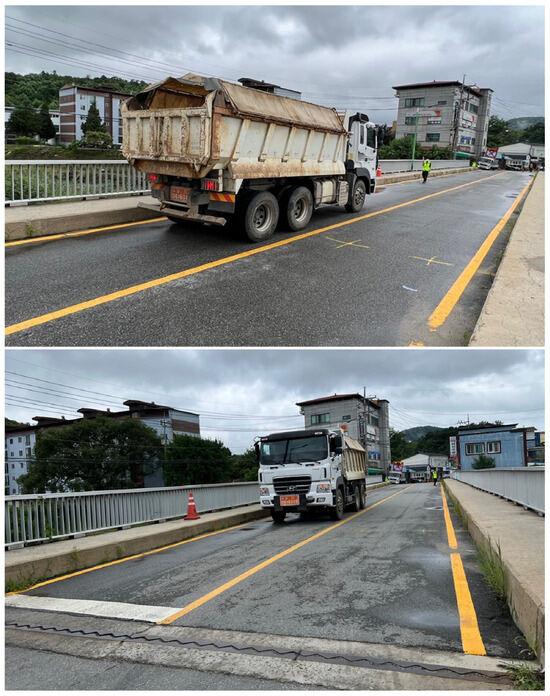
Figure 13.
Loading tests applied to the target bridge.
3. Results
3.1. Structural Analysis Results
The eigenvalue analysis results indicated that the natural frequency of the first bending mode for the reference model was 7.94 Hz. The natural frequencies for each stiffness reduction model are summarized in Table 3. The stiffness reduction rates for each model can be calculated from the obtained natural frequencies using Equation (2). The stiffness reduction rates ranged from 0% for the reference model to a maximum of 54.19%. The deflection values for each stiffness reduction model are listed in Table 4, showing a gradual increase in deflection due to the reduction in stiffness. The deflection response ratios for each stiffness reduction model were obtained from these deflection values using Equation (1).
Table 3.
Natural frequencies and stiffness reduction rates obtained from the structural analysis results.
Table 4.
Deflection response ratio obtained from the structural analysis results.
The correlation between the deflection response ratios and stiffness reduction rates was evaluated using the deflection response ratios and stiffness reduction rates listed in Table 3 and Table 4, as shown in Figure 14. In addition, regression analysis was performed based on the values for each model, and the regression equations obtained for each load case are listed in Table 5. The coefficient of determination () for each load case was greater than 0.997, indicating a very high correlation between the deflection response ratio and stiffness reduction rate. Accordingly, the field measurement data were used to analyze and evaluate the bridge damage.
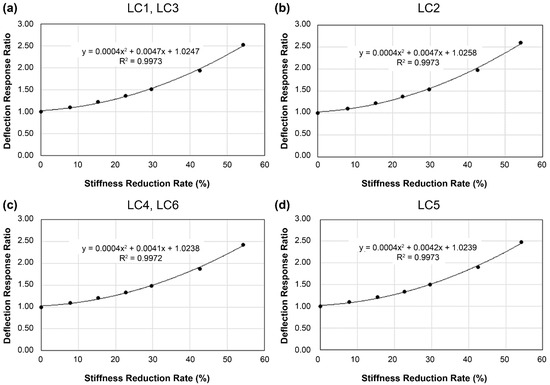
Figure 14.
Correlation between deflection response ratio and stiffness reduction rate from structural analysis for (a) LC1, LC3; (b) LC2; (c) LC4, LC6; (d) LC5.
Table 5.
Regression analysis equation for each load case.
3.2. Field Load Test Results
During the static load tests, once the vehicle passed the starting point at 0 s and was positioned at the center of span S1, a static load was applied for approximately 35–40 s before moving the vehicle to span S2 for load application. As shown in Figure 15, the deflection values for each load case show similar trends. The maximum values measured by the deflection gauges are listed in Table 6 and Table 7, where (+) indicates upward deflections and (−) indicates downward deflections. The results of repeated tests were similar, indicating their reliability. The deflection at both ends of the span was the greatest as the vehicle loading position changed, indicating symmetrical behavior of the bridge under the applied load. This demonstrates good lateral load distribution.
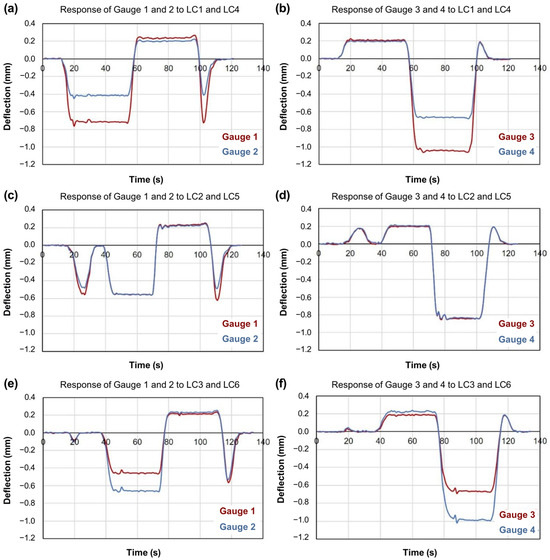
Figure 15.
Deflection graphs of static loading tests for LC1 and LC4: (a) Gauges 1 and 2, (b) Gauges 3 and 4; LC2 and LC5: (c) Gauges 1 and 2, (d) Gauges 3 and 4; LC3 and LC6: (e) Gauges 1 and 2, (f) Gauges 3 and 4.
Table 6.
Deflections for different load cases (LC1–LC3).
Table 7.
Deflections for different load cases (LC4–LC6).
The natural frequency of the bridge, obtained from the dynamic load test, was 6.326 Hz, and the maximum values measured during the static load test are listed in Table 8. Furthermore, the measured deflection response ratios were calculated using the deflection values obtained from the load tests and the reference model used in the structural analysis.
Table 8.
Deflection response ratios obtained from the loading test results.
3.3. Damage Analysis
The stiffness reduction rate of the bridge, calculated based on the natural frequency (6.326 Hz), was 36.571%. This was used to evaluate the correlation between the deflection response ratio and stiffness reduction rate, and the results for each load case are shown in Figure 16 and Table 9. For each load case, the deviation in the measured deflection response ratios from the estimated deflection response ratios was less than 10%, indicating highly similar results. A negative deviation indicates severe damage to the slab, and inspection and reinforcement are recommended. Conversely, a positive deviation suggests that the actual deflection is less than the estimated deflection, indicating that the bridge’s condition is good.
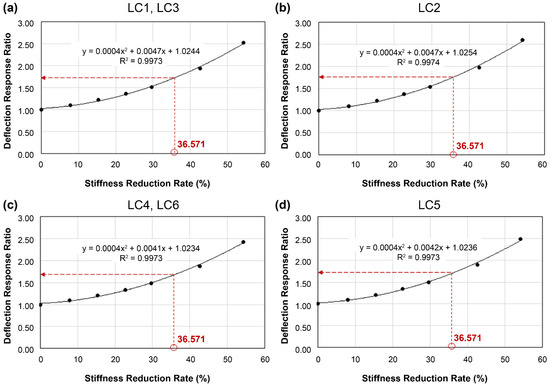
Figure 16.
Estimation of the deflection response ratio considering the stiffness reduction rate for (a) LC1, LC3; (b) LC2; (c) LC4, LC6; (d) LC5.
Table 9.
Comparative analysis for the deflection response ratio.
4. Discussion
The results obtained from the proposed damage assessment method indicate that the target bridge currently exhibits satisfactory stiffness without significant damage that could affect its structural behavior. However, the bridge’s performance is approximately 63% of the original design performance. Visual inspection results, detailed in the actual inspection report, indicate minor damage, and the deck is graded as C. This study illustrates the correlation between the poor behavior of the bridge’s deck due to cracks, specifically deflection. If cracks due to the aging of the bridge continue to occur or propagate, it is anticipated that the measured deflection response ratio will increase sharply, leading to larger negative deviation values. Therefore, although the stiffness reduction of the target bridge due to aging is currently satisfactory, continuous monitoring is necessary.
This study aimed to develop a damage assessment method for the efficient maintenance of aging small- to medium-sized RC slab bridges. Structural analysis results for an RC slab bridge based on the proposed damage assessment method indicated a very high correlation between deflection and stiffness reduction. Accordingly, the damage assessment results for an actual in-service bridge indicated that the target bridge did not exhibit damage that would affect its structural response. These results were similar to those obtained in the visual inspection report of the actual inspection, validating the effectiveness of the proposed damage assessment method.
This study was conducted to develop a damage assessment method for small- to medium-sized RC slab bridges. Therefore, it does not consider temperature variations of the target bridge in the fragmentary load test. However, it is expected that more reliable results can be achieved through future research by considering the behavior variations of the bridge according to temperature changes and expanding the research to include other types of bridges, such as truss bridges.
The current damage assessment method was studied for a single target bridge. In future work, correlation data for deflection response ratios and stiffness reduction rates for multiple bridges must be obtained. By continuously collecting data on the correlation between the deflection response ratio and stiffness reduction rate, damage assessment can be conducted via regression analysis of the collected data without requiring additional structural analysis. Therefore, structural analysis on multiple RC slab bridges will be considered in future work in addition to the target bridge to derive correlation results between the deflection response ratio and stiffness degradation rate and to use the continuously accumulated correlation data for the regression analysis. Additional field load test measurements will be taken and used in the regression analysis to further verify the reliability of the method.
5. Conclusions
The results of the proposed damage assessment method indicate a strong correlation between the deflection response ratio and stiffness reduction rate in RC slab bridges. This correlation allows for the identification of the current state of a bridge based on measurement data, without the need for precise performance evaluations typically obtained through existing bridge inspection systems. As mentioned in the Introduction, this method is expected to address the issues associated with existing displacement estimation methods using acceleration. Furthermore, if data are continuously accumulated using this method, it is anticipated that reliability can be achieved without the need for separate structural analysis.
While the proposed method does not quantify the bridge condition, it effectively assesses the risk of damage relative to current stiffness levels. Bridge management authorities can utilize these foundational data to prioritize repairs and reinforcements effectively. By carrying this out, the proposed method has the potential to reduce the budget and personnel traditionally required for comprehensive inspections. Moreover, the applicability of this damage assessment method extends beyond bridges in South Korea to RC slab bridges in service globally. In conclusion, the proposed method is expected to be feasible and beneficial, offering a practical approach to bridge maintenance management that enhances efficiency and cost-effectiveness while ensuring structural safety.
Author Contributions
Conceptualization, H.-M.C.; Data curation, H.-M.C.; Formal analysis, H.-M.C.; Funding acquisition, H.-M.C., K.-S.J. and K.-T.P.; Investigation, H.-M.C. and K.-S.J.; Methodology, H.-M.C.; Project administration, K.-T.P.; Resources, H.-M.C. and K.-S.J.; Software, H.-M.C. and K.-S.J.; Supervision, K.-T.P.; Validation, H.-M.C. and K.-T.P.; Visualization, H.-M.C. and K.-S.J.; Roles/Writing—original draft, H.-M.C.; and Writing—review and editing, H.-M.C. and K.-S.J. All authors have read and agreed to the published version of the manuscript.
Funding
This research was partially supported as part of a project funded by the Ministry of Science and ICT and the Korea Institute of Construction Technology (Project No. 20240142-001, Development of a DNA-based smart maintenance platform and application technologies for aging bridges).
Institutional Review Board Statement
Not applicable.
Informed Consent Statement
Not applicable.
Data Availability Statement
The original contributions presented in the study are included in the article, further inquiries can be directed to the corresponding author.
Conflicts of Interest
The authors declare no conflicts of interest.
References
- Facility Management System. Available online: https://www.fms.or.kr/com/mainForm.do (accessed on 23 January 2024).
- Ministry of Land, Infrastructure and Transport (MOLIT). Special Act on the Safety and Management of Facilities, National; Ministry of Land, Infrastructure and Transport: Sejong-si, Republic of Korea, 2022; p. Act-17946. (In Korean)
- Ministry of Land, Infrastructure and Transport (MOLIT). Framework Act on Sustainable Infrastructure Management, National; Ministry of Land, Infrastructure and Transport: Sejong-si, Republic of Korea, 2022; p. Act-18564. (In Korean)
- Ministry of Land, Infrastructure and Transport (MOLIT). Detailed Guidelines for the Safety and Maintenance of Facilities; Ministry of Land, Infrastructure and Transport: Sejong-si, Republic of Korea, 2022. (In Korean)
- Bridge and Tunnel Information System. Available online: https://bti.kict.re.kr/bti/publicMain/main.do (accessed on 24 January 2024).
- Jeong, Y.S.; Min, G.H.; Lee, I.K.; Kim, W.S. Comparative Study of Bridge Maintenance: United States, United Kingdom, Japan, and Korea. J. Korea Inst. Struct. Maint. Insp. 2021, 25, 114–126. [Google Scholar]
- Park, K.T.; Kim, S.H.; Park, H.S.; Lee, K.W. The Determination of Bridge Displacement using Measured Acceleration. Eng. Struct. 2005, 27, 371–378. [Google Scholar] [CrossRef]
- Gindy, M.; Vaccaro, R.; Nassif, H. A State-Space Approach for Deriving Bridge Displacement from Acceleration. Comput.-Aided Civ. Infrastruct. Eng. 2008, 23, 281–290. [Google Scholar] [CrossRef]
- Joh, S.H.; Jeon, J.C.; Hwang, S.K.; Lee, H.H. Experimental Verification of Displacement Estimation Algorithm using Velocity Time History. J. Korean Soc. Saf. 2015, 30, 99–105. [Google Scholar] [CrossRef][Green Version]
- Kyung, K.S.; Lee, Y.I.; Lee, S.J. Analysis of Load Carrying Capacity of Bridges Based on Field Data with Serviced Time. KSCE J. Civ. Environ. Eng. Res. 2015, 35, 31–38. [Google Scholar] [CrossRef]
- Cho, H.M.; Park, K.T.; Jung, K.S.; Kim, J.H. Performance Improvement Analysis Study on Bridge Repair and Strengthening Fall Academic Conference and Forum (Korea Institute for Structural Maintenance and Inspection); Sol Beach Yangyang: Yangyang-gun, Republic of Korea, 2023. [Google Scholar]
- Kim, K.S.; Park, S.K.; Kim, H.Y. An Improved Finite Element Modeling Technique for Prestressed Concrete Girder Bridges. J. Korea Concr. Inst. 1999, 11, 33–40. [Google Scholar]
- Lee, J.J.; Cho, S.J.; Shinozuka, M.; Yun, C.B.; Lee, C.G.; Lee, W.T. Evaluation of Bridge Load Carrying Capacity Based on Dynamic Displacement Measurement Using Real-Time Image Processing Techniques. J. Korean Soc. Steel Constr. 2006, 6, 377–385. [Google Scholar]
- Jeon, J.C.; Lee, H.H. Development of Displacement Estimation Method of Girder Bridges Using Measured Strain Signal Induced by Vehicular Loads. Eng. Struct. 2019, 186, 203–215. [Google Scholar] [CrossRef]


Disclaimer/Publisher’s Note: The statements, opinions and data contained in all publications are solely those of the individual author(s) and contributor(s) and not of MDPI and/or the editor(s). MDPI and/or the editor(s) disclaim responsibility for any injury to people or property resulting from any ideas, methods, instructions or products referred to in the content. |
© 2024 by the authors. Licensee MDPI, Basel, Switzerland. This article is an open access article distributed under the terms and conditions of the Creative Commons Attribution (CC BY) license (https://creativecommons.org/licenses/by/4.0/).