
Design of Volume Parameters of Large-Particle-Size Asphalt Mixture Based on the Vertical Vibration Compaction Method

Abstract
:1. Introduction
2. Materials and Test Methods
2.1. Materials
2.1.1. Asphalt
2.1.2. Aggregate
2.1.3. Mixtures
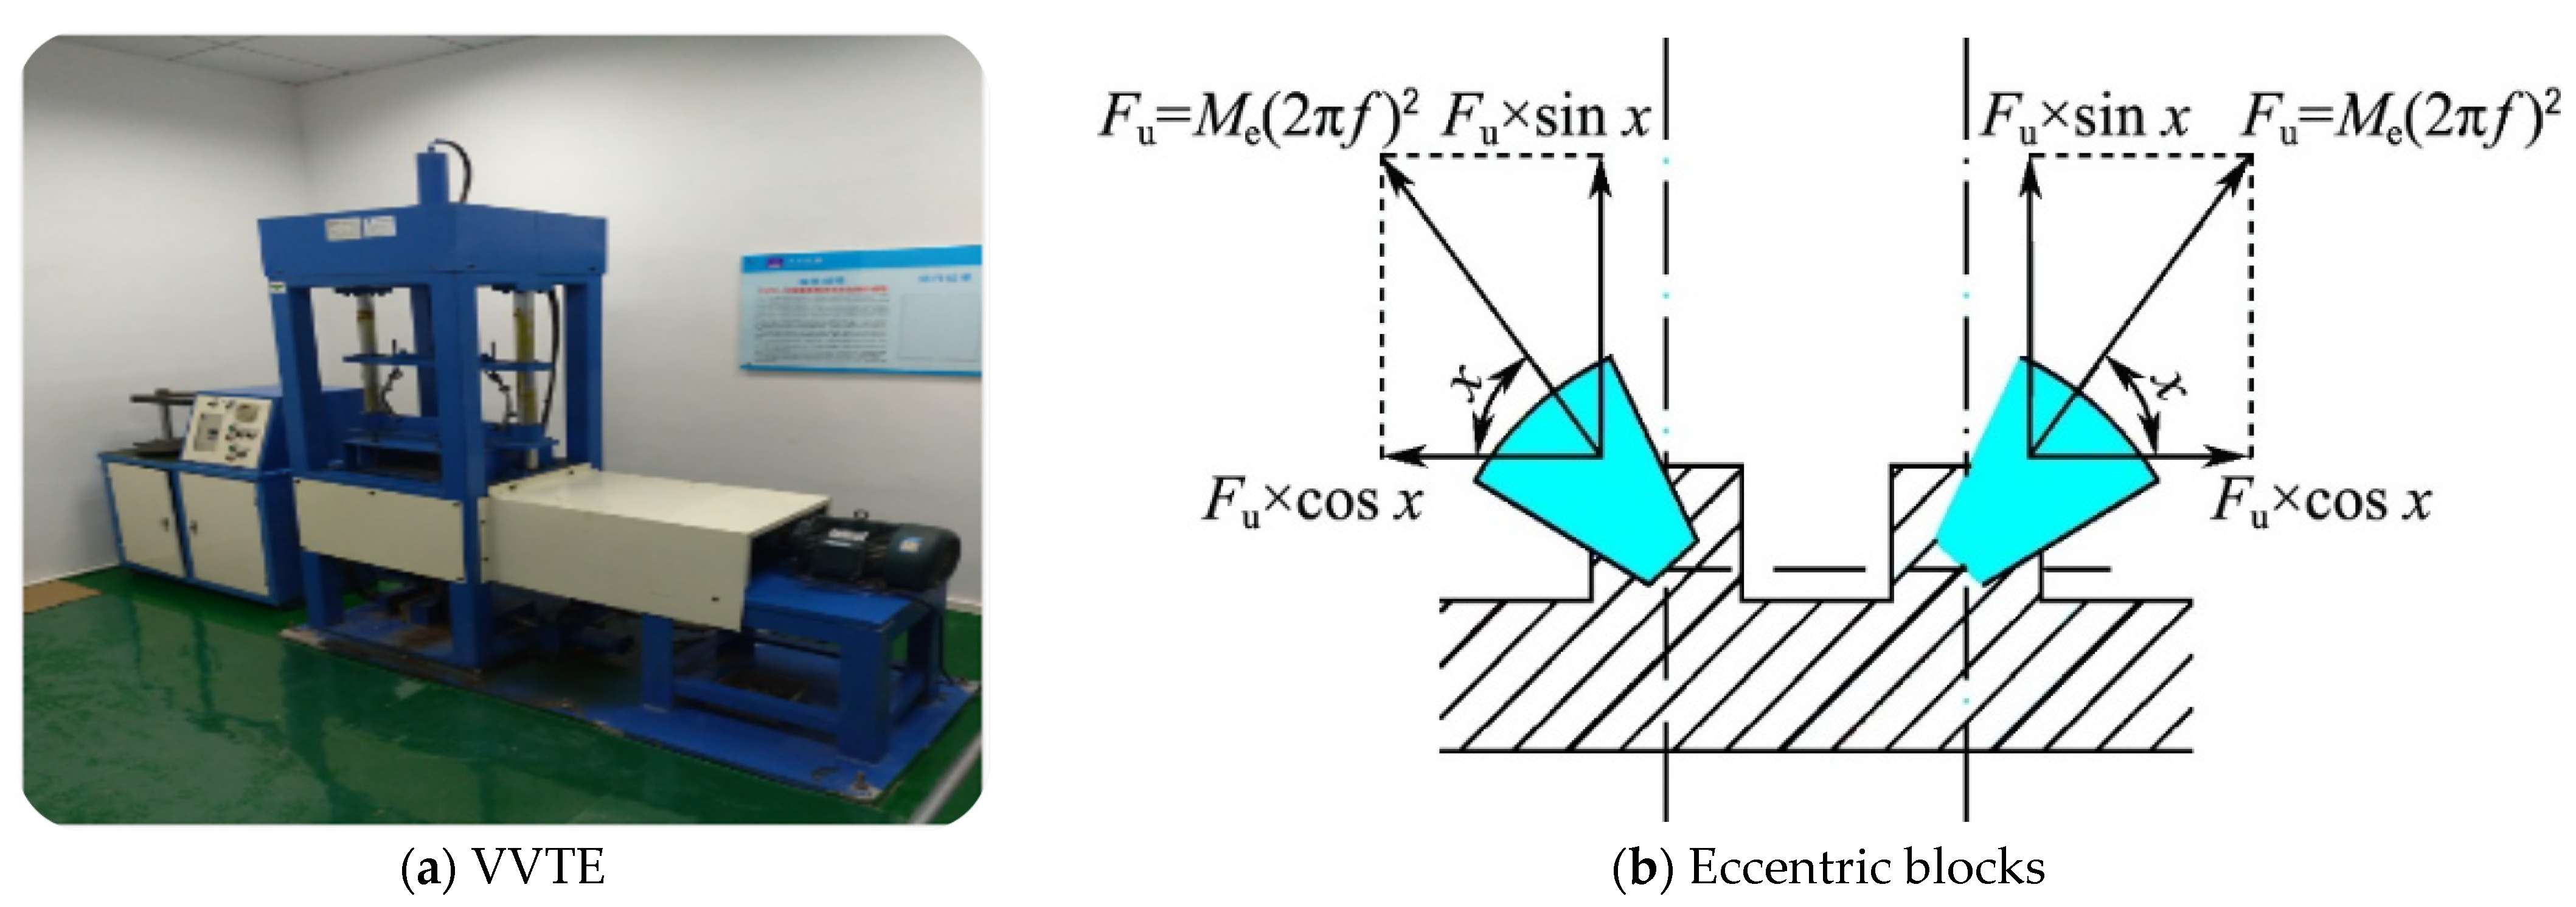
2.2. Specimen-Preparation Methods
2.3. Test Method
2.3.1. Uniaxial Compression Test
2.3.2. Splitting Test
2.3.3. Rutting Test
3. VVCM Evaluation
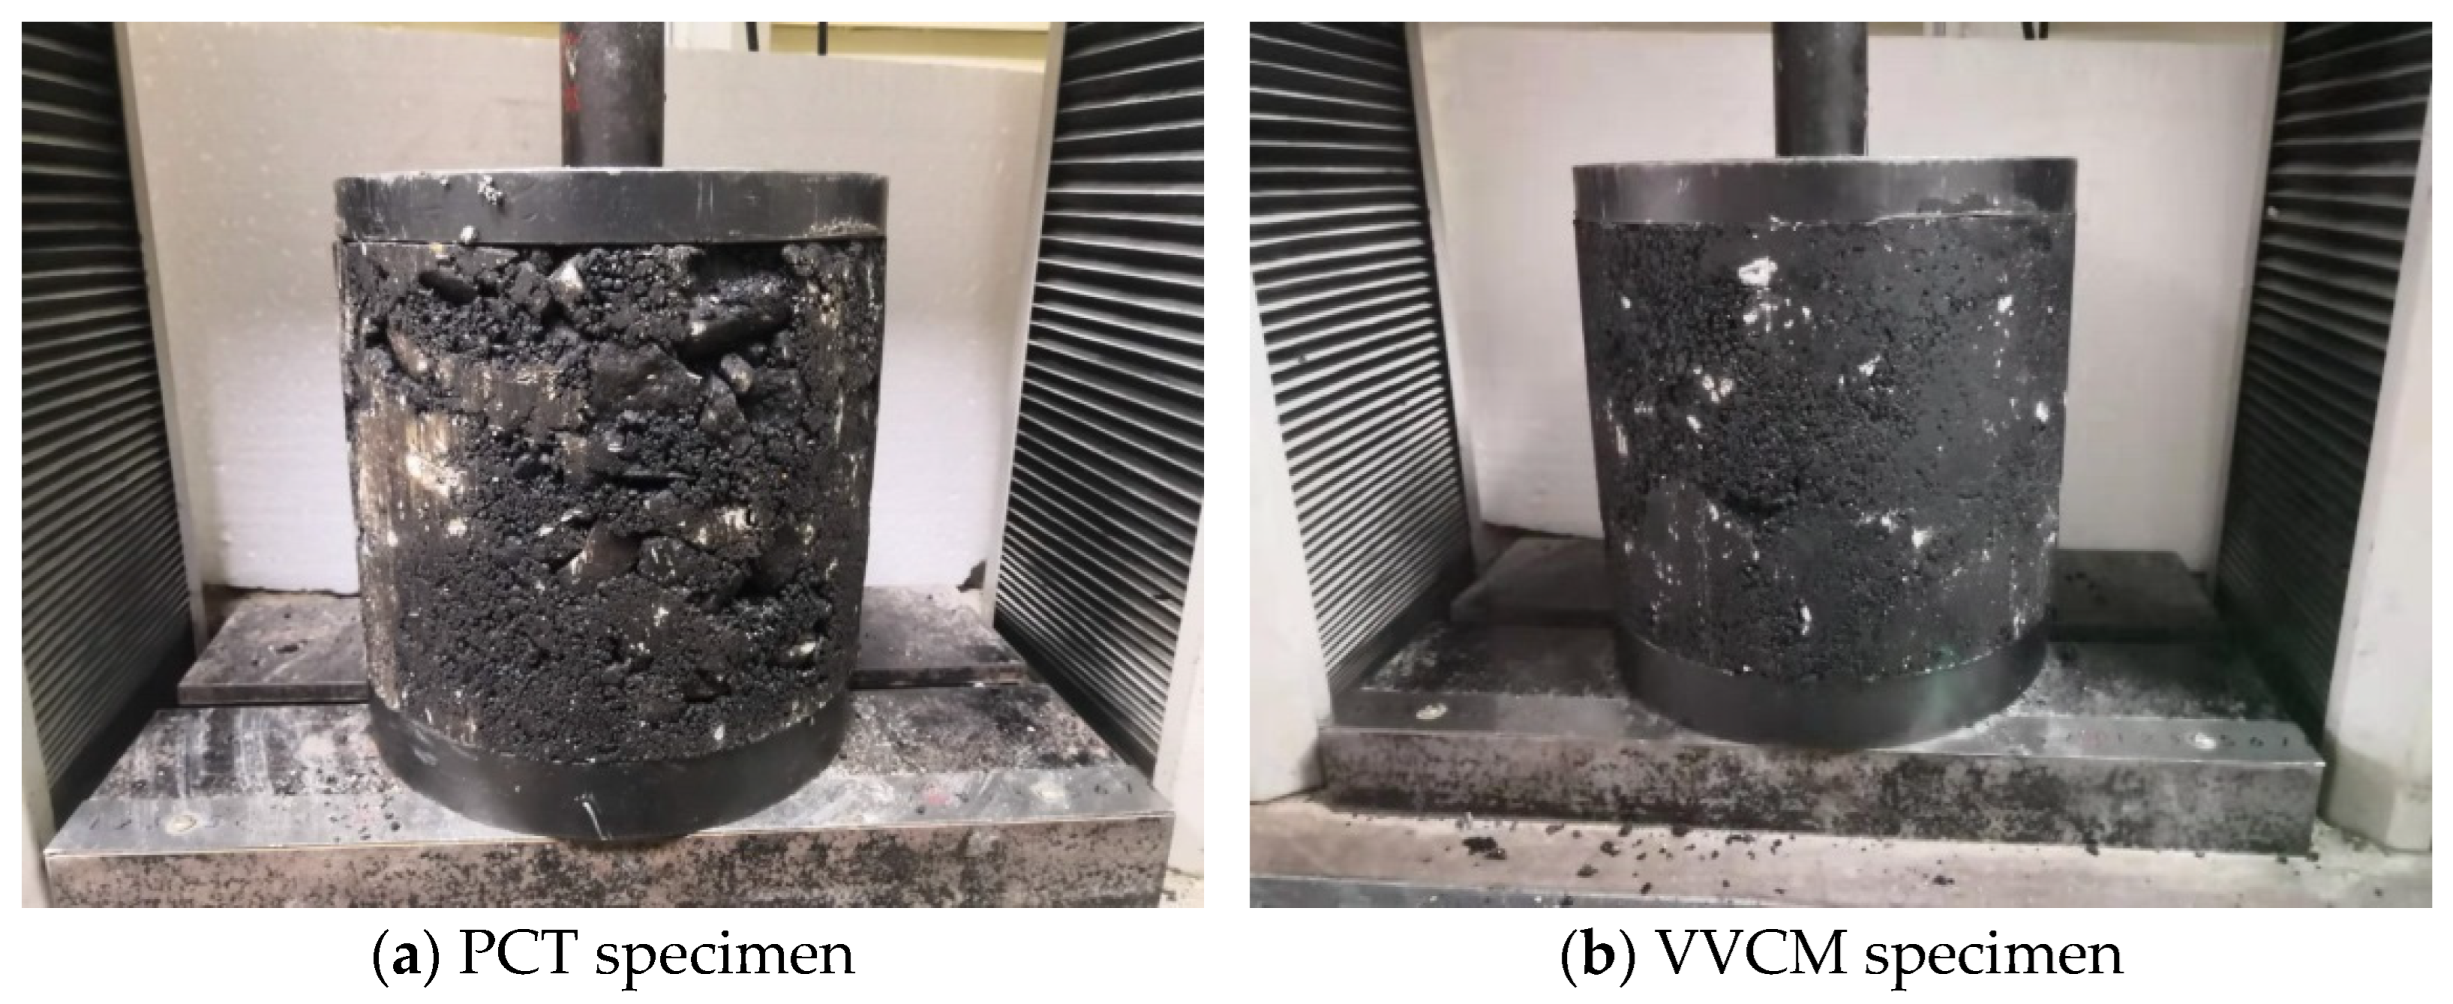
3.1. Specimen Appearance
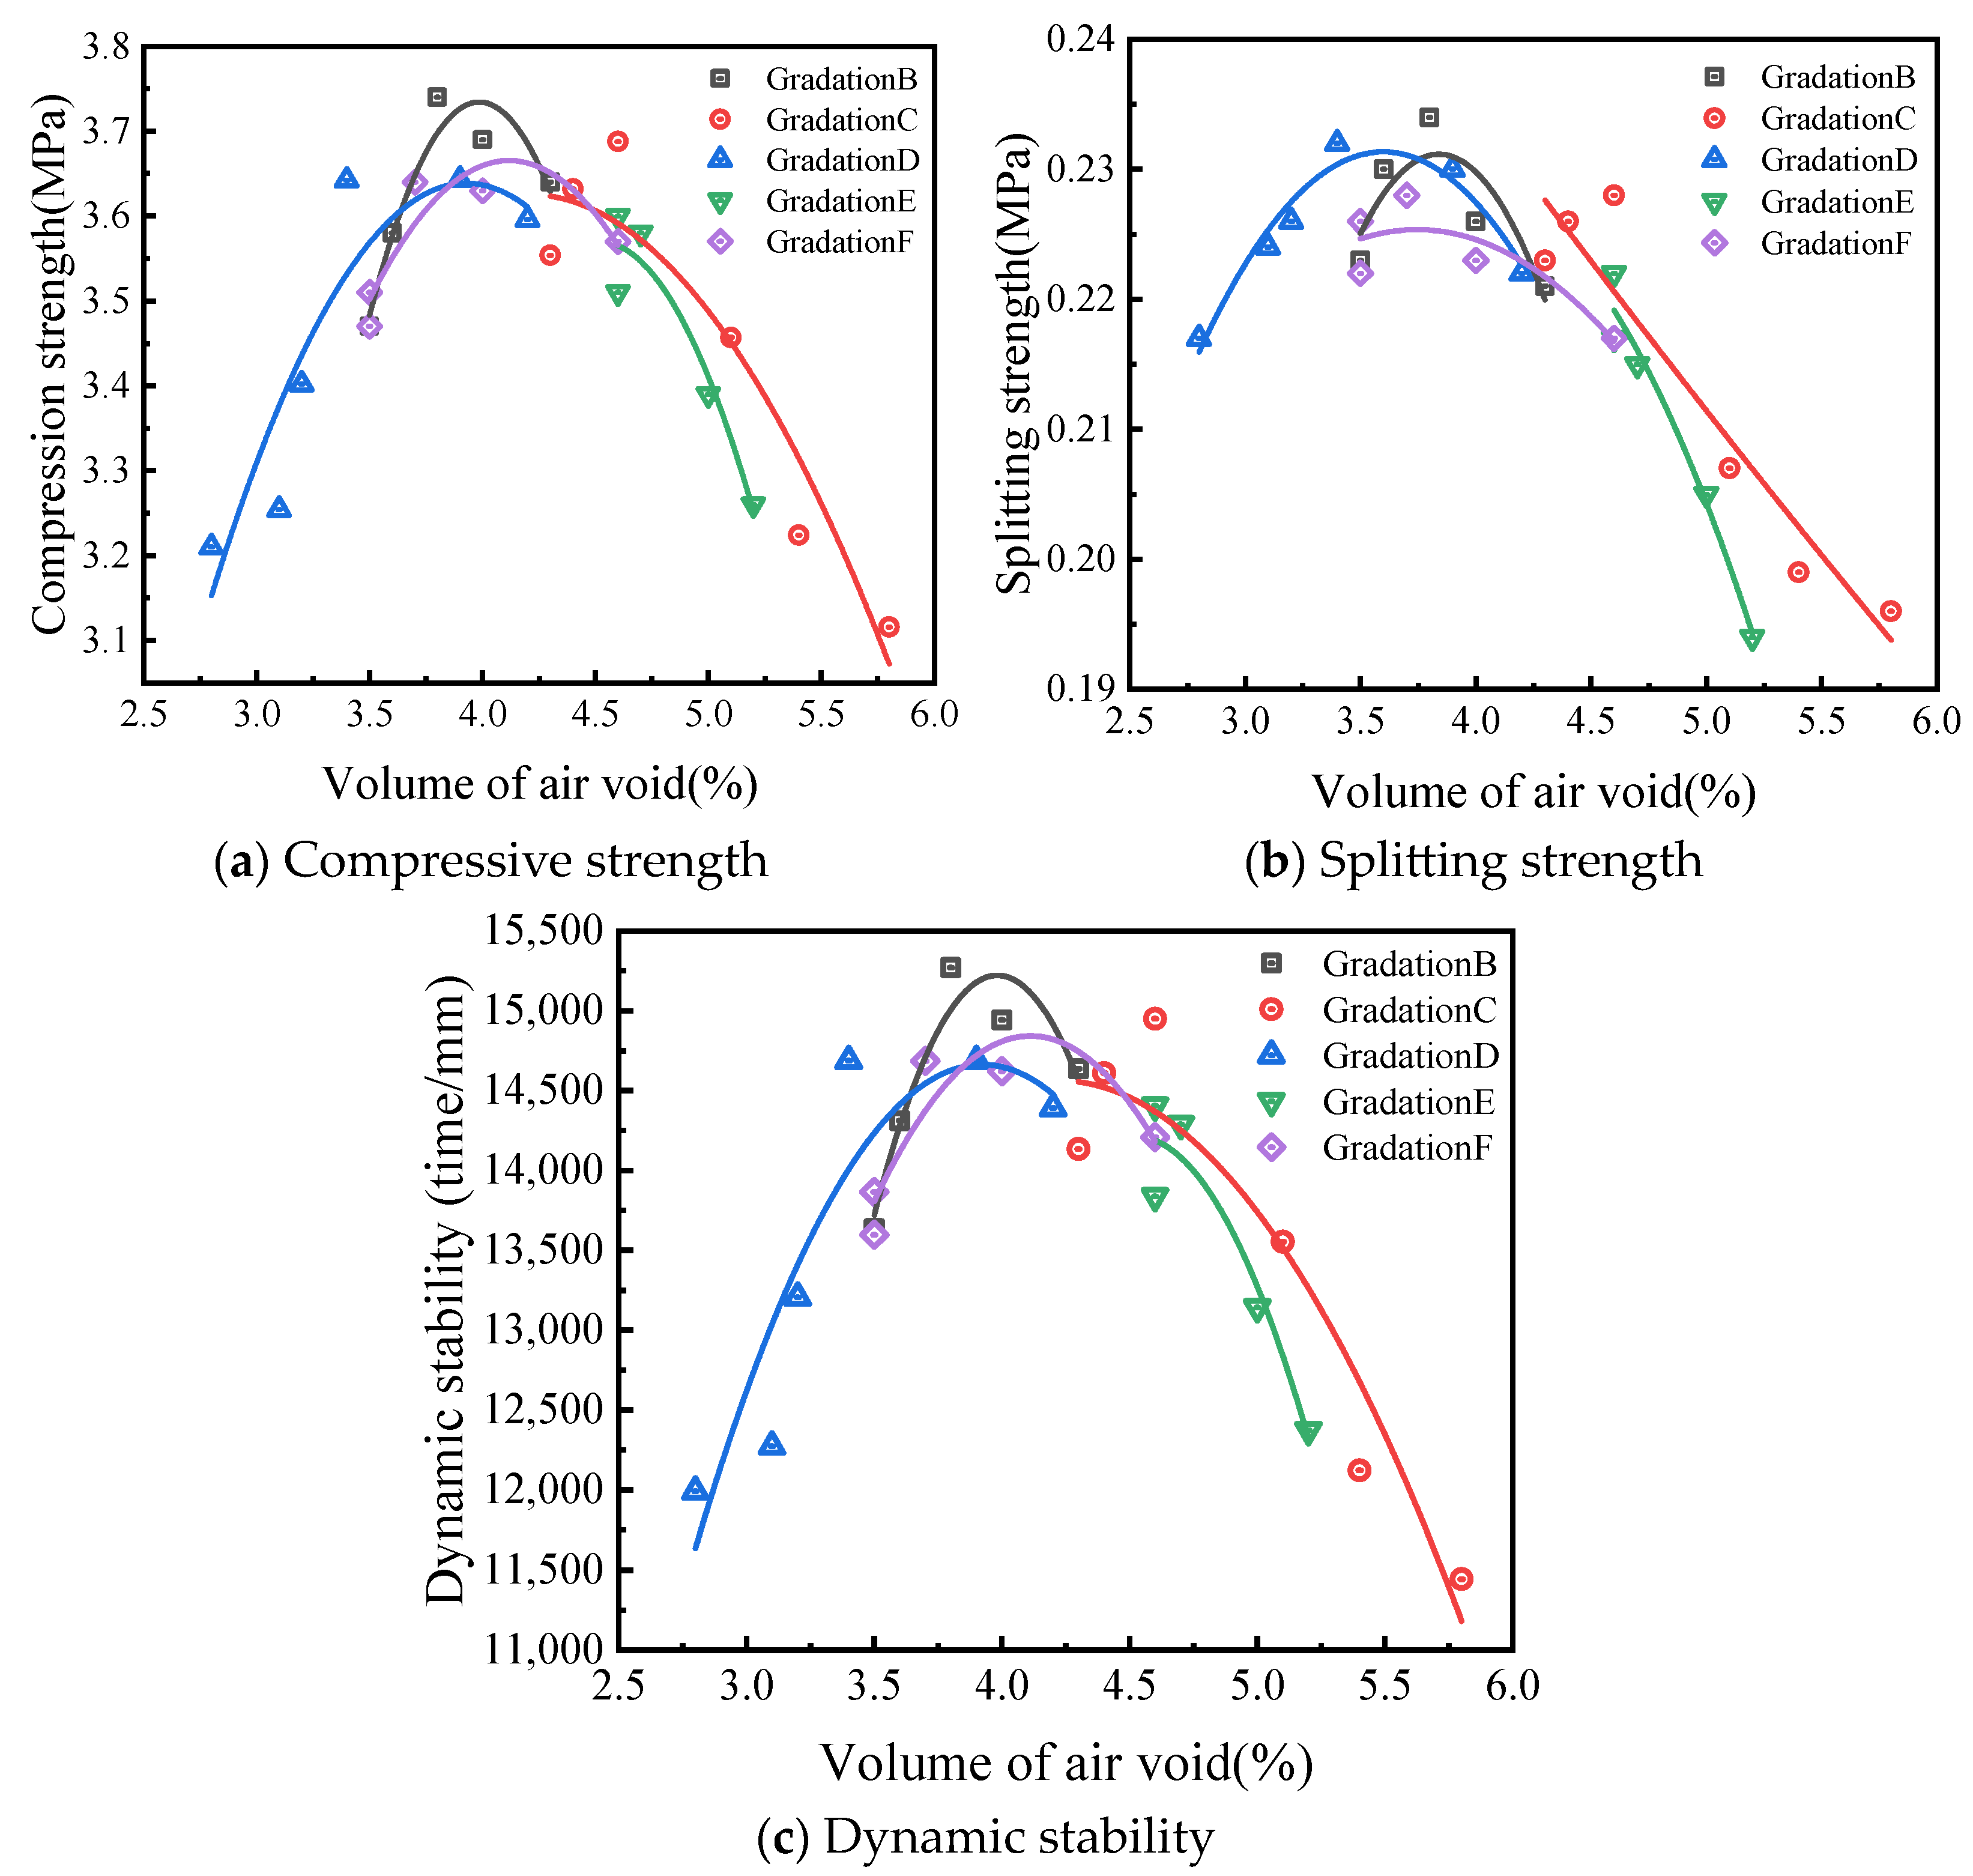
3.2. Mechanical Properties
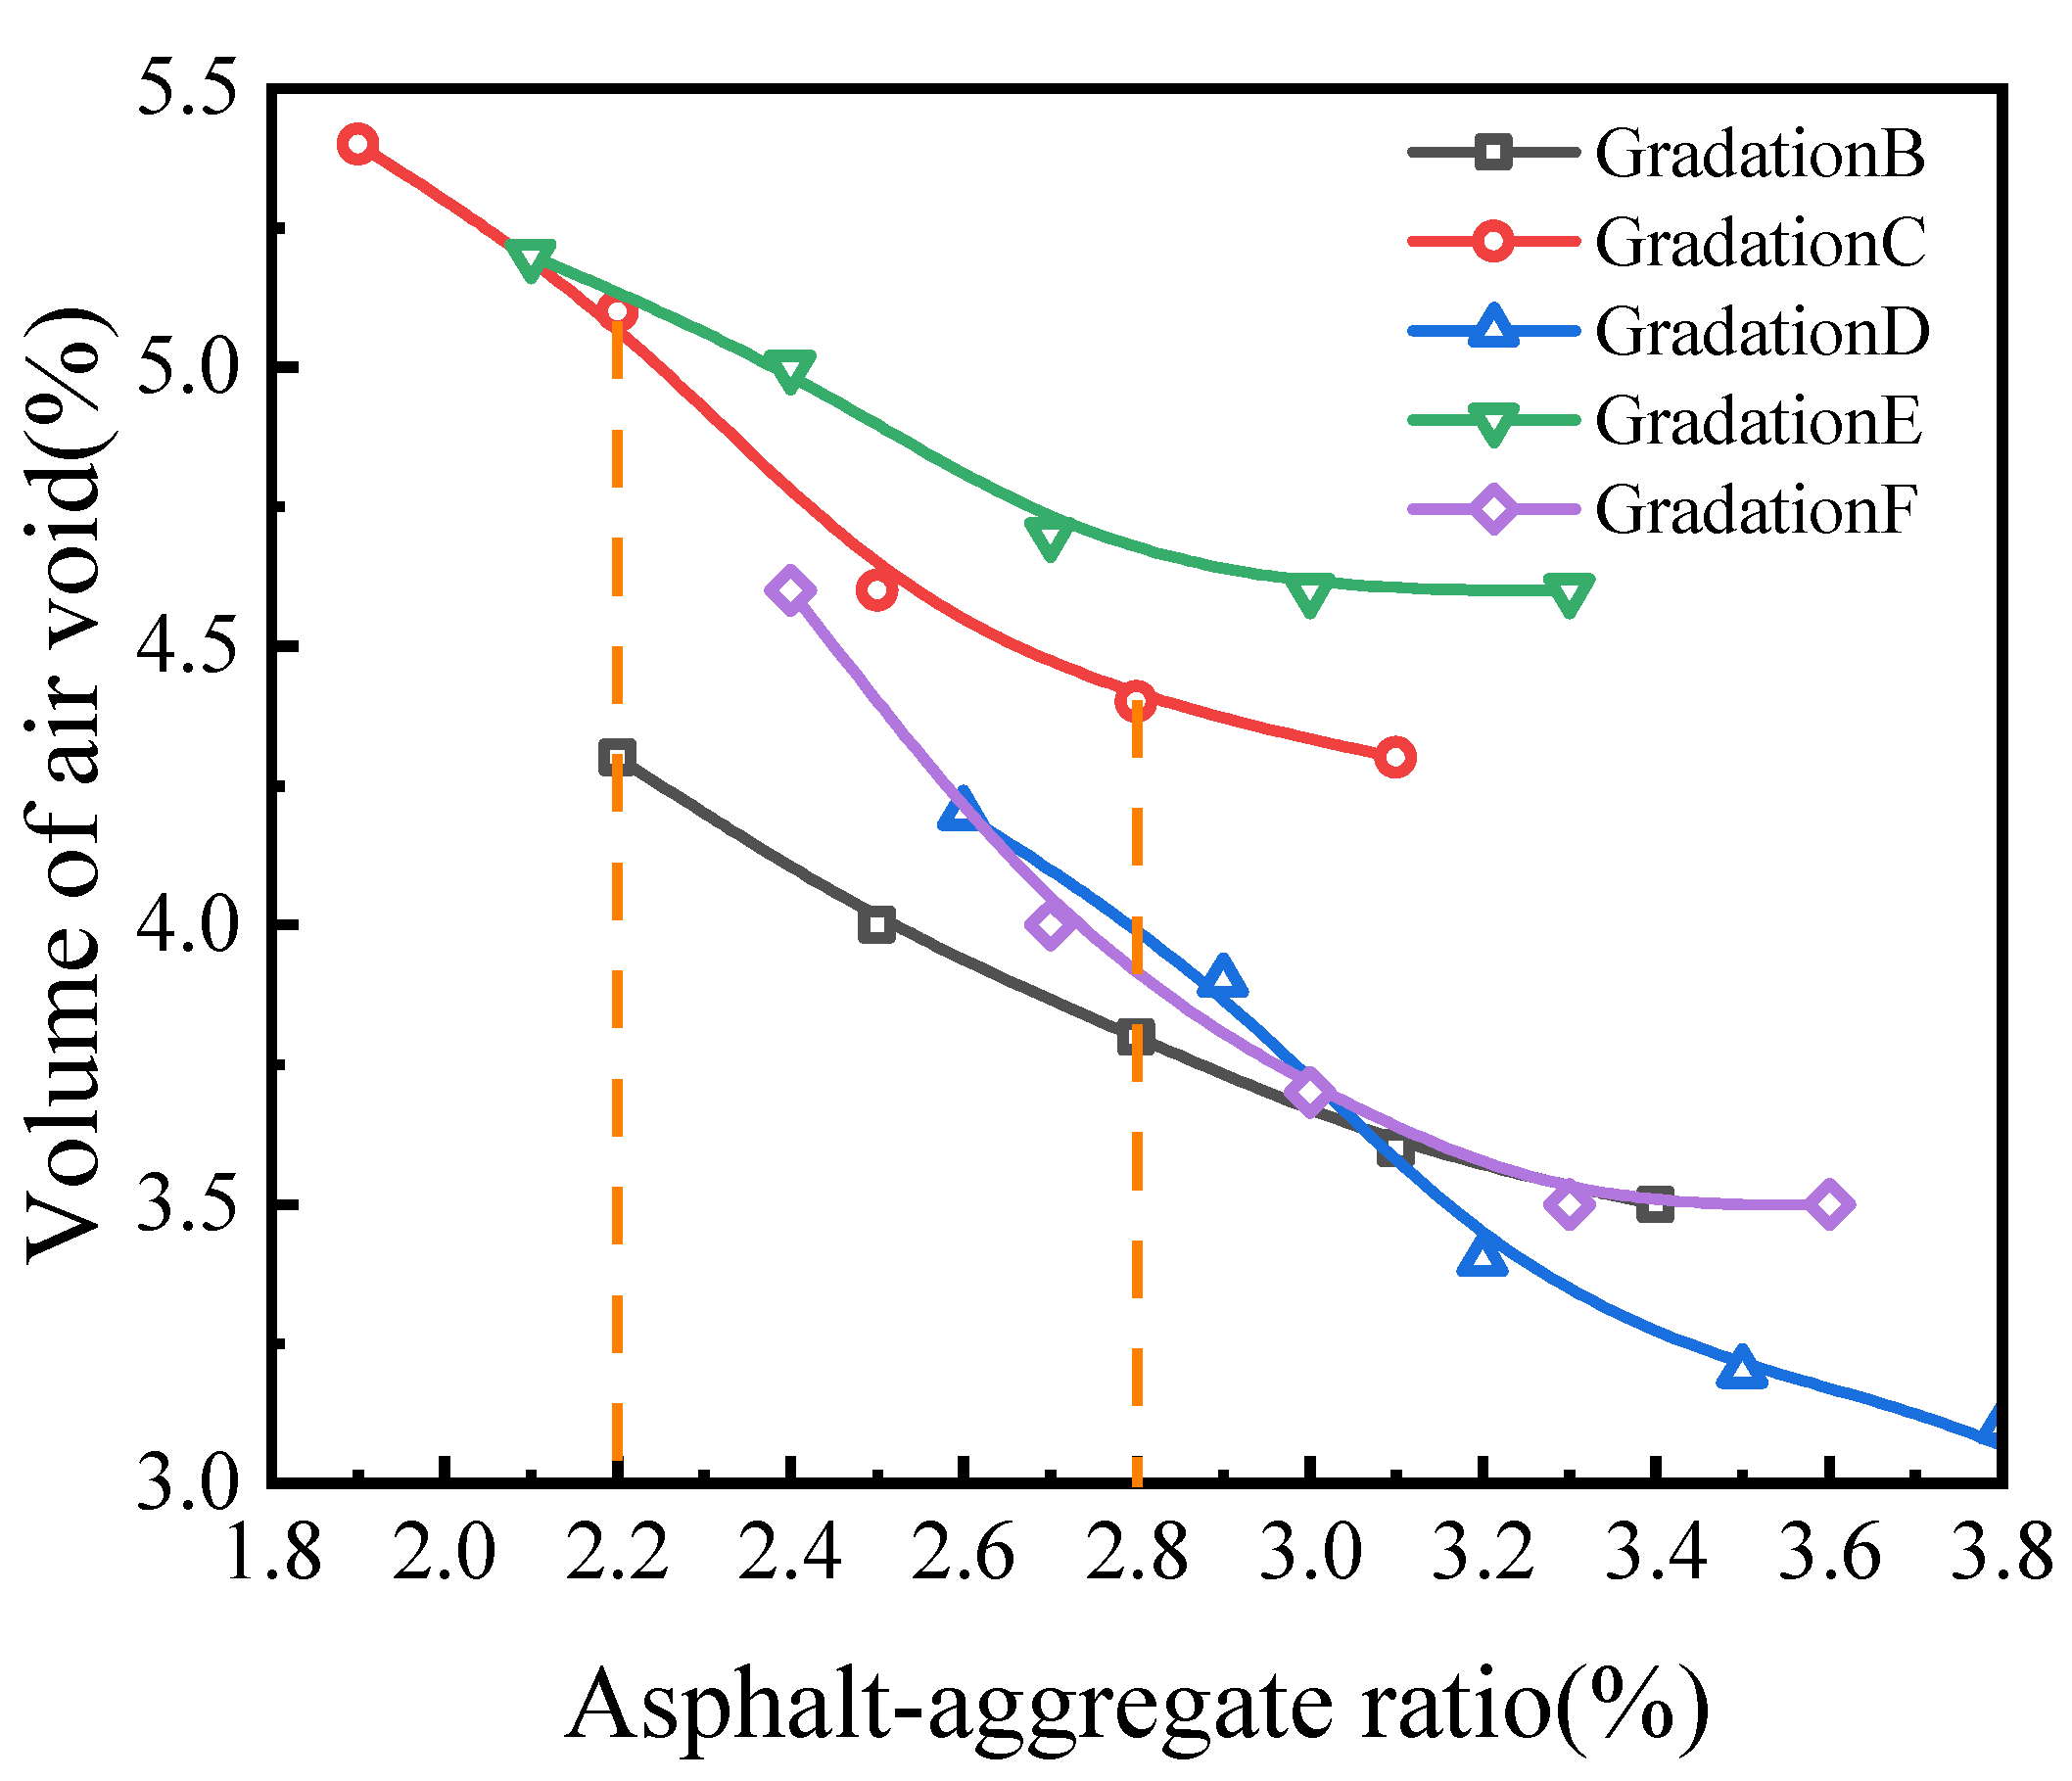
3.3. Gradation Variation
4. Influence of Volume Parameters on the Mechanical Properties of LSAM-50 Asphalt Mixture and Design Criteria
4.1. Influence of VV on the Mechanical Properties of LSAM-50 Asphalt Mixture and Design Criteria
4.1.1. VV Influencing Factors
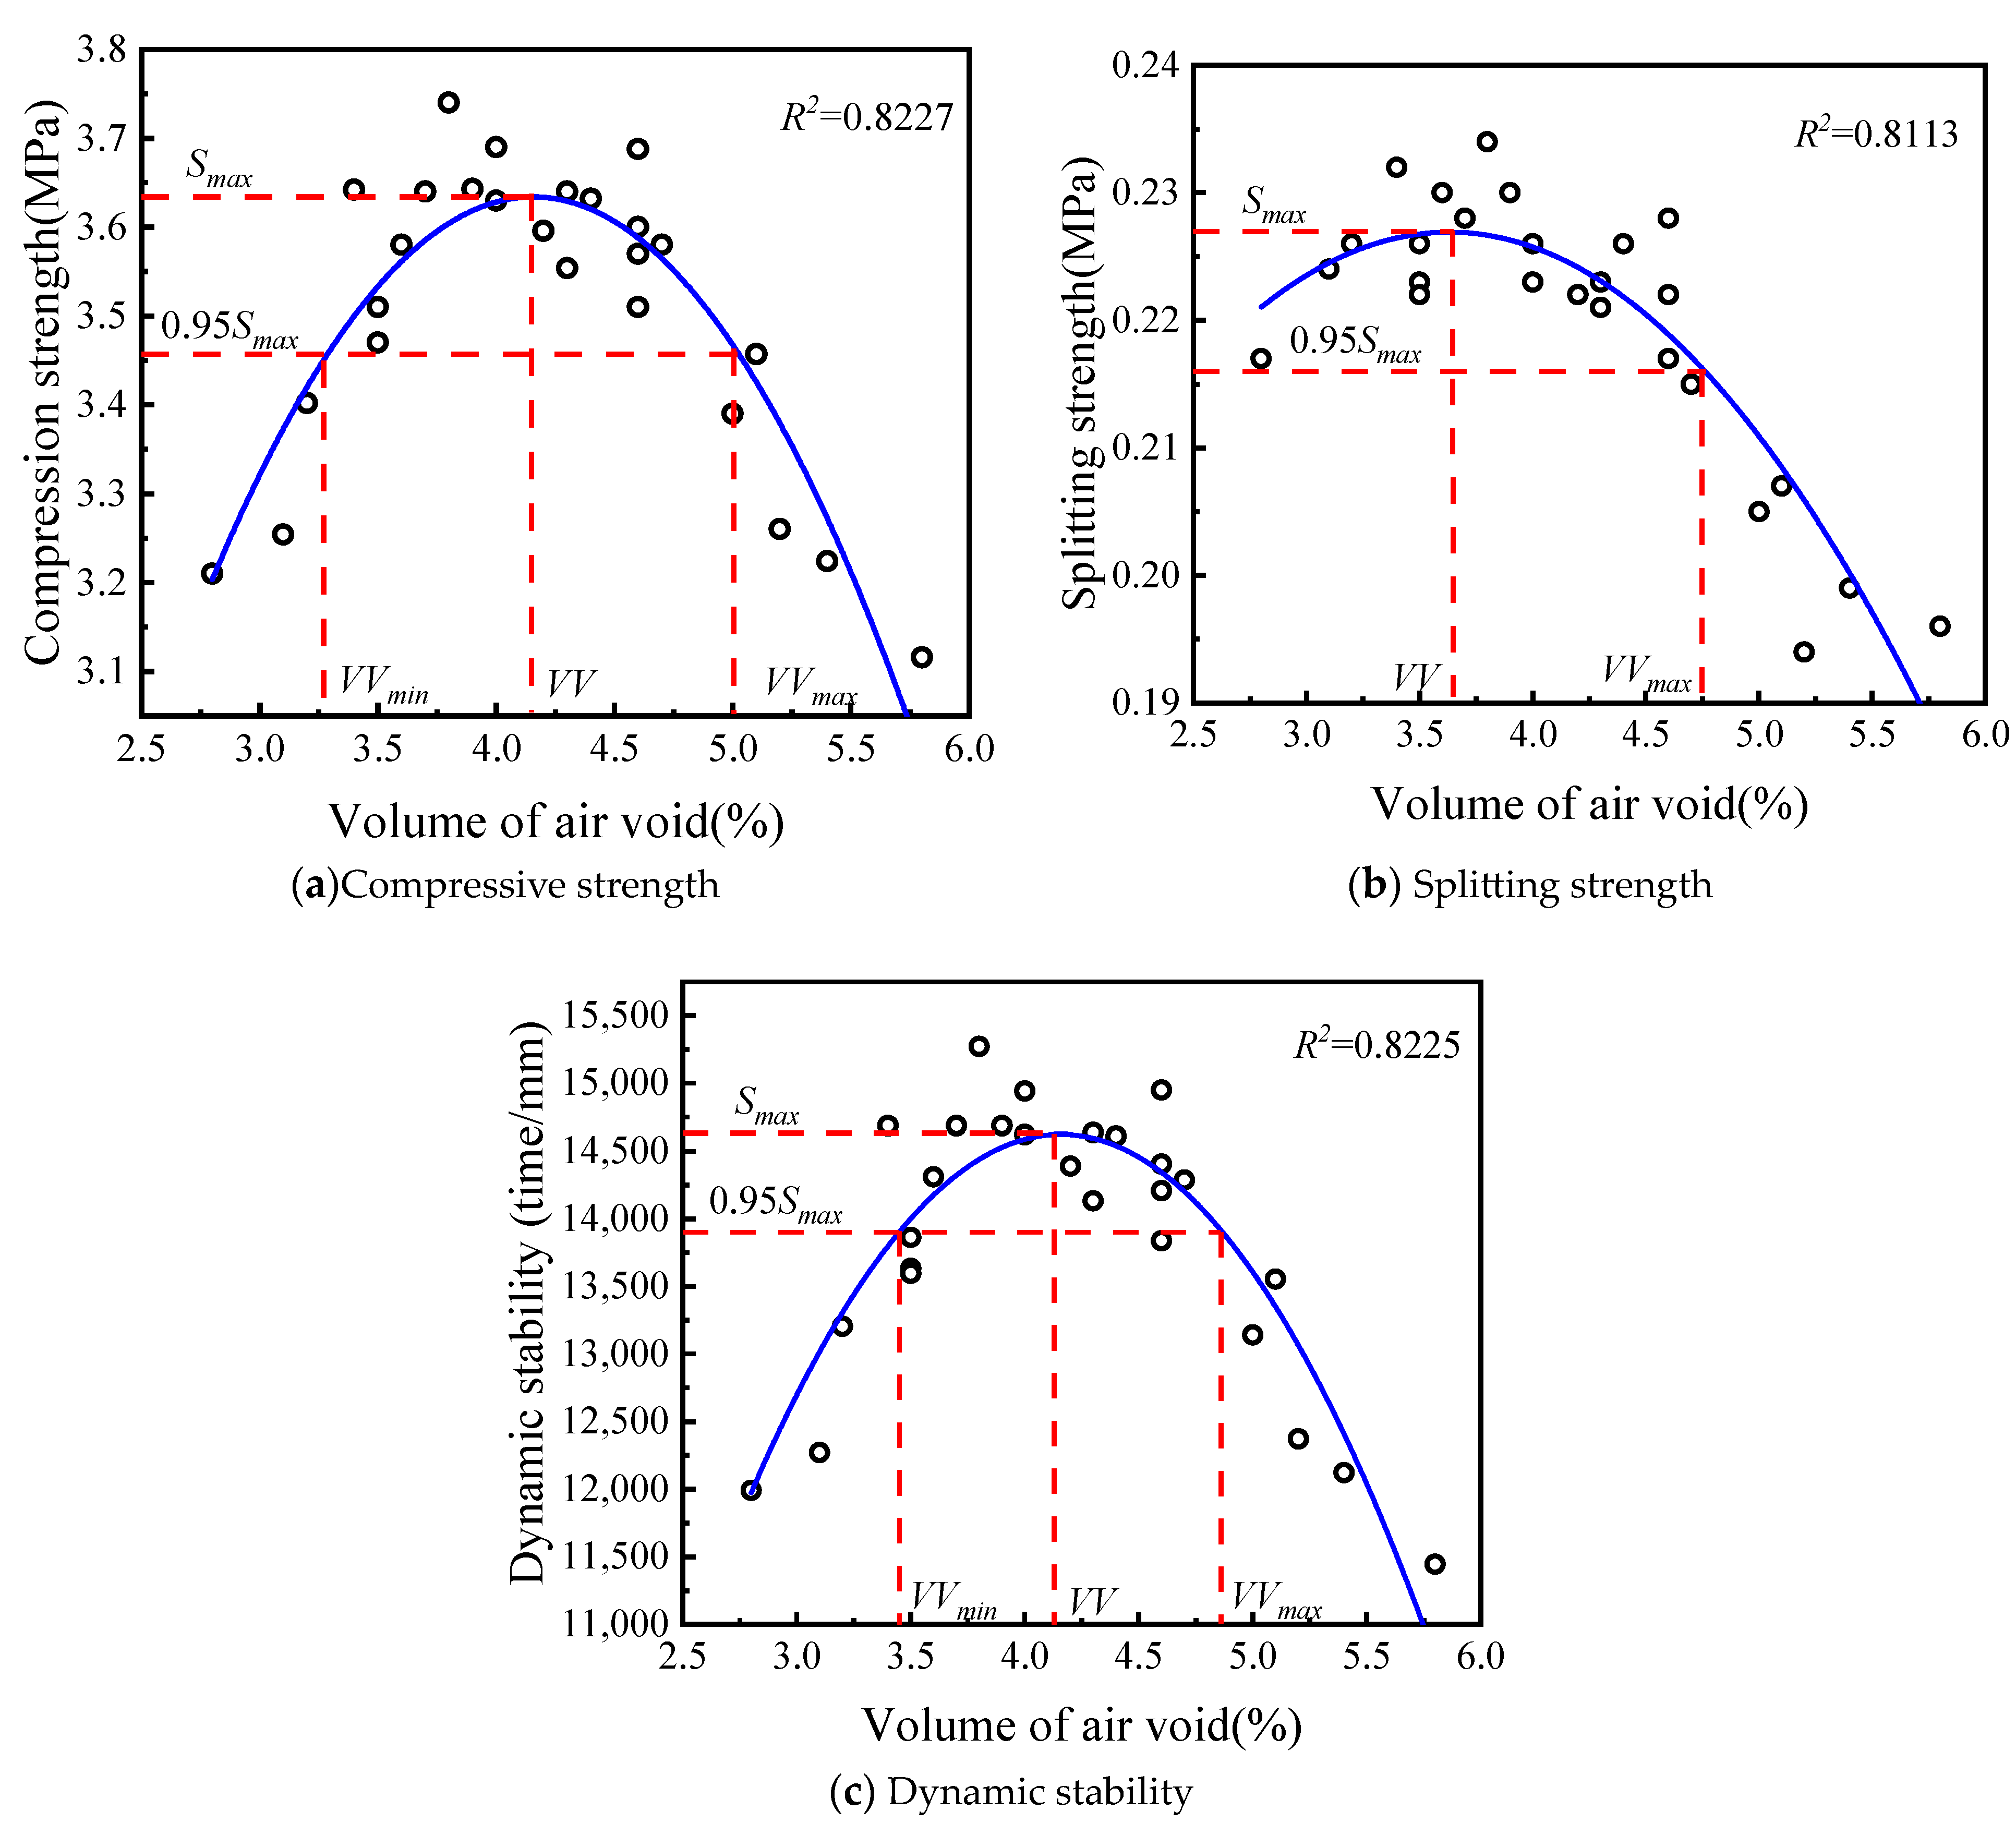
4.1.2. Effect of VV on the Mechanical Properties of Asphalt Mixtures
4.1.3. VV Design Criteria
4.2. Influence of VFA on the Mechanical Properties of LSAM-50 Asphalt Mixture and Design Criteria
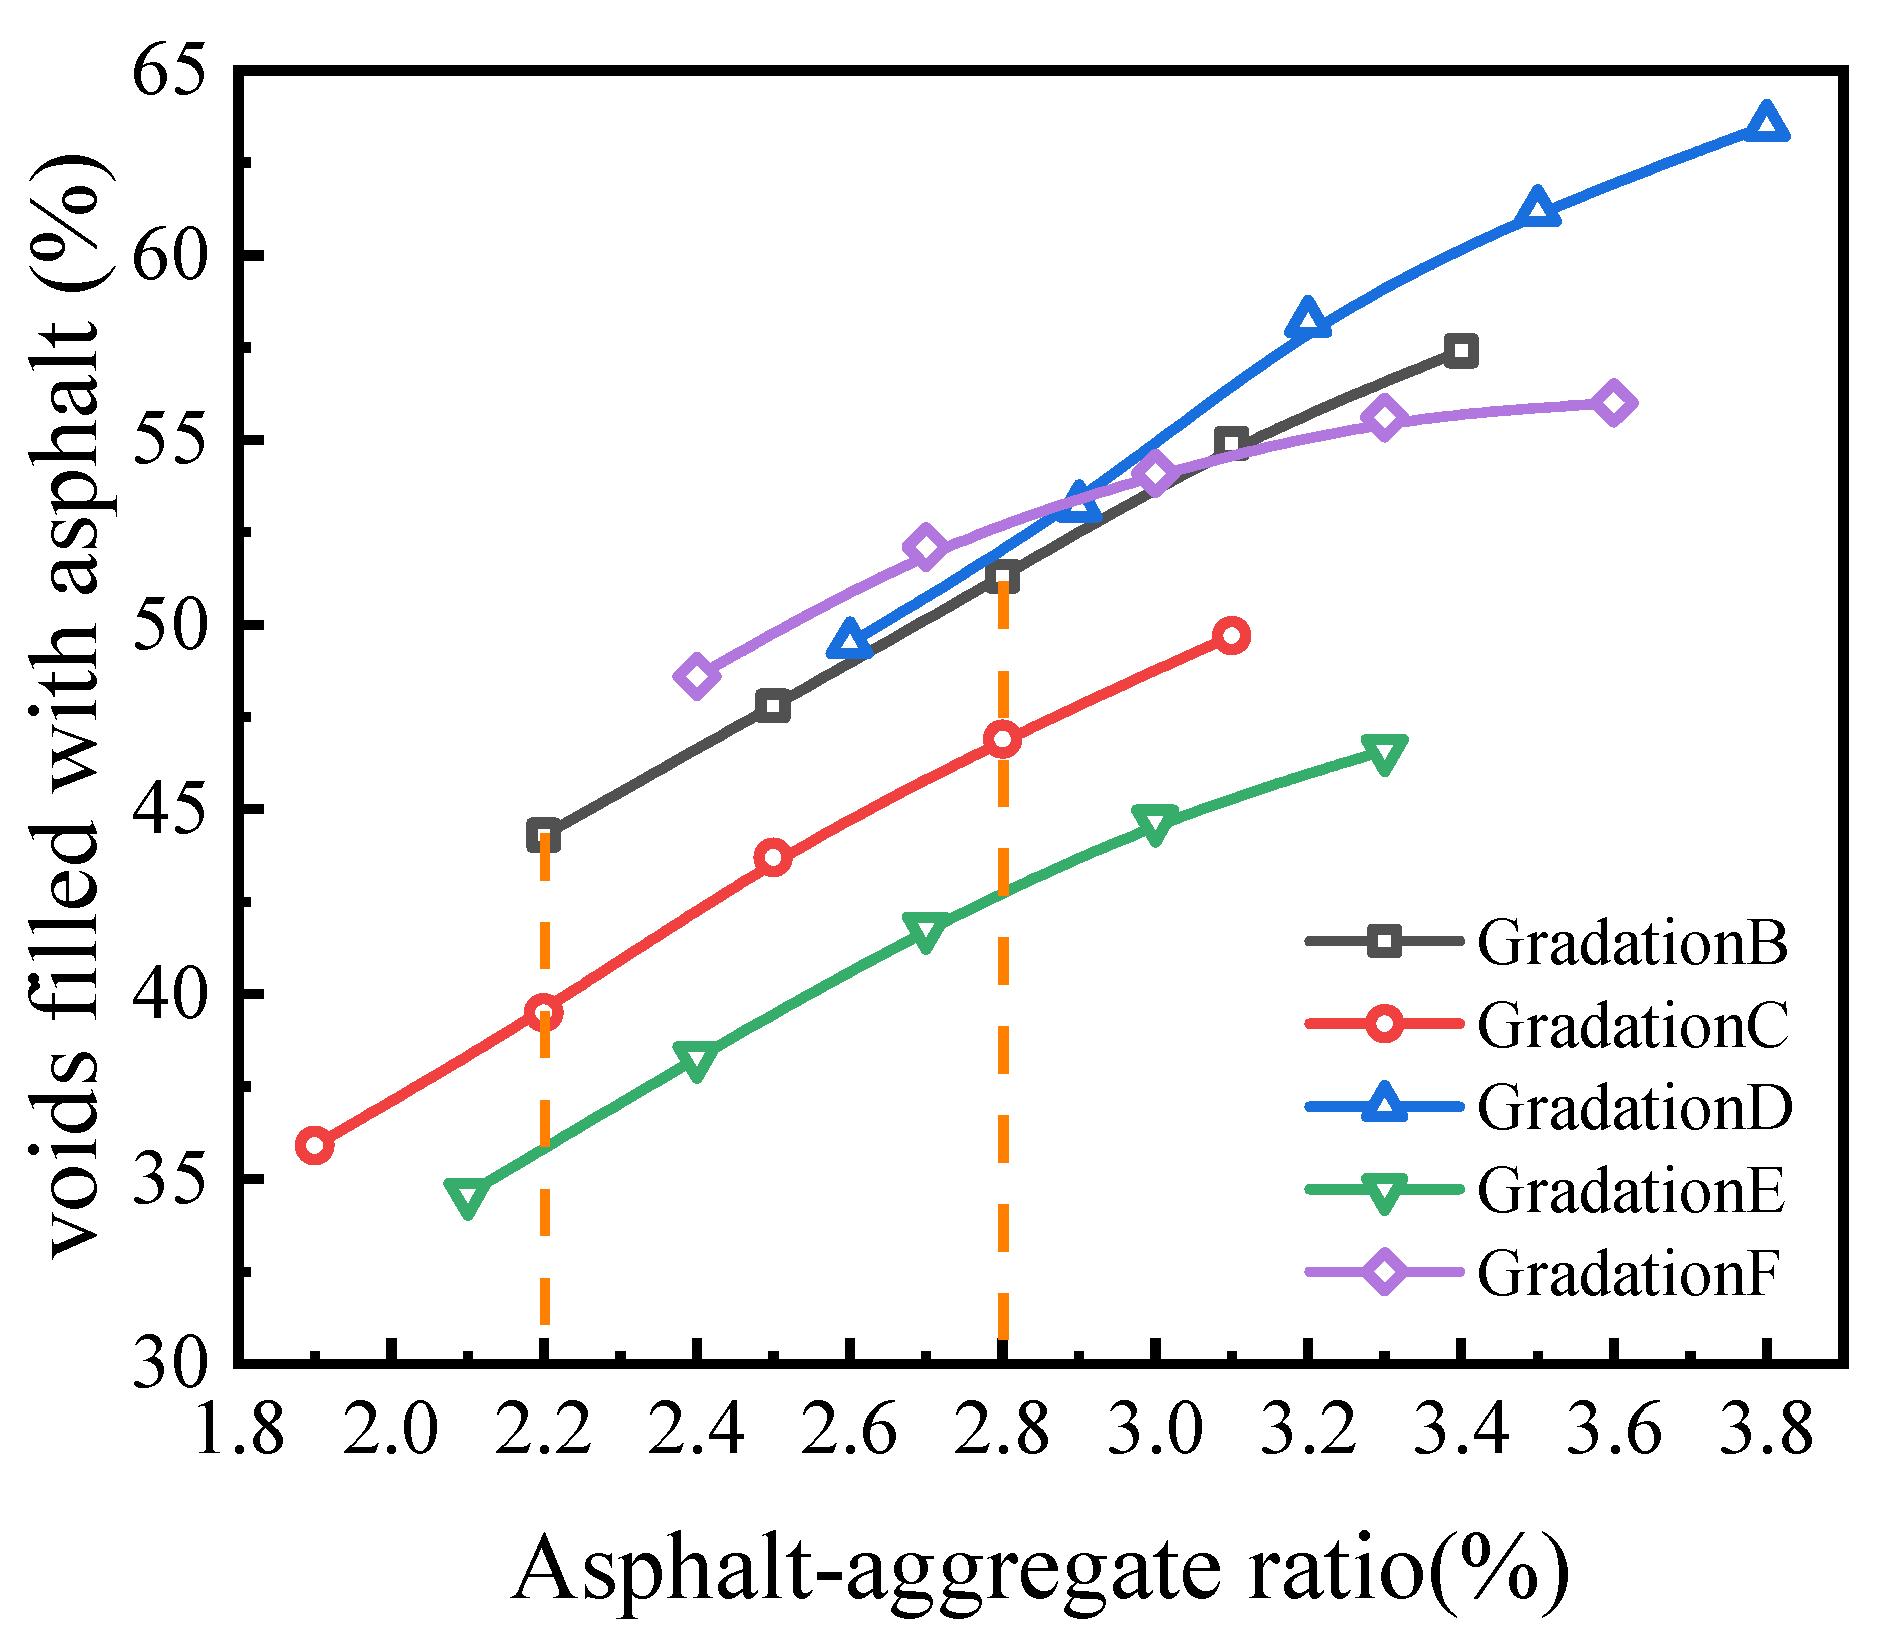
4.2.1. VFA-Influencing Factors
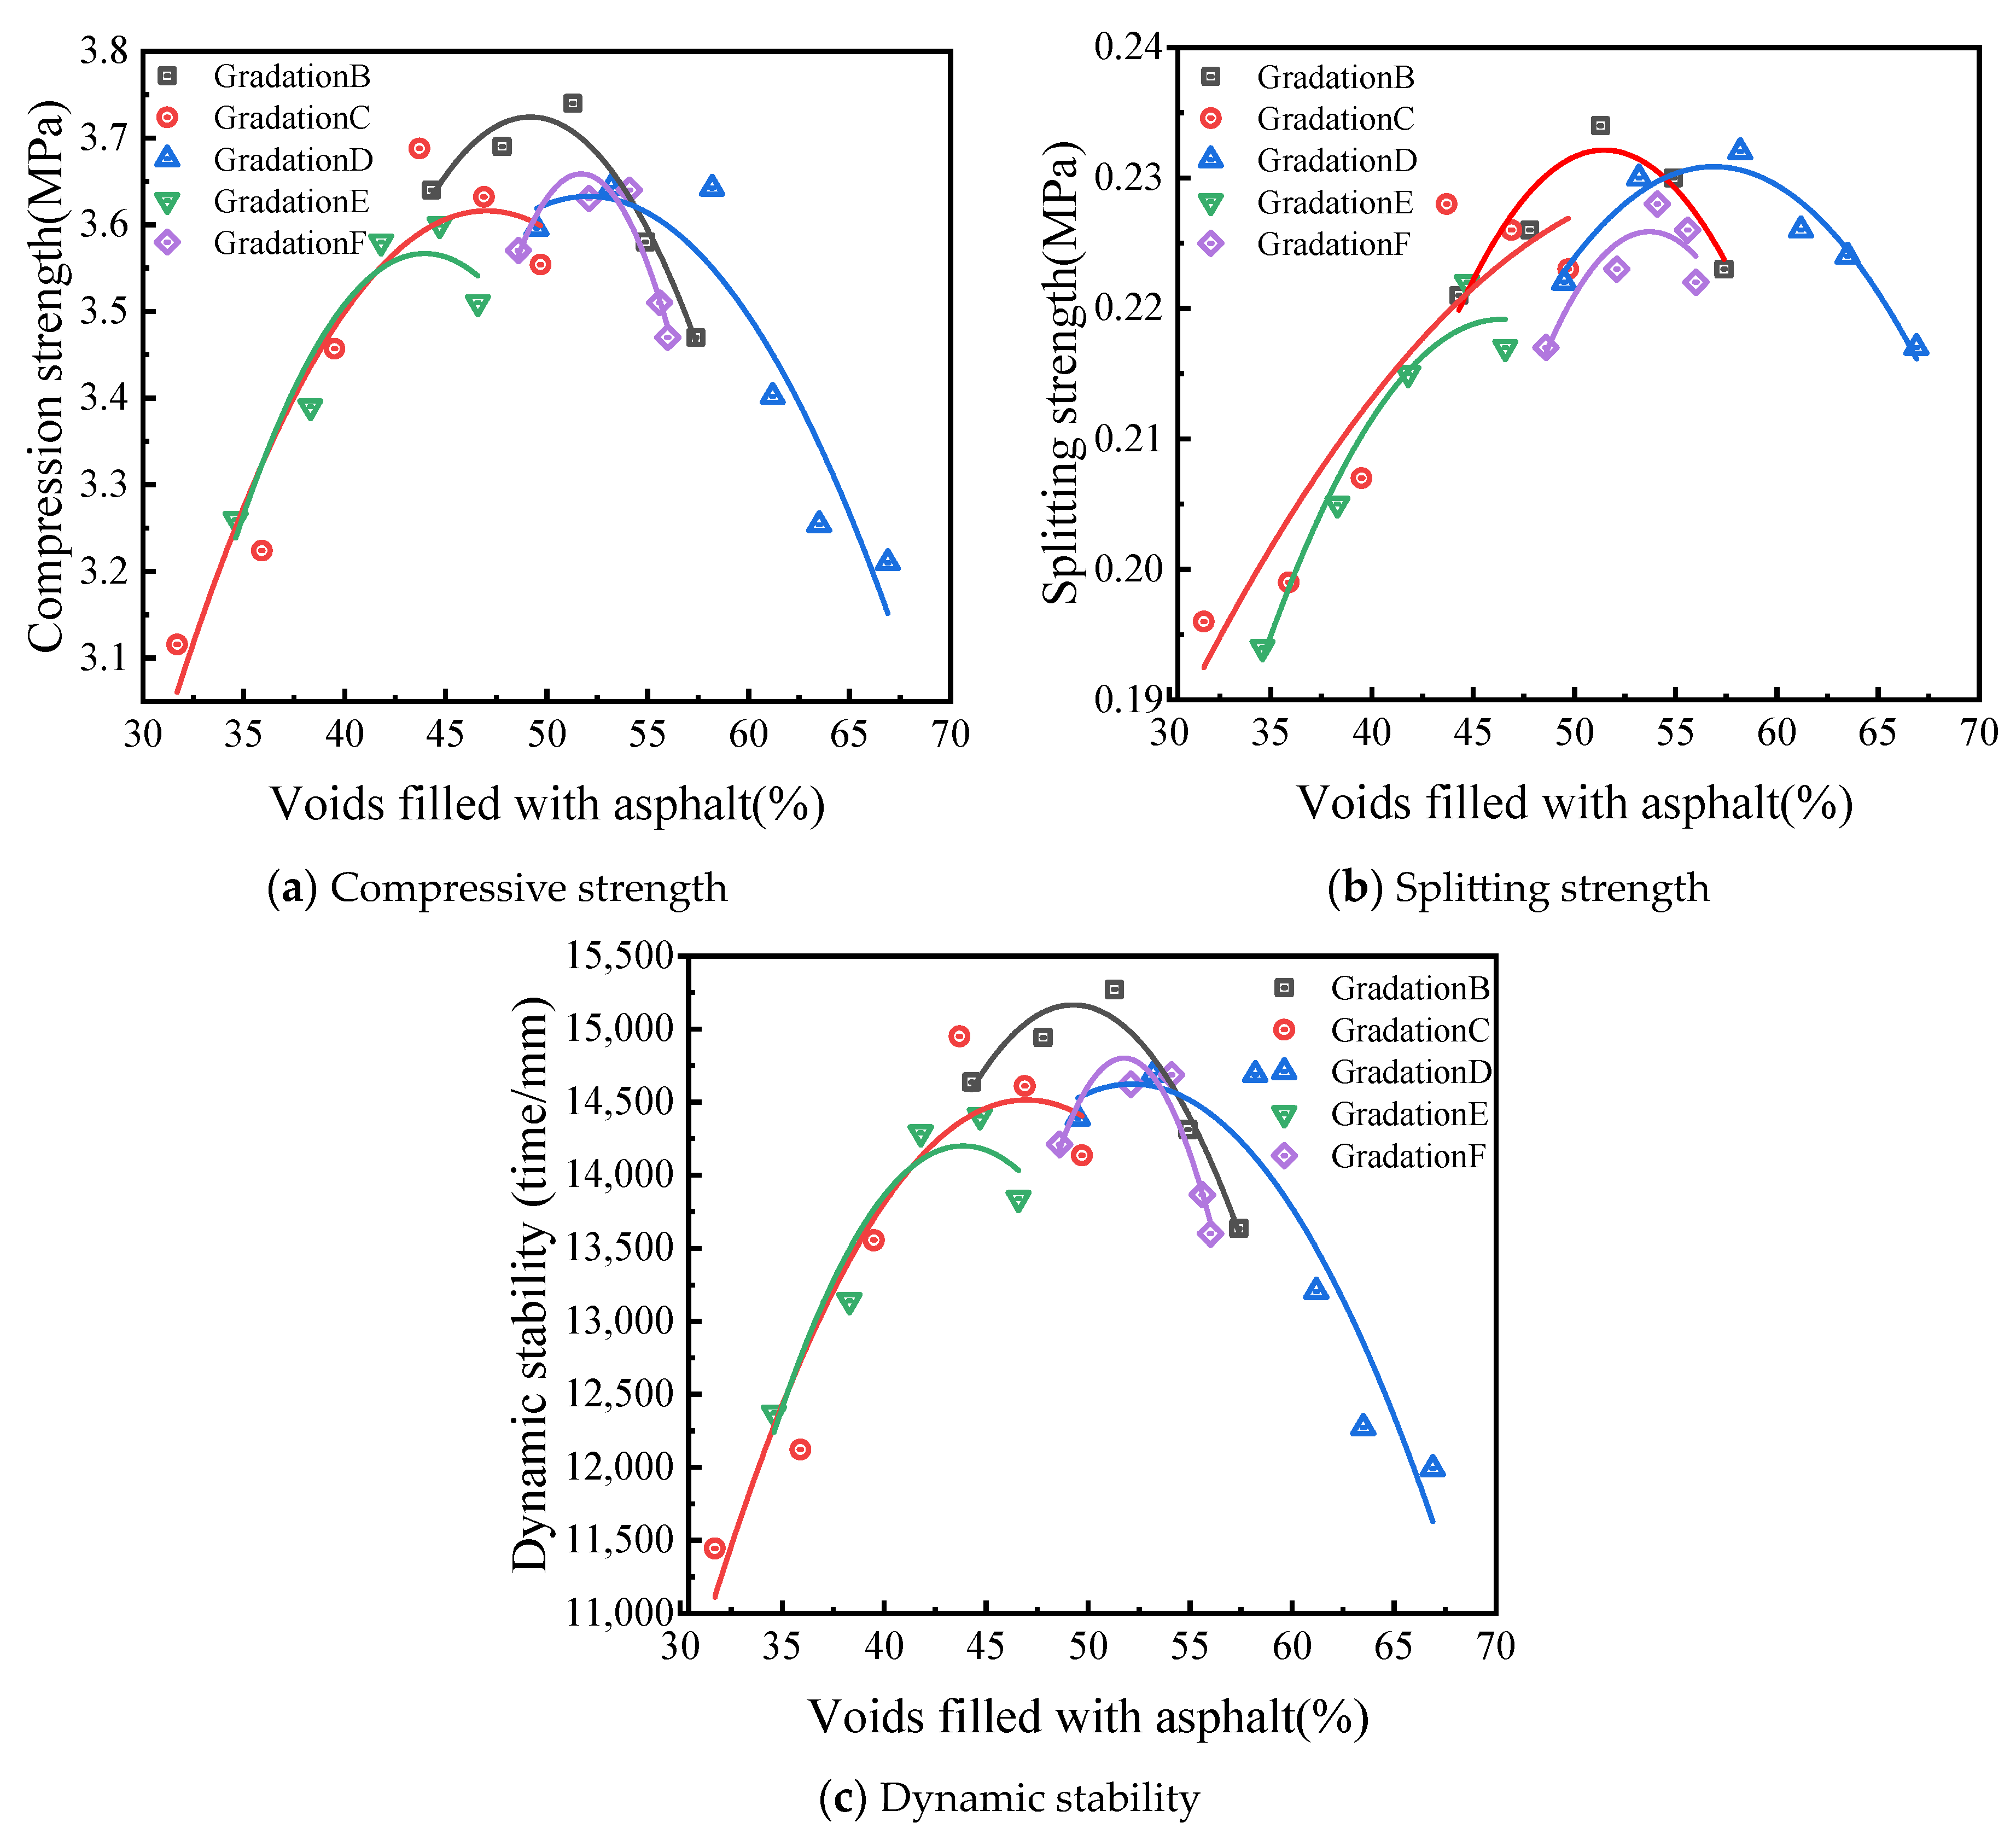
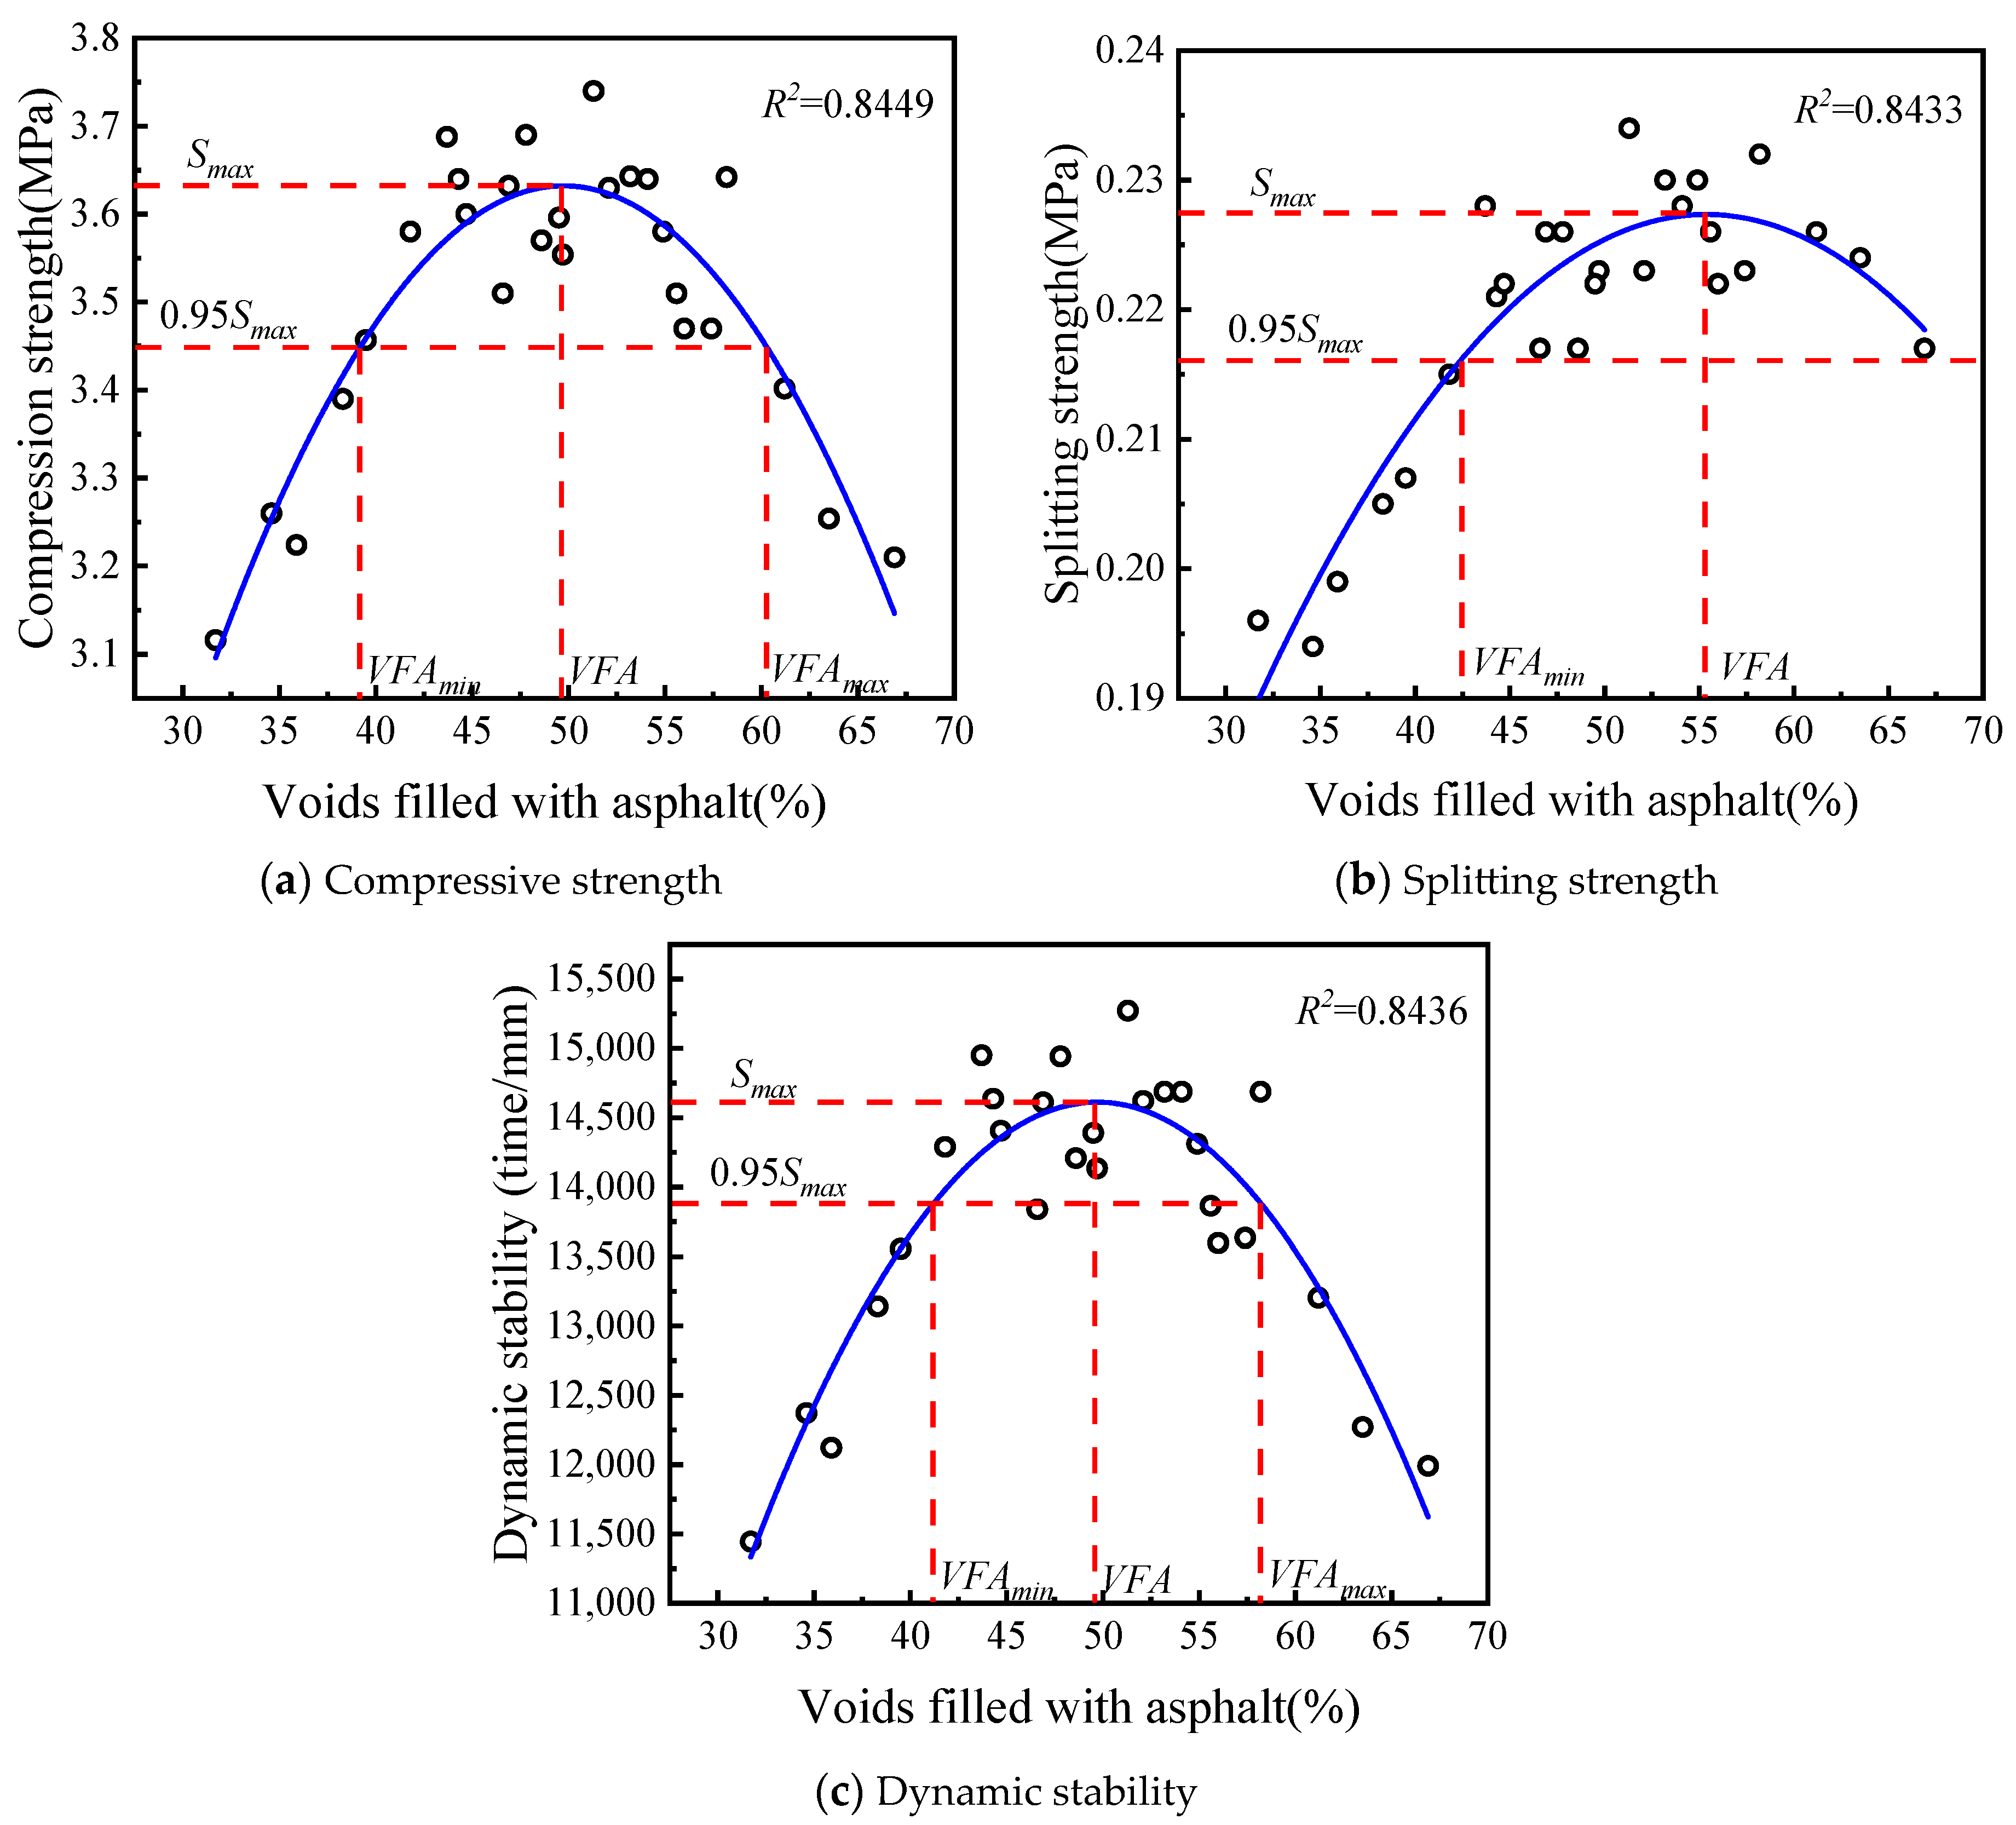
4.2.2. Effect of VFA on the Mechanical Properties of Asphalt Mixtures
4.2.3. VFA Design Criteria
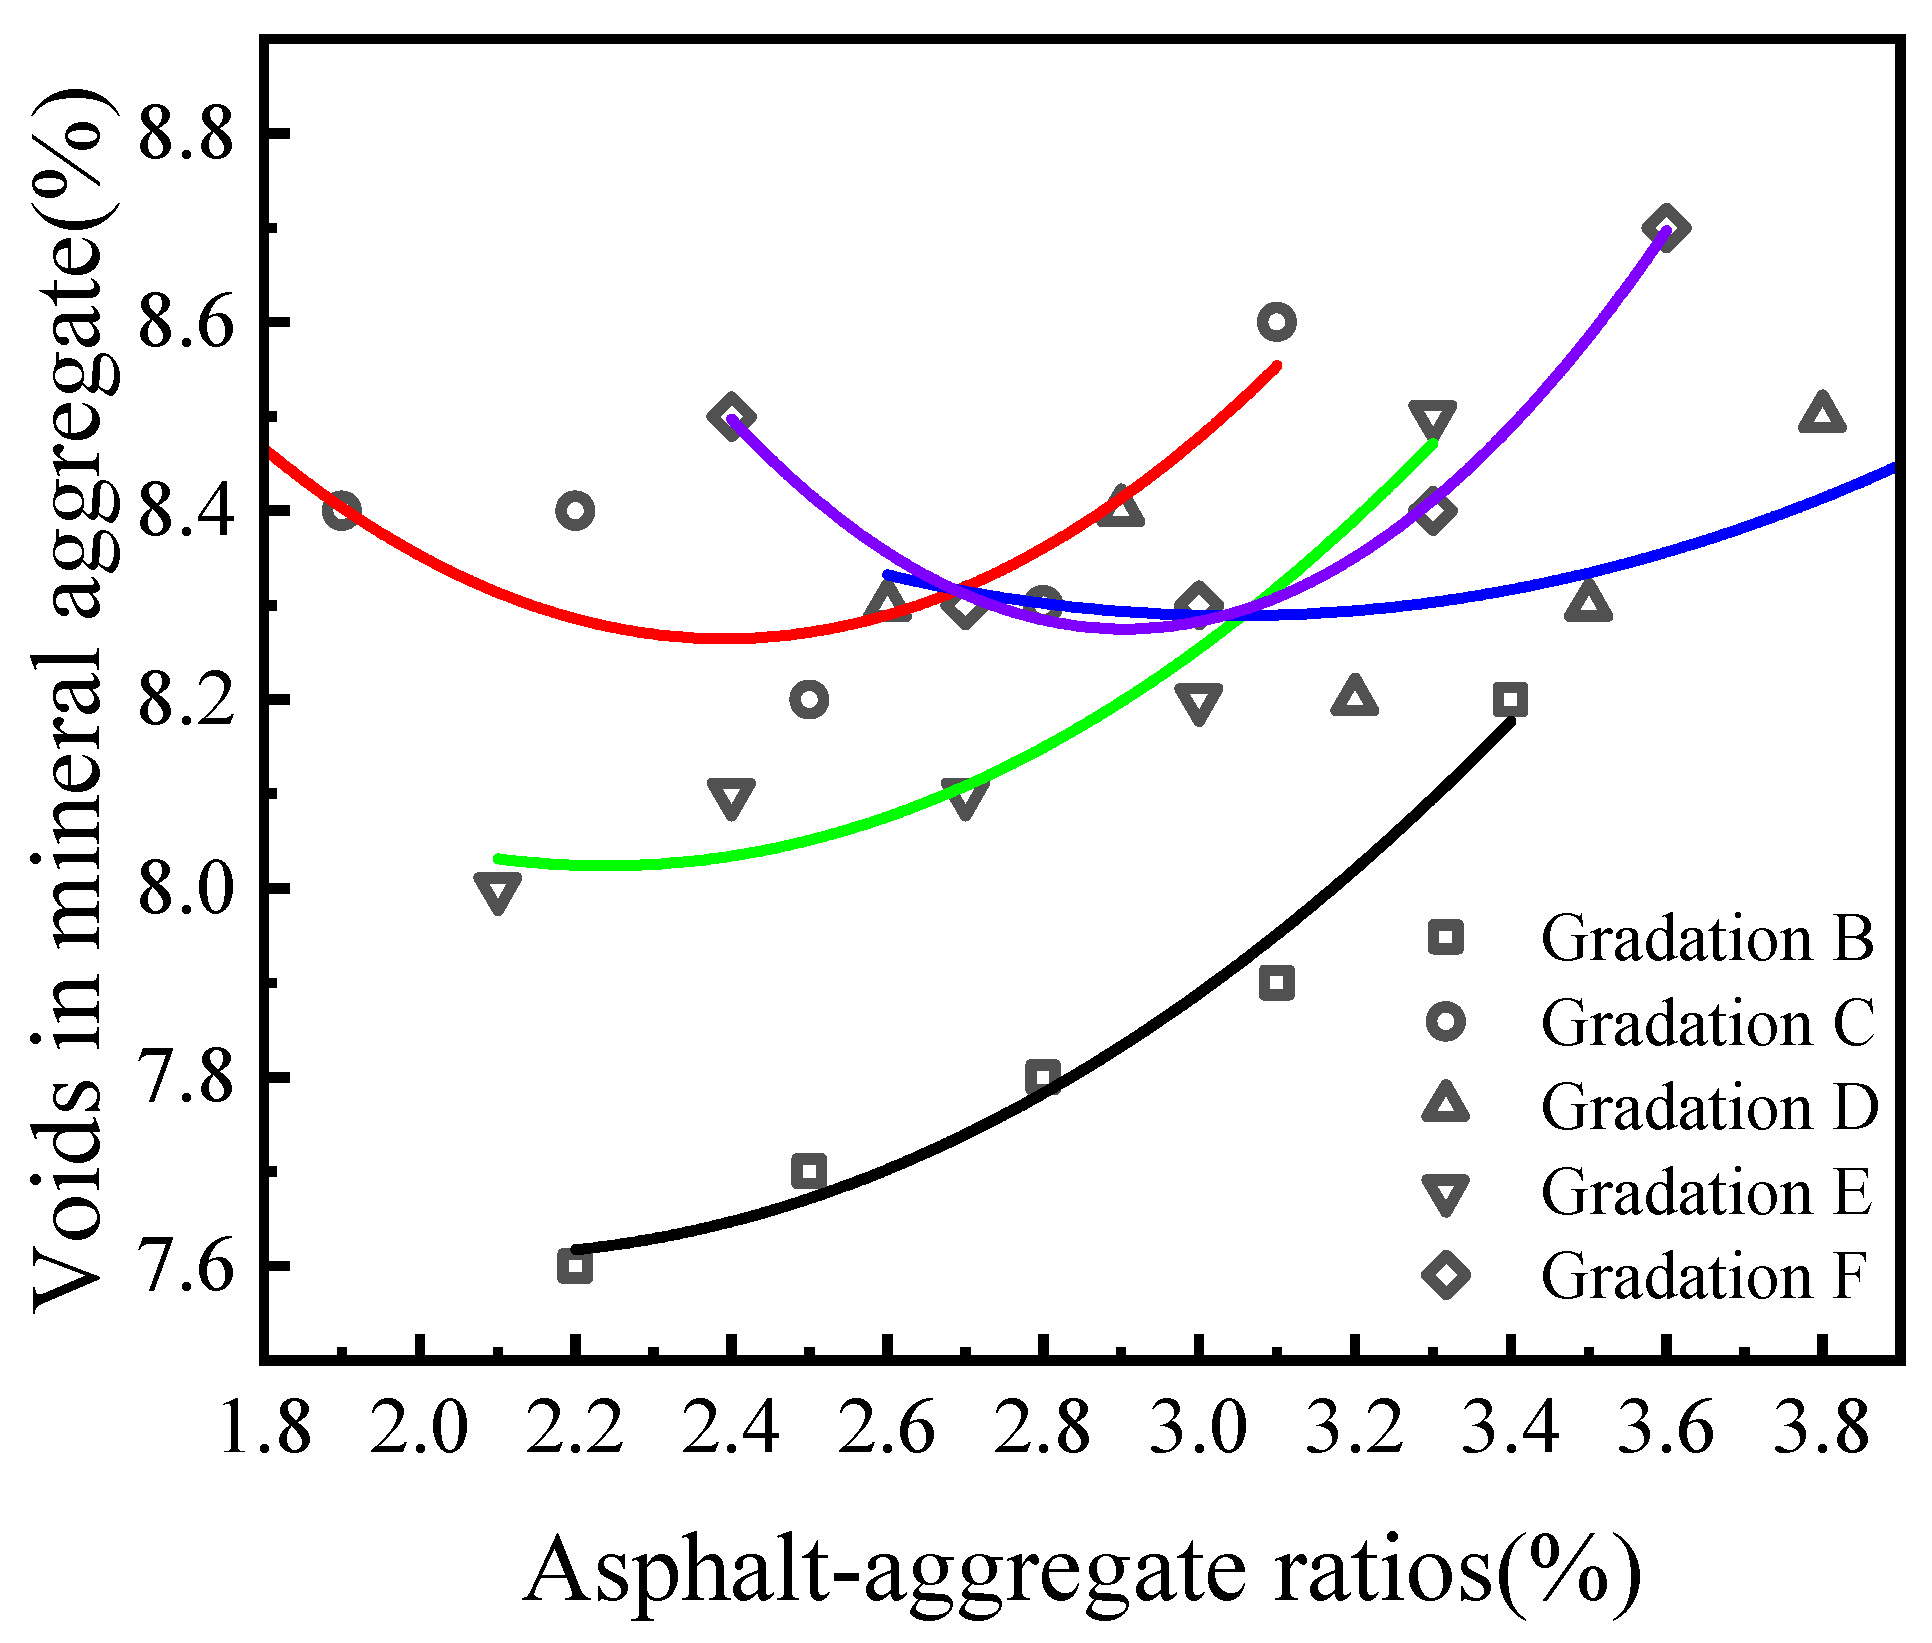
4.3. Influence of VMA on the Mechanical Properties of LSAM-50 Asphalt Mixture and Design Criteria
4.3.1. VMA Influencing Factors
4.3.2. Effect of VMA on the Mechanical Properties of Asphalt Mixtures
4.3.3. VMA Design Criteria
4.4. Criteria for Volume Design of LSAM-50 Asphalt Mixture
5. Analysis of LSAM-50 Test Section
5.1. Project Overview
5.2. Mix Proportion Design of Asphalt Mixture
5.3. Construction Process
5.3.1. Paving Process
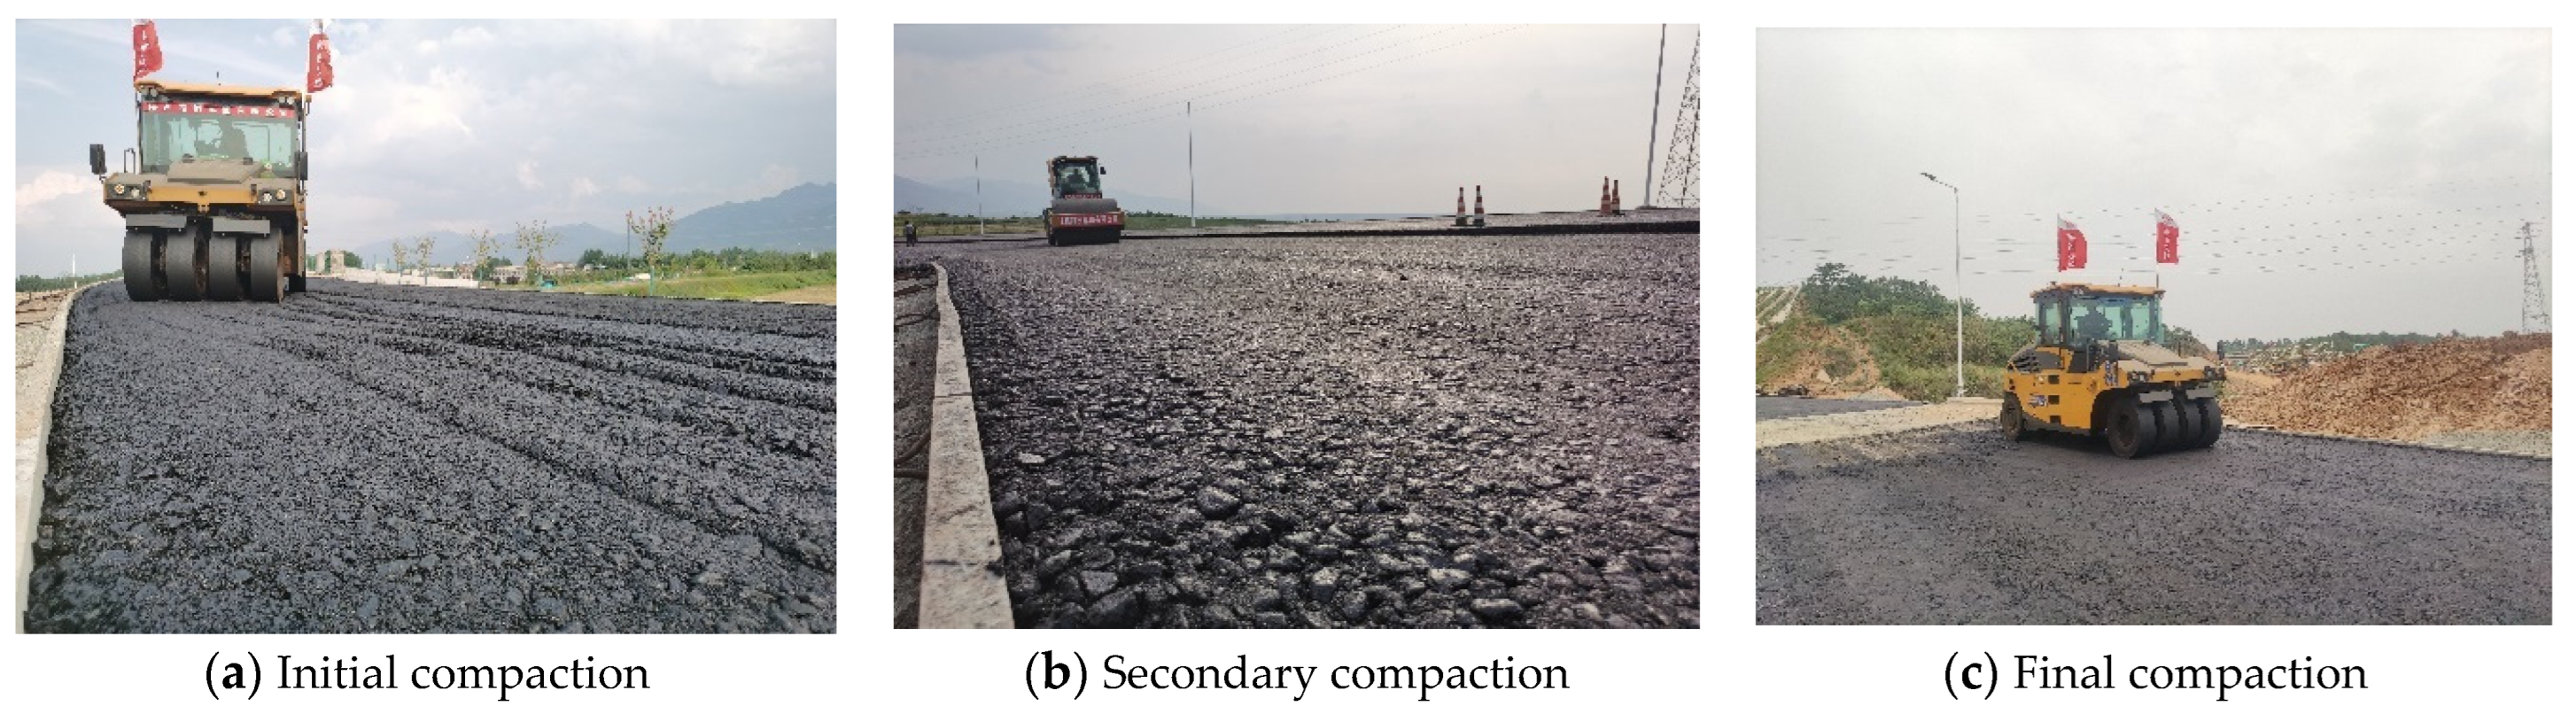
5.3.2. Compaction Process
5.4. Evaluation of Project Effectiveness
- (1)
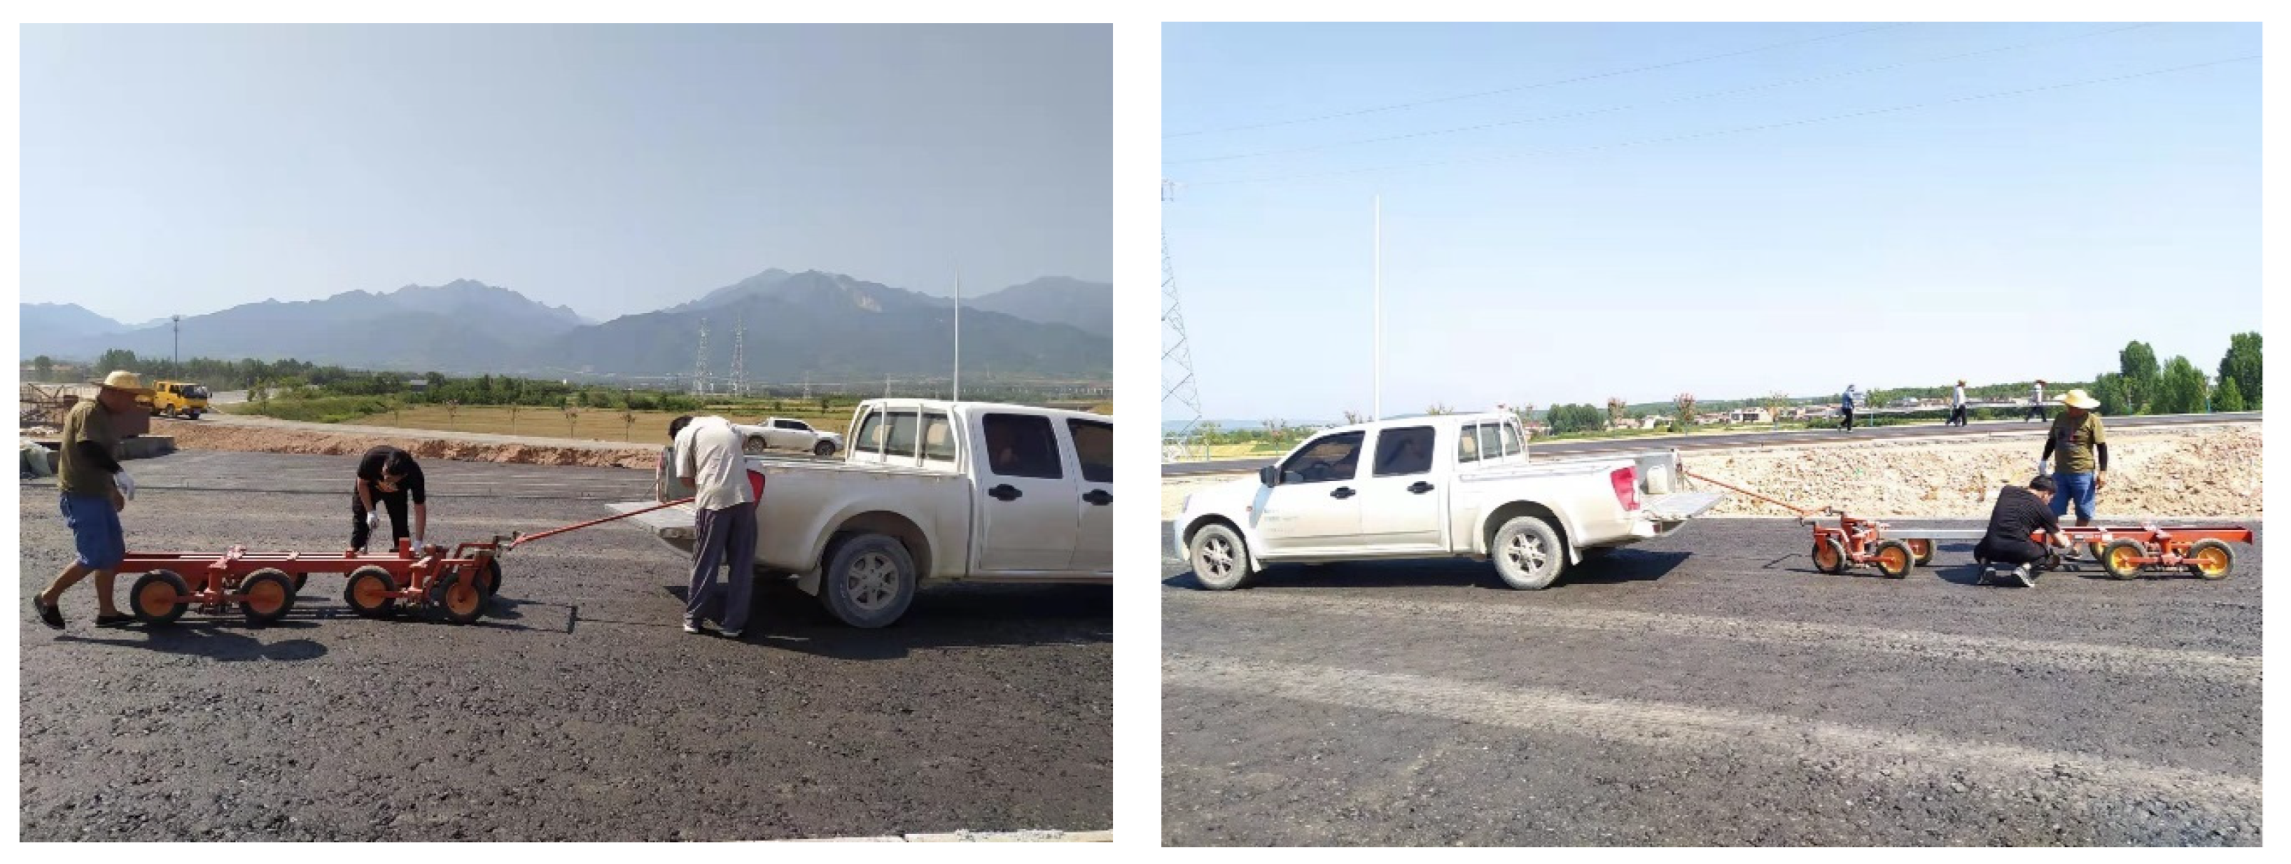
- Road Surface Evenness
- (2)
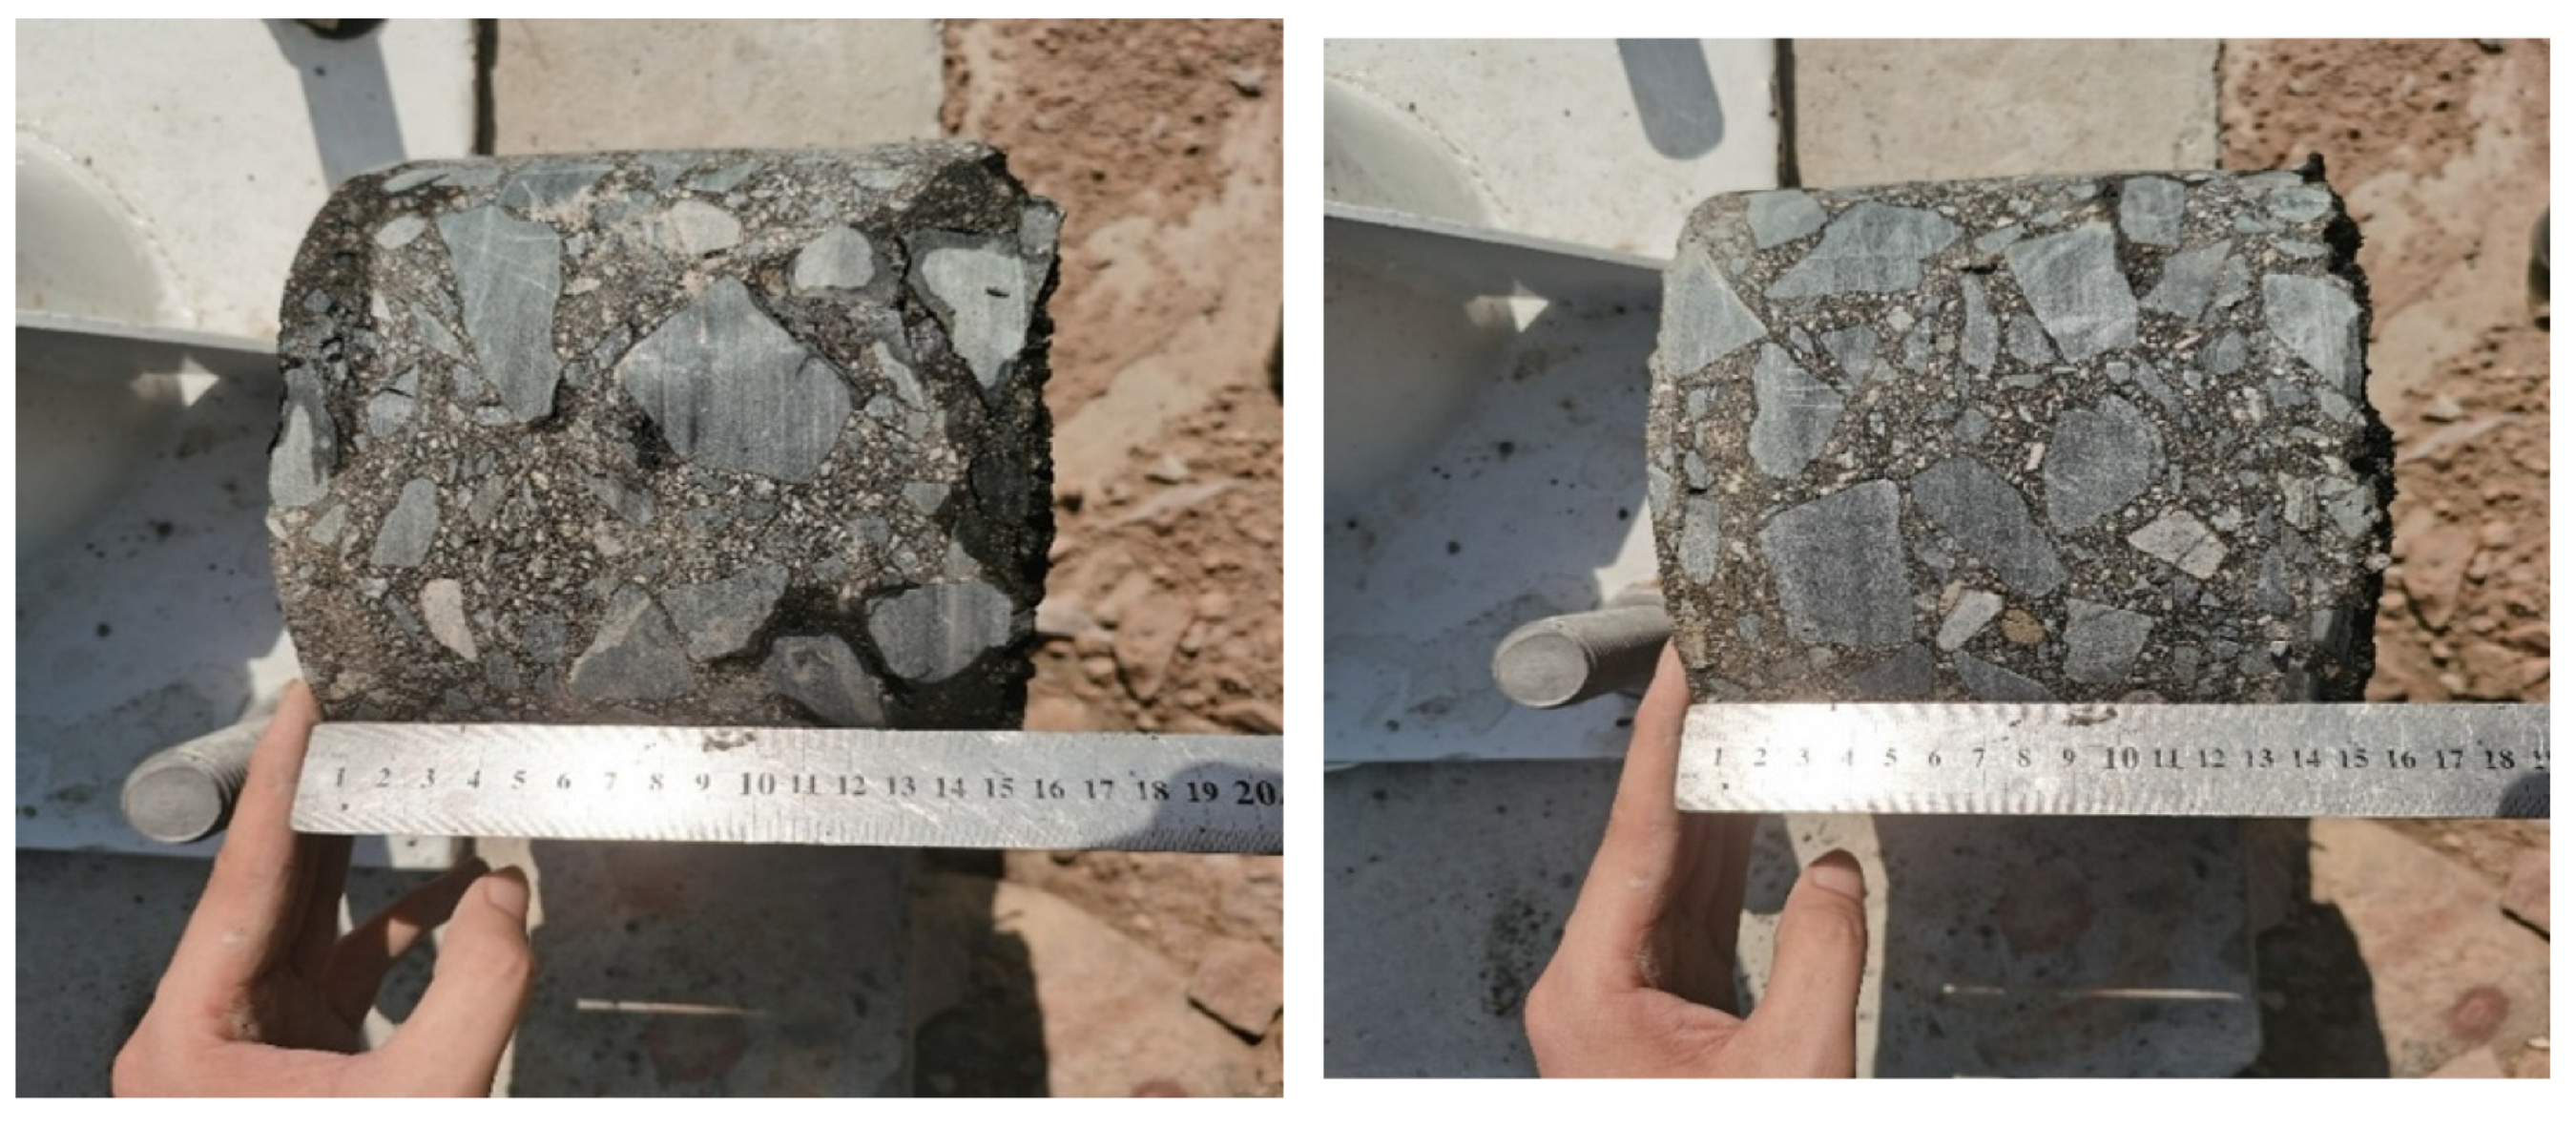
- Compaction Degree
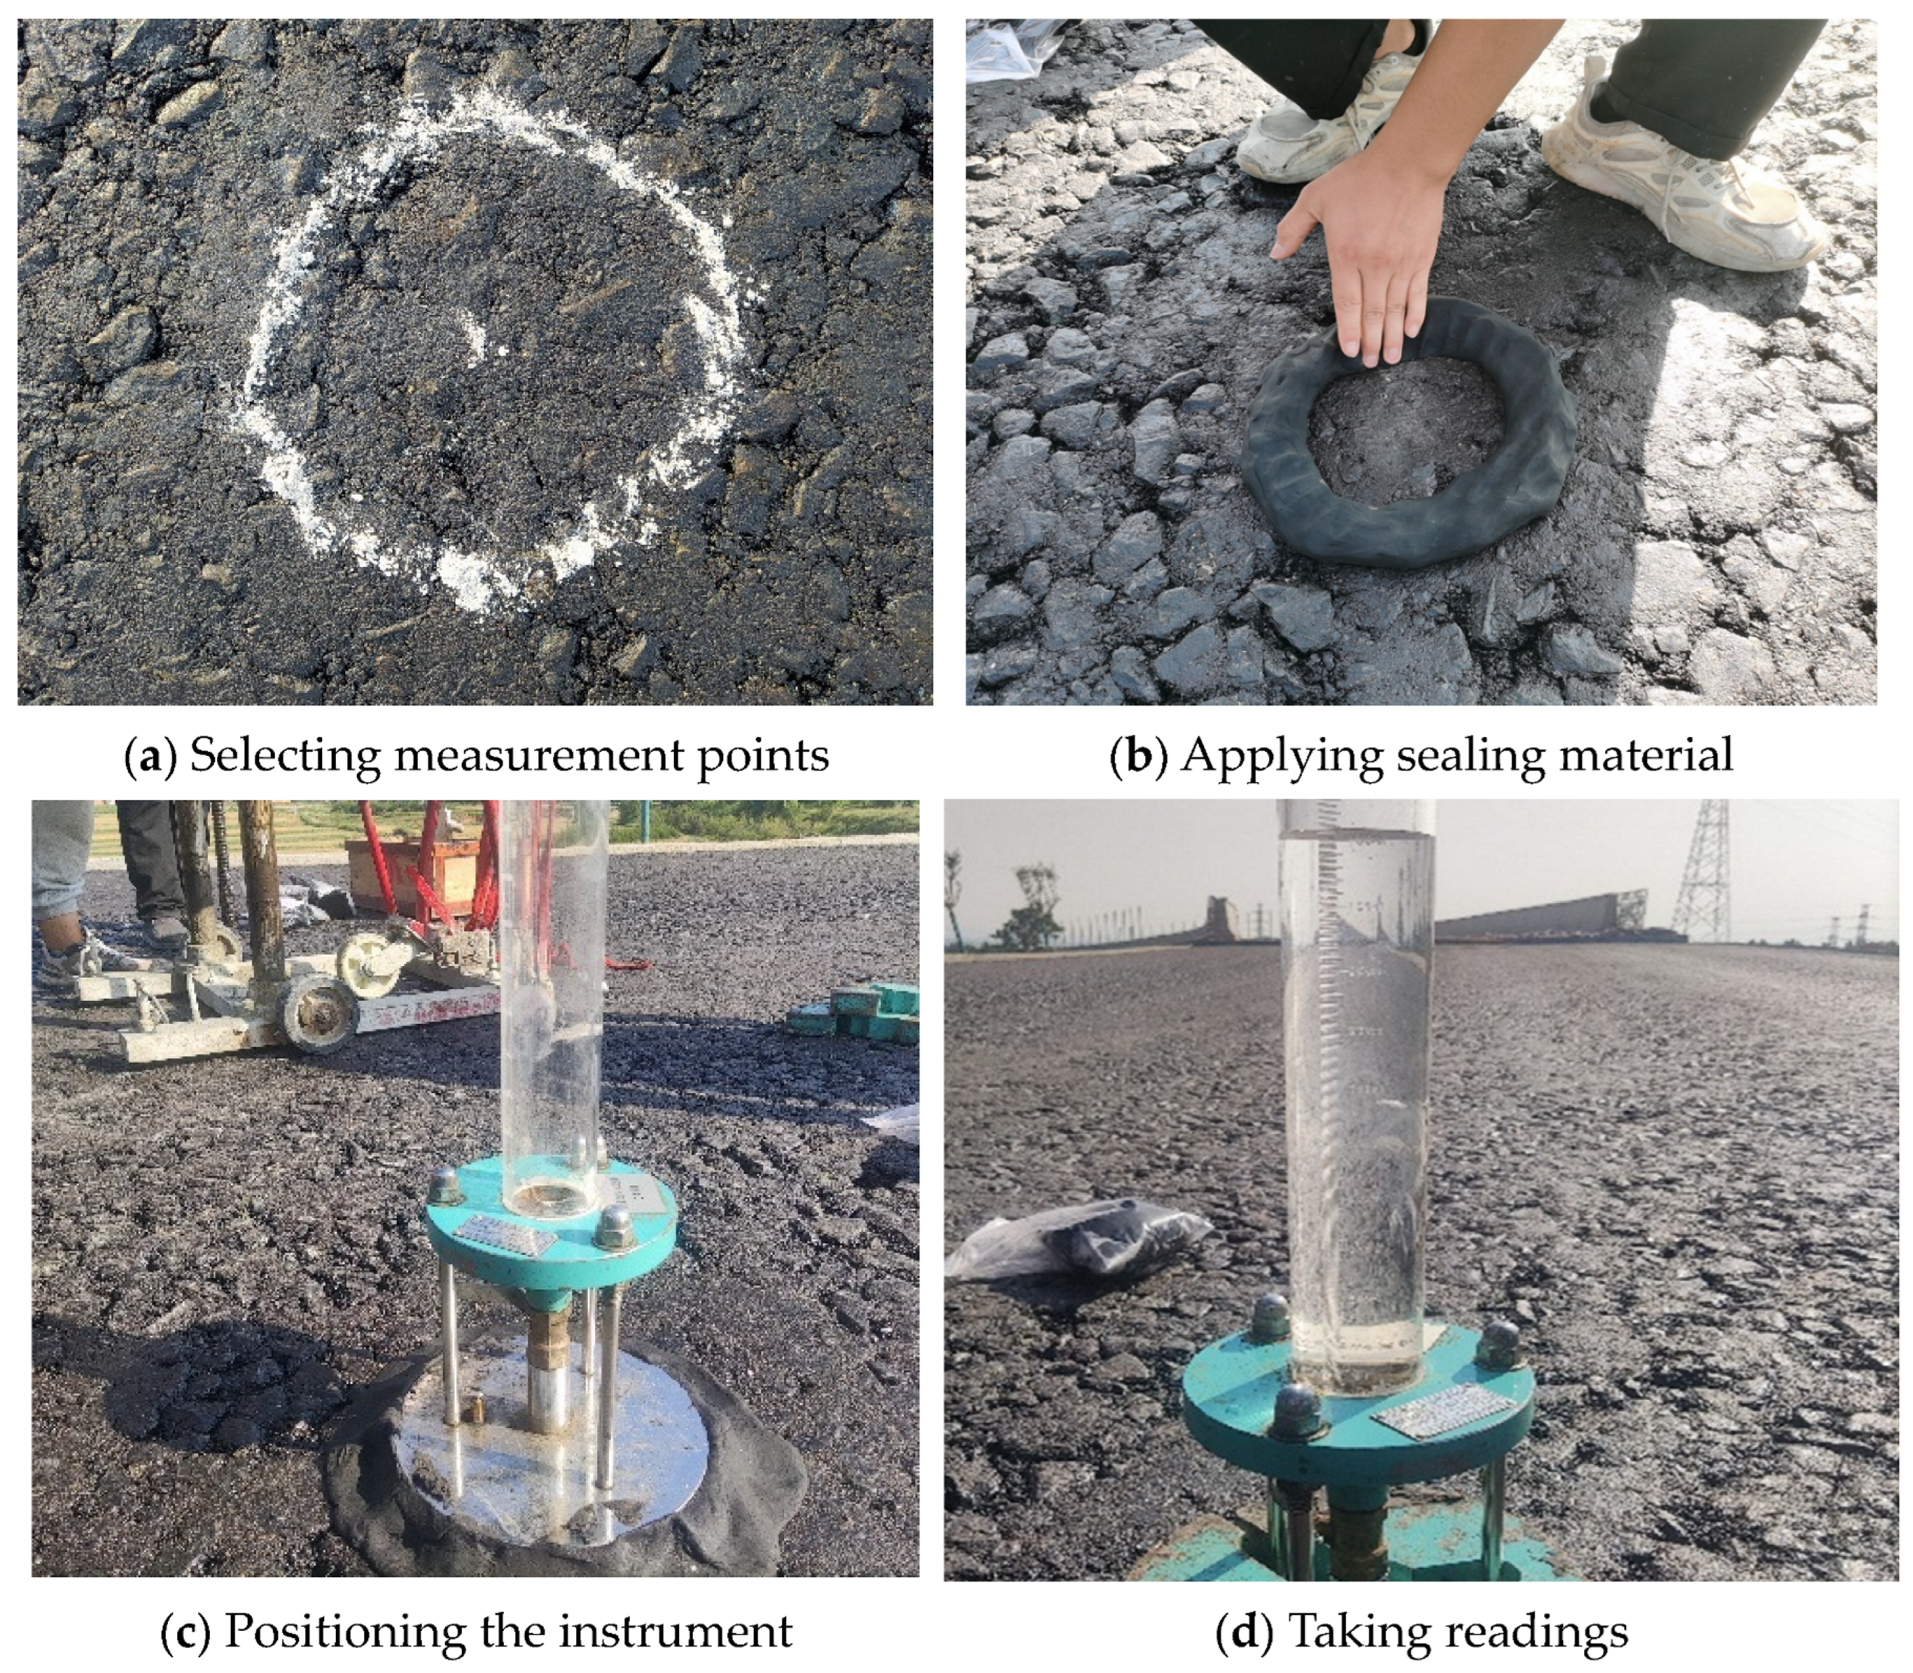
- (3)
- Permeability Coefficient
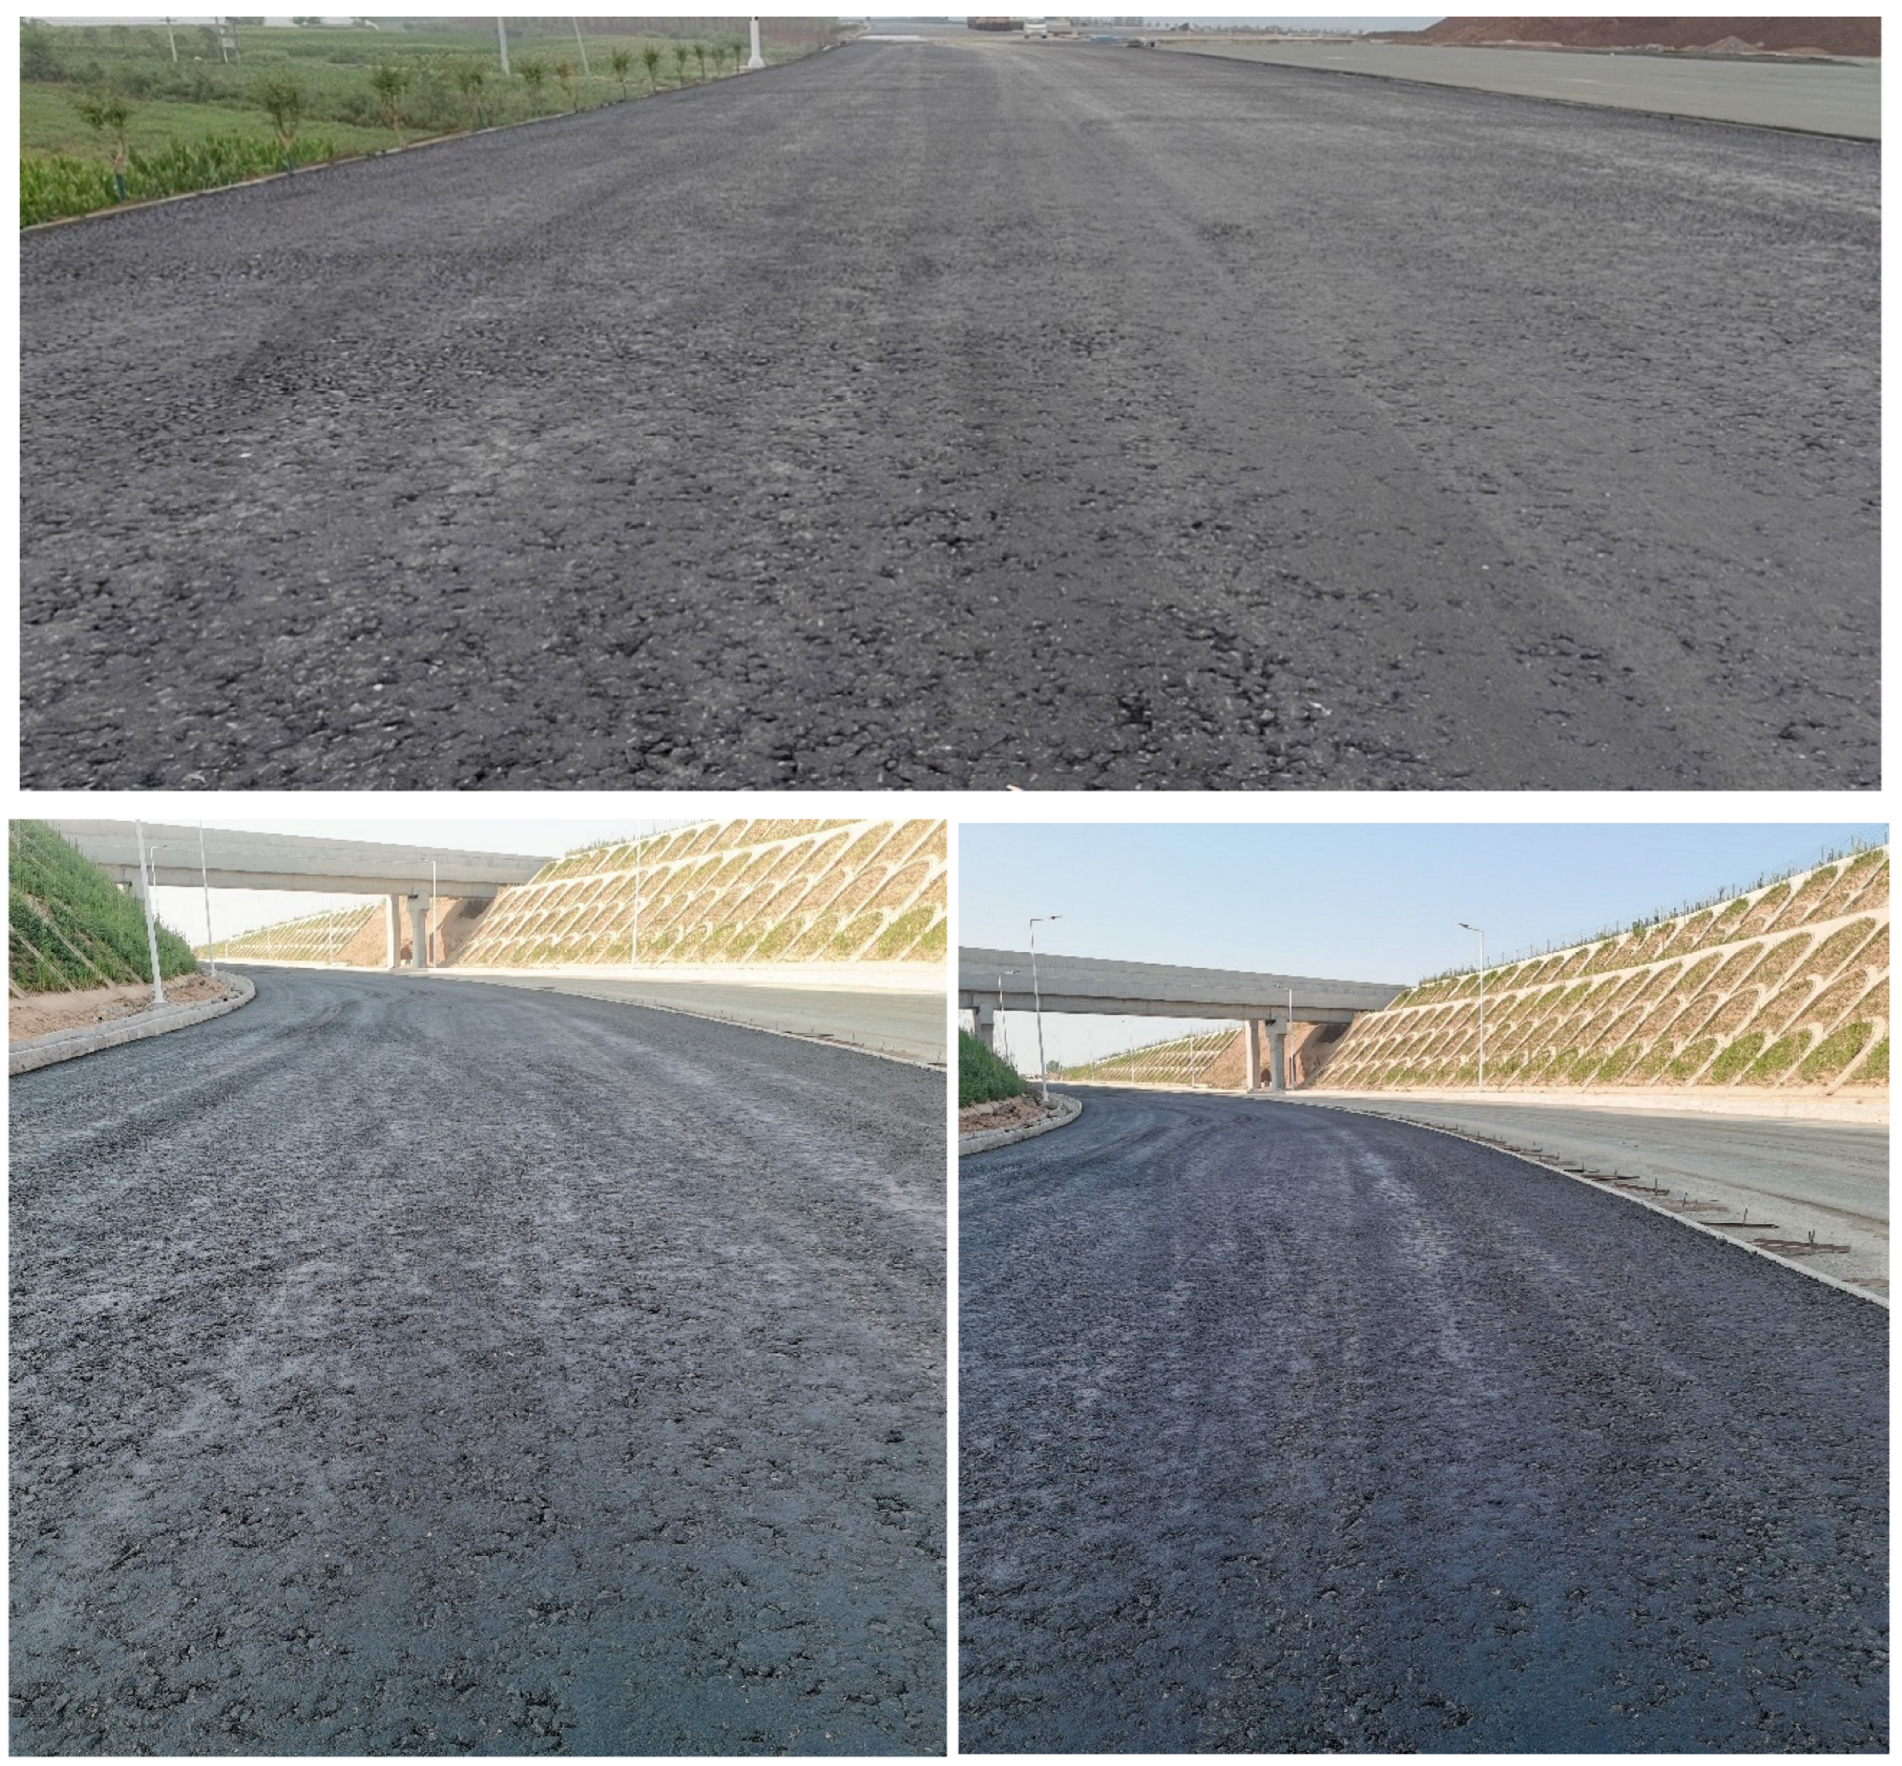
- (4)
- Overall Appearance
6. Conclusions
Author Contributions
Funding
Institutional Review Board Statement
Informed Consent Statement
Data Availability Statement
Conflicts of Interest
References
- Yuan, G.; Li, D.; Pan, J.; Hao, P. Influence Factors and Simulation of Anti-reflection Crack of Large Stone Porous Asphalt Mixes. J. Beijing Univ. Technol. 2020, 46, 1039–1047. (In Chinese) [Google Scholar]
- Li, J.; He, Z.; Guan, Z. Physical model for void ratio inmineral aggregates of porous asphalt concrete. J. Harbin Inst. Technol. 2022, 54, 139–147. (In Chinese) [Google Scholar]
- Jiang, Y.; Zhang, Y.; Yi, Y.; Tian, T.; Fan, J.; Xue, J. Study of shear strength and gradation optimization of asphalt mixture based on uniaxial penetration numerical test. Constr. Build. Mater. 2023, 397, 132398. [Google Scholar] [CrossRef]
- Mascarenhas ZM, G.; Gaspar, M.S.; Vasconcelos, K.L.; Bernucci, L.L.; Bhasin, A. Case study of a composite layer with large-stone asphalt mixture for heavy-traffic highways. J. Transp. Eng. Part B Pavements 2020, 146, 04019040. [Google Scholar] [CrossRef]
- Li, J.; Yu, J.; Xie, J.; Ye, Q. Performance degradation of large-sized asphalt mixture specimen under heavy load and its affecting factors using multifunctional pavement material tester. Materials 2019, 12, 3814. [Google Scholar] [CrossRef] [PubMed]
- Beja, I.A.; de Farias, M.M.; da Silva Barbosa, L.Y.; de Mello, L.G.R. Dynamic properties of large stone asphalt mixtures under different methods testing and loading. Int. J. Pavement Res. Technol. 2021, 14, 186–195. [Google Scholar] [CrossRef]
- Zhang, J.; Tan, H.; Pei, J.; Qu, T.; Liu, W. Evaluating crack resistance of asphalt mixture based on essential fracture energy and fracture toughness. Int. J. Geomech. 2019, 19, 06019005. [Google Scholar] [CrossRef]
- Li, J.; Yu, J.; Wu, S.; Xie, J. The mechanical resistance of asphalt mixture with steel slag to deformation and skid degradation based on laboratory accelerated heavy loading test. Materials 2022, 15, 911. [Google Scholar] [CrossRef] [PubMed]
- Hu, W.; Jia, X.; Huang, B.; Park, H. Evaluation of compactability of asphalt mixture utilizing asphalt vibratory compactor. Constr. Build. Mater. 2017, 139, 419–429. [Google Scholar] [CrossRef]
- Takahashi, O.; Hachiya, Y.; Tsubokawa, Y. Applicability of the Large Stone Asphalt Concretes for Surface Course of Heavy-Duty Airport Pavements. In Proceedings of the 2002 Federal Aviation Administration Technology Transfer Conference; 2002; pp. 63–85. [Google Scholar]
- Wang, X. Mechanical Properties and Fine Structure Analysis of AC-25 Asphalt Mixture Based on Vibration Molding Method. Master’s Thesis, Jilin University, Changchun, China, 2020. (In Chinese) [Google Scholar] [CrossRef]
- Liu, Z.; Sun, L.; Li, J.; Liu, L. Effect of key design parameters on high temperature performance of asphalt mixtures. Constr. Build. Mater. 2022, 348, 129651. [Google Scholar] [CrossRef]
- Lee, J.S.; Gibson, N.; Kim, Y.R. Use of mechanistic models to Investigate fatigue performance of asphalt mixtures: Effects of asphalt mix design targets and compaction. Transp. Res. Rec. 2015, 2507, 108–119. [Google Scholar] [CrossRef]
- Yu, J.; Chen, Y.; Zhang, X. Micromechanical analysis on asphalt mixture fatigue damage considering volumetric property. New Front. 2015, 233–241. Available online: https://ascelibrary.org/doi/10.1061/9780784414255.022 (accessed on 23 October 2023).
- Ge, X. Research on the Influence Factors of Asphalt Rubber Mixture Fatigue Performance. In Proceedings of the 2016 IEEE International Conference of Online Analysis and Computing Science (ICOACS), Chongqing, China, 28–29 May 2016; pp. 214–217. [Google Scholar]
- Jiang, Y.; Xue, J.; Chen, Z. Influence of volumetric property on mechanical properties of vertical vibration compacted asphalt mixture. Constr. Build. Mater. 2017, 135, 612–621. [Google Scholar] [CrossRef]
- Zhang, Y.; Leng, Z.; Dong, Z.; Liu, Z.; Zhang, Z.; Tan, Z. Performance verification of various bulk density measurement methods for open-and gap-graded asphalt mixtures using X-ray computed tomography. Constr. Build. Mater. 2018, 158, 855–863. [Google Scholar] [CrossRef]
- Al-Khateeb, G.G. Conceptualizing the asphalt film thickness to investigate the Superpave VMA criteria. Int. J. Pavement Eng. 2018, 19, 957–965. [Google Scholar] [CrossRef]
- Xie, Z.; Taylor, A.J.; Tran, N.; Kim, S. Evaluation of different VMA estimation methods for asphalt mixtures containing RAP. J. Mater. Civ. Eng. 2020, 32, 04020162. [Google Scholar] [CrossRef]
- Pouranian, M.R.; Haddock, J.E. Determination of voids in the mineral aggregate and aggregate skeleton characteristics of asphalt mixtures using a linear-mixture packing model. Constr. Build. Mater. 2018, 188, 292–304. [Google Scholar] [CrossRef]
- Saleh, A.; Anggraini, M.; Rahmat, H. Effect of Aggregate Physical Properties Observed Void in Minerals Aggregate (VMA) Value. In IOP Conference Series: Earth and Environmental Science; IOP Publishing: Bristol, UK, 2020; Volume 469, p. 012006. [Google Scholar]
- Zhang, D.; Huang, X.; Zhao, Y.; Zhang, S. Rubberized asphalt mixture design using a theoretical model. Constr. Build. Mater. 2014, 67, 265–269. [Google Scholar] [CrossRef]
- Tran, N.H.; Yin, F.; Leiva, F.; Rodezno, C.; Huber, G.; Pine, W. Volumetric Mix Design Adjustments for Improving Asphalt Mixture Durability. Transp. Res. Rec. 2022, 2676, 445–455. [Google Scholar] [CrossRef]
- JTG E20-2011; Standard Test Methods of Bitumen and Bituminous Mixtures for Highway Engineering. China Communications Press: Beijing, China, 2011. (In Chinese)
- JTG 42-2005; Test Method of Aggregate for Highway Engineering. China Communications Press: Beijing, China, 2005. (In Chinese)
- Zhang, Y.; Jiang, Y.; Yi, Y.; Fan, J.; Tian, T. Investigation of strong interlocking skeleton-dense gradation of unbound graded aggregate materials based on plastic deformation characteristics. Constr. Build. Mater. 2023, 368, 130266. [Google Scholar] [CrossRef]
- Jiang, Y.; Yi, Y.; Tian, T.; Hang, Y.; Fan, J. Investigation on viscoelastic properties and temperature effects of super large particle size asphalt mixture. J. Build. Mater. 2023, 1–11. Available online: http://kns.cnki.net/kcms/detail/31.1764.TU.20230921.1549.014.html (accessed on 6 December 2023).
- Deng, C.; Jiang, Y.; Lin, H.; Chen, Z.; Ji, X. Influence of gradations on performance of emulsified asphalt cold recycled mixture produced using vertical vibration compaction method. Road Mater. Pavement Des. 2021, 22, 983–1003. [Google Scholar] [CrossRef]
- JTG F40-2004; Technical Specifications for Construction of Highway Asphalt Pavements. China Communications Press: Beijing, China, 2004. (In Chinese)
- JTG 3450-2019; Field Test Methods of Highway Subgrade and Pavement. China Communications Press:: Beijing, China, 2019. (In Chinese)


| Items | Tested Results | Standard Value | |
|---|---|---|---|
| Penetration (25 °C, 100 g, 5 s) (0.1 mm) | 68 | 60~80 | |
| Ductility (5 cm/min, 15 °C) (cm) | >100 | ≥100 | |
| Softening point(°C) | 47.3 | ≥46 | |
| Penetration index (PI) | −0.315 | −1.5~+1.0 | |
| Flashpoint(°C) | 290 | ≥260 | |
| Solubility in trichloroethylene (%) | 99.6 | ≥99.5 | |
| Rolling Thin Film Oven Test (163 °C, 5 h) | Quality loss (%) | 0.03 | ≤±0.8 |
| Ductility (10 °C) (cm) | 7 | ≥6 | |
| Penetration ratio (25 °C) (%) | 63 | ≥61 | |
| Items | Aggregate Size (mm) | ||||||
|---|---|---|---|---|---|---|---|
| 37.5~53 | 19~37.5 | 9.5~19 | 4.75~9.5 | 2.36~4.75 | 0~2.36 | Mineral Powder | |
| Apparent relative density(g/cm3) | 2.819 | 2.779 | 2.755 | 2.721 | 2.728 | 2.728 | 2.706 |
| Flaky particle content (%) | 2.2 | 7.9 | 7.3 | 13.1 | / | / | / |
| Water absorption rate (%) | 0.37 | 0.62 | 0.98 | 1.73 | 0.75 | / | / |
| Crushed value (%) | 18.5 | / | / | ||||
| Sturdiness (%) | 3.7 | 7.3 | / | ||||
| Methylene blue value (g/kg) | / | / | / | / | / | 3.4 | / |
| Plasticity index (%) | / | / | / | / | / | / | 3.7 |
| Gradation | Percentage by Mass Passing through the Sieve Sizes (mm) | ||||||||||
|---|---|---|---|---|---|---|---|---|---|---|---|
| 53 | 37.5 | 19 | 9.5 | 4.75 | 2.36 | 1.18 | 0.6 | 0.3 | 0.15 | 0.075 | |
| A | 100.0 | 58.0 | 46.0 | 40.0 | 35.0 | 29.2 | 21.7 | 16.3 | 12.0 | 8.2 | 3.8 |
| B | 100.0 | 70.0 | 60.0 | 42.0 | 34.0 | 26.0 | 18.0 | 14.0 | 10.0 | 7.5 | 4.5 |
| C | 100.0 | 65.0 | 55.0 | 37.0 | 30.0 | 22.0 | 14.0 | 10.0 | 7.0 | 5.0 | 3.0 |
| D | 100.0 | 75.0 | 65.0 | 47.0 | 38.0 | 30.0 | 22.0 | 18.0 | 13.0 | 10.0 | 6.0 |
| E | 100.0 | 72.5 | 62.5 | 42.0 | 32.0 | 24.0 | 16.0 | 12.0 | 8.5 | 6.3 | 3.8 |
| F | 100.0 | 67.5 | 57.5 | 42.0 | 36.0 | 28.0 | 20.0 | 16.0 | 11.5 | 8.8 | 5.3 |
| Upper-System Weight (kg) | Lower-System Weight (kg) | Work Frequency (Hz) | Static Eccentric Moment (kg/m) | Work Amplitude (mm) |
|---|---|---|---|---|
| 122 | 180 | 40 | 0.215 | 1.2 |
| Thickness (cm) | Number of Lapping (Times) | Insulation Temperature (°C) | Insulation Time (h) |
|---|---|---|---|
| 18 | 44 | 60 | 7 |
| Strength Indexes | Forming Method | Parallel Specimen Strength Test Value (MPa) | (MPa) | Cv (%) | ||
|---|---|---|---|---|---|---|
| 1 | 2 | 3 | ||||
| 60 °C Rc | Core samples | 3.65 | 3.87 | 3.46 | 3.66 | 5.6 |
| VVCM | 3.32 | 3.49 | 3.26 | 3.36 | 3.6 | |
| PCT | 3.01 | 2.49 | 2.72 | 2.74 | 9.5 | |
| 60 °C RT | Core samples | 0.225 | 0.240 | 0.220 | 0.228 | 4.6 |
| VVCM | 0.213 | 0.199 | 0.204 | 0.205 | 3.4 | |
| PCT | 0.178 | 0.203 | 0.166 | 0.182 | 10.4 | |
| Contents | Percentage Passing (%) for Sieve Size (mm) | ||||||||
|---|---|---|---|---|---|---|---|---|---|
| 53 | 37.5 | 31.5 | 26.5 | 19 | 16 | 13.2 | 9.5 | 4.75 | |
| Initial gradation | 100.0 | 58.0 | 54.0 | 50.0 | 46.0 | 44.0 | 42.0 | 40.0 | 35.0 |
| VVCM | 100.0 | 59.2 | 55.6 | 51.8 | 48.1 | 46.0 | 43.6 | 40.6 | 35.6 |
| PCT | 100.0 | 65.4 | 58.4 | 55.7 | 49.4 | 47.2 | 45.0 | 42.7 | 37.2 |
| Contents | Percentage Passing (%) for Sieve Size (mm) | ΣΔ | ||||||||
|---|---|---|---|---|---|---|---|---|---|---|
| 53 | 37.5 | 31.5 | 26.5 | 19 | 16 | 13.2 | 9.5 | 4.75 | ||
| VVCM | 0.0 | 1.2 | 1.6 | 1.8 | 2.1 | 2 | 1.6 | 0.6 | 0.6 | 11.5 |
| PCT | 0.0 | 7.4 | 4.4 | 5.7 | 3.4 | 3.2 | 3 | 2.7 | 2.2 | 30.0 |
| Strength Indexes | Fitting Curve | VV of Smax | VV of 0.95∙Smax | ||
|---|---|---|---|---|---|
| Fitting Equation | Correlation Coefficient R2 | VV | VVmin | VVmax | |
| RC | RC = −0.23394VV2 + 1.94469VV − 0.40744 | 0.8227 | 4.2 | 3.3 | 5.0 |
| RT | RT = −0.00853VV2 + 0.06197VV + 0.11443 | 0.8113 | 3.6 | -- | 4.8 |
| DS | DS = −1435VV2 + 11938VV − 10197 | 0.8225 | 4.2 | 3.5 | 4.9 |
| Strength Indexes | Fitting Curve | VV of Smax | VV of 0.95∙Smax | ||
|---|---|---|---|---|---|
| Fitting Equation | Correlation Coefficient R2 | VV | VVmin | VVmax | |
| RC | RC = −0.00165VFA2 + 0.164VFA − 0.4462 | 0.8449 | 49.7 | 40 | 60 |
| RT | RT = −0.000067VFA2 + 0.00741VFA + 0.02224 | 0.8433 | 52.9 | 43 | - |
| DS | DS = −10.1VFA2 + 1005VFA − 10362 | 0.8436 | 49.8 | 42 | 58 |
| Volume Index | VV (%) | VFA (%) | VMA (%) |
|---|---|---|---|
| Technical standards | 3.5~4.8 | 49.7~52.9 | ≥7.5 |
| Aggregate Specifications (mm) | 38~54 | 22~38 | 11~22 | 7~11 | 4~7 | 0~4 | Mineral Powder |
|---|---|---|---|---|---|---|---|
| Proportions (%) | 30 | 15 | 10 | 6 | 6 | 29 | 4 |
| Project | Optimal Asphalt–Aggregate Ratio (%) | Bulk Specific Gravity | Theoretical Maximum Density | VV (%) | VFA (%) | VMA (%) | Compressive Strength at 60 °C (MPa) |
|---|---|---|---|---|---|---|---|
| Test value | 2.8 | 2.569 | 2.683 | 4.2 | 51.8 | 9.0 | 2.62 |
| Normative value | — | — | — | 3.5~4.8 | 49.7~52.9 | ≥7.5 | ≥2.0 |
| Project | High-Temperature Performance | Water Stability | Low-Temperature Performance | |
|---|---|---|---|---|
| Dynamic Stability (Time/mm) | Residual Strength Ratio (%) | Freeze-Thaw Splitting Strength Ratio (%) | Small Beam Bending Strain (µε) | |
| Test value | 10,449 | 86.9 | 85.7 | 2608 |
| Normative value | ≥4000 | ≥85 | ≥80 | ≥2500 |
| Number | Layer Position | Standard Deviation (mm) | ||
|---|---|---|---|---|
| Test Value | Mean Value | Normative Value | ||
| 1 | Road Base Layer | 1.77 | 2.21 | ≤3 |
| 2 | Road Base Layer | 2.36 | ||
| 3 | Road Base Layer | 2.20 | ||
| 4 | Road Base Layer | 2.51 | ||
| Pile Number | Height of Core Samples (cm) | Height (cm) | Mean Value (cm) | Error (mm) | Normative Value (mm) | Extreme Values (mm) | Error (mm) | Normative Value (mm) | |||
|---|---|---|---|---|---|---|---|---|---|---|---|
| 1 | 2 | 3 | 4 | ||||||||
| EK1 + 700 | 14.0 | 14.2 | 13.8 | 14.2 | 14.1 | 14.9 | −1 | ≥−8 | 14.1 | −9 | ≥−10 |
| EK1 + 600 | 14.9 | 15.3 | 15.2 | 15.1 | 15.1 | ||||||
| EK1 + 500 | 15.6 | 15.5 | 15.5 | 15.2 | 15.5 | ||||||
| EK1 + 400 | 15.3 | 15.0 | 14.9 | 15.0 | 15.1 | ||||||
| EK1 + 300 | 14.5 | 13.7 | 14.3 | 13.7 | 14.1 | ||||||
| EK1 + 200 | 15.3 | 15.2 | 15.5 | 15.3 | 15.3 | ||||||
| Pile Number | Height of Core Samples h (cm) | Density of Core Sample ρx (g/cm3) | Density of Specimen ρv (g/cm3) | Maximum Theoretical Density ρl (g/cm3) | Compaction Degree (%) | |
|---|---|---|---|---|---|---|
| ρx/ρv | ρx/ρl | |||||
| EK1 + 700 | 14.1 | 2.559 | 2.569 | 2.683 | 99.6 | 95.4 |
| EK1 + 600 | 15.1 | 2.574 | 100.2 | 95.9 | ||
| EK1 + 500 | 15.5 | 2.560 | 99.6 | 95.4 | ||
| EK1 + 400 | 15.1 | 2.583 | 100.5 | 96.3 | ||
| EK1 + 300 | 14.1 | 2.553 | 99.4 | 95.2 | ||
| EK1 + 200 | 15.3 | 2.581 | 100.5 | 96.2 | ||
| Mean value | 14.9 | 2.568 | - | - | 100.0 | 95.7 |
| Pile Number | Initial Value (mL) | Final Value (mL) | Permeability Coefficient (mL/min) | Mean Value (mL/min) |
|---|---|---|---|---|
| eEK1 + 750 | 100 | 130 | 10 | 12 |
| EK1 + 650 | 100 | 109 | 3 | |
| EK1 + 550 | 100 | 120 | 10 | |
| EK1 + 450 | 100 | 160 | 20 | |
| EK1 + 350 | 100 | 154 | 28 |
Disclaimer/Publisher’s Note: The statements, opinions and data contained in all publications are solely those of the individual author(s) and contributor(s) and not of MDPI and/or the editor(s). MDPI and/or the editor(s) disclaim responsibility for any injury to people or property resulting from any ideas, methods, instructions or products referred to in the content. |
© 2024 by the authors. Licensee MDPI, Basel, Switzerland. This article is an open access article distributed under the terms and conditions of the Creative Commons Attribution (CC BY) license (https://creativecommons.org/licenses/by/4.0/).
Share and Cite
Jiang, Y.; Cai, M.; Li, S.; Zhang, Y.; Yi, Y.; Su, H.; Bai, C. Design of Volume Parameters of Large-Particle-Size Asphalt Mixture Based on the Vertical Vibration Compaction Method. Appl. Sci. 2024, 14, 6983. https://doi.org/10.3390/app14166983
Jiang Y, Cai M, Li S, Zhang Y, Yi Y, Su H, Bai C. Design of Volume Parameters of Large-Particle-Size Asphalt Mixture Based on the Vertical Vibration Compaction Method. Applied Sciences. 2024; 14(16):6983. https://doi.org/10.3390/app14166983
Chicago/Turabian StyleJiang, Yingjun, Minfeng Cai, Sheng Li, Yu Zhang, Yong Yi, Hongjian Su, and Chenfan Bai. 2024. "Design of Volume Parameters of Large-Particle-Size Asphalt Mixture Based on the Vertical Vibration Compaction Method" Applied Sciences 14, no. 16: 6983. https://doi.org/10.3390/app14166983