Article

Combined Process for Caffeine Treatment in Aqueous Solution by Adsorption/Regeneration and Fenton Oxidation

by
Natalia Pollon Zanatta
1,
Vanessa Jurado Davila
2,*,
Katianna Hugue
1 and
Liliana Amaral Féris
1
1
Department of Chemical Engineering, Federal University of Rio Grande do Sul, Ramiro Barcelos Street, 2777, Porto Alegre 90035-007, RS, Brazil
2
CERES, Department of Chemical Engineering, University of Coimbra, Polo II, Rua Sílvio Lima, 3030-790 Coimbra, Portugal
*
Author to whom correspondence should be addressed.
Appl. Sci. 2024, 14(16), 6993; https://doi.org/10.3390/app14166993
Submission received: 16 July 2024 / Revised: 6 August 2024 / Accepted: 6 August 2024 / Published: 9 August 2024
(This article belongs to the Section Green Sustainable Science and Technology)

Abstract

:
This study aims to assess the efficiency of caffeine mitigation in an aqueous solution through a combination of adsorption and the Fenton reaction, using granular activated carbon (GAC). The present study also investigates the reduction in the concentration of oxidation byproducts in the solution and the regeneration of the solid. The combined process was conducted in four consecutive cycles using optimal values determined in individual technique studies. For the individual adsorption study, a Box–Behnken design was employed, with varying pH (3 to 11), GAC concentration (1.0 to 10.0 g L−1), and contact time (10 to 120 min). In the individual Fenton study, based on a factorial design, concentrations of FeSO4·7H2O (4 to 20 mg L−1) and H2O2 (25 to 150 mg L−1) were used at reaction times of 5 and 60 min. GAC was characterized by Fourier-transform infrared spectroscopy (FTIR), X-ray diffraction (XRD), specific area (BET), and pore size (BJH) throughout all stages of experimentation. The outcomes show that the adsorption achieved a 93.4% removal rate under the optimal experimental conditions (natural pH, 65 min, and 10 mg L−1) and the Fenton reaction achieved a 98.92% degradation rate at a 37.5 ratio of H2O2/FeSO4·7H2O. The combined process also achieved an efficiency of over 95.7% of caffeine removal in four cycles, reducing the Total Organic Carbon (TOC) by more than 47.65% and 20.6% at 5 and 60 min of the Fenton reaction, respectively. Regeneration efficiencies of 99.6%, 91.8%, and 93.8% for the other three evaluated cycles were obtained. These findings suggest that the combined process is a promising solution for the treatment of effluents contaminated with caffeine.

1. Introduction

Caffeine is extensively used in the food, beverage, and pharmaceutical industries due to its stimulating effects [1,2,3,4]. On account of its diverse applications and global consumption, caffeine stands as the most widely consumed psychoactive drug worldwide [5]. Consequently, it is frequently identified in various environmental matrices due to improper disposal practices. Since its presence in water is closely related to human activity, caffeine has been used as a chemical indicator of water quality in relation to the presence of pollutants, thus being associated with the sanitation conditions of a region [6,7,8]. Furthermore, caffeine is amidst the emerging contaminants (ECs) that present an environmental challenge [6,8]. These contaminants are characterized by their resistance to conventional wastewater treatments, environmental persistence, potential for bioaccumulation, and toxic, mutagenic, and carcinogenic effects [8,9,10,11,12]. As a result, effective removal of caffeine from wastewater is essential to ensure the safe discharge of treated effluents into watercourses in order to protect human health and preserve ecosystems [13,14].
Conventional wastewater treatment processes, such as biological [15] and physicochemical [16,17] methods, have been found to be ineffective in the removal of caffeine. Given that ECs exhibit high persistence in aqueous environments, advanced technologies are required in addition to conventional treatments for the complete removal of these pollutants [9]. Some of the techniques reported include bioremediation [18], membrane filtration [19], adsorption [20], and advanced oxidative processes (AOPs) [21].
Among these techniques, adsorption stands out for its ability to separate unwanted components in a solution by reducing their concentrations through mass transfer between the aqueous solution and the surface of the adsorbent [22,23,24,25]. The process is simple and cost-effective, with low waste generation [26]. However, adsorption has some limitations such as saturation of the adsorbent, which requires its replacement over time [27]. To identify when the solid will be saturated, some factors must be considered, including the physicochemical properties of the solid, concentration of the adsorbent, and contact time between the contaminated water and the adsorbent material [23,24,28]. However, these disadvantages can be overcome through regeneration of the adsorbent, which makes the process more sustainable and generates less final solid waste [27]. In addition, GAC is a frequent choice for removing various pollutants in the environmental field due to its high surface area, porosity, and the wide range of functional groups on its surface [23,25,29], besides lowering the cost of the process.
For better results, AOPs such as the Fenton reaction can be employed in combination with adsorption. The Fenton reaction involves the generation of hydroxyl radicals (•OH), a highly reactive species, which can rapidly oxidize and break down the caffeine molecule, promoting the degradation of the pollutant in water [30,31]. The combination of the Fenton reaction and adsorption allows for the degradation of the residual contaminant in the remaining solution while simultaneously promoting the regeneration of the saturated adsorbent through the degradation of the adsorbed organic molecules on the adsorption sites [32,33,34,35]. Caffeine degradation can generate persistent intermediates [36,37]; therefore, combining it with adsorption allows the adsorbent to also adsorb the intermediate reaction products and thus reduce the concentration of oxidation byproducts in the solution [38]. The decrease in reaction intermediates in the solution is important because these molecules can be harmful, sometimes more so than the original molecule, and therefore, careful control of the reaction conditions is necessary [39,40].
This work aims to apply a combined process of adsorption onto GAC and the Fenton reaction to achieve superior results compared to the individual techniques of adsorption and Fenton oxidation. The innovation of this study is found in the concurrent application of these techniques for caffeine removal, which not only enhances caffeine removal efficiency but also improves adsorbent regeneration and minimizes the production of oxidation byproducts. Initially, adsorption was employed to maximize the removal of caffeine in an aqueous solution. Subsequently, the Fenton reaction was applied within the adsorption system to degrade the remaining caffeine in the solution and regenerate the saturated adsorbent. Additionally, this process aids in removing the oxidation byproducts of the solution through their adsorption onto the GAC. The processes were studied separately using the response surface methodology to assess the significance of the interaction of the parameters and to optimize the conditions of the techniques to obtain the values most suitable for the combined process [41]. Once the optimal conditions had been determined, a simultaneous process of adsorption and Fenton oxidation was applied to the caffeine solution in order to, besides mitigating the pollutant, improve the process to achieve a reduction in the concentration of the degradation byproducts (which are sometimes more toxic than the initial organic molecule) and facilitate GAC regeneration. In a nutshell, this work is a comprehensive study that carries three main implications when combining the Fenton reaction with adsorption to treat caffeine-contaminated water: (I) enhanced removal efficiency, as the synergistic effect of adsorption onto GAC and the Fenton reaction proves to be more effective than individual techniques; (II) efficient regeneration of the adsorbent, achieved through the Fenton reaction’s ability to degrade the organic molecules present on the adsorption sites; and (III) minimization of oxidation byproducts in the solution that may be toxic, facilitated by their absorption onto GAC.

2. Methodology

2.1. Materials

Caffeine (CAF) was supplied by Sigma-Aldrich with a purity greater than 99%. A stock solution of caffeine with a concentration of 20 mg L−1 was prepared and used in all experiments. Commercial granular activated carbon (GAC) was supplied by Êxodo Científica, Sumaré, Brazil. GAC particle size was between 1.00 and 2.00 mm, the pHpzc was 7.36, the surface area was 534.42 m2 g−1, the average pore size was 4.82 Å, and the total pore volume was 0.12 cm3 g−1. The reagents used in the Fenton experiments were FeSO4·7H2O from Synth with a purity greater than 99% and H2O2 35% from Dynamics. For pH adjustment, NaOH and HCl from Synth were used in concentrations of 1 M.

2.2. Characterization of the Adsorbent Solid

GAC was characterized by N2 adsorption (BET/BJH), X-ray diffraction (XRD), Fourier transform infrared spectroscopy (FTIR), and pHPCZ analyses. N2 adsorption, XRD, and FTIR were performed before and after caffeine removal under the most suitable conditions for adsorption and the combined process. The pHPCZ was determined using the methodology of Regalbuto and Robles [42]. For N2 adsorption, a pore size and area analyzer (Quantachrome NOVA 4200e, Quantachrome, Boynton Beach, FL, USA) was used. The specific area was obtained by using the BET method [43], while the pore volume, diameter, and distribution were determined by using the BJH method [44]. XRD was studied using the Bruker D2 Phaser equipment with Cu αK radiation, with a step size of 0.05°, time per step of 1.0 s, and a scanning range from 5° to 75° (2θ). FTIR was analyzed using the Perkin Elmer equipment (Frontier model) with an analysis region from 400 to 4000 cm−1, 16 scans, and a resolution of 4 cm−1, to visualize the change in functional group characteristics of the solid surface before and after adsorption.

2.3. Adsorption Experiments

An evaluation of the influence and prediction of optimal conditions for the adsorption parameters was conducted using a three-level Box–Behnken experimental design. The independent variables studied were pH, solid concentration, and contact time, while caffeine removal percentage and caffeine final concentration (CF) were selected as response functions. The independent factors were set at three levels, as indicated in Table 1, and their ranges were defined according to De Oliveira’s [45] study.
The adsorption tests were conducted in batch experiments using a Wagner shaker with 360° stirring in Schott glass flasks (250 mL capacity). Each experiment involved 100 mL of a caffeine solution with an initial concentration of 20 mg L−1. Following the designated contact time, the samples were filtered, and the concentration of the remaining caffeine solution was analyzed using a UV-Vis spectrophotometer (Pró-Análise model UV-1100, São Paulo, Brazil) at a wavelength of 273 nm. The caffeine removal percentage was calculated using Equation (1):
R e m o v a l   % = C 0 C F C 0 · 100 %
where C0 (mg L−1) is the initial CAF concentration and CF (mg L−1) is the residual CAF at contact time t.

2.4. Fenton Experiments

To evaluate the influence and predict the optimal conditions of Fenton variables for caffeine degradation, an experimental design was developed based on the second-order response surface methodology. In the experimental design, the C0, the pH of the reaction medium of 3, and the room temperature were considered constant. The initial concentrations of Fe ions and H2O2 were considered independent parameters and were defined at three levels. The reagent concentration ranges, as shown in Table 2, were defined based on studies of pharmaceutical compound degradation [10,21,38,46,47,48]. The Fenton reaction was evaluated at 5, 15, 30, and 60 min.
Fenton experiments were conducted at room temperature in volumes of 0.5 L of a 20 mg L−1 caffeine solution. The homogenization of the reaction medium was carried out using a magnetic stirrer (New Lab NL 01-03 A). Initially, the pH of the caffeine solution was adjusted to 3, and then, a pre-defined amount of Fe+2 was added. Next, the required volume of H2O2 was added and the testing time began. After starting the reaction, aliquots of the solution were removed at 5, 15, 30, and 60 min. All aliquots removed from the solution were filtered through a 0.22 µm hydrophobic polytetrafluoroethylene (PTFE) membrane and sent to analysis by using a Carbon Analyzer (Shimadzu TOC-VCSH, São Paulo, Brazil) and High-Performance Liquid Chromatography (HPLC) (Agilent 1200 Infinity). The degradation percentage was calculated using Equation (2) and mineralization was calculated using Equation (3).
Degradation   ( % ) = 1 A H P L C F A H P L C 0 · 100
where A-HPLC0 and A-HPLCF are the values of the CAF areas in the chromatograms of the initial and final HPLC analysis, respectively.
Mineralization   ( % ) = 1 T O C F T O C 0 · 100
where TOC0 and TOCF are the initial and final CAF Total Organic Carbon values, respectively.

2.5. Combined Process: Adsorption and Fenton Reaction

The combined process consisted of initially carrying out batch adsorption under the optimal conditions of pH, adsorbent concentration, and contact time determined through the Box–Behnken design. After the adsorption was completed, the Fenton reaction began, adjusting the final system of the caffeine and GAC solution obtained in the adsorption process to the necessary conditions of the Fenton reaction. The first step to start the Fenton reaction was to adjust the pH of the final adsorption system to 3 and dose the optimal amounts of the reagents H2O2 and Fe+2 defined in the Fenton experimental design. The Fenton reaction time began to be counted after the addition of H2O2, and at the end of the combined process, the GAC was filtered and put in the drying oven at a temperature of 100 °C for at least 2 h to be used later in a new combined process. The caffeine solution resulting from the final filtration of the combined process was analyzed by HPLC and TOC.

Regeneration of Granular Activated Carbon

Furthermore, 4 cycles of the combined process were carried out aiming to evaluate the viability of GAC regeneration. The second, third, and fourth cycles were carried out with the same activated charcoal as the first cycle and with new caffeine solutions (20 mg L−1). The experiments were conducted in triplicate and the adsorbent regeneration efficiency (RE) was evaluated at the end of each cycle of the combined process through Equation (4).
RE   ( % ) = R n R 0 R 0 · 100
where Rn is the adsorption capacity after regeneration and R0 is the initial adsorption capacity.

3. Results and Discussion

3.1. CAF Adsorption onto GAC

The adsorption of caffeine onto GAC was studied individually to assess the potential of the technique and optimize it for subsequent application in the proposed combined process. The experimental tests and statistical analysis were based on the Box–Behnken design, enabling the determination of the optimal operating values for the following independent parameters: pH, adsorbent solid concentration, and contact time. The caffeine removal efficiency results obtained from the experimental tests based on the levels defined for the dependent and independent variables are shown in Table 3.
According to Table 3, the final caffeine concentration in the tests ranged from 1.29 to 19.12 mg L−1, with caffeine removal rates varying between 2.48% and 93.40%. The responses from the three central points showed minimal variation, indicating a high level of repeatability in the process. Consequently, mathematical models predicting the experimental results were calculated. The second-order models that correlate caffeine removal and CF as a function of the independent variables are presented in Equations (5) and (6), displaying the model in terms of coded variables.
RCAF (%) = −0.315 + 0.004 x − 0.001 x2 + 1.511 y − 0.832 y2 + 0.010 z − 4.974 × 10⁻⁵ z2 − 0.012 xy + 6.068 × 10⁻⁵ xz + 0.002 yz
CF = 25.792 − 0.067 x + 0.010 x2 − 29.637 y + 16.309 y2 − 0.197 z + 0.001 z2 + 0.228 xy − 0.001 yz − 0.030 yz
where “RCAF” is the caffeine removal percentage, CF is the final caffeine concentration, “x” is the pH, “y” is the adsorbent dosage in g L−1, and “z” is the contact time in minutes.
The significance of variables, interactions, and quadratic effects was assessed using variance analysis (ANOVA). This statistical analysis was performed to verify the difference in distribution between measurements, ensure that adjustment errors are independent and normally distributed, and thus guarantee the applicability of the proposed mathematical models. Table 4 presents the results obtained, where SS represents the sum of squares, DF indicates the degree of freedom, and MS denotes the mean squares.
The results of the statistical analysis revealed that the linear and quadratic terms associated with contact time and adsorbent dosage are statistically significant at a 5% level of significance, evidenced by the low p-values (0.0004, 0.0186, 0.0005, and 0.0279), all below 0.05. In contrast, the other variables do not present statistical significance (p-value > 0.05) and, therefore, do not exert a significant influence on the caffeine adsorption process on granular activated carbon. The importance of these parameters is corroborated by the F-values, where values higher than Fcalc indicate significant effects. The Fcalc for the model is 2.77, lower than the values of 69.01, 11.78, 63.67, and 9.40 for the parameters of linear and quadratic adsorbent dosage and linear and quadratic contact time, respectively. Furthermore, the effects of pH and the interaction of independent variables are not statistically significant, as evidenced by F-values lower than Fcalc. So, as pH did not influence the system, it is possible to define the most viable pH to work in caffeine removal—in this case, the natural pH.
An analysis of residual values was conducted, demonstrating their independence and adherence to a normal distribution, thereby validating the predicted model. The variance percentage obtained for the adjustment was 96.85%, and therefore, it was possible to conclude that the predicted model satisfied the experimental data obtained and can be used to plot and analyze the behavior of the independent variables for caffeine removal through response surfaces, as shown in Figure 1.
The response surface plots illustrate that an increase in adsorbent dosage results in a reduction in caffeine CF, indicating better effectiveness in removing the contaminant. Adsorbent dosages approaching the upper limit of 10 g L−1 indicate the system’s saturation point, suggesting that beyond this adsorbent concentration, the caffeine removal efficiency could remain stable. A longer contact time also results in higher removal rates, up to reaching the maximum adsorption capacity of the system. There is a nonlinear correlation between removal and contact time, particularly within the initial 60 min, which could be attributed to the abundant availability of active sites on the adsorbent surface at the onset of the process. The pH exhibited negligible impact within the studied conditions, likely due to the high pKa of caffeine (10.4), favoring adsorption across the evaluated pH range (3 to 11). Moreover, the GAC pHPCZ of 7.36 suggests a positively charged solid surface at lower pH values, which facilitates the adsorption of molecules such as caffeine, where the protonated form predominates when pH is lower than pKa (10.4) [7,49].
Critical values derived from the experimental planning (presented in Table 5) reveal that the optimal adsorbent concentration peaks at the upper limit of 10 g L−1, the ideal contact time stands at 116 min, and the optimal solution pH is natural. These outcomes align with prior studies [20,40,45,50,51], revealing the independent variables for the Fenton reaction, validating the successful optimization of adsorption parameters across diverse experimental conditions using the Box–Behnken design.

3.2. CAF Degradation by Fenton Process

The analysis of the Fenton technique specifically for caffeine degradation was conducted to explore its potential and enhance the method for future use in combined processes. This investigation assessed caffeine degradation in an aqueous solution using batch Fenton reaction experiments, varying the concentrations of H2O2 and Fe+2 at three levels (independent variables). The tests were analyzed using the response surface methodology, focusing on the response variables of CF and caffeine degradation.
The Fenton reaction uses H2O2 and iron ions as catalysts to generate reactive oxygen species that oxidize organic and inorganic compounds. The reaction mechanism (Equations (7)–(15) [30]) illustrates the oxidation of iron ions and the production of the desired hydroxyl radicals. Optimal conditions for the radical reactions include an acidic environment (pH below 3) to prevent iron precipitation and maintain catalyst activity, adequate concentrations of hydrogen peroxide to sustain radical formation, and controlled temperature and reaction time to enhance reaction rates. However, hydroxyl radicals can be eliminated by various means. The regeneration of iron ions indicates a cyclic mechanism, where iron acts as a catalyst. Equations (8)–(11) limit the reaction speed by consuming hydrogen peroxide and regenerating iron ions, while Equations (12)–(15) involve radical reactions.
Fe+2 + H2O2 → Fe+3 + OH + ·OH
Fe+3 + H2O2 → Fe+2 + ·O2H + H+
Fe+2 + ·OH → Fe+3 + OH
Fe+2 + ·O2H → Fe+3 + OH2
Fe+3 + ·O2H → Fe+2 + O2 + H+
·OH + ·OH → H2O2
·OH + H2O2·O2H + H2O
·O2H + ·O2H → H2O2 + O2
·OH + ·O2H → H2O + O2
Typically, an increase in Fenton reaction duration led to higher rates of caffeine degradation. Table 6 details the CF and caffeine degradation results obtained through Fenton reactions for different concentrations of H2O2 and Fe+2. The maximum degradation achieved was 98.92% in 60 min under conditions of 150 mg L−1 of H2O2 and 4 mg L−1 of FeSO4·7H2O.
This optimization was crucial to determine the maximum possible efficiency of caffeine degradation within the studied concentration ranges. Strategically, time points of 5 and 60 min were chosen for statistical analysis. Despite the lower degradation efficiency observed in 5 min intervals, the combination with the adsorption process could potentially yield efficiency akin to that achieved in 60 min Fenton reactions. The attractiveness of the 5 min duration lies in its reduced resource demands, rendering the proposed practice more economically viable. Conversely, the 60 min duration provides insights into the reaction’s steady state. Analysis of the results at 15 and 30 min intervals exhibited fluctuations influenced by experimental noise. Therefore, focusing on the analysis of 5 and 60 min durations ensured a more robust and reliable interpretation of the data.
The CF of caffeine ranged from 0.21 to 7.82 mg L−1, while caffeine degradation ranged from 58.72% to 98.92%. The second-order models that relate caffeine degradation and caffeine CF as a function of the independent variables for the Fenton reaction times of 5 and 60 min are presented in Equations (16)–(19).
DCAF (5 min) = 0.365 + 0.007 x − 2.070−05 x2 + 0.142 y − 0.006 y2 − 0.001 xy
DCAF (60 min) = 0.358 + 0.007 x − 2.027−05 x2 + 0.206 y − 0.020 y2 − 0.001 xy
CF (5 min) = 12.032 − 0.129 x + 0.0004 x2 − 2.696 y + 0.110 y2 + 0.021 xy
CF (60 min) = 12.153 − 0.127 x + 0.0004 x2 − 3.892 y + 0.381 y2 + 0.016 xy
where “DCAF” is the caffeine degradation, “x” is the H2O2 concentration, and “y” is the FeSO4·7H2O concentration.
The regression coefficients of the models indicate a remarkable similarity in the reactions at both 5 and 60 min intervals. The significance of variables, interactions, and quadratic effects was assessed using ANOVA. Table 7 and Table 8 showcase the results obtained specifically for reaction times of 5 and 60 min, respectively.
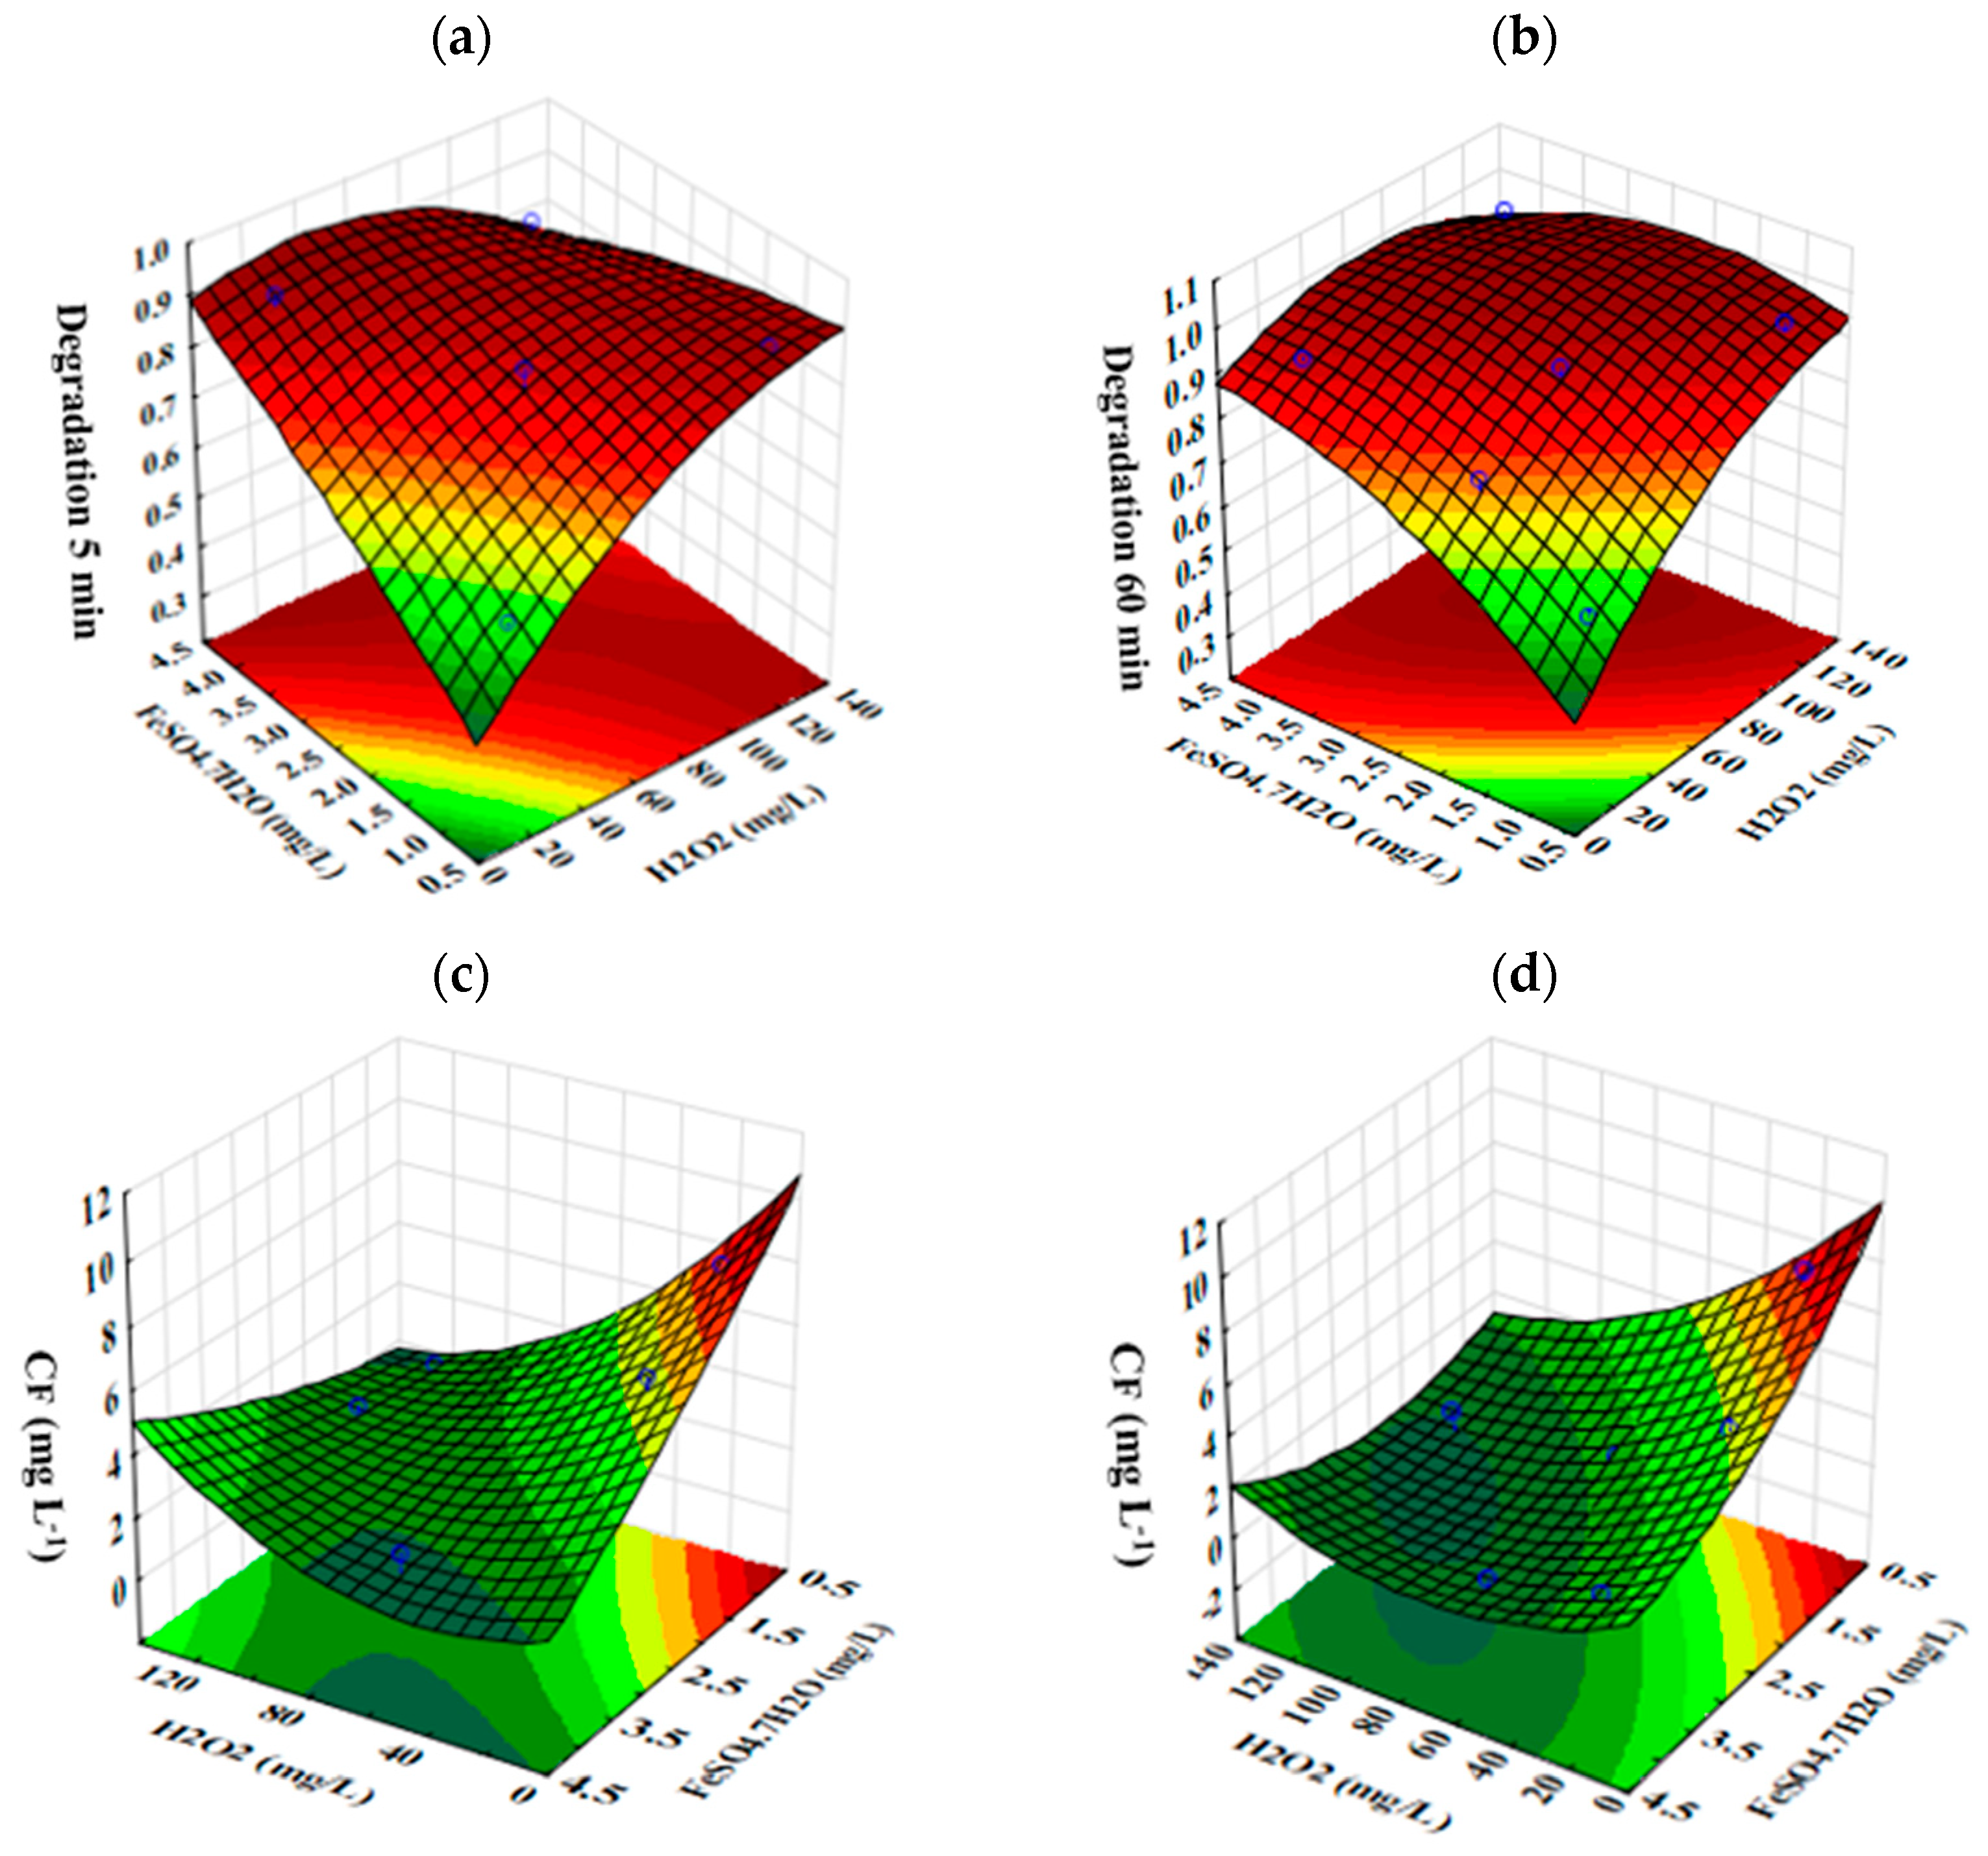
According to Table 8, the interaction term between the concentrations of H2O2 and FeSO4·7H2O is statistically significant (p-value < 0.05), indicating a significant influence on the caffeine degradation process in the Fenton reaction. This result is corroborated by the F-values, with the calculated F-value being 15.70, only lower than the value corresponding to the interaction term. The linear and quadratic effects of the other variables are not statistically significant. Likewise, in Table 9, the linear term of H2O2 concentration is statistically significant within 60 min of the Fenton reaction, evidenced by the p-value < 0.05 and calculated F-value of 15.90, inferior only to the term corresponding to this concentration. The other variables do not demonstrate a significant influence, as their F-values are lower than Fcalc. Residual analysis indicated an independent random distribution and normality. The models adjusted for Fenton reaction times of 5 and 60 min presented an R2 of 96.21% and 96.64%, respectively, indicating a good adaptation to the experimental data. This allows for effective analysis of the independent variables for caffeine degradation through response surfaces and contour curves, as demonstrated in Figure 2.
Both response surfaces exhibited similar behaviors, indicating that the simultaneous increase in the dosage of H2O2 and FeSO4·7H2O results in greater caffeine degradation, favoring the formation of hydroxyl radicals. In that regard, it is important to emphasize that in the proposed data model for 5 min of Fenton reactions, the interaction term for H2O2 and FeSO4·7H2O was statistically significant, and in the data model for 60 min of reactions, the H2O2 concentration term was significant. These variables obtained p-values very close to 0.05 in the two proposed models and therefore were considered significant in both cases. The high percentage of degradation in 5 min is due to the predominance of caffeine oxidation, but the subsequent drop indicates a decrease in the degradation rate. The rapid degradation kinetics are consistent with studies on the Fenton process. The concentration ranges chosen were satisfactory, not harming the degradation reaction. Table 9 shows the critical values of the experimental design, indicating the optimal points for the independent parameters studied. The optimized concentrations were used in the combined process experiments for times of 5 and 60 min.
The present work achieved satisfactory degradation efficiencies compared to previous studies, particularly due to the optimization of parameters. For instance, De Oliveira et al. [52] achieved 95% degradation of the caffeine molecule using Fenton’s reagent, García-Negueroles et al. [53] obtained a maximum degradation efficiency of approximately 80%, while Posser [47] achieved only 9.3% degradation under optimal conditions.
Similarly to what is found in the literature, the conducted tests showed inefficiency in mineralization, with rates not exceeding 5%. In AOPs, contaminant degradation involves sequential reactions initiated (Equations (20)–(22)) by radicals attacking organic compounds [40]. The hydroxyl radical operates in three stages, eliminating hydrogen, reacting with the compound, and creating intermediates until complete mineralization. Therefore, AOP efficiency encompasses total mineralization, preventing critical residue by destroying contaminants and their byproducts [40]. An evaluation of its effectiveness involves complete oxidation, yielding CO2, water, and minerals. Partial mineralization might produce harmful byproducts, requiring post-treatment before discharge into water bodies [39]. Since AOPs can transform pollutants into simpler species easily degraded by common technologies [54], there is an imperative to upgrade water treatment plants with additional tertiary treatment technologies to address pollutants resistant to conventional methods.
RH + ·OH → H2O + ·R
H2O2 + ·R → Byproduct
·OH + Byproduct → H2O + CO2 + Minerals
Hence, the specific investigation of the Fenton reaction in this study revealed the incomplete degradation of caffeine and its intermediate byproducts, resulting in the production of secondary residues that require characterization to comprehend their potential risks. This limitation is evident in the HPLC chromatograms depicted in Figure 3. The reaction intermediates were detected in the first 5 min of the reaction and their amount in the solution increased until the end of the 60 min of the reaction. This result shows that caffeine degradation generates persistent organic intermediates resistant to oxidation. Similar chromatograms to those found in this study were observed by Ubillus [55].
Figure 3 illustrates that under the investigated conditions, there is degradation of the contaminant, resulting in the formation of smaller-chain molecules with lower molecular weights and retention times of less than 7 min. To prevent the creation of potentially hazardous secondary waste, pursuing mineralization becomes crucial. Byproducts formed in this process might possess greater toxicity compared to the original molecules [39]. The rate at which hydroxyl radicals are generated relies on the oxidative potential of the procedure, directly impacted by the reaction rate outlined in Equation (1).
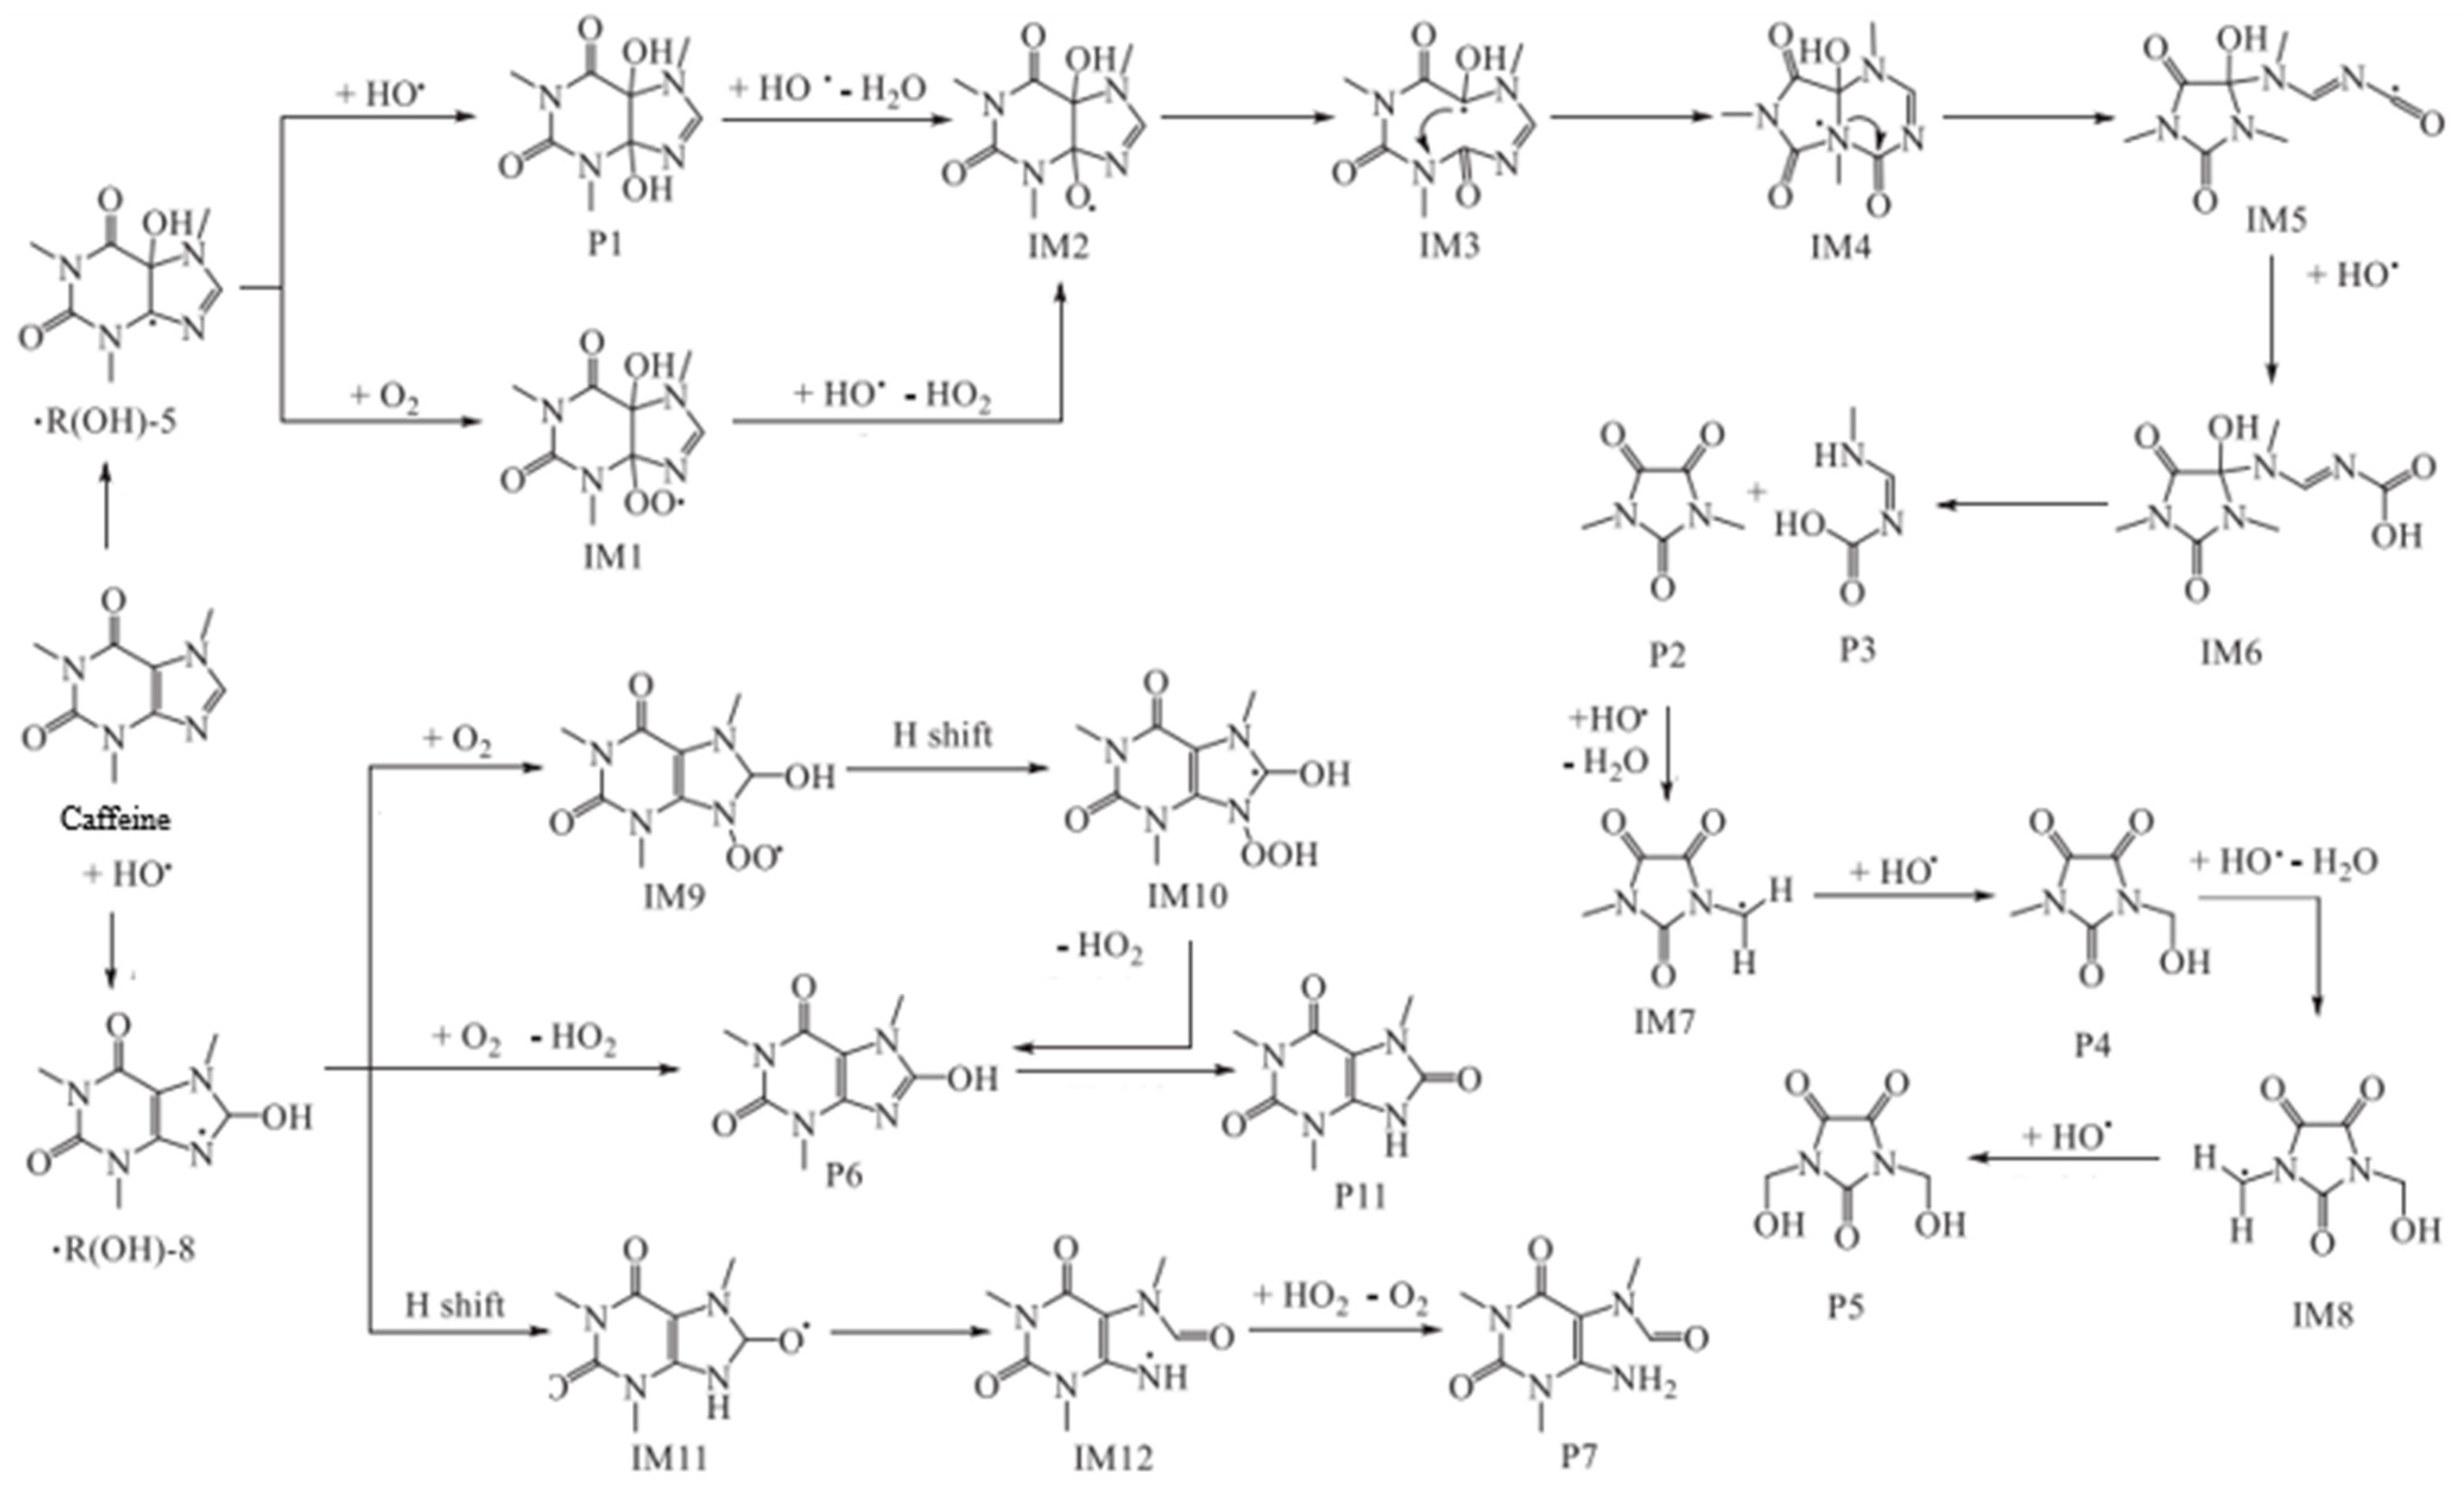
Identifying the byproducts formed during caffeine degradation is a complex process requiring focused research using analytical chemistry techniques like chromatography coupled with mass spectrometry. In this study, previous works by DALMÁZIO et al. [36], DE OLIVEIRA et al. [52], LI et al. [37], ROSAL et al. [56], and ZIYLAN-YAVAS et al. [57] provided insights into potential caffeine degradation pathways. DALMÁZIO et al. [36] reported reaction intermediates from caffeine oxidation under Fenton reaction conditions (H2O2/FeSO4·7H2O = 1/15 mol L−1). LI et al. [37] proposed a theoretical computational mechanism for caffeine degradation by •OH which closely resembled the pathway described by DALMÁZIO et al. [36]. Overall, these studies indicate that caffeine oxidation by the Fenton reaction generates persistent organic intermediates more resistant to oxidation compared to caffeine itself. Figure 4 depicts the theoretical degradation pathway of caffeine developed by LI et al. [37], specific to degradation by the hydroxyl radical. According to this figure, caffeine degradation by •OH begins at the imidazole portion, with the radical primarily targeting the C=C (degradation route •R(OH)-5) of caffeine and, to a lesser extent, the C8 (degradation route •R(OH)-8) [36,37,56].
Two pathways are illustrated for caffeine degradation. The first pathway (•R(OH)-5) demonstrates the hydroxyl radical transforming into P1, the 5,6-dihydroxyl of caffeine, which further reacts to form the intermediate IM2 and results in the production of dimethylparabanic acid (P2) and di(N-hydroxymethyl) parabanic acid (P5). The second pathway (•R(OH)-8) shows reactions yielding 1,3,7-trimethyluric acid (P6), 6-amino-5-(N-formylmethylamino)-1,3-dimethyluracil (P7), and 8-oxocaffeine (P11). These products are formed through distinct reactions involving hydrogen atom abstraction, displacement, and bond cleavage. Studies by LI et al. [37] highlighted the ecotoxicity of caffeine and its degradation products, indicating chronic toxicity to fish, acute and chronic harm to daphnia, severe acute and chronic toxicity to green algae, and non-hazardous effects on rats. DE OLIVEIRA et al. [52] found that lower concentrations of the solution obtained from Fenton-treated caffeine showed no chronic toxicity to zooplankton, but higher concentrations exhibited chronic toxicity.
Despite this, the hydroxyl radicals formed in the study were inefficient in degrading the byproducts as well, hindering effective solution mineralization. Persistent organic intermediates less prone to oxidation than caffeine were identified, suggesting the need for additional approaches. In this context, the combination of the Fenton process with adsorption can increase the generation of radicals and/or help reduce TOC. The integration of these methods can decrease the duration of treating contaminated water and aid in regenerating the adsorbent, resulting in a more sustainable and economically feasible process when compared to alternative treatment methods.

3.3. Combined Process

3.3.1. Caffeine Removal and Degradation Efficiency

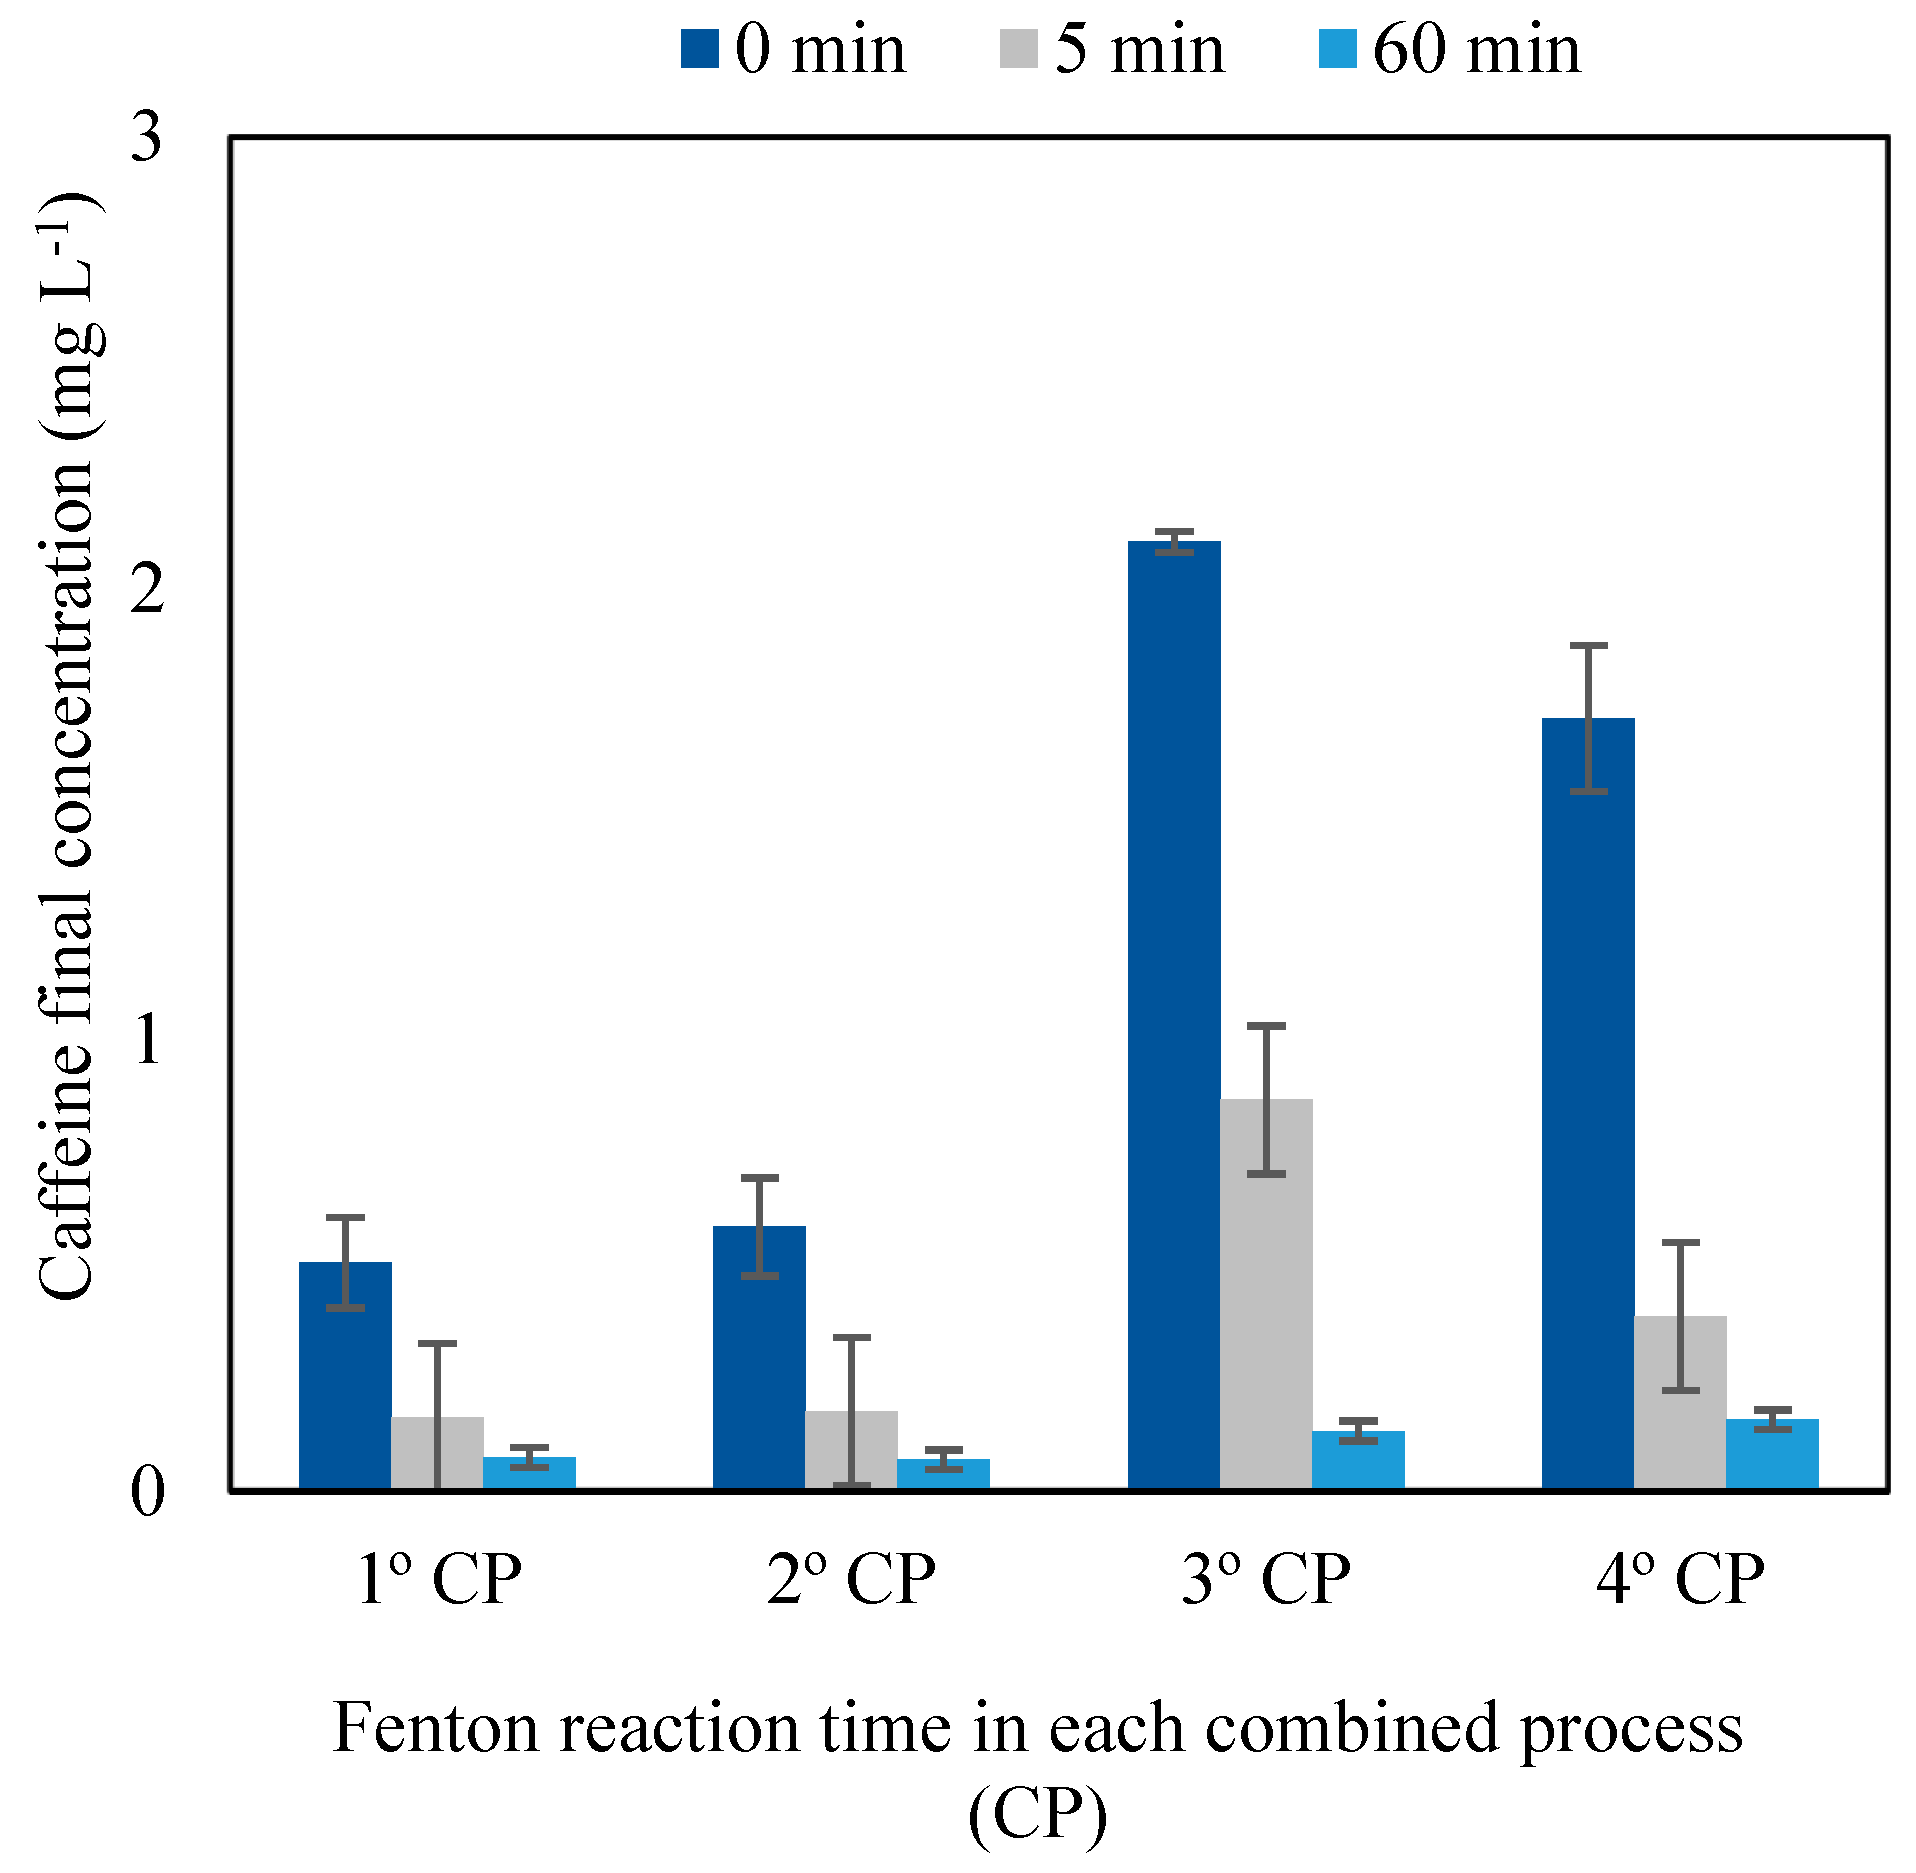
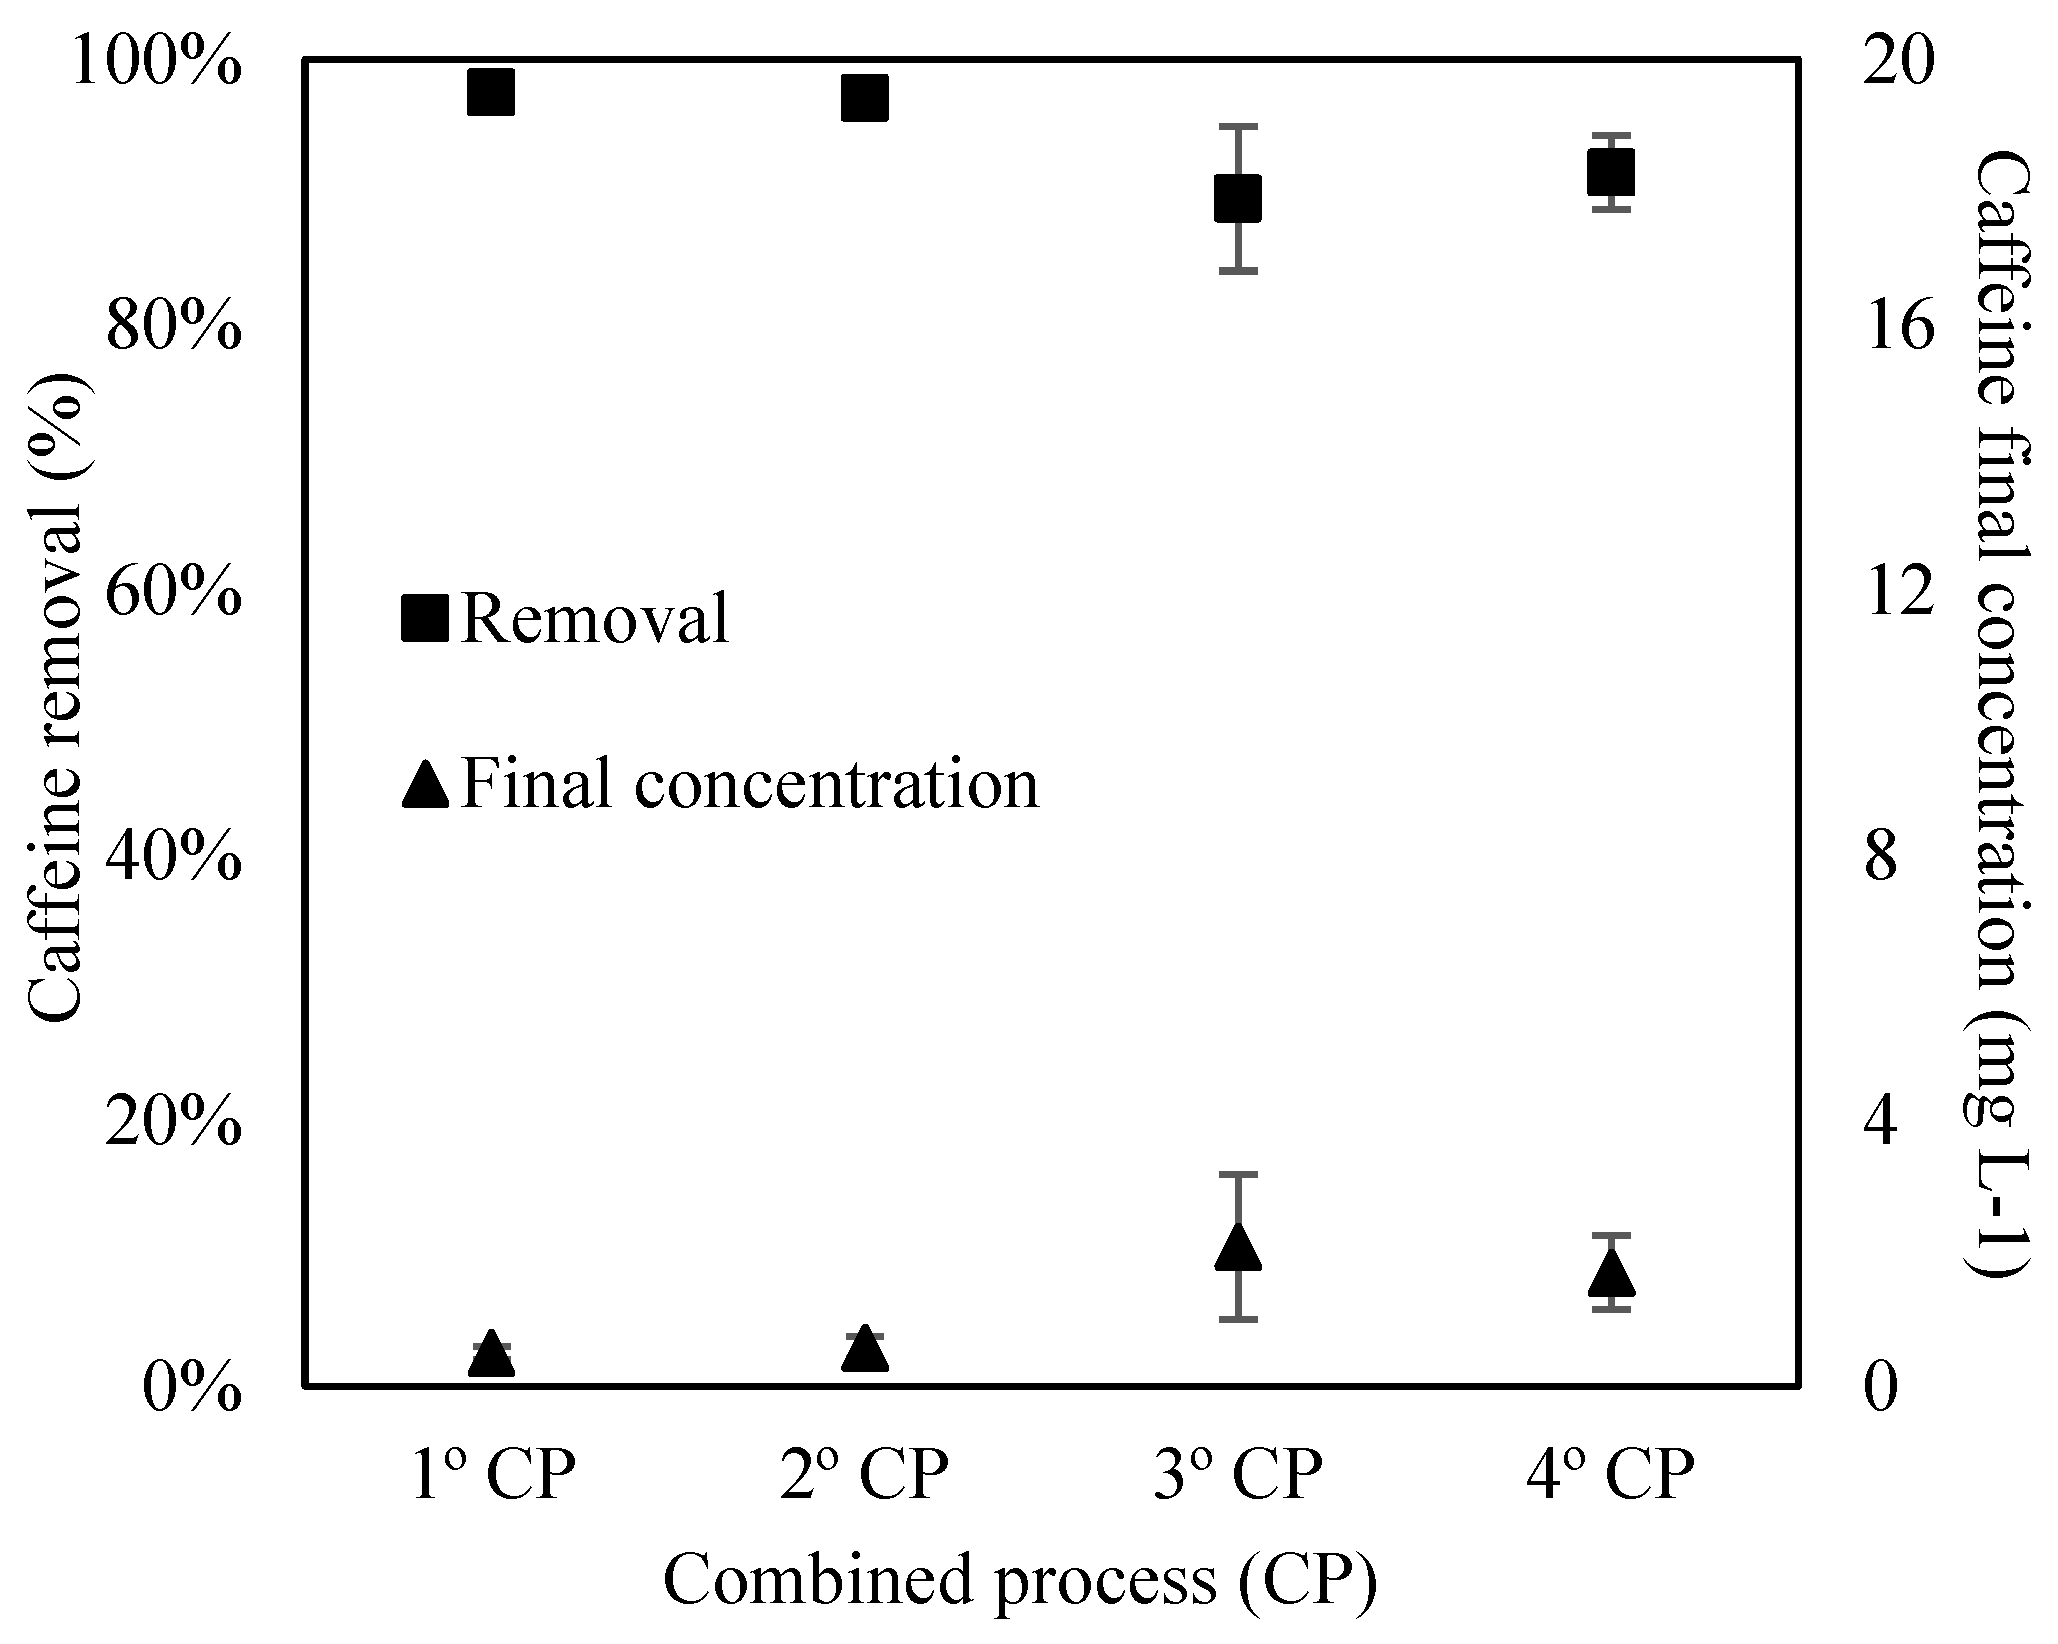
The caffeine removal and degradation efficiency were evaluated through combined process (CP) cycles. It is important to highlight that the initial caffeine concentration of 20 mg L−1 was chosen with the objective of simulating the amount of caffeine existing in real effluents [58,59]. Figure 5 indicates the caffeine removal and degradation values, and Figure 6 illustrates the caffeine CF values obtained throughout the four CP cycles for the three different Fenton reaction times evaluated: 0 min (end of adsorption), 5 min, and 60 min. Average error bars are identified in each column.
In the analysis of the combined adsorption and Fenton reaction process, the effectiveness of caffeine removal by adsorption remained high in the four cycles, ranging from 89.5% to 97.5%. The application of the Fenton reaction after adsorption proved to be crucial to degrade the residual caffeine in the solution, achieving additional removals of 95.7% to 99.2% in 5 min of the reaction and 95.3% to 99.6% in 60 min of the reaction, in subsequent cycles. The choice between Fenton reaction times of 5 and 60 min must consider the final objectives, assessing the effectiveness in reducing the TOC of the solution and the regeneration capacity of the adsorbent. The results of the fourth cycle showed a degradation efficiency of 98.1% in 5 min and 98.2% in 60 min. DE OLIVEIRA et al. [52] degraded 95% of caffeine in the system with a molar ratio of 3:10 Fe+2/H2O2 and 30 min of the reaction. GARCÍA-NEGUEROLES et al. [53] obtained 70% degradation of caffeine within the first 10 min of the reaction using pH 5, 0.1 g L−1 of Fe+3, and 60 mg L−1 of H2O2. BRACAMONTES-RUELAS et al. [60] achieved nearly complete degradation of caffeine within a 60 min timeframe. As seen, other studies in the literature required longer reaction times to achieve maximum caffeine degradation, highlighting that the results obtained in this work are satisfactory and suggest a tertiary treatment with a shorter time period for caffeine removal.

3.3.2. Total Organic Carbon Monitoring

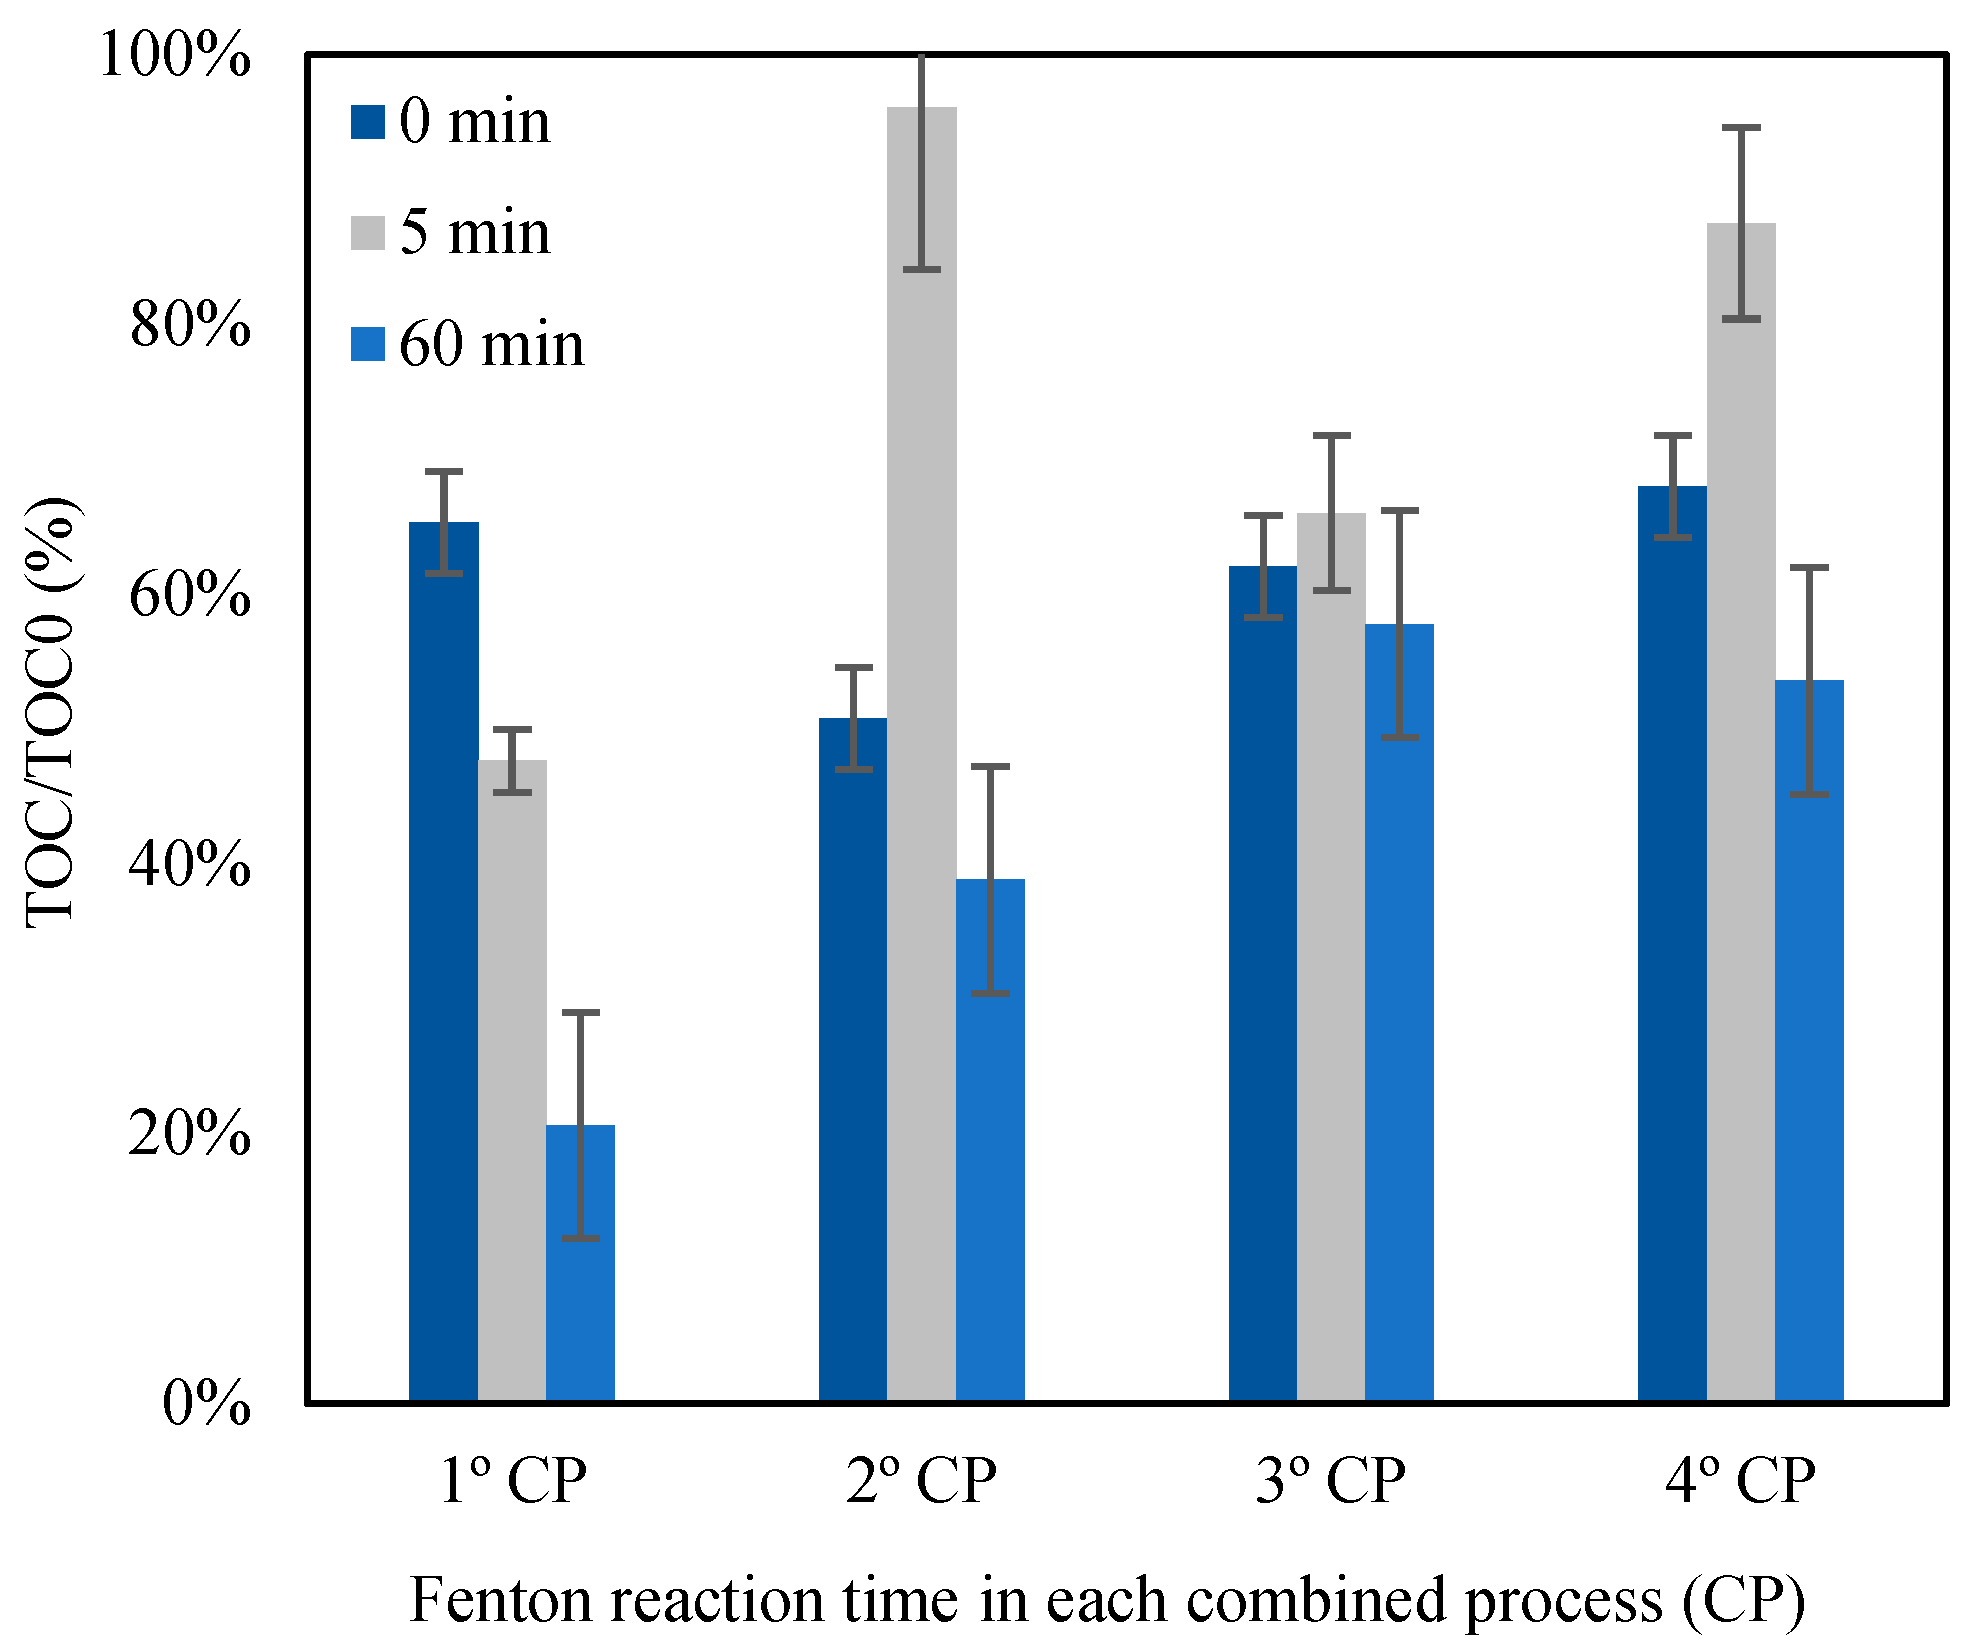
This study evaluated the TOC content in different phases of the CP, focusing on the ability of GAC to reduce TOC in the solution. Given the limited mineralization (5%) achieved in the individual Fenton study and considering the potential criticality of the byproducts formed, it was sought to integrate the Fenton reaction into the adsorption step with GAC. Figure 7 illustrates the reduction in TOC throughout the four combined processes, considering three Fenton reaction times: 0 min (end of adsorption), 5 min, and 60 min. The reduction was calculated in relation to the initial value of the caffeine solution (TOC0), which started with a concentration of 20 mg L−1 in each process. Average error bars are identified in each column.
Figure 7 reveals that at the end of adsorption, the TOC was reduced by more than 50% in the four CPs. However, this value suggests the desorption of organic compounds from the surface of the material into the solution, since the adsorption tests obtained more than 89% caffeine removal, and consequently, the TOC reduction should be greater. For the CPs with 5 min of the Fenton reaction, an increase in the TOC reduction is observed, except for the first, reaching a final reduction of more than 60%. The second combined process achieved a 96% reduction in TOC. These reductions do not necessarily indicate mineralization, but rather the adsorption of organic compounds onto the granular activated carbon. When extending the Fenton reaction time to 60 min, there was an increase in the TOC in the solution after 55 min of the reaction, associated with a decrease in oxidants and the depletion of active sites in the GAC. The results show greater effectiveness within 5 min of the Fenton reaction, followed by an accumulation of organic intermediates up to 60 min, reflecting a pattern of rapid initial degradation kinetics, in accordance with the literature [38,47,48,61]. At the end of the fourth CP, a reduction of 87% in TOC was achieved in 5 min of the reaction and 54% in 60 min, satisfactory values compared to the results in the literature for caffeine mineralization.
Trovó et al. [48] and Posser et al. [47] concluded that the application of the Fenton process was not effective for the mineralization of caffeine and the authors chose to couple UV radiation with the Fenton reaction. After combining UV radiation with the same previous experimental conditions of the Fenton reaction, they obtained mineralization efficiencies of 78% and 32%, respectively. The results of the Fenton reactions performed by the authors corroborated the behavior obtained in the present work when studying the Fenton reaction individually. Costa et al. [62] applied the ozonation process to study the mineralization of caffeine and obtained a maximum efficiency of 30.8%. The result obtained by the authors was very close to that previously obtained by Posser et al. [47] when coupling UV radiation with the Fenton reaction. In other words, the ozonation process for caffeine is more efficient than the Fenton technique alone, but still requires further research focusing on maximizing the mineralization of the pollutant. On the other hand, Ziylan-Yava et al. [57] studied the application of ultrasound (US) and UV radiation in combination with H2O2 and TiO2 according to the following four sequences: UV-H2O2, US/UV-H2O2, UV/TiO2, and US/UV/TiO2. The authors obtained mineralization efficiencies of 21.7%, 35.4%, 60%, and 66%, respectively. In other words, it was proven that H2O2 presented a lower mineralization efficiency, probably because it is not possible to produce strong oxidants during the entire reaction. However, TiO2 has a higher cost than H2O2.
Thus, it is possible to conclude that the TOC decay results obtained in the present work are satisfactory. The present work proposed the application of the Fenton technique combined with adsorption, which proved promising in reducing the level of total organic carbon in the final treated solution when compared to the results reported in the literature.

3.3.3. Regeneration Efficiency of Granular Activated Carbon

The regeneration capacity of GAC was evaluated by analyzing caffeine removal in the adsorption stages of the four CPs conducted in triplicate. The same GAC was used, undergoing filtration and drying after the Fenton reactions. Figure 8 shows the adsorption efficiency and final caffeine concentration in each combined process, with average error bars indicated for each response function.
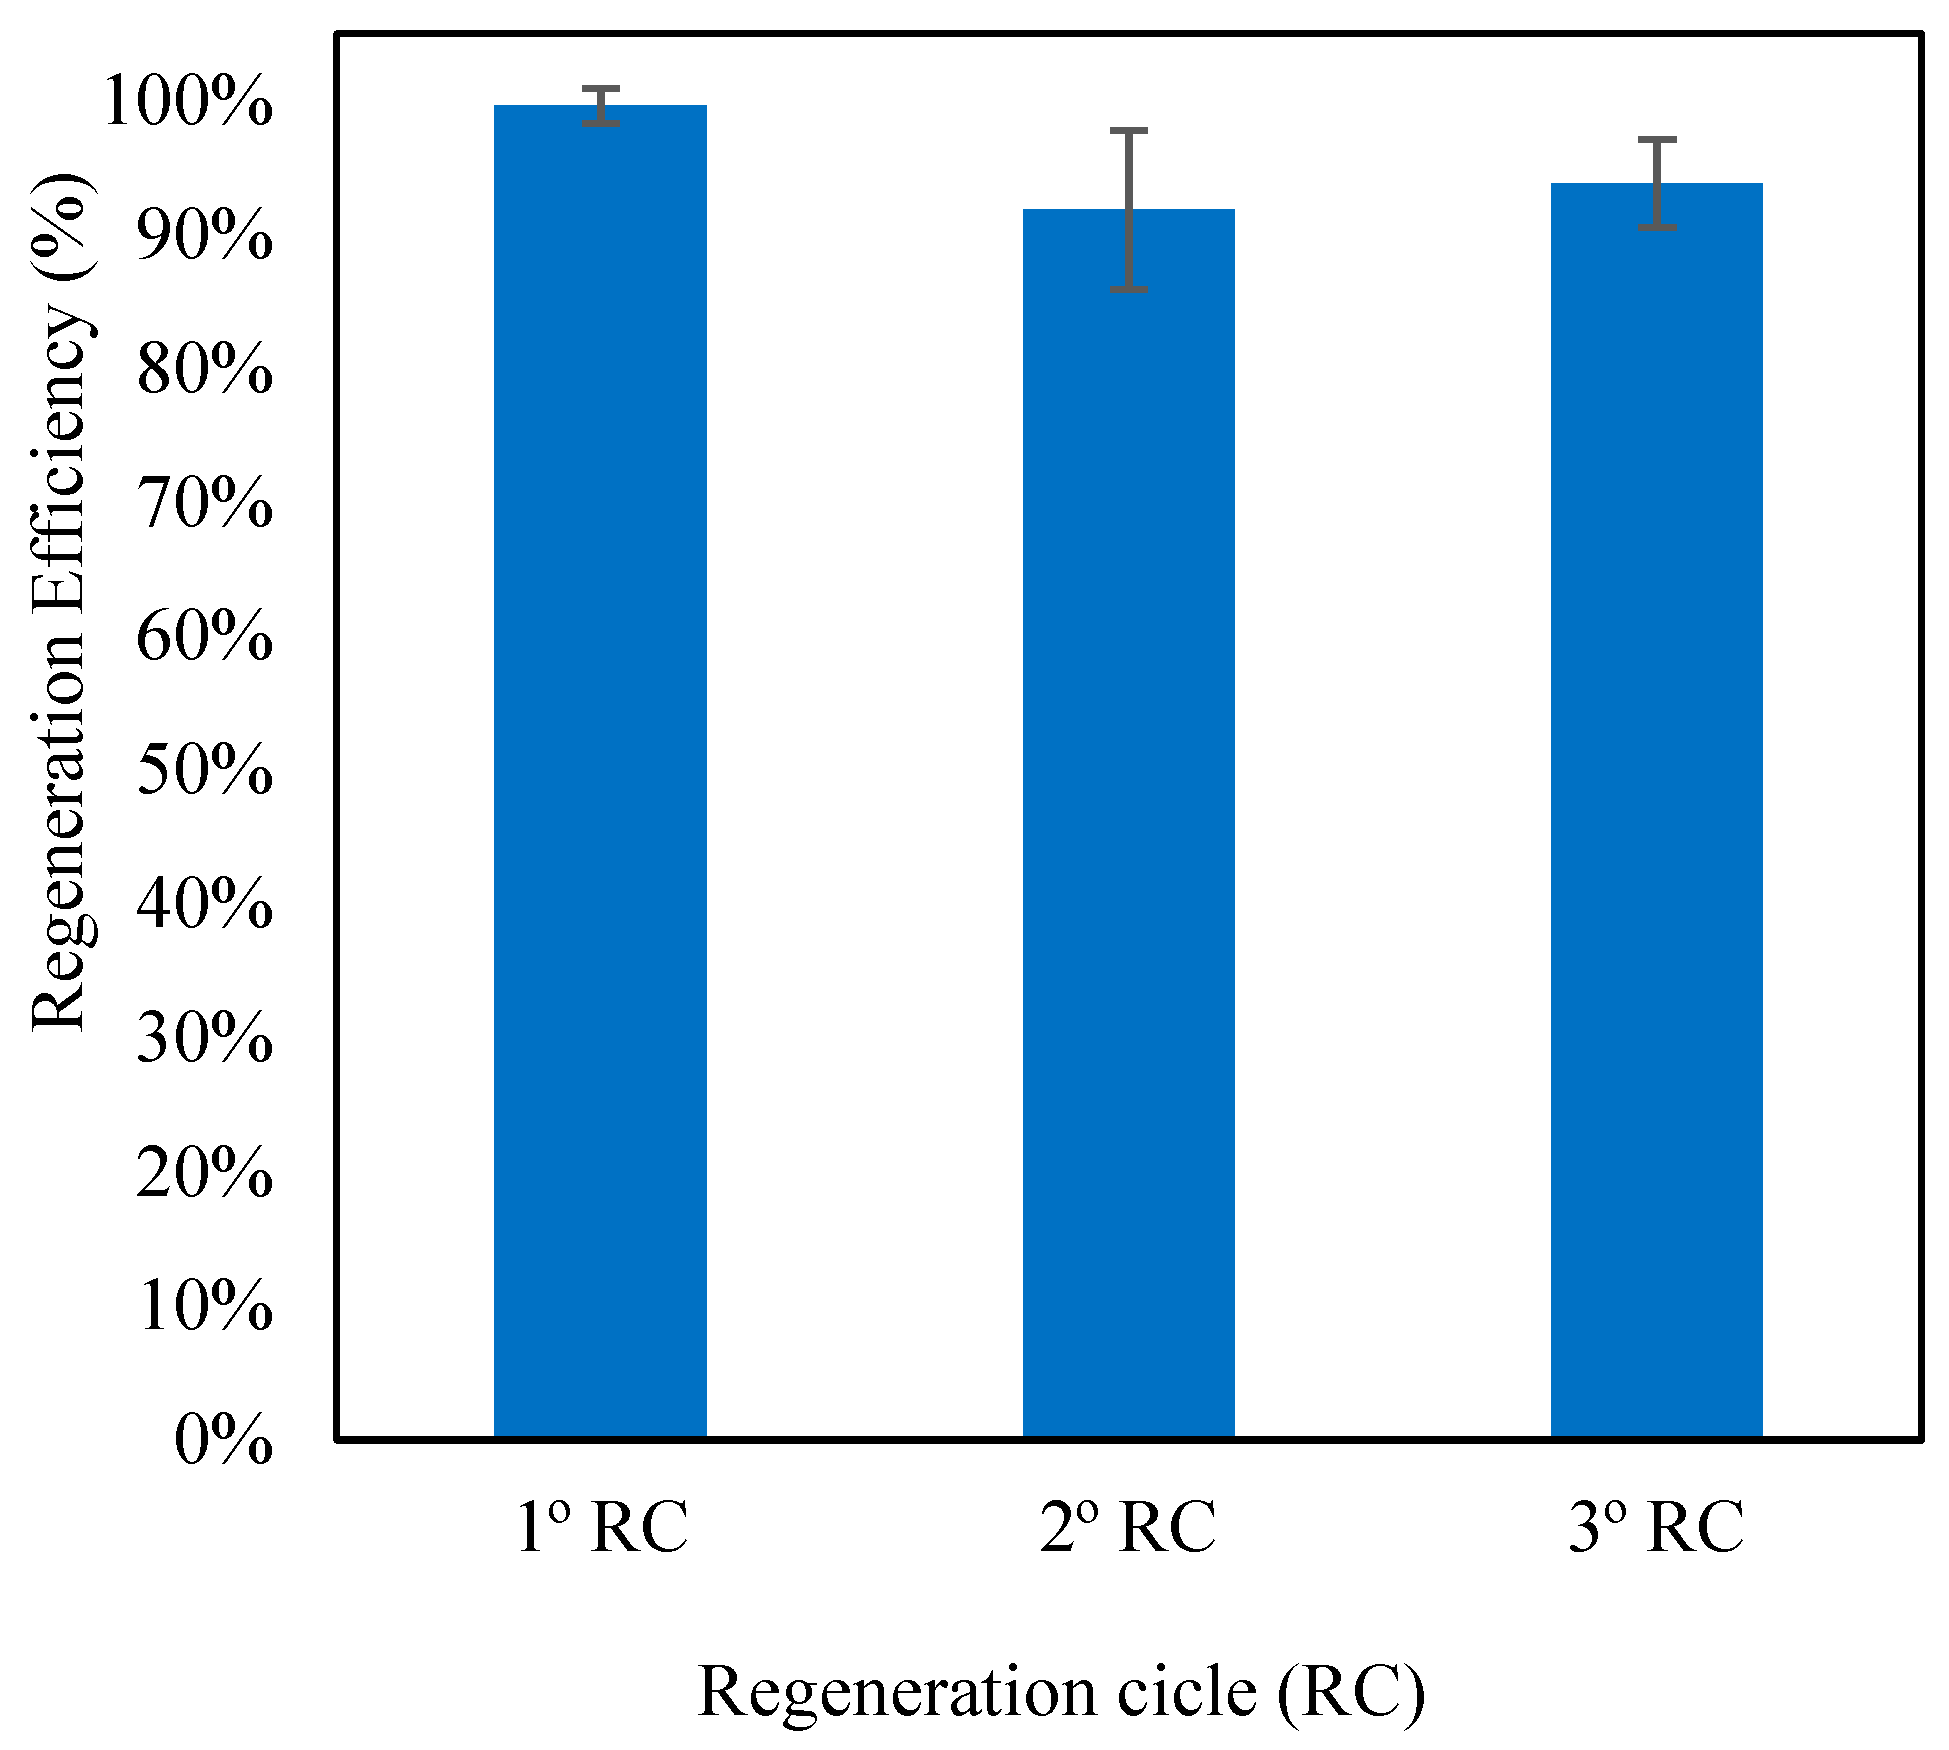
Figure 8 reveals consistently high efficiencies (>89%) in caffeine removal by activated carbon during the four adsorption cycles, resulting in low final caffeine concentrations (<2.1 mg L−1) in the solution. In the first adsorption step (first combined process, R0), the removal was approximately 97.5%, reducing to ~97.1% (second combined process) after the first regeneration. The second regeneration (second combined process) resulted in a reduction of only 7.8%, reaching an average of ~89.5% (third combined process). After the third regeneration, the solid adsorbent was able to adsorb ~91.5% of the 20 mg L−1 caffeine solution in the fourth combined process, an increase of 2% compared to the previous adsorption step. The adsorbent regeneration efficiency (ER) was calculated using the adsorption of the first combined process (97.5%) as reference (R0) and the values of the three subsequent processes as variables (R1, R2, and R3). Figure 9 illustrates the regeneration efficiencies for each cycle, with average error bars indicated for each curve.
Figure 9 shows the effectiveness of the combined process in the regeneration of GAC over three experimental cycles, reaching regeneration percentages of 99.6%, 91.8%, and 93.8%. The efficient regeneration is attributed to the ability of the Fenton reaction to degrade organic molecules on the GAC surface, keeping its textural characteristics unchanged. Studies in the literature, including Santos et al. [35], highlight the effectiveness of the oxidative mechanism of the Fenton reaction in the regeneration of GAC without significant structural changes, corroborating the results obtained in this work. The authors investigated the GAC regeneration in the adsorption of a model organic pollutant (methylene blue) using the Fenton reaction. The results revealed a maximum regeneration efficiency of 71% under the established conditions, which included a reaction period of 2 h, as well as concentrations of 500 mmol L−1 of H2O2 and 0.5 mmol L−1 of Fe+2. In the present study, a higher maximum regeneration efficiency (99.6%) was achieved compared to the study by Santos et al. [35] with a shorter Fenton reaction time (1 h), a 57.5% lower Fe+2 concentration (0.04 mmol L−1), and no significant alteration in pore diameter. The concentration of H2O2 was 574 mmol L−1, similar to that found by the authors. Although the pollutants compared here are different, the efficiency and potential of using the Fenton reaction as a regenerant for caffeine-saturated activated carbon are demonstrated by the high efficiency, short reaction time, and low reagent concentrations. An analysis of the works of De las Casas et al. [33], Muranaka et al. [34], and Chen et al. [32,63] reveals that the process proposed in this study achieves higher regeneration efficiencies in a shorter time, with low concentrations of reagents, highlighting the efficiency of the Fenton reaction in the regeneration of GAC saturated with caffeine.

3.4. Characterization of Solid Adsorbent

The proprieties of GAC as an adsorbent solid were determined and evaluated, as these parameters are essential for obtaining an efficient adsorption process. Figure 10 illustrates the N2 adsorption and desorption isotherm for GAC; the results show a behavior of type I isotherm, according to the International Union of Pure and Applied Chemistry (IUPAC) classification. This classification is characteristic of microporous solids with high selectivity. It was noticed that after adsorption and the combined processes, the solid maintained the isotherm with the same behavior; however, the volume of N2 adsorbed at the relative pressures was slightly different from the volume obtained for natural GAC. This difference in N2 volumes indicates that the specific values of textural characteristics changed throughout the three stages evaluated, as shown in Table 10.
After adsorption, the surface area of commercial GAC (534.415 m2/g) decreases to 483.715 m2/g. This suggests that the available active sites of GAC were filled by the caffeine molecules [62]. The GAC used has a pore size larger than the CAF size of 0.78 × 0.61 × 0.21 nm [64], which guaranteed the adsorption process. Studies on the removal of organic compounds have also reported high efficiencies when using GAC in the adsorption operation, with similar values for surface area [20,38,45,62,65,66] and for average pore diameter [20,62,66].
After the second cycle of the CP, the surface area increased to 531.059 m2 g−1, and after the fourth cycle, it reached 576.459 m2 g−1. These results highlight the role of the Fenton reaction as a regenerating agent for GAC, since in the second cycle, the surface area neared the one observed in natural GAC, and in the fourth cycle, it surpassed the initial surface area, indicating that the surface of activated carbon was oxidized by the Fenton reagent. Furthermore, the total pore volume of GAC after the second cycle of the combined process was 0.108 cm3 g−1, increasing to 0.139 cm3 g−1 after the fourth cycle. The average pore diameter was maintained in the microporosity range (less than 200 Å) in both cases, indicating that the GAC remains microporous.
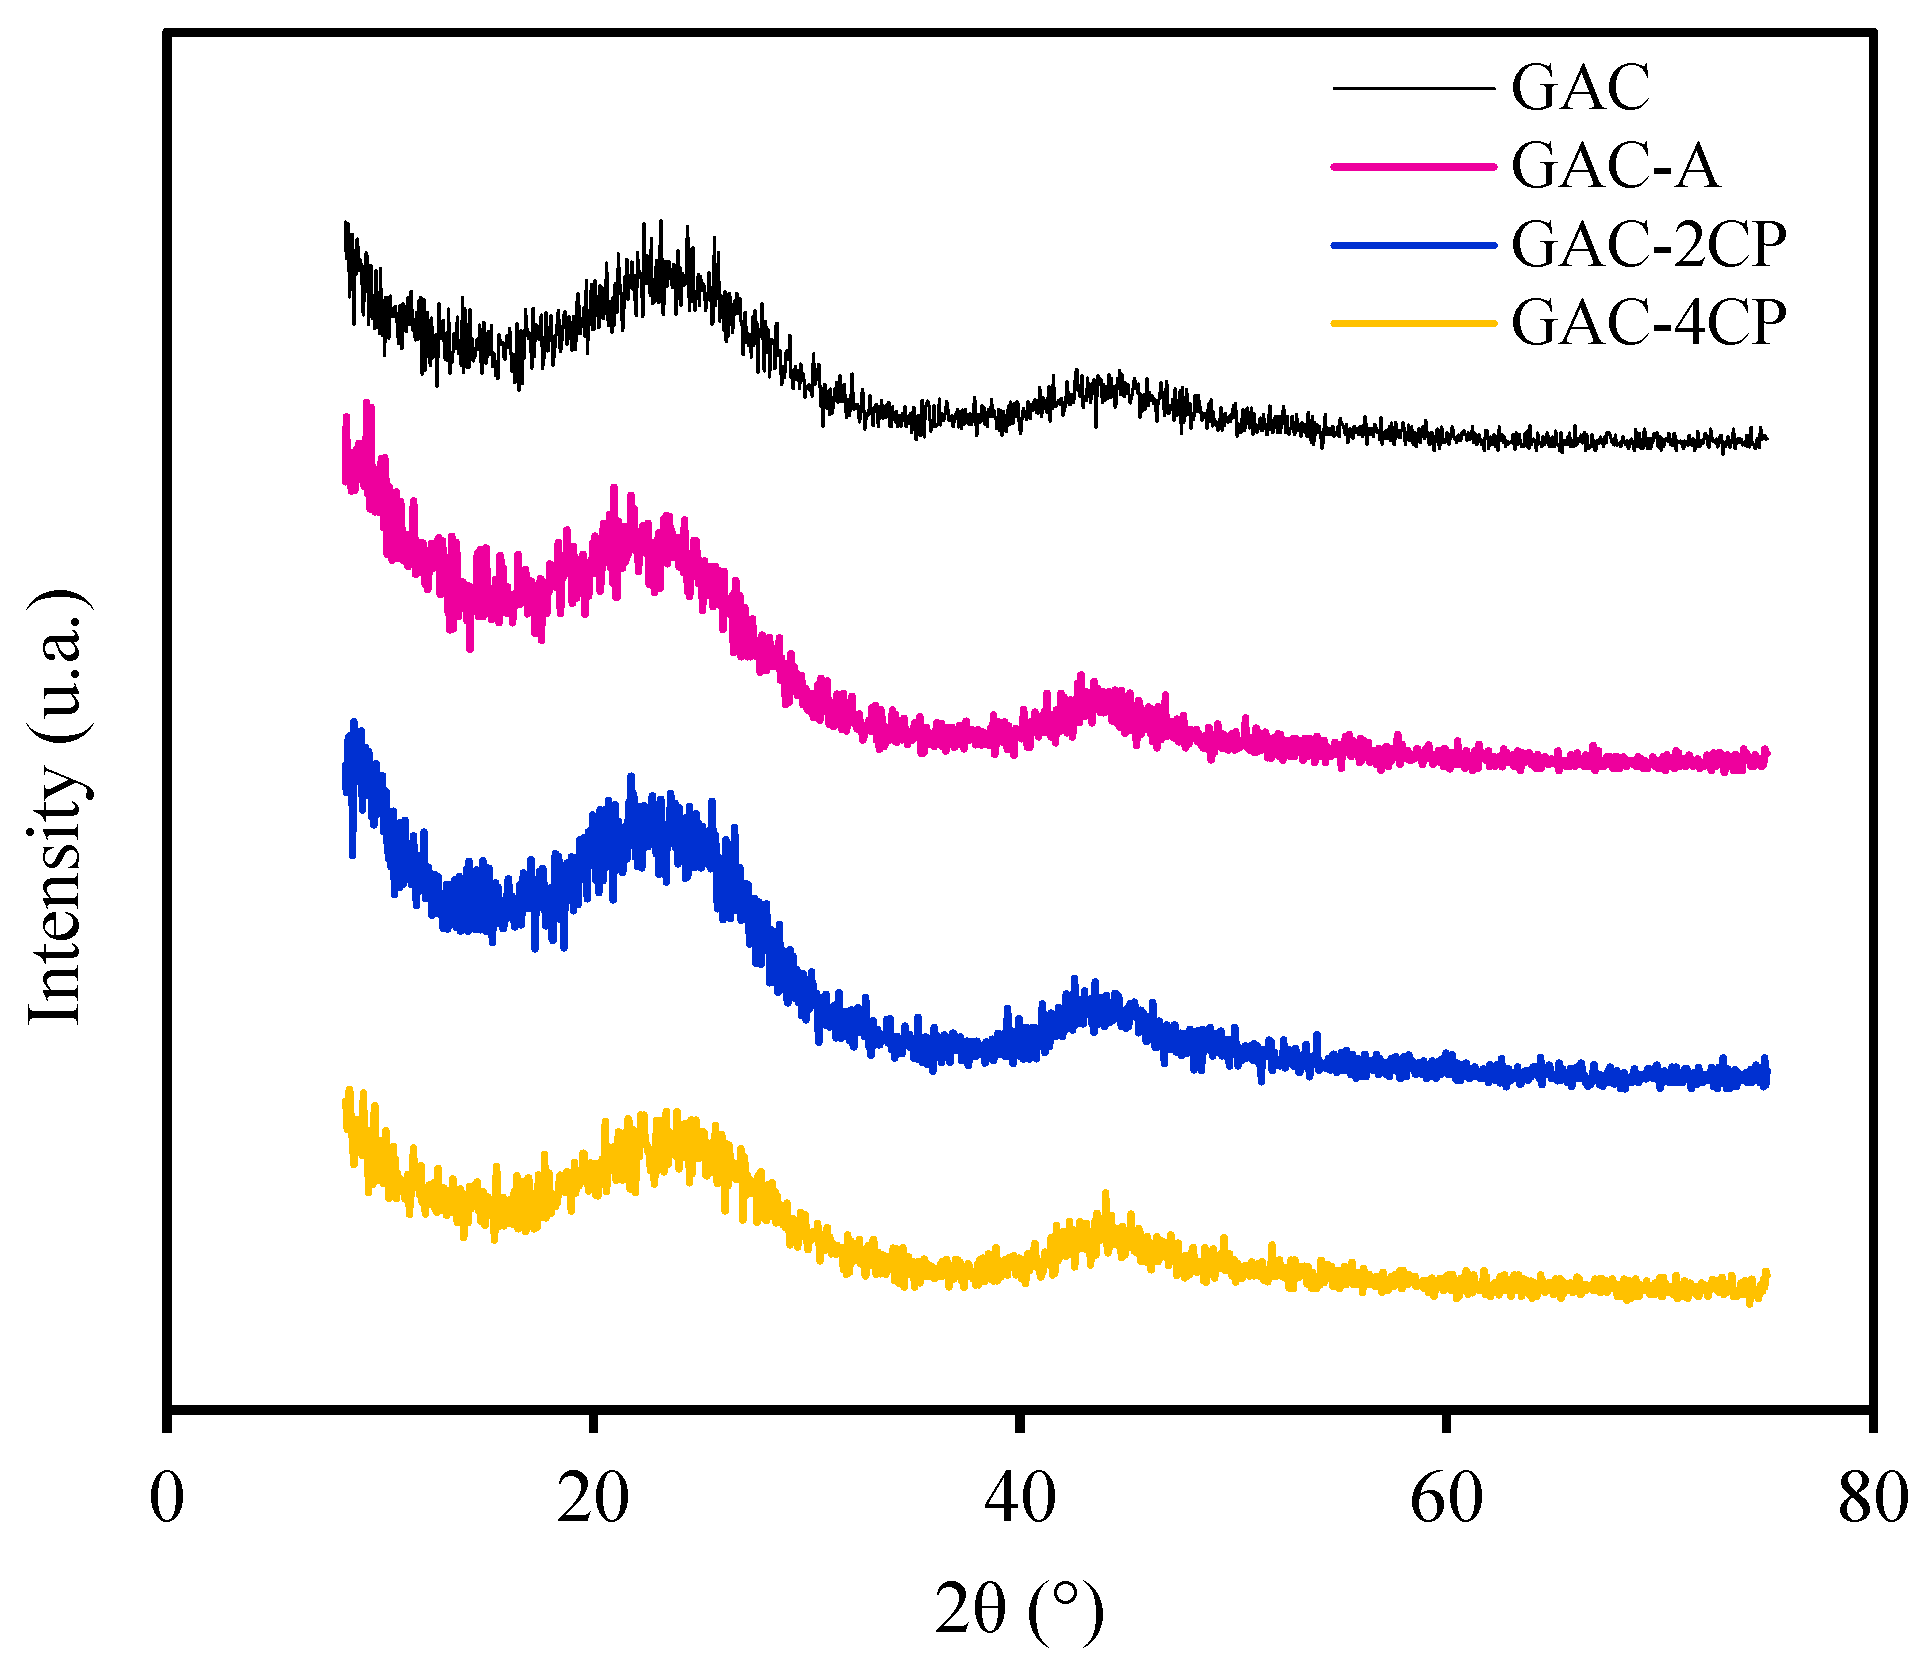
Figure 11 shows the XRD patterns corresponding to the solid samples analyzed. The pattern obtained for activated carbon before and after adsorption reflects the characteristic structure of activated carbons, with main reflections at approximately 25° and 45° [17,67,68]. The peak at 25° is typical of the structure of disordered aromatic carbons, while the peak at 45° is associated with the planes of the hexagonal structure of the graphite phase, evidencing the characteristic behavior of non-crystalline amorphous solids [63,67,68,69]. After adsorption and combined processes, the diffraction pattern of the GAC did not change significantly, but there were slight changes in the intensity of some signals, which can be attributed to the interaction between GAC and caffeine and between GAC and Fenton reagents. The absence of shifts in the basal spacings between the peaks indicates that the predominant interaction between caffeine and activated carbon occurred on the surface of the material [35,45,70].
The chemical composition of GAC was evaluated by the FTIR method and Figure 12 shows the peaks corresponding to certain vibrations of commercial GAC. There are three larger peaks between the ranges of 1200 and 1800 cm−1, with small changes at 765 cm−1, between the lengths of 2300 and 2500 cm−1, and between 2800 and 3000 cm−1. The peak at ~1250 cm−1 indicates the stretching of C–O in carboxylic acids, anhydrides, phenols, lactones, and ethers [63]. The peak at 1347 cm−1 is attributed to the hydroxyl -OH functional group [71]. Meanwhile, the peak at ~1750 is attributed to the stretching of the C=O bond in carboxylic acids, anhydrides, and lactones [63]. Regarding small changes, at 765 cm−1, the presence of amine groups (-NH) is suggested [71], at 2360 cm−1, carbonyl structures (C=O) are identified, and between 2850 and 2920 cm−1, there is stretching of aliphatic groups—methyl or methylene groups [72]. There were no substantial changes in the chemical composition of the GAC after the adsorption and combined processes. Therefore, it is concluded that the process of the adsorption and regeneration of caffeine with the solid adsorbent is predominantly physical, without causing significant changes in the fundamental chemical structure of the adsorbent, and thus, the Fenton reaction restores the adsorption capacity of the solid adsorbent.
Furthermore, the pHPCZ obtained for commercial GAC in this study was 7.36, as shown in Figure 13. In other words, at this pH, the net charge of the adsorbent is zero. For pH values lower than 7.36, the surface charge of GAC becomes positive and favors the adsorption of anions due to the higher concentration of hydronium ions in the solution. By comparison, for pH values greater than 7.36, the surface charge of GAC is negative and favors the adsorption of cations due to the higher concentration of hydroxyl ions in the solution [25]. Similar results for the pHPCZ were found by De Carvalho et al. [38] and De Oliveira [45] who used the same solid as our adsorbent, obtaining a pHPCZ equal to 7.35 and 8.04, respectively.

4. Conclusions

GAC, initially identified by its microporous nature, underwent a four-cycle process combining adsorption and the Fenton reaction for caffeine removal. The surface area of GAC increased post-Fenton reaction, signifying its efficacy as a regenerating process. Analyses of XRD and FTIR spectra affirmed the retention of the GAC structure, showcasing its capability to uphold textural attributes and functional groups throughout cycles.
Individual studies of adsorption and Fenton reactions revealed optimized parameters, yielding high caffeine removal rates. The combined process demonstrated efficiency in all four cycles, achieving substantial caffeine removal rates (average of 93.7%). Applying the Fenton reaction for 5 and 60 min enabled final degradation efficiencies of 99.2% and 99.6%, respectively, resulting in final caffeine concentrations of 0.2 mg/L and 0.07 mg/L, respectively. The reduction in TOC was significant, especially within 5 min of the Fenton reaction, showcasing its effectiveness in reducing TOC (96.1%, 66.0%, and 87.5% for the second, third, and fourth cycles). The GAC regeneration efficiency remained high, ranging from 91.8% to 99.6%, indicating the preservation of the solid’s textural characteristics.
In comparison to previous studies, the proposed method in this work excelled in efficiency, with shorter times and lower reagent concentrations during GAC regeneration. These promising outcomes, supported by numerical results, indicate the potential application of the combined process for treating water and effluents containing caffeine. However, ecotoxicity and solid disposal issues must be considered for future studies aiming to implement this approach on an industrial scale.

Author Contributions

Conceptualization, N.P.Z. and V.J.D.; Methodology, N.P.Z. and K.H.; Software, N.P.Z.; Validation, N.P.Z. and K.H.; Formal analysis, N.P.Z. and V.J.D.; Investigation, N.P.Z.; Resources, L.A.F.; Writing—original draft, N.P.Z.; Writing—review & editing, V.J.D., K.H. and L.A.F.; Supervision, V.J.D. and L.A.F.; Project administration, L.A.F.; Funding acquisition, L.A.F. All authors have read and agreed to the published version of the manuscript.

Funding

The authors thank the National Council of Technological and Scientifc Development (CNPq) and the Coordination for the Improvement of Higher Education Personnel (CAPES) of the Brazilian Government for the financial support granted to carry out this work.

Institutional Review Board Statement

Not applicable.

Informed Consent Statement

Not applicable.

Data Availability Statement

The original contributions presented in the study are included in the article, further inquiries can be directed to the corresponding author/s.

Conflicts of Interest

The authors declare no conflict of interest.

References

  1. Alhowail, A. Candidate mechanisms of caffeine improving memory dysfunction. Die Pharmazie 2019, 74, 705–710. [Google Scholar]
  2. Fiani, B.; Zhu, L.; Musch, B.L.; Briceno, S.; Andel, R.; Sadeq, N.; Ansari, A.Z. The neurophysiology of caffeine as a central nervous system stimulant and the resultant effects on cognitive function. Cureus J. Med. Sci. 2021, 13, e15032. [Google Scholar] [CrossRef]
  3. Lima-Silva, A.E.; Cristina-Souza, G.; Silva-Cavalcante, M.D.; Bertuzzi, R.; Bishop, D.J. Caffeine during high-intensity whole-body exercise: An integrative approach beyond the central nervous system. Nutrients 2021, 13, 2503. [Google Scholar] [CrossRef]
  4. Malviya, A.K.; Saranlal, A.M.; Mulchandani, M.; Gupta, A. Caffeine–Essentials for anesthesiologists: A narrative review. J. Anesthesiol. Clin. Pharmacol. 2023, 39, 528–538. [Google Scholar] [CrossRef] [PubMed]
  5. Camargo, M.A.F.; Camargo, C.A.C.M. Effects of caffeine on the organism—Literature. Open Access Lib. J. 2019, 6, 5265. [Google Scholar]
  6. Montagner, C.C.; Umbuzeiro, G.A.; Pasquini, C.; Jardim, W.F. Caffeine as an indicator of estrogenic activity in source water. Environ. Sci. Process. Impacts 2014, 16, 1866–1869. [Google Scholar] [CrossRef] [PubMed]
  7. Rigueto, C.V.T.; Nazari, M.T.; De Souza, C.F.; Cadore, J.S.; Brião, V.B.; Piccin, J.S. Alternative techniques for caffeine removal from wastewater: An overview of opportunities and challenges. J. Water Process Eng. 2020, 35, 101231. [Google Scholar] [CrossRef]
  8. Starling, M.C.V.M.; Amorim, C.C.; Leão, M.M.D. Occurrence, control, and fate of contaminants of emerging concern in environmental compartments in Brazil. J. Hazard. Mater. 2019, 372, 17–36. [Google Scholar] [CrossRef]
  9. Petrie, B.; Barden, R.; Kasprzyk-Hordern, B. A review on emerging contaminants in wastewater and the environment: Current knowledge, understudied areas and recommendations for future monitoring. Water Res. 2015, 72, 3–27. [Google Scholar] [CrossRef]
  10. Parida, V.K.; Saidulu, D.; Majumder, A.; Srivastava, A.; Gupta, B.; Gupta, A.K. Emerging contaminants in wastewater: A critical review on occurrence, existing legislations, risk assessment, and sustainable treatment alternatives. J. Environ. Chem. Eng. 2021, 9, 105966. [Google Scholar] [CrossRef]
  11. Cruz, N.; Mierzwa, J.C. Saúde pública e inovações tecnológicas para abastecimento público. Saúde Soc. 2020, 29, e180824. [Google Scholar] [CrossRef]
  12. Velloso, V. Poluentes Emergentes: Um Report, via Revisão Sistemática, Sobre os Efeitos em Microrganismos Planctônicos de Água Doce; Editora Dialética: São Paulo, SP, Brazil, 2022. [Google Scholar]
  13. Malaj, E.; Von Der Ohe, P.C.; Grote, M.; Kühne, R.; Mondy, C.P.; Usseglio-Polatera, P.; Brack, W.; Schäfer, R.B. Organic chemicals jeopardize the health of freshwater ecosystems on the continental scale. Proc. Natl. Acad. Sci. USA 2014, 111, 9549–9554. [Google Scholar] [CrossRef]
  14. Vrijheid, M.; Casas, M.; Gascon, M.; Valvi, D.; Nieuwenhuijsen, M. Environmental pollutants and child health—A review of recent concerns. Int. J. Hyg. Environ. Health 2016, 219, 331–342. [Google Scholar] [CrossRef] [PubMed]
  15. Koumaki, E.; Noutsopoulos, C.; Mamais, D.; Fragkiskatos, G.; Andreadakis, A. Fate of emerging contaminants in high rate activated sludge systems. Int. J. Environ. Res. Public Health 2020, 18, 400. [Google Scholar] [CrossRef] [PubMed]
  16. Kooijman, G.; De Kreuk, M.K.; Houtman, C.; Van Lier, J.B. Perspectives of coagulation/flocculation for the removal of pharmaceuticals from domestic wastewater: A critical view at experimental procedures. J. Water Process Eng. 2020, 34, 101161. [Google Scholar] [CrossRef]
  17. Padmaja, K.; Cherukuri, J.; Reddy, M.A. A comparative study of the efficiency of chemical coagulation and electrocoagulation methods in the treatment of pharmaceutical effluent. J. Water Process Eng. 2020, 34, 101153. [Google Scholar] [CrossRef]
  18. Thathola, P.; Agnihotri, V.; Pandey, A. Microbial Degradation of Caffeine Using Himalayan Psychrotolerant Pseudomonas sp. GBPI_Hb5 (MCC 3295). Curr. Microbiol. 2021, 78, 3924–3935. [Google Scholar] [CrossRef] [PubMed]
  19. Nayak, V.; Cuhorka, J.; Mikulášek, P. Separation of drugs by commercial nanofiltration membranes and their modelling. Membranes 2022, 12, 528. [Google Scholar] [CrossRef]
  20. Dávila, I.V.J.; Hübner, J.V.M.; Nunes, K.G.P.; Féris, L.A. Caffeine removal by adsorption: Kinetics, equilibrium thermodynamic and regeneration studies. J. Solid Waste Technol. Manag. 2021, 47, 95–103. [Google Scholar] [CrossRef]
  21. Sönmez, G.; Işik, T.B.M. Removal of selected pharmaceuticals from tap water by the Fenton process. Int. J. Environ. Anal. Chem. 2022, 102, 3855–3867. [Google Scholar] [CrossRef]
  22. Baltrėnas, P.; Baltrėnaitė, E. Sustainable Environmental Protection Technologies; Springer International Publishing: Berlin/Heidelberg, Germany, 2020. [Google Scholar]
  23. Ghaedi, M. Adsorption: Fundamental Processes and Applications; Academic Press: Cambridge, MA, USA, 2021. [Google Scholar]
  24. Perry, R.H.; Green, D.W.; Maloney, J.O. Chemical Engineers’ Handbook, 9th ed.; McGraw-Hill: New York, NY, USA, 2019. [Google Scholar]
  25. Singh, J.K.; Verma, N. Aqueous Phase Adsorption: Theory, Simulations and Experiments; CRC Press: Boca Raton, FL, USA, 2019. [Google Scholar]
  26. Zhuo, N.; Lan, Y.; Yang, W.; Yang, Z.; Li, X.; Zhou, X. Adsorption of three selected pharmaceuticals and personal care products (PPCPs) onto MIL-101 (Cr)/natural polymer composite beads. Sep. Purif. Technol. 2017, 177, 272–280. [Google Scholar] [CrossRef]
  27. Zanella, O.; Tessaro, I.C.; Féris, L.A. Desorption- and decomposition-based techniques for the regeneration of activated carbon. Chem. Eng. Technol. 2014, 37, 1447–1459. [Google Scholar] [CrossRef]
  28. Yagub, M.T.; Sen, T.K.; Afroze, S.; Ang, H.M. Dye and its removal from aqueous solution by adsorption: A review. Adv. Colloid Interface Sci. 2014, 209, 172–184. [Google Scholar] [CrossRef] [PubMed]
  29. Bhatnagar, A.; Hogland, W.; Marques, M.; Sillanpää, M. An overview of the modification methods of activated carbon for its water treatment applications. Chem. Eng. J. 2013, 219, 499–511. [Google Scholar] [CrossRef]
  30. Babuponnusami, A.; Muthukumar, K. A review on Fenton and improvements to the Fenton process for wastewater treatment. J. Environ. Chem. Eng. 2014, 2, 557–572. [Google Scholar] [CrossRef]
  31. Nidheesh, P.V.; Gandhimathi, R. Trends in electro-Fenton process for water and wastewater treatment: An overview. Desalination 2012, 299, 1–15. [Google Scholar] [CrossRef]
  32. Chen, Q.; Liu, H.; Yang, Z.; Tan, D. Regeneration performance of spent granular activated carbon for tertiary treatment of dyeing wastewater by Fenton reagent and hydrogen peroxide. J. Mater. Cycles Waste Manag. 2015, 19, 256–264. [Google Scholar] [CrossRef]
  33. De Las Casas, C.L.; Bishop, K.G.; Bercik, L.M.; Johnson, M.; Potzler, M.; Ela, W.P.; Sáez, A.E.; Huling, S.G.; Arnold, R.G. In-place regeneration of granular activated carbon using Fenton’s reagents. Remediation Hazard. Waste Subsurface 2006, 4, 43–65. [Google Scholar]
  34. Muranaka, C.T.; Julcour, C.; Wilhelm, A.M.; Delmas, H.; Nascimento, C.A. Regeneration of activated carbon by (photo)-Fenton oxidation. Ind. Eng. Chem. Res. 2010, 49, 989–995. [Google Scholar]
  35. Santos, D.H.; Duarte, J.L.; Tonholo, J.; Meili, L.; Zanta, C.L. Saturated activated carbon regeneration by UV-light, H2O2 and Fenton reaction. Sep. Purif. Technol. 2020, 250, 117112. [Google Scholar] [CrossRef]
  36. Dalmázio, I.; Santos, L.S.; Lopes, R.P.; Eberlin, M.N.; Augusti, R. Advanced oxidation of caffeine in water: On-line and real-time monitoring by electrospray ionization mass spectrometry. Environ. Sci. Technol. 2005, 39, 5982–5988. [Google Scholar] [CrossRef] [PubMed]
  37. Li, M.; Mei, Q.; Han, D.; Wei, B.; An, Z.; Cao, H.; Xie, J.; He, M. The roles of HO•, ClO•, and BrO• radicals in caffeine degradation: A theoretical study. Sci. Total Environ. 2021, 768, 144733. [Google Scholar] [CrossRef] [PubMed]
  38. De Carvalho, C.B.; Rosa, I.R.; Del Vecchio, P.; Dávila, I.V.J.; Nunes, K.G.P.; Marcilio, N.R.M.; Féris, L.A. Degradation of ampicillin by combined process: Adsorption and Fenton reaction. Environ. Technol. Innov. 2022, 26, 102365. [Google Scholar] [CrossRef]
  39. Ioannou-Ttofa, L.; Raj, S.; Prakash, H.; Fatta-Kassinos, D. Solar photo-Fenton oxidation for the removal of ampicillin, total cultivable and resistant E. coli and eTOCoxicity from secondary-treated wastewater effluents. Chem. Eng. J. 2019, 355, 91–102. [Google Scholar] [CrossRef]
  40. Gil, A.; Galeano, L.A.; Vicente, M.Á. Applications of Advanced Oxidation Processes (AOPs) in Drinking Water Treatment; Springer International Publishing: Berlin/Heidelberg, Germany, 2019; Volume 67. [Google Scholar]
  41. Kabuba, J.; Lukusa, T. Process Optimization Using Response Surface Methodology for the Removal of Cu(II) and Co(II) from Aqueous Solution Using Gelatin-Cellulose Nanocrystals Hydrogel Membrane. Int. J. Environ. Sci. Dev. 2023, 14, 252–258. [Google Scholar] [CrossRef]
  42. Regalbuto, J.R.; Robles, J.O. The Engineering of Pt/Carbon Catalyst Preparation for Application on Proton Exchange Fuel Cell Membrane; Catalysis Laboratory, University of Illinois at Chicago: Chicago, IL, USA, 2004. [Google Scholar]
  43. Brunauer, S.; Emmett, P.H.; Teller, E. Adsorption of gases in multimolecular layers. J. Am. Chem. Soc. 1938, 60, 309–319. [Google Scholar] [CrossRef]
  44. Barrett, E.P.; Joyner, L.G.; Halenda, P.P. The determination of pore volume and area distributions in porous substances. I. Computations from nitrogen isotherms. J. Am. Chem. Soc. 1951, 73, 373–380. [Google Scholar] [CrossRef]
  45. De Oliveira, J.T. Estimativa de Parâmetros e Seleção de Modelos Através da Aplicação de Técnicas Bayesianas ao Processo de Adsorção de cafeína: Cinética, Isoterma e Curva de Ruptura; Postgraduate Program in Chemical Engineering; Federal University of Rio Grande do Sul: Porto Alegre, Brazil, 2022. [Google Scholar]
  46. Michael, S.G.; Michael-Kordatou, I.; Beretsou, V.G.; Jäger, T.; Michael, C.; Schwartz, T.; Fatta-Kassinos, D. Solar photo-Fenton oxidation followed by adsorption on activated carbon for the minimization of antibiotic resistance determinants and toxicity present in urban wastewater. Appl. Catal. B Environ. 2019, 244, 871–880. [Google Scholar] [CrossRef]
  47. Posser, Y.M. Degradação da Cafeína Através dos Processos Oxidativos Avançados Fenton e Foto-Fenton; Postgraduate Program in Chemical Engineering; Federal University of Rio Grande do Sul: Porto Alegre, Brazil, 2016. [Google Scholar]
  48. Trovó, A.G.; Silva, T.F.; Gomes, O., Jr.; Machado, A.E.; Neto, W.B.; Muller, P.S., Jr.; Daniel, D. Degradation of caffeine by photo-Fenton process: Optimization of treatment conditions using experimental design. Chemosphere 2013, 90, 170–175. [Google Scholar] [CrossRef]
  49. Licona, K.P.M.; Geaquinto, L.R.D.O.; Nicolini, J.V.; Figueiredo, N.G.; Chiapetta, S.C.; Habert, A.C.; Yokoyama, L. Assessing potential of nanofiltration and reverse osmosis for removal of toxic pharmaceuticals from water. J. Water Process Eng. 2018, 25, 195–204. [Google Scholar] [CrossRef]
  50. François, L.L.; Haro, N.K.; Souza, F.S.; Féris, L.A. Remoção de cafeína por adsorção em carvão ativado. Scientia Cum Industria 2016, 4, 64–68. [Google Scholar] [CrossRef]
  51. Kaur, H.; Bansiwal, A.; Hippargi, G.; Pophali, G.R. Effect of hydrophobicity of pharmaceuticals and personal care products for adsorption on activated carbon: Adsorption isotherms, kinetics, and mechanism. Environ. Sci. Pollut. Res. 2018, 25, 20473–20485. [Google Scholar] [CrossRef] [PubMed]
  52. De Oliveira, T.D.D.; Martini, W.S.; Santos, M.D.; Matos, M.A.C.; Rocha, L.L.D. Caffeine oxidation in water by Fenton and Fenton-like processes: Effects of inorganic anions and ecotoxicological evaluation on aquatic organisms. J. Braz. Chem. Soc. 2015, 26, 178–184. [Google Scholar] [CrossRef]
  53. García-Negueroles, P.; García-Ballesteros, S.; Amat, A.M.; Laurenti, E.; Arques, A.; Santos-Juanes, L. Unveiling the dependence between hydroxyl radical generation and performance of Fenton systems with complexed iron. ACS Omega 2019, 4, 21698–21703. [Google Scholar] [CrossRef] [PubMed]
  54. De Araújo, K.S.; Antonelli, R.; Gaydeczka, B.; Granato, A.C.; Malpass, G.R.P. Advanced oxidation processes: A review of fundamentals and applications in the treatment of urban and industrial wastewaters. Ambiente Água 2016, 11, 387–401. [Google Scholar] [CrossRef]
  55. Ubillus, M.A.R. Óxido de Grafeno Magnético Para Degradação de Cafeína por Processo Fenton Heterogêneo; Institute of Chemistry, São Paulo State University: Araraquara, Brazil, 2020. [Google Scholar]
  56. Rosal, R.; Rodríguez, A.; Perdigón-Melón, J.A.; Petre, A.; García-Calvo, E.; Gómez, M.J.; Agüera, A.; Fernández-Alba, A.R. Degradation of caffeine and identification of the transformation products generated by ozonation. Chemosphere 2009, 74, 825–831. [Google Scholar] [CrossRef]
  57. Ziylan-Yavas, A.; Ince, N.H.; Ozon, E.; Arslan, E.; Aviyente, V.; Savun-Hekimoğlu, B.; Erdincler, A. Oxidative decomposition and mineralization of caffeine by advanced oxidation processes: The effect of hybridization. Ultrason. Sonochem. 2021, 76, 105635. [Google Scholar] [CrossRef] [PubMed]
  58. Kosma, C.I.; Lambropoulou, D.A.; Albanis, T.A. Occurrence and removal of PPCPs in municipal and hospital wastewaters in Greece. J. Hazard. Mater. 2010, 179, 804–817. [Google Scholar] [CrossRef]
  59. Conkle, J.L.; White, J.R.; Metcalfe, C.D. Reduction of pharmaceutically active compounds by a lagoon wetland wastewater treatment system in Southeast Louisiana. Chemosphere 2008, 73, 1741–1748. [Google Scholar] [CrossRef]
  60. Bracamontes-Ruelas, A.R.; Reyes-Vidal, Y.; Irigoyen-Campuzano, J.R.; Reynoso-Cuevas, L. Simultaneous oxidation of emerging pollutants in real wastewater by the advanced Fenton oxidation process. Catalysts 2023, 13, 748. [Google Scholar] [CrossRef]
  61. De Almeida, L.N.B.; Josué, T.G.; Fidelis, M.Z.; Abreu, E.; Bechlin, M.A.; Dos Santos, O.A.A.; Lenzi, G.G. Process comparison for caffeine degradation: Fenton, photo-Fenton, UV/H2O2, and UV/Fe3⁺. Water Air Soil Pollut. 2021, 232, 147. [Google Scholar] [CrossRef]
  62. Costa, L.R.C.; Ribeiro, L.M.; Hidalgo, G.E.N.; Féris, L.A. Determination of optimal operating parameters for tetracycline removal by adsorption from synthetic and real aqueous solutions. J. Environ. Sci. Health Part A 2020, 55, 1615–1623. [Google Scholar] [CrossRef] [PubMed]
  63. Carabineiro, S.A.; Pereira, M.F.; Órfão, J.J.; Figueiredo, J.L. Surface chemistry of activated carbons. Chem. Phys. Res. J. 2011, 4, 291. [Google Scholar]
  64. Nunes, K.G.P.; Dávila, I.V.J.; Arnold, D.; Moura, C.H.R.; Estumano, D.C.; Féris, L.A. Kinetics and thermodynamic study of laponite application in caffeine removal by adsorption. Environ. Process. 2022, 9, 47. [Google Scholar] [CrossRef]
  65. Hübner, J.V.M. Avaliação Experimental da Habilidade do Carvão Ativado em Adsorver Cafeína Múltiplas Vezes; Postgraduate Program in Chemical Engineering; Federal University of Rio Grande do Sul: Porto Alegre, Brazil, 2020. [Google Scholar]
  66. Haro, N.K.; Del Vecchio, P.; Marcilio, N.R.; Féris, L.A. Removal of atenolol by adsorption—Study of kinetics and equilibrium. J. Clean. Prod. 2017, 154, 214–219. [Google Scholar] [CrossRef]
  67. Bedia, J.; Peñas-Garzón, M.; Gómez-Avilés, A.; Rodriguez, J.J.; Belver, C. Review on activated carbons by chemical activation with FeCl3. J. Carbon Res. 2020, 6, 21. [Google Scholar] [CrossRef]
  68. Xu, Z.; Zhang, T.; Yuan, Z.; Zhang, D.; Sun, Z.; Huang, Y.X.; Chen, W.; Tian, D.; Deng, H.; Zhou, Y. Fabrication of TOCton textile waste-based magnetic activated carbon using FeCl3 activation by the Box-Behnken design: Optimization and characteristics. RSC Adv. 2018, 8, 38081–38090. [Google Scholar] [CrossRef] [PubMed]
  69. Medina, F.M.O.; Aguiar, M.B.; Parolo, M.E.; Avena, M.J. Insights of competitive adsorption on activated carbon of binary caffeine and diclofenac solutions. J. Environ. Manag. 2021, 278, 111523. [Google Scholar] [CrossRef] [PubMed]
  70. Beltrame, K.K.; Cazetta, A.L.; De Souza, P.S.; Spessato, L.; Silva, T.L.; Almeida, V.C. Adsorption of caffeine on mesoporous activated carbon fibers prepared from pineapple plant leaves. Ecotoxicol. Environ. Saf. 2018, 147, 64–71. [Google Scholar] [CrossRef] [PubMed]
  71. Thiravetyan, P.; Suksabye, P. Using “activated carbon from bagasse” for color removal. In Activated Carbon. Chemical Engineering Methods and Technology; Nova Science Publishers: New York, NY, USA, 2012. [Google Scholar]
  72. Álvarez-Torrellas, S.; Rodríguez, A.; Ovejero, G.; Gómez, J.M.; García, J. Removal of caffeine from pharmaceutical wastewater by adsorption: Influence of NOM, textural and chemical properties of the adsorbent. Environ. Technol. 2016, 37, 1618–1630. [Google Scholar] [CrossRef]
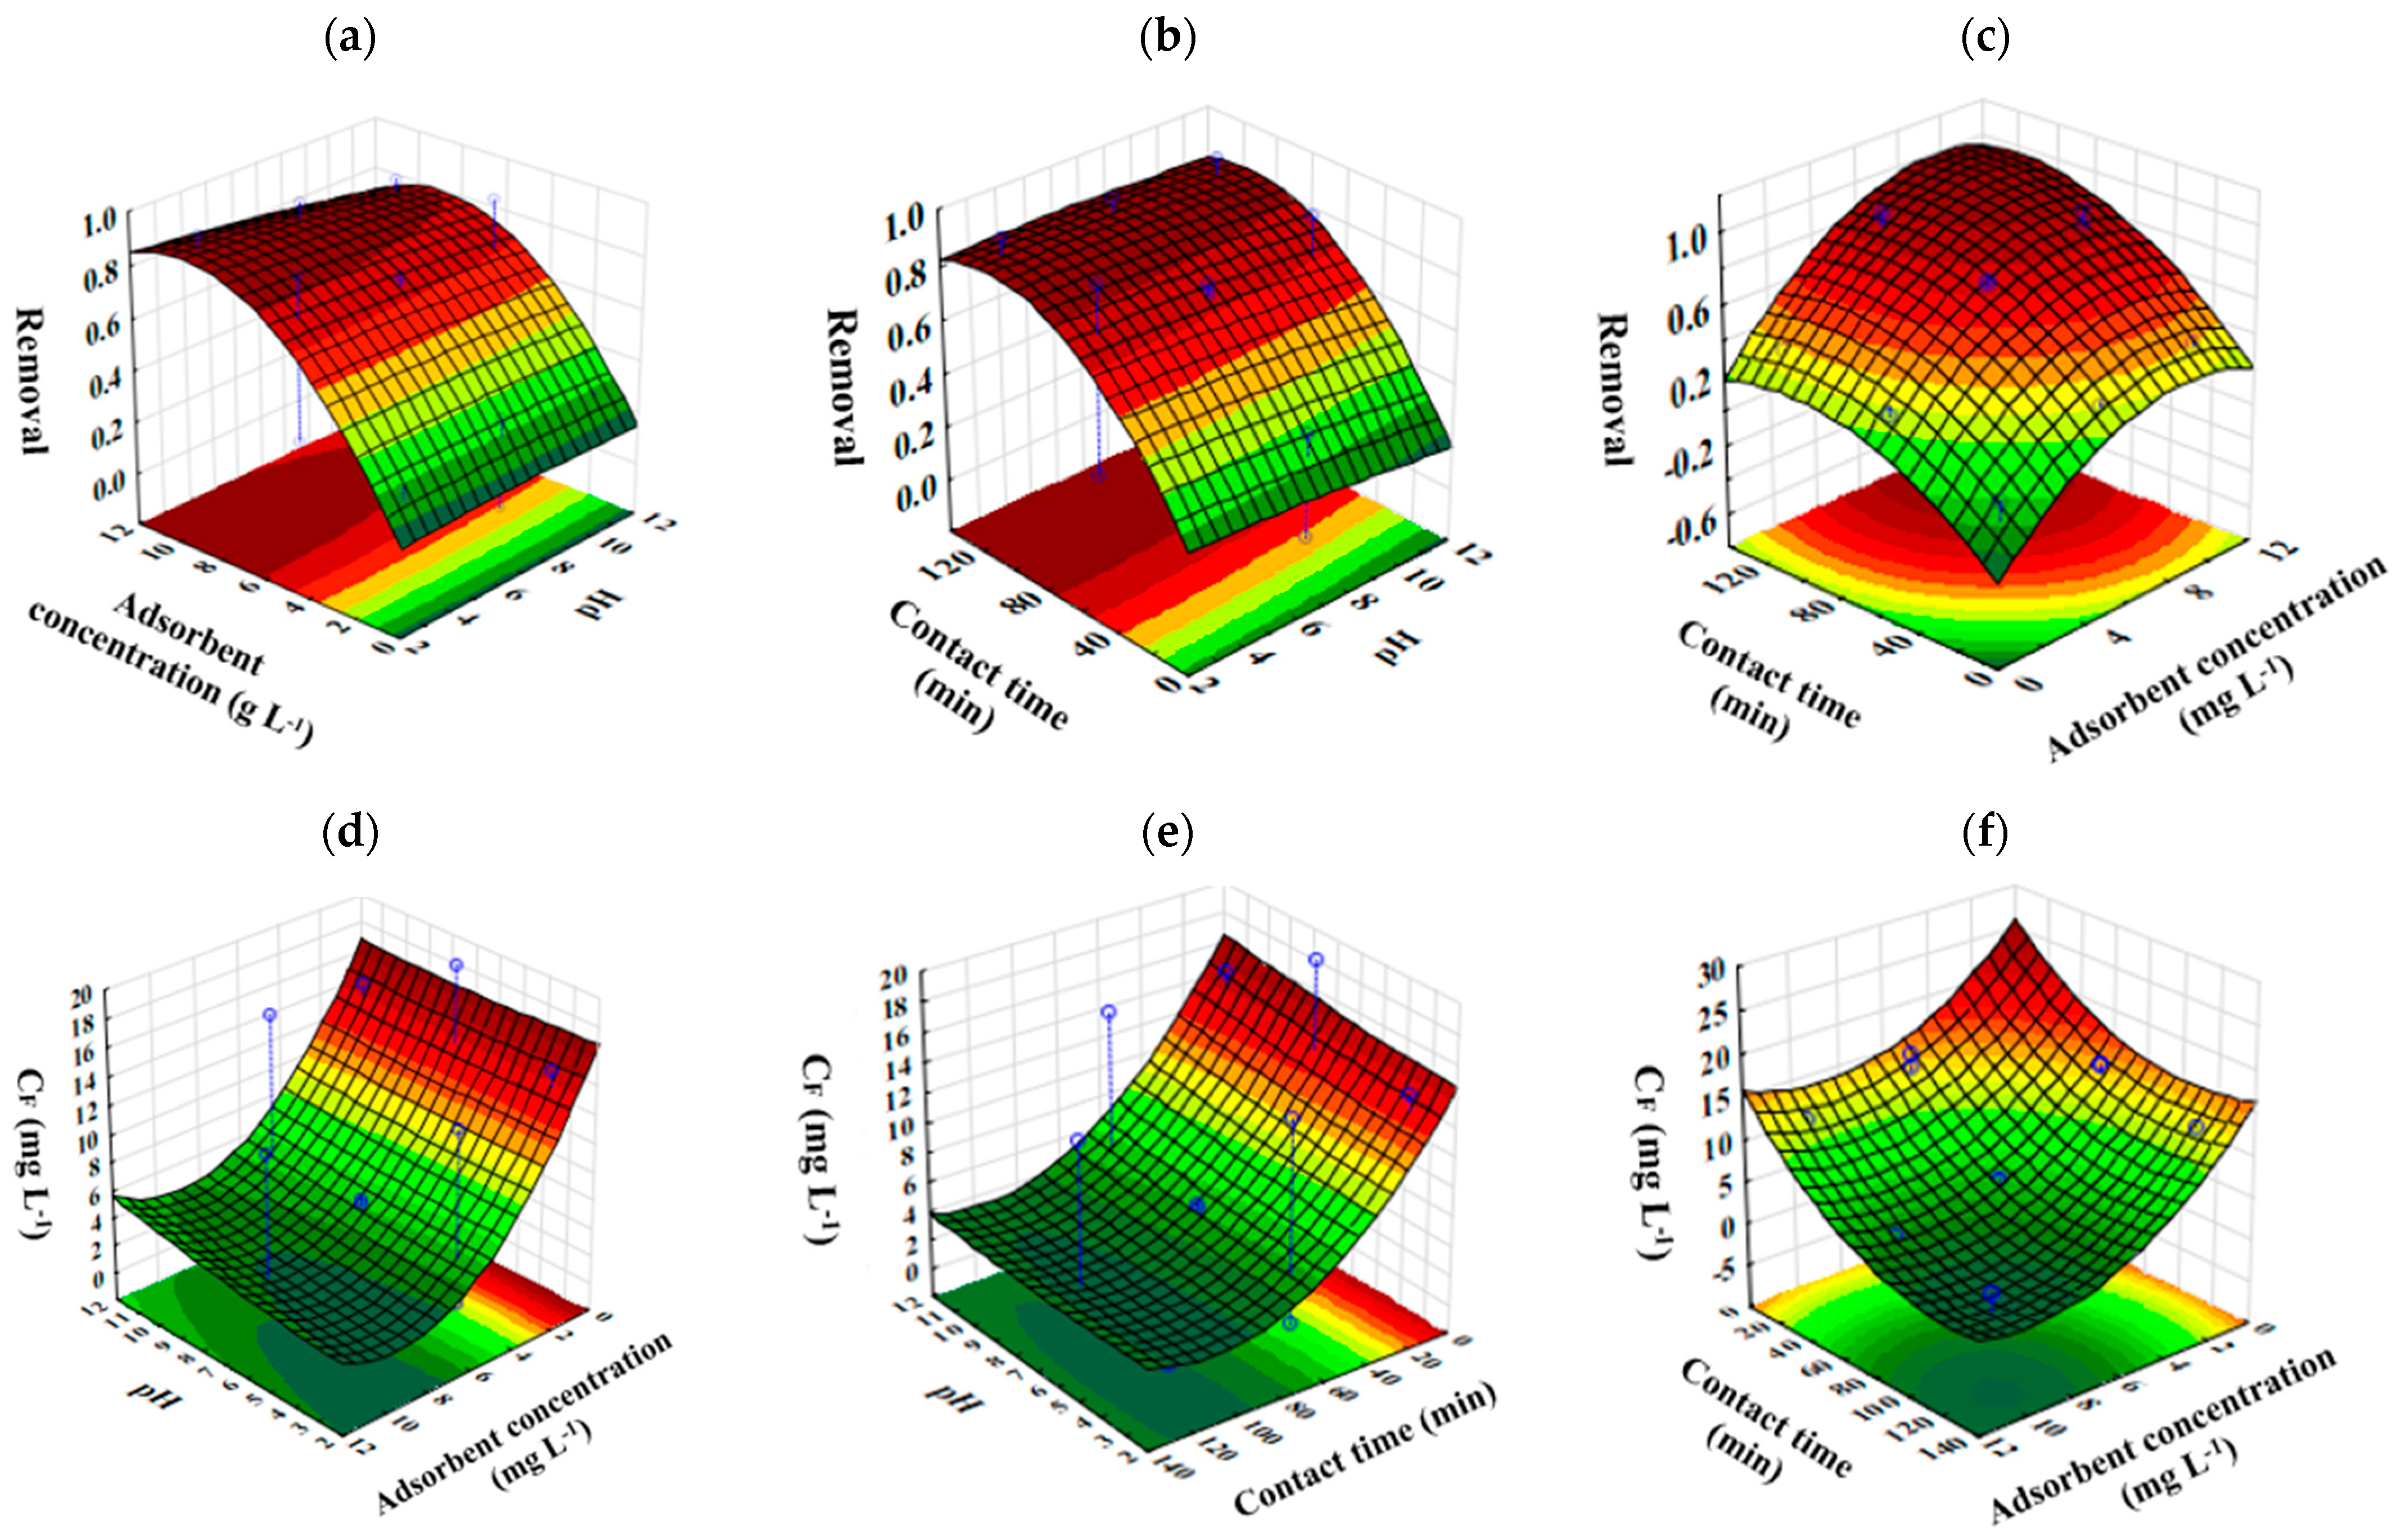
Figure 1. Response surfaces for RCAF and CF as function of pH and adsorbent dosage (a,d), pH and contact time (b,e), and adsorbent concentration and contact time (c,f).
Applsci 14 06993 g001
Figure 2. Response surfaces for DCAF and CF as function of dosage of H2O2 and FeSO4·7H2O after 5 min of reaction (a,c) and after 60 min of reaction (b,d).
Applsci 14 06993 g002
Figure 3. Caffeine chromatograms of the initial solution of 20 mg L−1 (a) and after 5 min (b) and 60 min (c) of the Fenton reaction (H2O2/FeSO4·7H2O = 150/4 mg L−1).
Applsci 14 06993 g003
Figure 4. Theoretical degradation route of caffeine by hydroxyl radicals.
Applsci 14 06993 g004
Figure 5. Caffeine removal and degradation for Fenton reaction times of 0 (end of adsorption), 5, and 60 min in relation to initial solution of 20 mg L−1.
Applsci 14 06993 g005
Figure 6. CF of caffeine for Fenton reaction times of 0 (end of adsorption), 5, and 60 min.
Applsci 14 06993 g006
Figure 7. The reduction in the TOC of the caffeine solution for the Fenton reaction times of 0 (end of adsorption), 5, and 60 min in relation to the TOC of the initial solution of 20 mg L−1.
Applsci 14 06993 g007
Figure 8. Caffeine removal efficiency on GAC in adsorption stage for four combined processes carried out in sequence.
Applsci 14 06993 g008
Figure 9. Regeneration efficiencies for each cycle of CP.
Applsci 14 06993 g009
Figure 10. N2 adsorption and desorption isotherm for GAC.
Applsci 14 06993 g010
Figure 11. GAC XRD patterns, where -A is after adsorption, -2CP is after second combined process, and -4CP is after fourth combined process.
Applsci 14 06993 g011
Figure 12. GAC FTIR spectrum, where -A is after adsorption, -2CP is after second combined process, and -4CP is after fourth combined process.
Applsci 14 06993 g012
Figure 13. pHPCZ curve for commercial granular activated carbon.
Applsci 14 06993 g013
Table 1. Independent variable values at three different levels during CAF adsorption onto GAC.
LevelpHSolid Adsorbent Concentration (mg L−1)Contac Time (min)
(+1)11.010.0120.0
07.05.565.0
(−1)3.01.010.0
Table 2. Independent variables at three levels for Fenton reaction for degradation of CAF.
LevelFe+2 Concentration (mg L−1)H2O2 Concentration (mg L−1)
(+1)4.0150.0
02.075.0
(−1)0.825.0
Table 3. Experimental conditions and results for design of experiments (DOE) with central composite analysis, where Cads is GAC concentration.
Test RunspHCads
(g L−1)
Contact Time (min)CF
(mg L−1)
Removal (%)
1710.01201.9190.27
235.51201.5392.18
331.06514.8024.56
4310.0651.2993.40
51110.0652.9784.86
675.5655.3672.65
775.5655.0474.32
875.5654.6476.36
971.01019.122.48
10111.06514.8324.39
11115.51202.0189.73
12115.51015.2322.35
1335.51013.7030.14
14710.01011.5840.95
1571.012012.4536.53
Table 4. ANOVA for the RCAF response function.
FactorSS RCAFSS CFDFF-Valuep-Value
(1) pH (L)0.00441.725710.50480.5092
(1) pH (Q)0.00020.091410.02670.8765
(2) mads (L)0.6134235.9451169.01230.0004
(2) mads (Q)0.104740.2711111.77900.0186
(3) t (L)0.5660217.6919163.67330.0005
(3) t (Q)0.083632.146719.40270.0279
1 by 20.00180.673210.19690.6758
1 by 30.00070.274210.08020.7884
2 by 30.00582.242710.65600.4548
Error0.044417.09445
Total SS1.4124543.240214
Table 5. Critical values of adsorption experimental DOE.
FactorObserved MinimumCritical ValuesObserved Maximum
pH3Natural (pH ~6–8)11
Cads (g L−1)11010
Contac time (min)10116120
Table 6. CF results (mg L−1) and caffeine degradation in aqueous solution varying dosage of H2O2/FeSO4·7H2O with initial pH equal to 3 and initial caffeine concentration of 20 mg L−1.
H2O2
(mg L−1)
FeSO4·7H2O
(mg L−1)
Surface ResponseReaction Time (min)
5153060
60.004.00DCAF (%)
CF (mg L−1)
87.48%
2.37
97.61%
0.45
98.39%
0.31
96.98%
0.57
20.002.00DCAF (%)
CF (mg L−1)
68.65%
5.94
75.88%
4.57
81.02%
3.59
80.46%
3.70
20.000.80DCAF (%)
CF (mg L−1)
58.72%
7.82
64.92%
6.64
63.01%
7.00
60.17%
7.54
20.004.00DCAF (%)
CF (mg L−1)
90.10%
1.87
86.18%
2.62
90.50%
1.80
91.58%
1.59
1204.00DCAF (%)
CF (mg L−1)
83.74%
3.08
87.70%
2.33
96.13%
0.73
98.92%
0.21
602.00DCAF (%)
CF (mg L−1)
86.01%
2.65
90.85%
1.73
87.59%
2.35
93.57%
1.22
1200.80DCAF (%)
CF (mg L−1)
88.66%
2.15
98.35%
0.31
86.46%
2.56
96.46%
0.67
1202.00DCAF (%)
CF (mg L−1)
86.89%
2.48
79.83%
3.82
81.64%
3.48
96.12%
0.73
Table 7. ANOVA for DCAF at 5 min of Fenton reaction.
FactorSS RCAFDFF-Valuep-Value
(1) H2O2 (L)0.023113.4910.067
(1) H2O2 (Q)0.00311.9070.301
(2) FeSO4·7H2O (L)0.01518.5770.100
(2) FeSO4·7H2O (Q)0.000310.1870.708
1 by 20.033119.2790.048
Error0.0032
Total SS0.0907
Table 8. ANOVA for DCAF at 60 min of Fenton reaction.
FactorSS RCAFDFF-Valuep-Value
(1) H2O2 (L)0.0516125.5870.037
(1) H2O2 (Q)0.00311.5480.340
(2) FeSO4·7H2O (L)0.028113.950.065
(2) FeSO4·7H2O (Q)0.00411.8960.302
1 by 20.01919.2270.093
Error0.0042
Total SS0.1207
Table 9. Critical values of Fenton reaction experimental DOE.
FactorObserved MinimumCritical ValuesObserved Maximum
H2O2 (mg L−1)25.0129.7150.0
Fe+2 (mg L−1)0.82.34.0
Table 10. BET/BJH results for GAC textural characteristics, where -A is after adsorption, -2CP is after second combined process, and -4CP is after fourth combined process.
StageABET (m2/g)Vpore (cm3/g)Dpore (Å)
GAC534.4150.1204.818
GAC-A483.7150.1054.816
GAC-2CP531.0590.1084.837
GAC-4CP576.4590.1394.836
Disclaimer/Publisher’s Note: The statements, opinions and data contained in all publications are solely those of the individual author(s) and contributor(s) and not of MDPI and/or the editor(s). MDPI and/or the editor(s) disclaim responsibility for any injury to people or property resulting from any ideas, methods, instructions or products referred to in the content.