Abstract
The final feedwater temperature is the temperature of the feedwater supplied to the boiler in the power plant applied with the Rankine cycle. In thermal power plants adopting a regenerative cycle, it is generally known that the heat transfer of the boiler is reduced, and the efficiency of the power plant is increased. However, the output of the power plant is reduced when the final feedwater temperature is increased. In this study, the net output and efficiency of the power plants depending on the final feedwater temperature under the condition of constant boiler heat transfer rate were analyzed for five cases. The results show that there is a final feedwater temperature at which the net output and the net efficiency are maximized. The additional output of the power plant obtained by increasing the final feedwater temperature has the effect of reducing CO2 emissions. If the final feed water temperature is below 308.3 °C, the net output and the final feed water temperature are proportional for all cases. When the final feedwater temperature increases by 1 °C, the net output increases by 63.02 kW and CO2 emissions are reduced by 60.52 kgCO2/h on average.
1. Introduction
To solve global warming and energy problems, the Paris Agreement was signed to keep the global average temperature rise below 2 °C compared to the industrialization era and to try to limit the rise to 1.5 °C or less [1,2]. For this purpose, the conversion and diversification of energy sources from fossil energy to renewable energy such as wind power, fuel cells, biomass, etc. are being pursued; however, a perfect solution could not be presented due to the different interests of each country and a lack of suitable technologies. One of the ways to resolve energy shortage and reduce CO2 emissions is to develop a high-efficiency coal-fired power plant that combines technological advances to reduce harmful substance emissions [3]. Coal-fired power plants account for one-third of the total electric power supply in Korea, and among them, 20 units of the 500 MW class of coal-fired power plants built in the 1990s have been operating for more than 20 years and are aging. Due to the difficulties of constructing new power plants, the need for life extension and performance improvement for existing power plants is emerging [4,5,6]. The CO2 emission factor at the power transmission stage of the domestic supercritical coal-fired power plants is 1.017 kgCO2/kWh [7]. Steam power plants have already reached capacity limits and technological developments are focused on improving efficiency [8].
The steam conditions of the power plant influence the performance of the power plant. Many studies have been conducted on supercritical power plants and ultra-supercritical power plants with enhanced steam conditions to improve the performance of power plants. Li et al. [9] performed thermodynamic analysis and optimization of a double reheat system in an ultra-supercritical power plant. An optimized double reheat system adopting 10-stage extraction and two outer steam coolers was proposed. Yang et al. [10] provided a basis for the quantifying proposals of exergy-driven strategies for improving the system by performing conventional and advanced exergy analysis on a coal-fired ultra-supercritical power plant. By increasing the steam conditions, the exergy destruction ratio of the boiler was significantly reduced, contributing to the system improvement. Bugge et al. [11] described the development and prospects of high-efficiency coal-fired power plants through improved steam conditions. A coal-fired power plant with a 700 °C steam temperature was studied to minimize CO2 emissions. Beer [12] compared the efficiency of coal-fired Rankine cycle steam plants with advanced steam parameters. Efficiency improvement was proposed as the lowest-cost method to reduce all emissions including CO2. The thermodynamic efficiency of power generation was enhanced by increasing steam pressure and temperature. Weitzel [13] investigated a steam generator for advanced ultra-supercritical power plants to enhance the efficiency of a coal-fired power plant. Stepczynska et al. [14] presented various configurations of a 900 MW power unit for advanced 700/720 °C ultra-supercritical steam parameters with a single and double steam reheat. Łukowicz et al. [15] analyzed various ultra-supercritical power plants to determine the effect of the parameters of live and reheated steam on the basic thermodynamic and economic indices of the thermal cycle. However, since steam conditions cannot be infinitely enhanced, other methods for improving the performance of power plants would need to be considered when steam conditions reach a certain level. Several measures have been proposed to improve the performance of power plants. Espatolero et al. [16] suggested a method to improve power generation efficiency by utilizing heat from boiler exhaust gas in an advanced supercritical power plant. Salih et al. [17] studied the improvement in energy efficiency of the steam cycle according to the mass flow rate of air. Espatolero et al. [18] suggested a method for optimizing feedwater heater configuration, and Srinivas et al. [19] thermodynamically analyzed the performance of power plants according to the number of feedwater heaters. Mohammed et al. [20] investigated the effect of using different numbers of feed water heaters on cycle performance in a 200 MW steam cycle power plant. Khaleel et al. [21] used an in-house-developed prediction model to simultaneously optimize the pressure of all feedwater heaters of a coal-fired power plant. This optimization is performed based on the maximum thermal efficiency, exergy efficiency, and net power of the power plant. Khaleel et al. [22] investigate the feasibility of using a feedwater heater system with a coal-fired power plant. Khaleel et al. [23] developed an analysis model to predict the effectiveness of closed feedwater heaters based on data measured at a coal-fired power plant and investigated the effect of operating conditions on power plant performance.
In addition, various studies have been conducted including thermodynamic analysis and optimization of reheat and double reheat power plants [9,24,25,26,27,28,29]. Sengupta et al. [30] conducted a study on exergy efficiency through exergy analysis for a 210 MW thermal power plant. Khaleel et al. [31] performed a comparative evaluation of the energy and exergy analysis of coal-fired and gas-fired thermal power plants. Khaleel et al. [32] analyzed the impact of operating conditions of coal-fired power plants on performance through exergy analysis. Reddy et al. [33] analyzed a solar-concentrator-aided coal-fired supercritical thermal power plant, and various other studies using solar energy in power plants, such as heating feedwater using solar heat, were conducted [34,35,36,37]. However, few studies have been conducted on the relationship between the final feedwater temperature and the performance of coal-fired power plants.
In this study, a 500 MW class coal-fired power plant was modeled and the correlation between the final feedwater temperature and the performance of the power plant was studied under the identical condition of the heat transfer rate in the boiler. The final feedwater temperature is proposed as a key parameter to improve the performance of the power plant considering the net output and the net efficiency of the power plant.
2. Materials and Methods
2.1. Regenerative-Reheat Rankine Cycle
2.1.1. Typical Coal-Fired Power Plant
A coal-fired power plant is based on the regenerative-reheat Rankine cycle. High-temperature and high-pressure steam with thermal energy is generated by the combustion of coal. This steam rotates the turbine to generate electric power. Currently, most thermal power plants raise the steam pressure above the critical pressure to increase efficiency, which is called a supercritical cycle [38].
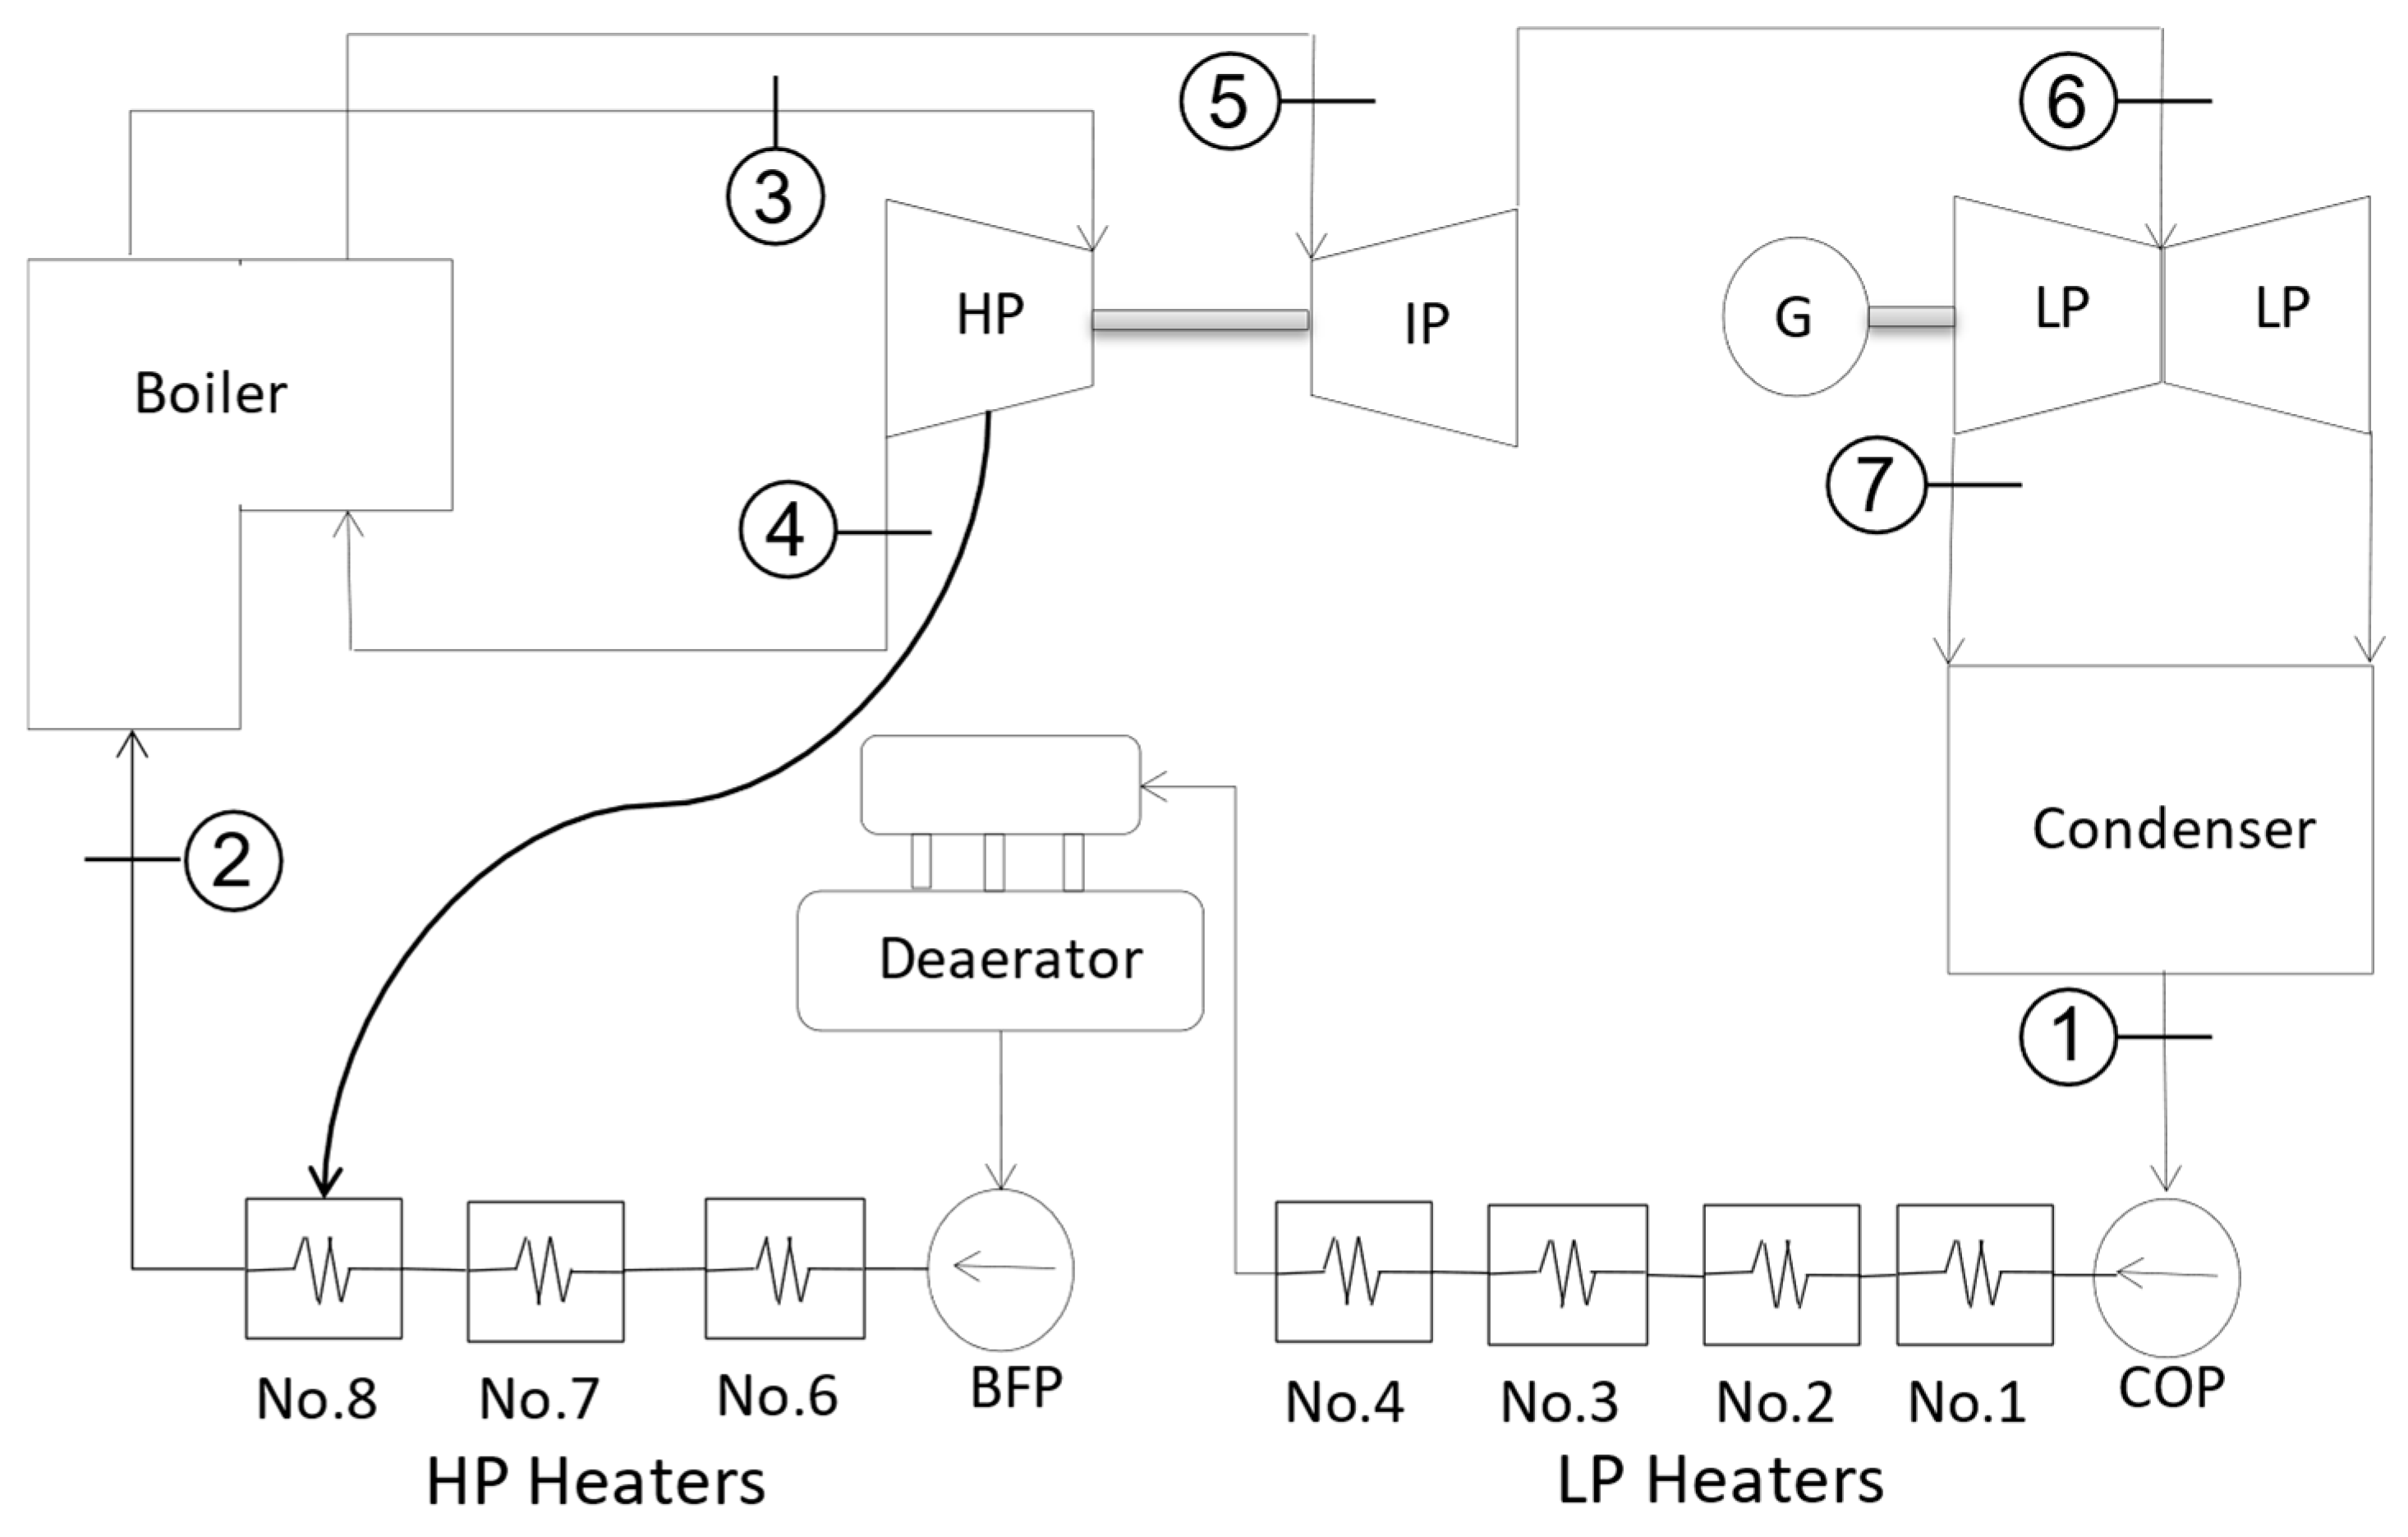
Figure 1 shows a block diagram of a typical coal-fired power plant. The power plant consists of pumps, low-pressure feedwater heaters (hereinafter LP heaters), a deaerator, high-pressure feedwater heaters (hereinafter HP heaters), a boiler, turbines, and condensers. Feedwater is the water supplied to the boiler as a working fluid. The feedwater system consists of feedwater pumps, high-pressure feedwater heaters, and a deaerator. As shown in Figure 1, to improve the cycle efficiency, some of the steam in the turbine is extracted to raise the temperature of the feedwater supplied to the boiler. This is called a regenerative cycle. In modern large-scale power plants, a regenerative cycle using about 7 to 8 or more feedwater heaters is applied [39]. The final feedwater temperature is the temperature of feedwater that is supplied to the boiler through the feedwater heater. In Figure 1, the temperature of point ② is the final feedwater temperature. Feedwater heater No. 8 uses steam to heat the feedwater. The steam to heat the feedwater is supplied from the extraction of the high-pressure turbine (hereinafter HPT) as shown in Figure 1. It is well known that as the final feedwater temperature increases, the heat transfer of the boiler decreases, thereby improving the efficiency of the power plant. However, if the final feedwater temperature is too high, a two-phase flow of steam and water occurs in the economizer of the boiler, and heat transfer to the feedwater flowing inside the economizer tube is not smoothly performed, causing problems such as local overheating of the tube. In general, there is a maximum allowable final feedwater temperature suggested by boiler manufacturers in consideration of the lifetime and reliability of the boiler.

Figure 1.
Typical coal-fired power plant configuration.
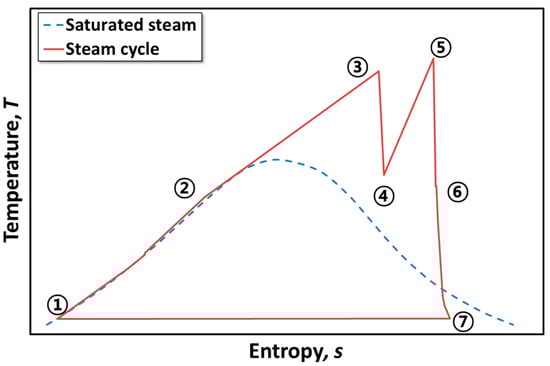
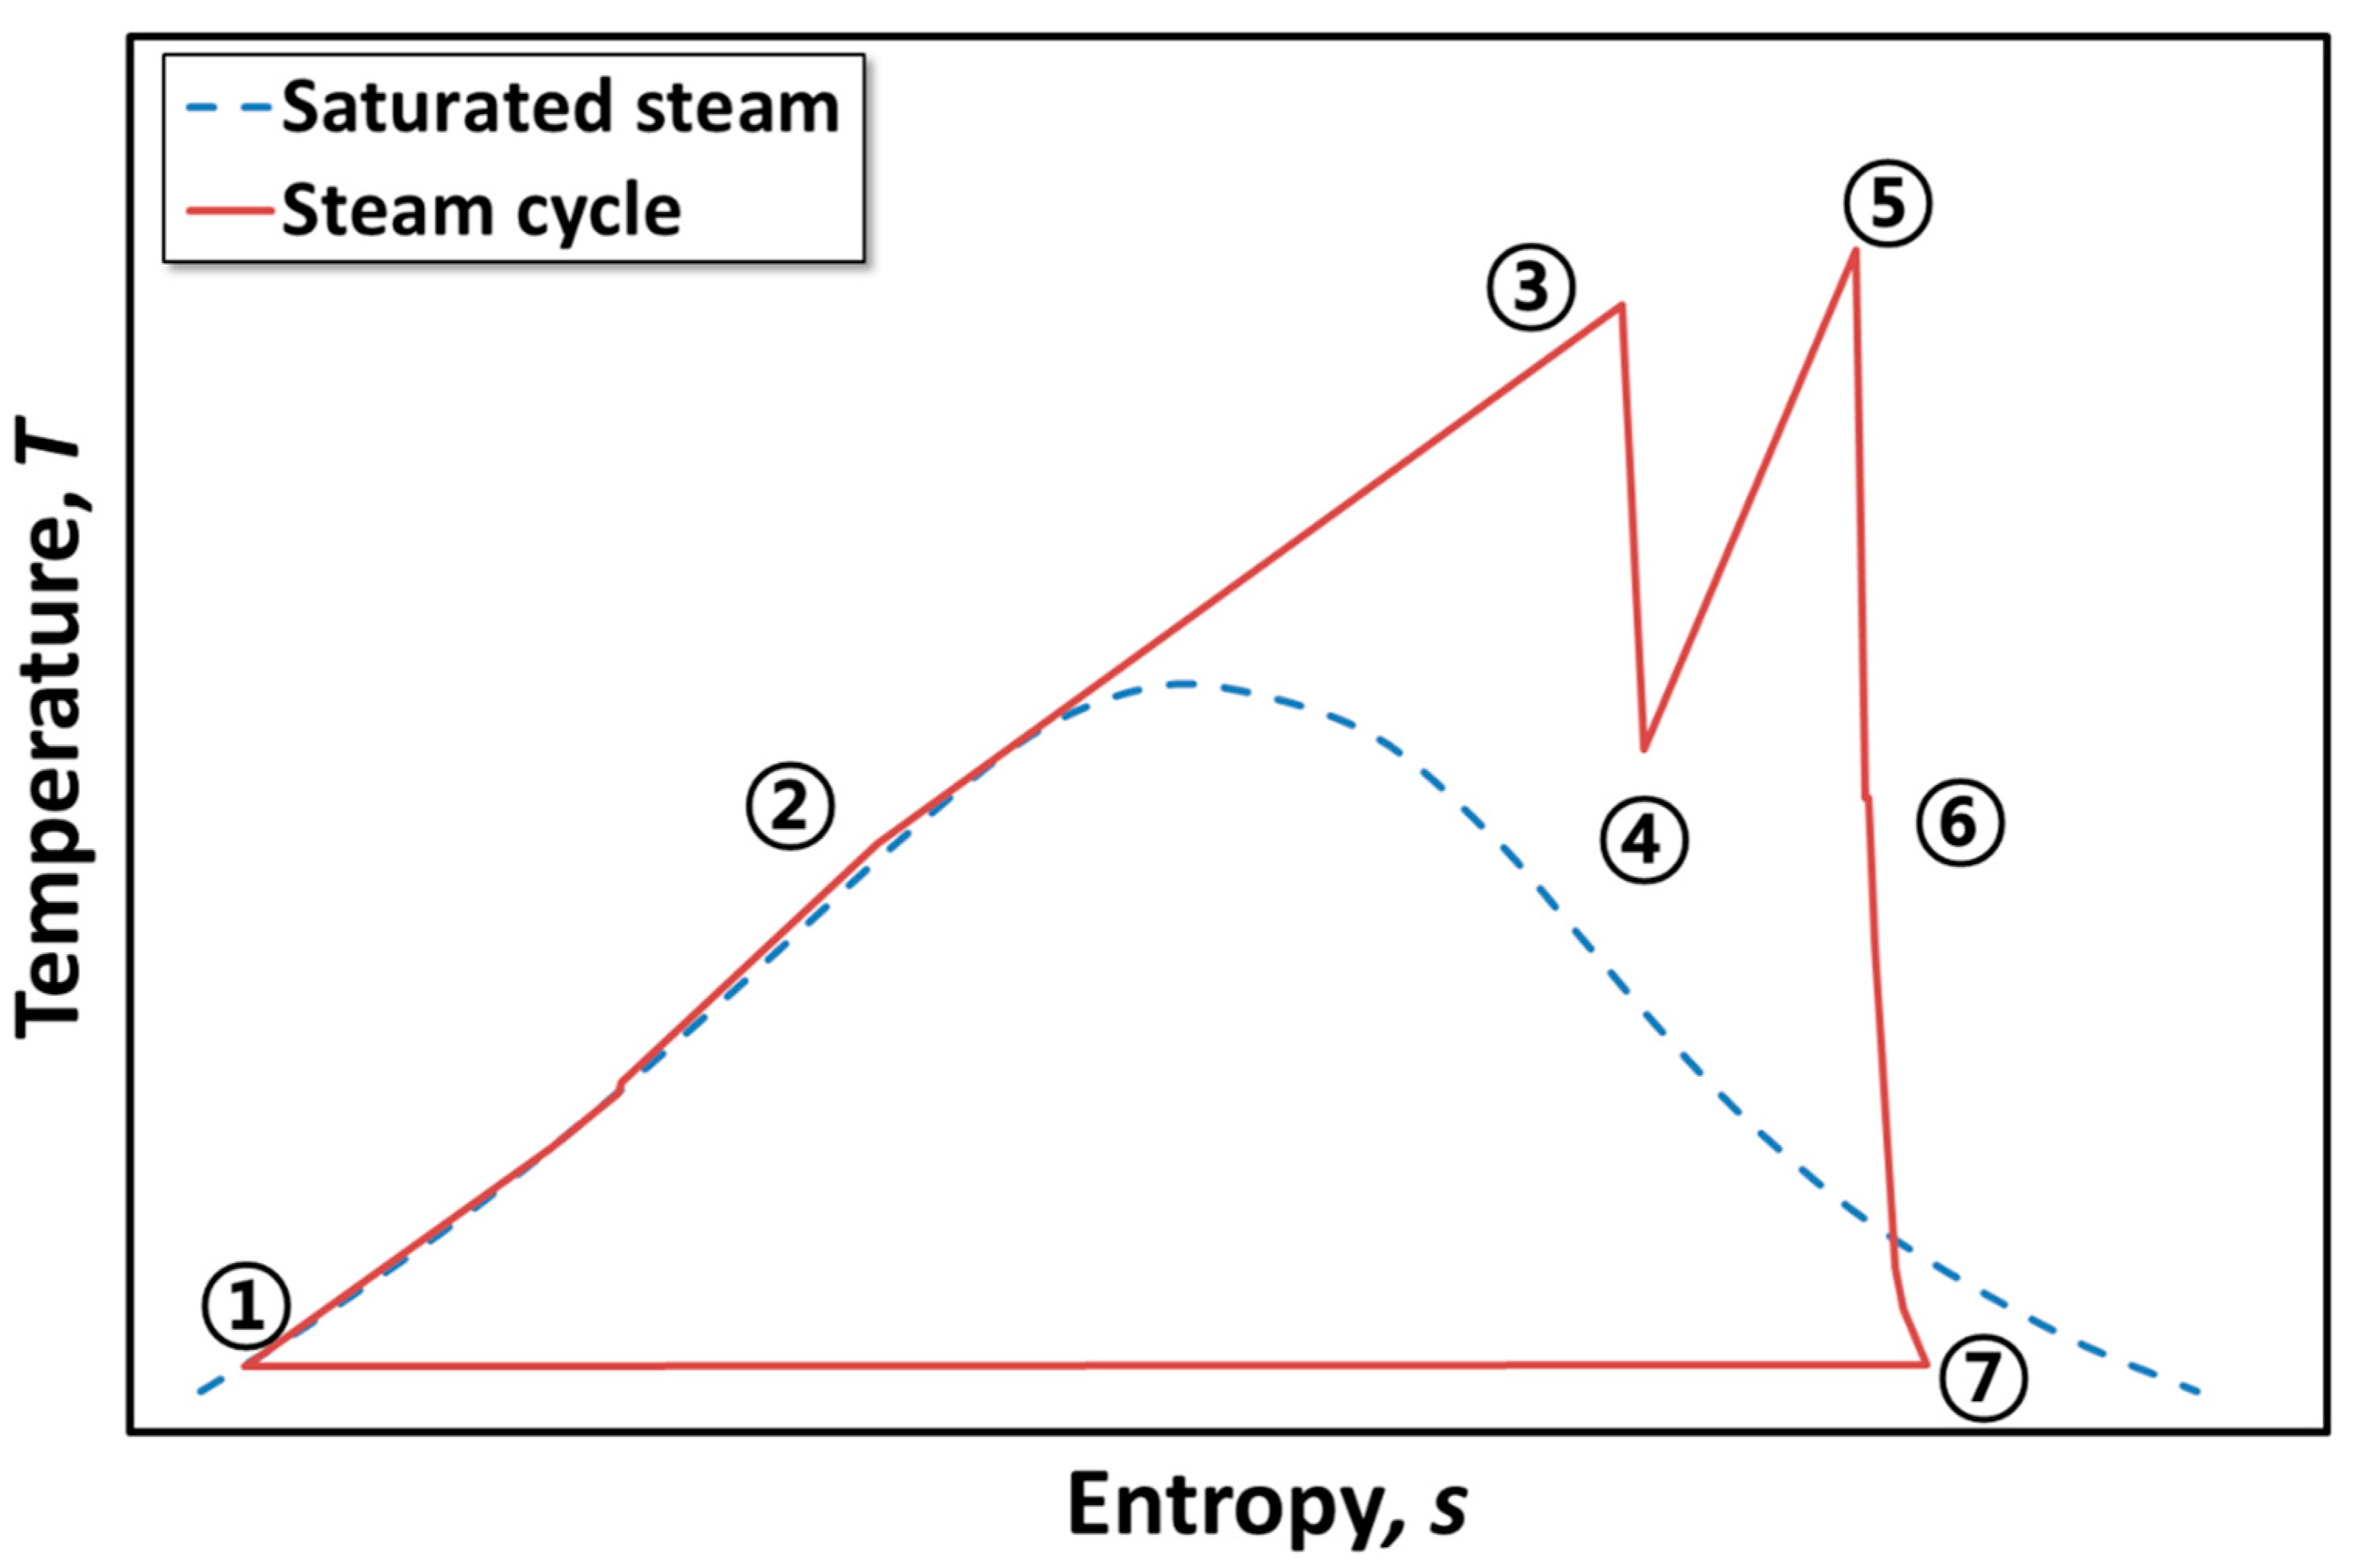
A temperature–entropy diagram depending on the configuration of the power plant is shown in Figure 2 according to Figure 1. As shown in Figure 1, the section from point ② to point ③ is a boiler and the section from point ④ to point ⑤ is a reheater. In Figure 2, section ② to ③ and section ④ to ⑤ are the sections where heat is transferred through a boiler.
2.1.2. Final Feedwater Temperature
When the design conditions of the high-pressure feedwater heaters are the same, relatively high-pressure steam must be extracted from the turbine to raise the final feedwater temperature. As a result, the turbine work is relatively reduced, and the specific power of steam (generated power per mass flow rate, kW/(kg·s−1)) is decreased. Therefore, when the flow rate of steam supplied to the turbine is fixed and the final feedwater temperature increases, the amount of power output generated by the power plant decreases. With a target power output, a relatively higher flow rate of steam should be supplied to the turbine. The flow rate of feedwater supplied to the boiler should be increased, and power consumption of the feedwater pumps increases, resulting in a decrease in the net output and the net efficiency of the power plant. When the flow rate of steam and the flow rate of feedwater increase, it is necessary to increase related facilities such as a boiler and feedwater pumps.
2.2. Performance Analysis of the Steam Cycle
2.2.1. Theories of Analysis
The definition of performance for the analysis of the power plant is the net output and the net efficiency. The main theory for analysis of the power plant is as follows [38,39]. The power required by the condensate pump is
where , , , and are the mass flow rate of condensate water flowing into the condensate pump, upstream specific enthalpy, downstream specific enthalpy with isentropic compression, and the isentropic efficiency of the pump, respectively. The power consumption of the condensate pump is
where is the efficiency of the motor. The isentropic efficiency of the turbine is
where and denote the specific enthalpy of the turbine outlet and the specific enthalpy of the turbine outlet with isentropic expansion, respectively. The power generated by the turbine is
where refers to the mass flow rate of steam supplied to the turbine. The gross power output of the power plant is
where and are the sum of the power generated by the turbine and the sum of the power loss of the turbine and generator, respectively. The total heat transfer rate of the boiler is
where is the mass flow rate of feedwater supplied to a boiler. The gross efficiency of the power plant is defined as follows:
The net output of the power plant after subtracting the power consumption of the condensate pumps is
where is the power consumption of the condensate pumps. The net efficiency of the power plant is defined as follows:
The terminal temperature difference (TTD), which is the main design condition of the feedwater heater, TTD is defined as follows:
where and are the saturated steam temperature at the internal pressure of the feedwater heater shell and the feedwater temperature at the outlet of the feedwater heater tube side, respectively. The drain sub-cooler approach (DCA), which is the main design condition of the feedwater heater, DCA is defined as follows:
where and are the drain temperature on the shell side of the feedwater heater and the feedwater temperature at the inlet of the feedwater heater tube side, respectively. The ratio of transmission power output to the gross power output is defined as follows:
where is the output of the power plant at the transmission stage. The CO2 emission rate of the power plant is defined as follows [7]:
where is the CO2 emission factor at the power transmission stage of the power plant. The general exergy balance equation is represented as follows [40]:
where indicates specific exergy and is the work rate and is the exergy destruction rate. is calculated as follows:
where and are the heat transfer rate and the temperature of the dead state, respectively.
2.2.2. Design Conditions and Interpretation
The reference condition for this study was based on the design conditions of an existing 500 MW class coal-fired power plant. Table 1 summarizes the reference conditions of performance analysis of the power plant. The assumptions are as follows: (1) The power plant is a supercritical coal-fired power plant. (2) All turbines are adiabatic. (3) The isentropic efficiency of each stage of the turbine is constant. (4) Except for No. 8 feedwater heater shell internal pressure and turbine extraction pressure connected to the feedwater heater, all other turbine extraction pressures and feedwater heater shell internal pressure are identical. (5) The ratio between the shell internal pressure of the No. 8 feedwater heater and the turbine extraction pressure connected to the feedwater heater is constant. (6) The design conditions of the feedwater heater (TTD and DCA) are identical. (7) The high-pressure turbine exhaust pressure and the hot reheat steam pressure are constant. (8) The heat transfer rate of the boiler (including the reheater) is constant. (9) The supplied exergy of the boiler is constant. (10) The CO2 emission factor at the power transmission stage of a supercritical coal-fired power plant is 1.017 kgCO2/kWh [7]. (11) The ratio of transmission power output to the gross power output () is 0.94429 [41]. (12) The dead state temperature is 25 °C.

Table 1.
Reference conditions of performance analysis.
The performance analysis model was established based on the heat balance diagram of an existing 500 MW class coal-fired power plant. The pressure of steam supplied to the No. 8 feedwater heater was changed by the extraction pressure of the high-pressure turbine. By changing the internal pressure of the No. 8 feedwater heater shell, the final feedwater temperature was changed. The same value as the mass flow rate of the main steam was applied to the mass flow rate of the feedwater flowing through the tube side of the No. 8 feedwater heater.
According to the feedwater heater design conditions (TTD and DCA), the flow rate of steam extracted from the turbine was calculated under thermal equilibrium conditions, and the steam excluding the extracted steam flows to the next stage of the turbine. The power consumption of the feedwater pumps was calculated by reflecting the flow rate of feedwater, and the steam consumption of the feedwater pump driving turbines required to drive the feedwater pumps was calculated according to the power consumption of the feedwater pumps. The required flow rate of the extraction steam to the deaerator was calculated considering the thermal equilibrium in the deaerator. The inlet steam flow rate of the low-pressure turbine was calculated by subtracting the steam demand of the feedwater pump driving turbines and the flow rate of the deaerator inlet steam from the flow rate of the medium-pressure turbine exhaust steam.
The flow rate at the tube side of the low-pressure feedwater heater was calculated considering the sum of steam and water flowing into the condenser, such as the drainage of the low-pressure feedwater heater, the exhaust steam of the low-pressure turbine, and the exhaust steam of the feedwater pump driving turbine. The amount of steam extracted from the low-pressure turbine was calculated according to the design conditions of the low-pressure feedwater heater (TTD and DCA). The steam excluding the extraction steam flowed into the next stage of the low-pressure turbine. The heat transfer rate of the boiler changed according to the final feedwater temperature. Under a certain final feedwater temperature, the flow rate of feedwater was changed until the calculated heat transfer rate of the boiler was equal to the reference value.
As shown in Table 2, five cases were modeled considering the main steam and reheat steam conditions of existing coal-fired power plants. The performances of the power plant according to the final feedwater temperature were analyzed.
Table 2.
Modelled cases.
To study the relationship between the final feedwater temperature and the performance of the power plant, the extraction pressure of the high-pressure turbine was changed from 70 bar to 120 bar. Therefore, the pressure of the extraction steam supplied to feedwater heater No. 8 and the shell internal pressure of feedwater heater No. 8 were changed. The performance analyses of the power plant were performed under 52 conditions of final feedwater temperature in the range 284.1 °C to 322.5 °C. Since the heat transfer rate of the boiler was identical, the flow rate of the HPT exhaust steam changed according to the flow rate of extraction steam of the HPT, and thus, the flow rate of feedwater and the flow rate of condensate water changed. Because the feedwater pumps were driven by the steam turbines, no additional electric power was consumed. However, the power consumption of the condensate pump changed according to the flow rate of the condensate water. The power consumption of the condensate pump () also changes in proportion to the flow rate of the condensate water. The net efficiency of the power plant () was calculated from the net output of the power plant ().
3. Results and Discussion
The reference case in each case was the power plant in which the final feedwater temperature was 287.5 °C. The data increment was defined as the data of the reference case subtracted from the data of a certain case.
3.1. Final Feedwater Temperature and Feedwater System
To raise the final feedwater temperature under the condition of the same TTD, which was the main design factor of the feedwater heater, the saturated steam pressure on the shell side of the No. 8 feedwater heater was increased. To increase the shell side saturated steam pressure, the pressure of the HPT extraction steam to the shell side of feedwater heater No. 8 should be increased. Therefore, to raise the final feedwater temperature, the HPT extraction steam pressure supplied to feedwater heater No. 8 should be increased.
Figure 3 shows the relationship between the pressure of the HPT extraction steam and the final feedwater temperature. As shown in Figure 3, under the condition that TTD and the pressure drop ratio of the extraction steam pipe were constant, the final feedwater temperature and the HPT extraction steam pressure were proportional. In the definition of TTD, the final feedwater temperature was a function of the saturated steam temperature according to the pressure of the feedwater heater shell.
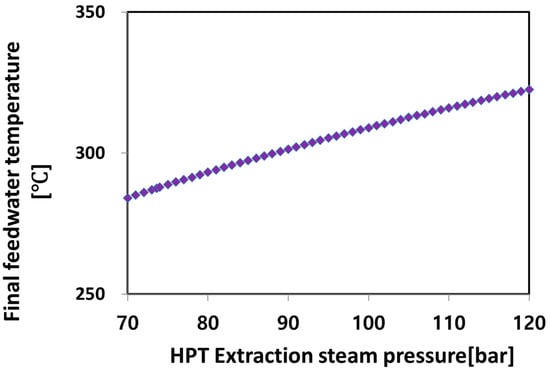
Figure 3.
Final feedwater temperature versus HPT extraction steam pressure.
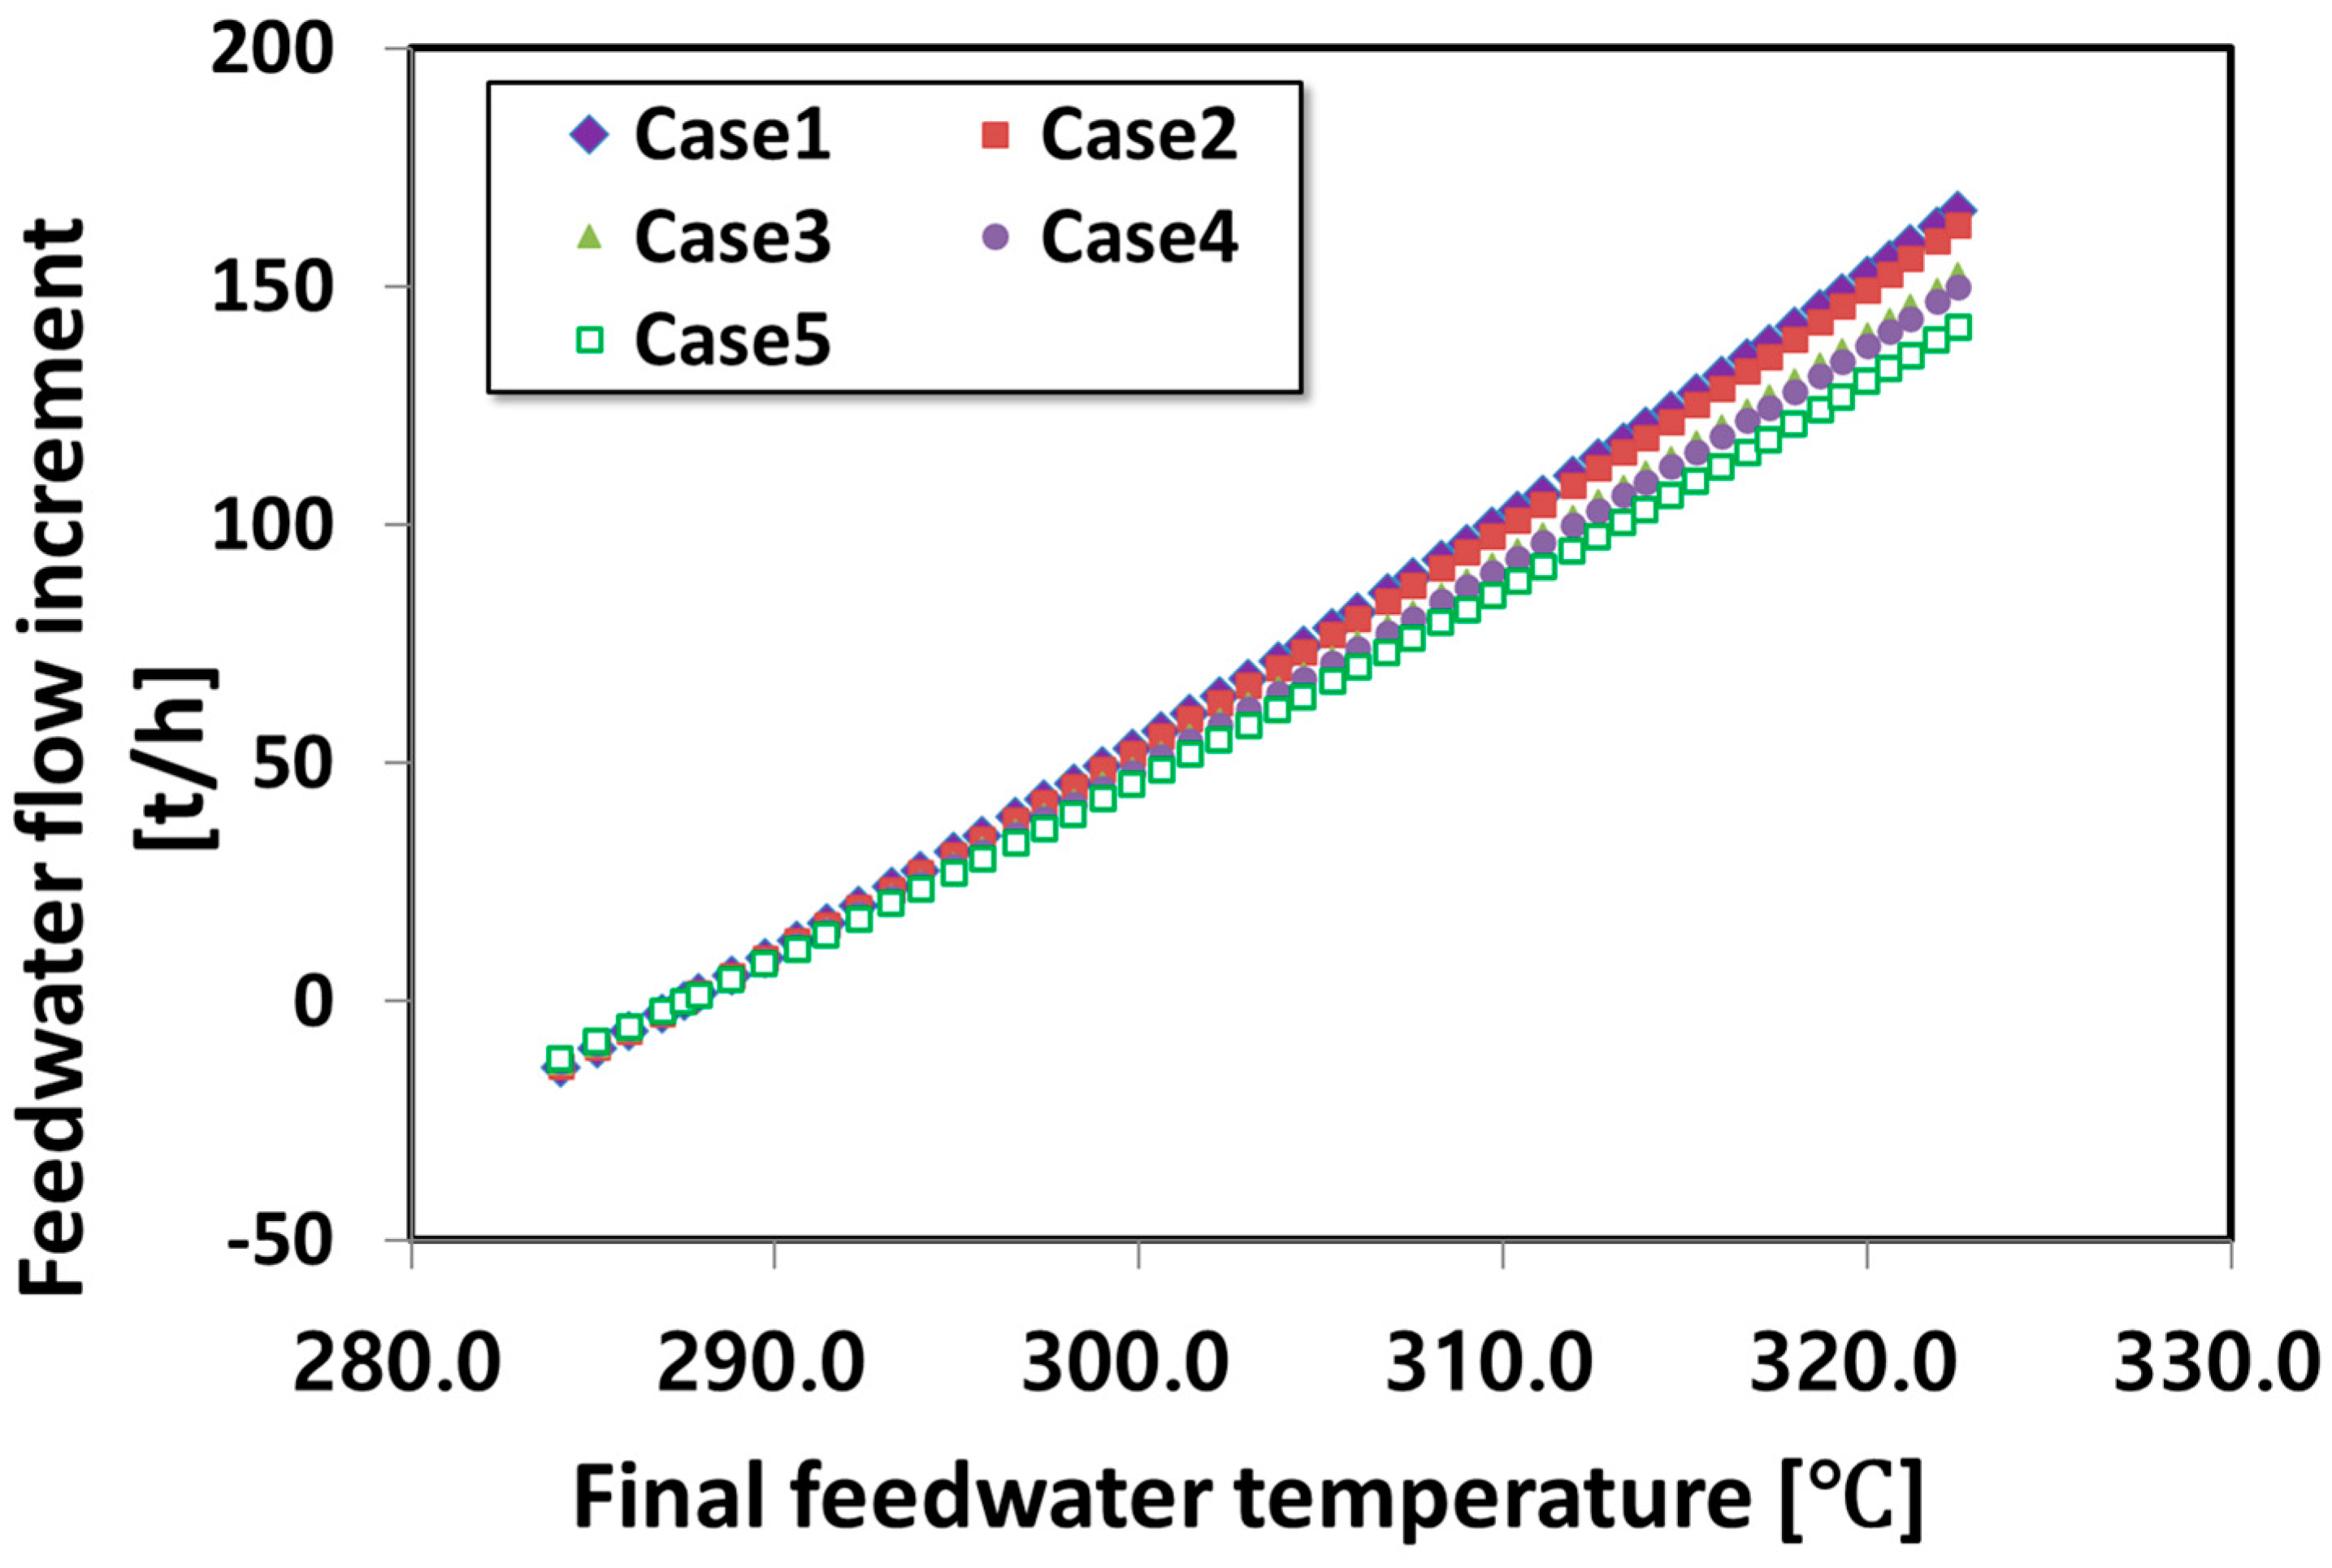
As shown in Figure 4, the flow rate increment of feedwater supplied to the boiler and the final feedwater temperature were proportional in all cases. As the temperature of the main steam or the temperature of reheat steam was increased, the change rate of the feedwater flow rate increment according to the final feedwater temperature was decreased.
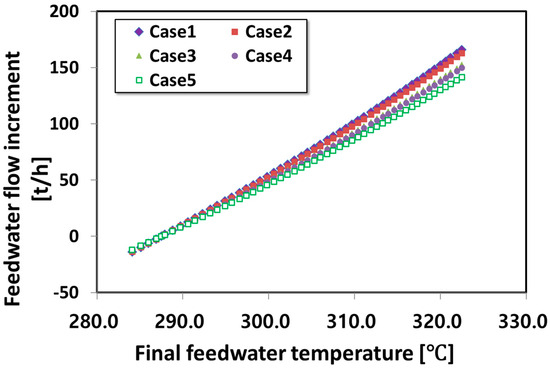
Figure 4.
Feedwater flow increment versus final feedwater temperature.
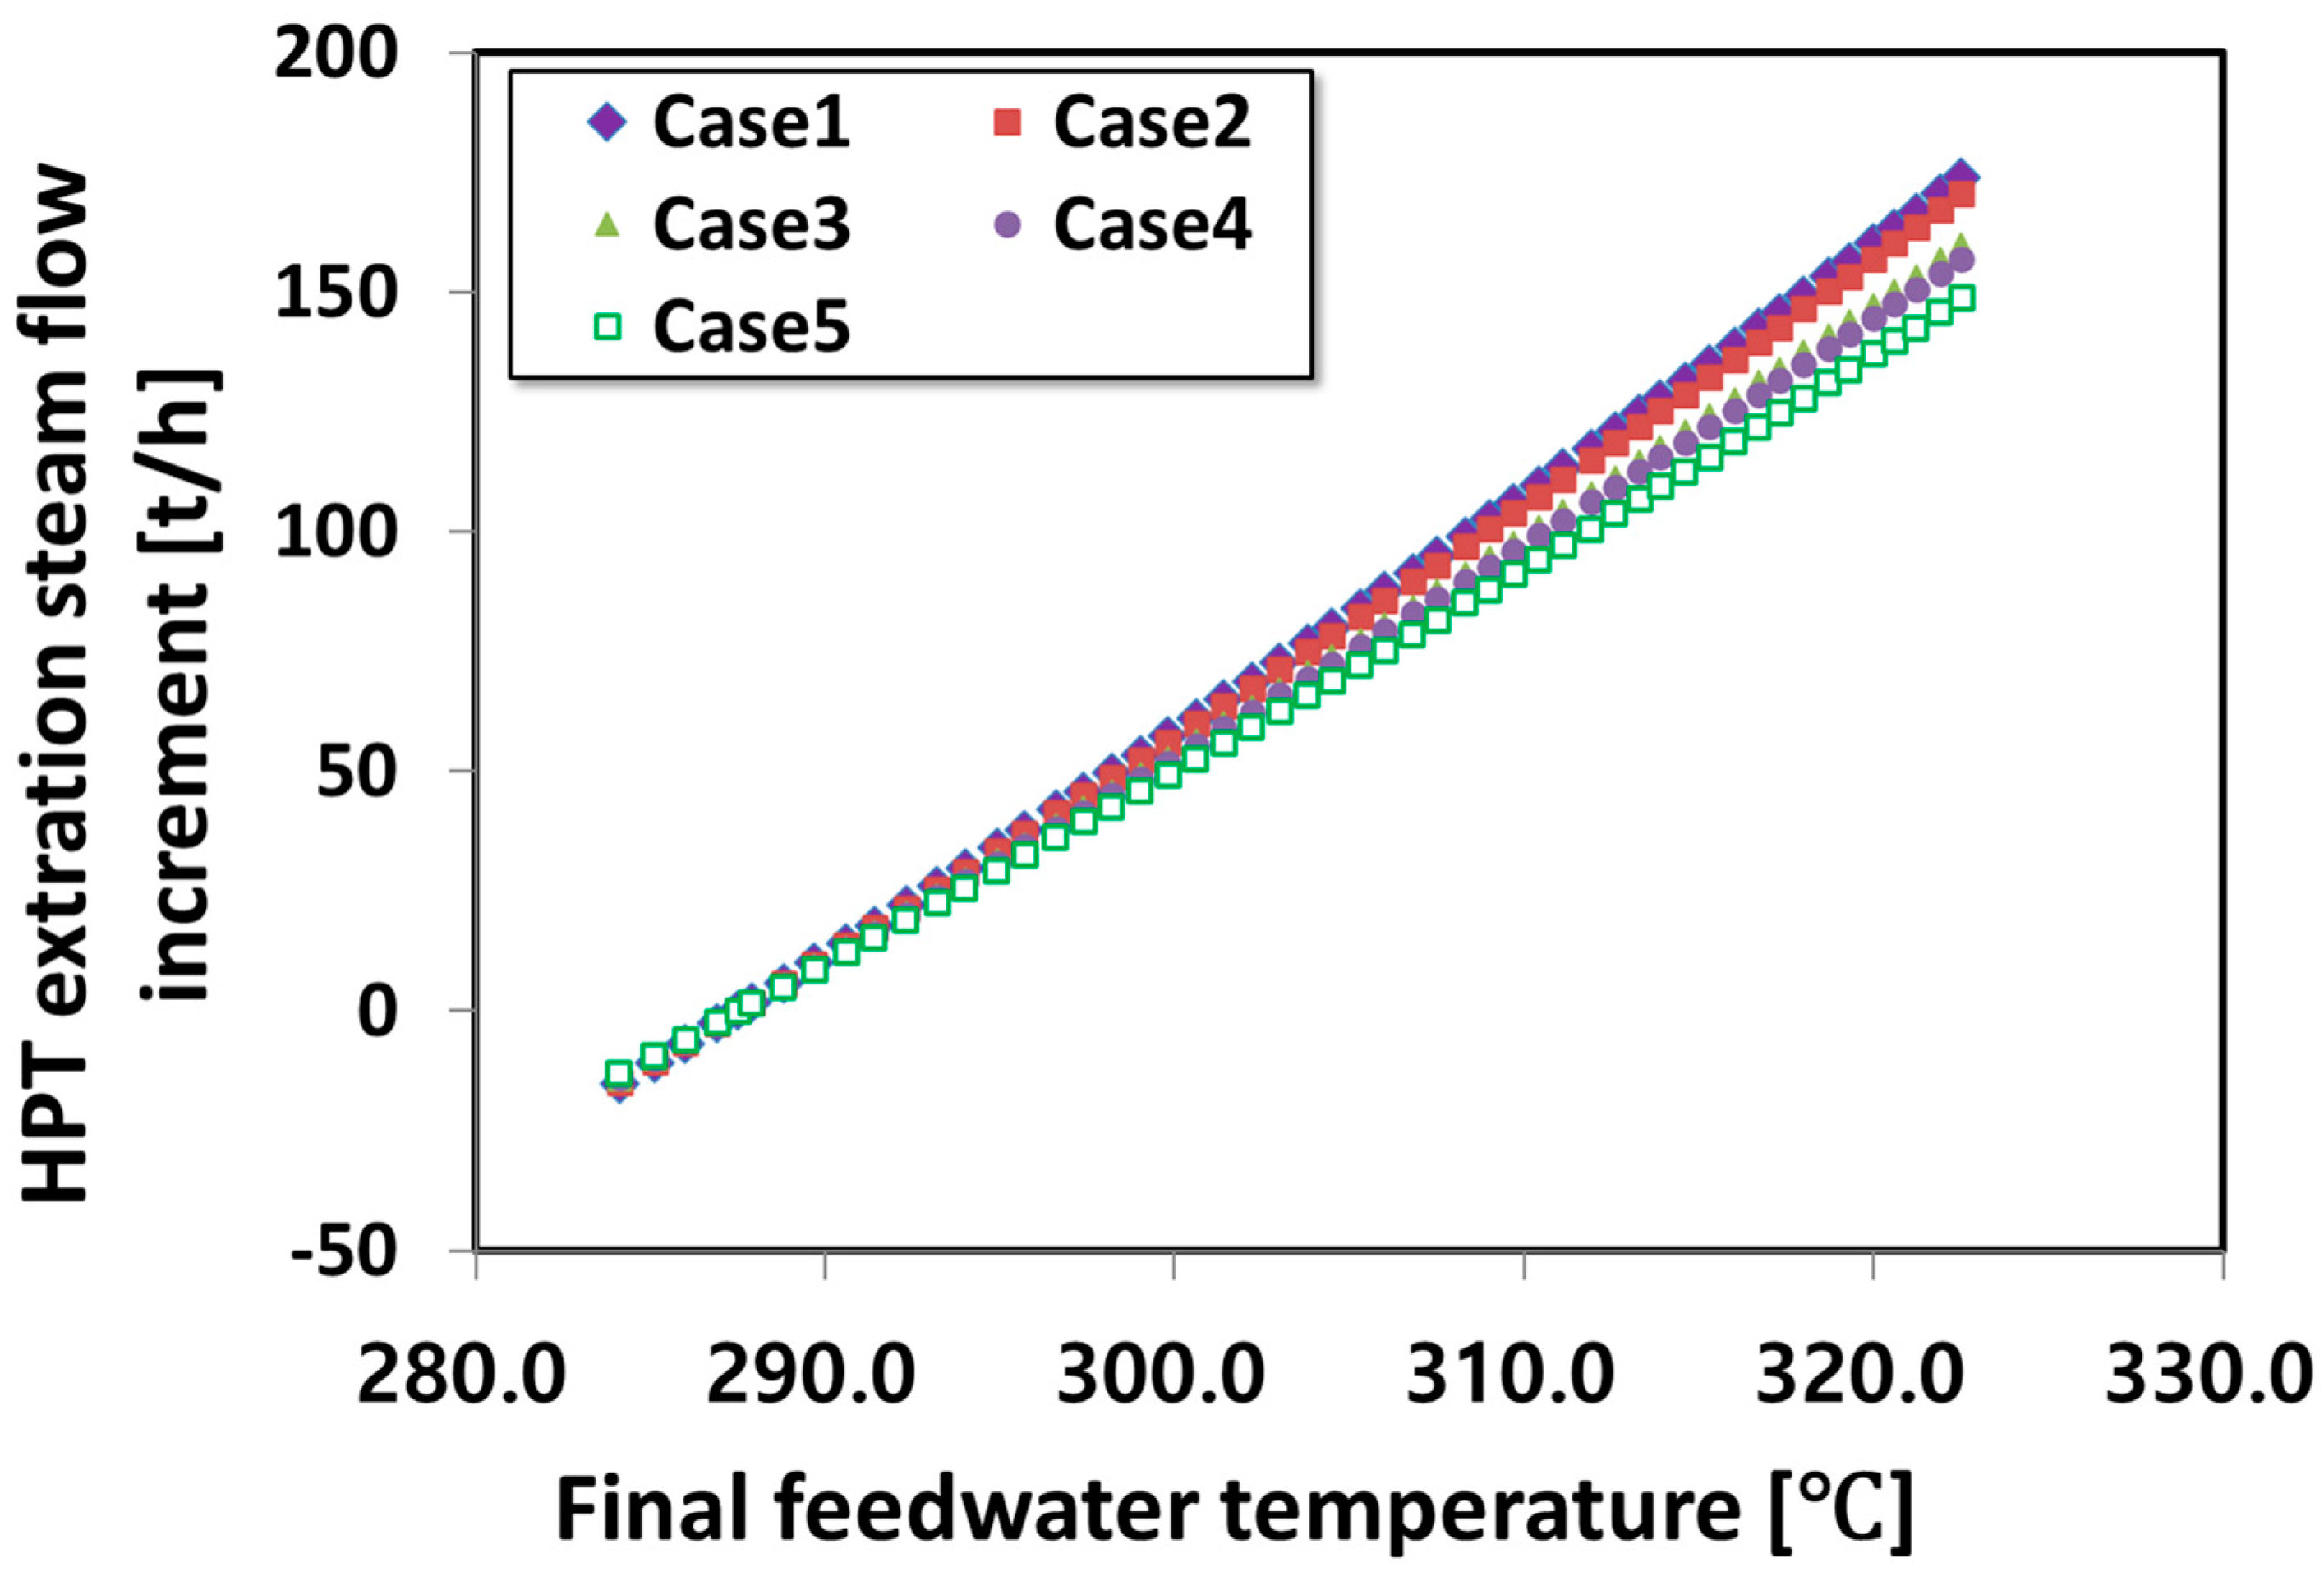
Figure 5 shows the final feedwater temperature and the flow rate increment of the HPT extraction steam. In all cases, the Pearson product-moment correlation coefficient between the final feedwater temperature and the flow rate increment of HPT extraction steam was over +0.9996. As shown in Figure 5, the flow rate increment of the HPT extraction steam and the final feedwater temperature were proportional and strongly correlated. If the final feedwater temperature increased by 1 °C, the flow rate increment of the HPT extraction steam increased by 4.92 t/h in case 1, 4.82 t/h in case 2, 4.53 t/h in case 3, 4.45 t/h in case 4, and 4.21 t/h in case 5. Considering cases 1–4, in which the main steam temperature was identical, the change rate of the flow rate increment of the HPT extraction steam according to the final feedwater temperature decreased as the reheat temperature increased. Considering cases 2–5, in which the reheat temperature was identical, the change rate of the flow rate increment of the HPT extraction steam according to the final feedwater temperature decreased as the reheat temperature increased. As the temperature of the main steam or the temperature of reheat steam increased, the change rate of the HPT extraction steam flow rate increment according to the final feedwater temperature decreased.
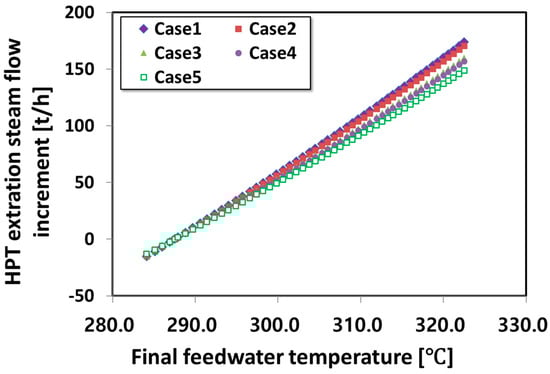
Figure 5.
HPT extraction steam increment flow versus final feedwater temperature.
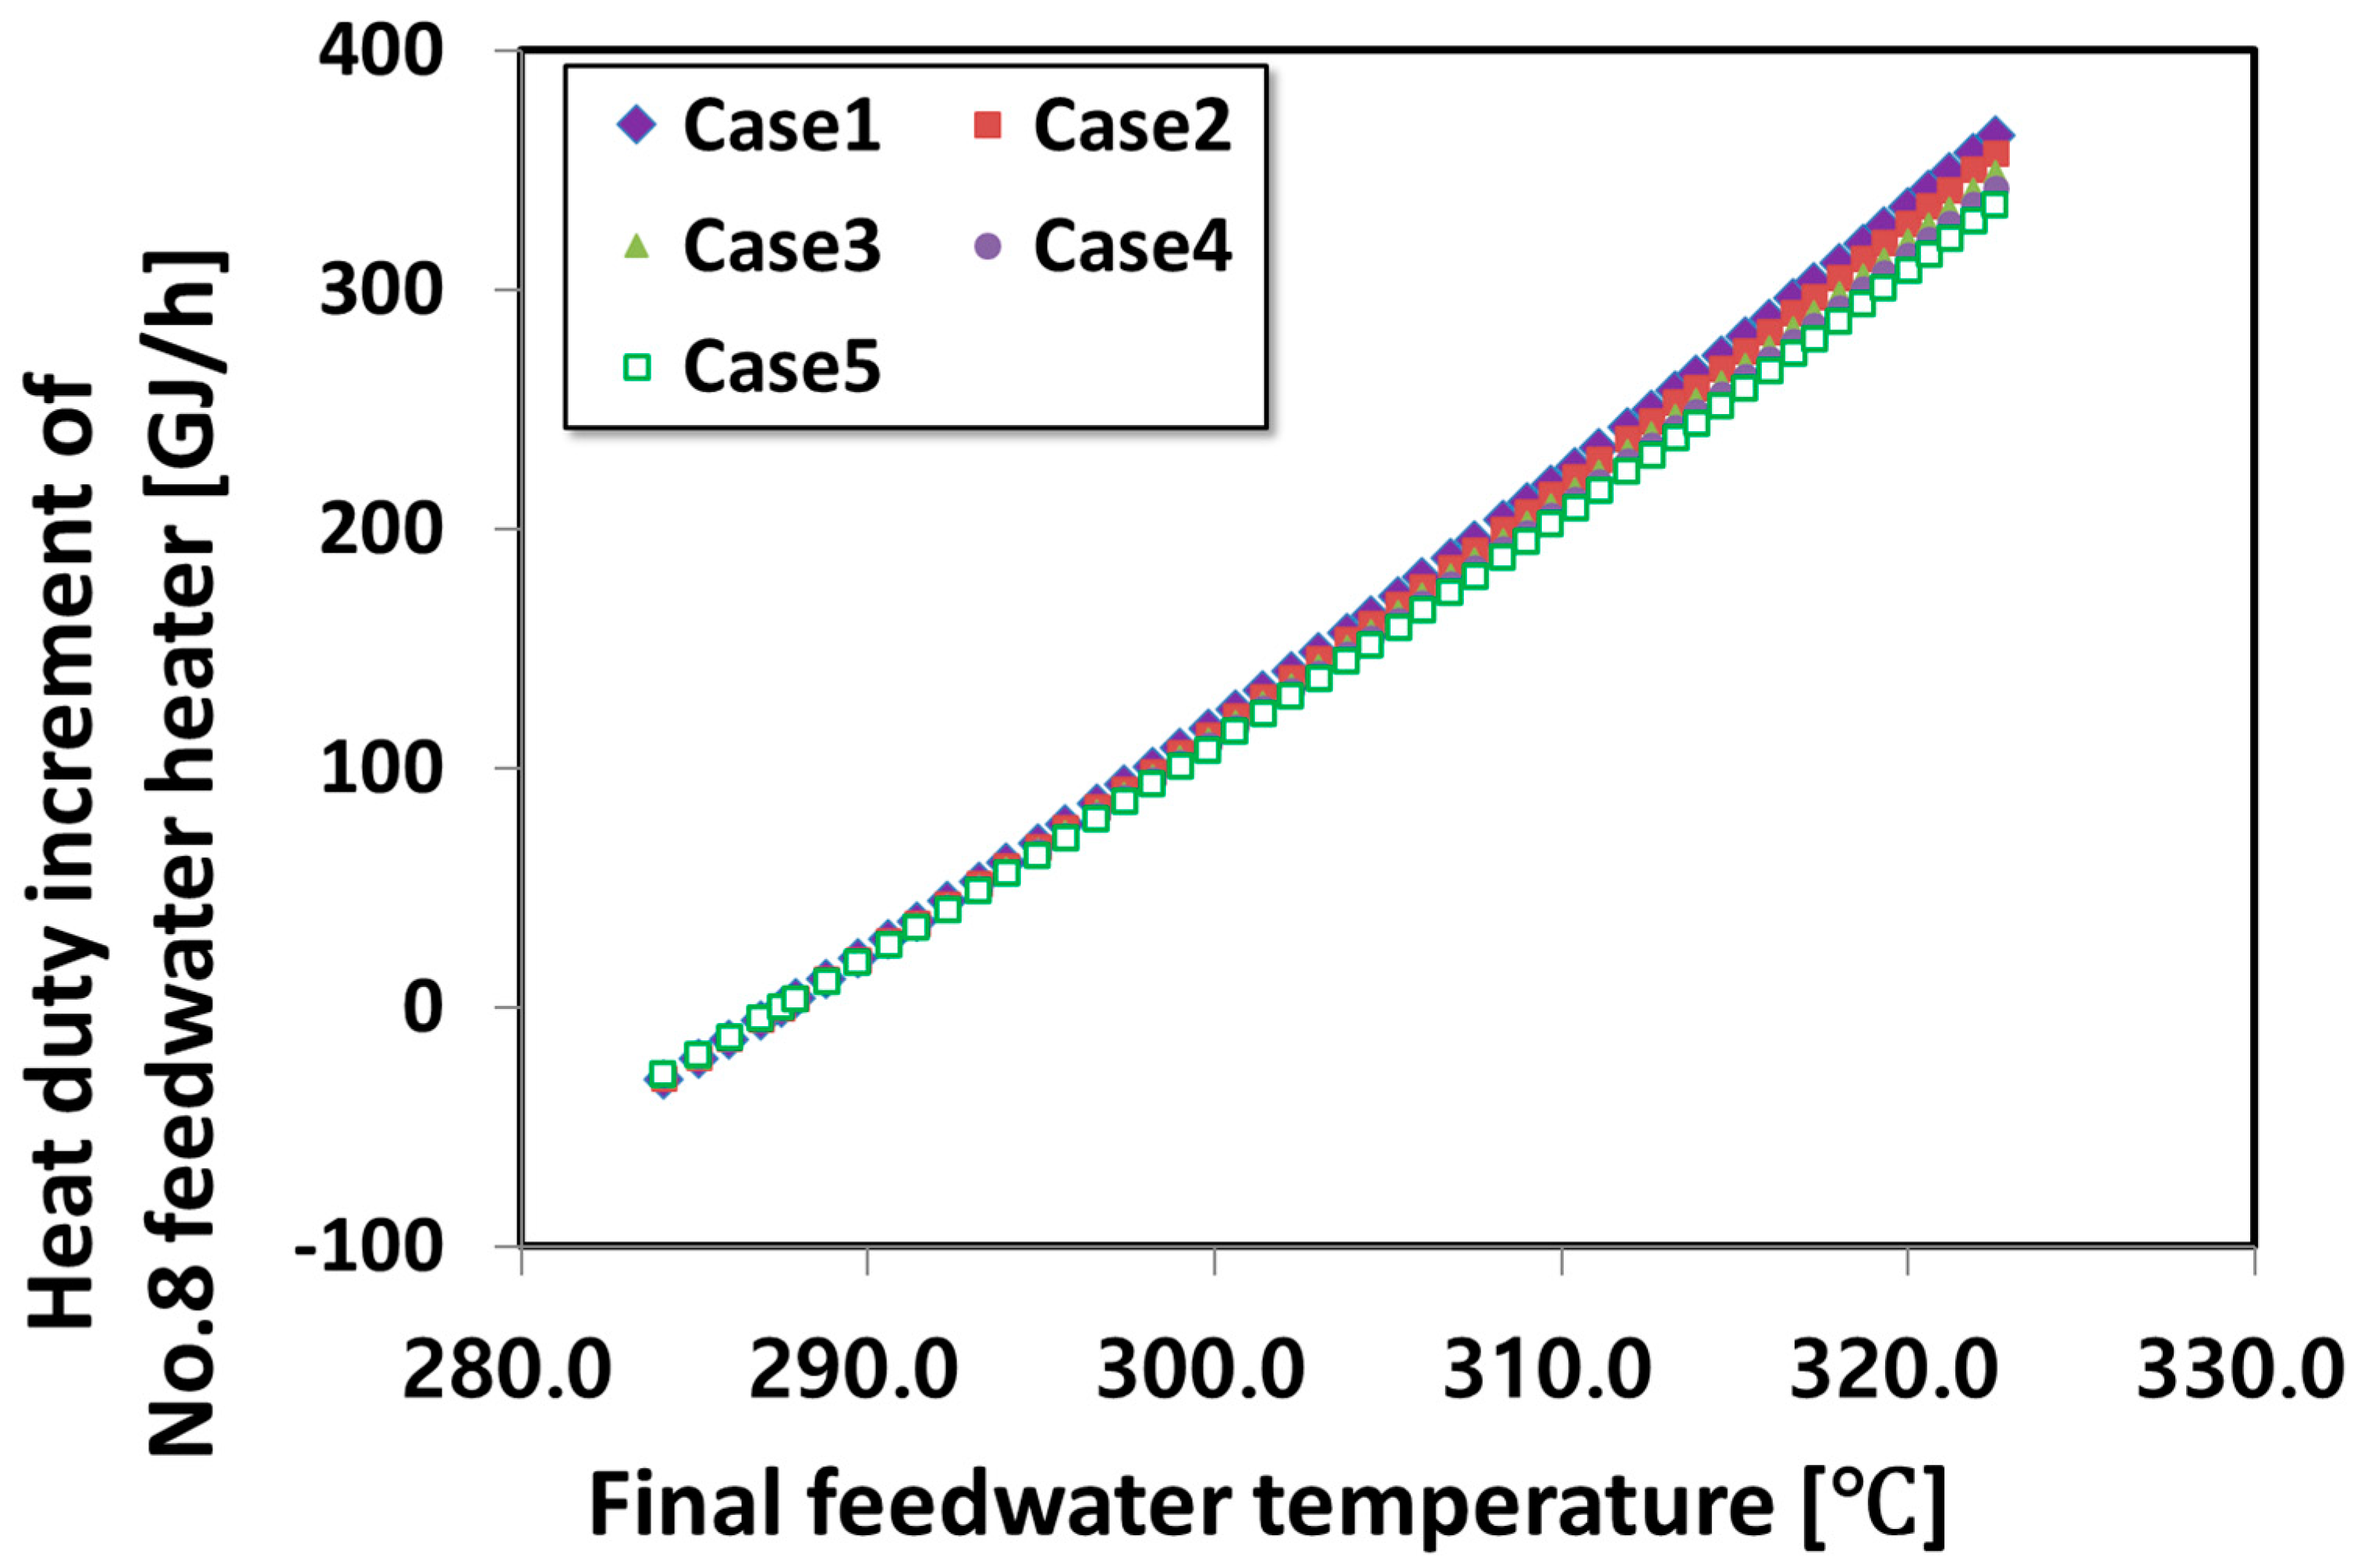
The heat duty increments in feedwater heater No. 8 versus the final feedwater temperature are shown in Figure 6. The temperature of the feedwater supplied to the tube side of feedwater heater No. 8 was identical. As the final feedwater temperature and the feedwater flow rate increased, the heat duty of feedwater heater No. 8 increased. Similar to the change rate of the HPT extraction steam flow rate increment, the temperature of the main steam or the temperature of reheat steam increased, and the change rate of the heat duty increment of feedwater heater No. 8 according to the final feedwater temperature decreased.
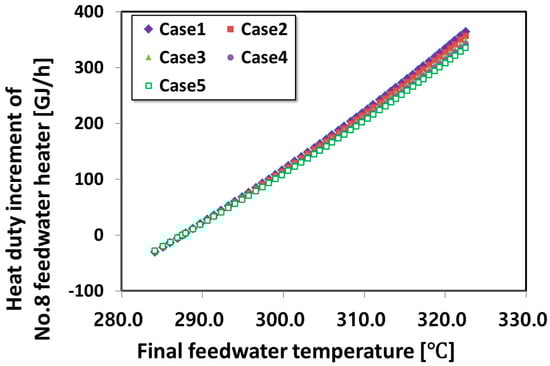
Figure 6.
Heat duty increment of No. 8 feedwater heater versus final feedwater temperature.
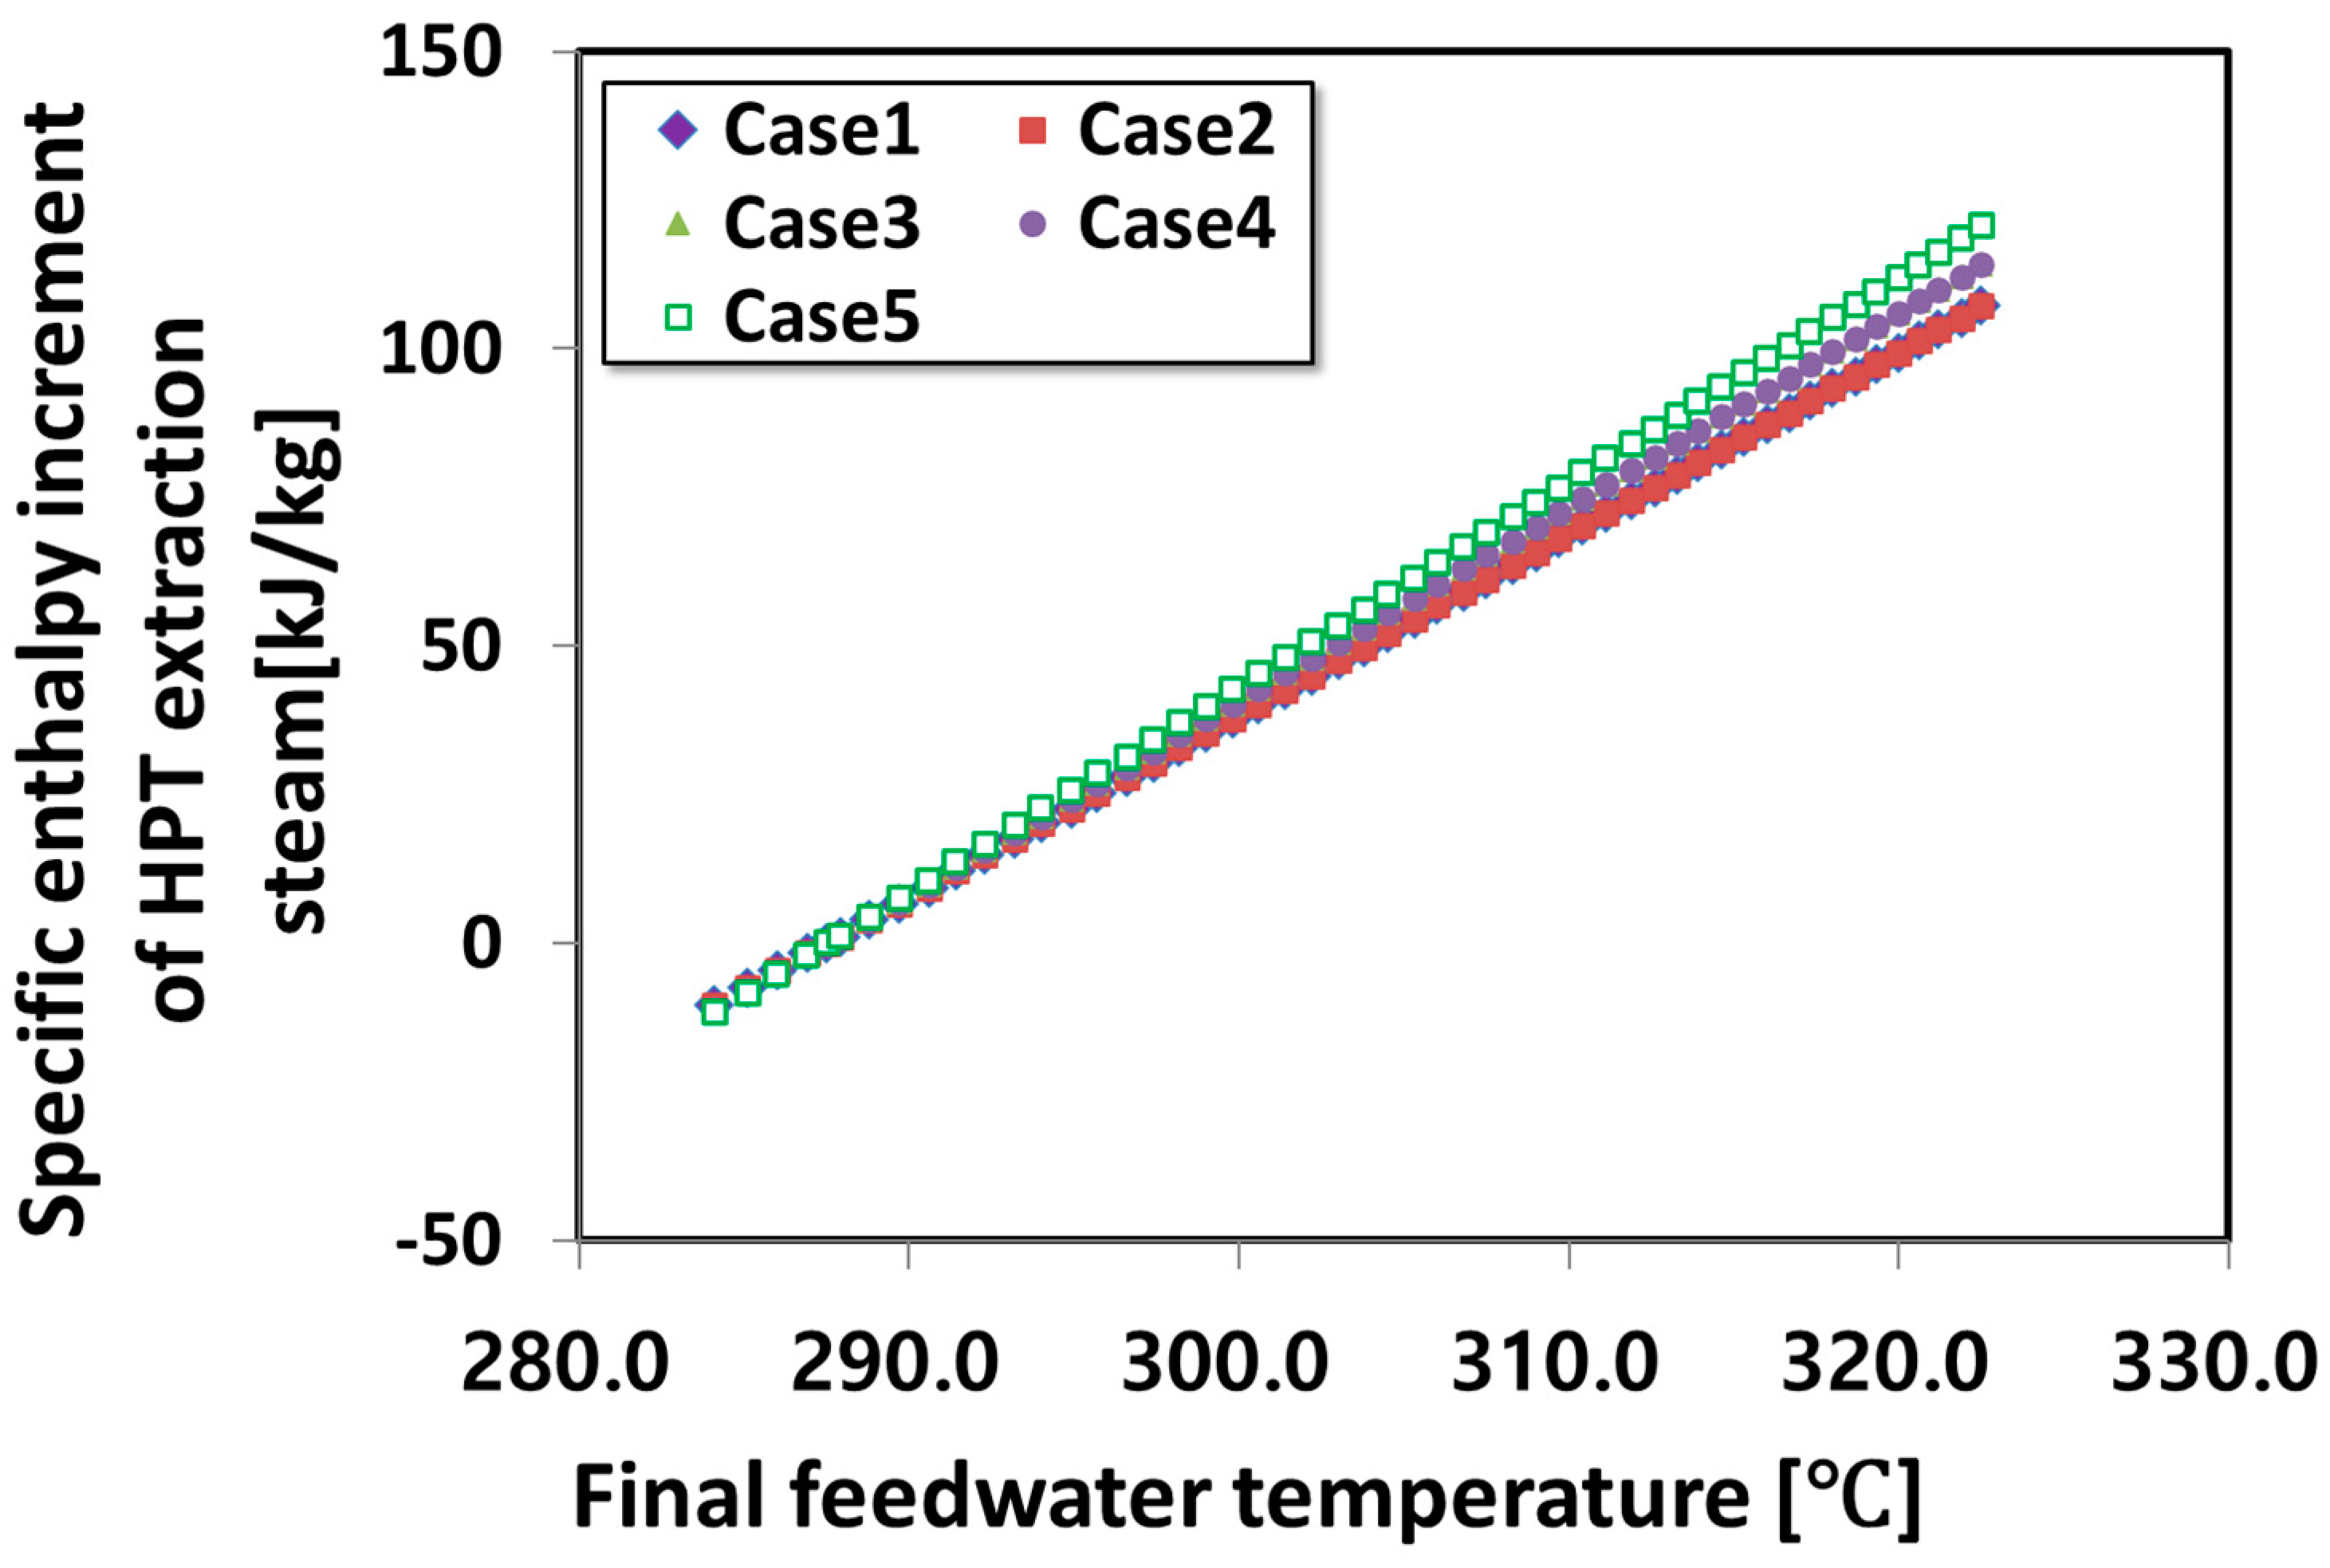
The specific enthalpy increments in HPT extraction steam versus final feedwater temperature are shown in Figure 7. In all cases, the Pearson product-moment correlation coefficient between the final feedwater temperature and the specific enthalpy increment of HPT extraction steam was +1.0. As shown in Figure 7, the final feedwater temperature and the specific enthalpy increment of HPT extraction steam were proportional and had a positive linear relationship. As the final feedwater temperature increased, the specific enthalpy of HPT extraction steam also increased linearly. In the case where the main steam temperature was higher, the change rate of the specific enthalpy increment of HPT extraction steam was relatively higher. When the final feedwater temperature increased, the increase in the specific enthalpy of HPT extraction steam partially offset the increase in the heat duty of the feedwater heater No. 8. However, the heat duty of the feedwater heater increased more rapidly due to the increase in the feedwater flow rate and the final feedwater temperature. Therefore, the flow rate of the HPT extraction steam increased. As the temperature of the main steam decreased, the change rate of the specific enthalpy increments of the HPT extraction steam relatively decreased. Consequently, the flow rate increment of the HPT extraction steam increased more.
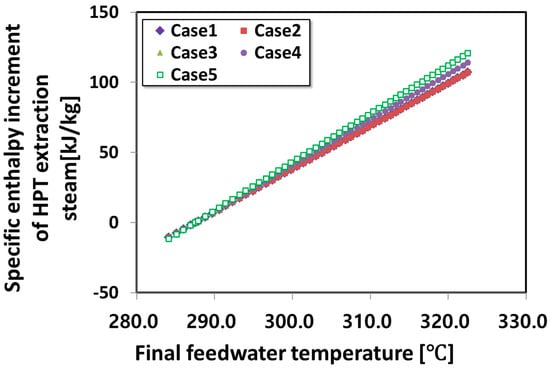
Figure 7.
Specific enthalpies increment of extraction steam versus final feedwater temperature.
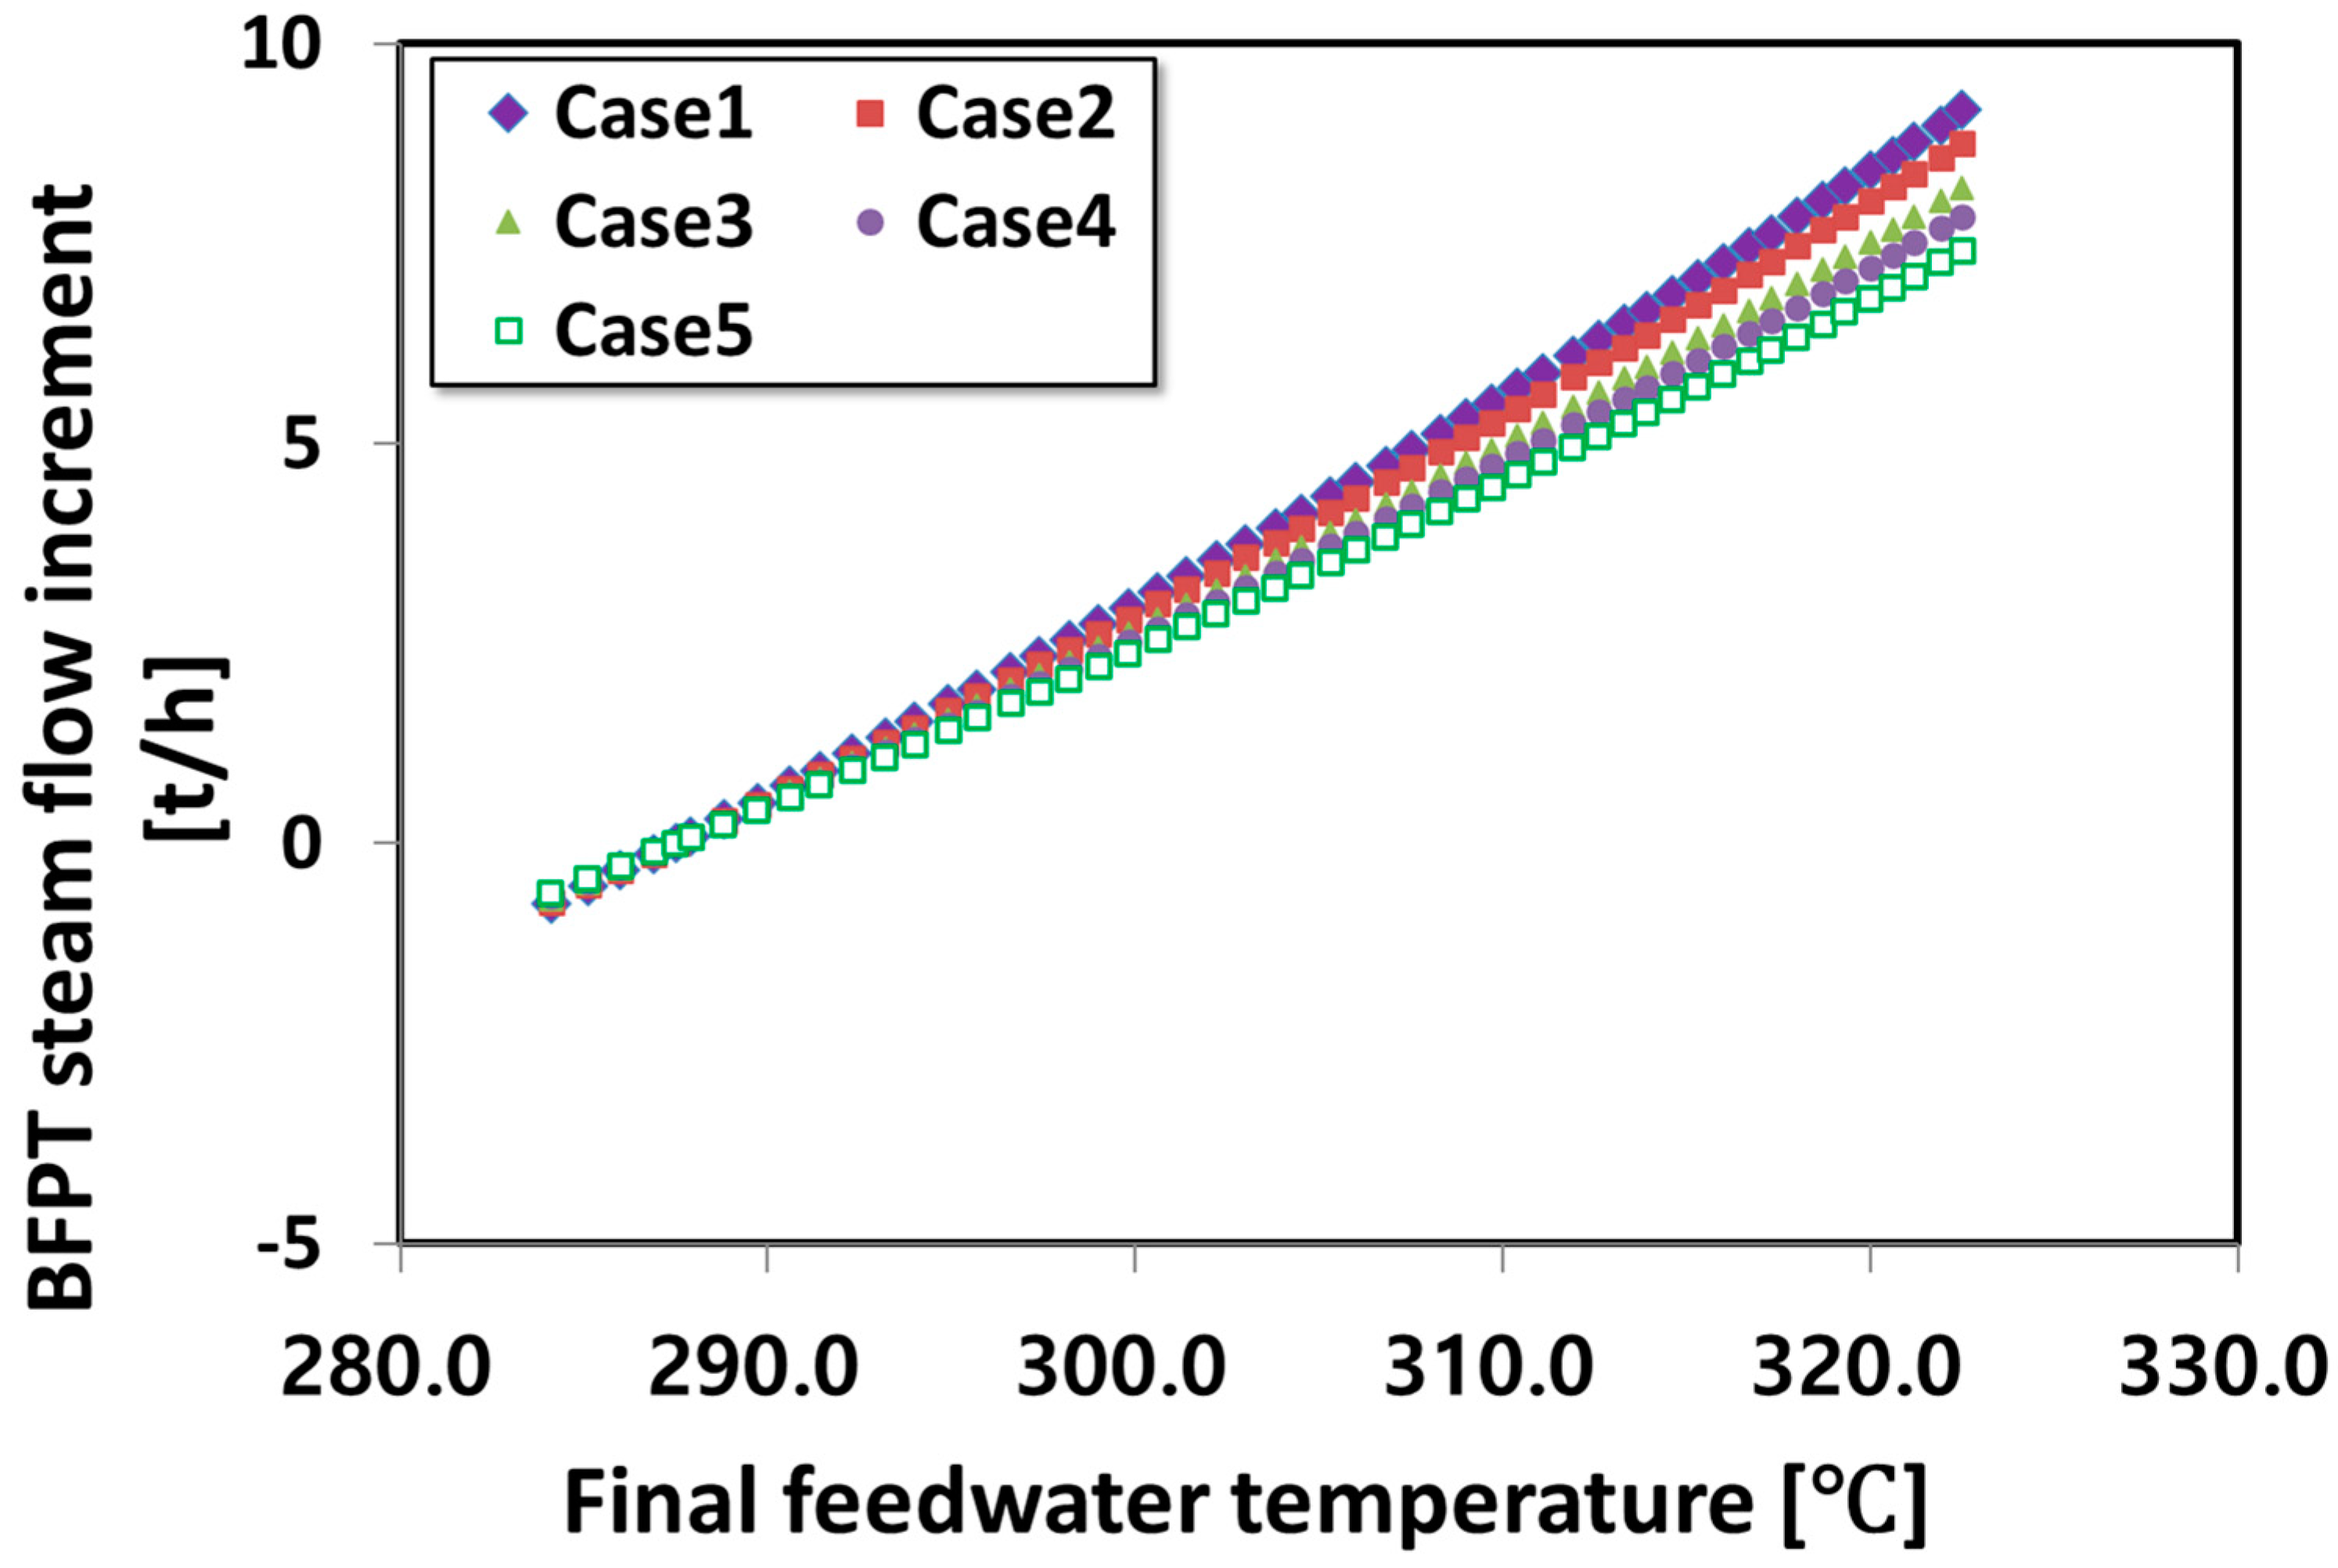
Figure 8 shows the steam flow rate increment supplied to the boiler feedwater pump driving turbine (hereinafter BFPT) versus the final feedwater temperature. As shown in Figure 4, in all cases, as the final feedwater temperature increased, the flow rate of feedwater also increased. Accordingly, the brake horsepower of the boiler feedwater pump increased, too. As the brake horsepower of the boiler feedwater pump increased, the steam flow rate supplied to the BFPT also increased. As the flow rate of steam supplied to the BFPT increased, the flow rate of steam supplied to the low-pressure turbine (hereinafter LPT) decreased, and the power output of the LPT was reduced.

Figure 8.
BFPT steam flow increment versus final feedwater temperature.
3.2. Condensate Water System
Figure 9 shows the flow rate increment of condensate water versus the final feedwater temperature. Up to a final feedwater temperature of 312.6 °C, the flow rate increment of condensate water decreased as the final feedwater temperature increased. At a final feedwater temperature of 312.6 °C, the flow rate increment of condensate water was minimized. If the final feedwater temperature was higher than 312.6 °C, as the final feedwater temperature increased, the flow rate increment of condensate water increased again.
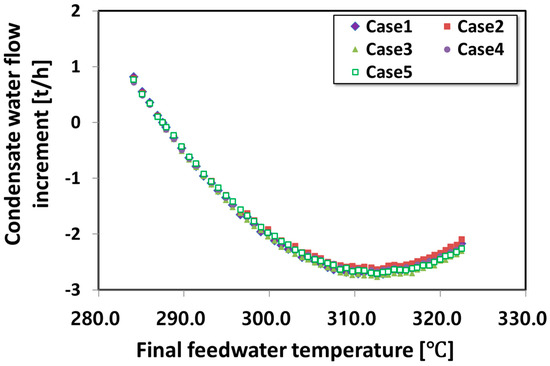
Figure 9.
Condensate water flow increment versus final feedwater temperature.
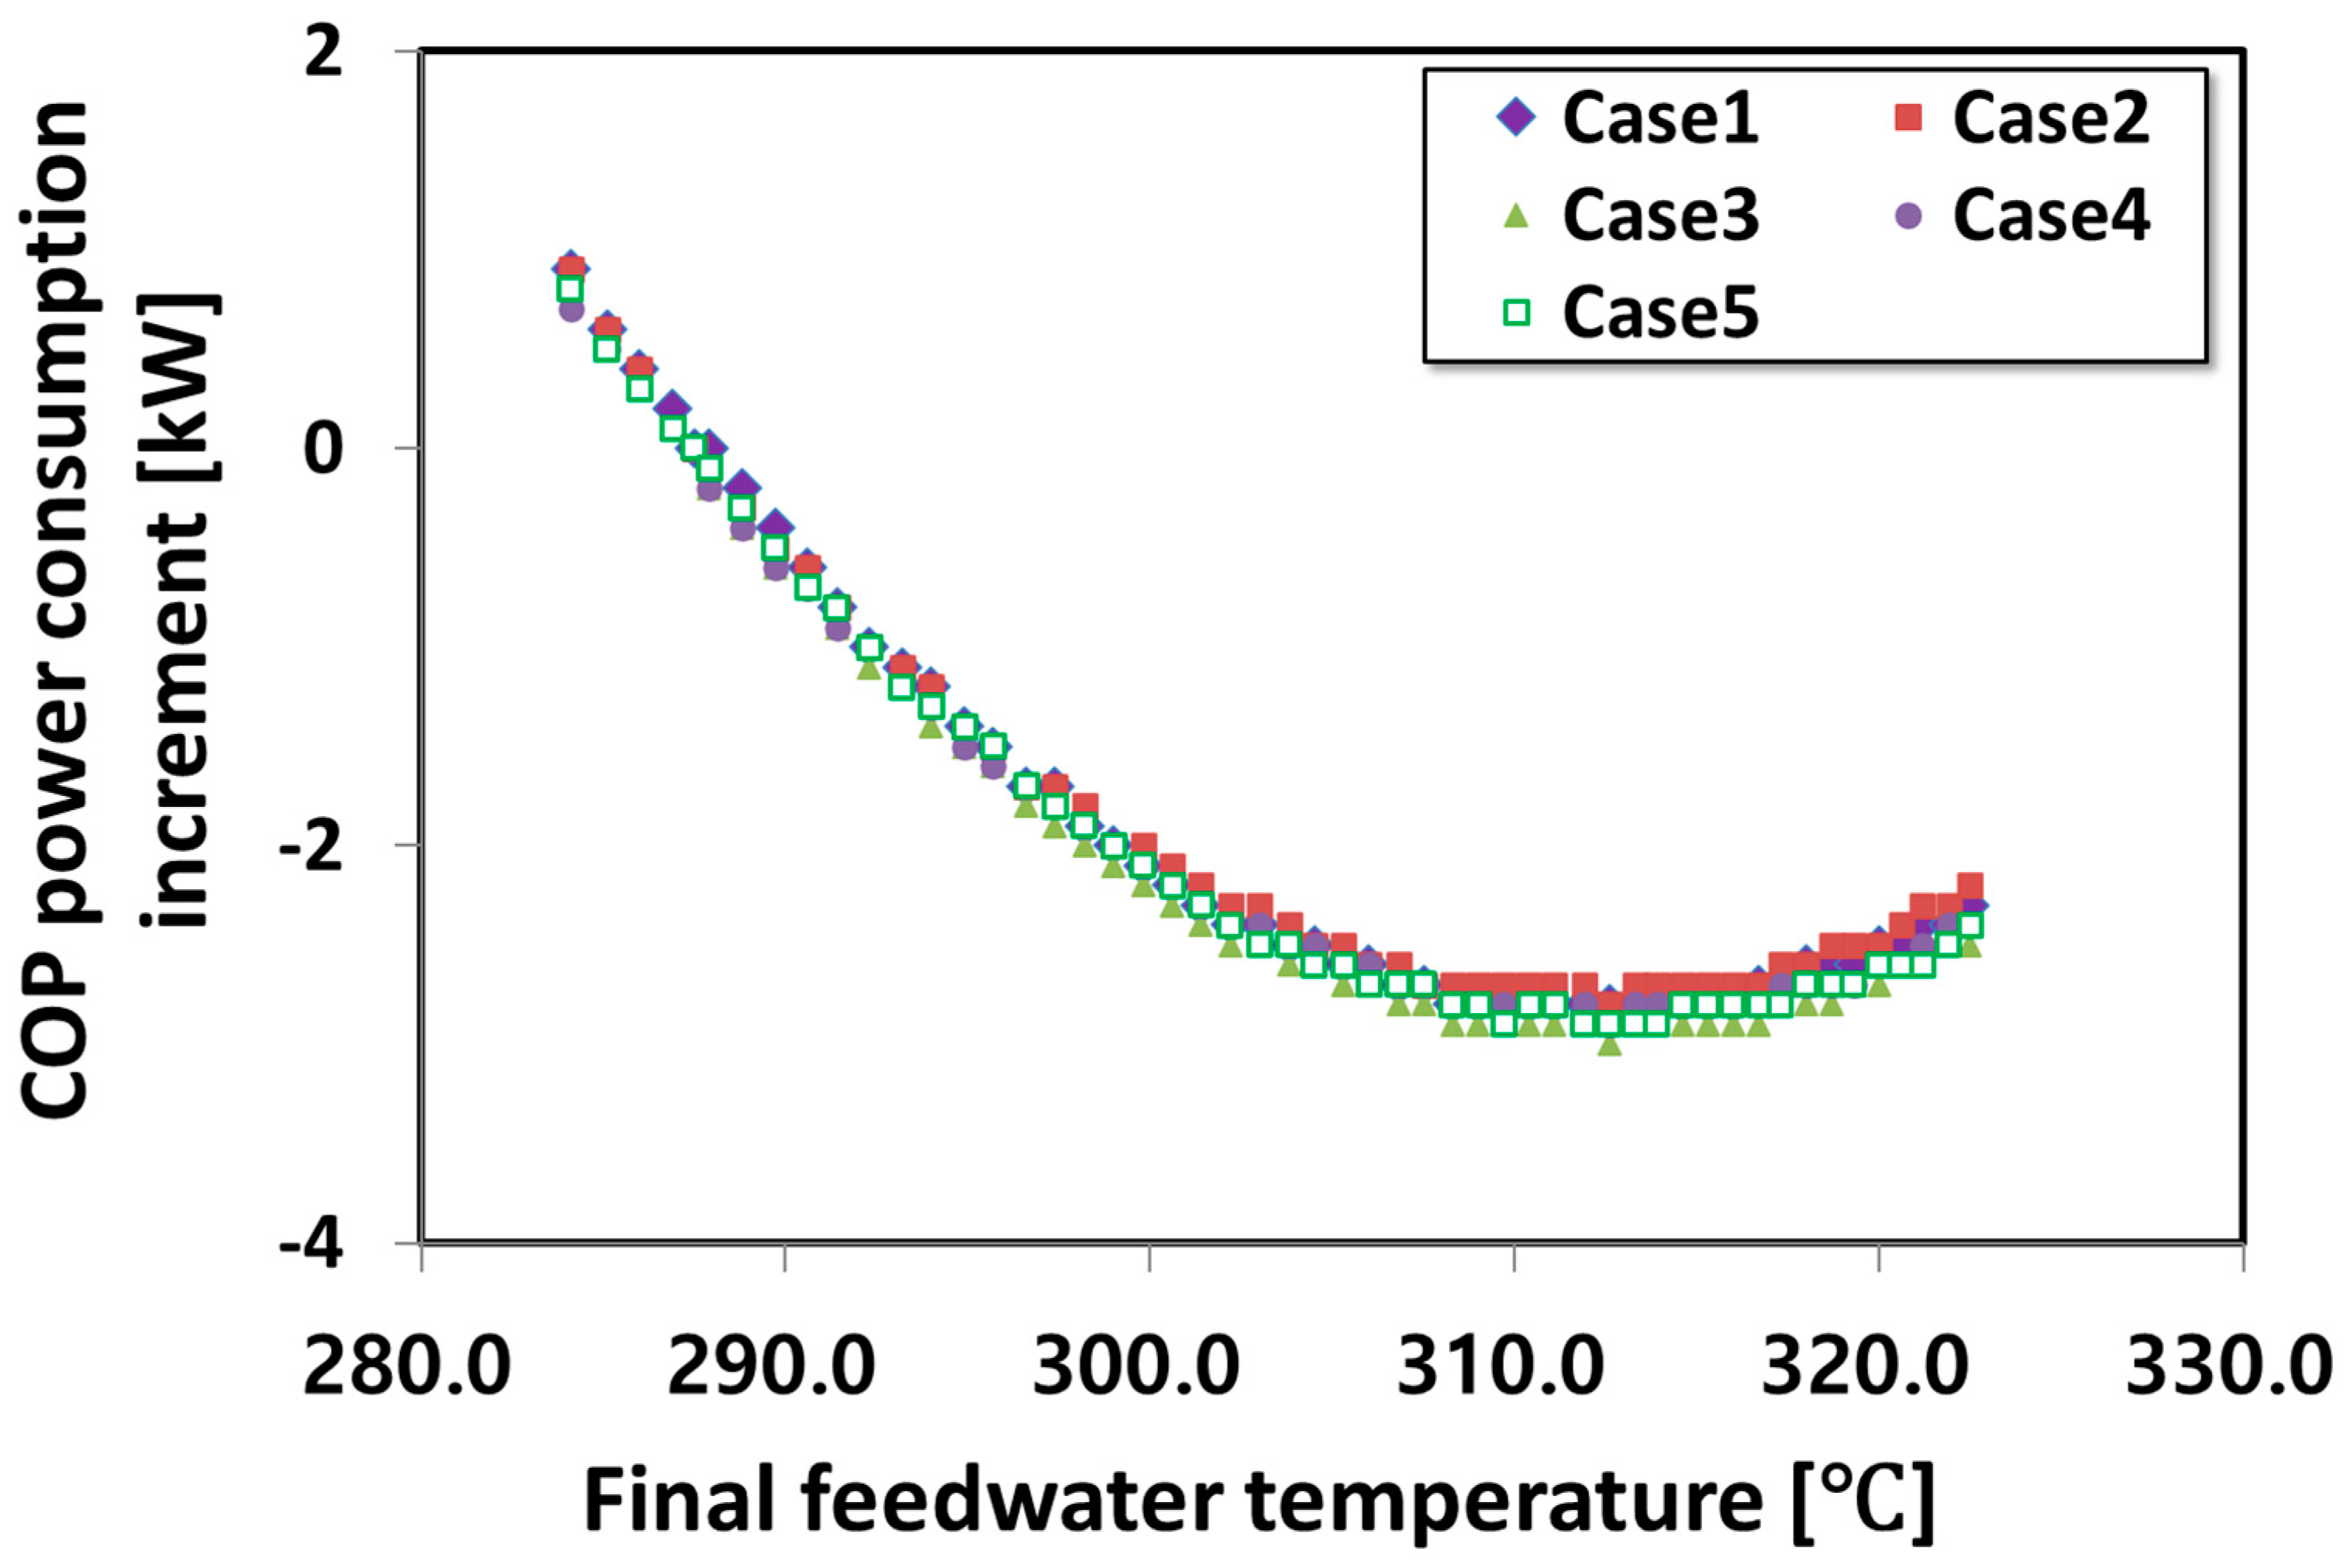
The final feedwater temperature versus the power consumption increment of the condensate pump (hereinafter COP) is shown in Figure 10. Since the flow rate of the condensate water was a major factor in determining the power consumption of the COP, the flow rate increment of condensate water and the power consumption increment of the COP changed in a similar pattern.

Figure 10.
Power consumption increment of condensate pump versus final feedwater temperature.
3.3. Exergy Destruction Rate of Power Plant
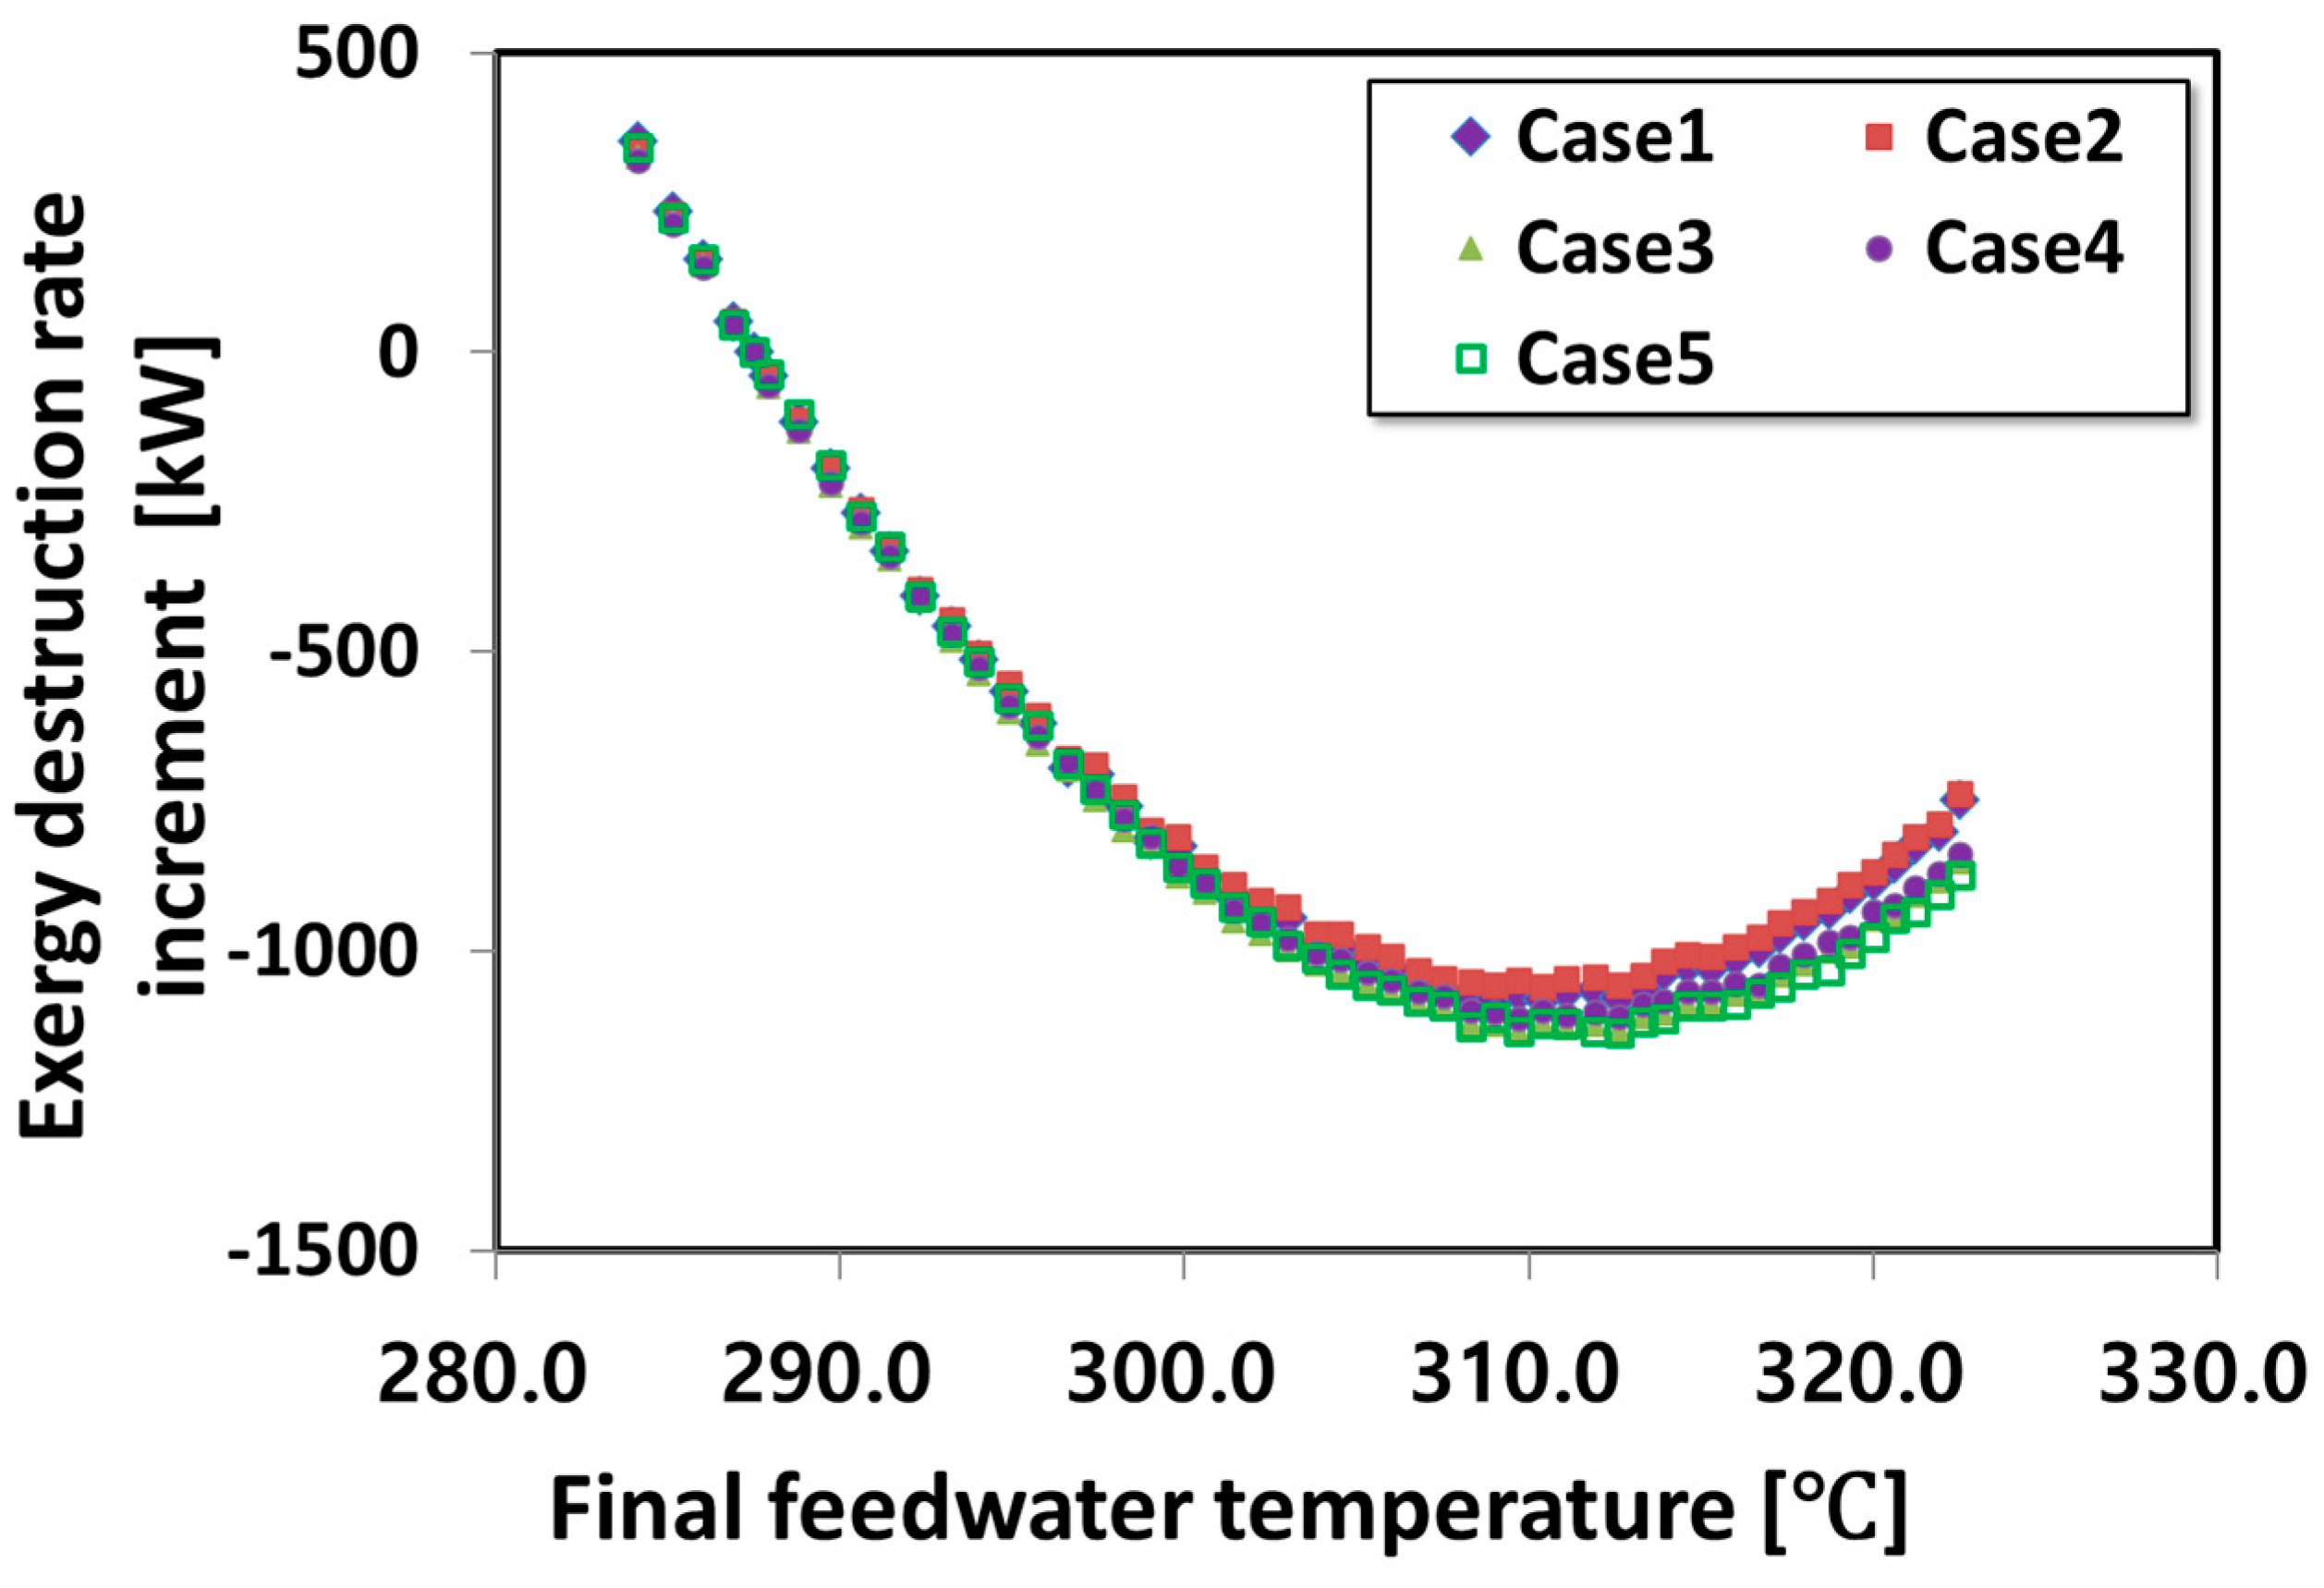
Exergy analysis was conducted on the boiler, reheater, HPT, IP turbine, deaerator, feedwater heater No. 6, feedwater heater No. 7, feedwater heater No. 8, BFPT, and BFP, as these components are significantly influenced by changes in the final feedwater temperature. A lower sum of exergy destruction rates indicates a more efficient cycle. Figure 11 illustrates the increment in the sum of the exergy destruction rates for each component based on the final feedwater temperature. In all cases, there was a specific final feedwater temperature at which the exergy destruction rate increment reached its minimum value. Specifically, for cases 1 and 2, the final feedwater temperature was 310.4 °C; for cases 3 and 4, it was 309.7 °C; and for case 5, it was 312.6 °C.

Figure 11.
Exergy destruction rate increment versus final feedwater temperature.
3.4. Gross Output, Net Output, and Net Efficiency of Power Plant
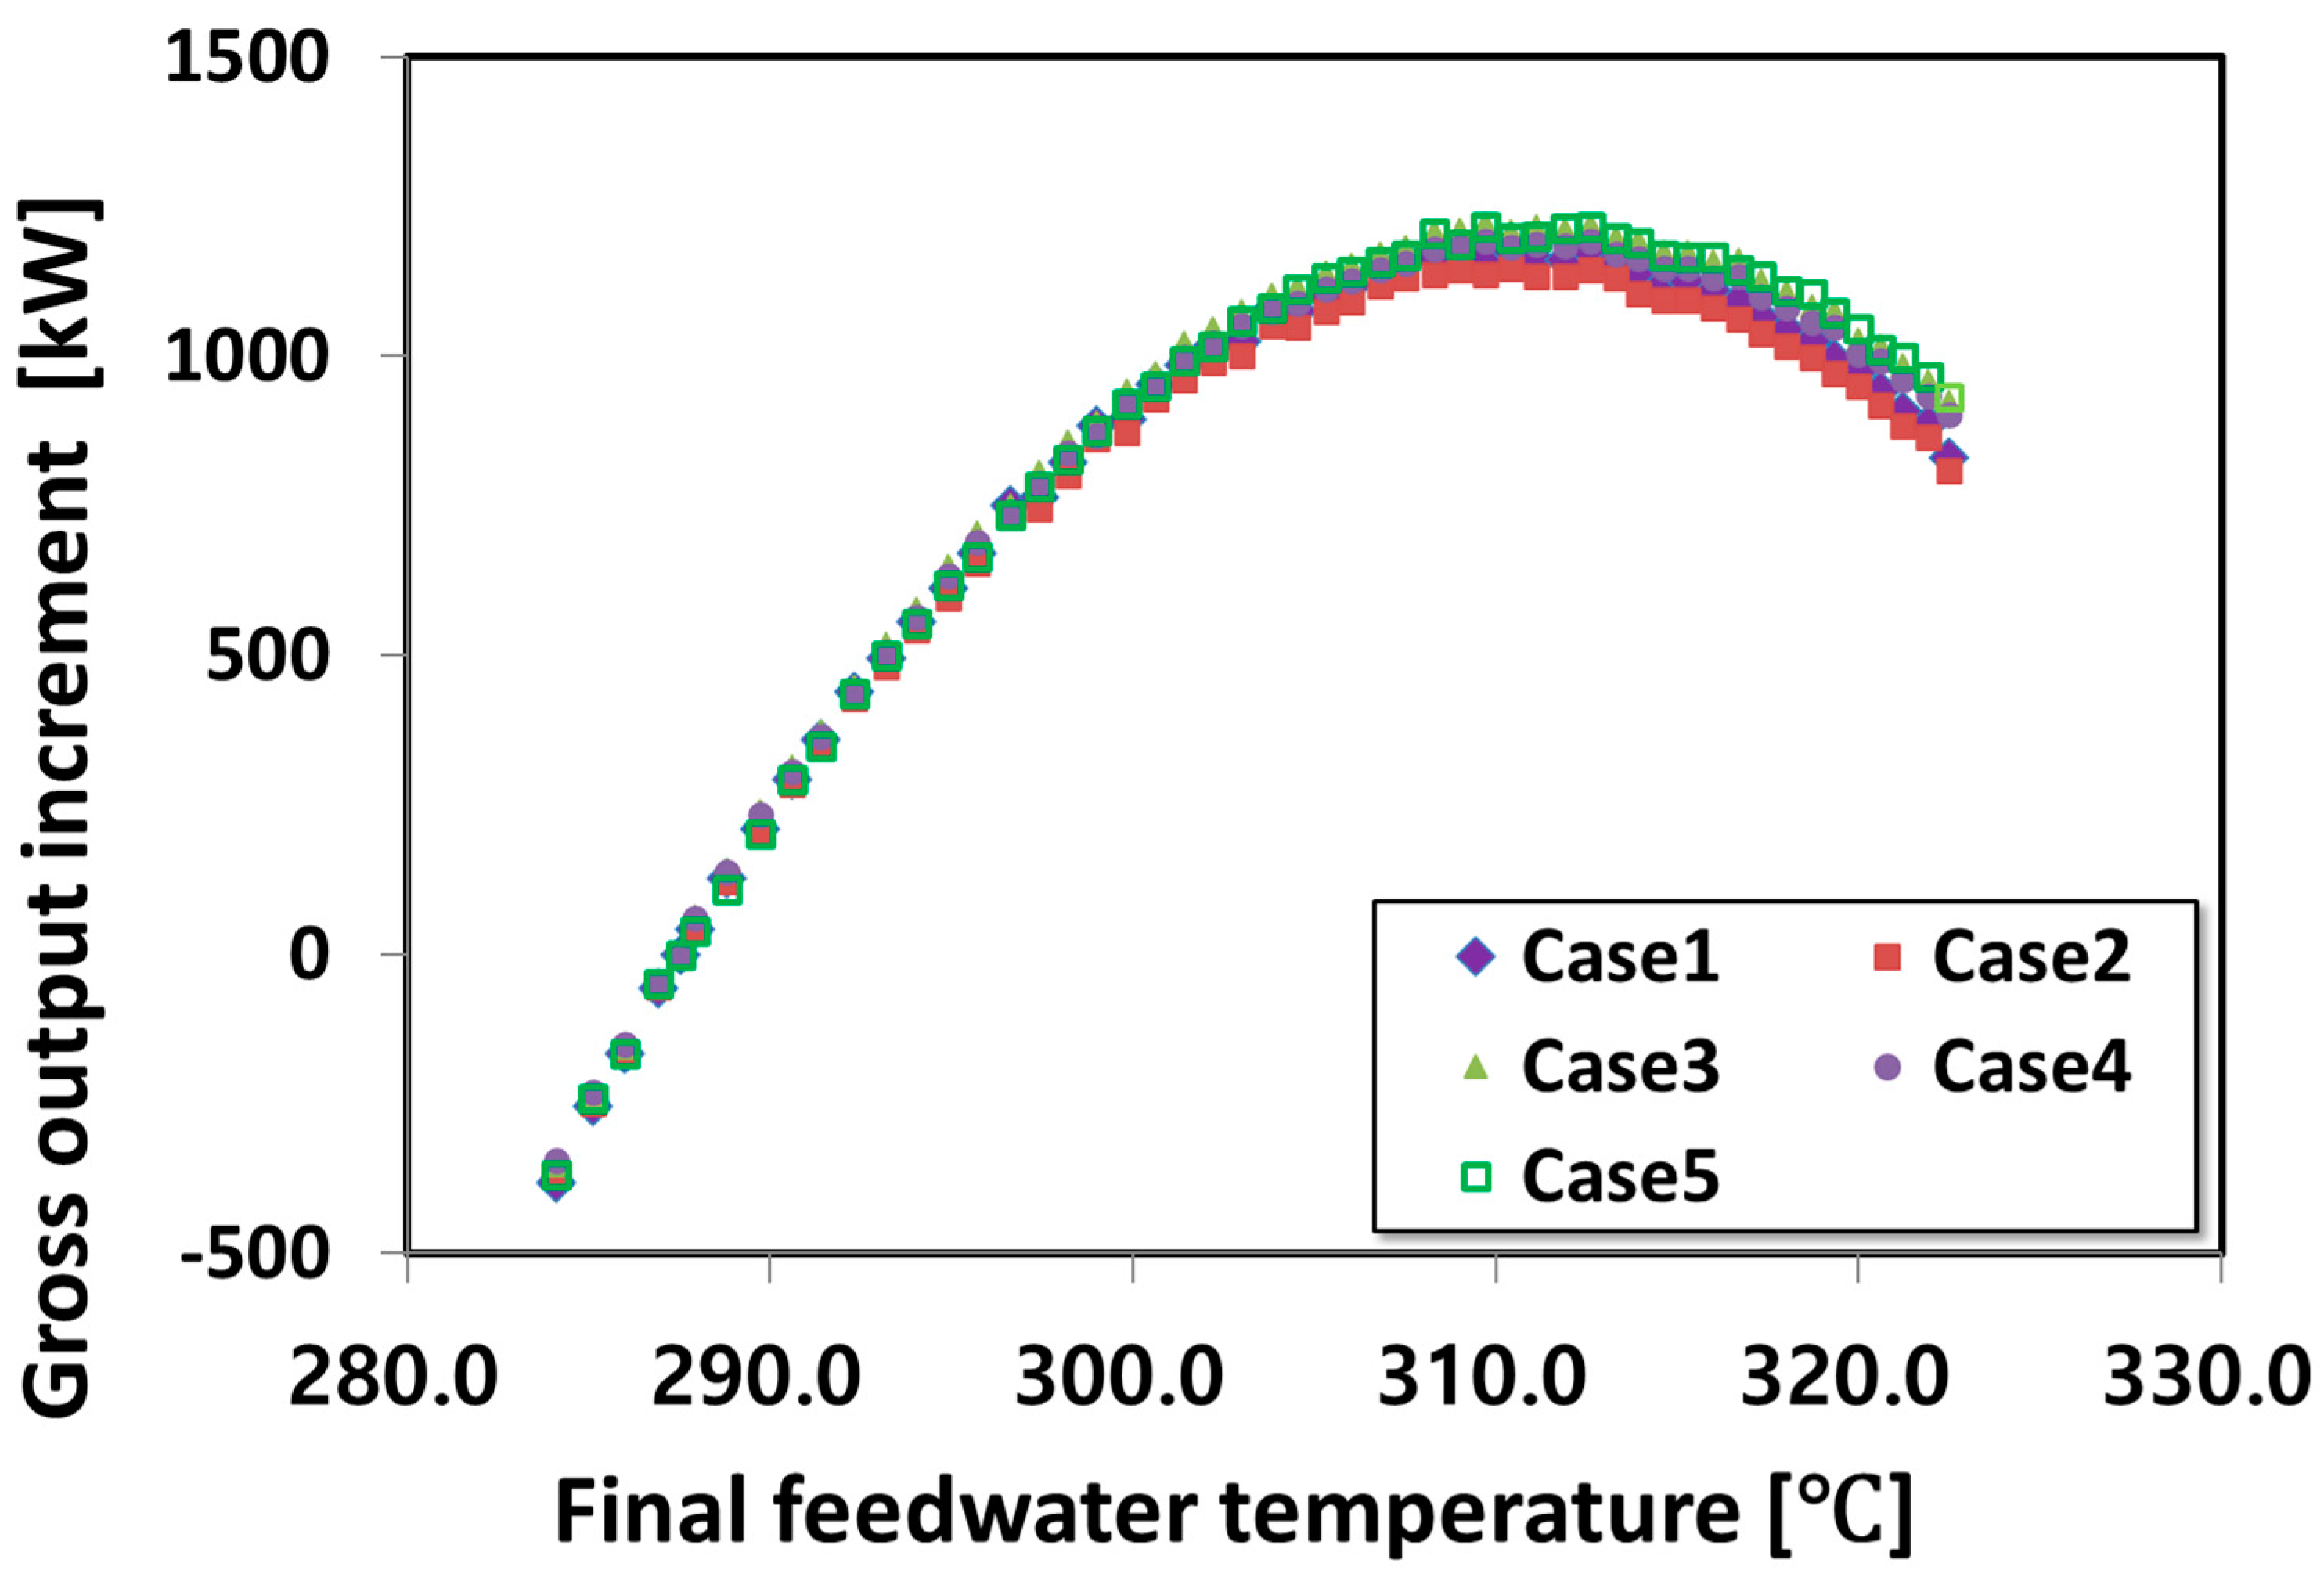
Figure 12 shows the final feedwater temperature versus the gross output increment of the power plant. In all cases, there was a final feedwater temperature at which the gross output increment reached its maximum value. In cases 1 and 2, the final feedwater temperature was 310.4 °C and the maximum gross output increments of the power plant were 1176.4 kW and 1147.2 kW, respectively. When the final feedwater temperature was 309.7 °C in cases 3 and 4, the maximum gross output increments of the power plant were 1222.3 kW and 1193.7 kW, respectively. In case 5, the final feedwater temperature was 312.6 °C and the maximum gross output increment of the power plant was 1215.6 kW.

Figure 12.
Gross output increment versus final feedwater temperature.
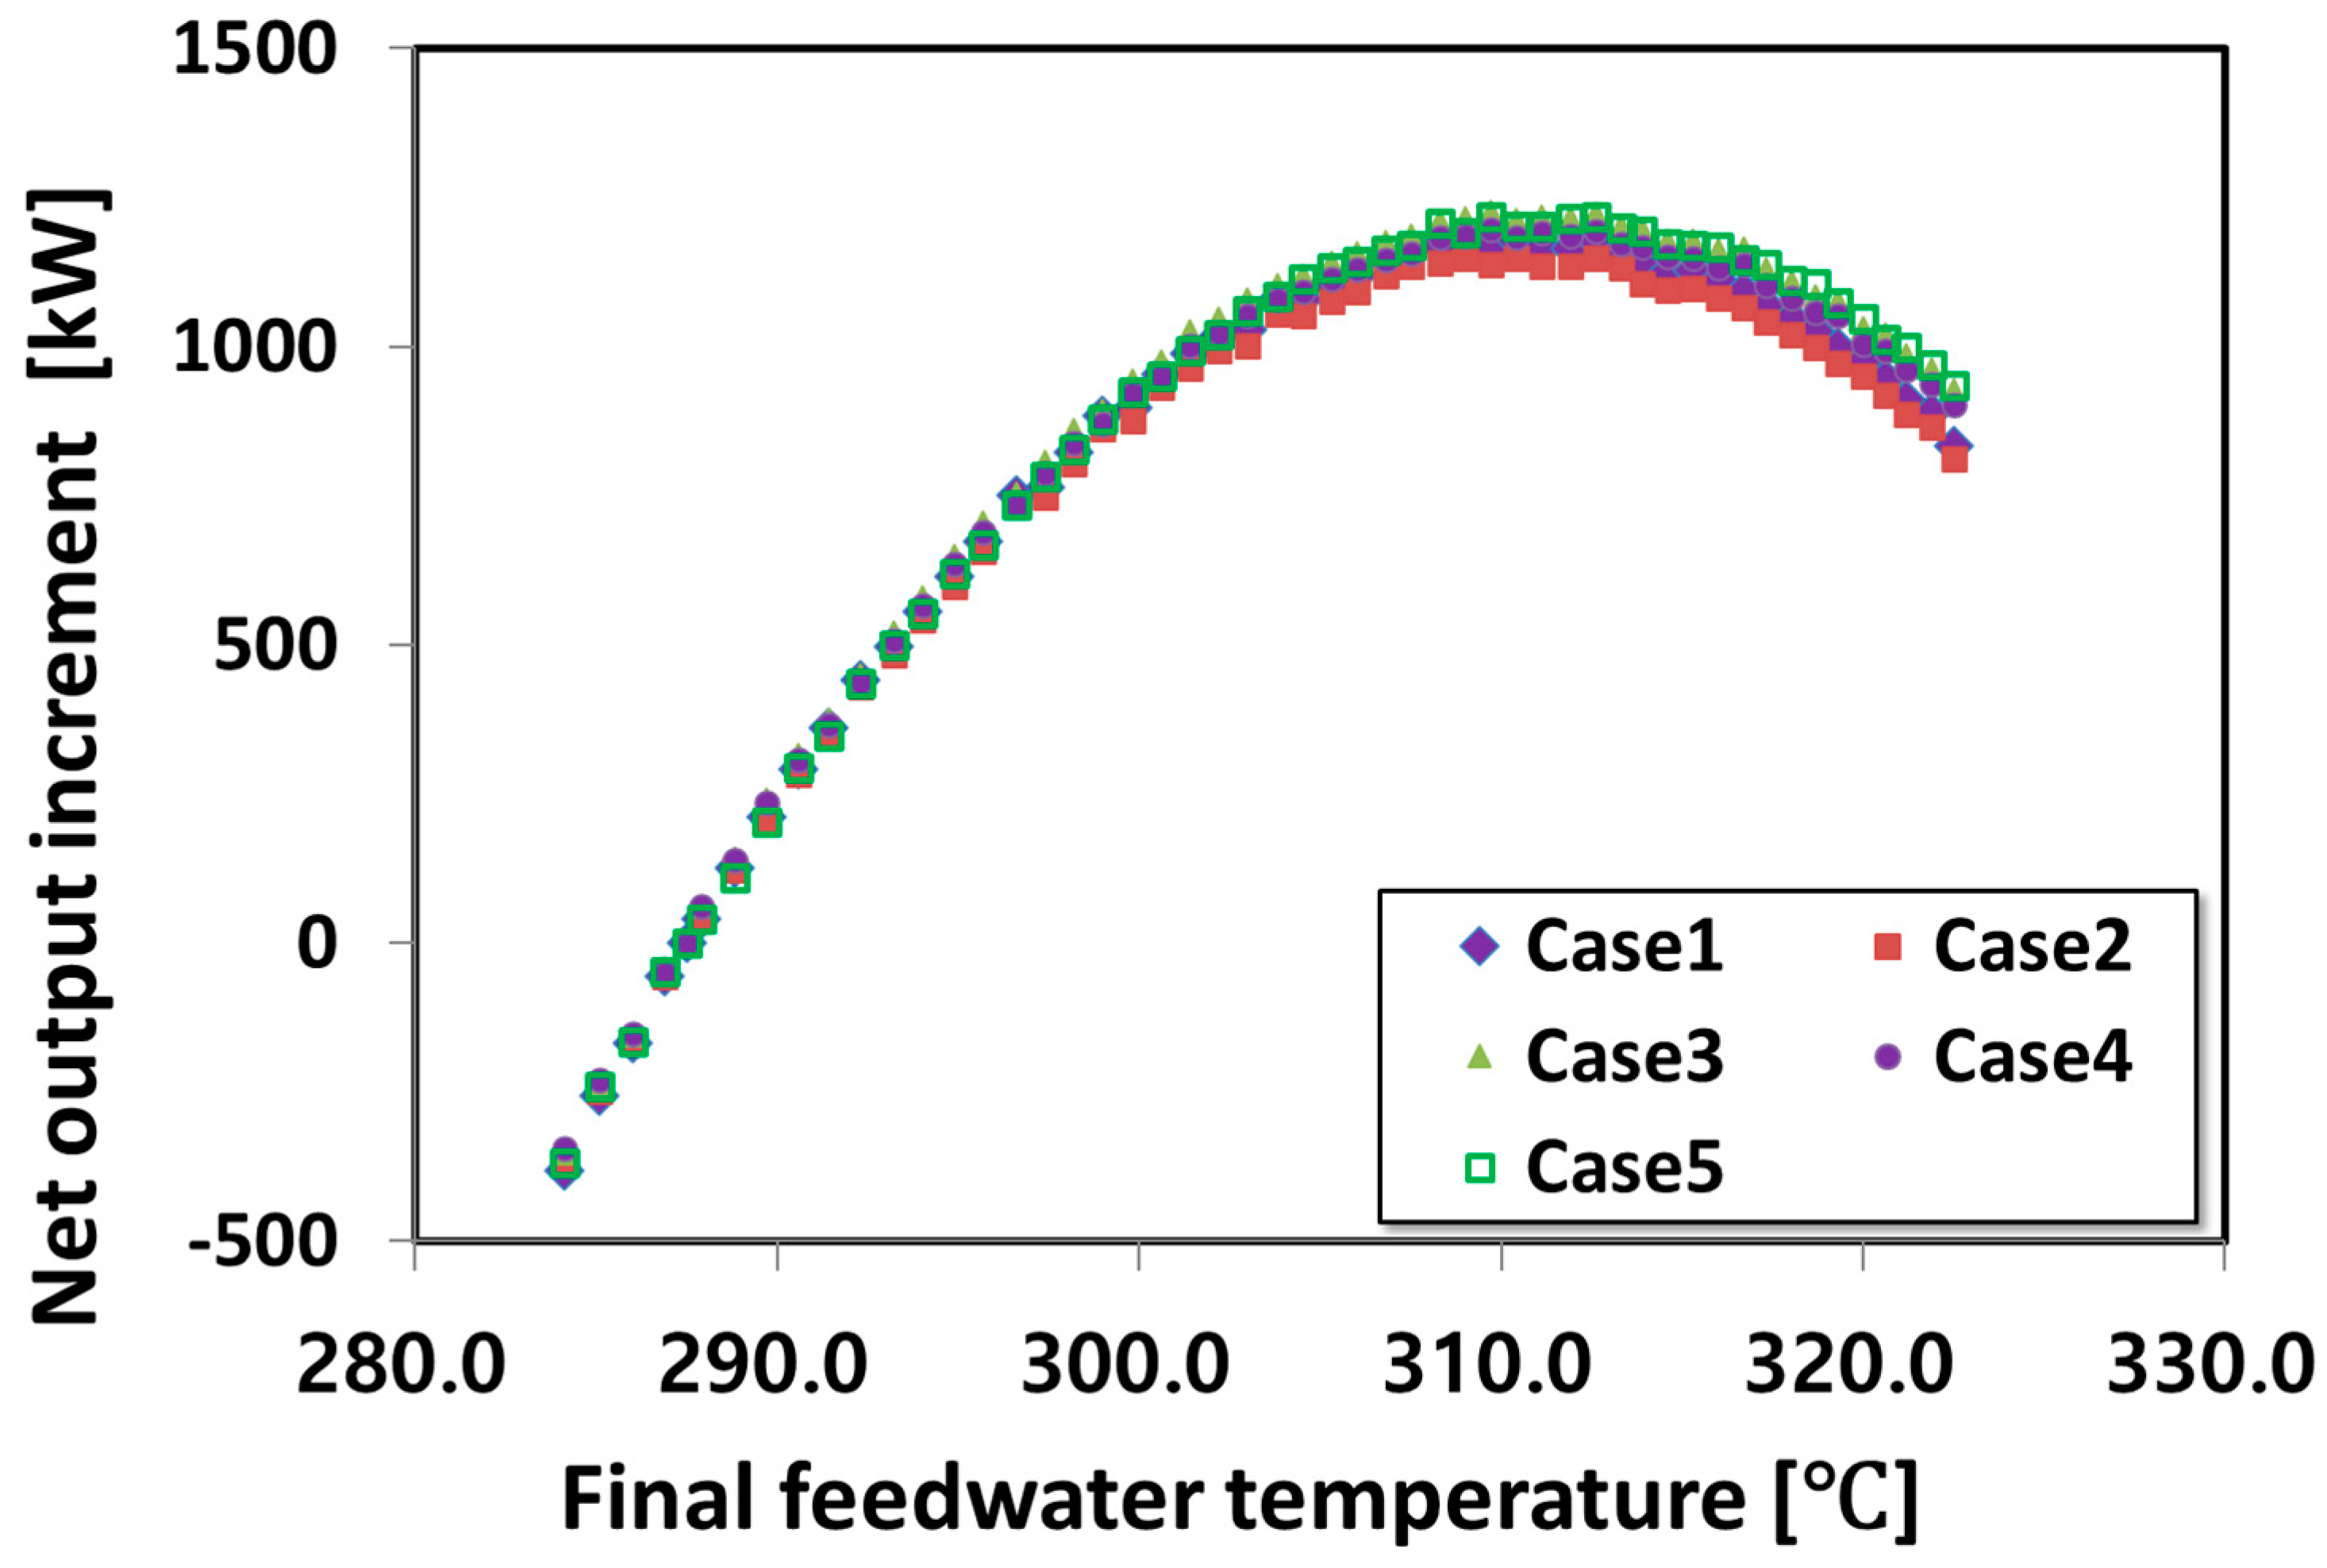
Figure 13 presents the final feedwater temperature versus the net output increment of the power plant. Similar to the gross output increment, there was a final feedwater temperature at which the net output increment reached its maximum value. In cases 1 and 2, the final feedwater temperature was 310.4 °C and the maximum net output increments of the power plant were 1179.2 kW and 1149.9 kW, respectively. When the final feedwater temperature was 309.7 °C in cases 3 and 4, the maximum net output increments of the power plant were 1225.2 kW and 1196.5 kW, respectively. In case 5, the final feedwater temperature was 312.6 °C and the maximum net output increment of the power plant was 1218.5 kW. The maximum value of net output increment is higher than the maximum value of gross output increment in all cases. This is because the power consumption increment of the condensate pump decreases as shown in Figure 10.
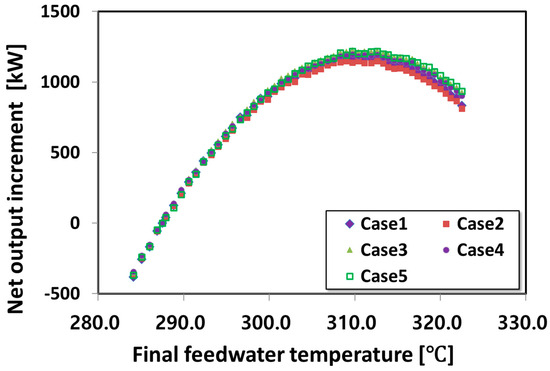
Figure 13.
Net output increment versus final feedwater temperature.
Figure 14 depicts the relationship between the final feedwater temperature and the net efficiency increment of the power plant. In all cases, the boiler heat transfer rate was assumed to be the same, so the net efficiency increment of the power plant had a similar pattern as the net output increment of the power plant. There was a final feedwater temperature at which the net efficiency increment reached its maximum value. In cases 1 and 2, the final feedwater temperature was 310.4 °C and the maximum net efficiency increments of the power plant were 0.099%p and 0.096%p, respectively. When the final feedwater temperature was 309.7 °C in cases 3 and 4, the maximum net efficiency increments of the power plant were 0.103%p and 0.100%p, respectively. In case 5, the final feedwater temperature was 312.6 °C and the maximum net efficiency increment of the power plant was 0.102%p. If the final feed water temperature is no higher than 308.3 °C, the net output increment and the final feed water temperature are proportional for all cases.
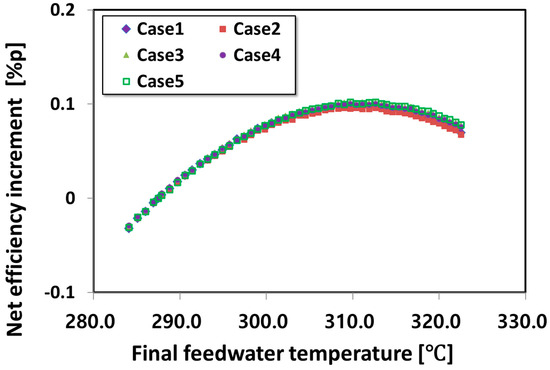
Figure 14.
Net efficiency increment versus final feedwater temperature.
Table 3 shows the average change rate of the net output increment and the net efficiency increment limited to the section in which the final feedwater temperature and the net output of the power plant were proportional. According to the final feed water temperature in the proportional section, where the main steam temperature and the hot reheat steam temperature were identical in case 1, case 3, and case 5, as the main steam temperature and the hot reheat steam temperature increased, the change rate of the net output increment and the change rate of the net efficiency increment according to the final feedwater temperature increased. Where the main steam temperature was the same and only the hot reheat steam temperature was different in cases 1 and 2, cases 3 and 4, as the hot reheat steam temperature increased, the change rate of net output increment and the change rate of the net efficiency increment according to the final feedwater temperature decreased.
Table 3.
The average change rate of the net output increment and the net efficiency increment for different final feedwater temperatures.
As the final feedwater temperature increased, the flow rate of HPT extraction steam increased, the flow rate of steam flowing inside the HPT after the extraction decreased and the flow rate of HPT exhaust steam decreased. The heat exchange rate of the reheater of the boiler decreased according to the decrease in the HPT exhaust steam flow rate. The feedwater flow rate was increased to keep the heat exchange rate of the boiler constant. According to the increased feedwater flow rate, the main steam flow rate supplied to the HPT increased, and consequently, the output of the HPT increased. When the final feedwater temperature and the net output increment of the power plant were proportional, with an increase of 1 °C in the final feedwater temperature, the net output increment of the power plant increased by 63.02 kW on average in the five cases. This increased net output of the power plant was the added power output without CO2 emissions due to the improvement in power plant efficiency without additional heat supplied to the boiler. The increased net output has the same effect as the increased gross output at the power transmission stage. Therefore, considering the CO2 emission factor of a supercritical coal-fired power plant at the power transmission stage and Equation (13), if the final feedwater temperature was raised by 1 °C, CO2 emissions were reduced by 60.52 kgCO2/h on average in the five cases. Considering the maximum value of the net output increment of the power plant according to the final feedwater temperature, the CO2 emission reduction effect was 1132.44 kgCO2/h in case 1, 1104.30 kgCO2/h in case 2, 1176.61 kgCO2/h in case 3, 1149.05 kgCO2/h in case 4, and 1170.17 kgCO2/h in case 5.
4. Conclusions
In this study, 500 MW class supercritical coal-fired power plants were studied. The following conclusions were obtained by analyzing the performance of the power plants depending on the final feedwater temperature under the five main steam and hot reheat steam temperature conditions.
There is a final feedwater temperature that maximizes the net output and net efficiency of the power plant. When the boiler heat transfer rate and the temperature and pressure of the main steam and hot reheat steam are identical, the final feedwater temperature was 310.4 °C for cases 1 and 2, 309.7 °C for cases 3 and 4, and 312.6 °C for case 5.
In case 1, which applies the same main steam and hot reheat steam conditions as the reference power plant, the net output of the power plant increased by 1179.2 kW, and the CO2 emissions of the power plant were reduced by 1132.44 kgCO2/h compared to the reference power plant at a final feedwater temperature of 310.4 °C. When the final feedwater temperature is 308.3 °C or under, if the final feedwater temperature increases by 1 °C, the net output of the power plant increases by 63.02 kW on average in the five cases and the CO2 emissions of the power plant are reduced by 60.52 kgCO2/h on average in the five cases. The higher the temperature of the main steam, the net output and net efficiency of the power plant increase more as the final feedwater temperature increases. If only the temperature of hot reheat steam is increased, the net output and net efficiency of the power plant increase relatively less as the final feedwater temperature increases. Considering the net output and net efficiency of the power plant and the CO2 emissions of the power plant, it is recommended that the final feedwater temperature be raised only to 312.6 °C.
Author Contributions
Conceptualization, Y.-C.J. and S.-J.M.; methodology, Y.-C.J.; software, Y.-C.J.; validation, Y.-C.J.; formal analysis, Y.-C.J.; investigation, Y.-C.J.; resources, Y.-C.J. and S.-J.M.; data curation, Y.-C.J.; writing—original draft preparation, Y.-C.J.; writing—review and editing, Y.-C.J. and S.-J.M.; supervision, S.-J.M. All authors have read and agreed to the published version of the manuscript.
Funding
This work was supported by the Korea Institute for Advancement of Technology (KIAT), titled “Development of a highly versatile quartz transmittance analysis system based on multi-wavelength laser to improve the semiconductor RTP process” (No. RS-2024-00434898).
Institutional Review Board Statement
Not applicable.
Informed Consent Statement
Not applicable.
Data Availability Statement
The original contributions presented in the study are included in the article, further inquiries can be directed to the corresponding author.
Conflicts of Interest
The authors declare no conflicts of interest.
References
- UNFCCC. Adoption of the Paris Agreement. 2015. Available online: https://unfccc.int/resource/docs/2015/cop21/eng/l09r01.pdf (accessed on 15 January 2022).
- Gi, K.; Sano, F.; Akimoto, K.; Hiwatari, R.; Tobita, K. Potential contribution of fusion power generation to low-carbon development under the Paris Agreement and associated uncertainties. Energy Strategy Rev. 2020, 27, 100432. [Google Scholar] [CrossRef]
- Chang, S.H.; Kim, B.S.; Min, T.K. Development of Ultra-Supercritical (USC) Power Plant. Trans. Korean Soc. Mech. Eng. 2012, 36, 205–210. [Google Scholar] [CrossRef]
- Song, B.H. 500MW class standard coal-fired retrofit demonstration project. J. KSME 2015, 55, 41–44. [Google Scholar]
- Kim, S. Decomposition Analysis on GHG Emissions of Domestic Electricity Generation Sector. Korean Energy Econ. Rev. 2018, 17, 241–264. [Google Scholar]
- Korea Energy Economics Institution. Yearbook of Energy Statistics 2021. 2022. Available online: http://www.keei.re.kr/keei/download/YES2021.pdf (accessed on 21 February 2022).
- Roh, J.Y.; Kang, S.M.; Lee, H.S.; Jeon, E.C. CO2 Reduction Potential due to Expansion of Ultra Super-Critical Power Plants. J. Clim. Change Res. 2020, 11, 713–717. [Google Scholar] [CrossRef]
- Rukes, B.; Taud, R. Status and perspectives of fossil power generation. Energy 2004, 29, 1853–1874. [Google Scholar] [CrossRef]
- Li, Y.; Zhou, L.; Xu, G.; Fang, Y.; Zhao, S.; Yang, Y. Thermodynamic analysis and optimization of a double reheat system in an ultra-supercritical power plant. Energy 2014, 74, 202–214. [Google Scholar] [CrossRef]
- Yang, Y.; Wang, L.; Dong, C.; Xu, G.; Morosuk, T.; Tsatsaronis, G. Comprehensive exergy-based evaluation and parametric study of a coal-fired ultra-supercritical power plant. Appl. Energy 2013, 112, 1087–1099. [Google Scholar] [CrossRef]
- Bugge, J.; Kjaer, S.; Blum, R. High-efficiency coal-fired power plants development and perspectives. Energy 2006, 31, 1437–1445. [Google Scholar] [CrossRef]
- Beer, J.M. High efficiency electric power generation: The environmental role. Prog. Energy Combust. Sci. 2007, 33, 107–134. [Google Scholar] [CrossRef]
- Weitzel, P.S. Steam generator for advanced ultra-supercritical power plants 700 to 760c. In Proceedings of the ASME Power Conference, Denver, CO, USA, 12–14 July 2011; pp. 281–291. [Google Scholar] [CrossRef]
- Stepczynska, K.; Kowalczyk, Ł.; Dykas, S.W. Elsner, Calculation of a 900 MW conceptual 700/720 °C coal-fired power unit with an auxiliary extraction-backpressure turbine. J. Power Technol. 2012, 92, 266–273. [Google Scholar]
- Łukowicz, H.; Dykas, S.; Rulik, S.; Stępczyńska, K. Thermodynamic and economic analysis of a 900 MW ultrasupercritical power unit. Arch. Thermodyn. 2011, 32, 231–244. [Google Scholar] [CrossRef]
- Espatolero, S.; Cortos, C.; Romeo, L.M. Optimization of boiler cold-end and integration with the steam cycle in supercritical units. Appl. Energy 2010, 87, 1651–1660. [Google Scholar] [CrossRef]
- Salih, W.A.; Alkumait, A.A.; Khalaf, H.J. Energy and exergy assessment of north refineries company (NRC) steam cycle based on air mass flowrate of main condenser. Tikrit J. Eng. Sci. 2021, 28, 61–70. [Google Scholar] [CrossRef]
- Espatolero, S.; Romeo, L.M.; Cortes, C. Efficiency improvement strategies for the feedwater heaters network designing in supercritical coal-fired power plants. Appl. Therm. Eng. 2014, 73, 449–460. [Google Scholar] [CrossRef]
- Srinivas, T.; Gupta, A.V.S.S.K.S.; Reddy, B. Generalized Thermodynamic Analysis of Steam Power Cycles with ‘n’ Number of Feedwater Heaters. Int. J. Thermodyn. 2007, 10, 177–185. [Google Scholar]
- Mohammed, M.K.; Al Doori, W.H.; Jassim, A.H.; Ibrahim, T.K.; Al-Sammarraie, A.T. Energy and exergy analysis of the steam power plant based on effect the numbers of feed water heater. J. Adv. Res. Fluid Mech. Therm. Sci. 2019, 56, 211–222. [Google Scholar]
- Khaleel, O.J.; Ibrahim, T.K.; Ismail, F.B.; Al-Sammarraie, A.T.; bin Abu Hassan, S.H. Modeling and analysis of optimal performance of a coal-fired power plant based on exergy evaluation. Energy Rep. 2022, 8, 2179–2199. [Google Scholar] [CrossRef]
- Khaleel, O.J.; Ibrahim, T.K.; Ismail, F.B.; Hassan, S.H.A. Thermal performance of coal-fired power plant based on number of feedwater heaters. J. Adv. Res. Fluid Mech. Therm. Sci. 2022, 95, 188–205. [Google Scholar] [CrossRef]
- Khaleel, O.J.; Ibrahim, T.K.; Ismail, F.B.; Al-Sammarraie, A.T. Developing an analytical model to predict the energy and exergy based performances of a coal-fired thermal power plant. Case Stud. Therm. Eng. 2021, 28, 101519. [Google Scholar] [CrossRef]
- Ust, Y.; Gonca, G.; Kayadelen, H.K. Determination of optimum reheat pressures for single and double reheat irreversible Rankine cycle. J. Energy Inst. 2011, 84, 215–219. [Google Scholar] [CrossRef]
- Rashidi, M.M.; Aghagoli, A.; Ali, M. Thermodynamic Analysis of a Steam Power Plant with Double Reheat and Feedwater Heaters. Adv. Mech. Eng. 2014, 6, 940818. [Google Scholar] [CrossRef]
- Habib, M.A.; Zubair, S.M. Second law-based thermodynamic analysis of regenerative-reheat Rankine-cycle power plants. Energy 1992, 17, 295–301. [Google Scholar] [CrossRef]
- Dincer, I.; Al-Muslim, H. Thermodynamic analysis of reheat cycle steam power plants. Int. J. Energy Res. 2001, 25, 727–739. [Google Scholar] [CrossRef]
- Habib, M.A.; Said, S.A.M.; Al-Zaharna, I. Optimization of reheat pressures in thermal power plants. Energy 1995, 20, 555–565. [Google Scholar] [CrossRef]
- Habib, M.A.; Said, S.A.M.; Al-Zaharna, I. Optimization Thermodynamic optimization of reheat regenerative thermal-power plants. Appl. Energy 1999, 63, 17–34. [Google Scholar] [CrossRef]
- Sengupta, S.; Datta, A.; Duttagupta, S. Exergy analysis of a coal-based 210MW thermal power plant. Int. J. Energy Res. 2007, 31, 14–28. [Google Scholar] [CrossRef]
- Khaleel, O.J.; Ismail, F.B.; Ibrahim, T.K.; bin Abu Hassan, S.H. Energy and exergy analysis of the steam power plants: A comprehensive review on the Classification, Development, Improvements, and configurations. Ain Shams Eng. J. 2022, 13, 101640. [Google Scholar] [CrossRef]
- Khaleel, O.J.; Ismail, F.B.; Ibrahim, T.K. Parametric assessment of the thermal performance of coal-fired power plant. J. Adv. Res. Fluid Mech. Therm. Sci. 2021, 87, 27–43. [Google Scholar] [CrossRef]
- Reddy, V.S.; Kaushik, S.C.; Tyagi, S.K. Exergetic analysis of solar concentrator aided coal fired super critical thermal power plant (SACSCTPT). Clean Technol. Environ. Policy 2013, 15, 133–145. [Google Scholar] [CrossRef]
- Yang, Y.; Yan, Q.; Zhai, R.; Kouzani, A.; Hu, E. An efficient way to use medium-or-low temperature solar heat for power generation–integration into conventional power plant. Appl. Therm. Eng. 2011, 31, 157–162. [Google Scholar] [CrossRef]
- Hu, E.; Yang, Y.; Nishimura, A.; Yilmaz, F.; Kouzani, A. Solar thermal aided power generation. Appl. Energy 2010, 87, 2881–2885. [Google Scholar] [CrossRef]
- Gupta, M.K.; Kaushik, S.C. Exergetic utilization of solar energy for feedwater preheating in a conventional thermal power plant. Int. J. Energy Res. 2009, 33, 593–604. [Google Scholar] [CrossRef]
- Popov, D. An option for solar thermal repowering of fossil fuel fired power plants. Sol. Energy 2011, 85, 344–349. [Google Scholar] [CrossRef]
- Moran, M.J.; Shapiro, H.N. Fundamentals of Engineering Thermodynamics; John Wiley & Sons: Hoboken, NJ, USA, 2000. [Google Scholar]
- Ro, S.T. Engineering Thermodynamics; Munundang: Seoul, Republic of Korea, 2012. [Google Scholar]
- Noroozian, A.; Mohammadi, A.; Bidi, M.; Ahmadi, M.H. Energy, exergy and economic analyses of a novel system to recover waste heat and water in steam power plants. Energy Convers. Manag. 2017, 144, 351–360. [Google Scholar] [CrossRef]
- Korea Electric Power Corporation. Statistics of Electric Power in Korea 2023. 2024. Available online: https://home.kepco.co.kr/kepco/cmmn/documentViewer.po?fn=BBS_202406171041028251&rs=/kepco/synap/doc (accessed on 13 July 2024).


Disclaimer/Publisher’s Note: The statements, opinions and data contained in all publications are solely those of the individual author(s) and contributor(s) and not of MDPI and/or the editor(s). MDPI and/or the editor(s) disclaim responsibility for any injury to people or property resulting from any ideas, methods, instructions or products referred to in the content. |
© 2024 by the authors. Licensee MDPI, Basel, Switzerland. This article is an open access article distributed under the terms and conditions of the Creative Commons Attribution (CC BY) license (https://creativecommons.org/licenses/by/4.0/).