Article

Evaluation Method for Virtual Museum Interface Integrating Layout Aesthetics and Visual Cognitive Characteristics Based on Improved Gray H-Convex Correlation Model

College of Design and Art, Shaanxi University of Science and Technology, Xi’an 710021, China
*
Authors to whom correspondence should be addressed.
Appl. Sci. 2024, 14(16), 7006; https://doi.org/10.3390/app14167006
Submission received: 25 June 2024 / Revised: 27 July 2024 / Accepted: 7 August 2024 / Published: 9 August 2024

Abstract

:
A scientific method for evaluating the design of interfaces is proposed to address the unique characteristics and user needs of infrequent-contact public service interfaces. This method is significant for enhancing service efficiency and promoting the sustainable development of public services. Current interface evaluation methods are limited in scope and often fail to meet actual user needs. To address this, this study focuses on virtual museums, examining users’ aesthetic psychology and cognitive behavior in terms of layout aesthetics and visual cognitive characteristics, aiming to explore the relationship between the two. Interface layout aesthetic values and user visual cognitive measurements were obtained by using computational aesthetics methods and eye-tracking experiments. These served as input data for a new model. An improved gray H-convex correlation model utilizing the ICRITIC method is proposed to examine the mapping relationship between interface layout aesthetics and visual cognitive features. The results demonstrate that our new model achieves over 90% accuracy, outperforming existing models. For virtual museum interfaces, symmetry and dominance significantly influence user visual cognition, with the most notable correlations found between density and gaze shift frequency, simplicity and mean pupil diameter, and order and gaze shift frequency. Additionally, fixation duration, fixation count, and mean pupil diameter were inversely correlated with interface layout aesthetics, whereas gaze shift frequency and gaze time percentage were positively correlated.

1. Introduction

Culture provides sustainable spiritual support for the harmonious development of human society. Continuous research on culture is vital for preserving cultural diversity, transmitting cultural heritage, and promoting cultural innovation. Currently, the surge in internet technologies and digitization offers development opportunities for cultural sustainability [1]. Virtual museums, leveraging virtual reality technology to create interactive and open virtual environments, allow people to visit cultural relics across time and space, significantly contributing to cultural dissemination and preservation [2]. Based on digital technology, museums provide online cultural exhibition services to the public, increasing the accessibility of museums and significantly enhancing the public’s right to browse and learn about culture [3]. Some scholars have conducted research from the perspective of human perceptual characteristics, aiming to enhance the attractiveness and user experience of virtual museums. Using experimental testing methods, the impact of ambient lighting and color temperature in virtual museum environments on users’ visual perception preferences was explored, with the aim of enhancing visitors’ perceptual experiences, attracting more visitors to the museum, and expanding cultural dissemination [4,5]. Jeon et al. [6] established a multisensory interaction system by combining voice interaction and visual information interaction from the perspective of auditory and visual perception, aiming to enhance the emotional interaction experience in virtual museums. Volioti et al. [7] proposed an interactive learning experience system based on the visual, auditory, and tactile perceptual needs of visitors, aiming to engage virtual museum visitors in the transmission of cultural knowledge in an active and creative manner.
However, existing research on virtual museums often overlooks the importance of interactive interface design and evaluation methods, which greatly impacts the user experience. As a critical medium for accessing service facilities, the quality of interface design directly affects service quality and the sustainability of user engagement. From the perspective of user experience and interaction design, high-quality interface design could enhance user satisfaction and engagement, foster understanding and acceptance of museum content, attract more visitors, and promote the sustainable development of museums [8]. Therefore, establishing a scientific interface design evaluation method that meets user needs is crucial.
In addition, the virtual museum interface belongs to the category of infrequent-contact public service interfaces, which refers to operational interfaces that users do not frequently interact with, but need to use efficiently to complete specific tasks. This type of interface is widely employed in urban public service facilities such as hospitals, airports, railway stations, museums, shopping malls, and so on [9,10]. For these interfaces, designs that are visually aesthetically pleasing and align with human visual habits can enhance information recognition efficiency and user experience [11]. Therefore, it is crucial to develop scientific design evaluation methods specifically for those infrequently contacted interfaces.
However, research on evaluating the interface design of virtual museums is limited, with few studies considering both human aesthetic psychology and physiological behavior. There is even less quantitative research on the relationship between interface layout aesthetics and visual cognitive features. This study aims to bridge this gap by combining interface aesthetics with users’ visual cognitive characteristics and calculating their correlation. Using these correlations as design guidelines, designers can create virtual museum interfaces that better meet users’ aesthetic preferences and align with their visual cognitive habits. This approach allows users to feel more comfortable and natural when browsing and interacting, optimizes information communication, enhances interface aesthetics, improves user experience and satisfaction, and ultimately promotes the sustainability of public service interfaces.
Scholars have explored the technical optimization, interactive experience, and interface evaluation of virtual museums. However, there is a notable lack of evaluation research from the perspectives of both human aesthetic experience and visual behavioral habits. Furthermore, quantitative studies on the correlation between these two aspects are even scarcer. Leopardi et al. [12] focused on optimizing virtual museum systems using extended reality (XR) technology, aiming to enhance platform stability. Wolfgang et al. [13] utilized virtual reality to restore and expand exhibit content, thereby optimizing the user experience when viewing artwork. In terms of interactive experience optimization, Paul F. Marty et al. [14] advocated for a “user-centered” approach, emphasizing how users engage with virtual museums and their resources. Regarding the evaluation of virtual museum interfaces, Tanriverdi et al. [15] proposed a VRID design model for interactive interfaces, categorizing interface design into graphical elements, interactive feedback, and behavioral performance. Frojdman et al. [16] provided seven guidelines for interface design, focusing on layout positioning and interaction feedback, using methods such as heuristic evaluation, interviews, and usability testing. Nadia et al. [17] conducted a case study revealing that icon visual design significantly enhances user experience in navigating and searching for information.
The gray model effectively elucidates the mapping relationship between interface layout aesthetics and users’ visual cognitive features. Additionally, the gray H-convex correlation model offers significant advantages over other gray models [18]. We provide a comparative analysis in the subsequent sections. However, it is important to note that the gray H-convex correlation model has a limitation in that it ignores the influence of indicator weights. To address this, our study employs the ICRITIC (improved criteria importance through intercriteria correlation) method to optimize the model. The ICRITIC method is superior to the original CRITIC (criteria importance through intercriteria correlation) method due to its more reasonable weight acquisition process. Therefore, this paper proposes an improved gray H-convex correlation model based on the ICRITIC method to solve the correlation problem between aesthetic features and visual cognitive features of interface layouts, which represents a pioneering attempt in this area.
The remainder of this paper is arranged as follows. Section 2 reviews related studies on interface layout aesthetics and visual perception, delineates our motivation and methodology, and presents the overall framework of this study. In Section 3, we establish an evaluation index system for interface layout, focusing on both aesthetics and visual cognition. Section 4 details the construction of an improved gray H-convex correlation model to determine the mapping relationship between layout aesthetics and visual cognition. Section 5 validates our proposed method by applying it to virtual museum interfaces from various provinces in China, thereby assessing its suitability as a standard for future interface design. Finally, Section 6 summarizes the study’s findings, discusses its limitations, and proposes directions for future research.

2. Theoretical Background

2.1. Interface Layout Aesthetics

Currently, there are two primary methods for analyzing the aesthetics of interface layout: subjective human evaluation and objective formula calculation. In terms of subjective evaluation, scholars have extensively studied the influence of various interface design elements on user experience. For example, studies have focused on elements such as colors, images, and buttons [19,20,21], as well as the subjective perceptual influences of interface visual complexity, usefulness, and attractiveness [22,23,24]. In addition, with the continuous advancement in science and technology, researchers have proposed objective quantitative calculation methods for assessing interface aesthetics. Birkhoff [25] introduced computational aesthetics and proposed a mathematical formula for macroscopic aesthetics, M = O/C, where aesthetics is defined as the ratio of order (O) to complexity (C). Building upon this, Ngo et al. [26] developed mathematical formulae based on computational aesthetics to quantify the aesthetic elements of interface layout in interface design. However, the correlations between these indicators and their applicability to other interface domains remain unclear. Zhou et al. [27] presented an objective comprehensive evaluation model for interface style aesthetics using “vivacious aesthetics” as an example and considering interface design style as a key perspective.
In summary, scholars have made progress in the research of interface aesthetics calculation, applying computational aesthetics principles to objectively and quantitatively determine overall interface aesthetics. However, direct comparative evaluations of aesthetic indicators often yield overly generalized and lacking diversity results. Users’ aesthetic needs are multifaceted, encompassing psychological, physiological, and other factors. Therefore, relying solely on counting formulae for calculation does not align with a user-centered research approach, resulting in discrepancies between calculated outcomes and actual user preferences. Instead, combining users’ physiological cognitive habits can improve evaluation accuracy. Consequently, we conducted a literature review focusing on the visual cognition domain.

2.2. Visual Cognition

Visual cognition refers to the process by which objective information from the outside world serves as a source of stimulation, transmitted to the brain through the optic nerve, and then processed by the brain [28]. When observing interface information, the eye is the primary organ for acquiring visual data. The physiological behavior of the human eye’s gaze during the processing of interactive interface information is closely related to brain cognition [29]. However, since human visual attention is limited, presenting virtual museum interface information in an unorganized manner may cause cognitive confusion for users. Eye-tracking technology enables the measurement of visual gaze focus, reflecting individual interest preferences and providing insights into cognitive performance during human–computer interactions. Consequently, scholars measure human visual cognitive characteristics through eye-tracking experiments. Montazem et al. [30] conducted eye movement experiments to analyze the impact of different information presentation methods on interface usability, noting particularly that novice users tend to favor simpler graphical interfaces. Zhi et al. [31] examined various train-driving interface layouts to study human visual cognitive load, search efficiency, and attention allocation through eye movement experiments. Salman et al. [32] conducted experimental measurements to evaluate health-care information system interfaces and proposed an optimization methodology for interface design that can serve as a valuable reference. Furthermore, Daniel et al. [33] analyzed the gaze trajectory, gaze point distribution, and gaze frequency of pilots using a cockpit instrument panel interface. Their goal was to reduce pilot operational errors by incorporating insights from eye movement experiments.
In summary, scholars have evaluated interface usability based on either interface layout aesthetics or visual cognitive features, but they have not attempted to combine the two. Relying solely on one evaluation dimension cannot fully capture user needs. Additionally, without distinguishing interface types, the evaluation method may not be applicable to infrequently contacted public service interfaces. To address this shortcoming, this study evaluates interface usability from the dimensions of interface layout aesthetics and users’ visual cognitive characteristics, quantitatively describing the mapping relationship between the two. This approach aims to propose a new methodology for the design and usability evaluation of public service interfaces, providing a guiding principle for designers in future interface design.

2.3. Research Motivation and Methodology

To improve the quality of interface design while considering users’ aesthetic psychology and physiological habits, this paper proposes an evaluation method for interface layout design. Given the current lack of distinction in interface types in the research, this study focuses on evaluating infrequently contacted public service interfaces, using virtual museum interfaces in various provinces of China as examples. Scholars have separately studied interface layout aesthetics and visual cognition, but there is a notable gap in research combining these two aspects. Therefore, another focus of this study is to evaluate interface quality by integrating interface layout aesthetics and visual cognitive features, elucidating their relevance. To address the aforementioned issues, we have introduced the methods applied in this study. This approach aims to provide a comprehensive evaluation methodology that can guide future interface design by aligning with both aesthetic and cognitive user needs.
The gray theory is named after the color. A system with completely clear information is called a white system, a system with completely unknown information is called a black system, and a system with partially known and partially unknown information is called a gray system [34]. In this study, the aesthetic value of the interface layout scheme (calculated through relevant formulae) and the user’s visual cognitive features (derived from eye movement experiments) belong to the white system, as they are known quantities. However, the mapping relationship between the two belongs to the black system, as it remains unknown and unmeasurable. Therefore, this paper employs the gray model to analyze the relationship between interface layout aesthetics and visual cognitive features. While the gray H-convex correlation model is adept at determining correlation issues, it has a defect in that it ignores the weight differences of the indicators, leading to lower accuracy in model results. To address this, an improved gray H-convex correlation model is proposed using the ICRITIC method to quantitatively study the correlation between interface layout aesthetics and visual cognitive features.
(1)
Gray H-convex correlation
Since Professor Deng proposed his correlation model [35], research on gray correlation analysis has advanced rapidly. Scholars have subsequently established a series of correlation models to further explore and refine this analytical approach, including the gray entropy correlation model [36], the gray B-type correlation model [37], and new gray absolute correlation model [38], etc. The aforementioned gray correlation algorithms have some shortcomings. For example, they are suitable only for cases of positive correlation among sequence factors and have a blind spot when processing oscillatory sequences. To address these limitations, Pan et al. [18] used the principles of span and arch height to express the convexity of folds at the transverse level and proposed a gray H-convex correlation model. This model effectively quantifies the degree of correlation between the factors of the series and distinguishes between positive and negative correlations. However, despite its ability to judge negative correlation problems between indicators, it overlooks differences in the weights of the indicators.
(2)
ICRITIC
The ICRITIC methodology was employed to compute the weight coefficients for every aesthetic evaluation criterion, aiming to enhance the optimization of the gray H-convex correlation mode. Traditional CRITIC approaches rely on standard deviation and correlation coefficients to assess the intensity of comparison and conflict [39,40]. Nonetheless, variations in indicator dimensions and magnitudes pose challenges, rendering standard deviation insufficient for accurately reflecting the comparative strength among indicators. Furthermore, it is worth noting that the correlation coefficient among indicators often exhibits a negative correlation. In other words, as the conflict between indicators intensifies, the correlation coefficient tends to decrease. Consequently, the ICRITIC method addresses this issue by incorporating two key approaches. Firstly, it evaluates the comparative strength of indicators through the introduction of the Gini coefficient [41]. Secondly, it treats the correlation coefficient within the conflict coefficient as an absolute value, effectively mitigating the influence of negative correlation coefficients.

2.4. Thesis Framework

The overarching framework of this study is delineated into three segments, as depicted in Figure 1. (1) Firstly, the initial segment entails the establishment of the evaluation criteria system pertaining to the interface layout of the virtual museum. (2) The second part is to obtain evaluation data based on the evaluation indicators determined in the first part. The data come from two sources. On the one hand, the aesthetic value of virtual museum interface samples is computed utilizing the quantitative layout aesthetic criteria calculation method. On the other hand, combining eye-tracking technology, various virtual museum interfaces serve as experimental stimulus images to procure user visual cognitive physiological measurement results. (3) In the third part, the ICRITIC method is deployed to refine the gray H-convex correlation model. The interface aesthetic values and user visual cognitive measurements obtained in the second phase are input into the model to ascertain the correlation between them. This correlation serves as the evaluation standard for the interface layout design of virtual museums.

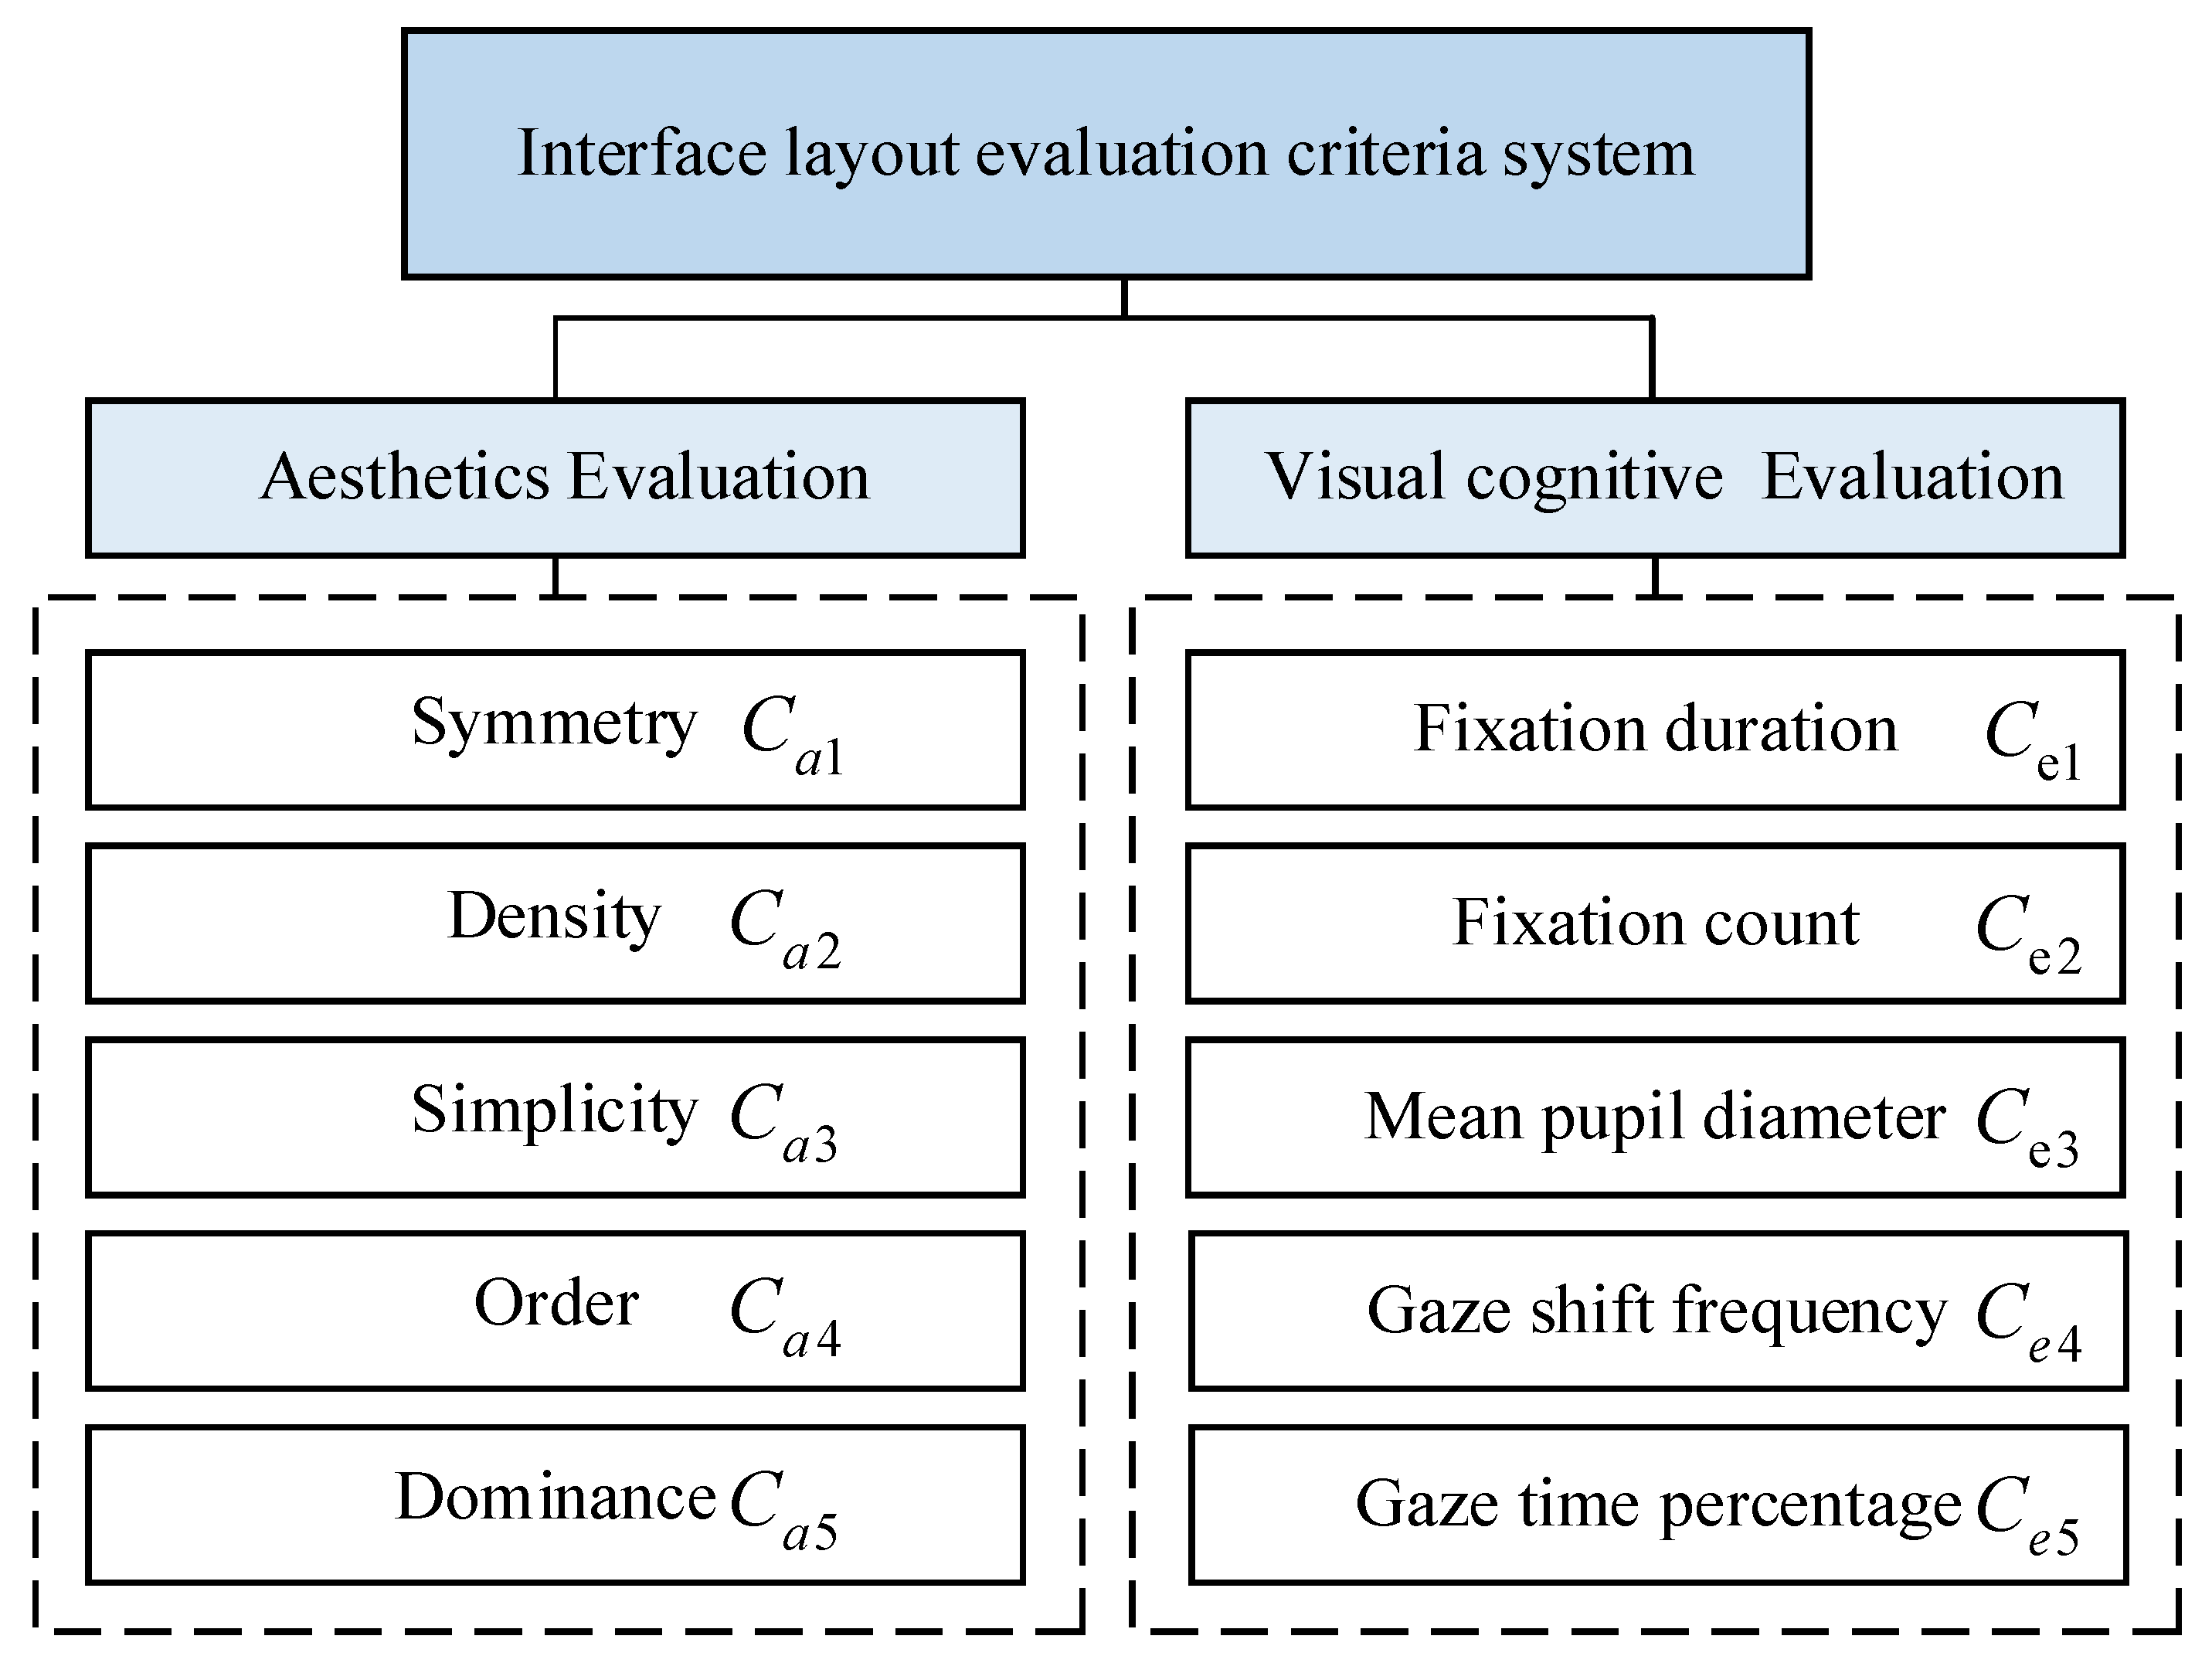
3. Interface Layout Evaluation Criteria System

This study accounted for both the psychological and physiological factors of users, culminating in the establishment of an evaluation criteria system for virtual museum interface layout across two dimensions: aesthetics and visual cognition.
Regarding aesthetic evaluation, designers frequently conduct their design work relying on personal subjective judgment, often lacking direct communication and understanding with users. This gap directly results in designs that deviate from users’ perceptions. Thus, it is imperative to delve into users’ perceptual image needs to enhance the rationality of interface aesthetic evaluation outcomes. A total of 7 experts with over 5 years of experience in human–computer interface design were selected alongside 20 interface design students (comprising the professional group) and 20 non-design students (constituting the non-professional group). Maintaining an equal gender distribution, the participants’ ages ranged from 20 to 35 years, all possessing normal vision with no visual impairments. Initially, the sample underwent imagery analysis by the professional group, then was subsequently adjudicated and augmented by the non-professional group. This process yielded 24 interface layout design imagery feature vocabularies exhibiting significant dissimilarity. Subsequently, these 24 sensory image words underwent classification via cluster analysis. Following parameter adjustment, they were categorized into seven groups, showcasing the most discernible effects. Thereafter, factor analysis was employed to extract factors possessing eigenvalues exceeding 1 and cumulative variance contributions surpassing 90%. These factors—symmetry, density, simplicity, order, and dominance—were subsequently designated as the final aesthetic evaluation criteria.
Concerning visual cognition evaluation, previous research has underscored the impact of interface element layout on users’ visual cognitive performance. Utilizing eye-tracking technology, changes in users’ gaze patterns when observing interface element layouts can be captured, providing valuable physiological data [42]. Presently, eye movement criteria with a mapping relationship to aesthetic criteria of interface layout include fixation duration, fixation count, mean pupil diameter, gaze shift frequency, and gaze time percentage [43,44,45,46,47]. Consequently, these criteria were selected to assess visual cognitive performance. The interface layout evaluation criteria system is depicted in Figure 2.

4. Model Construction

4.1. Modeling Framework

The model framework, depicted in Figure 3, is segmented into three distinct parts. Moreover, the significance of the symbols in the diagrams is elaborated upon in Section 4 and shall not be reiterated here.
(1)
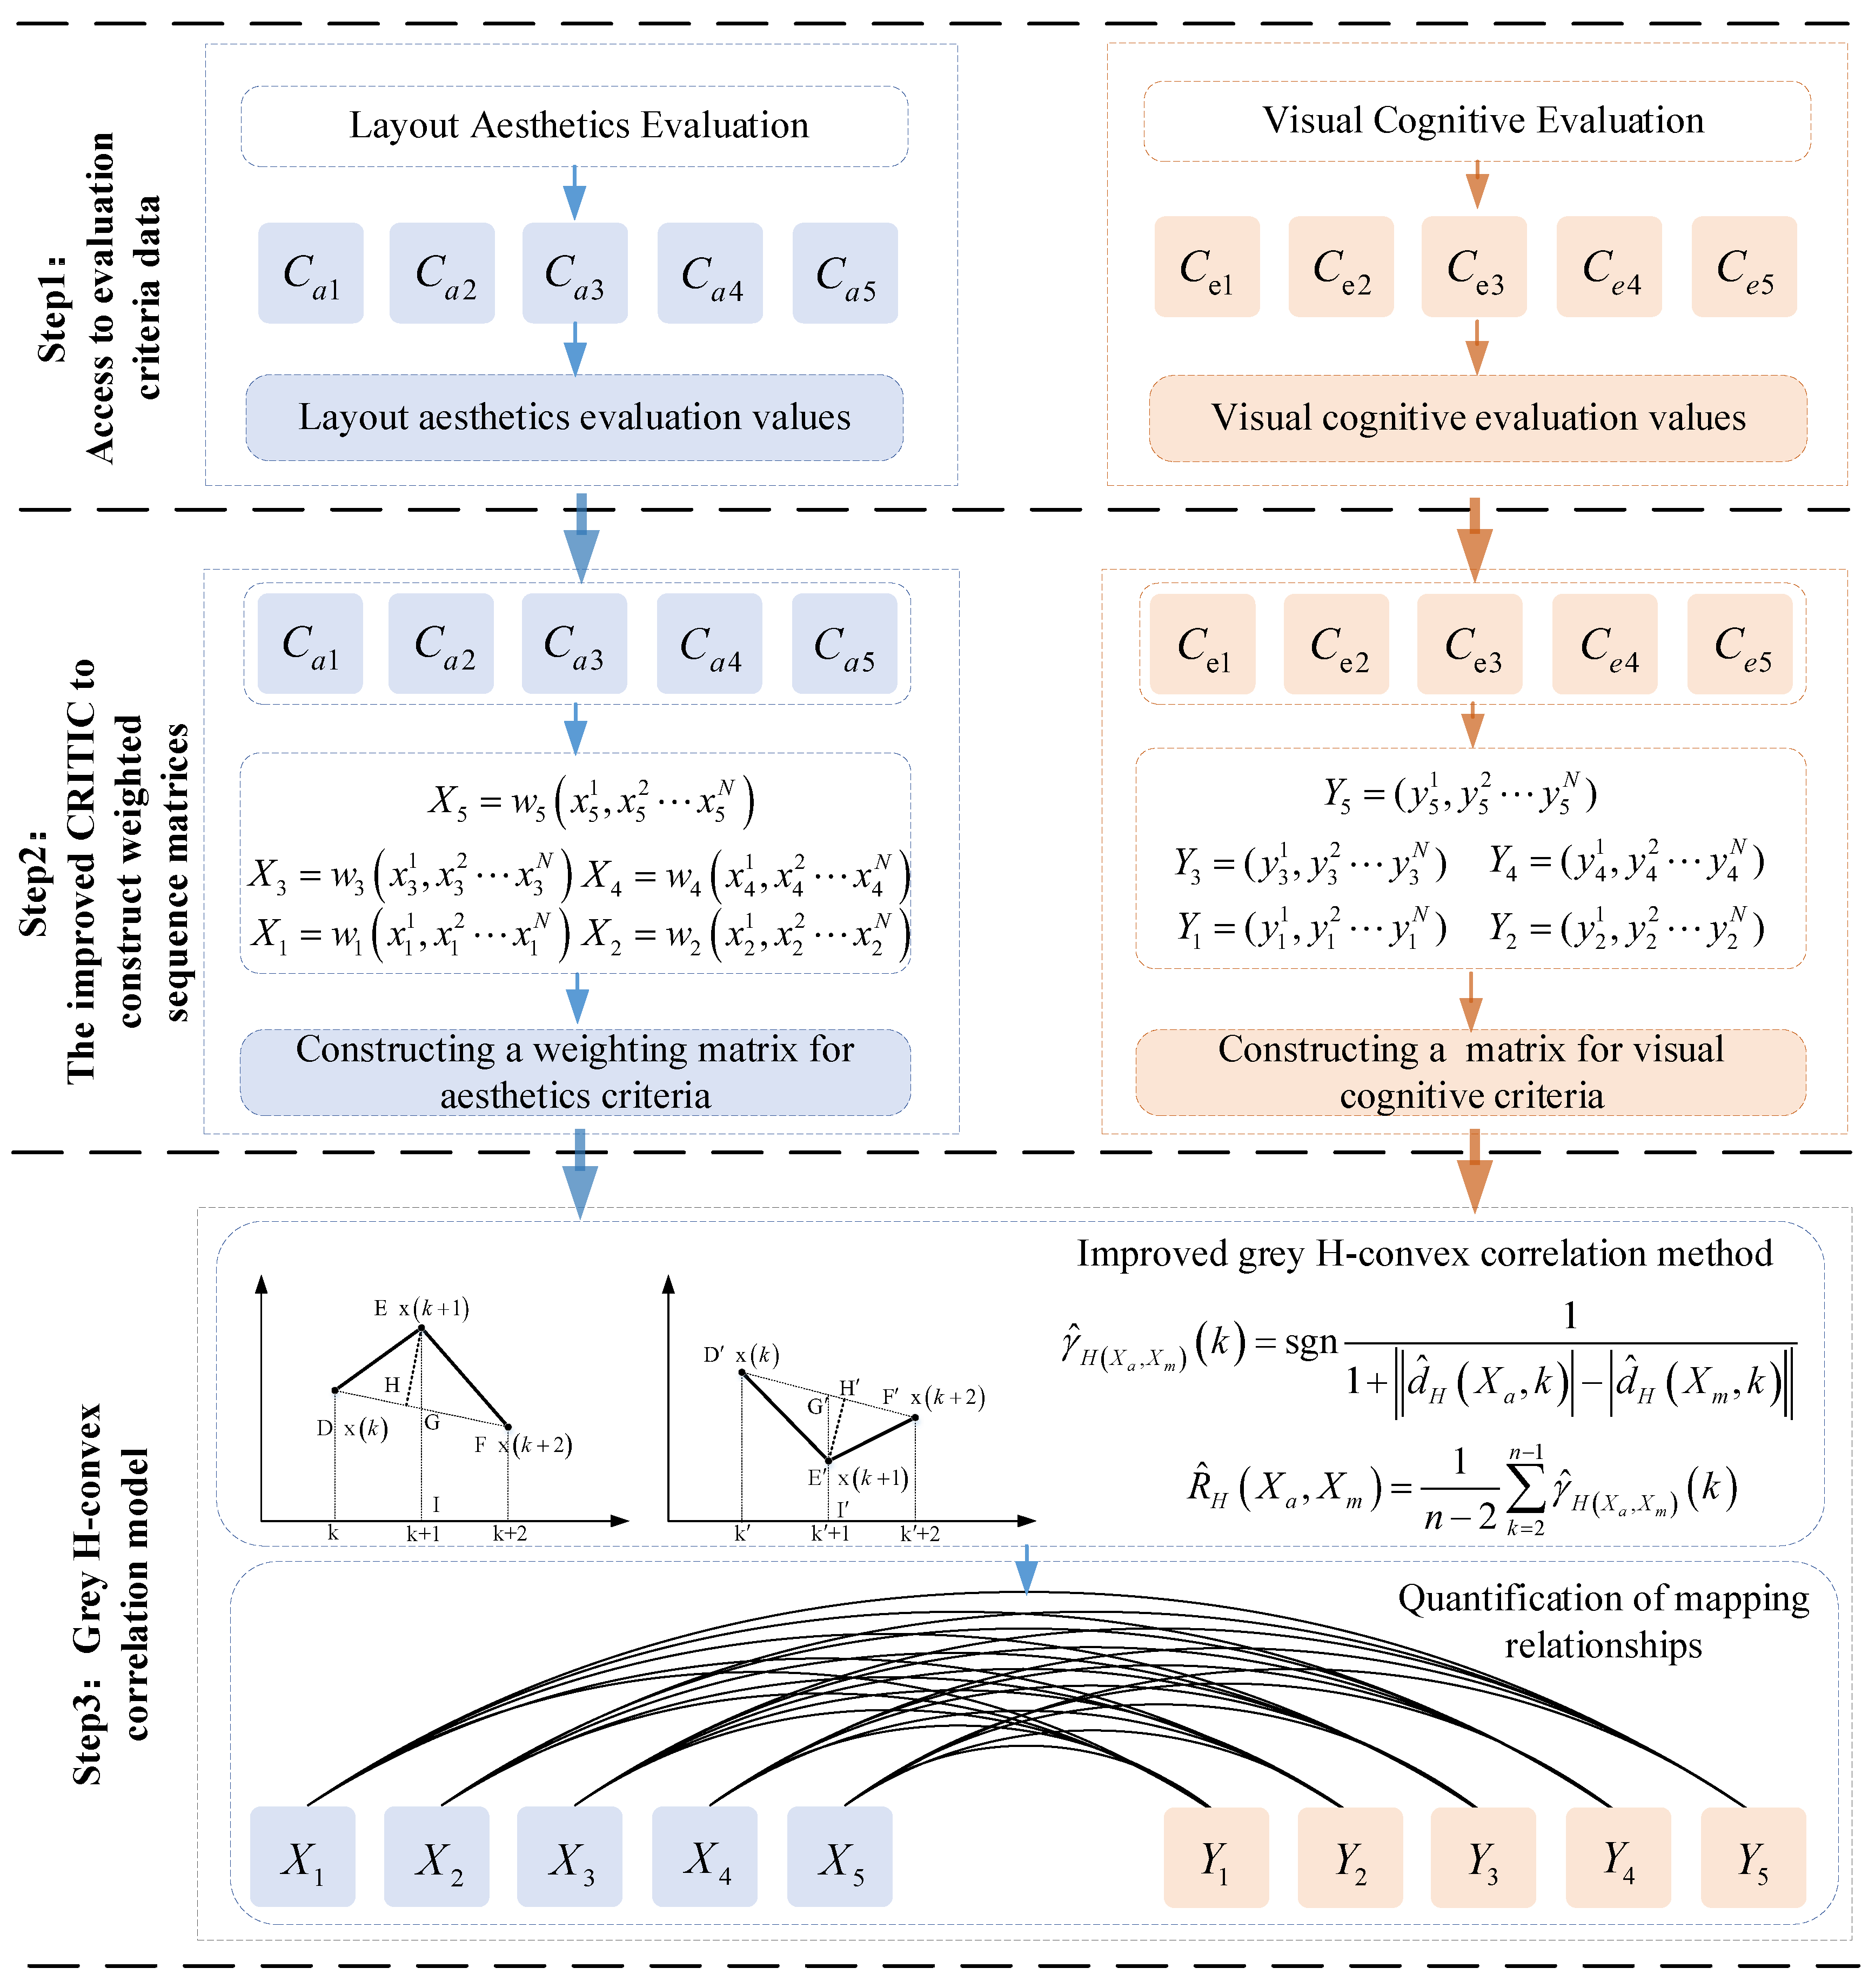
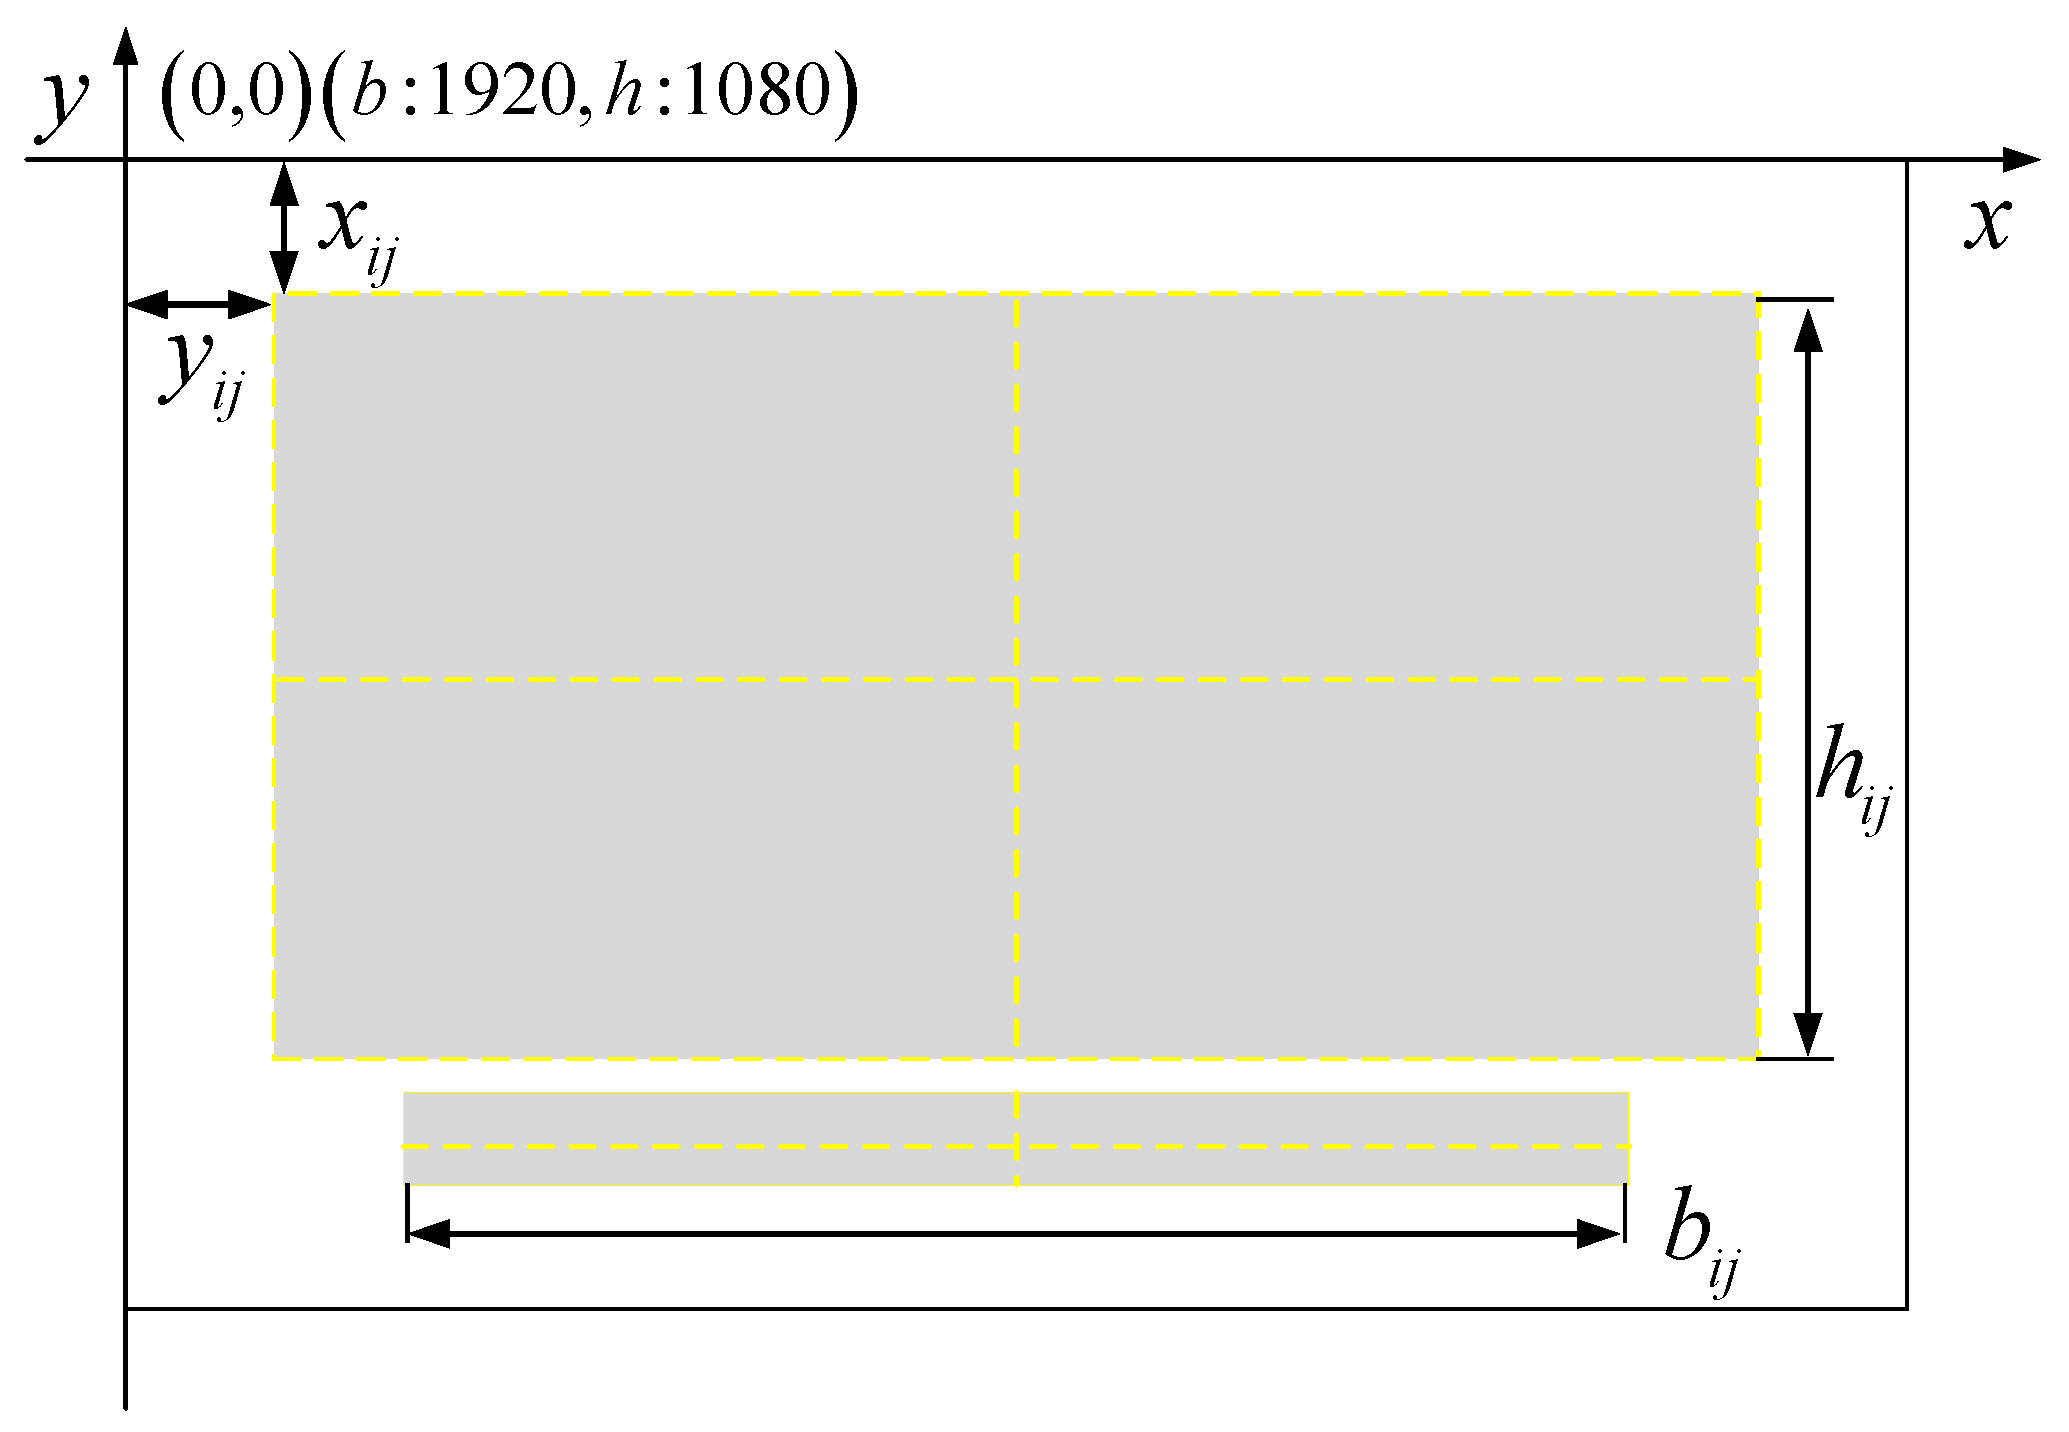
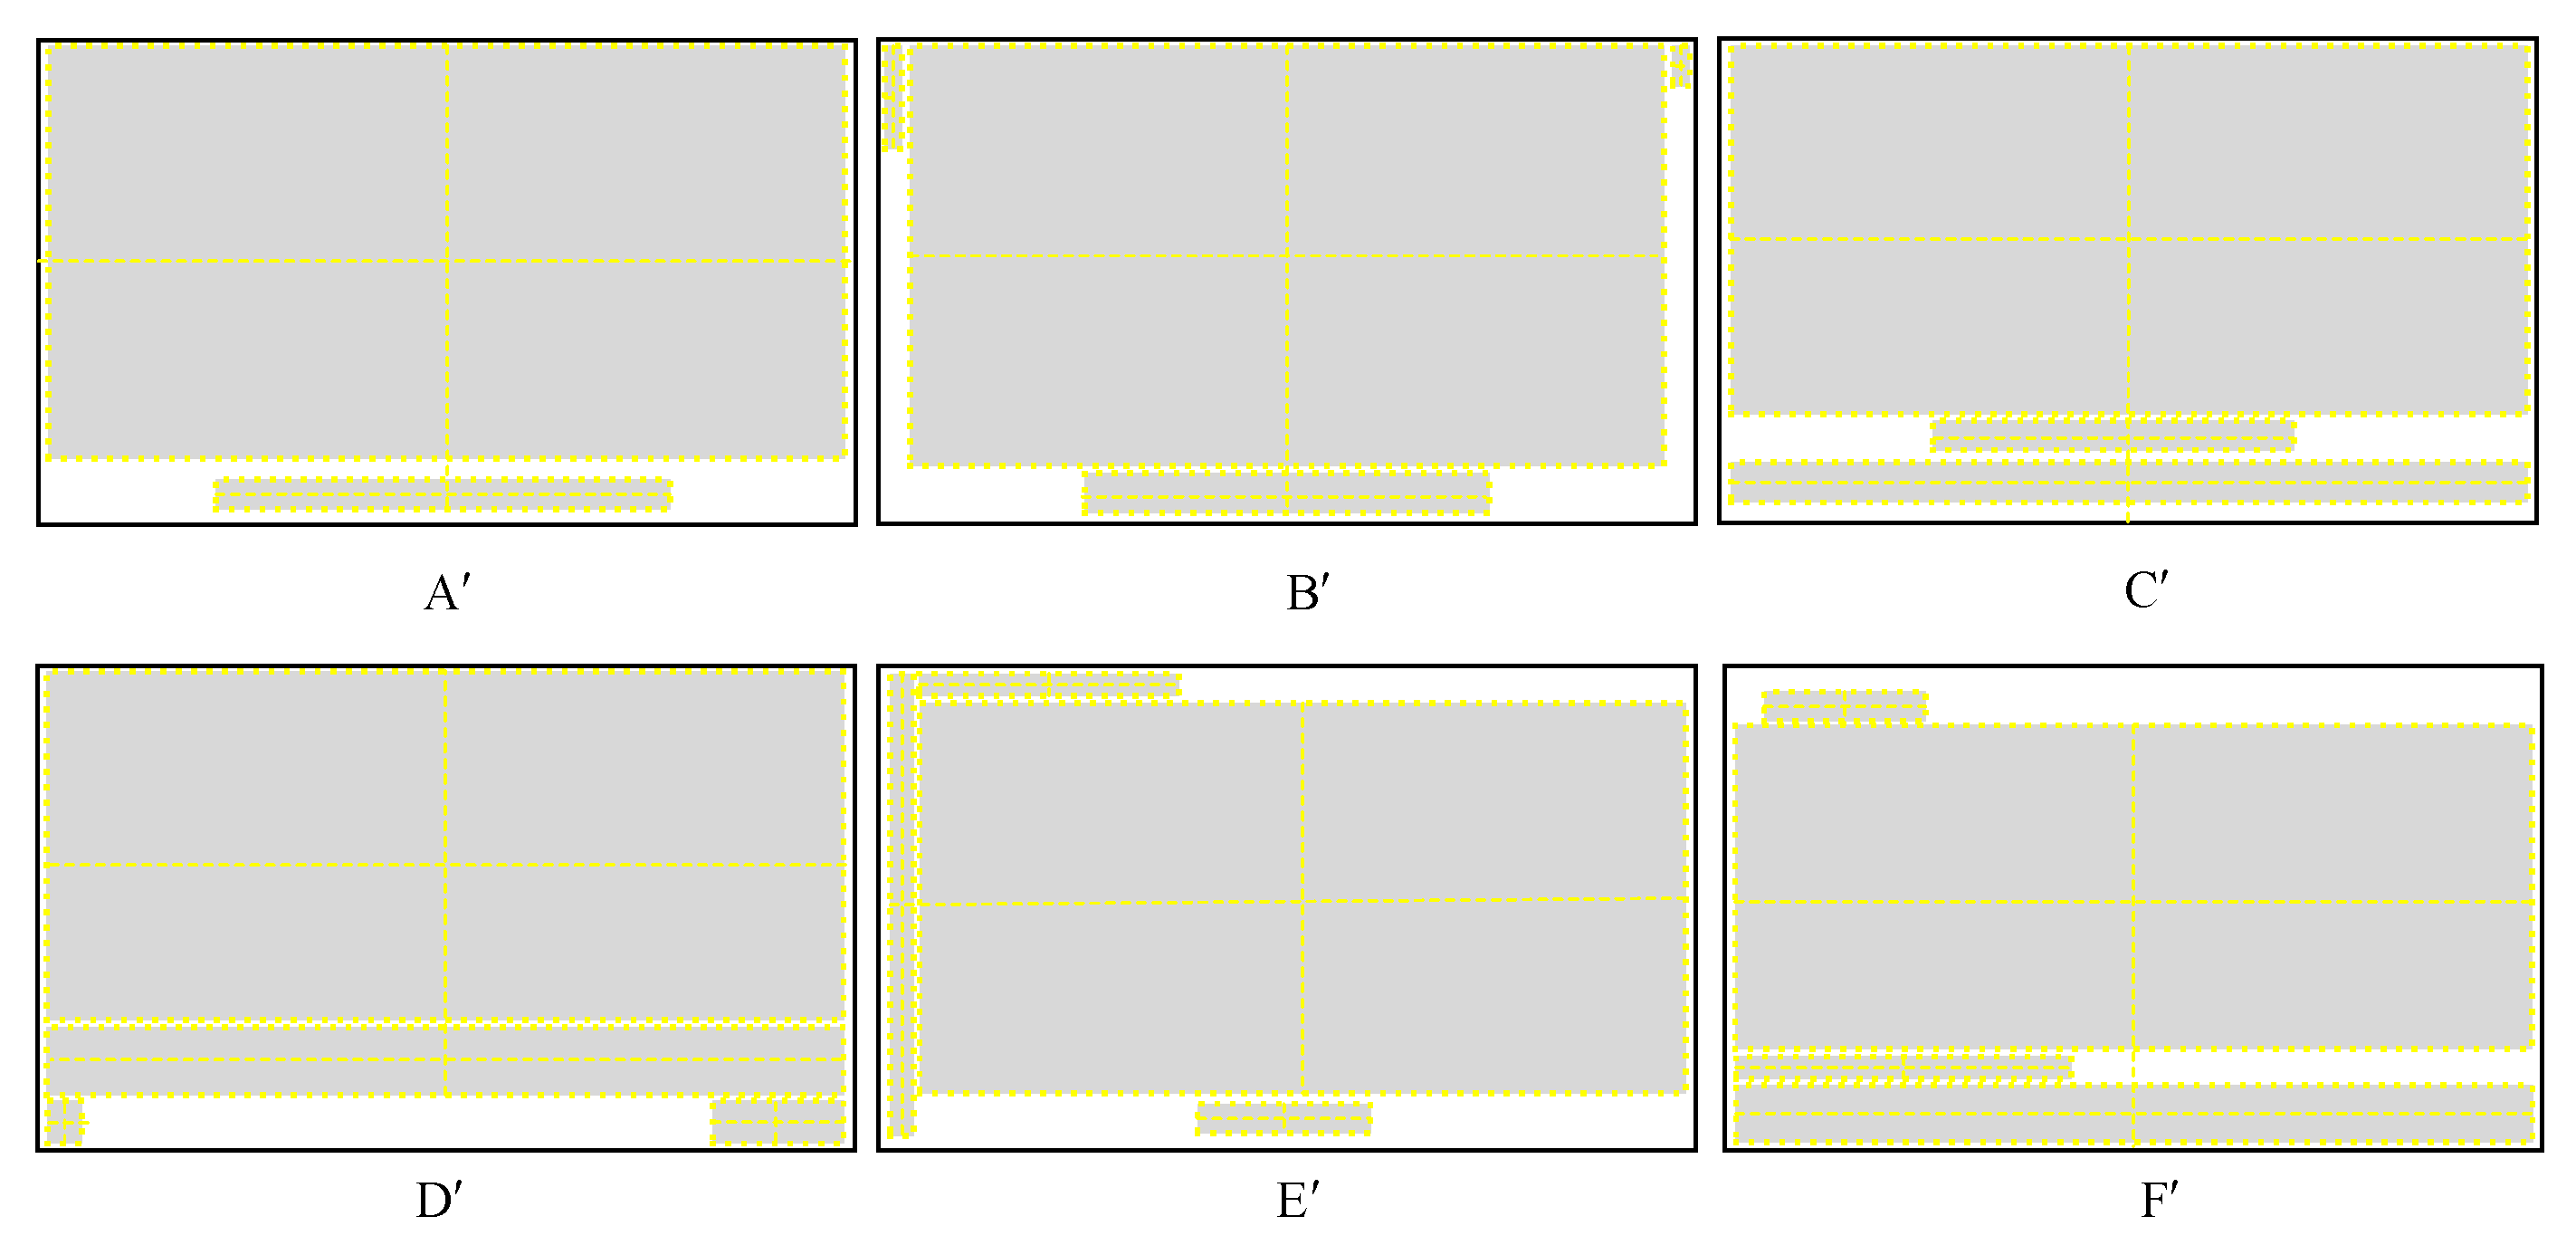
Obtaining criteria data. Firstly, we computed aesthetic assessment values by amalgamating objective formulae with abstract rectangular samples [26]. Secondly, physiological measurements of visual cognition were acquired utilizing eye-tracking technology to collect pertinent eye movement indicator data. Let the set of aesthetic evaluation criteria be { C a 1 , C a 2 , C a 3 , C a 4 , C a 5 } , and the set of eye movement criteria is { C e 1 , C e 2 , C e 3 , C e 4 , C e 5 } .
(2)
Constructing a weighted indicator sequence matrix based on the ICRITIC. Utilizing the ICRITIC method for weight assignment to criteria, a weighted criteria sequence matrix is constructed, where X 1 denotes the data sequence of the first eye movement indicator under N samples, X 2 , X 3 , X 4 , X 5 and so on and Y 1 denotes the data sequence of the first aesthetic indicator under N samples, Y 2 , Y 3 , Y 4 , Y 5 and so on.
(3)
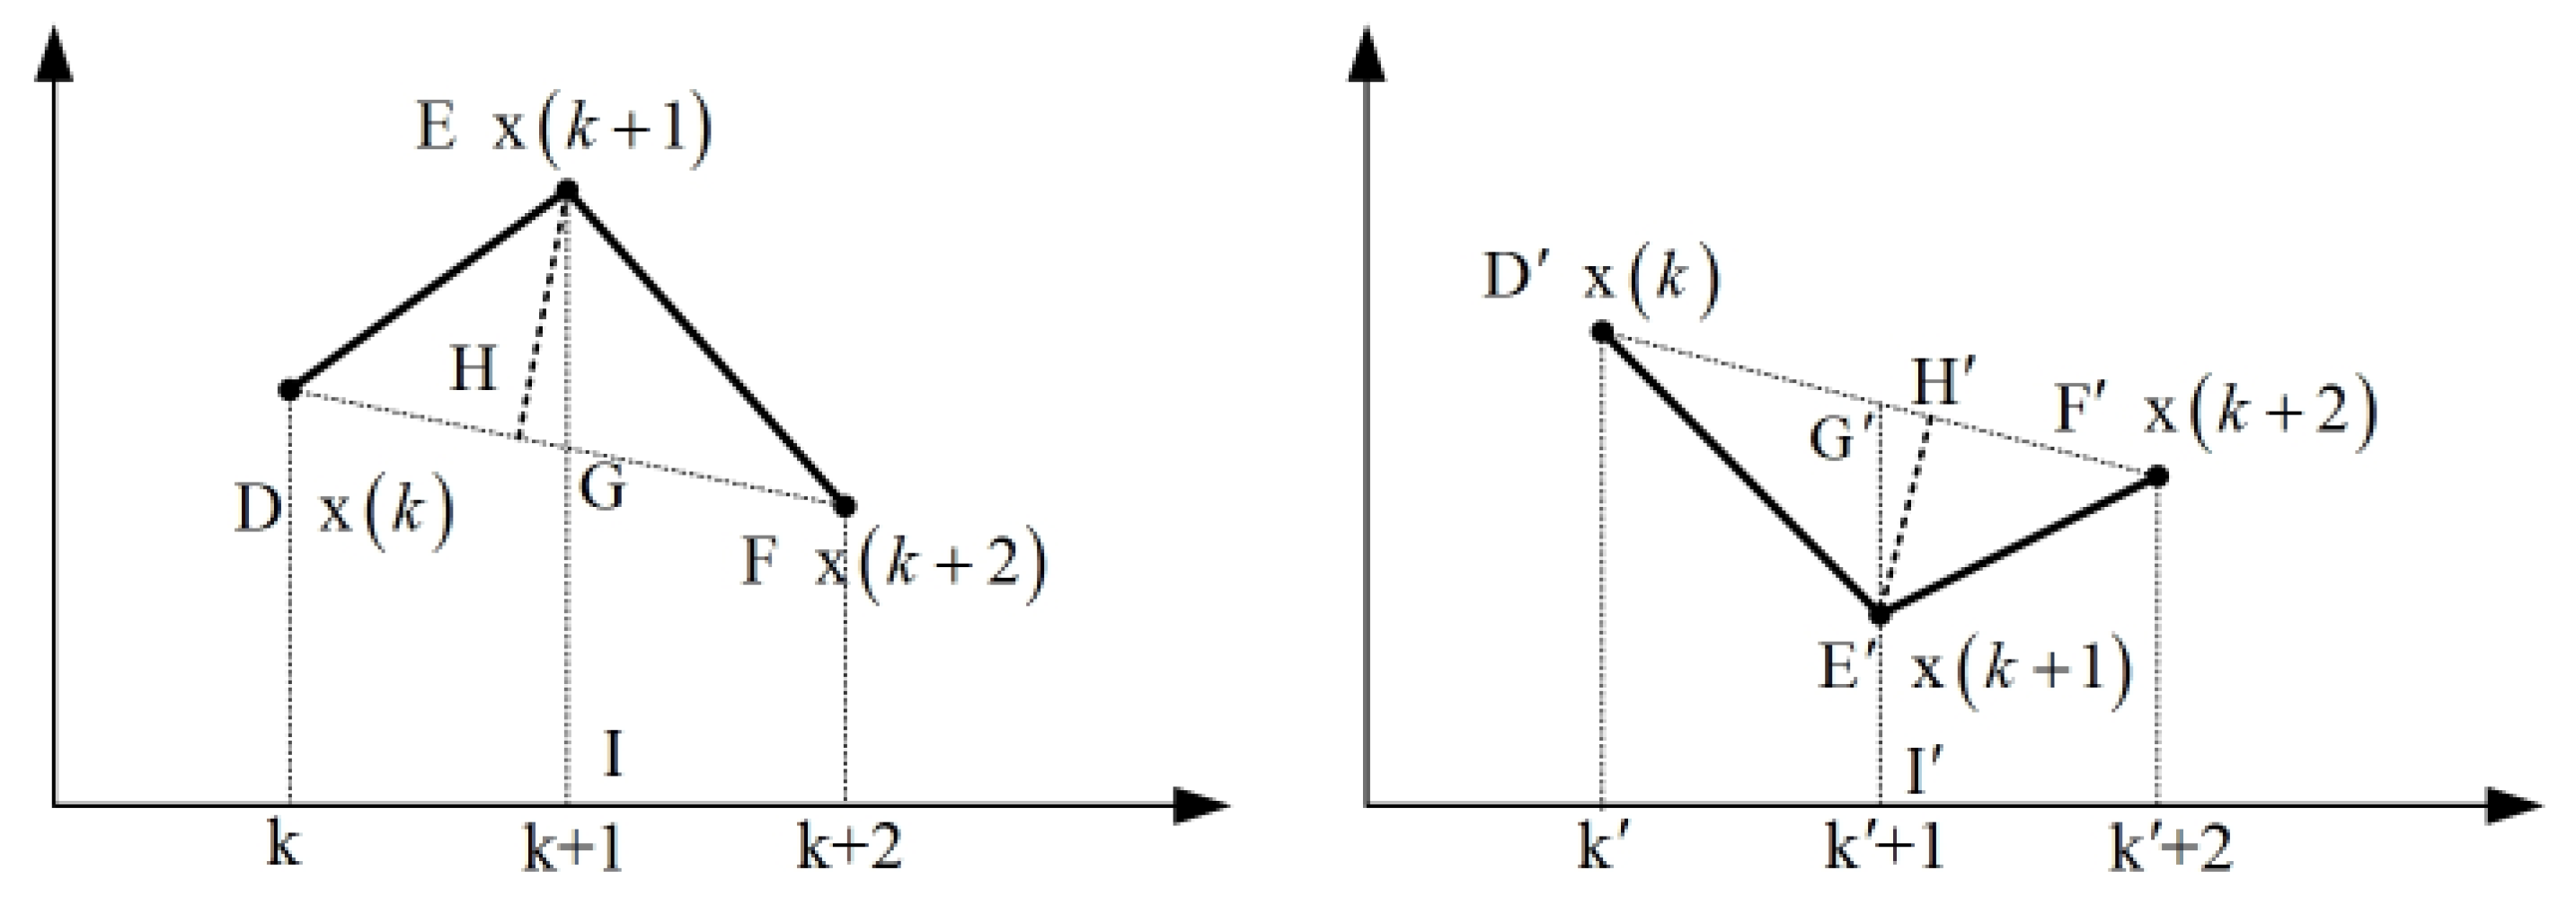
Gray H-convex correlation model. Optimizing the gray H-convex correlation model based on weighted indicator sequence matrices. Using the visual cognitive criteria sequence as the reference sequence, i.e., Y = ( Y 1 , Y 2 , Y 3 , Y 4 , Y 5 ) , and using the layout aesthetic criteria sequence as the comparison sequence, i.e., X = ( X 1 , X 2 , X 3 , X 4 , X 5 ) . The mapping relationship between layout aesthetics and visual cognitive features is clarified by calculating the correlation between the indicator data sequence curves, where γ ^ H ( X a , X m ) ( k ) is denoted as the gray H-convexity coefficients of X a and X m at t = k , an R ^ H ( X a , X m ) is denoted as the gray H-convex correlation degree between sequences X a and X m . The meaning of the symbols in the diagrams is detailed in Section 4.2.3 and will not be repeated here.
Figure 3. Model framework.
Applsci 14 07006 g003

4.2. Layout Aesthetics and Visual Cognitive Mapping Model

4.2.1. Collecting Data

Layout Aesthetic Evaluation Value

In this section, there are a total of five layout aesthetic indicators that require quantification: symmetry, density, simplicity, order, and dominance. The following elucidates the detailed methods and steps. Leveraging insights from the psychological proposition on the shape advantages of human cognitive processing, interface information and images are functionally partitioned and abstracted into rectangles, facilitating precise positioning of interface elements. Subsequently, a coordinate system for calculating the interface layout aesthetic criteria was established, depicted in Figure 4. Select four parameters for spatial positioning of interface elements, namely, rectangular x -coordinate, y -coordinate, total width b , and total height h . Among them, x i j and y i j represent the x and y coordinates of the layout element, while b i j and h i j represent width and height. The following are the specific meanings and calculations of the interface aesthetic indicator, with the aesthetic value set as an uninterrupted number in the interval [0, 1].
(1)
Symmetry C a 1
The symmetry in interface layout is calculated based on three main directions: vertical, horizontal, and diagonal symmetry. According to the literature [26], the symmetry is calculated as:
C a 1 = 1 | s vertical | + | s h o r i z o n t a l | + | s radial | 3
where S v e r t i c a l , S h o r i z o n t a l and S r a d i a l denote vertical, horizontal and diagonal symmetry values, respectively,
S vertical = 1 12 ( | X UL X UR | + | X LL X LR | + | Y UL Y UR | + | Y LL Y LR | + | H UL H UR | + | H LL H LR | + | B UL B UR | + | B LL B LR | + | θ UL θ UR | + | θ LL θ LR | + | R UL R UR | + | R LL R LR | )
S h o r i z o n t a l = 1 12 ( | X UL X LL | + | X UR X LR | + | Y UL Y LL | + | Y UR Y LR | + | H UL H LL | + | H UR H LR | + | B UL B LL | + | B UR B LR | + | θ UL θ LL | + | θ UR θ LR | + | R UL R LL | + | R UR R LR | )
S radial = 1 12 ( | X UL X LR | + | X UR X LL | + | Y UL Y LR | + | Y UR Y LL | + | H UL H LR | + | H UR H LL | + | B UL B LR | + | B UR B LL | + | θ UL θ LR | + | θ UR θ LL | + | R UL R LR | + | R UR R LL | )
where X j , Y j , H j , B j , θ j and R j are the dimensionless values of X j , Y j , H j , B j , θ j and R j after the canonical treatment, respectively, and:
X j = i n j | x i j x c | , j = UL , UR , LL , LR
Y j = i n j | y i j y c |
H j = i n j h i j , B j = i n j b i , θ j = i n j | y i j y c x i j x c |
R j = i n j ( x i j x c ) 2 + ( y i j y c ) 2
G i = o i min { o j } 1 j n max { o j } 1 j n min { o j } 1 j n , G = X , Y , H , B , θ , R .
where U L , U R , L L and L R denote upper left, upper right, lower left and lower right, respectively, ( x i j , y i j ) are the coordinates of the center of element i in quadrant j , and ( x c , y c ) are the coordinates of the center of the interface. b i j and h i j are the width and height of the object, respectively, and n j refers to the total number of objects on the quadrant.
(2)
Density C a 2
Density in interface design refers to the arrangement and spacing of elements, determining the degree of tightness or looseness. The calculation involves assessing the difference between the actual and optimal interfacial densities. According to the density calculation formula [26], the influencing factor is the ratio of the area of all elements to the interface area.
(3)
Simplicity C a 3
Simplicity refers to the level of alignment and integration of interface elements, with the goal of reducing cognitive load on the user interface layout. According to the simplicity calculation formula [26], the factors that influence simplicity include the number of alignment points for elements in the vertical and horizontal directions of the interface, as well as the total number of interface elements.
(4)
Order C a 4
An interface layout that conforms to the reading habits and gaze trajectory of the human eye can effectively guide the user’s browsing order. According to the order degree calculation formula [26], the influencing factors are the area of elements in the upper-left, upper-right, lower-left, and lower-right regions of the interface and the weight of each region.
(5)
Dominance C a 5
There is a significant dominance of interface information, with the human eye first navigating the upper-left region of the interface, followed by the upper right, lower left, and lower right. According to the dominance calculation formula [26], the influencing factor is the difference in element area between the optimal interface and the upper-left, upper-right, lower-left, and lower-right areas of the interface.

Visual Cognitive Measurement Values

Acquiring user visual cognitive physiological measurements involves conducting eye movement experiments. This entails introducing the experimental equipment, environment, and subjects.
(1)
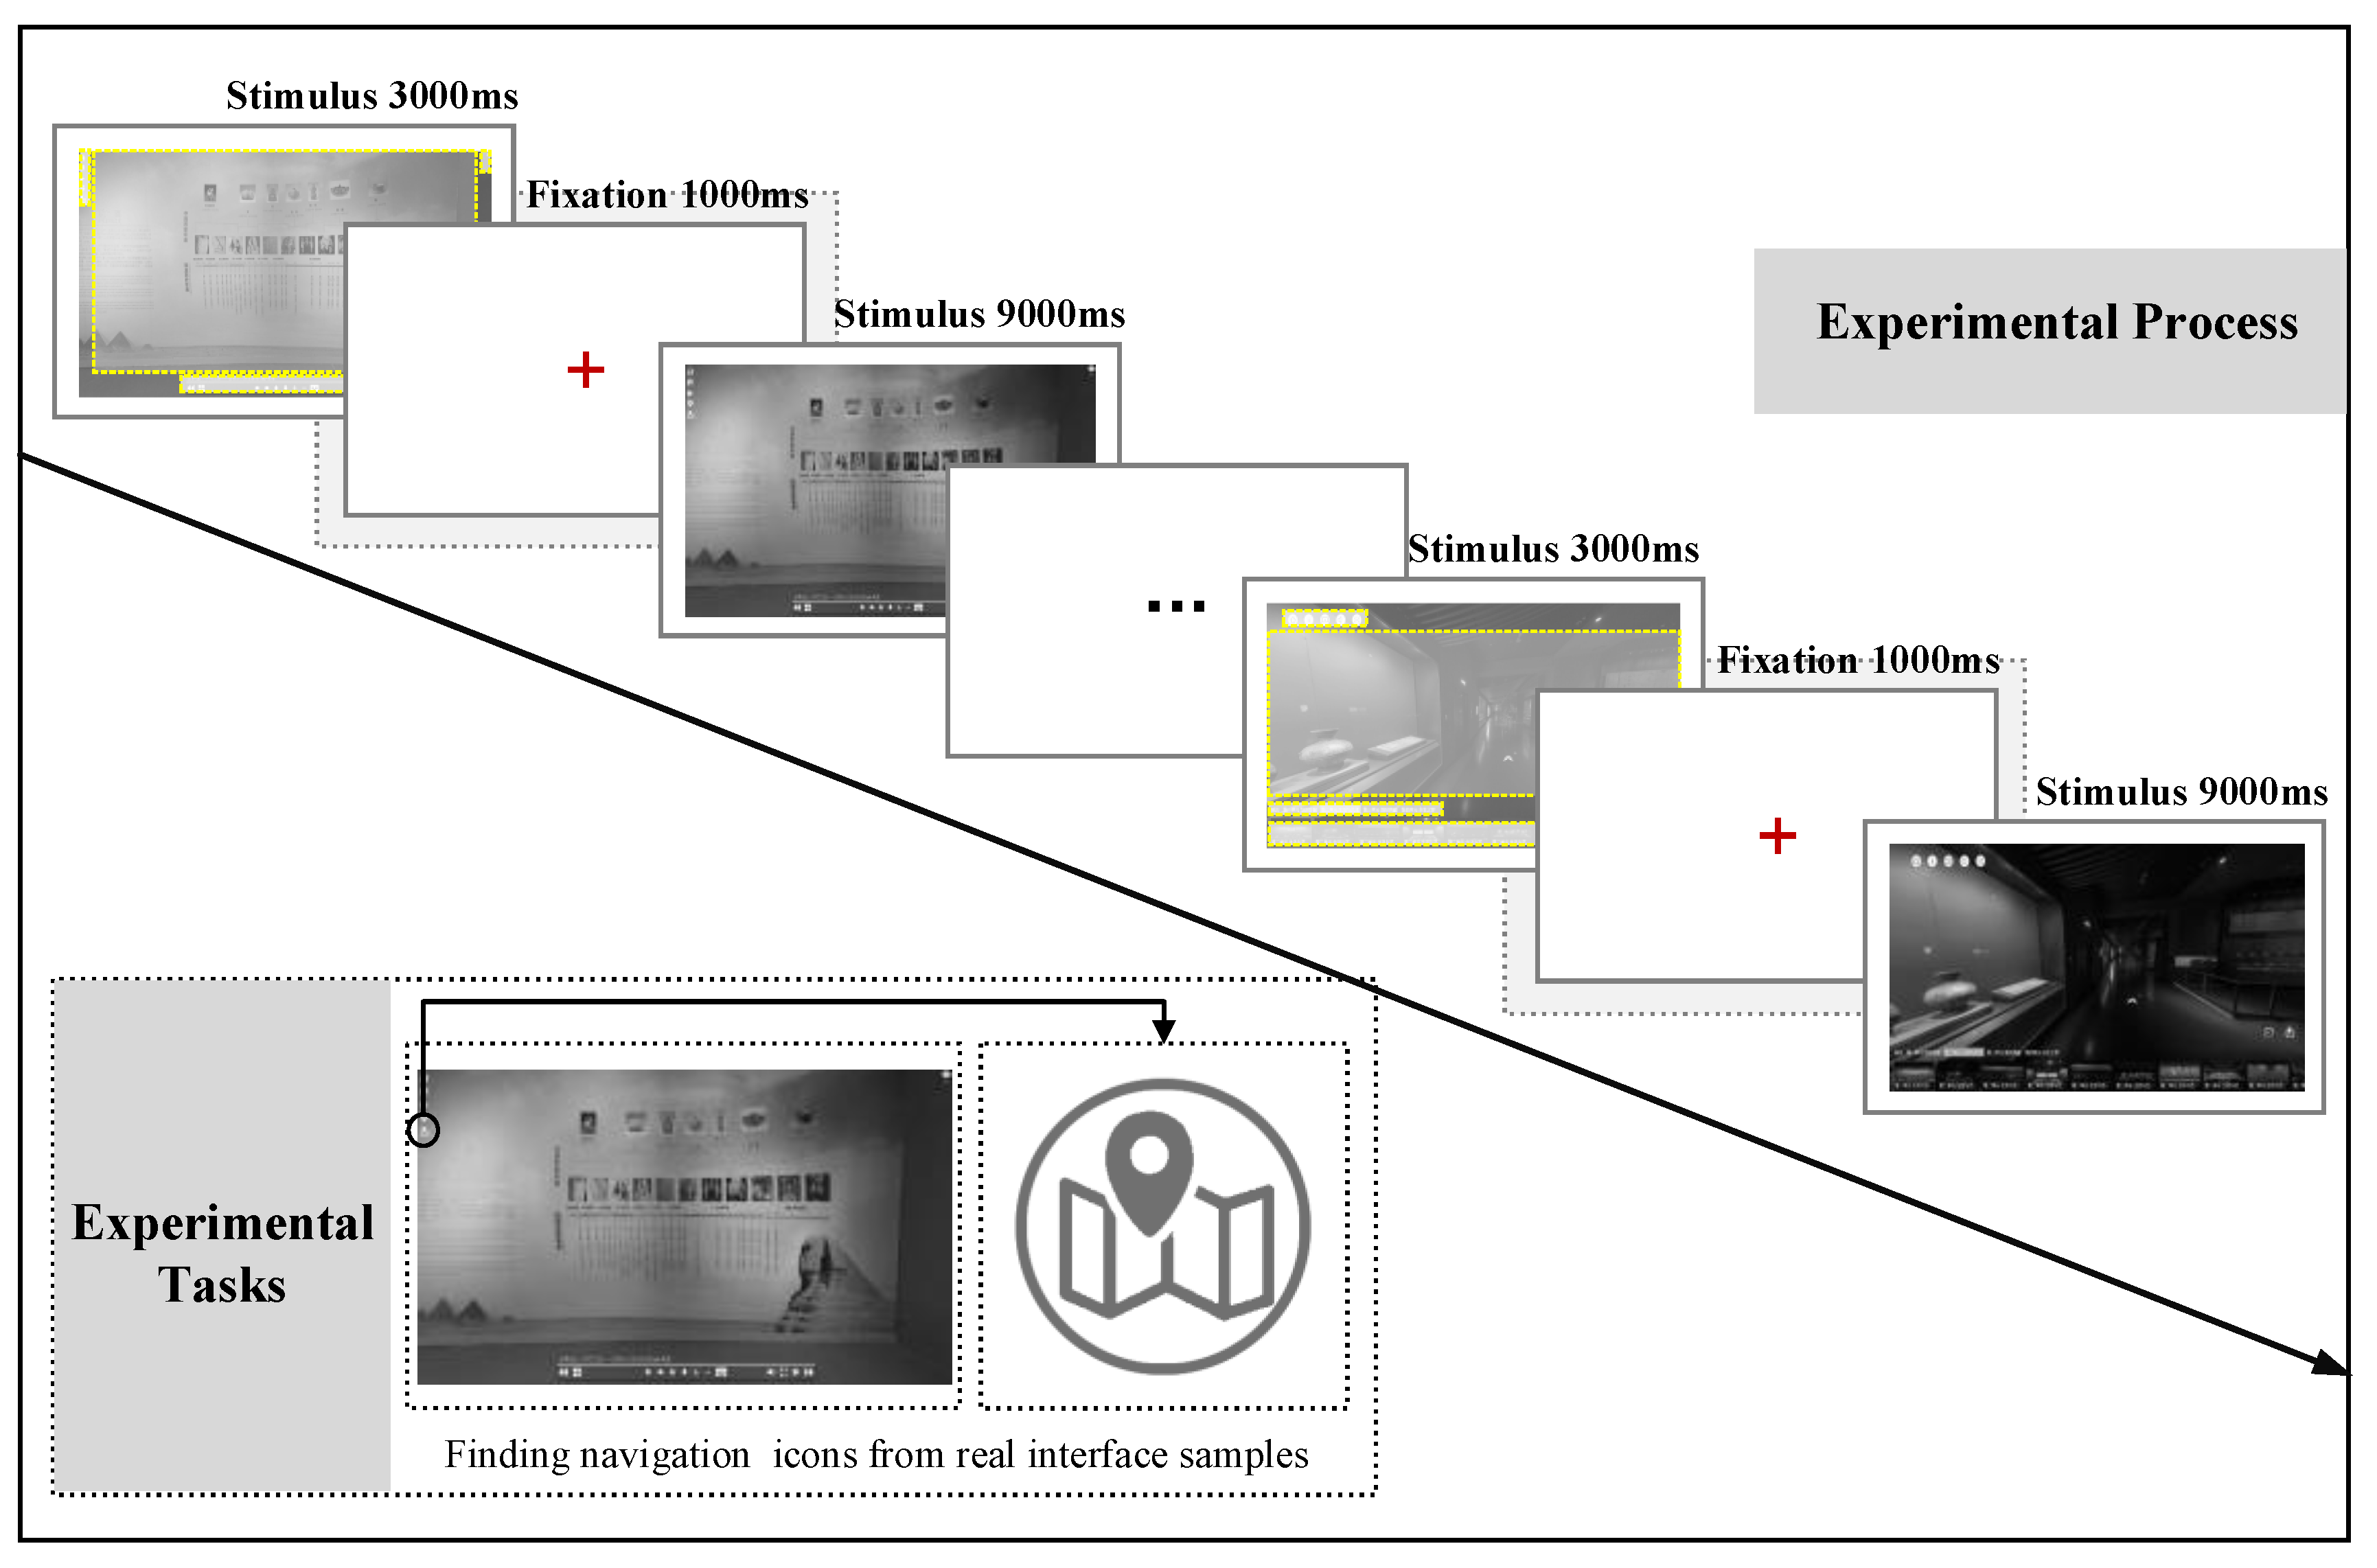
Experimental Equipment: The Tobii X120 eye tracker (Tobii, Danderyd Municipality, Sweden) (with a sampling frequency of 120 Hz and an accuracy of approximately 0.4°) and a 23.8-inch Dell desktop presentation monitor (Dell, Round Rock, TX, USA) (with a resolution of 1920 × 1080 px, operating at 60 Hz) were chosen. ErgoLAB software (ErgoLAB v3.12) was employed to develop, execute, and collect experimental stimulation programs, while SPSS software (v.29) was utilized for experimental data processing and analysis. All potential interfering factors (such as noise, external light sources, odors, temperature, etc.) were minimized during the experiment. The experimental setting encompassed a laboratory space covering approximately 42 square meters, indoors, with shading treatments applied.
(2)
Experimental Subjects: The study enlisted 6 professionals (comprising the professional group) with over 3 years of experience in human–machine interface design, alongside 32 non-designers, none of whom had prior involvement in similar experiments. Among the non-professional group, there were 16 males and 16 females aged 20–32 years, with an average age of 25 years (standard deviation = 0.843). The day before the experiment, participants were reminded to ensure adequate sleep and to avoid being excessively tired or excited. Prior to the formal experiment, all participants underwent vision chart and color vision tests to ensure normal vision in both eyes and no visual impairments. Additionally, participants completed and signed a consent form approved by the university review board, ensuring that they fully understood the experiment’s content and the associated ethical and legal guidelines.

4.2.2. Criteria Weights

The conventional gray H-convex correlation algorithm overlooks indicator weights when delineating the similarity process of data sequence curves. This section employs the ICRITC method to ascertain criteria weights, formulate criteria-weighted data sequences, and enhance the optimization of model data input.
Step 1. Create a sample data matrix. Setting the number of samples as m and the number of aesthetic indicators as n , and the sample data matrix used for interface evaluation is:
Z = [ r i j ] m × n
Step 2. Standardize data. The data need to be pre-standardized in order to eliminate differences in the scale and positive and negative attributes of the indicators.
Positive criteria are calculated as:
t i j = x i j min { x i j } max { x i j } min { x i j }
Negative criteria are calculated as:
t i j = max { x i j } x i j max { x i j } min { x i j }
Step 3. Calculate the correlation coefficient. The correlation coefficient between the i and j criteria was calculated as:
r i j = h = 1 n ( t h j t ¯ i ) ( t h j t ¯ j ) h = 1 n ( t h i t ¯ i ) 2 h = 1 n ( t h j t ¯ j ) 2
where t h i and t h j are the values of the i th and j th indicators in the h th evaluation sample, and t ¯ i and t ¯ j are the mean values of the i th and j th criteria in all samples.
Step 4. Calculation of the Gini coefficient between criteria:
δ i = j = 1 n k = 1 n | t i j t i h | 2 n j = 1 n t i j
where δ i is the Gini coefficient for the i th criteria and δ i [ 0 , 1 ] .
Step 5. Calculate the conflict factor. To address the issue of positive and negative correlations between criteria, the correlation coefficients are taken as absolute values. The formula for this calculation is:
v i = j = 1 n ( 1 | r i j | )
Step 6. Calculation of the informativeness of the criteria:
C i = δ i v i
Step 7. Calculation of criteria weighting:
W i g = C i / i = 1 n C i

4.2.3. Improved Gray H-Convex Correlation

This section calculates the similarity between two lines by calculating the H-convexity between them, that is, calculating the correlation between layout aesthetics lines and visual cognitive lines.
Definition 1. 
As shown in Figure 5, there is an arbitrary line D E F , where segment D F represents the span and the perpendicular H E from vertex E to span D F represents the arch height.
Definition 2. 
As shown in Figure 5, the ratio of the arch height H E to span D F is the H-convexity of the folding lines D E F , represented by d H c o n v e x = H E D F .
(1)
Calculate H-convexity
As shown in Figure 6, based on x ( k ) , x ( k + 1 ) , and x ( k + 2 ) in the standardized criteria series X plotting the fold, D E F spans D F = ( k + 2 k ) 2 + [ x ( k + 2 ) x ( k ) ] 2 = 4 + [ x ( k + 2 ) x ( k ) ] 2 . For easy calculation of values, the value of G E is used instead of the arch height H E . G E = x ( k + 1 ) x ( k ) + x ( k + 2 ) 2 , then the H-convexity value of the sequence X at t = k + 1 is recorded as d ^ H ( X , k + 1 ) :
d ^ H ( X , k + 1 ) = x ( k + 1 ) x ( k ) + x ( k + 2 ) 2 4 + [ x ( k + 2 ) x ( k ) ] 2
(2)
Calculate the gray H-convex correlation coefficient
In this step, the aesthetic indicator weights obtained earlier are brought into the indicator data series. Let the aesthetic evaluation indicator be M and the object be N . x m n is the evaluation value for the m th   ( m = a , b , , M ) indicator and the n th ( n = 1 , 2 , , N ) object. The weighted standardized data series of the m th indicator can be represented as X a = ω a ( x a 1 , x a 2 , , x a N ) ,   X b = ω b ( x b 1 , x b 2 , , x b N ) , , X M = ω M ( x M 1 , x M 2 , , x M N ) . Then, the gray H-convexity coefficients of X a and X m at t = k are:
γ ^ H ( X a , X m ) ( k ) = sgn ( d ^ H ( X a , k ) , d ^ H ( X m , k ) ) 1 1 + | | d ^ H ( X a , k ) | | d ^ H ( X m , k ) | |
where d ^ H ( X a , k ) , d ^ H ( X m , k ) is the H-convexity of the sequence X a and X m at t = k , k = 2 , , n 1 , and sgn ( ) represents the sign function.
sgn ( x ) = { 1 , 0 , 1 , x > 0 x = 0 x < 0
(3)
Calculate the gray H-convex correlation degree.
The gray H-convex correlation degree between sequences X a and X m is denoted by R ^ H ( X a , X m ) , abbreviated as R ^ H ( a , m ) . The calculation method is:
R ^ H ( X a , X m ) = 1 n 2 k = 2 n 1 γ ^ H ( X a , X m ) ( k )
Figure 6. Calculation of H-convexity for concave (right) and convex (left) polylines.
Applsci 14 07006 g006

5. Application

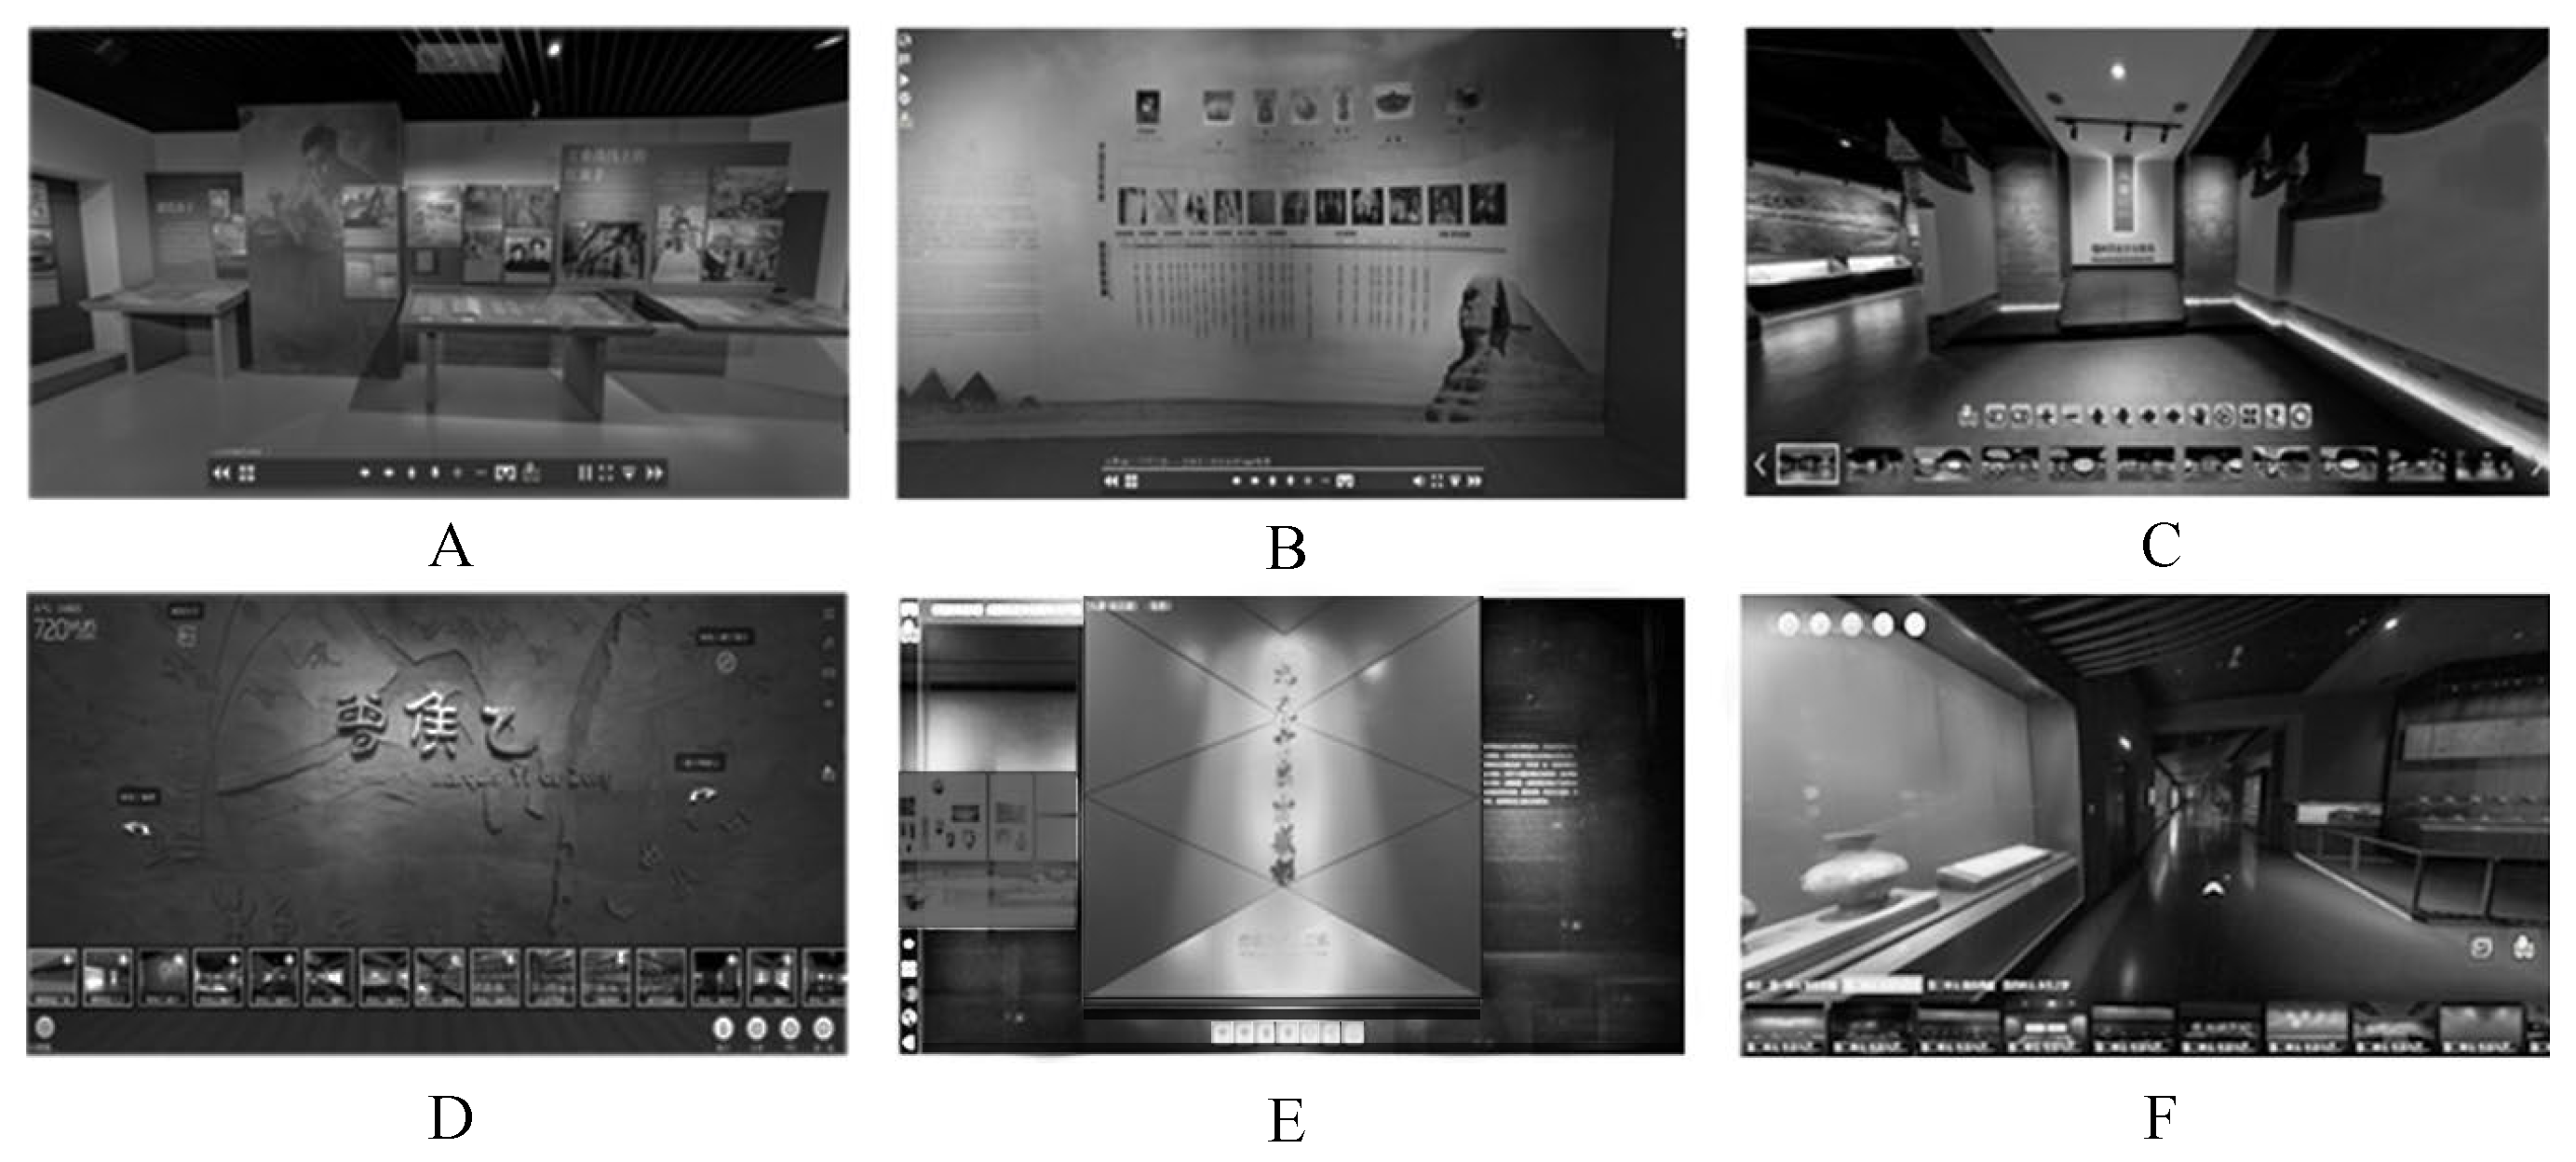
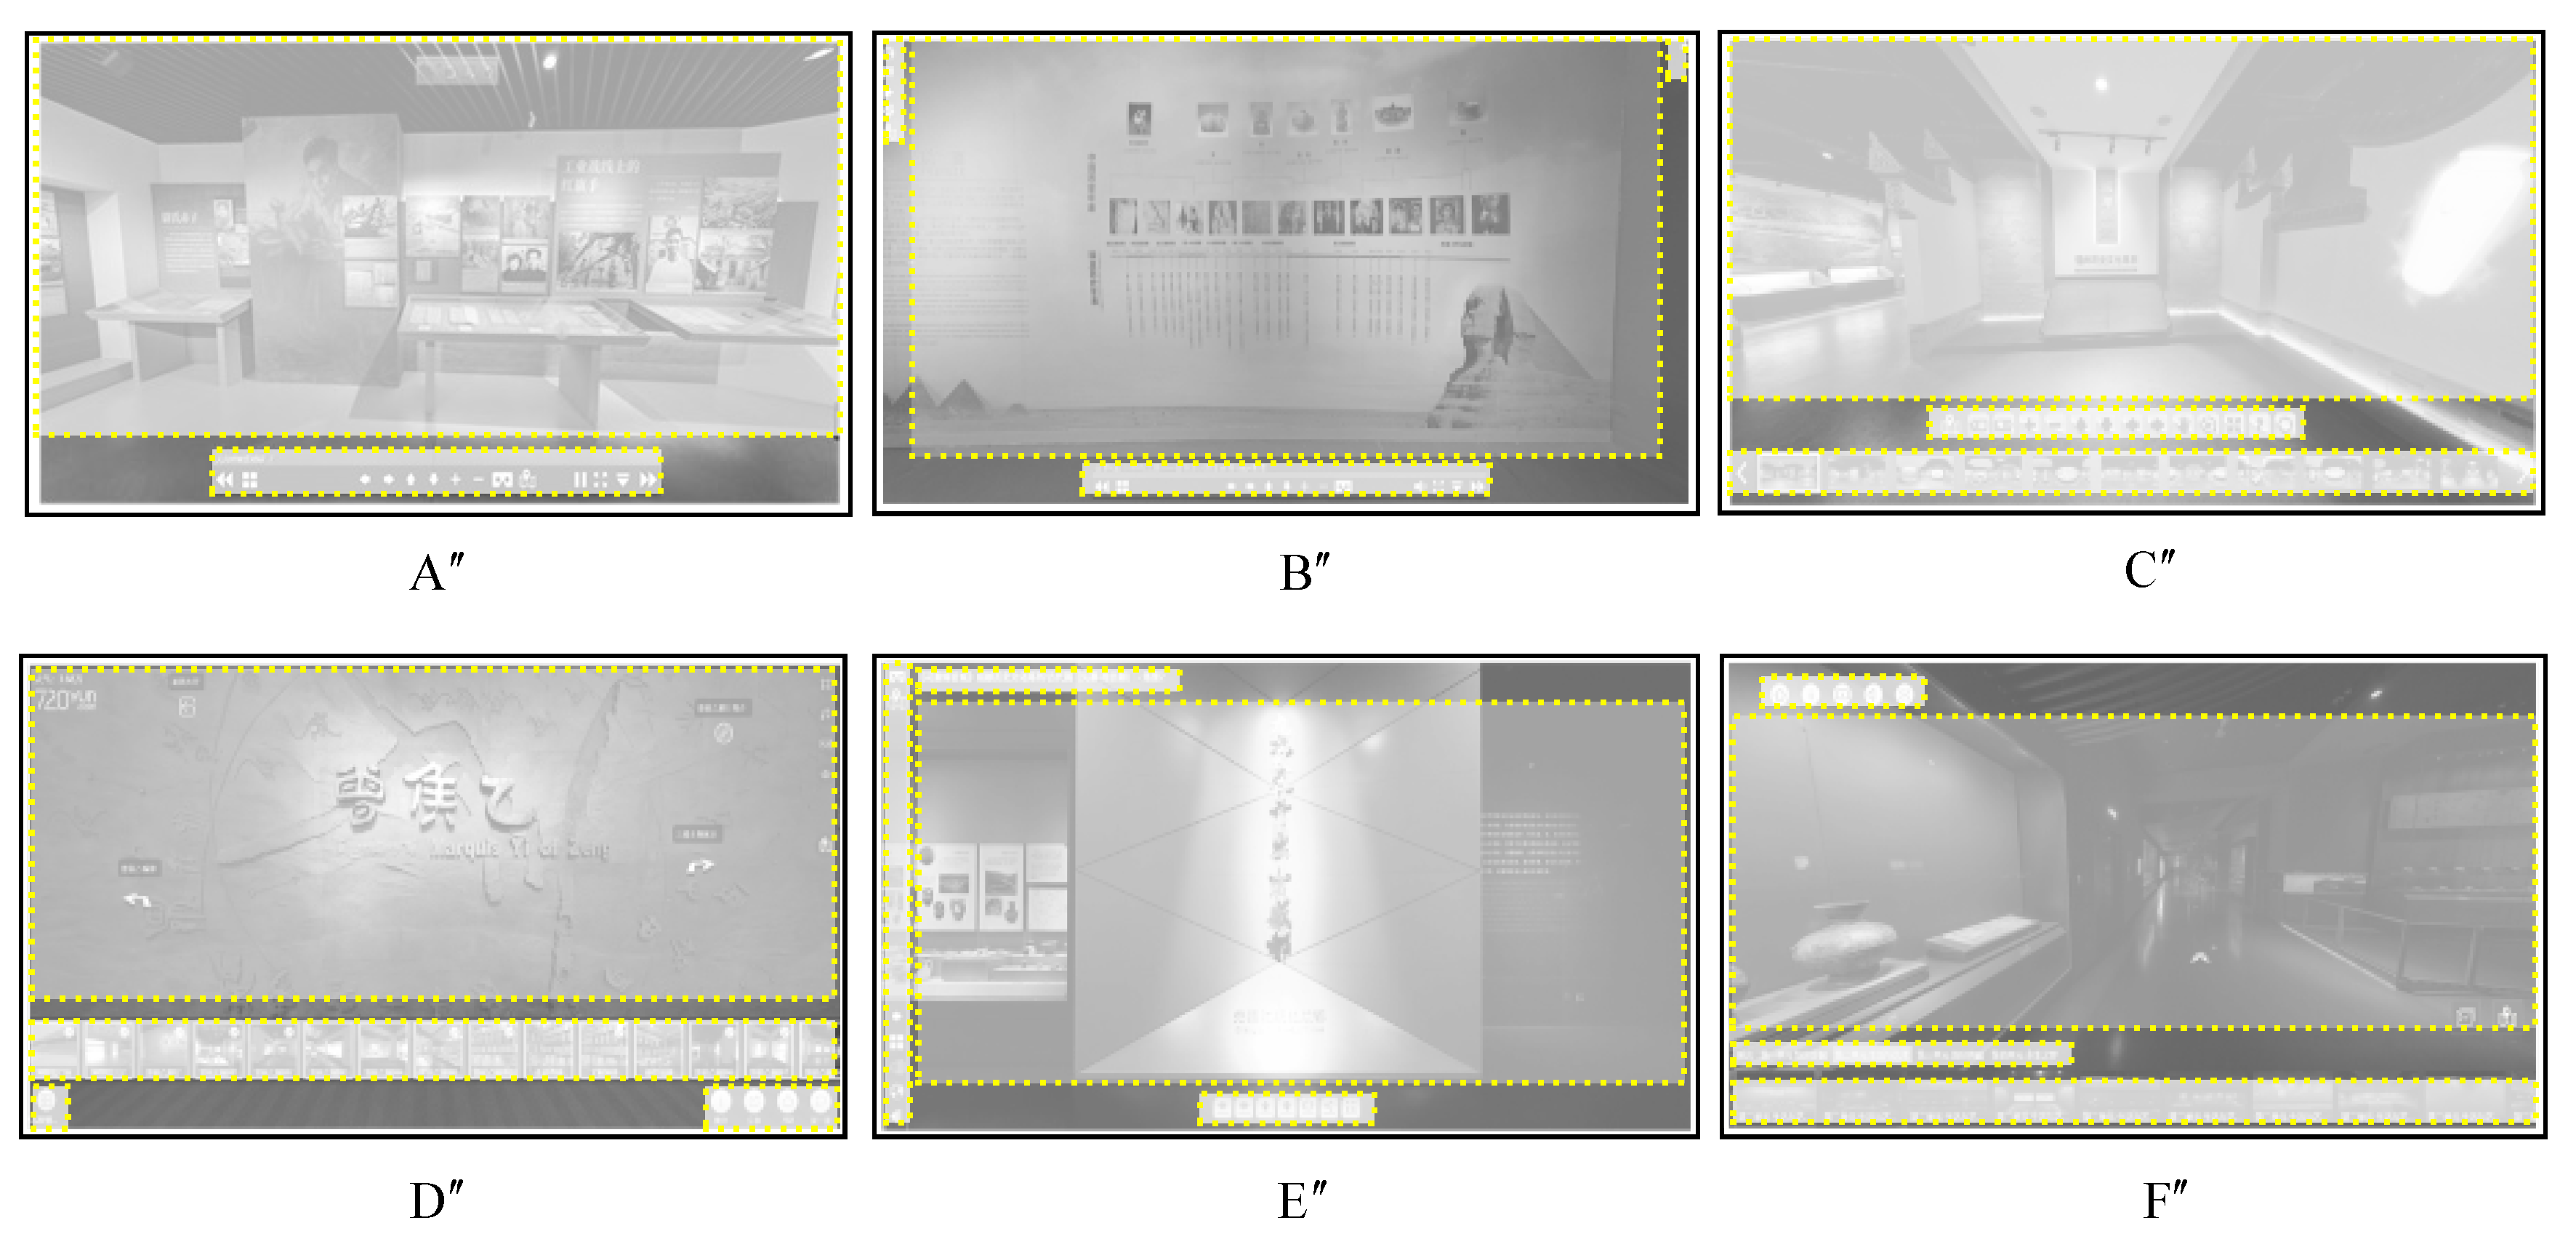
5.1. Evaluation Samples

There were 127 different interface layout samples gathered from the Chinese virtual museum website platform, and the KJ (affinity diagram) method was employed to distill 6 representative samples, depicted in Figure 7. These interface layout samples possess a uniform aspect ratio and abstract functional partitioning into the smallest rectangle capable of encompassing their internal elements. The layout of virtual museum interfaces predominantly follows a POP- or cover-type format, akin to promotional posters. Typically, these interfaces feature an image with local cultural characteristics as the design theme, occupying the central area of the interface and boasting the largest area. Functional element icons are positioned around the interface, with smaller areas. Consequently, the abstracted interface layout image is centralized within the largest rectangle, with smaller rectangles representing functional icons positioned around it. To eliminate the interference of color and font style on the experimental results, all sample stimulus images were converted to black and white and the text areas were blurred. The contrast ratio between the icons and the interface background was set to 4.5:1, and the brightness of all interfaces was standardized.
During eye movement experimental testing, prior studies commonly utilized the abstract rectangular layout interface depicted in Figure 8 as the experimental sample. However, this approach may result in subjects struggling to accurately follow the layout content of the real interface. To enhance the precision of experimental tests, this study re-optimized some of the experimental samples. As illustrated in Figure 9, the real interface was merged with the abstracted rectangular interface while reducing the transparency of the rectangle. This adjustment enabled subjects to vaguely perceive the real interface, facilitating a more intuitive identification of the interface layout. Furthermore, it facilitated a quick connection with real interface content, thereby aiding in the reduction of experimental errors.

5.2. Evaluation Data

5.2.1. Layout Aesthetic Evaluation Data

Based on calculations in the literature [21], the layout aesthetic rating value of the samples in Figure 8 is solved, and the results are shown in Table 1. Samples   A ,   B , and   C have the best symmetry (all aesthetic values > 0.9), sample   E has the worst symmetry (aesthetic value < 0.4), sample   A has the best densities (aesthetic value of 0.99) and   D has the worst densities (aesthetic value of 0.69). Sample   A has the most advantage in terms of simplicity (aesthetic value of 1.00), while sample   D has the worst simplicity (aesthetic value of 0.65).

5.2.2. Eye Movement Experimental Data

The experimental samples are depicted in Figure 7 and Figure 9, featuring six distinct layout forms, each accompanied by two stimulus images: an interface with transparent abstract rectangles and a real interface. The presentation format is as follows: initially, interfaces with transparent abstract rectangles are displayed, followed by the corresponding real interfaces. The six groups of layout interfaces are presented randomly.
During the experiment, subjects are tasked with performing an image search task, wherein they must swiftly locate and accurately click on a navigation map icon while the real interface is playing. The presentation time for the real interface images is limited to 9000 milliseconds. If participants find the target before 9000 milliseconds, they can freely press the space bar to proceed to the next image. Each image is displayed only once. The experimental process and tasks are delineated in Figure 10.
The experimental measurement data of fixation duration, fixation count, mean pupil diameter, gaze shift frequency and gaze time percentage were obtained using ErgoLAB software. Due to one participant wearing contact lenses, the eye-tracking device was unable to perform precise calibration, resulting in significant data deviation. Consequently, this set of experimental data was excluded. Ultimately, the data results from 37 participants were compiled, including 6 interface experts and 31 non-professionals. The statistical results are presented in Table 2. Additionally, an analysis of variance (ANOVA) and tests were conducted on five eye movement indicators. The results showed fixation duration (F = 3.126, p < 0.05), fixation count (F = 9.506, p < 0.05), mean pupil diameter (F = 20.089, p < 0.05), gaze shift frequency (F = 4.178, p < 0.05), and gaze time percentage (F = 5.506, p < 0.05). Therefore, the layout of interface elements has a significant impact on eye-tracking metrics.

5.2.3. Weighted Normalized Data

Firstly, in order to eliminate the dimension and positive and negative attribute differences of each criterion, the data in Table 1 and Table 2 undergo a pre-standardization process. Secondly, the weights for each aesthetic evaluation criteria are calculated, with the outcomes present in Table 3.

5.3. Results and Analysis
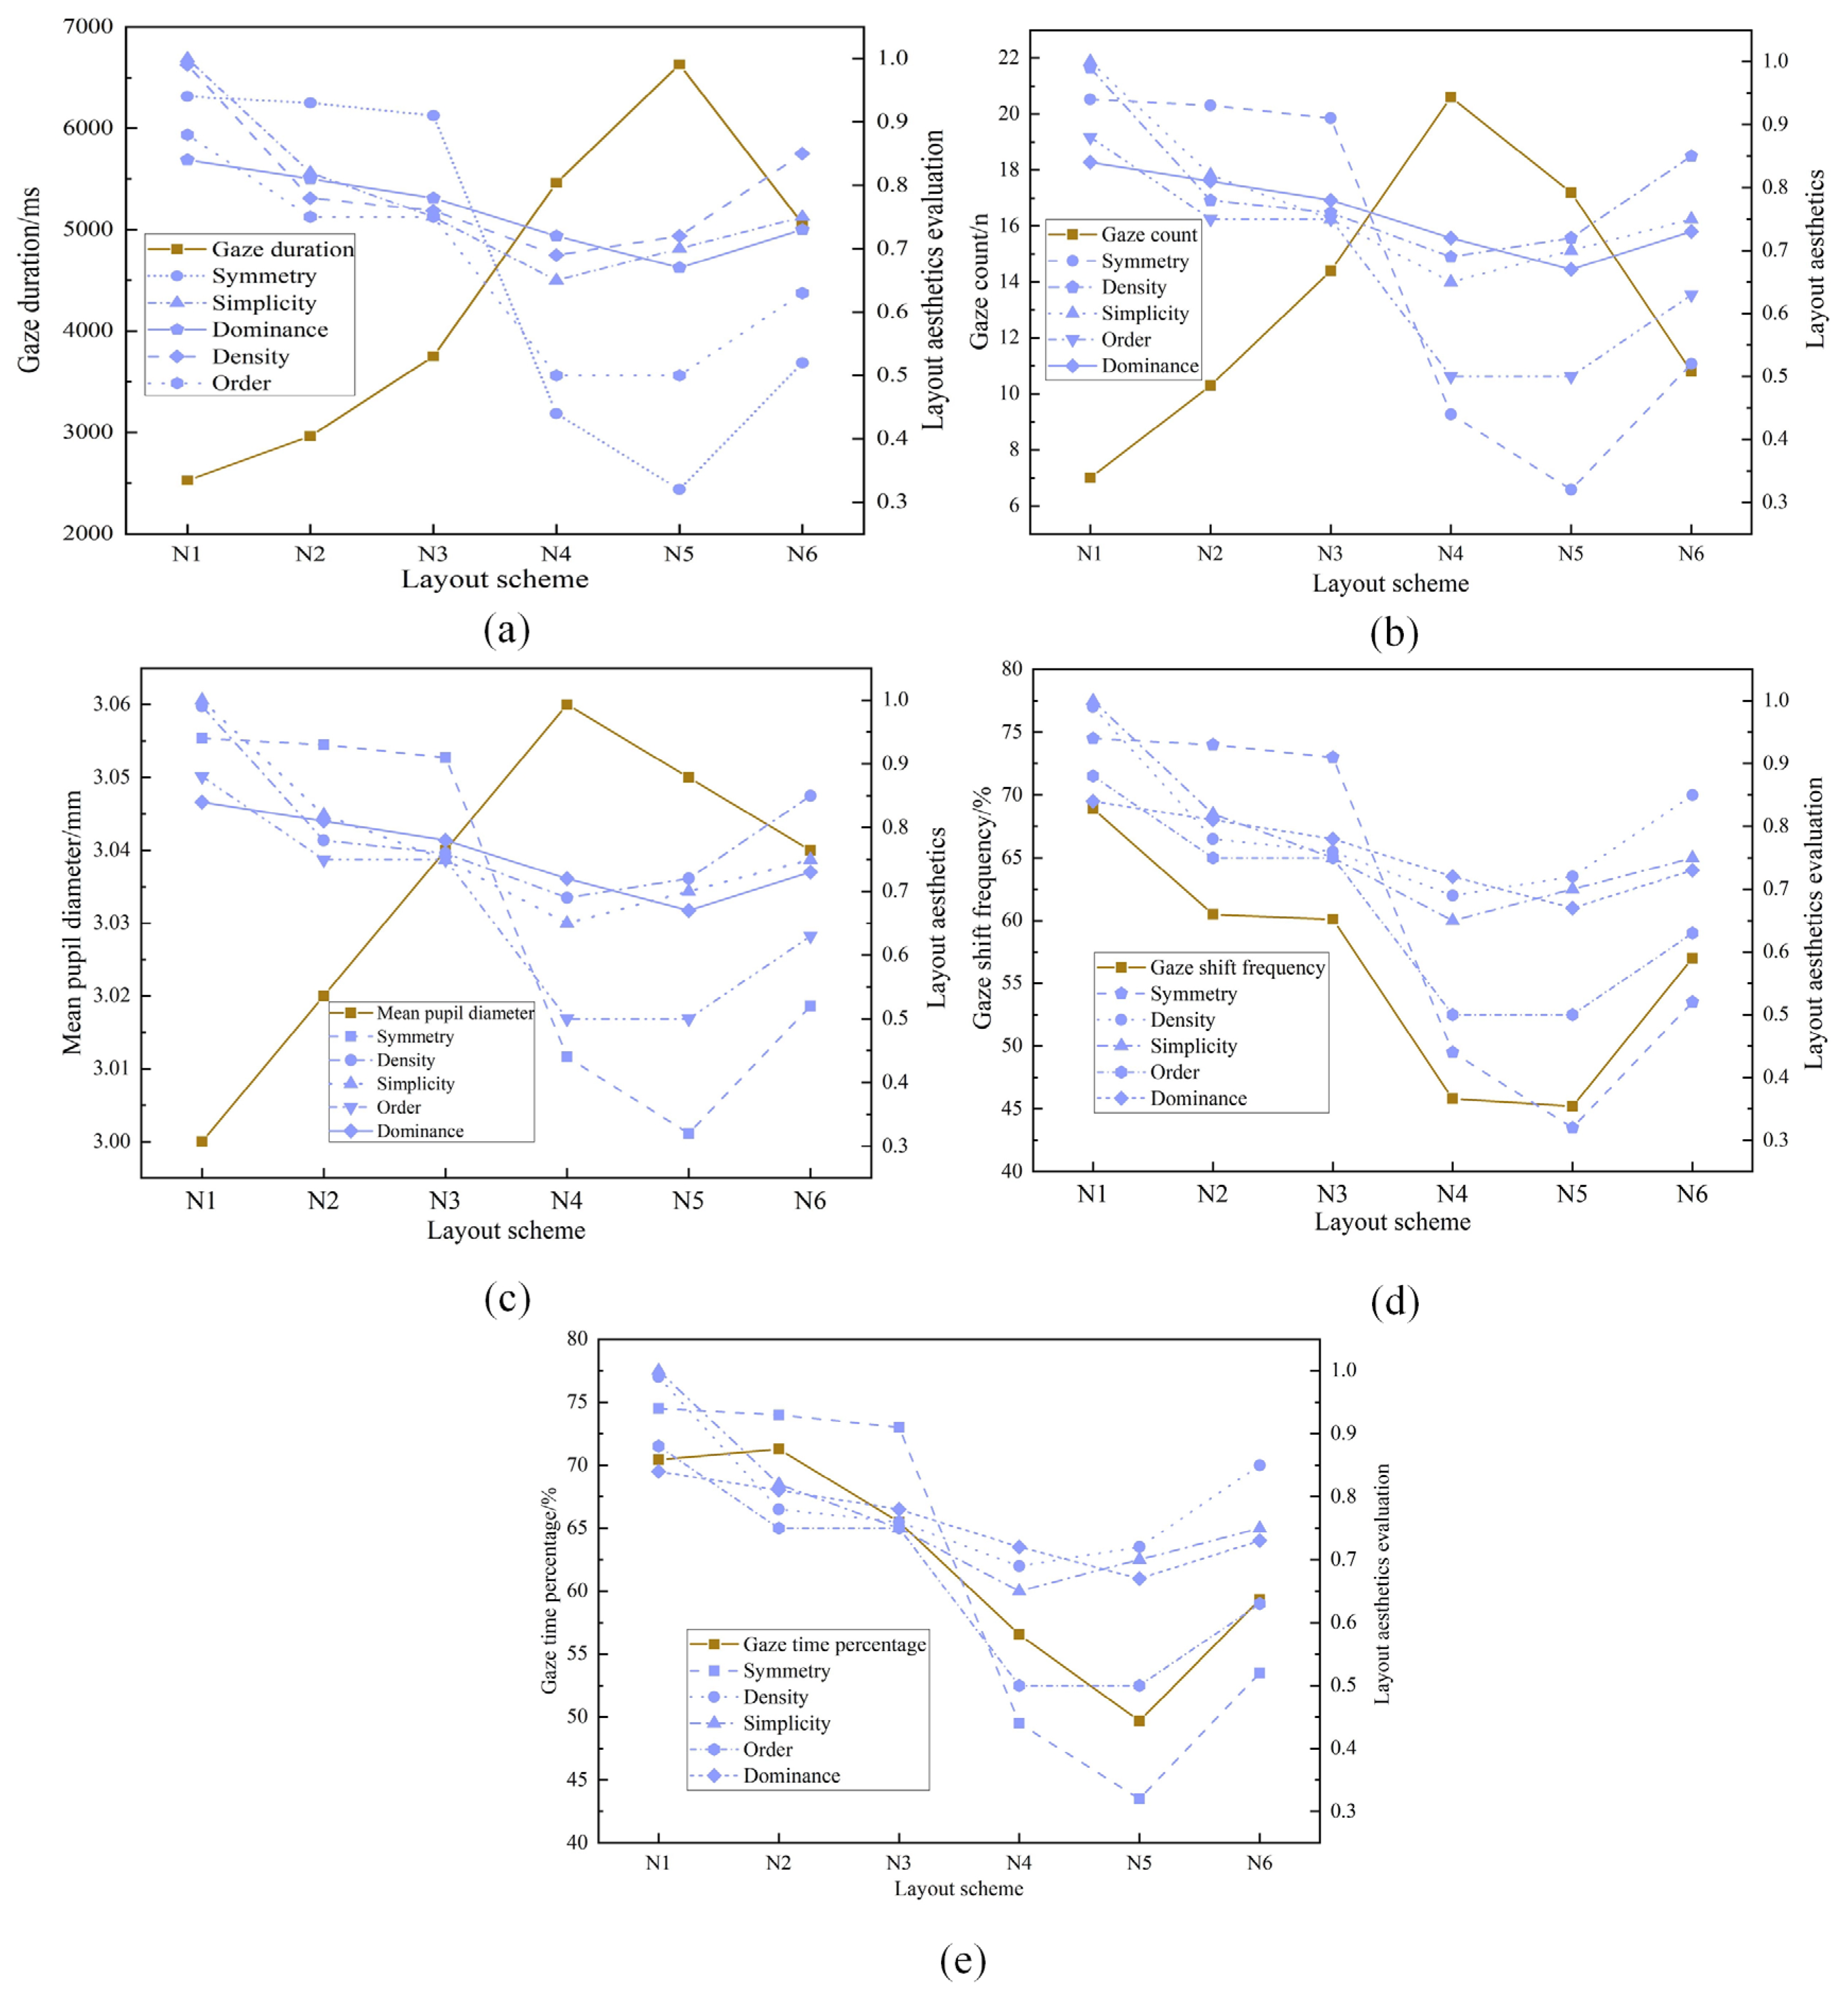
To calculate the correlation coefficients between visual cognitive features and layout aesthetics, a sequence of system characteristic behaviors in terms of fixation duration C e 1 , fixation count C e 2 , mean pupil diameter C e 3 , gaze shift frequency C e 4 and gaze time percentage C e 5 for the six interface scenarios, denoted by Y = ( Y 1 , Y 2 , Y 3 , Y 4 , Y 5 ) is analyzed, with symmetry C a 1 , density C a 2 , simplicity C a 3 , order C a 4 and dominance C a 5 as comparison sequences, denoted by X = ( X 1 , X 2 , X 3 , X 4 , X 5 ) . The calculation results are shown in Table 4.
(1)
Correlations between fixation duration and layout aesthetics
As shown in Table 5, the correlation between fixation duration and layout aesthetics is ranked R ^ H ( 1 , 5 )   > R ^ H ( 1 , 1 )   > R ^ H ( 1 , 3 )   > R ^ H ( 1 , 2 )   > R ^ H ( 1 , 4 ) , and all were negatively correlated. It can be seen that C a 5 and C a 1 are the main influence criteria and C a 3 , C a 2 , and C a 4 are the secondary criteria. That is, dominance, symmetry, and fixation duration were more highly correlated, simplicity was second, and density and order were less so. Dominance exerts the most significant impact on fixation duration, underscoring the presence of dominance in the presentation of interface information layout. Consequently, interface design should adhere to users’ visual patterns and prioritize the importance of information for differentiated layout of interface elements. This approach enhances readers’ reading efficiency and engagement. Moreover, symmetry in the interface layout should not be disregarded. Users prioritize the overall balance of information within the interface, seeking symmetry in the distribution of horizontal and vertical elements. Imbalanced layouts are liable to impact users’ visual experience and requirements adversely.
(2)
Correlations between the fixation count and layout aesthetics
The correlations were calculated as R ^ H ( 2 , 1 ) = −0.9300, R ^ H ( 2 , 2 ) = −0.5001, R ^ H ( 2 , 3 ) = −0.4819, R ^ H ( 2 , 4 ) = −0.4769, and R ^ H ( 2 , 5 ) = −0.9353. Sorting based on the magnitude of the correlation between the two sequences revealed R ^ H ( 2 , 5 )   > R ^ H ( 2 , 1 )   > R ^ H ( 2 , 2 )   > R ^ H ( 2 , 3 )   > R ^ H ( 2 , 4 ) . Indeed, symmetry and dominance exhibit a stronger correlation with fixation count, whereas simplicity, order, and density demonstrate comparatively lower correlations. This suggests that in interface design, the layout information should be harmonized and consistent, adhering to specific user line-of-sight guidance principles. Such an approach serves to mitigate visual load and enhance reading speed and overall user experience.
(3)
Correlations between mean pupil diameter and layout aesthetics
The correlations were calculated as R ^ H ( 3 , 1 ) = −0.7124, R ^ H ( 3 , 2 ) = −0.4937, R ^ H ( 3 , 3 ) = −0.5077, R ^ H ( 3 , 4 ) = −0.4586, and R ^ H ( 3 , 5 ) = −0.4997. Sorting based on the magnitude of the correlation between the two sequences revealed R ^ H ( 3 , 1 )   > R ^ H ( 3 , 3 )   > R ^ H ( 3 , 5 )   > R ^ H ( 3 , 2 )   > R ^ H ( 3 , 4 ) . Indeed, symmetry and simplicity exhibit the strongest correlation with mean pupil diameter, with dominance following closely behind, while density and order demonstrate relatively lower correlations. The notable correlation between simplicity and mean pupil diameter suggests that greater alignment and integration of layout information contribute to a more transparent and comprehensible interface. This in turn aids in reducing visual load and information search time, thereby enhancing overall user experience.
(4)
Correlations between gaze shift frequency and layout aesthetics
The correlations were calculated as R ^ H ( 4 , 1 ) = 0.9720, R ^ H ( 4 , 2 ) = 0.9382, R ^ H ( 4 , 3 ) = 0.4504, R ^ H ( 4 , 4 ) = 0.9808, and R ^ H ( 4 , 5 ) = 0.4779. Sorting based on the magnitude of the correlation between the two sequences revealed R ^ H ( 4 , 4 )   > R ^ H ( 4 , 1 )   > R ^ H ( 4 , 2 )   > R ^ H ( 4 , 5 )   > R ^ H ( 4 , 3 ) . Correlations among order, symmetry, density, and frequency of gaze shifts are notably strong, whereas dominance, simplicity, and gaze shift frequency exhibit relatively low correlations. The interface layout adheres to optimal visual principles and reading habits, effectively guiding the eye’s scanning pattern. Moreover, interface density significantly influences gaze shift frequency, necessitating designers to adhere to standardized design principles and judiciously regulate the spacing between interface elements.
(5)
Correlations between gaze time percentage and layout aesthetics
Correlations are obtained by calculating R ^ H ( 5 , 1 ) = 0.9155, R ^ H ( 5 , 2 ) = 0.4764, R ^ H ( 5 , 3 ) = 0.0178, R ^ H ( 5 , 4 ) = 0.4213, R ^ H ( 5 , 5 ) = 0.9710, all positive correlations. This is based on the size of the correlation ordering: R ^ H ( 5 , 5 )   > R ^ H ( 5 , 1 )   > R ^ H ( 5 , 2 )   > R ^ H ( 5 , 4 )   > R ^ H ( 5 , 3 ) . Indeed, the percentage of gaze time exhibits the strongest correlation with dominance and symmetry, followed by density and order, while demonstrating the weakest correlation with simplicity. These results are consistent with the trends identified in the analyses of fixation duration and mean pupil diameter discussed previously.

5.4. Model Testing and Comparison

5.4.1. Effect Comparison

To assess the efficacy of the gray H-convex correlation model utilizing the ICRITIC method, identical data preprocessing techniques were employed. The gray correlation [30], novel gray absolute correlation [33], and gray H-convex correlation [13] were chosen for comparative analysis with the approach outlined in this study. The statistical outcomes are delineated in Table 5. Owing to constraints in space, only the correlation findings between fixation duration and layout aesthetics are provided.
In Table 5, the results from the three models, aside from the gray correlation model, generally demonstrate a consistent pattern, highlighting the strongest correlation between gaze duration and symmetry and dominance. This substantiates the effectiveness of the model proposed in this paper. However, there are notable discrepancies, as follows.
  • The gray correlation model yields positive results even in cases of negative correlation between indicators, failing to align with the actual scenario, which is highly consistent with the findings of Zhou et al. [48].
  • The new gray absolute correlation model lacks stability in accurately reflecting positive and negative correlations among indicators, exemplified by a correlation coefficient of 0.0489 between fixation duration and order, still indicating a positive correlation. This conclusion corroborates the findings of Zhou et al. [48], demonstrating that the model lacks the capability to determine negative correlations between variables.
  • The original gray H-convex correlation model indicates that the highest negative correlation between fixation duration and dominance was 0.8546, followed by symmetry at 0.7016. This is consistent with the ranking outcomes of the enhanced gray H-convex correlation model.
  • In the improved model, the correlation between fixation duration and simplicity surpasses that of density, contrary to the results of the original gray H-convex correlation model. This discrepancy may stem from the improved model’s integration of differential indicator characteristics and their impact on the system, thereby influencing the final outcome.
Additionally, by employing the interface layout scheme as the X-axis, a line graph is constructed to illustrate the fluctuations in user visual cognitive attributes and layout aesthetics. As depicted in Figure 11, it is discernible that the line pattern of fixation duration closely resembles that of symmetry and dominance, exhibiting an inverse correlation. The fixation count aligns more closely with the folded graph shape of symmetry and dominance, also showcasing an inverse relationship, similar to the findings of other scholars [49]. Meanwhile, the mean pupil diameter bears the closest resemblance to the shape of symmetry and simplicity, demonstrating an inverse correlation. Conversely, gaze shift frequency exhibits the closest association with order and symmetry, indicating a positive correlation. Likewise, gaze time percentage closely corresponds to symmetry and dominance, with a positive correlation. Yang et al. [50] found that gaze time percentage also affects pupil diameter. In summary, the line graphs depict outcomes congruent with the model calculations. Consequently, the enhanced model proves to be feasible and possesses considerable application value.

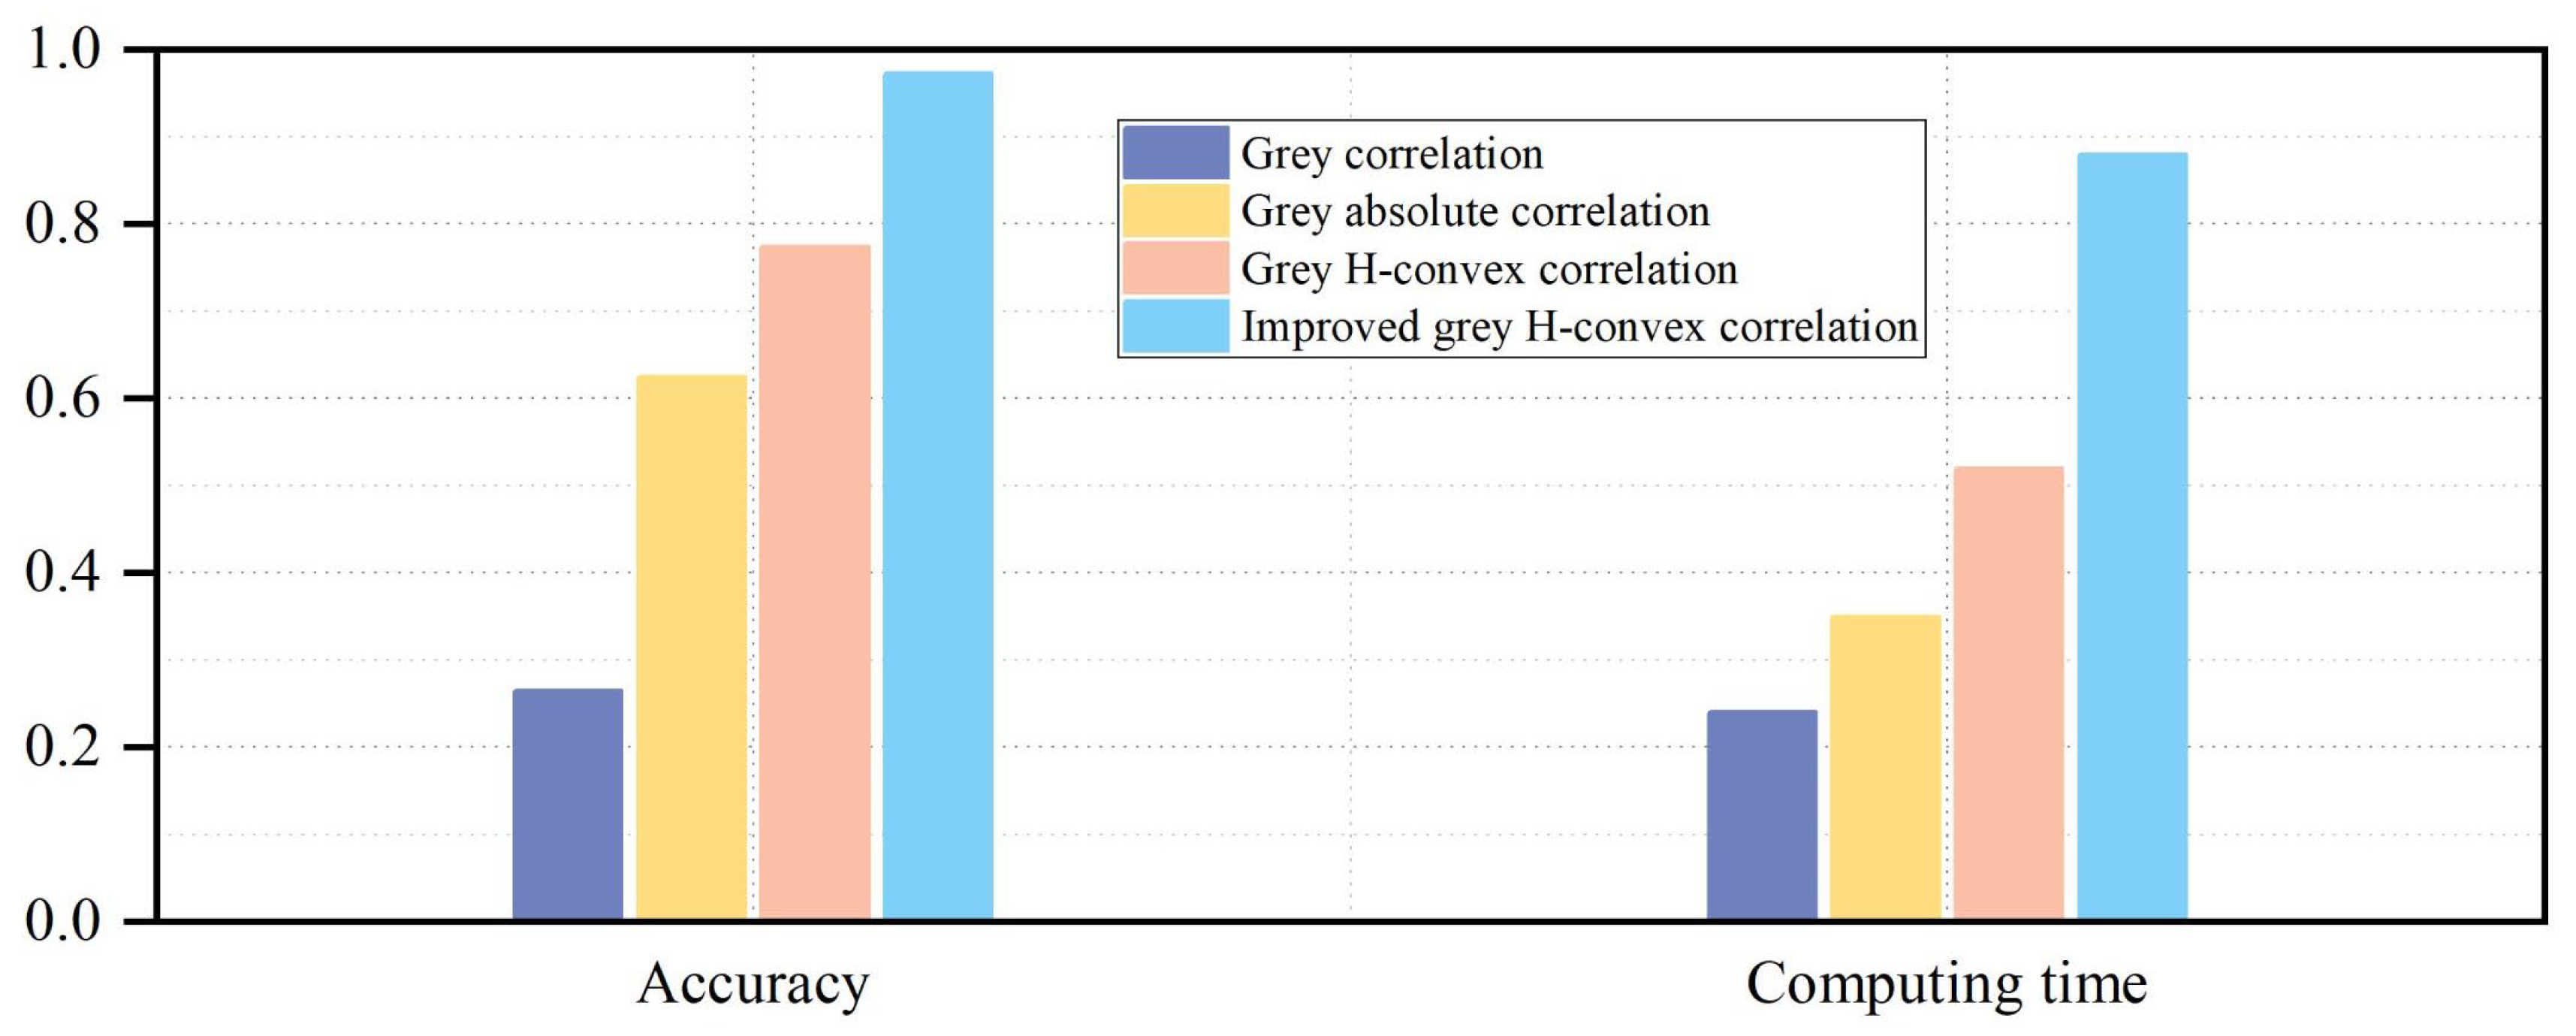
5.4.2. Performance Comparison

To further ascertain the efficacy of the model, identical test samples were utilized to compare the accuracy and computational efficiency of four models. In Figure 12, it is evident that the enhanced gray H-convex correlation method exhibits superior accuracy compared to the other three methods, achieving an accuracy rate exceeding 90%. However, owing to its intricate calculation steps, the running time was slightly prolonged, surpassing 0.8 min. Conversely, the other three methods feature straightforward calculation procedures, completing within a model time of less than 0.5 min.

6. Conclusions

The research aimed to propose an evaluation method for public service interfaces to enhance users’ engagement with the interface and the efficiency of acquiring interface information. This endeavor seeks to contribute to the establishment of a sustainable digital cultural social service system, fostering cultural dissemination and preservation, and facilitating sustainable cultural development. Through an analysis of users’ aesthetic preferences and cognitive principles, a mapping model between the two is formulated and utilized to calculate their correlation, thereby furnishing theoretical and methodological guidance for designers and enterprises engaged in interface design. Addressing the limitations of the original gray H-convex correlation model, which overlooks the issue of indicator weighting, this study presents an improved model, leveraging the ICRITIC method for the first time. It is demonstrated that the enhanced model offers superior accuracy and performance compared to other gray models. Consequently, this research entails both theoretical and practical innovations. The key findings of the study are outlined as follows.
(1)
This paper employs the enhanced gray H-convex correlation model, enabling precise identification of positive and negative correlations between interface layout aesthetics and visual cognition. The findings demonstrate that the accuracy of the enhanced model exceeds 90%. Nevertheless, the computational complexity of the model leads to a moderate increase in running time. Efforts will be directed towards addressing this limitation through further optimization in future endeavors.
(2)
A notable correlation exists between interface layout aesthetics and user visual cognition. Specifically, the correlations between fixation duration and fixation count are the most pronounced (0.9831 and 0.9353, respectively), which is highly consistent with the findings of Li et al. [51]. However, this study differs by explicitly calculating the degree of their correlation. Moreover, the correlation between mean pupil diameter and symmetry exhibits the highest value (0.7124), which is consistent with the findings of Wei et al. [52]. Simultaneously, we found that the correlation between gaze shift frequency and order is notably strong (0.9808), while the correlation between fixation time percentage and dominance is the highest (0.9710). The inverse relationship between fixation duration, fixation count, and mean pupil diameter with interface layout aesthetics is consistent with the findings of Munsters et al. [53]. Notably, this study found that gaze shift frequency and gaze time percentage are positively correlated with interface layout aesthetics. These findings underscore the importance for designers to prioritize factors such as dominance, symmetry, and order of interface layout in designing interfaces for infrequently accessed public services like virtual museums. Furthermore, attention should be directed towards understanding user cognitive and physiological tendencies, as well as aesthetic inclinations, to enhance user experience and interaction efficiency.
(3)
Nevertheless, the evaluation samples utilized in this paper exclusively encompass 2D static layout interfaces, thereby overlooking the undeniable influence of dynamic interface layout designs on user visual cognition. In forthcoming research, we intend to incorporate immersive 3D dynamic interactive interfaces as samples to undertake a comparative study of the impact of dynamic versus static interfaces on user aesthetics and cognition. Moreover, while this study predominantly centers on interface layout, it is imperative to acknowledge that interface color schemes, icons, and interaction frameworks, as well as user emotions and personalities, constitute pivotal factors influencing interface design. Consequently, future endeavors will be directed towards addressing these overlooked limitations, thereby contributing to a more comprehensive understanding of interface design considerations.

Author Contributions

Conceptualization, W.W.; Methodology, Z.W. and J.C.; Software, W.W. and Z.W.; Validation, W.W. and Z.W.; Formal analysis, W.W., Z.W. and Q.P.; Investigation, Z.W. and Q.P.; Resources, Z.W.; Data curation, Z.W., J.C. and Q.P.; Supervision, Y.G.; Project administration, J.C. and Y.G. All authors have read and agreed to the published version of the manuscript.

Funding

The present work is supported by the Innovation Capability Support Program of Shaanxi (2023-CX-PT-37); Shaanxi Provincial Natural Science Basic Research Program Project (2023-JC-QN-0524); Key R&D plan program of Shaanxi (Program No.2022ZDLGY06-05).

Institutional Review Board Statement

Not applicable.

Informed Consent Statement

Informed consent was obtained from all subjects involved in the study.

Data Availability Statement

The data are not publicly available due to ongoing research, and the authors will continue to work with these in the future.

Acknowledgments

The authors are thankful for the anonymous referee’s constructive comments.

Conflicts of Interest

The authors declare no conflicts of interest.

References

  1. Wen, J.Y.; Shu, T.L. Creative economy and sustainable development: Shaping flexible cultural governance model for creativity. Sustainability 2023, 15, 4353. [Google Scholar] [CrossRef]
  2. Chai, C.; Zhang, X.; Chai, Q.; Yin, Y.; Li, W.; Shi, J.; Fan, H.; Liu, X.; Zhang, D.; Zou, N. Immersive 2D versus 3D: How does the form of virtual reality inspirational stimuli affect conceptual design? Des. J. 2023, 26, 856–877. [Google Scholar] [CrossRef]
  3. Deng, Y.; Zhang, X.; Zhang, B.; Zhang, B.; Qin, J. From digital museuming to on-site visiting: The mediation of cultural identity and perceived value. Front. Psychol. 2023, 14, 1111917. [Google Scholar] [CrossRef] [PubMed]
  4. Yu, N.; Lv, Y.; Liu, X.; Jiang, S.; Xie, H.; Zhang, X.; Xu, K. Impact of Correlated Color Temperature on Visitors’ Perception and Preference in Virtual Reality Museum Exhibitions. Int. J. Environ. Res. Public Health 2023, 20, 2811. [Google Scholar] [CrossRef] [PubMed]
  5. Çevik, A.; Kazanasmaz, Z.T.; Tambellini, G.; Salvadori, G.; Leccese, F. Perception of Light in Museum Environments: Comparison between Real-Life and Virtual Visual Experiences. Sustainability 2022, 14, 14288. [Google Scholar] [CrossRef]
  6. Jeon, S.; Kim, M.S. Noise-Robust Multimodal Audio-Visual Speech Recognition System for Speech-Based Interaction Applications. Sensors 2022, 22, 7738. [Google Scholar] [CrossRef] [PubMed]
  7. Suarez, S.; Puyol, R.; Schafer, C.; Mucklich, F. HapticSOUND: An Interactive Learning Experience with a Digital Musical Instrument. Appl. Sci. 2023, 13, 7149. [Google Scholar] [CrossRef]
  8. Hulusic, V.; Gusia, L.; Luci, N.; Smith, M. Tangible User Interfaces for Enhancing User Experience of Virtual Reality Cultural Heritage Applications for Utilization in Educational Environment. J. Comput. Cult. Herit. 2023, 16, 3593429. [Google Scholar] [CrossRef]
  9. Kim, K.; Kwon, O.; Yu, J. Evaluation of an HMD-Based Multisensory Virtual Museum Experience for Enhancing Sense of Presence. IEEE Access 2023, 11, 100295–100308. [Google Scholar] [CrossRef]
  10. Partarakis, N.; Zabulis, X. A review of immersive technologies, knowledge representation, and AI for human-centered digital experiences. Electronics 2024, 13, 269. [Google Scholar] [CrossRef]
  11. Nunes, V.; Cappelli, C.; De Moraes, R.M.; Oliveira, R.; Da Silva, J.L.C. Method for Evaluating the Use of Plain Language in Interfaces of Public Service Portals. In Proceedings of the 24th Annual International Conference on Digital Government Research (DGO’23), Gdańsk, Poland, 11–14 July 2023; Volume 7, pp. 233–243. [Google Scholar] [CrossRef]
  12. Leopardi, A.; Ceccacci, S.; Mengoni, M.; Naspetti, S.; Gambelli, D.; Ozturk, E.; Zanoli, R. X-reality technologies for museums: A comparative evaluation based on presence and visitors experience through user studies. J. Cult. Herit. 2020, 47, 188–198. [Google Scholar] [CrossRef]
  13. Wolfgang, H.; Tan, X.J.; de Coninck, F. Using Digital Extensions to Create New VR Museum Experiences. In Proceedings of the 13th International Conference on Advances in Computer Entertainment Technology, Osaka, Japan, 9–12 November 2016; pp. 1–6. [Google Scholar]
  14. Marty, P.F. Museum websites and museum visitors: Digital museum resources and their use. Mus. Manag. Curatorship 2008, 23, 81–99. [Google Scholar] [CrossRef]
  15. Tanriverdi, V.; Jacob, R.J.K. VRID: A design model and methodology for developing virtual reality interfaces. In Proceedings of the ACM Symposium on Virtual Reality Software and Technology, Baniff, AB, Canada, 15–17 November 2001. [Google Scholar]
  16. Frojdman, S. User Experience Guidelines for Deisgn of Virtual Reality Graphical User Interfaces. Ph.D. Thesis, University of Skovde, Skövde, Sweden, 2016. [Google Scholar]
  17. Nadia, Z.; Pasaribu, Y.; Djati, I. Expectations and Ideal VRUI from User’s Perspective, Case Studies: VR Interface in ITB Electric Car’s (Molina) Virttual Exhibition. J. Comput. 2018, 13, 721–732. [Google Scholar] [CrossRef]
  18. Pan, P.G.; Chen, Y.M.; Xie, H.Y. Study on grey H-convex correlation degree model. Stat. Decis. 2016, 9, 31–34. [Google Scholar] [CrossRef]
  19. Xu, L.; Chen, J.; Wang, Q. Application of color entropy to image quality assessment. J. Image Graph. 2015, 20, 1583–1592. [Google Scholar]
  20. Dong, T.Y.; Yang, L.J.; Zhang, X.P. 3D image experience quality evaluation method for users multi-dimensional perception. J. Image Graph. 2019, 24, 0782–0793. [Google Scholar]
  21. Horbinski, T.; Cybulski, P.; Medynska, G. Graphic design and button placement for Mobile map applications. Cartogr. J. 2020, 57, 196–208. [Google Scholar] [CrossRef]
  22. Lazard, A.; King, A. Objective design to subjective evaluations: Connecting visual complexity to aesthetic and usability assessments of ehealth. Int. J. Hum.-Comput. Interact. 2020, 36, 95–104. [Google Scholar] [CrossRef]
  23. Dianat, I.; Adeli, P.; Jafarabadi, M.A.; Karimi, M.A. User-centred web design, usability and user satisfaction: The case of online banking websites in Iran. Appl. Ergon. 2019, 81, 102892. [Google Scholar] [CrossRef]
  24. Pengnate, S.; Sarathy, R.; Kyulee, J. The engagement of website initial aesthetic impressions: An experimental investigation. Int. J. Hum.-Comput. Interact. 2018, 35, 1517–1531. [Google Scholar] [CrossRef]
  25. Birkhoff, G.D. Aesthetic Measure; Harvard University Press: Cambridge, MA, USA, 1933. [Google Scholar]
  26. Ngo, D.C.L.; Lian, S.T.; Byrne, J.G. Modelling interface aesthetics. Inf. Sci. 2003, 152, 25–46. [Google Scholar] [CrossRef]
  27. Zhou, A.M.; Su, J.N.; Yan, S.T.; Ouyang, J.Y.; Shi, C.; Yuwang, B.Y. Nonlinear information dynamics model of synthetic evaluation on product form aesthetic. J. Mech. Eng. 2018, 54, 150–159. [Google Scholar] [CrossRef]
  28. Theeuwes, J. Self-explaining roads: What does visual cognition tell us about designing safer roads? Cogn. Res. Princ. Implic. 2021, 6, 15. [Google Scholar] [CrossRef] [PubMed]
  29. Zhu, Y.; Li, Y.; Lin, Y.; Chen, M.; Guo, Q.; Zhang, Z. Research on the influence of user and graphic-Text combined Icon construal level fitting on visual cognition. Appl. Sci. 2022, 7, 10111. [Google Scholar] [CrossRef]
  30. Montazem, A.R. The impact of experience on the design of user interface. Man-Mach. Stud. 1991, 34, 731–749. [Google Scholar] [CrossRef]
  31. Zhi, J.Y.; Du, Y.; Feng, S. Review on the graphic design and perceptual characteristics of automobile system interface. Packag. Eng. 2020, 41, 62–70. [Google Scholar]
  32. Salman, Y.B.; Cheng, H.I.; Patterson, P.E. Icon and user interface design for emergency medical information systems: A case study. Int. J. Med. Inform. 2012, 81, 29–35. [Google Scholar] [CrossRef] [PubMed]
  33. Martinez-Marquez, D.; Pingali, S.; Panuwatwanich, K.; Stewart, R.A.; Mohamed, S. Application of Eye Tracking Technology in Aviation, Maritime, and Construction Industries: A Systematic Review. Sensors 2021, 21, 4289. [Google Scholar] [CrossRef]
  34. Deng, J.L. Figure on difference information space in grey relational analysis source. J. Grey Syst. 2004, 16, 96–100. [Google Scholar]
  35. Deng, J.L. The Elements of Grey System; Press of Huazhong University of Science and Technology: Wuhan, China, 2002; pp. 63–170. [Google Scholar]
  36. Zhang, Q.S.; Guo, X.J.; Deng, J.L. Grey relation entropy method of grey relation analysis. Syst. Eng.-Theory Pract. 1996, 16, 7–11. [Google Scholar]
  37. Wang, Q.Y. The grey relational analysis of B-Mode. J. Huazhong Univ. Sci. Technol. 1989, 16, 77–82. [Google Scholar]
  38. Liu, Y.; Liu, F.; Forrest, J. A new grey absolute degree of grey incidence model and application. Chin. J. Manag. Sci. 2012, 20, 173–177. [Google Scholar]
  39. Wang, J.H.; Wang, L.; Zhang, L.; Cui, L.J. Supplier selection vikor Multi-attribute decision making of grey group clustering and improved critic weighting. Syst. Eng. Electron. 2023, 45, 155–164. [Google Scholar]
  40. Krishnan, A.R.; Kasim, M.M.; Hamid, R.; Ghazali, M.F. A modified critic method to estimate the objective weights of decision criteria. Symmetry 2021, 13, 973. [Google Scholar] [CrossRef]
  41. Fan, W.L.; Hu, P.; Liu, Z.G. A multi-attribute node importance evaluation method based on Gni-cofficient in complex power grids. IET Gener. Transm. Distrib. 2016, 10, 2027–2034. [Google Scholar]
  42. d’Anjou, P. The impalpable omnipresence of the ethical demand in design. Adv. Des. Res. 2023, 1, 1–6. [Google Scholar] [CrossRef]
  43. Wang, L. A Study of the Effect of Website Symmetry and Complexity on User’s Recognition Load Based one Eye Tracking Technology. Master’s Thesis, Zhejiang University, Hangzhou, China, 2017. [Google Scholar]
  44. Nandini, M.; Jaiteg, S. Understanding Online Consumer Behavior at E-commerce Portals Using Eye-Gaze Tracking. Int. J. Hum.-Comput. Interact. 2023, 39, 721–742. [Google Scholar]
  45. Wu, X.; Gedeon, T.; Xue, C.; Zhang, W.; Wang, L. Comparison of the congruent effects on Fixation/Saccade and pupil dilation influencing information feature searching. J. Comput.-Aided Des. Comput. Graph. 2019, 31, 1636–1644. [Google Scholar]
  46. Lounis, C.; Peysakhovich, V. Causse M Visual scanning strategies in the cockpit are modulated by pilots’ expertise: A flight simulator study. Plosone 2021, 16, e0247061. [Google Scholar] [CrossRef]
  47. Wang, L.; Yu, S.H.; Chu, J.J. Position design of in-car information display based on eye movement analysis. J. Zhejiang Univ. (Eng. Sci.) 2020, 54, 671–693. [Google Scholar]
  48. Zhou, W.H.; Zeng, B. A research review of grey relational degree model. Stat. Decis. 2020, 36, 29–34. [Google Scholar]
  49. Jiang, J.-Y.; Guo, F.; Chen, J.-H.; Tian, X.-H.; Lv, W. Applying Eye-Tracking Technology to Measure Interactive Experience Toward the Navigation Interface of Mobile Games Considering Different Visual Attention Mechanisms. Appl. Sci. 2019, 9, 3242. [Google Scholar] [CrossRef]
  50. Yang, Y.; Chen, F. Research on the characteristics of driver visual behavior in highway extra-long tunnel. IOP Conf. Ser. Earth Env. Sci. 2019, 295, 042139. [Google Scholar] [CrossRef]
  51. Li, G.; Wang, L.; Hu, J. Integration with Visual Perception—Research on the Usability of a Data Visualization Interface Layout in Zero-Carbon Parks Based on Eye-Tracking Technology. Sustainability 2023, 15, 11102. [Google Scholar] [CrossRef]
  52. Wei, S.; Zheng, R.; Li, R.; Shi, M.; Zhang, J. Measuring cognitive load of digital interface combining event-related potential and BubbleView. Brain Inform. 2023, 10, 8. [Google Scholar] [CrossRef] [PubMed]
  53. Munsters, N.M.; Boomen, C.v.D.; Hooge, I.T.C.; Kemner, C. The Role of Global and Local Visual Information during Gaze-Cued Orienting of Attention. PLoS ONE 2016, 11, e0160405. [Google Scholar] [CrossRef]
Figure 1. Overall research framework.
Applsci 14 07006 g001
Figure 2. Evaluation criteria system of interface layout.
Applsci 14 07006 g002
Figure 4. Layout element representation and localization.
Applsci 14 07006 g004
Figure 5. Folding lines for different spans and arch heights.
Applsci 14 07006 g005
Figure 7. Virtual museum interface samples. A–F show real cases representing six different interface layouts.
Applsci 14 07006 g007
Figure 8. Abstracted virtual museum interface samples. A′–F′ represent the smallest rectangles that can be accommodated by the interface elements in Figure 7A–F, respectively.
Applsci 14 07006 g008
Figure 9. A″–F″ represent sample interfaces with transparent abstract rectangles, respectively. Interface samples with transparent abstract rectangles. Combine the real interface from Figure 7 with the abstract rectangular interface from Figure 8 and reduce the transparency to facilitate participants’ connection with the real interface.
Applsci 14 07006 g009
Figure 10. Experimental process and tasks. First, the interface with transparent abstract rectangles is displayed, followed by the corresponding real interface, until all six layout interfaces have been shown. When the real interface is presented, participants are required to complete an icon search task, which involves quickly finding and accurately clicking on the navigation map icon. Once the icon is clicked, the screen will automatically switch to the next image. The maximum presentation time for the real interface is 9000 ms.
Applsci 14 07006 g010
Figure 11. Visual cognitive vs. layout aesthetics change trend line chart. (a) Gaze duration and layout aesthetics; (b) gaze count and layout aesthetics; (c) average pupil diameter and layout aesthetics; (d) gaze shift frequency and layout aesthetics; (e) gaze time percentage and layout aesthetics.
Applsci 14 07006 g011
Figure 12. Comparison of model accuracy and computing time: gray correlation, gray absolute correlation, and gray H-convex correlation.
Applsci 14 07006 g012
Table 1. Aesthetic evaluation data. Calculated from the aesthetic measures of the interface layout in Figure 8 (in terms of symmetry, density, simplicity, order, and dominance).
Samples C a 1 C a 2 C a 3 C a 4 C a 4
  A 0.940.991.000.880.84
  B 0.930.780.820.750.81
  C 0.910.760.750.750.78
  D 0.440.690.650.500.72
  E 0.320.720.700.500.67
  F 0.520.850.750.630.73
Table 2. Experimental measurement data. Figure 7 was used as the experimental stimulus image to obtain the subjects’ visual cognitive results (in terms of fixation duration, fixation count, mean pupil diameter, gaze shift frequency, and gaze time percentage).
Samples C e 1 C e 2 C e 3 C e 4 C e 5
A25277.003.0068.970.43
B296310.303.0260.571.27
C375114.403.0460.165.48
D546020.603.0645.856.55
E662817.203.0545.249.69
F506210.803.0457.059.33
F-value3.5269.50620.0894.1785.506
p-value0.0350.0010.0220.0120.043
Table 3. Weighting of the aesthetic criteria.
Criteria C a 1 C a 2 C a 3 C a 4 C a 5
Weight0.380.150.100.270.11
Table 4. The correlation between visual cognitive and layout aesthetics. X represents the set of aesthetic measure sequences, and Y represents the set of eye movement measure sequences.
X 1 X 2 X 3 X 4 X 5
Y 1 −0.9394−0.4928−0.4976−0.4617−0.9831
Y 2 −0.9300−0.5001−0.4819−0.4769−0.9353
Y 3 −0.7124−0.4937−0.50770.4586−0.4997
Y 4 0.97200.93820.45040.98080.4779
Y 5 0.91550.47640.01780.42130.9710
Table 5. Comparison of results from different models, taking the calculation of the correlation between fixation duration and interface layout aesthetics as an example.
Model C e 1 - C a 1 C e 1 - C a 2 C e 1 - C a 3 C e 1 - C a 4 C e 1 - C a 5
Gray correlation0.69590.60580.38000.35420.4591
New gray absolute correlation−0.7511−0.3119−0.30480.0489−0.7379
Gray H-convex correlation−0.7016−0.4138−0.3599−0.2024−0.8546
Improved gray H-convex correlation−0.9394−0.4928−0.4976−0.4617−0.9831
Disclaimer/Publisher’s Note: The statements, opinions and data contained in all publications are solely those of the individual author(s) and contributor(s) and not of MDPI and/or the editor(s). MDPI and/or the editor(s) disclaim responsibility for any injury to people or property resulting from any ideas, methods, instructions or products referred to in the content.

