Abstract
Text matching promotes the research and application of deep understanding of text information, and it provides the basis for information retrieval, recommendation systems and natural language processing by exploring the similar structures in text data. Owning to the outstanding performance and automatically extract text features for the target, the methods based-pre-training models gradually become the mainstream. However, such models usually suffer from the disadvantages of slow retrieval speed and low running efficiency. On the other hand, previous text matching algorithms have mainly focused on horizontal domain research, and there are relatively few vertical domain algorithms for agricultural text, which need to be further investigated. To address this issue, a second-order text matching algorithm has been developed. This paper first obtains a large amount of text about typical agricultural crops and constructs a database by using web crawlers and querying relevant textbooks, etc. Then BM25 algorithm is used to generate a candidate set and BERT model is used to filter the optimal match based on the candidate set. Experiments have shown that the Precision@1 of this second-order algorithm can reach 88.34% on the dataset constructed in this paper, and the average time to match a piece of text is only 2.02 s. Compared with BERT model and BM25 algorithm, there is an increase of 8.81% and 13.73% in Precision@1 respectively. In terms of the average time required for matching a text, it is 55.2 s faster than BERT model and only 2 s slower than BM25 algorithm. It can improve the efficiency and accuracy of agricultural information retrieval, agricultural decision support, agricultural market analysis, etc., and promote the sustainable development of agriculture.
1. Introduction
Agriculture plays a crucial role in the global economy, providing diverse food sources and serving as the economic backbone for many countries [1]. Its importance goes beyond food security and economic development, directly affecting ecological balance, social stability and the global trading system. The sustainable and healthy development of agriculture is essential to ensure human survival, promote global economic prosperity and maintain the ecological balance of the planet.
In the current digital era, with the continuous emergence of large text data, there is a growing realisation that harnessing artificial intelligence and big data technologies [2] is necessary to empower agricultural production with science and data [3]. Faced with massive amounts of text data, people need to utilize databases to manage data [4] and text matching technology to quickly and accurately find the information needed to help people make decisions, improve the efficiency of agricultural production, management, scientific research, etc., better disseminate and share agricultural knowledge, and promote the application of agricultural technology.
Since its inception, text matching has been a central task in natural language processing, playing a crucial role in information retrieval, question-answering systems, natural language inference [5], and various other areas. In the early stages, from the early 1990s to the late 2000s, traditional rule-based and statistical methods dominated text matching. These included keyword matching, bag-of-words models and TF-IDF algorithm [6] and so on. While effective in certain scenarios, these methods had limited ability to understand semantics and context.
By 2010, statistical and machine learning methods were gaining ground. Some classification algorithms such as Support Vector Machines [7], Naive Bayes [8] and Decision Trees [9] were widely applied to text matching. Research in this era focused on feature engineering and model optimisation to improve matching accuracy. From the mid-2010s, with breakthroughs in deep learning, Neural Networks significantly advanced text matching. Models such as Convolutional Neural Networks [10], Recurrent Neural Networks [11] and attention mechanisms [12] improved the capture of semantic information and context, increasing the accuracy of text matching. Pre-trained language models such as BERT and GPT [13] brought new breakthroughs to text matching tasks. In recent years, multimodal matching and cross-language matching [14] have gained popularity, addressing tasks involving text, images and video, and facilitating global information exchange.
In the early days, agriculture relied on basic text retrieval systems to access information on agricultural research, market trends and policy. These systems typically used keyword matching, which limited retrieval to superficial information. In the early 1990s, with the advent of information technology, agriculture adopted specialised knowledge bases and decision support systems. These systems integrated and analysed large volumes of agricultural data using text matching technology to support agricultural decision-making, focusing on areas such as pest control, weather forecasting and crop management. In the 2010s, with the rise of Internet of Things (IoT) technology [15], text matching played a crucial role in smart agriculture. Agricultural IoT systems, using sensors and data collection technologies, combined real-time agricultural data with textual information to help farmers make decisions. Text matching was used to correlate disparate data sources, such as matching weather forecasts with agricultural advice. In recent years, agriculture has explored advanced text matching technologies, including Natural Language Processing (NLP) and knowledge graphs [16]. Building agricultural knowledge graphs enables systems to better understand and correlate textual information, providing users with more intelligent agricultural solutions. NLP technologies further enhance the understanding of agricultural text and context, improving the accuracy of agricultural decisions.
However, the integration of text matching technology in agriculture still faces a number of challenges. Most existing research focuses on improving accuracy, but ignores the efficiency problem of the relevant models. What’s more, the efficiency problem is a very important and cannot be ignored issue brought by deep learning [17]. On the other hand, text matching models based on deep learning tend to concentrate on information at a particular granularity, potentially giving less direct attention to details at other granularities. To a certain extent, this may impact the ability to fully capture all potentially useful information within the text.
In this paper, a second-order text matching (SOTM) algorithm is designed for agricultural text. The first phase is referred to as the recall phase. For the text to be matched, we first use BM25 algorithm to select a part of the constructed database as a candidate set. The second phase is referred to as the rearrangement phase. The candidate set is filtered using BERT model to select the text with the highest match. SOTM algorithm combines the fast retrieval speed of BM25 with the high retrieval accuracy of BERT model. The result is high quality results with a reduction in the cost of text matching. In summary, the primary contributions of this paper can be outlined as follows:
- SOTM algorithm combines the advantages of fast retrieval speed of BM25 algorithm and high retrieval accuracy of BERT model. It is not only significantly reduced runtime for deep learning models but also achieves breakthroughs in accuracy.
- BM25 algorithm is based on words, while BERT model used in this paper (BERT-Chinese) is based on characters. This multi-granularity information fusion has higher accuracy compared to single-granularity algorithms or models, demonstrating the effectiveness of multi-granularity information fusion.
- In the construction of the dataset, this paper utilizes several experimentally proven effective methods, enabling BERT model to acquire more fundamental and essential knowledge.
The rest of this paper is structured as follows. Section 2 describes the related work in text matching. Section 3 describes the related algorithm and model used in SOTM algorithm. Section 4 describes the overall composition of SOTM algorithm, with a description of the recall and rearrangement phases, respectively. Moreover, parameter selection and complexity analysis are also discussed in this section. Section 5 describes the experimental setup, optimal parameter determination, performance comparison analysis and summary. Section 6 summarises the paper. It shows the accuracy and efficiency of SOTM algorithm, indicates the application value of the algorithm, and puts forward the future research direction.
2. Related Work
Traditional vocabulary-based matching algorithms can address lexical matching issues, but these algorithms suffer from limited generalization and difficulty in task transfer due to the high cost of manually extracting features and a relatively small number of learnable parameters. With the rapid development of deep learning methods, recent research on text matching algorithms has primarily focused on deep learning approaches. Deep learning methods automatically extract features, eliminating the need for extensive manual feature design. Many pre-trained matching models based on deep learning exhibit strong task transferability [18]. Based on weak interaction short text matching models, these models often use Siamese network architectures with shared parameters to transform pairs of short texts into two independently represented vectors for simple interaction matching. In order to effectively utilize different granularities of local information in short texts, Yao et al. [19] utilized CNNs of different scales to obtain feature vectors of different granularities, merged them into a new vector, feed it into an improved LSTM model to obtain the document’s vector representation, and calculated similarity using cosine similarity. While solutions integrating sentence-level, word-level, and character-level multi-granularity information alleviate some mismatch issues between different clauses, they might still face challenges related to losing original semantic meanings of characters when combined with corresponding words, dependency on single-word segmentation results, and constraints imposed by the original word order structure. To address this, Lai et al. [20] employed a grid-based multi-layer CNN to extract sentence-level features of word grids and constructed a deep network model based on the Siamese architecture. This model did not rely on character or character-level sequences but treated each possible word and character equally, providing its own context for interaction at each layer. Similarly, to tackle the problem of potentially incorrect, ambiguous, or inconsistent Chinese word segmentation affecting the final matching performance, Chen et al. [21] constructed a word grid graph based on all possible segmentation results in a sentence, and obtained embeddings for graph vertices based on BERT model and attention mechanism. Finally, a two-stage neural graph interaction matching module was designed to obtain sentence-level vector representations. To enhance BERT’s text matching performance, Xia et al. [22] suggested that synonym replacement significantly improved the model’s performance, and an attention mechanism based on the Hadamard product was redesigned using WordNet. Experimental results showed continuous improvement in BERT’s text matching performance, particularly advantageous in handling sparse data.
To address the issue of existing text semantic matching models not giving sufficient attention to semantic information in text labels, Zhang et al. [23] first concatenated the input sentences, processed them through BERT to obtain global semantic representations by weighting and summing the hidden layers, employed varying-sized convolutional kernels for extensive local feature extraction, and ultimately merged the local and global feature vectors in the purpose-built relationship recognition module to accomplish the task. To handle the problem of Chinese short text being polysemous, lacking context information, and having inappropriate word segmentation granularity affecting semantic matching model performance, Lyu et al. [24] constructed a word grid graph using three segmentation results from Jieba, Pkuseg, and Thulac and combined BERT model and Hownet external knowledge base to process the matching text into word embedding and sense embedding vectors. These vectors undergowent iterative interaction to merge context and semantic information, and the resulting enhanced semantic knowledge of each sentence was fused into characters. A matching model was constructed using a two-hidden-layer feedforward network. To address the issue of lacking usable data after Chinese short text segmentation, Tang et al. [25] proposed a sentence matching model based on multi-granularity semantic embedding and multi-directional semantic interaction. Each sentence pair was represented as a multi-granularity embedding form based on attention mechanism character embedding and word embedding, which was then passed to LSTM to obtain respective feature vectors. These vectors were separately passed to two pooling network layers and an information interaction network layer constructed from a word vector similarity matrix, and the different granularity feature vectors were merged. Finally, a Bi-LSTM layer aggregated the two matching result sequences into a fixed-length matching vector, and a fully connected layer was used for vector-based classification prediction.
Although weak interaction short-text matching models have advantages such as concise expression, fast computation, and unsupervised pre-training, their matching is not merely one-to-one but hierarchical and structured. Extracting features separately from two objects makes it challenging to capture structural information in the matching. Additionally, facing multiple semantic contexts, it is difficult to differentiate the importance of localized information in different contexts and integrate layout information with global information effectively. On the other hand, strong interaction short text matching models do away with the approach of independently extracting features before matching and conduct interaction matching between granularities within short texts in the initial input stage, using the initial matching results for subsequent feature extraction and modeling.
To effectively extract local interaction information from pairs of short texts, Severyn et al. [26] performed convolution and max pooling operations on word vector embedding matrices of paired short texts to obtain semantic vectors. It calculated similarity using a similarity matrix and concatenated semantic vectors, similarity, and external feature vectors to create a comprehensive vector. A non-linear hidden layer was then used for matching modeling. Inspired by CNN’s effectiveness in extracting hierarchical structure information from images, Pang et al. [27] viewed text matching modeling as an image recognition problem and used hierarchical convolutional modeling to solve it. Similar to the two-dimensional matrix representation of images, it constructed a two-dimensional similarity matrix from paired short text word vectors and employed two layers of CNN for feature extraction before matching modeling. To effectively explore the interactive effects of paired texts in the task context, Yin et al. [28], building upon a non-interactive matching model based on CNN and Siamese network architecture, used the Euclidean distance between word feature vectors of paired texts to obtain word attention feature representations. These representations were added to sentence word feature vector representations and separately input into convolutional layers, pooling layers, and two other layers, constructing three semantic matching models. To address the lack of inter-feature representation between word vectors in attention-based matching models, Chen et al. [29] firstly used bidirectional LSTM to obtain word feature representations from paired texts’ hidden states at different time steps. It then constructed word attention mechanisms based on vector products and performed interactive calculations to obtain attention feature representations. Finally, it concatenated word feature representations, attention feature representations, and their differences and producted into a comprehensive sequence, passing them sequentially through Bi-LSTM layers, pooling layers, and multi-layer perceptron layers for matching modeling. To tackle the issue of existing matching models only matching from a single direction and granularity, Wang et al. [30] extracted character embeddings obtained from LSTM feature extraction and pre-trained word embeddings concatenated and passed through Bi-LSTM to obtain hidden state representations for each time step of paired texts. Then, it used four methods to match all time steps from both forward and backward directions. Finally, Bi-LSTM was used to aggregate matching vectors of the two sequences into a fixed-length matching vector for modeling.
In the agricultural domain, there has been a growing awareness of the importance of text matching work in recent years. Wang et al. [31] addressed many issues in the rice question and answer system, including the existence of many similar expressions with the same semantics, the sparsity of the problem text, real-time requirements, and non-standard problems. They proposed the Co-attention-Dense-GRU rice question classification model, consisting of text preprocessing, Dense-GRU layer, co-attention layer, and interactive classification layer. Experimental results demonstrated the model’s excellent accuracy. The precision and F1 values of the proposed model were 96.3% and 96.9%, respectively. Zhou et al. [32] tackled the identification difficulty of word boundaries and insufficient embedding of vocabulary information in crop pest and disease issues. They introduced AgrCQS model for similarity matching in Chinese agricultural disease and pest problems. Experimental verification showed that MM-CNN model and self-attention mechanism improved the classification performance of the model. In their research, the performance of the AgrCQS on the CCDIP is verified, and three benchmark datasets, namely, AFQMC, LCQMC, and BQ, are used. The accuracy rates are 93.92%, 74.42%, 86.3%, and 83.05%, respectively, which are higher than that of baseline systems without using any external knowledge. Liu et al. [33] addressed issues like segmentation errors and data sparsity in rice-related questions. They proposed a Siamese-based bidirectional BiLSTM-CNN rice question semantic matching model. The model utilized character-level Word2Vec for question representation, employed Siamese neural networks to learn semantic features, extracted semantic temporal features using BiLSTM-CNN, and calculated question similarity at the semantic level with a cosine function. The experimental results indicated that the BiLSTM-CNN model had effectively extracted features of various granularities from texts, enhancing the rice question similarity matching performance. On the dataset that was constructed, the accuracy and F1 score of the BiLSTM-CNN model surpassed those of other text matching models, achieving 98.2% and 88.75%, respectively. Jin et al. [34] focused on challenges in agricultural question and answer communities, such as limited vocabulary, numerous specialized terms, poor sentence standardization, and strong feature sparsity. They presented a text matching model integrating multiple semantic features. The model constructed a word co-occurrence relationship network in the text preprocessing layer, calculating weights for each word co-occurrence pair to enrich short-text features from various perspectives. The experimental results showed that the model could extract text features more comprehensively, with an accuracy of 94.15%. Wang et al. [35] addressed the issue of automatically and accurately discovering repetitive semantic questions in China’s agricultural technology dissemination question and answer community. They proposed an agricultural question similarity matching model based on BERT-Attention-Dense-Bi-GRU. The model, comprising text preprocessing, dense linked Bi-GRU, attention mechanism, and interactive classification layers, outperformed six other deep learning models in precision, recall, and F1 values. The precision and F1 values of the proposed model were 97.2% and 97.6%.
Although the aforementioned models have achieved significant success, there are still challenges and shortcomings in text matching algorithms specific to the agricultural domain. Real-time performance of the model is one of the crucial aspects. For example, semantic search systems in agriculture face significant challenges in providing real-time search performance. The complexity of queries and the need for contextual understanding of agricultural data often result in slower response times, impacting the effectiveness of real-time data retrieval and analysis [36]. Deep learning text matching models do bring high accuracy to the text matching task and are excellent in many scenarios. However, the overly large parameters make it require a lot of arithmetic support and slow retrieval speed, which limits its use in some scenarios. In this paper, due to the high efficiency of BM25 algorithm, the number of candidate sets is compressed to a very small set using BM25 algorithm, which greatly reduces the amount of work and the working time of BERT model, and thus improves the efficiency to a large extent.
3. Related Concepts and Algorithms
In order to implement SOTM algorithm, we need to use the traditional text similarity calculation method BM25, and BERT model based on deep learning. The algorithm and model are described in this section.
3.1. BM25 Algorithm
BM25 algorithm is the traditional method of text similarity calculation. It has been widely used in information retrieval, search engines and other fields because it is simple to implement with good effect. BM25 algorithm can calculate the similarity about all sentences. The formula for BM25 is shown by Equation (1). stands for word frequency. stands for inverse document frequency. Specifically, reflects the ubiquity of a term across the entire document collection. If a term appears in many documents, its value is relatively low, indicating a weaker discriminative power across the entire document set. Conversely, if a term appears in fewer documents, its value will be higher, indicating greater discriminative power and information value within the document collection. N denotes the number of documents in the index. denotes the similarity score between the query Q and the set of all documents D. denotes the number of documents and denotes the average length of all documents. Both and b are adjustable parameters. limits the value of relevance, usually taken as 2 and b adjusts the effect of document length, usually taken as 0.75. In the paper, takes the value of 2, and b takes the value of 0.75. BM25 algorithm is fast and the results are accurate, but it only takes into account the text’s similarity at the word level and does not include the semantic information of the words, which does not capture the semantic similarity of the sentences well.
where , , represents the segmentation of words in the query, denotes the number of documents containing the word . denotes the frequency of occurrence of the word i in the document j. denotes the number of occurrences of i in j and the denominator denotes the sum of all occurrences of the word in j.
3.2. BERT Model Architecture
BERT model is a pre-trained language representation model based on Transformer architecture. It consists of multiple layers of Transformer encoders, including a self-attention mechanism. A key innovation of BERT is the pre-training of the model with bidirectional context, allowing it to better understand the contextual relationships between words in a sentence. The basic architecture of BERT model includes the following key components. Input embeddings convert words in the input text into embeddings, typically using techniques like WordPiece. The transformer encoder consists of multiple layers, each containing multi-head self-attention mechanisms and feedforward neural networks. This allows the model to capture complex relationships between words. During pre-training, BERT employs two objectives to learn general language representations: Masked Language Modeling (MLM) and Next Sentence Prediction (NSP) [37]. In MLM, some words in the input text are randomly masked, and the model’s task is to predict the original words that were masked. NSP, on the other hand, teaches the model to understand the relationship between two sentences by predicting whether they are consecutive or not. After pre-training, BERT model can be fine-tuned for a wide range of natural language processing tasks, including text classification, named entity recognition, and so on, to adapt to specific application domains.
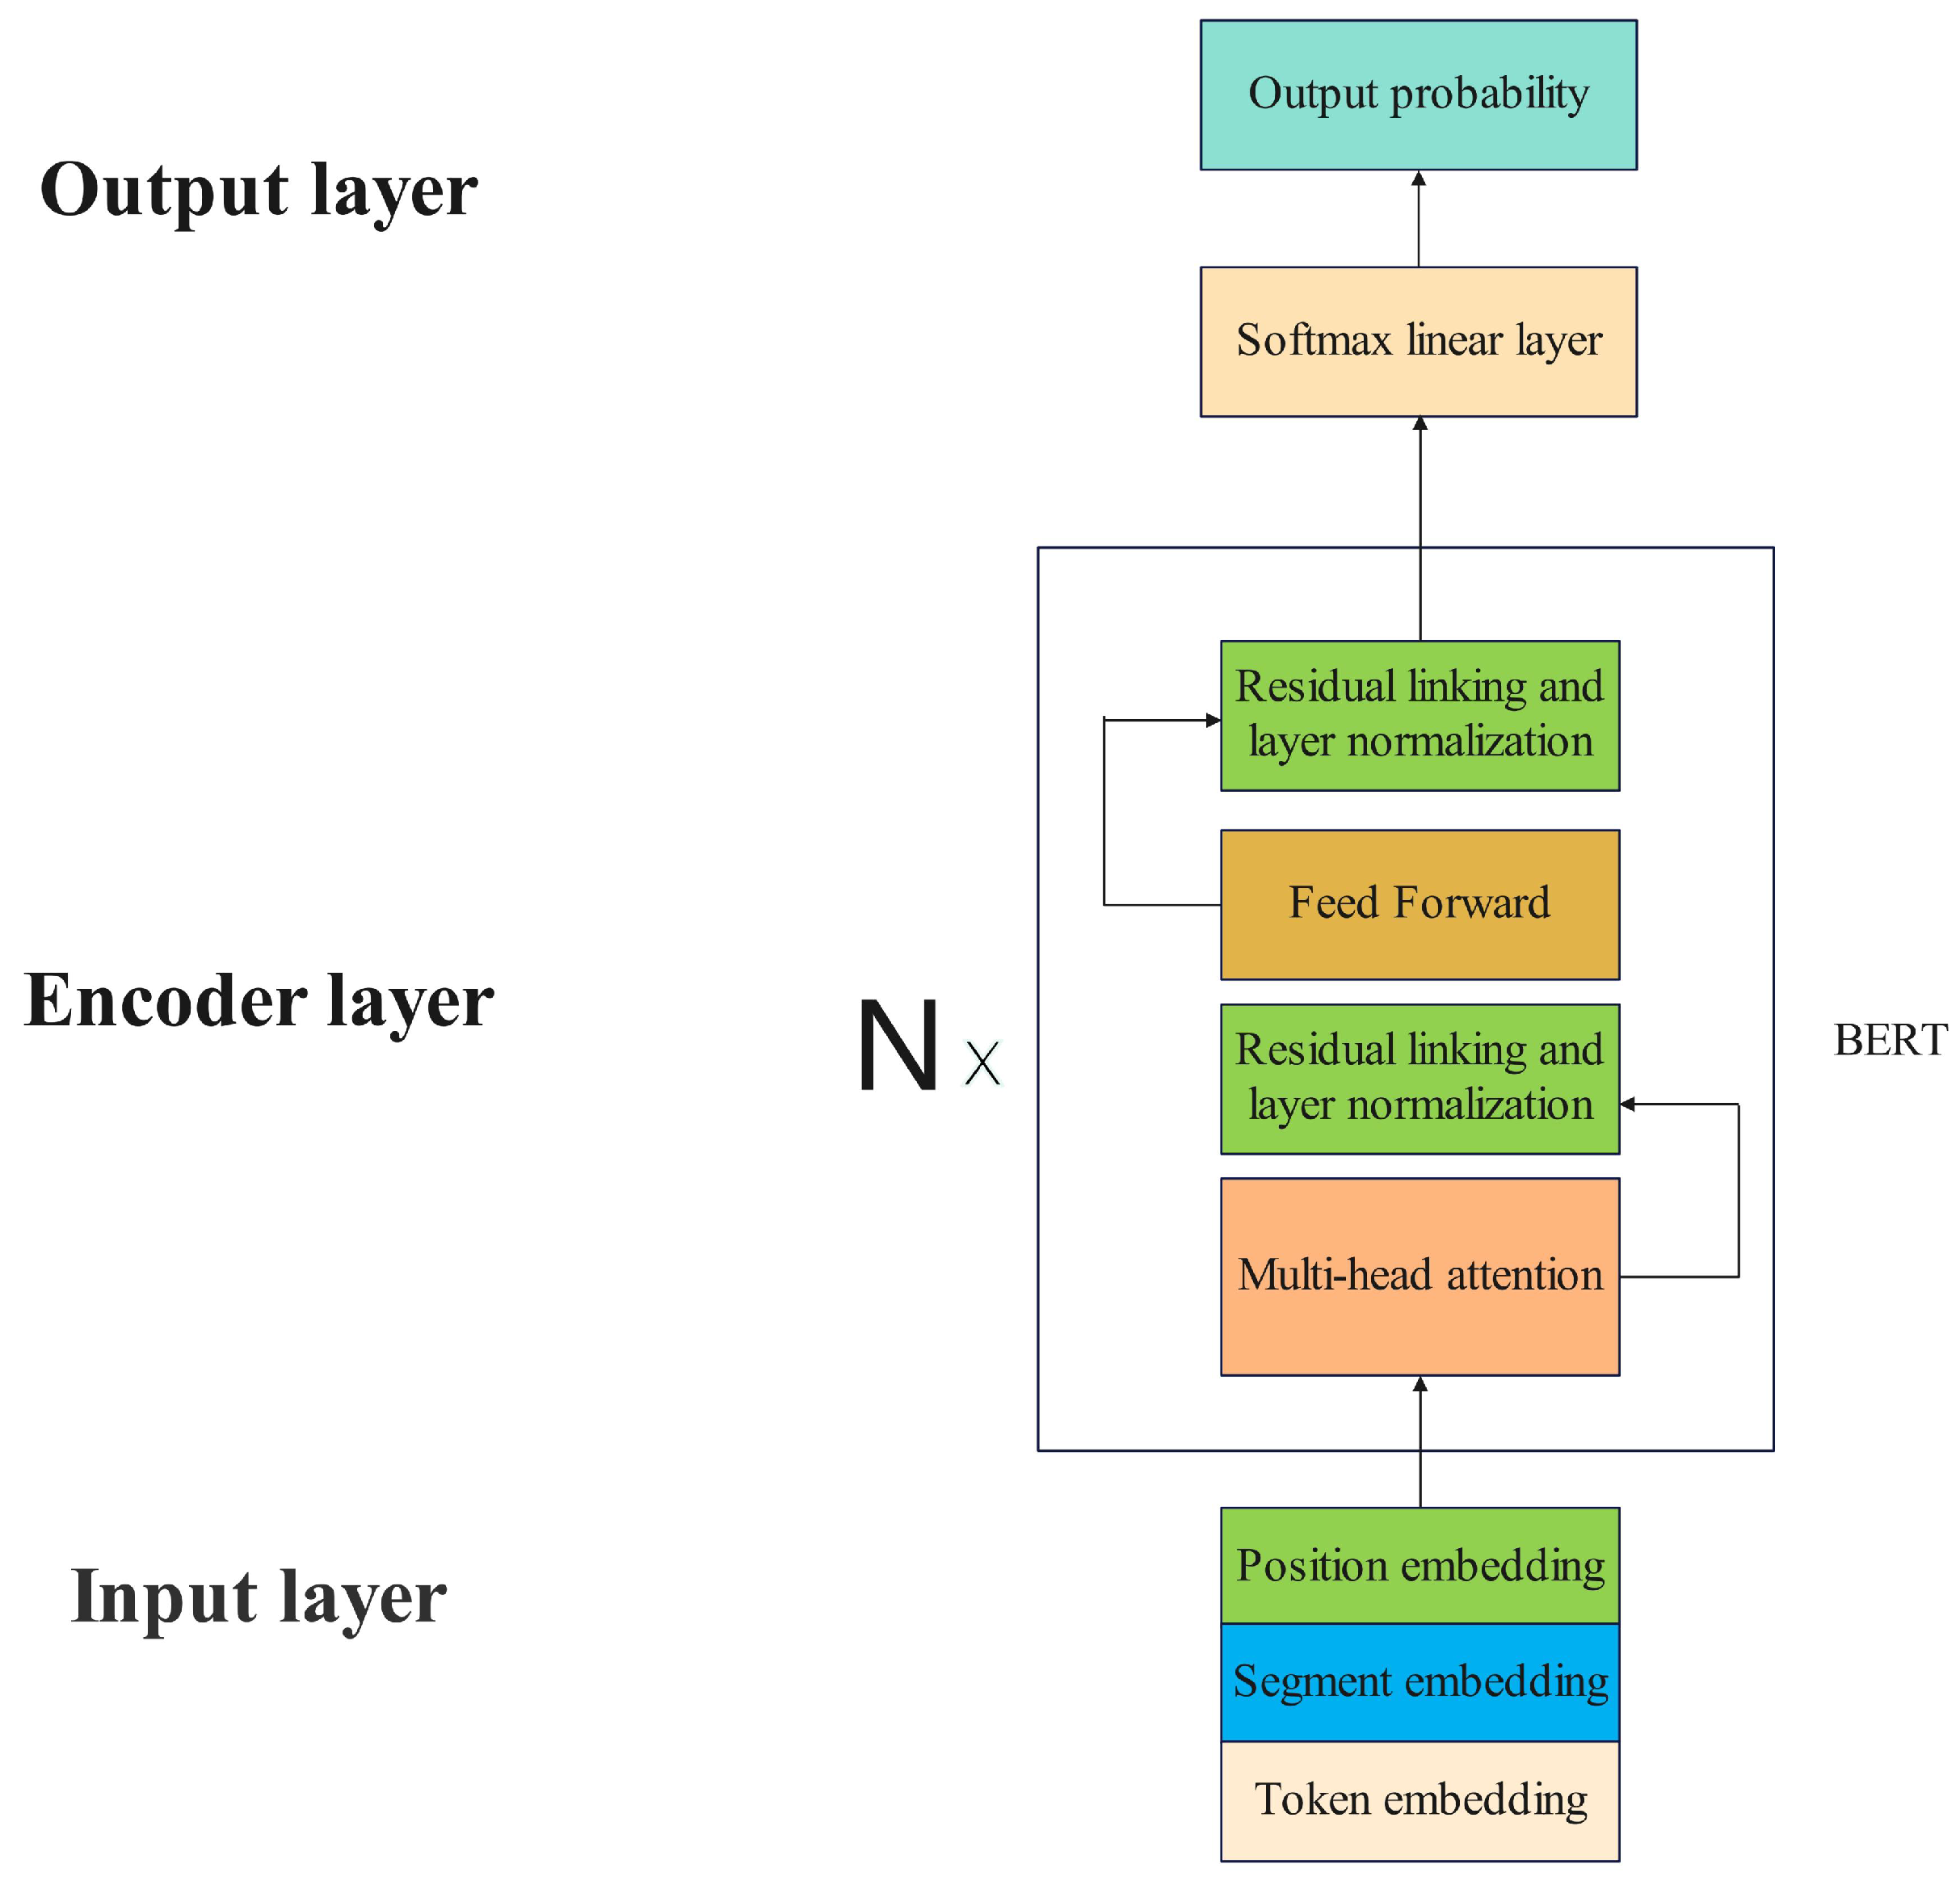
Each layer of BERT model contains a multi-head self-attention module, a feed-forward neural network, a residual connection and a layer normalization module. The input to BERT model usually consists of three types, the token embedding, the segment embedding and the position embedding. The token embedding encodes information about the content of the input text, which is formatted with respect to the task to be fine-tuned. The segment embedding encodes information about the class of the sentence. If the input consists of two sentences, it is common to mask the first sentence with all zeros and the second sentence with all ones. The position embedding encodes the positional and sequential information of the input, and the position embedding of BERT model is automatically learned by the model. To improve the utilization of BERT model outputs, a softmax layer is superimposed on the original BERT model in this paper, characterizing the probability that two sentences are similar as a value ranging from 0 to 1. This paper uses the parameter settings of BERTBASE. BERTBASE model is constructed with 12 Transformer encoder layers, each layer utilizing 12 self-attention heads in its multi-head attention mechanism. The dimension of the encoding embeddings is 768, and the model comprises approximately 110 M (million) parameters in total [37]. The model uses word as the input unit and the size of the word list is 21,128. The maximum length of the model’s input embeddings is 512 [38]. Smaller embeddings will be padded and larger embeddings will be truncated. The architecture of BERT model is shown in Figure 1 [37].

Figure 1.
BERTBASE model architecture.
4. Proposed Method
This section provides a discussion on the implementation of SOTM algorithm. This section is divided into five parts, the overall framework of SOTM algorithm, recall phase based on BM25 algorithm, rearrangement phase based on BERT model, parameter selection, and complexity analysis.
4.1. The Overall Framework of SOTM Algorithm
Traditional text matching algorithms include TF-IDF algorithm, BM25 algorithm, etc. These algorithms typically focus on the word or character level, employing parameters such as word frequency and inverse document frequency to calculate the similarity scores of two sentences. It is characterized by simple implementation and fast matching speed. However, this type of algorithm cannot capture the meaning at the semantic level, resulting in a relatively lower matching accuracy. Text matching algorithms based on deep learning include GRU, BERT and so on. This type of models can better understand the contextual semantics and has a relatively higher matching accuracy. However, the actual retrieval speed of this type of models is relatively slow.
Therefore, this paper aims to combine traditional text matching algorithms and text matching algorithms based on deep learning. In the current work, BM25 algorithm in traditional text matching algorithm and BERT model based on deep learning are selected to construct a second-order text matching algorithm. The reasons for selecting BM25 algorithm and BERT model are explained in the following paragraphs.
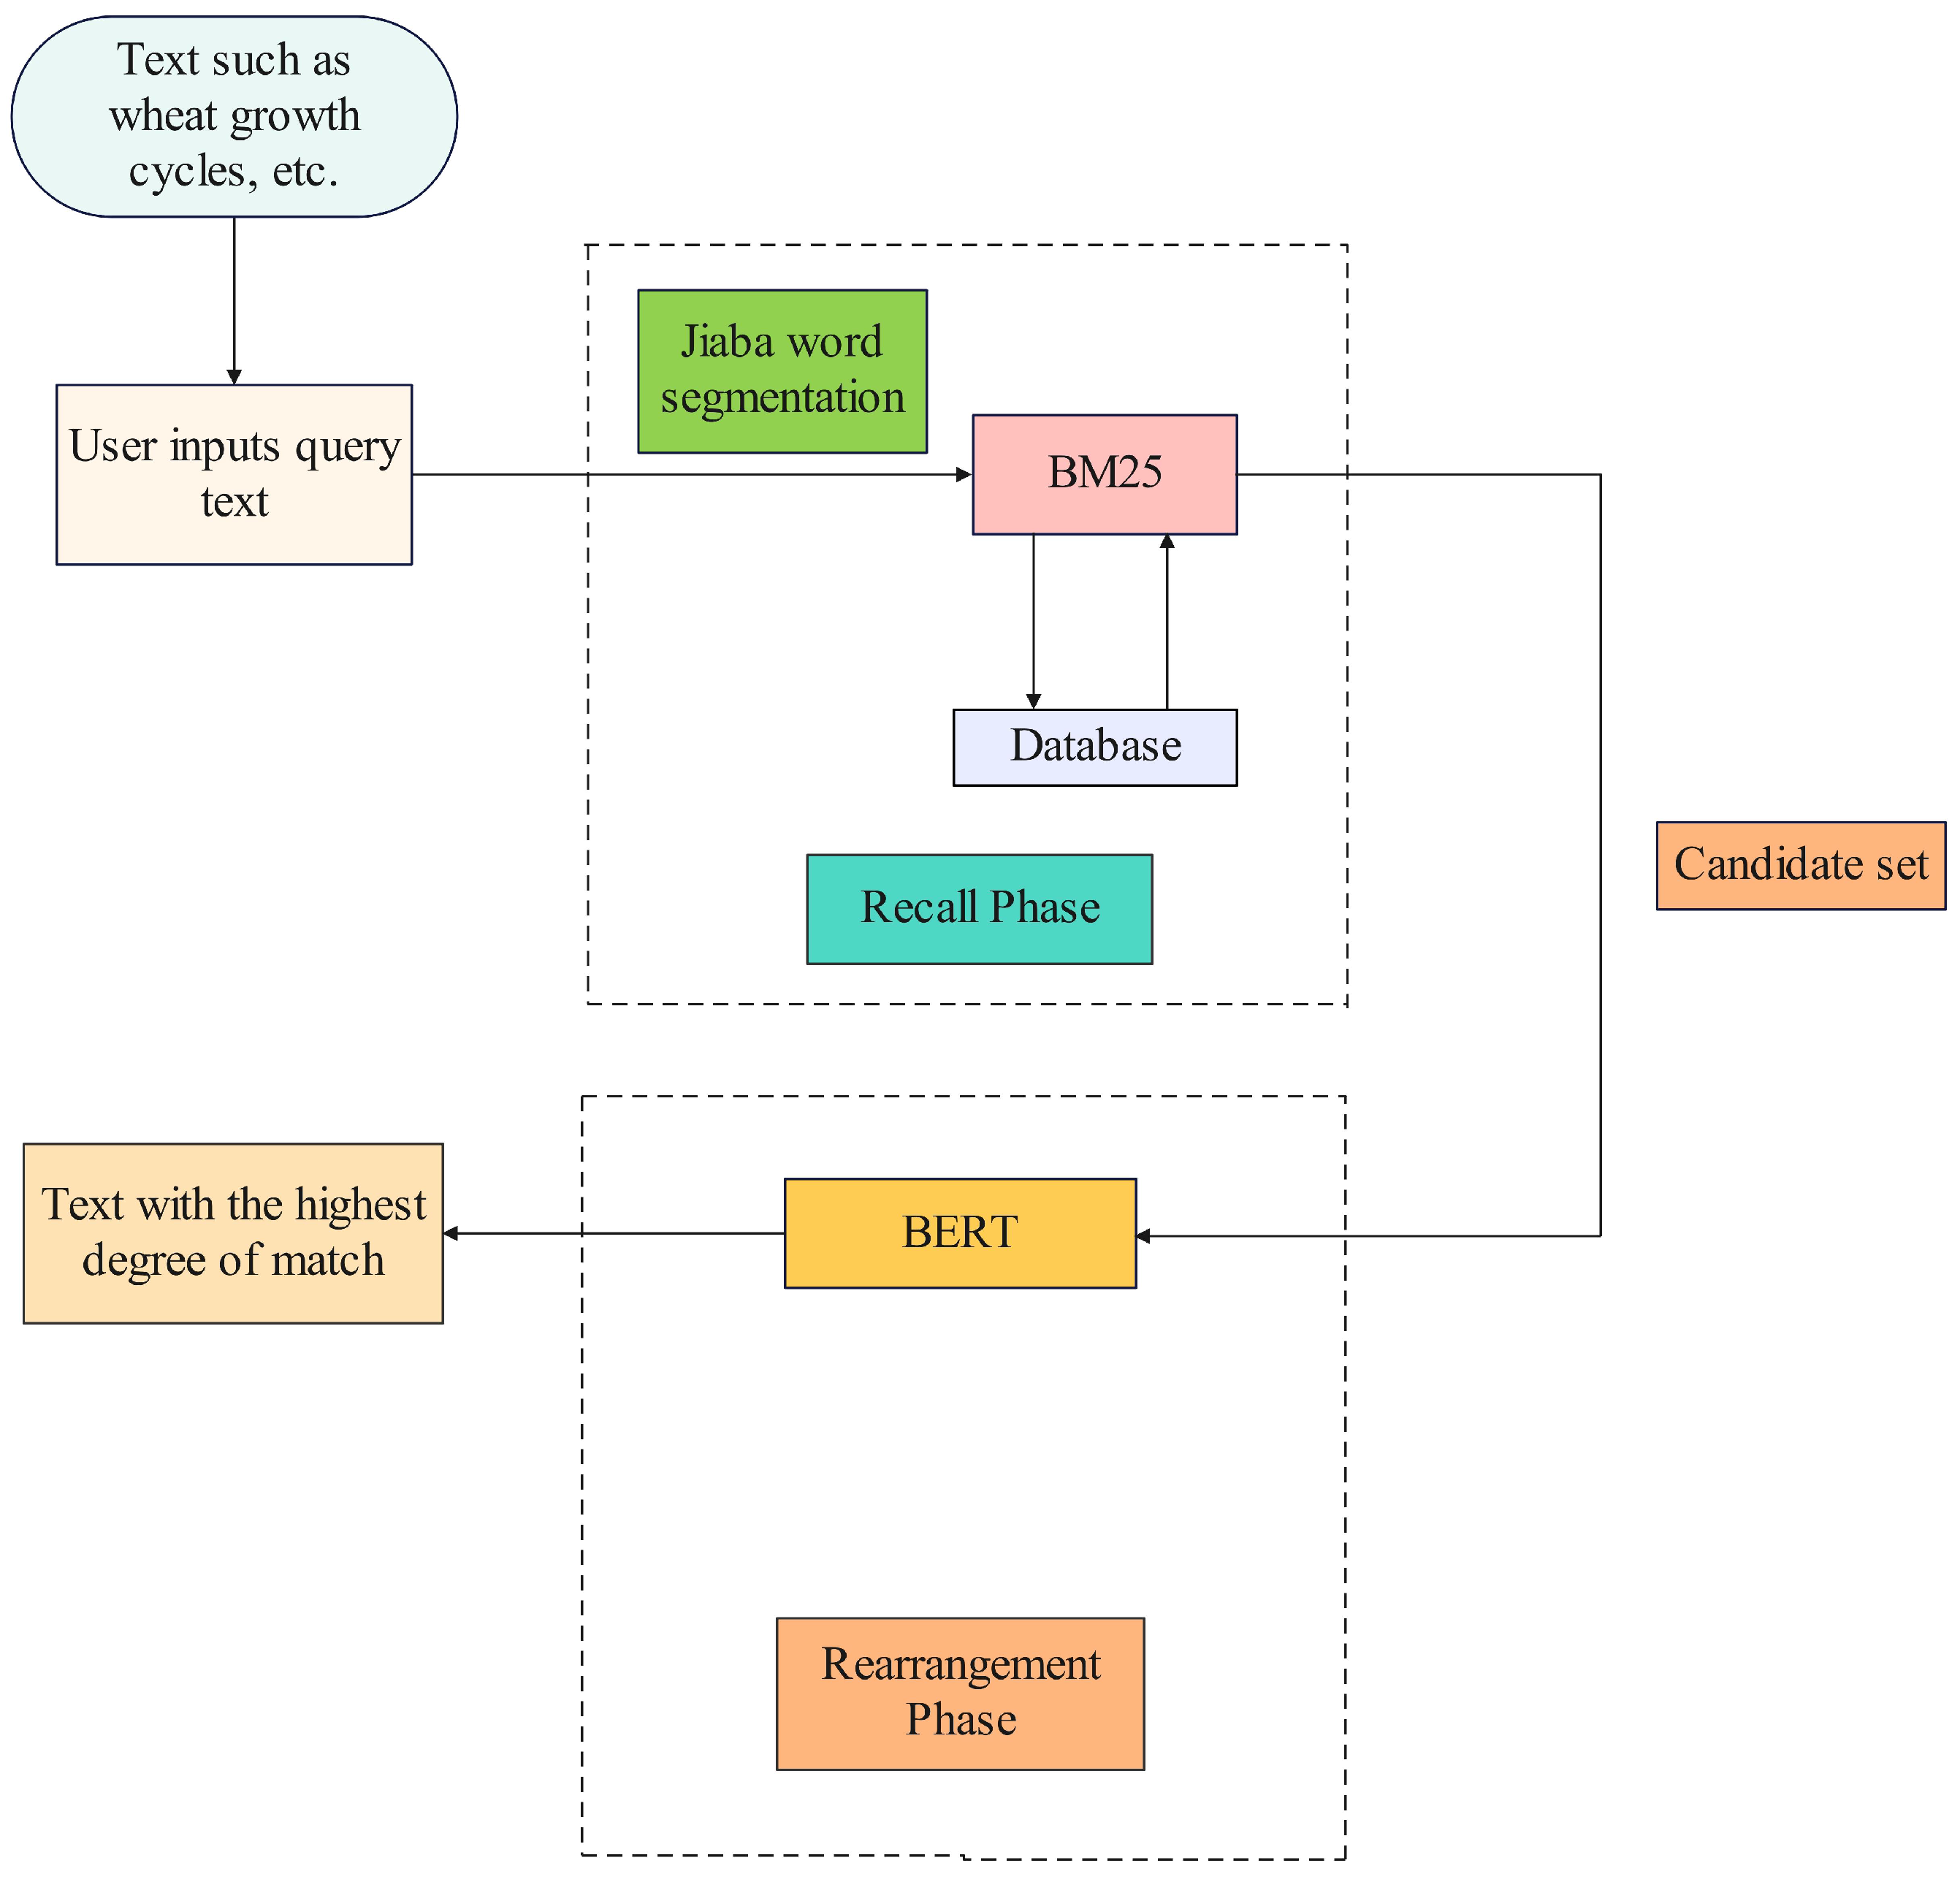
The overall framework of SOTM algorithm proposed by this paper is shown in Figure 2. The text is input by the user and subsequently segmented using the Jieba library. Jieba is an open source library for Chinese text segmentation library. It is based on the prefix dictionary to achieve efficient Chinese word separation function [39]. This is followed by the retrieval phase. The results of the word segmentation are compared with the text stored in the database using BM25 algorithm and the matching results are sorted. Some of the best matches are selected as the candidate set. The algorithm ends with a rearrangement phase. Match the candidate set again using BERT model to find out the text that has the highest degree of match. SOTM algorithm is shown on Algorithm 1.
| Algorithm 1 SOTM Algorithm Flow Based on BM25 Algorithm and BERT Model |
| Input: One query , text set . |
| Output: The optimal matched query . |
Procedure:
|

Figure 2.
The overall framework of SOTM algorithm.
4.2. Recall Phase Based on BM25 Algorithm
Compared to other traditional text matching algorithms, BM25 algorithm has the following advantages. Firstly, it can dynamically adjust its parameters. The two main parameters ( and b) can be adjusted to adapt to different text collections and query patterns, which makes the algorithm more flexible. Secondly, BM25 takes into account the effect of document length on the weights, which are adjusted by the parameter b. This makes the algorithm more robust to different document lengths than other traditional text matching model. Thirdly, BM25 avoids the overfitting problem that may occur in other traditional text matching algorithm like TF-IDF when dealing with long documents, by suppressing the frequent words in the document. Fourthly, BM25 performs better in handling sparse queries (queries with a small number of keywords) and provides more accurate search results than some other algorithms. Therefore, BM25 algorithm is selected for screening and matching in the recall phase.
The data required for BM25 algorithm can be pre-processed. In the first step, the frequency of word occurrences in a sentence can be calculated. denotes the number of occurrences of word i in the j-th sentence. In the second step, the inverse document frequency of each word can be calculated and stored in a dictionary. denotes the value for word i. In the third step, the average length of all sentences in the text set can be calculated.
When the user inputs a query , the algorithm utilizes Jieba library to segment words, where each word is denoted by . For each , and are calculated. Then, the similarity scores between and each text are computed and stored in the dictionary . The dictionary stores two pieces of information, an index and the score of the query corresponding to that index. Finally, the dictionary is sorted in descending order based on the query scores and then returned. In this way, the set of problems corresponding to the first few indices of the dictionary is the required candidate set and the recall phase ends. The pseudocode for this phase of the algorithm is given on Algorithm 2.
| Algorithm 2 Recall Phase Based on BM25 Algorithm |
| Input: One query , text set . |
| Output: Candidate query subset . |
Procedure:
|
4.3. Rearrangement Phase Based on BERT Model
BERT has several significant advantages over other text matching algorithms. Firstly, BERT uses a bidirectional Transformer model, which allows it to better understand contextual nuances. Other models such as Word2Vec and GloVe only consider unidirectional contextual information. Secondly, BERT has several layers of representations, each capturing different levels of semantic information. This allows BERT to understand text comprehensively, improving its performance in text matching tasks. Thirdly, BERT is pre-trained on large amounts of text to learn universal language representations. This imparts superior generalisation capabilities, enabling the model to perform well even with limited annotated data. Fourthly, BERT can be fine-tuned for specific tasks, adapting to different text matching scenarios. This flexibility increases the applicability of the model to a wide range of contexts. Therefore, BERT model is selected in the rearrangement phase.
BERT model is trained in two steps. A generic model is firstly trained using a large-scale unlabeled document-level corpus and then supervised training of that model on a task-specific corpus is performed to tune the model’s parameters. The pre-training phase requires training on large-scale unlabeled documents and this paper directly uses BERT-Chinese model released by Google as the pre-training model. The model is pre-trained on millions of Chinese Wikipedia corpus, which can be well migrated to various Chinese text tasks.
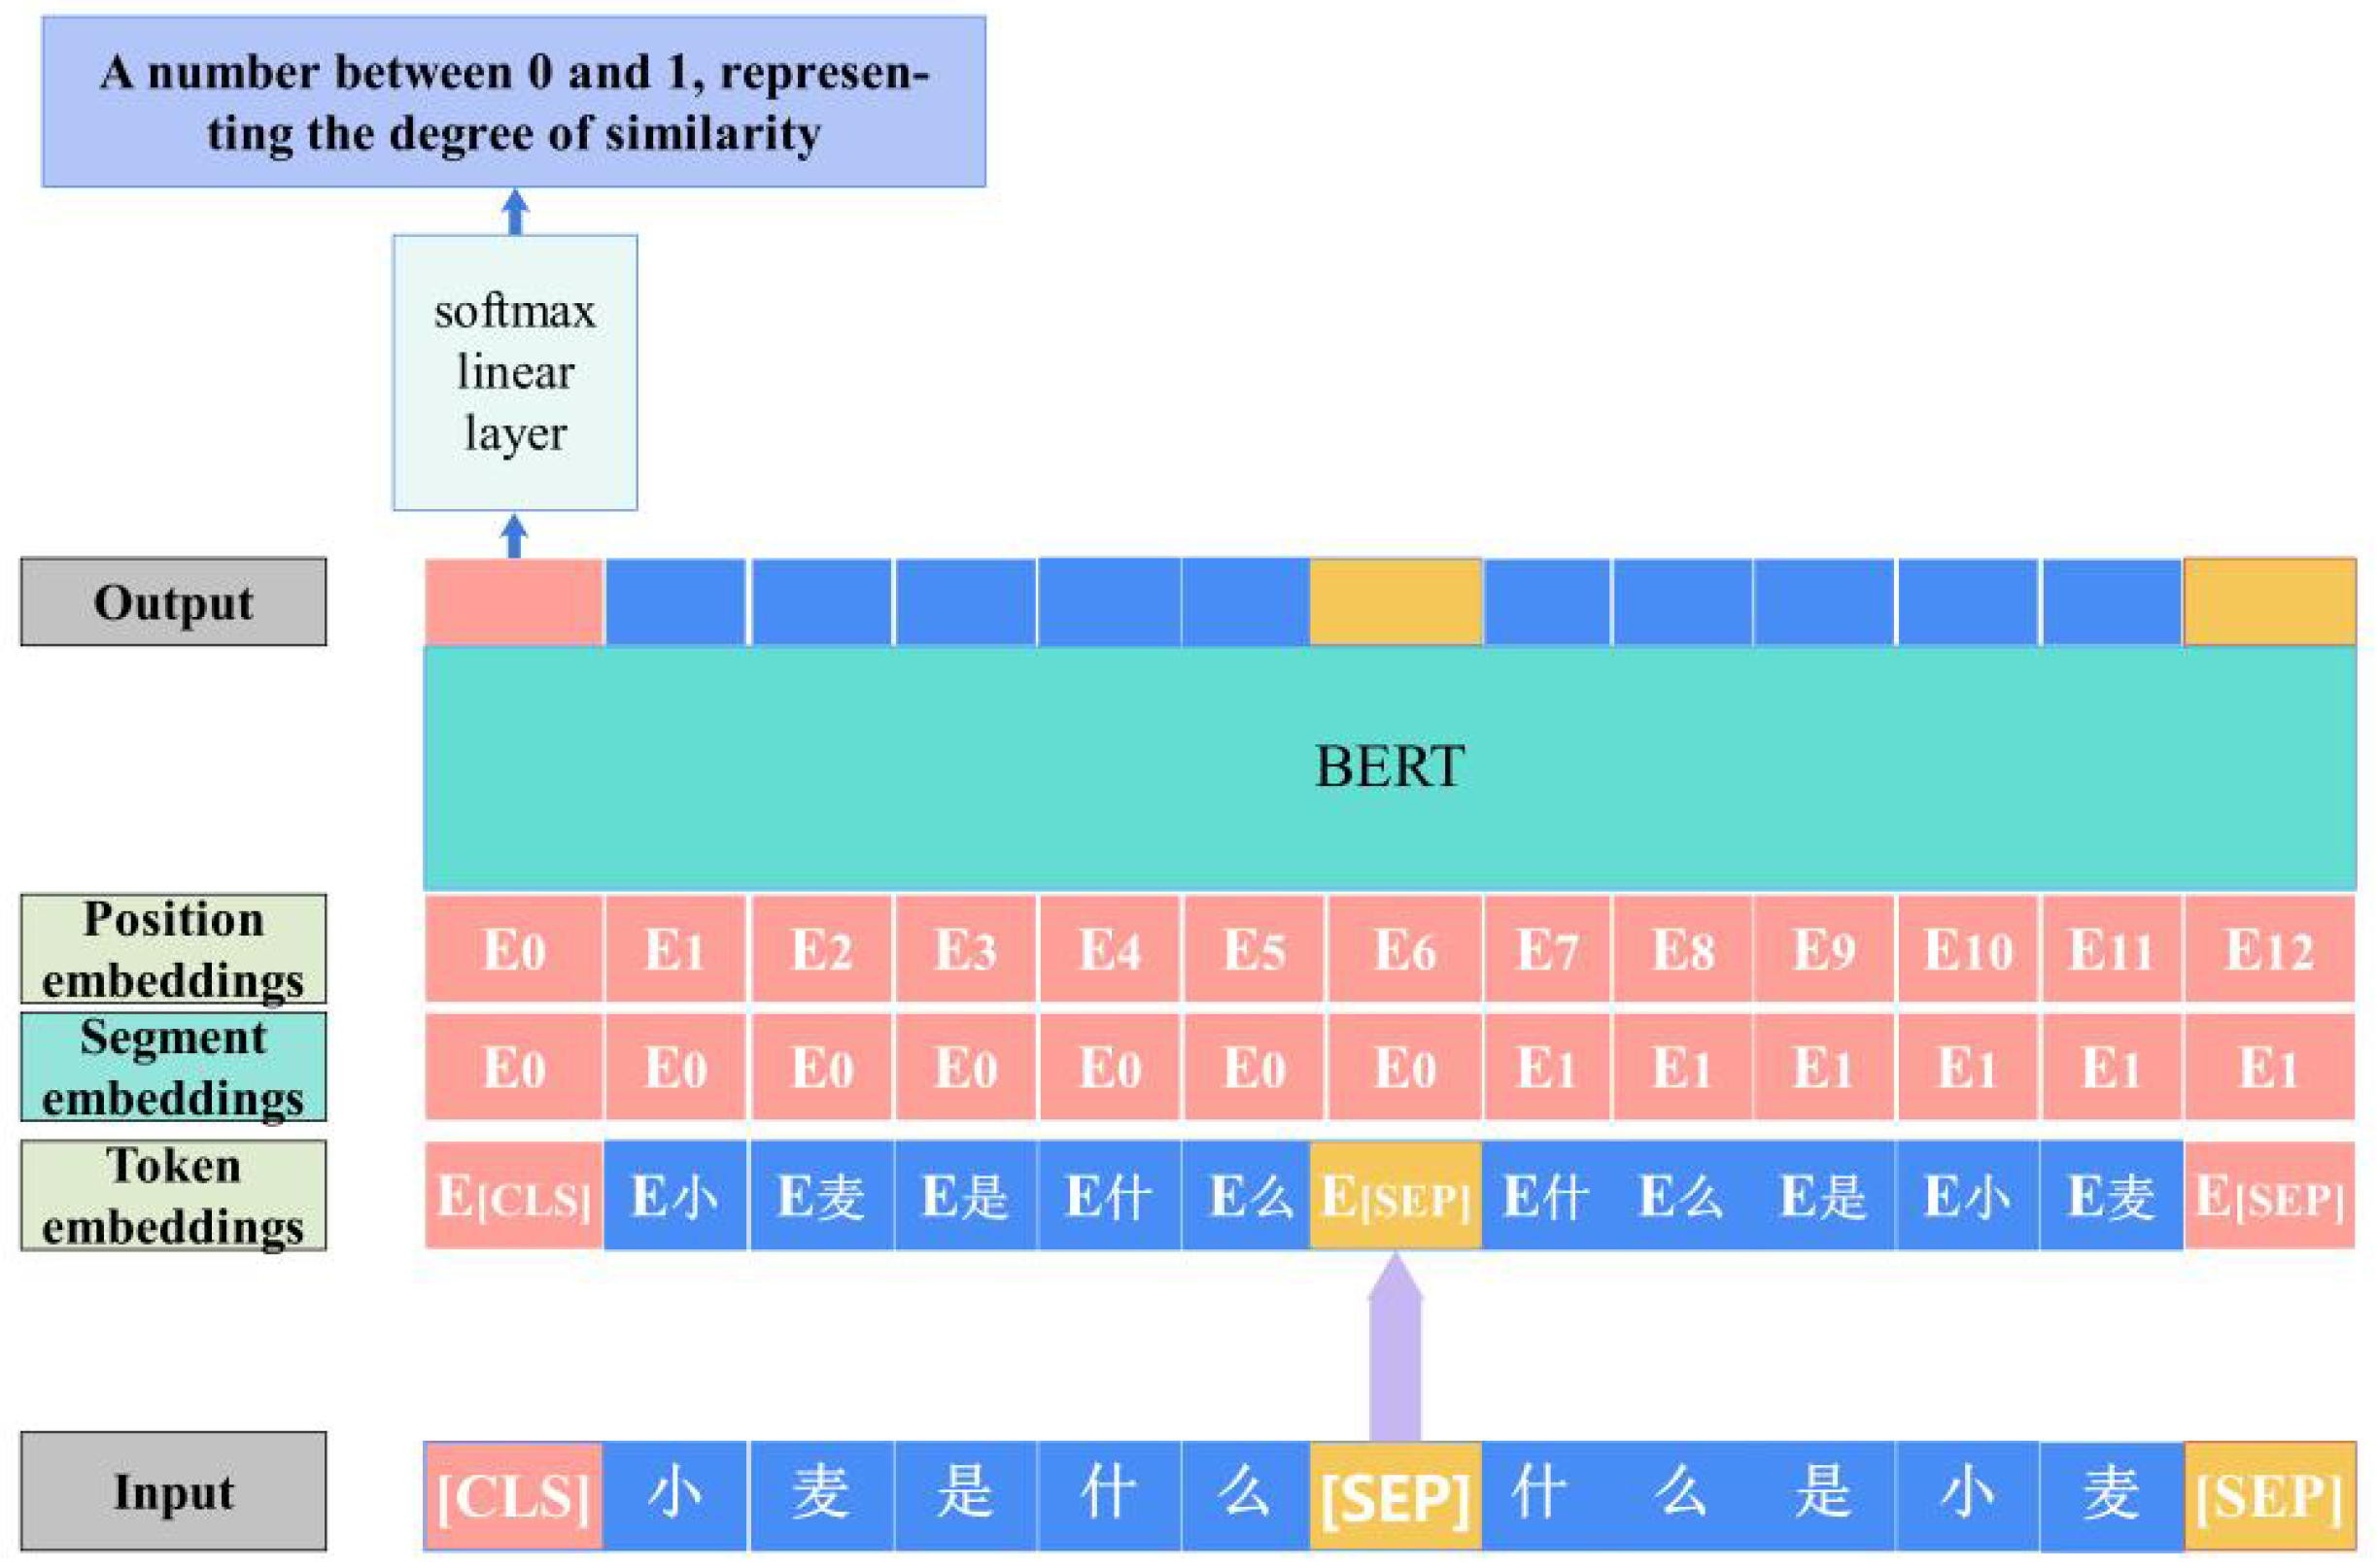
After pre-training BERT model, the parameters need to be fine-tuned in the downstream task, otherwise the results will not be satisfying. Firstly, the two sentences that need to be text-matched are combined into a single sentence with special tags. Specifically, a tag is inserted at the beginning of the first sentence, and a tag is inserted at the end of the first sentence and the second sentence. It is necessary to conduct this for all the sentences. To make sure that the length of all word lists is the same, it is necessary to fill the sentences that do not reach the maximum length with tags and mark which positions are filled or not. Finally all markers are mapped to a single independent one. This is the text embedding . Then map the words in the first sentence of 0 and those in the second sentence of 1. This is the segment embedding . The and are the inputs to BERT fine-tuning process. BERT fine-tuning process is shown in Figure 3, where “小麦是什么” means “Wheat, what is it” and
“什么是小麦” means “What is wheat”. The pseudocode for this phase of the algorithm is given on Algorithm 3.
| Algorithm 3 Rearrangement Phase Based on BERT Model |
| Input: One query , candidate set S from recall phase. |
| Output: Highest matching query . |
Procedure:
|

Figure 3.
BERT fine-tuning process.
4.4. Parameter Selection
Before SOTM algorithm is applied, two types of parameters need to be selected. One is the parameters of BERT model and the other is the number of recalls, i.e., the size of the candidate set. The selection of BERT model relies on pre-training and fine-tuning. In this paper, we directly use the official Bert-Chinese model released by Google as the pre-training model, so the selection of BERT model focuses on fine-tuning. The fine-tuning of BERT model is iterative. We save the model trained at each iteration, and then evaluate its accuracy. Among all models, the one with the highest accuracy is selected as the final actual model.
The choice of recall number depends on the actual performance of the algorithm in terms of accuracy and efficiency. As SOTM algorithm has a high requirement for accuracy of matching, accuracy should be given priority. The efficiency of the algorithm is then considered, provided that accuracy is ensured.
4.5. Complexity Analysis
The aim of this paper is to find a faster and more accurate text matching algorithm. Therefore, it is crucial to analyze the complexity of the algorithm. The time complexity of BM25 algorithm mainly depends on the size of the document collection and the number of query . Overall, the time complexity of BM25 algorithm can be considered as , which is relatively low complexity and has an excellent efficiency.
The complexity analysis of BERT model includes several factors, the computation of BERT mainly comes from the encoder layers. In the multi-head self-attention sub-layer, the complexity of self-attention operation is and the complexity of the multi-head projection operation is . In the FFN sub-layer, the complexity is where n is the length of the text sequence, and d is the dimension of the hidden layer [40]. Assuming the number of encoder layers is L, the number of independent texts to be matched is , the candidate set size generated by BM25 is s, and the number of texts in the database available for matching is k. The complexity of BERT model can be simplified as: . On the other hand, the complexity of the SOTM algorithm can be approximately considered as: . Since is very low, it can be ignored. Moreover, as , compared to the complexity of BERT model, there is a significant reduction, especially when dealing with large-scale texts.
5. Experiments
In order to better verify the accuracy and efficiency of SOTM algorithm, a series of controlled experiments are designed in this paper. This section describes the four perspectives of experimental setup, optimal parameter determination, performance comparison analysis, and summary of experiments.
5.1. Experimental Setup
This subsection describes the experimental setup, which comprises three parts: data collation, experimental environment configuration, and experimental metrics.
5.1.1. Data Collation
These experiments require a train set, a validation set and a test set. The train set is used for training BERT model during fine-tuning. The validation set is used to select the optimal BERT model during fine-tuning, and the test set is used to determine the size of the candidate set and compare the accuracy and efficiency of SOTM algorithm, BERT model and BM25 algorithm.
To enable BERT to acquire extensive knowledge on agricultural fields and achieve superior accuracy during fine-tuning, a comprehensive database encompassing agricultural crop knowledge needs to be established. Utilizing crawler technology, a significant amount of data is obtained from agricultural forums. Given the presence of numerous noises in this data, data cleaning is performed to eliminate irrelevant and meaningless images, links, comments, and the like. Furthermore, specialized agricultural books, papers, and documents are tapped to extract additional data, which is then integrated, filtered, and constructed into a high-quality database.
For each piece of data within the database, a text semantically similar to the original data is constructed through techniques such as synonym replacement and noun explanation. This pair of data is subsequently labeled with 1, signifying their semantic similarity. Conversely, for each piece of data in the database, another distinct piece of data is randomly chosen and modified using similar techniques. This pair is labeled with 0, indicating semantic dissimilarity. The text pairs labeled 1 are then divided into three parts in a specific proportion and allocated to the train set, validation set, and test set accordingly. Additionally, the text pairs labeled 0 are split into two parts and added to the train set and validation set, respectively.
To enhance the realism of the data and improve the effectiveness of fine-tuning and test, 800 text data samples are randomly selected. For each text, a carefully manually constructed similar meaning text is prepared. Each pair of texts is labeled with 1. Subsequently, 400 data samples are allocated to the train set, 200 to the validation set, and 200 to the test set. To ensure that BERT model comprehends the texts thoroughly, in the train set, the positions of and are swapped for all agricultural data texts labeled with 1. Additionally, and are also included in the train set. Furthermore, the modified text and the original text are segmented using Jieba library for all text data pairs labeled with 1. Any overlapping words found in the two texts have one word randomly masked in the modified text for further modification. If no overlapping words exist, no further modification is performed.
This paper uses an additional LCQMC dataset to make BERT model more adequate for learning [41], which is a large-scale Chinese text matching dataset containing a lot of semantic information. In order to better reflect the accuracy on the agricultural datasets, the validation set and test set in these experiments do not include the data in LCQMC. The data in the validation set and test set is all related texts in the field of agriculture. The counts of different data types in the train set, validation set, and test set are shown in Table 1.

Table 1.
The counts of different data types in the train set, validation set, and test set.
In this paragraph, we provide additional clarifications and supplementary details regarding the dataset and experimental setup. Given the immense parameter count of BERT model, directly training and fine-tuning it for text matching on vast text data would be prohibitively expensive. Consequently, we describe our methodology, where BERT model is trained to determine whether two sentences are similar, using distinct train and validation sets. Additionally, we have allocated a small test set to allow the model to actually perform the task of text matching, in order to assess the performance of BERT model in this specific application.
5.1.2. Experimental Environment Configuration
SOTM algorithm, BM25 algorithm and BERT model are mainly based on Python language implementation. Table 2 gives a specific description of the experimental environment configuration.
Table 2.
Description of the experimental environment configuration.
5.1.3. Experimental Metrics
In the field of text matching, the retrieval accuracy and efficiency of an algorithm or model are usually considered as very important attributes. We evaluate the retrieval accuracy using the Precision@K (P@K) metric. P@K is an evaluation metric that measures the ratio of the number of correct predictions considering only the first K items in a given list of actual and predicted categories to the first K items of each predicted category. Equation (2) gives the formula for P@K.
where is the number of truly correct results in the first K results of the prediction and is the number of incorrect results in the first K results of the prediction.
We use two metrics, average time and coefficient of variation, to measure the efficiency. Average time, is the mean value of the time spent on each query. In this paper, seconds (s) are used as the unit of measurement. We also use average time as the expected time for the algorithm or model to retrieve a problem. Coefficient of variation, also known as dispersion coefficient, is a relative statistical measure of the degree of variation in data. It is used to compare the degree of variation of two or more sample data with different mean values. Typically, the smaller the coefficient of variation, the smaller the degree of variation in the data and vice versa. Equation (3) shows the formula for coefficient of variation.
where is the coefficient of variation, is the standard deviation, is the mean. Standard deviation is used to measure the dispersion of the data. The larger the standard deviation, the more scattered the data, i.e., the greater the difference between the data and vice versa. Mean is used to measure the central tendency of the data. Equation (4) gives the formula for calculating standard deviation .
where is the value of each element in the data set, is the mean of the data set and n is the size of the data set.
5.2. Optimal Parameter Determination
This subsection is divided into two parts, BERT model determination and recall number determination. The former explains the choice of BERT model for different number of iterations during fine-tuning, and the latter explains the choice of the number of recalls.
5.2.1. BERT Model Determination
The objective of this experiment is twofold. Firstly, to fine-tune a pre-trained BERT model to enable it to learn more about agricultural crops, leading to higher accuracy in text matching in the agricultural domain. Secondly, to select BERT model with the highest accuracy from different iterations during fine-tuning. This experiment requires the use of the train set and the validation set. BERT model is iteratively trained on the train set. The validation set is used to evaluate the effectiveness of the model. After each training iteration is completed, classification accuracy (defined as the number of correctly predicted samples divided by the total number of samples), is used as the evaluation metric for the validation set, and the model with the highest classification accuracy is chosen.
During training, this paper uses the AdamW optimizer to optimize the loss values, warm-up strategy to adjust the learning rate and gradient cropping to prevent gradient explosion. The learning rate of the optimizer is set to 2 × 10⁻⁵, the number of steps for warm-up is set to 1000 and the threshold for gradient clipping is set to 1.0. The batch size is set to 32 and the training iteration is 20 times.
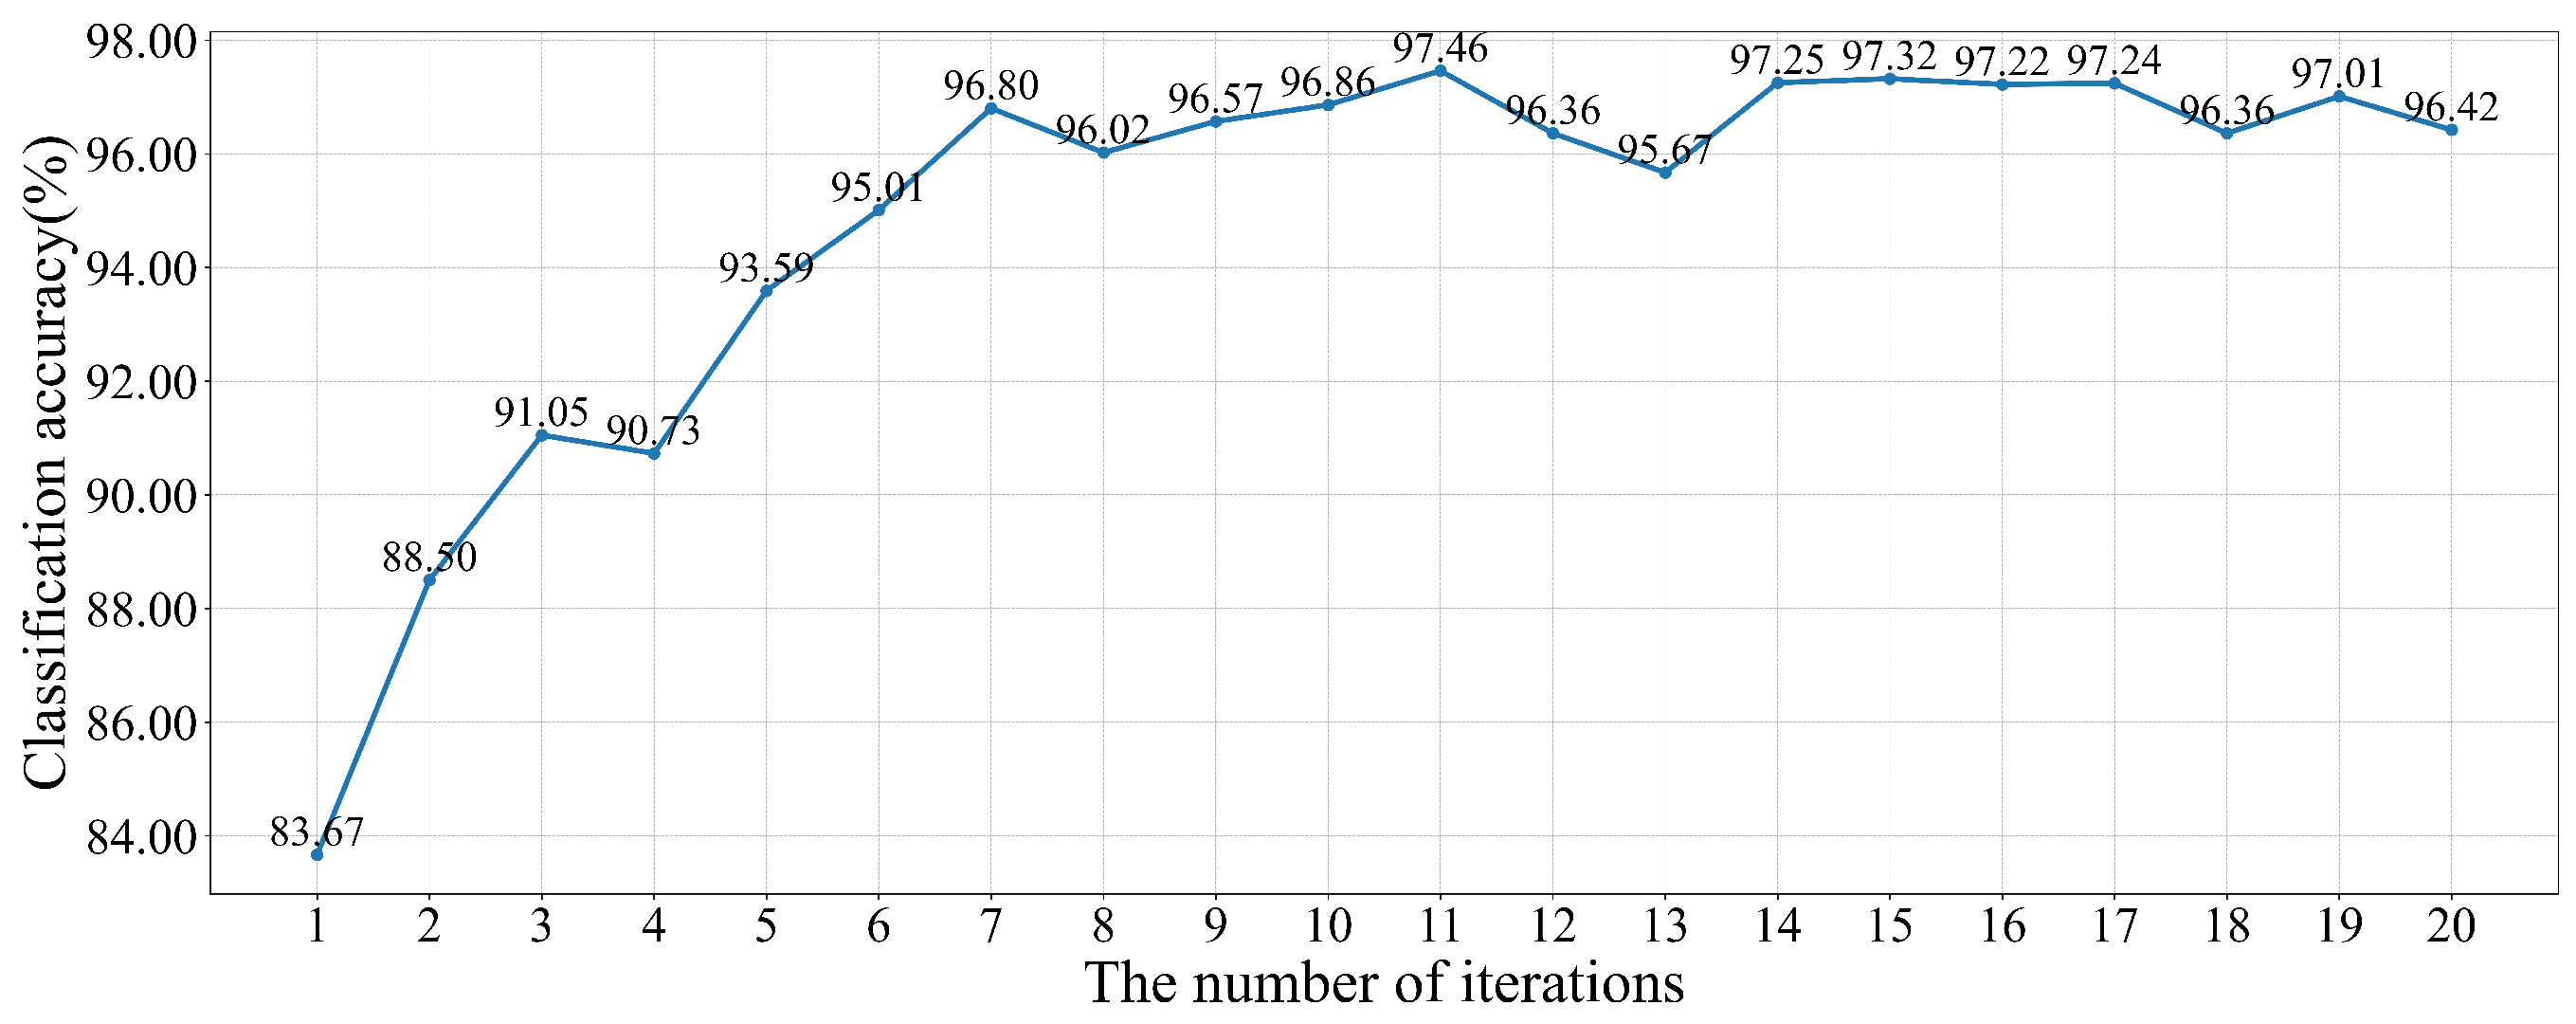
Figure 4 gives the variation of the classification accuracy of the model on the validation set, which reaches a maximum value of 97.46% when iterated 11 times. Therefore, BERT model after the 11th model iteration is used as the final matching model in this paper.

Figure 4.
Validation set classification accuracy change during fine-tuning.
5.2.2. Recall Number Determination
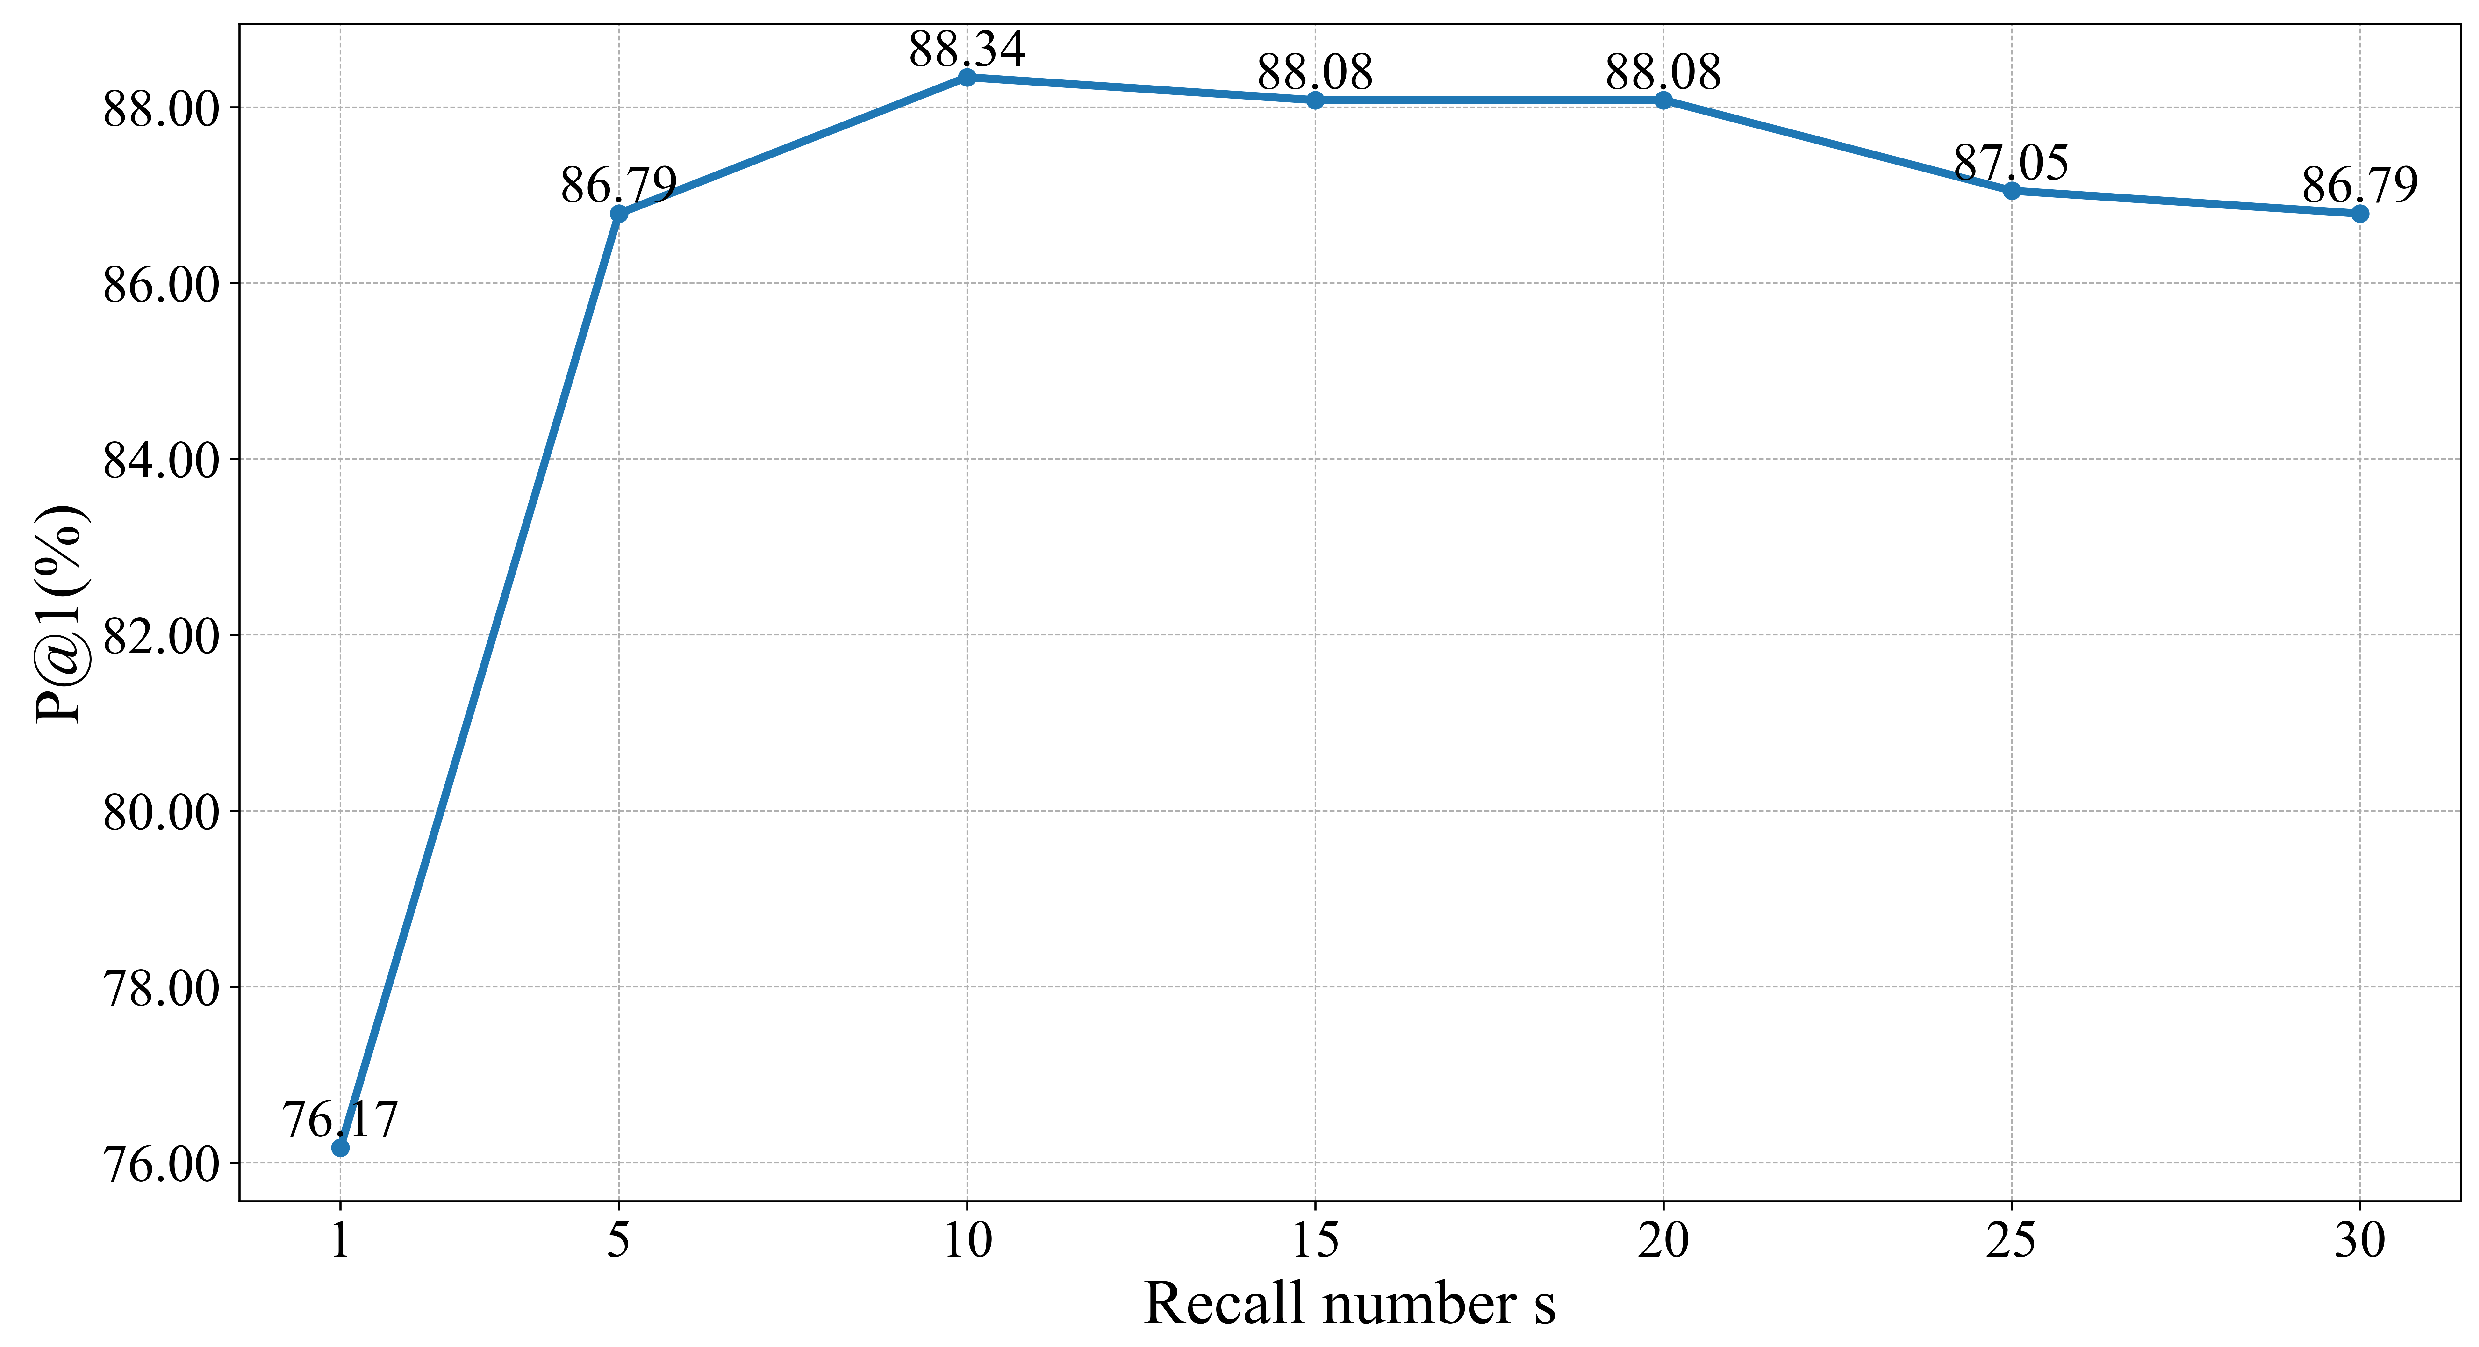
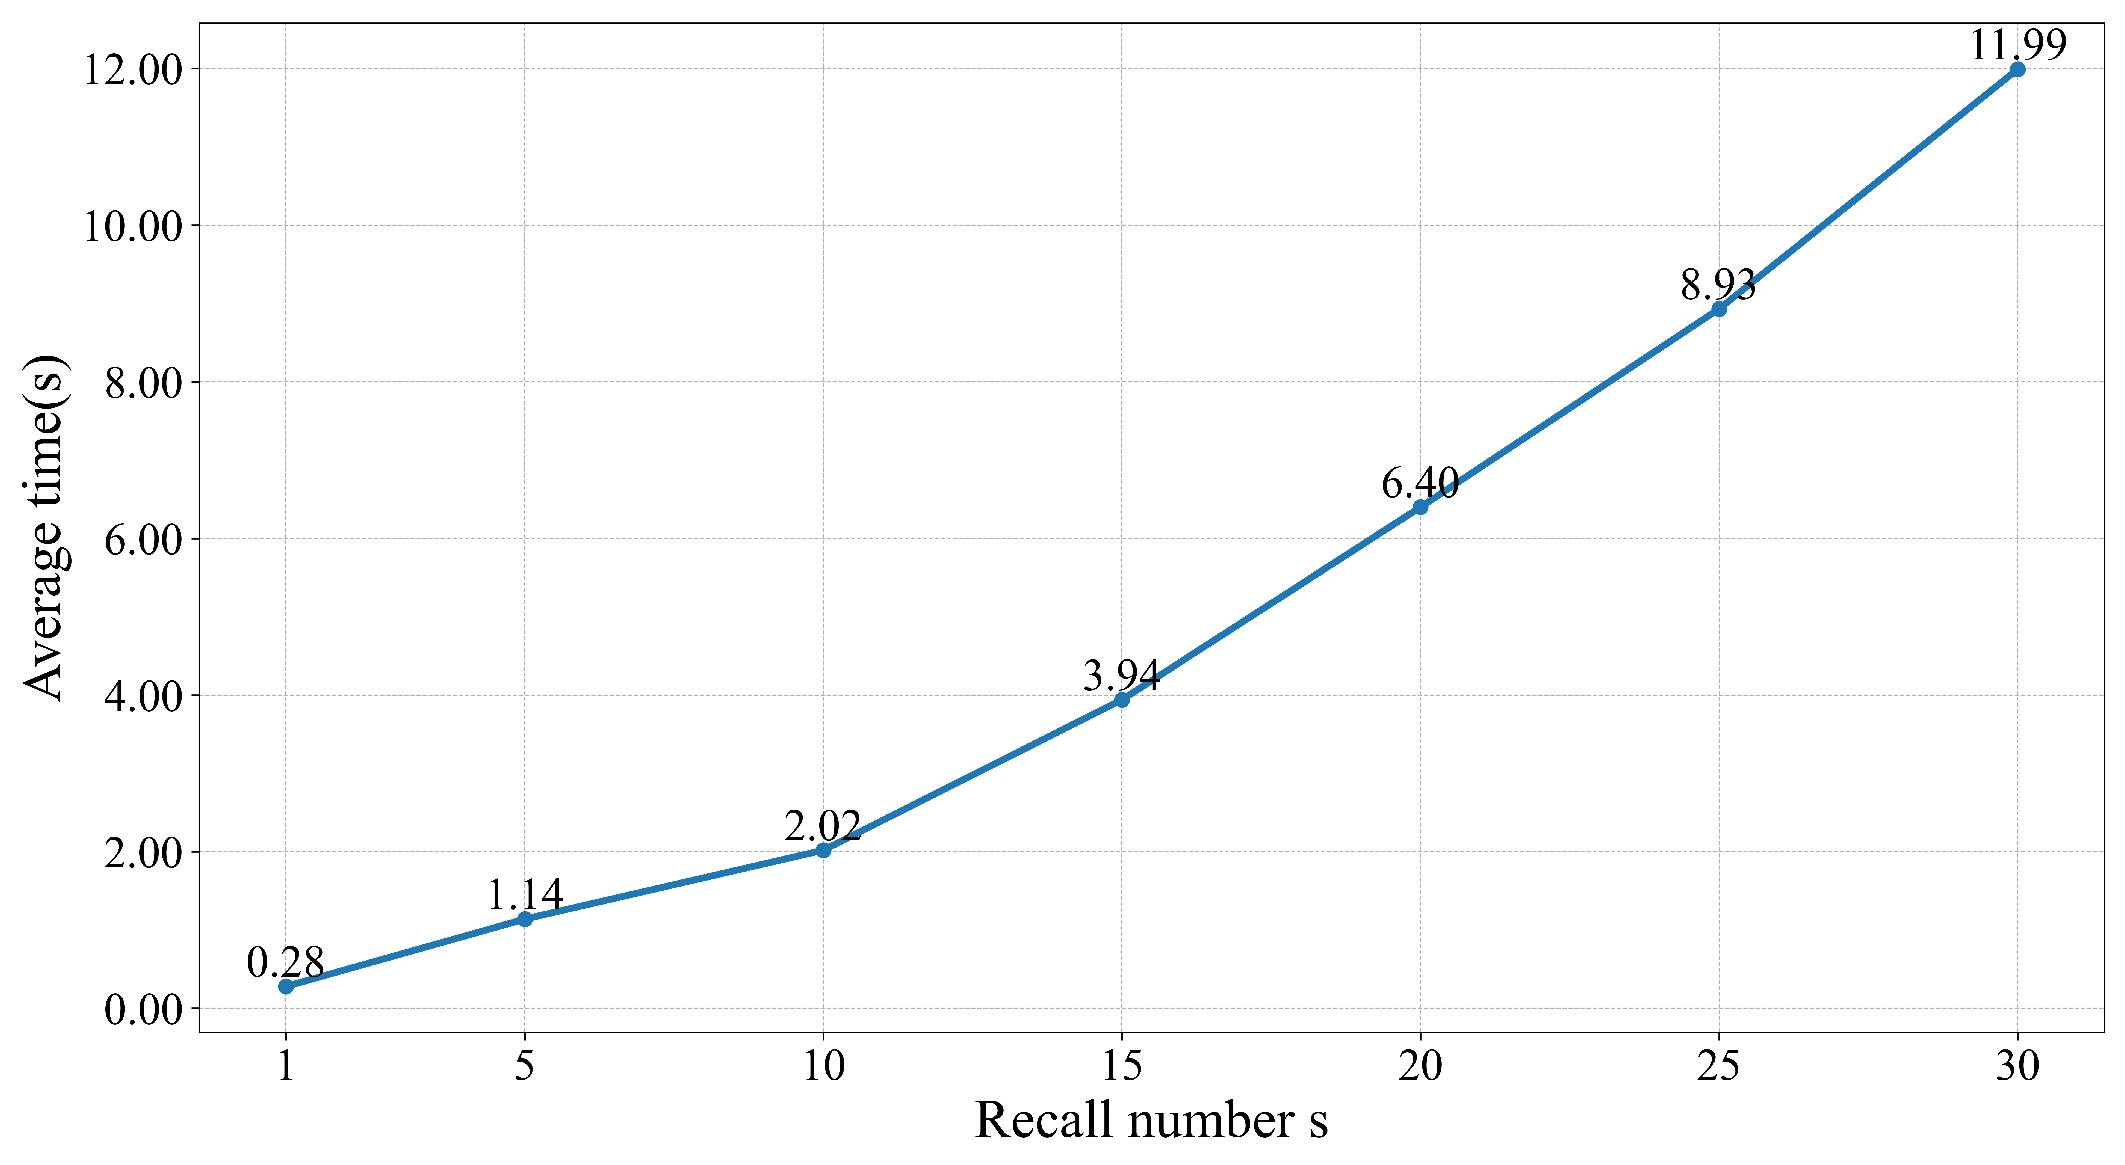
The aim of this experiment is to investigate the effect of the recall number s on retrieval accuracy and efficiency, and finally to identify the optimal value for s. We use P@1 to measure the retrieval accuracy of an algorithm or model and average time to measure efficiency. Figure 5 and Figure 6 show the algorithm’s P@1 and average time to retrieve a query versus recall number s, respectively.

Figure 5.
Variation of algorithm’s P@1 with recall number s.

Figure 6.
Variation of algorithm’s average time with recall number s.
It can be found that the choice of the value of s affects the retrieval accuracy and retrieval efficiency of the algorithm. Overall, as the recall number s increases, the P@1 value of SOTM algorithm shows a trend of first rising and then falling. When s equals 10, the P@1 value of the algorithm reaches its maximum. On the other hand, the average time of SOTM algorithm rises monotonically with recall number s. Since SOTM algorithm has high requirements for accurate answers, this paper prioritizes algorithms with high retrieval accuracy rates. In addition, algorithms with faster retrieval speeds are chosen whenever possible, while ensuring that their retrieval accuracy rates are maintained. Considering both retrieval accuracy and speed, this paper finally takes s equal to 10. The algorithm achieves the highest retrieval accuracy of 88.34% and the average retrieval time for one query is only 2.02 s. The algorithm has high retrieval accuracy and excellent efficiency.
5.3. Performance Comparison Analysis
This subsection compares the retrieval accuracy and efficiency of SOTM algorithm, BM25 algorithm and BERT model, respectively. It is divided into two parts: retrieval accuracy comparison analysis and efficiency comparison analysis.
5.3.1. Retrieval Accuracy Comparison Analysis
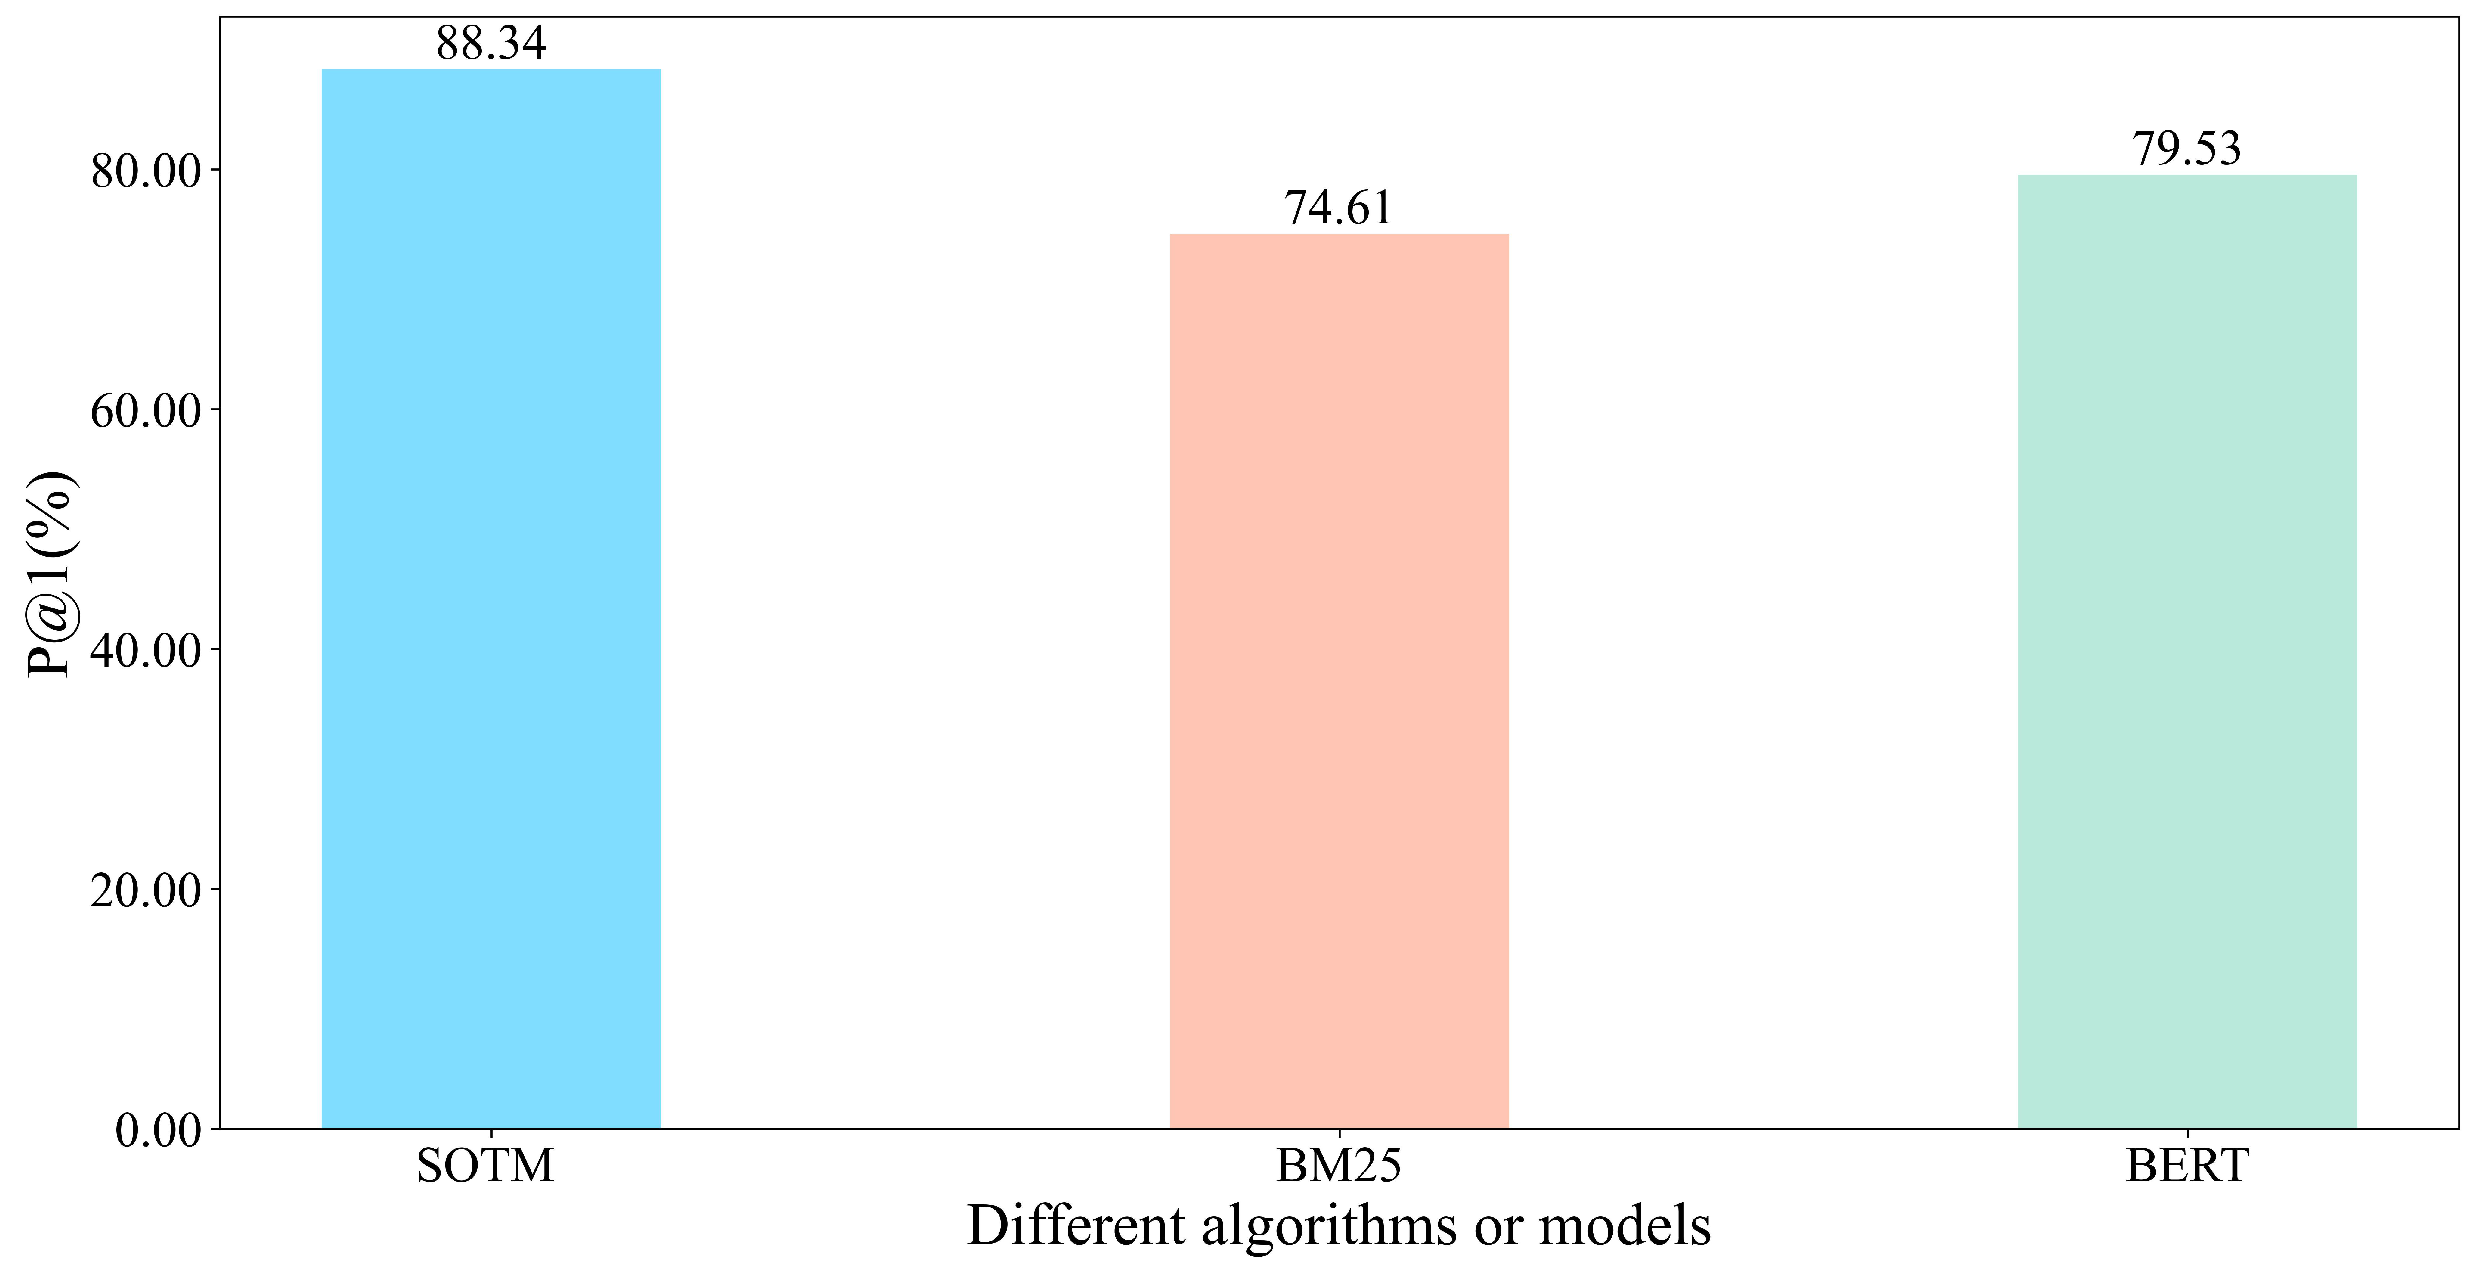
The purpose of this experiment is to compare the algorithms and models retrieval accuracies of using SOTM algorithm, using only BM25 algorithm, and using only BERT model. The dataset used in this experiment is the text set, and the three algorithms and models are run on this dataset separately to compare their retrieval accuracies. We use P@1 as the metric of retrieval accuracy. For each query in the test set, SOTM, BM25, and BERT retrieve only one answer. If the retrieved answer matches the given answer, it is considered as a successful match; otherwise, it is considered as a failed match. We calculate the retrieval accuracy of each algorithm or model by dividing the number of successful matches by the size of the test set. Figure 7 compares P@1 of different algorithms or models.

Figure 7.
Comparison of P@1 of different algorithms or models.
It can be observed that P@1 is the lowest when only BM25 algorithm is used. The P@1 value of BM25 is only 74.61%. This is because BM25 algorithm matches through some word-level perspectives such as word frequency, inverse document frequency and document length. It ignores specific contextual information and word order relationships, which makes BM25 algorithm unable to comprehensively consider the semantic relationships between words. At the same time, BM25 algorithm focuses more on dealing with common words, while its performance may be poor when dealing with long-tailed words and domain-specific proper nouns. When only BERT model is used, the P@1 is moderate, reaching 79.53%. BERT has been trained on a large corpus, incorporating extensive, diverse, and general linguistic information. Through fine-tuning, BERT model has learned specific terms and semantic information in the agricultural domain. When matching text, BERT model comprehensively considers semantic information from the context, leading to better choices [42].
It can be seen that SOTM even outperforms BERT model in P@1 when s equals to 10. The P@1 value of SOTM algorithm is 88.34%, the highest among the three. The reasons we hypothesize for SOTM algorithm performing even better than using only BERT model may lie in two aspects. One is the task difference and the other is the granularity difference.
- Task difference. During fine-tuning, BERT is trained to judge whether two given sentences are similar (returning 1) or dissimilar (returning 0). However, in this experiment, the task is to provide a query and find another text from the dataset. For a given query, BERT may consider that there are several texts similar to the query in the candidate text set. Although we ultimately obtain BERT’s scores for each text through the softmax function, and select text with the highest score, this is not consistent with the task of fine-tuning. BERT has not been fully trained for this fine-tuning task. We have found through experimentation that BERT often gives similar scores to multiple texts. On the contrary, we firstly use BM25 algorithm to narrow down the candidate set of BERT. To some extent, this can reduce the interference of texts that have large word differences but are similar to the query in some expressions, and reduce the situation where BERT gives similar scores to multiple texts. It is therefore helpful for BERT to select the most appropriate answer.
- Granularity difference. BERT model used in this paper is based on characters, while SOTM algorithm is based on both characters and words. This multi-granularity information fusion enables SOTM algorithm to learn more information. This makes SOTM algorithm easier to have a higher retrieval accuracy.
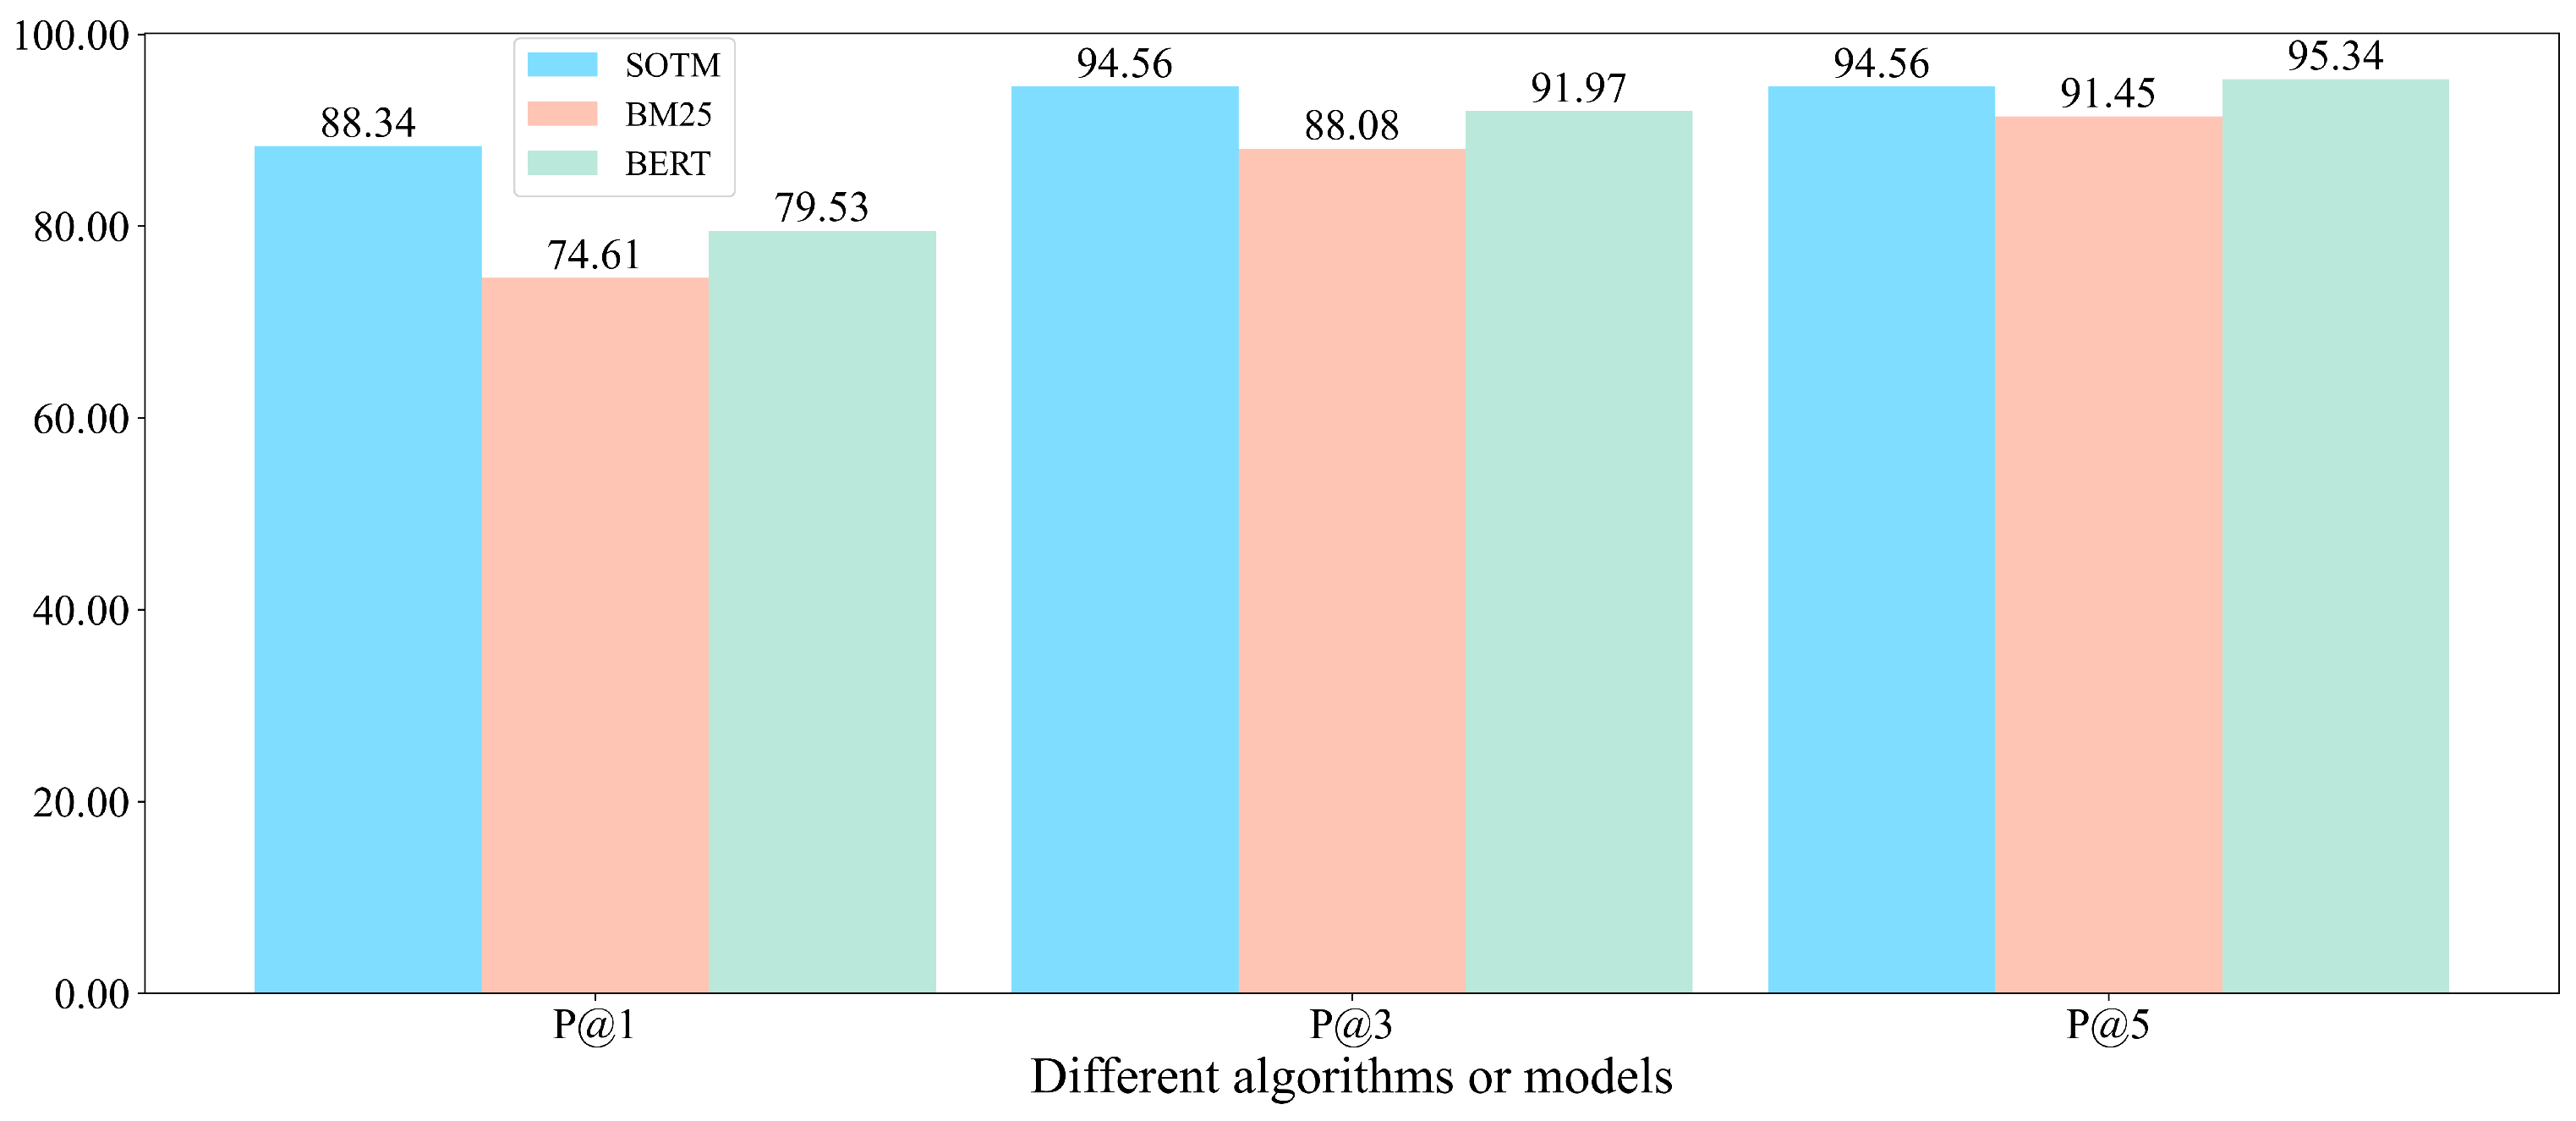
Furthermore, to further explore and compare the retrieval accuracies of various algorithms or models, the P@3 and P@5 values of SOTM, BM25, and BERT are also calculated. Additionally, a comparison is made among P@1, P@3, and P@5 values. Figure 8 compares different algorithms or models in terms of P@1, P@3, and P@5.

Figure 8.
Comparison different algorithms or models in terms of P@1, P@3, and P@5.
It can be seen that when K is 3, SOTM still achieves the best performance. However, when K equals 5, the P@5 value of BERT model is 95.34%, which exceeds SOTM’s 94.56% and is the highest among the three methods. SOTM algorithm suffers from the drawback of BM25 algorithm, which considers solely at the word level and results in lower retrieval accuracy. The accuracy of answer retrieval is inferior to that of only using BERT model. Since the size of the candidate set for SOTM algorithm is set to 10 in the paper, when K is closer to 10, the impact of BM25 algorithm on the overall algorithm becomes more evident. When K is taken as a large value in P@K, increasing the size of the candidate set can reduce the impact of BM25 algorithm on the overall algorithm and increase the impact of BERT model on the overall algorithm, but this will reduce the retrieval efficiency. In general, the experiment proves the high retrieval accuracy of SOTM algorithm, especially when the number of returned answers K is small.
5.3.2. Efficiency Comparison Analysis
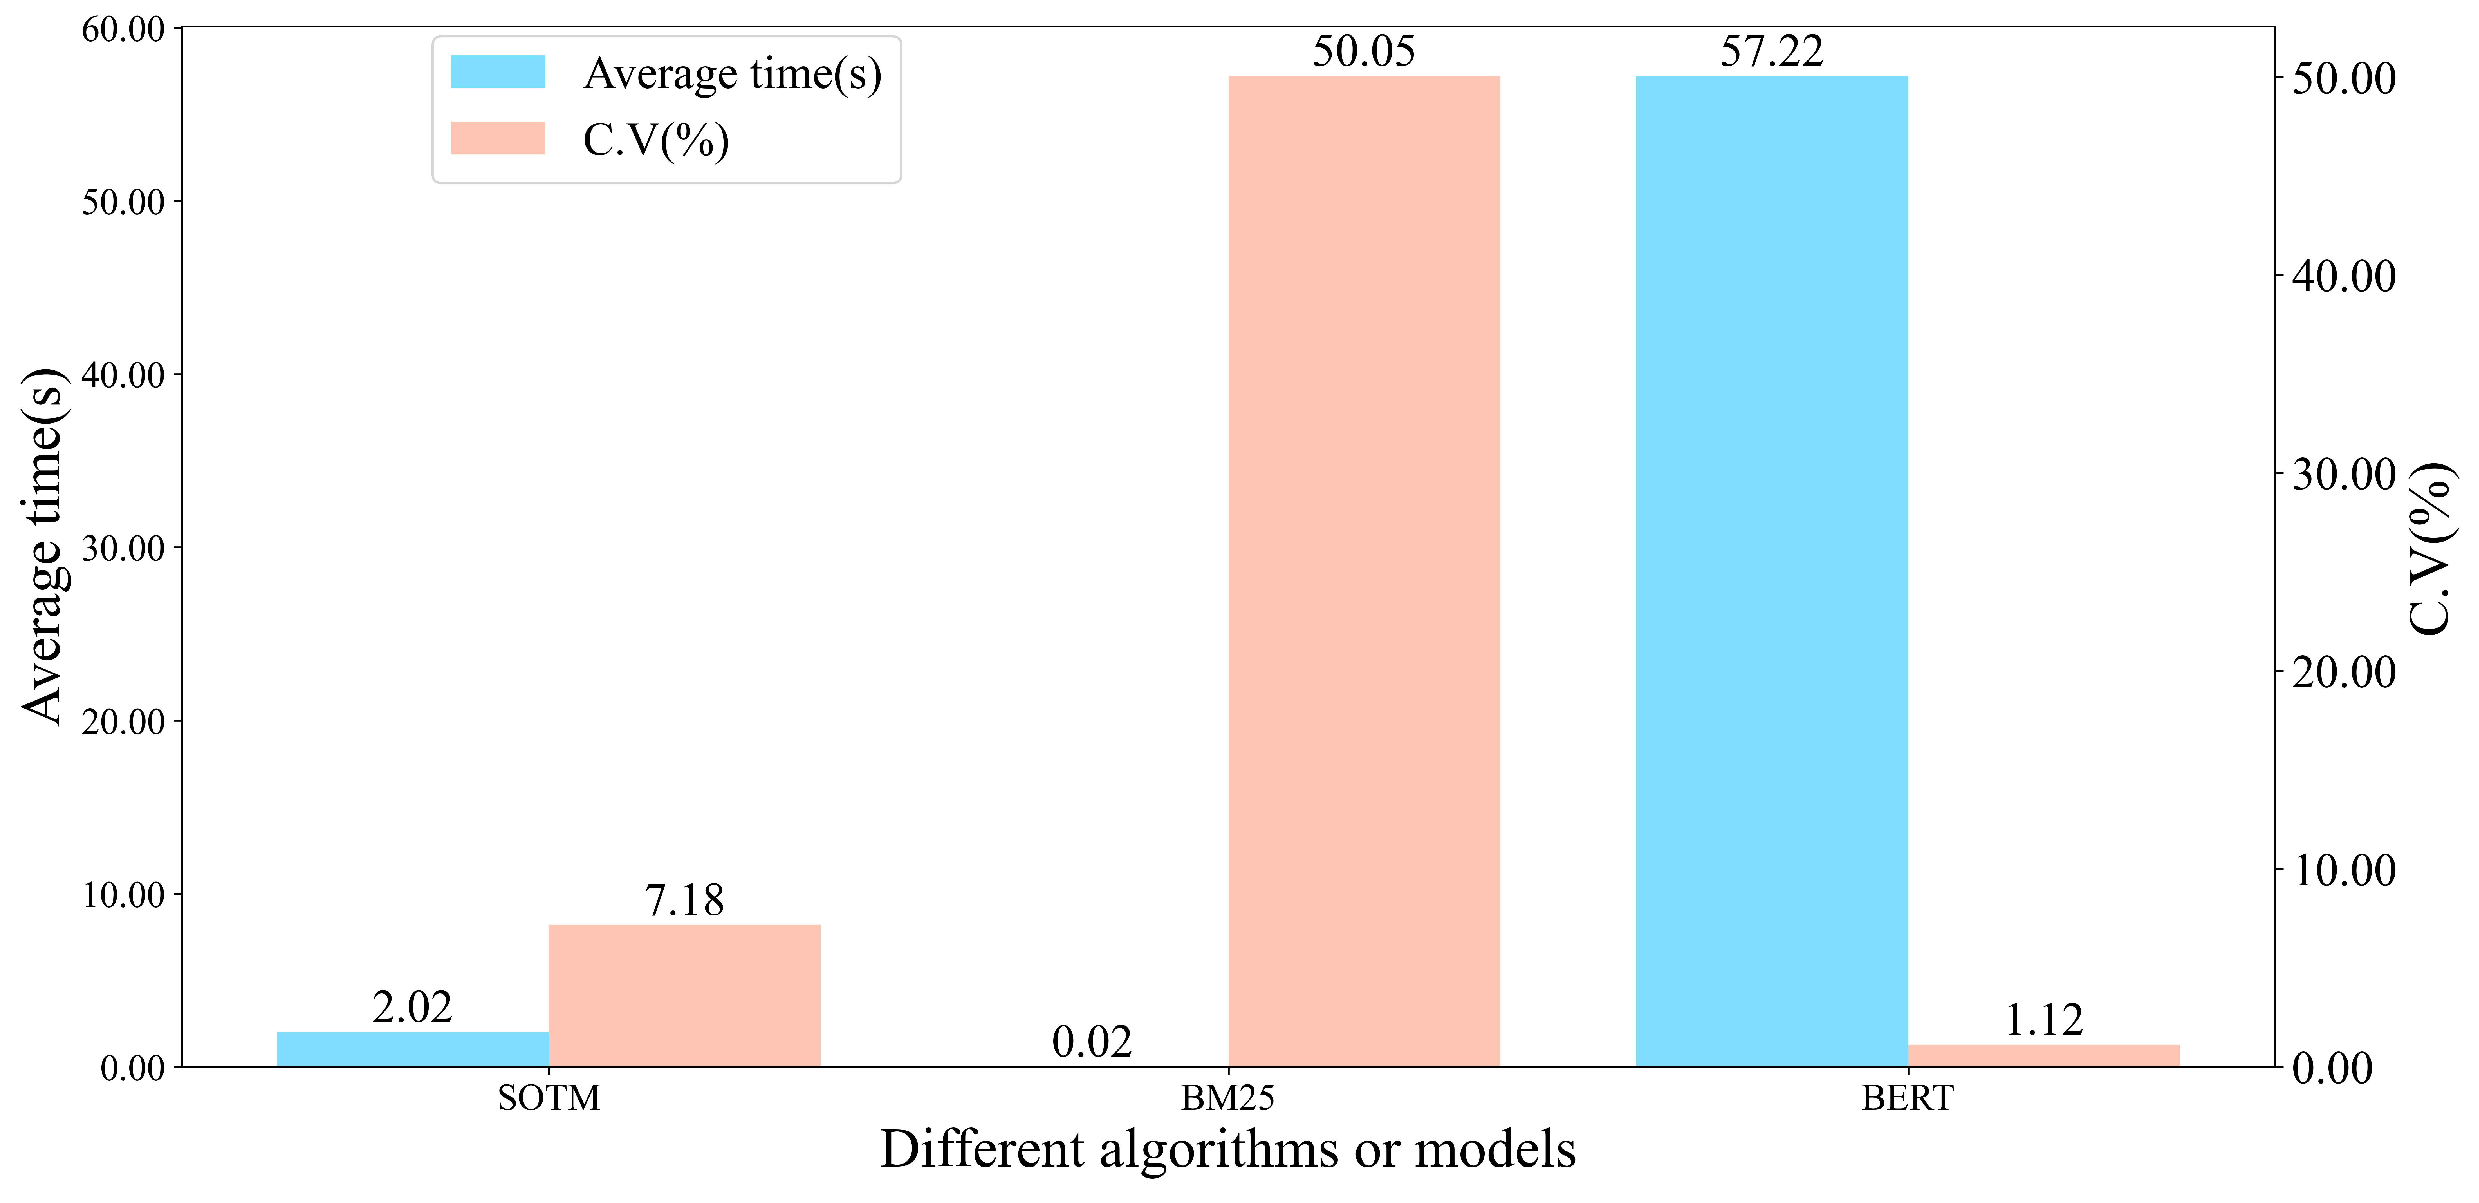
The purpose of this experiment is similar to the retrieval accuracy comparison analysis experiment described above, and the same test set is used for testing. For each algorithm or model, the total time and the time spent on each query are recorded. The start time of the algorithm or model is denoted as . For each query, the time taken to input the query into the algorithm or model is denoted as , and the time taken to return the answer is denoted as . Finally, the end time of the algorithm or model is recorded as . The total retrieval time of each method is obtained by calculating -, and the time for each query is obtained by calculating -. This results in three lists, each containing 386 data points. Table 3 demonstrates the time required for a method to retrieve a response to a query, as well as the total time for the entire retrieval process. Figure 9 shows the average time and processed by different algorithms or methods.
Table 3.
The time it takes for a method to retrieve an answer to a query and all queries.

Figure 9.
Comparison of average time and C.V of different algorithms or models.
It can be seen that when only BM25 algorithm is used, the algorithm is very fast, taking only 0.02 s per problem on average from the figure. This is due to the fact that BM25 algorithm uses a simple and efficient calculation method. It does not involve complex mathematical operations or matrix calculations. In addition, BM25 algorithm calculates the score for each document independently, which reduces the complexity of the calculation. Matching using only BERT model is very slow, taking an average of 57.22 s per problem, which is unacceptable in real life. BERT model uses a deep bidirectional Transformer structure with a large number of parameters, which allows BERT model to take into account more context, but also results in a large amount of computation and memory requirements, which leads to the inefficiency of BERT model. When SOTM algorithm is used, it can be found that the efficiency of SOTM algorithm is also superior. On average, it takes only 2.02 s per problem, which is basically acceptable to us in our daily life. SOTM algorithm first performs word-level matching using BM25 algorithm and selects s (s is 10 in this paper) as the candidate set. In this way, the number of queries faced by BERT model when performing text matching is reduced from 386 to 10, which greatly improves the overall efficiency of the algorithm. The higher the number of initial texts, the more significant the improvement.
It can be found from the figure that the of BM25 algorithm is the highest, reaching 50.05%. We believe that due to the high efficiency of BM25 in matching, the length of queries plays a significant role in the efficiency of the final algorithm, resulting in significant differences in processing time for each problem. The experiment finds that in the slowest case, it takes about 0.044 s to retrieve a query, while in the fastest case, it takes only 0.001 s to retrieve a query. This is not very different in everyday use, so this paper still uses the mean as the expected time for BM25 algorithm to process a single query. Compared to BM25 algorithm, the of SOTM algorithm and BERT model is very small, which is 7.18% and 1.12% respectively. This is because the time spent by these two algorithms or models in task matching is much greater than the time required to process queries of different lengths. For most of the different length querys, the time spent by the two algorithms or models is not significantly different.
5.4. Summary
Through a series of controlled experiments, it can be found that when the candidate set size s is 10, the P@1, P@3, and P@5 values of SOTM algorithm are 88.34%, 94.56%, and 94.56%, respectively, and retrieving an average query takes 2.02 s.
The percentage change in retrieval accuracy can be compared by subtracting the retrieval accuracies of the two algorithms or models. Additionally, the percentage change in velocity can be calculated by employing Equation (5).
where W is the percentage velocity increase. If W is negative, it represents the percentage decrease in velocity. is the velocity of the old model, is the velocity of the new model. The comparison results of SOTM with BM25, BERT respectively at different parameters are given in Table 4. Positive numbers indicate the percentage of improvement and negative numbers indicate the percentage of decrement.
Table 4.
Comparison of SOTM with BM25 and BERT under different parameters.
Compared to using only BM25 algorithm, this is a 13.73% improvement in P@1, a 6.48% improvement in P@3 and a 3.11% improvement in P@5, despite being 100.00% slower in velocity. Compared to using only BERT model, it is 96.47% faster in velocity and 8.81% improvement in P@1, 2.59% improvement in P@3 and 0.78% deterioration in P@5. This demonstrates that SOTM algorithm balances accuracy and efficiency compared to using only a single text matching model. It has high retrieval efficiency along with high retrieval accuracy, especially when the number of returned matching texts K is small.
6. Conclusions
In this paper, by comparing traditional text matching algorithms with deep learning text matching models, a second-order text matching algorithm for agricultural text is introduced. It overcomes the limitations of traditional text matching algorithms, which are limited to character-level or word-level matching, and addresses the drawback of slow retrieval speed in deep learning text matching models. The use of pre-trained models enriches the algorithm with more linguistic information and improves its transferability. This research not only provides a novel perspective for the advancement of text matching in the agricultural domain, but also provides valuable insights into overcoming challenges in practical scenarios. It will expedite applications such as agricultural information retrieval, decision support, knowledge graph construction, and market monitoring, driving the development of agricultural intelligence and facilitating breakthroughs in agricultural research and technology innovation. Future research directions including a deeper exploration in more complex contexts and cross-domain applications of text matching in real-world scenarios are proposed.
Author Contributions
Methodology, Y.S.; writing—original draft preparation, X.S.; data curation, J.H. All authors have read and agreed to the published version of the manuscript.
Funding
This research was supported by Shandong Provincial Natural Science Foundation, China (No. ZR2020MF146), and Open Project Foundation of Intelligent Information Processing Key Laboratory of Shanxi Province (No. CICIP2021002).
Institutional Review Board Statement
Not applicable.
Informed Consent Statement
Not applicable.
Data Availability Statement
The raw data supporting the conclusions of this article will be made available by the authors on request.
Conflicts of Interest
The authors declare no conflicts of interest.
References
- Yao, S. How important is agriculture in China’s economic growth? Oxf. Dev. Stud. 2000, 28, 33–49. [Google Scholar] [CrossRef]
- Lin, C.X.; Ding, B.; Han, J.; Zhu, F.; Zhao, B. Text cube: Computing ir measures for multidimensional text database analysis. In Proceedings of the 2008 8th IEEE International Conference on Data Mining, Pisa, Italy, 15–19 December 2008; IEEE: Piscataway, NJ, USA, 2008; pp. 905–910. [Google Scholar]
- Awasthi, Y. Press “a” for artificial intelligence in agriculture: A review. JOIV Int. J. Inform. Vis. 2020, 4, 112–116. [Google Scholar]
- Buraga, S.C.; Amariei, D.; Dospinescu, O. An owl-based specification of database management systems. Comput. Mater. Contin 2022, 70, 5537–5550. [Google Scholar] [CrossRef]
- Wang, S.; Jiang, J. Learning natural language inference with LSTM. arXiv 2015, arXiv:1512.08849. [Google Scholar]
- Aizawa, A. An information-theoretic perspective of tf–idf measures. Inf. Process. Manag. 2003, 39, 45–65. [Google Scholar] [CrossRef]
- Jakkula, V. Tutorial on support vector machine (svm). Sch. EECS Wash. State Univ. 2006, 37, 3. [Google Scholar]
- Fan, L.; Poh, K.L.; Zhou, P. A sequential feature extraction approach for naïve bayes classification of microarray data. Expert Syst. Appl. 2009, 36, 9919–9923. [Google Scholar] [CrossRef]
- Worachartcheewan, A.; Nantasenamat, C.; Isarankura-Na-Ayudhya, C.; Pidetcha, P.; Prachayasittikul, V. Identification of metabolic syndrome using decision tree analysis. Diabetes Res. Clin. Pract. 2010, 90, e15–e18. [Google Scholar] [CrossRef]
- Zhang, G.; Zeng, Z.; Zhang, S.; Zhang, Y.; Wu, W. SIFT matching with CNN evidences for particular object retrieval. Neurocomputing 2017, 238, 399–409. [Google Scholar] [CrossRef]
- Maknickienė, N. Selection of orthogonal investment portfolio using Evolino RNN trading model. Procedia-Soc. Behav. Sci. 2014, 110, 1158–1165. [Google Scholar] [CrossRef]
- Vaswani, A.; Shazeer, N.; Parmar, N.; Uszkoreit, J.; Jones, L.; Gomez, A.N.; Kaiser, Ł.; Polosukhin, I. Attention is all you need. In Proceedings of the Advances in Neural Information Processing Systems, Long Beach, CA, USA, 4–9 December 2017; Volume 30. [Google Scholar]
- Van Geemert, R. Use of GPT for stabilization and acceleration of search mechanisms in industrial core computations. Ann. Nucl. Energy 2020, 136, 107013. [Google Scholar] [CrossRef]
- Roostaee, M.; Fakhrahmad, S.M.; Sadreddini, M.H. Cross-language text alignment: A proposed two-level matching scheme for plagiarism detection. Expert Syst. Appl. 2020, 160, 113718. [Google Scholar] [CrossRef]
- Dhall, R.; Agrawal, H. An improved energy efficient duty cycling algorithm for IoT based precision agriculture. Procedia Comput. Sci. 2018, 141, 135–142. [Google Scholar] [CrossRef]
- Zhang, J.; Liu, J.; Chen, Y.; Feng, X.; Sun, Z. Knowledge mapping of machine learning approaches applied in agricultural management—A scientometric review with citespace. Sustainability 2021, 13, 7662. [Google Scholar] [CrossRef]
- Bhat, S.A.; Huang, N.F. Big data and ai revolution in precision agriculture: Survey and challenges. IEEE Access 2021, 9, 110209–110222. [Google Scholar] [CrossRef]
- Pang, L.; Lan, Y.Y.; Xu, J.; Guo, J.F.; Wan, S.X.; Cheng, X. A survey on deep text matching. Chin. J. Comput. 2017, 40, 985–1003. [Google Scholar]
- Yao, L.; Pan, Z.; Ning, H. Unlabeled short text similarity with LSTM encoder. IEEE Access 2018, 7, 3430–3437. [Google Scholar] [CrossRef]
- Lai, Y.; Feng, Y.; Yu, X.; Wang, Z.; Xu, K.; Zhao, D. Lattice cnns for matching based chinese question answering. In Proceedings of the AAAI Conference on Artificial Intelligence, Honolulu, HI, USA, 27 January–1 February 2019; Volume 33, pp. 6634–6641. [Google Scholar]
- Chen, L.; Zhao, Y.; Lyu, B.; Jin, L.; Chen, Z.; Zhu, S.; Yu, K. Neural graph matching networks for Chinese short text matching. In Proceedings of the 58th Annual Meeting of the Association for Computational Linguistics, Online, 5–10 July 2020; pp. 6152–6158. [Google Scholar]
- Xia, T.; Wang, Y.; Tian, Y.; Chang, Y. Using prior knowledge to guide bert’s attention in semantic textual matching tasks. In Proceedings of the Web Conference 2021, Virtual, 19–23 April 2021; pp. 2466–2475. [Google Scholar]
- Zhang, K.; Wu, L.; Lv, G.; Wang, M.; Chen, E.; Ruan, S. Making the relation matters: Relation of relation learning network for sentence semantic matching. In Proceedings of the AAAI Conference on Artificial Intelligence, Virtual, 2–9 February 2021; Volume 35, pp. 14411–14419. [Google Scholar]
- Lyu, B.; Chen, L.; Zhu, S.; Yu, K. Let: Linguistic knowledge enhanced graph transformer for chinese short text matching. In Proceedings of the AAAI Conference on Artificial Intelligence, Virtual, 2–9 February 2021; Volume 35, pp. 13498–13506. [Google Scholar]
- Tang, X.; Luo, Y.; Xiong, D.; Yang, J.; Li, R.; Peng, D. Short text matching model with multiway semantic interaction based on multi-granularity semantic embedding. Appl. Intell. 2022, 52, 15632–15642. [Google Scholar] [CrossRef]
- Severyn, A.; Moschitti, A. Learning to rank short text pairs with convolutional deep neural networks. In Proceedings of the 38th International ACM SIGIR Conference on Research and Development in Information Retrieval, Santiago, Chile, 9–13 August 2015; pp. 373–382. [Google Scholar]
- Pang, L.; Lan, Y.; Guo, J.; Xu, J.; Wan, S.; Cheng, X. Text matching as image recognition. In Proceedings of the AAAI Conference on Artificial Intelligence, Phoenix, AZ, USA, 12–17 February 2016; Volume 30, pp. 2793–2799. [Google Scholar]
- Yin, W.; Schütze, H.; Xiang, B.; Zhou, B. Abcnn: Attention-based convolutional neural network for modeling sentence pairs. Trans. Assoc. Comput. Linguist. 2016, 4, 259–272. [Google Scholar] [CrossRef]
- Chen, Q.; Zhu, X.; Ling, Z.; Wei, S.; Jiang, H.; Inkpen, D. Enhanced LSTM for natural language inference. arXiv 2016, arXiv:1609.06038. [Google Scholar]
- Wang, Z.; Hamza, W.; Florian, R. Bilateral multi-perspective matching for natural language sentences. arXiv 2017, arXiv:1702.03814. [Google Scholar]
- Wang, H.; Zhu, H.; Wu, H.; Wang, X.; Han, X.; Xu, T. A Densely Connected GRU Neural Network Based on Coattention Mechanism for Chinese Rice-Related Question Similarity Matching. Agronomy 2021, 11, 1307. [Google Scholar] [CrossRef]
- Zhou, H.; Guo, X.; Liu, C.; Tang, Z.; Lu, S.; Li, L. Question Similarity Measurement of Chinese Crop Diseases and Insect Pests Based on Mixed Information Extraction. KSII Trans. Internet Inf. Syst. 2021, 15, 3992–4010. [Google Scholar]
- Liu, Z.; Wang, X.; Wu, H.; Wang, H.; Xu, T. Research on rice question-and-sentence similarity matching method based on BiLSTM-CNN. J. Chin. Agric. Mech. 2022, 43, 125. [Google Scholar] [CrossRef]
- Jin, N.; Zhao, C.; Wu, H.; Miao, Y.; Wang, H.; Yang, B. Agricultural Short Text Matching Technology Based on Multi-semantic Features. Trans. Chin. Soc. Agric. Mach. 2022, 53, 325–331. [Google Scholar]
- Wang, H.; Wang, X.; Miao, Y.; Xu, T.; Liu, Z.; Wu, H. Densely connected BiGRU neural network based on BERT and attention mechanism for Chinese agriculture-related question similarity matching. Trans. Chin. Soc. Agric. Mach. 2022, 53, 244–252. [Google Scholar]
- Pan, Y.; Sun, J.; Yu, H.; Bai, G.; Ge, Y.; Luck, J.; Awada, T. Transforming Agriculture with Intelligent Data Management and Insights. In Proceedings of the 2023 IEEE International Conference on Big Data, Sorrento, Italy, 15–18 December 2023. [Google Scholar]
- Devlin, J.; Chang, M.W.; Lee, K.; Toutanova, K. Bert: Pre-training of deep bidirectional transformers for language understanding. arXiv 2018, arXiv:1810.04805. [Google Scholar]
- Yang, H. Bert meets chinese word segmentation. arXiv 2019, arXiv:1909.09292. [Google Scholar]
- Zhang, C. Improved Word Segmentation System for Chinese Criminal Judgment Documents. Appl. Artif. Intell. 2024, 38, 2297524. [Google Scholar] [CrossRef]
- Yang, C.; Wang, S.; Li, Y.; Yang, C.; Yan, M.; Zhang, J.; Lin, F. CoRe: An Efficient Coarse-refined Training Framework for BERT. arXiv 2020, arXiv:2011.13633. [Google Scholar]
- Liu, X.; Chen, Q.; Deng, C.; Zeng, H.; Chen, J.; Li, D.; Tang, B. Lcqmc: A large-scale chinese question matching corpus. In Proceedings of the 27th International Conference on Computational Linguistics, Santa Fe, NM, USA, 20–26 August 2018; pp. 1952–1962. [Google Scholar]
- Rau, D.; Kamps, J. How different are pre-trained transformers for text ranking? In Proceedings of the European Conference on Information Retrieval, Stavanger, Norway, 10–14 April 2022; Springer: Berlin/Heidelberg, Germany, 2022; pp. 207–214. [Google Scholar]
Disclaimer/Publisher’s Note: The statements, opinions and data contained in all publications are solely those of the individual author(s) and contributor(s) and not of MDPI and/or the editor(s). MDPI and/or the editor(s) disclaim responsibility for any injury to people or property resulting from any ideas, methods, instructions or products referred to in the content. |
© 2024 by the authors. Licensee MDPI, Basel, Switzerland. This article is an open access article distributed under the terms and conditions of the Creative Commons Attribution (CC BY) license (https://creativecommons.org/licenses/by/4.0/).