Abstract
The purpose of this research is to investigate the differences in specific GPS variables related to the running performance of amateur football players, comparing data over 15 min periods of time throughout the match, as well as examining differences between players of different positions. The participants are adult male amateur football players from the same team. The analysis of the players’ performance was carried out using GPS transmitters over twelve league matches (Amateur Division A) for all starting players (except the goalkeeper) who completed the match without being substituted. The formation was 1-4-3-3, and the players were divided into five categories: Central Defenders (CDs), Full Backs (FBs), Central Midfielders (CMs), Wingers (Ws), and Center Forwards (FWs). Each match was divided into two halves and into periods of fifteen minutes. The analysis concerns the total distance covered within these time periods and in different speed zones. The results showed that CDs covered the shortest distance (p < 0.05), while CMs and Ws covered the longest (p < 0.05) in the most of the 15 min time periods. In both halves, it was observed that players covered greater distances at low intensity in the last 15-min periods. Finally, the total distance covered at low intensity was greater in the last 15-min period of the 2nd half compared to that of the 1st half. As footballers’ loads vary based on their playing position, the data from this study warrant extensive consideration for better training planning.
1. Introduction
Football is a particularly popular sport involving millions of athletes, but it is simultaneously watched by billions of spectators [1]. Its popularity results in attracting significant financial investments, part of which is used to further enhance the players’ performance to make the sport even more spectacular. Notably, in recent decades, technologies such as video analysis and tracking of athletes’ performance have become integral parts of team training processes. Additionally, the increased number of scientific studies on the use of these technologies reflects the significant interest of the sports science community in improving performance [2,3,4,5].
As mentioned earlier, one such technology that has emerged in recent decades is the Global Positioning System (GPS). The use of these devices enables direct recording, even in real time, of the external loads experienced by footballers, with some devices also incorporating heart rate monitors to provide information on internal loads. Sports scientists utilize these devices to create individual player profiles, allowing for personalized training loads aimed at both performance improvement [6] and injury prevention [7]. Furthermore, live tracking informs coaching staff when a player approaches performance limits. Another aspect monitored by sports scientists using GPS is the variation in external load at different time intervals during a match [8,9,10] with a common observation being a decrease in running performance in the second half compared to the first [4]. Studies have also examined running performance in shorter time intervals during matches (e.g., 15 min or 5 min periods) [8,9,10].
Moreover, GPS technology allows sports scientists to assess how external load differs based on a player’s position and the formation in which the team plays [11,12]. Interestingly, players in the same position can experience different external loads depending on the tactical formation. This information could potentially influence both training strategies and player selection for specific formations.
From the literature, it appears that central midfielders cover the greatest distance during matches [4,13]. Additionally, wide midfielders (WMs) and fullbacks cover the greatest distance at high intensity and in sprints [14,15]. The formation used by a team can influence a player’s external load [16]; for example, players in a 1-4-5-1 formation cover more distance at high intensity compared to a 1-3-5-2 formation. Other studies have observed that defenders in formations like 1-4-3-3 and 1-4-5-1 cover more total distance and distance at high intensity compared to a 1-4-4-2 formation [17]. Furthermore, central midfielders in a 1-4-2-3-1 formation appear to cover more distance at high intensity and perform more accelerations compared to other formations [18,19]. Another factor that can affect running performance is the formation of the opposing team.
Overall, the studies examining the impact on footballers’ running performance in different playing positions and specific formations are limited. Even fewer studies consider these factors across different time periods within matches.
This study was a part of a larger study investigating internal and external load on amateur football players [12]. The aim of this research is to investigate the differences arising from the analysis of GPS data in the distance covered by amateur football players according to their playing position, speed zone, and 15 min intervals during the 90 min (including stoppage time) of a match in the 1-4-3-3 team formation.
This study will provide very useful data regarding the analysis of the aforementioned external load parameters across all positions in the 1-4-3-3 formation. Additionally, it will identify whether there is a specific time interval during which performance peaks or significantly declines.
According to the existing literature, which primarily concerns professional soccer players, we hypothesize that (a) the greatest total distance and high-intensity distance will be covered during the first and fourth 15 min periods (after the halftime break), (b) a decline in performance will be observed in the final time periods, (c) center defenders (CDs) will exhibit the lowest running performance, and (d) players in wide positions of the formation will show the best running performance during 15 min periods.
2. Materials and Methods
2.1. Subjects
Data were collected from 18 adult male amateur football players (age 20.6 ± 2.4; training age 11.6 ± 3.4, body fat 16.7 ± 3.1) belonging to the same team (4th Greek Division). The players trained 4 times a week and played one league match per week. The study included all the matches from the team’s first round. Matches were excluded if (a) any player (regardless of the team) received a red card, (b) the formation was changed for some duration, or (c) weather conditions affected the match (e.g., heavy rain). After this selection, 12 out of the total 14 matches were included in the study. The players included in the study were those who completed the full 90 min of the match in the same playing position. Goalkeepers were not included in the study. The team competed in a 1-4-3-3 formation, and the players were divided into five categories according to their position: Central Defenders (CDs), Fullbacks (FBs), Central Midfielders (CMs), Wingers (Ws), and Forwards (FWs). The football players were informed about the study and signed a consent form. The local Institutional Review Board approved the study (approval number 179/2023) in the spirit of the Helsinki Declaration
2.2. Anthropometric Measurements
The calculation of anthropometric parameters (weight, height, BMI) and body composition analysis (skinfold measurements) was conducted simultaneously for all players. Body mass and height (with light sportswear and without shoes) were measured using an electronic scale with an integrated stadiometer (Seca 220e, Hamburg, Germany) with an accuracy of 0.1 kg and 0.5 cm, respectively. For the skinfold measurements, a skinfold caliper (Lange, Beta Technology, Santa Cruz, CA, USA) was used to measure the thickness of subcutaneous fat at four skinfold sites (biceps, triceps, subscapular, suprailiac). For measuring the skinfolds of the football players, we used the guidelines described by Slaughter et al. (1988) [20]. For the calculation of body fat, Siri’s [21] equation was used after first calculating body density with Durnin’s and Rahaman’s equation (1967) [22].
2.3. External Load
We used the following parameters of external load used in the study:
- Zone 1: 0.1–7.19 km/h (rest, walking)—low intensity;
- Zone 2: 7.2–14.39 km/h (jogging)—moderate intensity;
- Zone 3: 14.4–19.79 km/h (running)—high intensity;
- Zone 4: 19.8–25.19 km/h (fast running)—high intensity;
- Zone 5: ≥25.2 km/h (sprinting)—very high intensity.
For their measurement, the Polar Team Pro equipment (Global Positioning System, 10 Hz Polar Team Pro, Kempele, Finland) was used. Familiarization with the equipment was conducted in a friendly match during the pre-season period.
2.4. Time Intervals Used in the Study
During the analysis, each match was divided into two halves and into 15 min time intervals:
- 1st Half: 1st–15th min;
- 1st Half: 16th–30th min;
- 1st Half: 31st–45th min + stoppage time;
- 2nd Half: 46th–60th min;
- 2nd Half: 61st–75th min;
- 2nd Half: 76th–90th min + stoppage time.
2.5. External Load Variables
With the data collected from each match, comparisons were made among different player positions, focusing on the following variables:
- Total distance covered (and in each speed zone) per 15 min time interval of the 1st half;
- Total distance covered (and in each speed zone) per 15 min time interval of the 2nd half;
- Total distance covered (and in each speed zone) per corresponding 15 min time interval between the two halves (e.g., 1st–15th min compared to 46th–60th min, etc.).
2.6. Statistical Analysis
For the statistical analysis, SPSS software (Statistics for Windows, Version 25.0. Armonk, NY, USA: IBM Corp) was used. Initially, the Shapiro–Wilk test was applied to check the normal distribution of the data. The test results indicated that parametric statistical tests could be used. A repeated measures analysis of variance (GLM Repeated Measures ANOVA) was used to compare the running performance between playing positions. When significant differences were observed, the post hoc Bonferroni test was applied. To examine the differences between the two halves of the match, Student’s dependent t-test for paired samples was used. Partial eta squared values were reported, which were categorized as small (0.01–0.059), moderate (0.06–0.137), and large (>0.138) according to Cohen (1988) [23]. The level of statistical significance was set at p < 0.05.
3. Results
3.1. Total Distance Covered (and in Each Speed Zone) per 15 min Time Interval of the 1st and 2nd Half
Statistical analysis revealed significant differences between the 15 min intervals of the halves. The differences are presented in Figure 1 and Figure 2. Also, the p values of each difference are presented in Table 1.
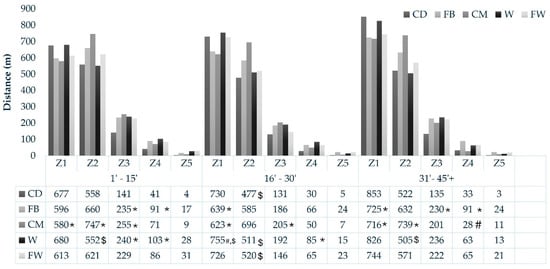
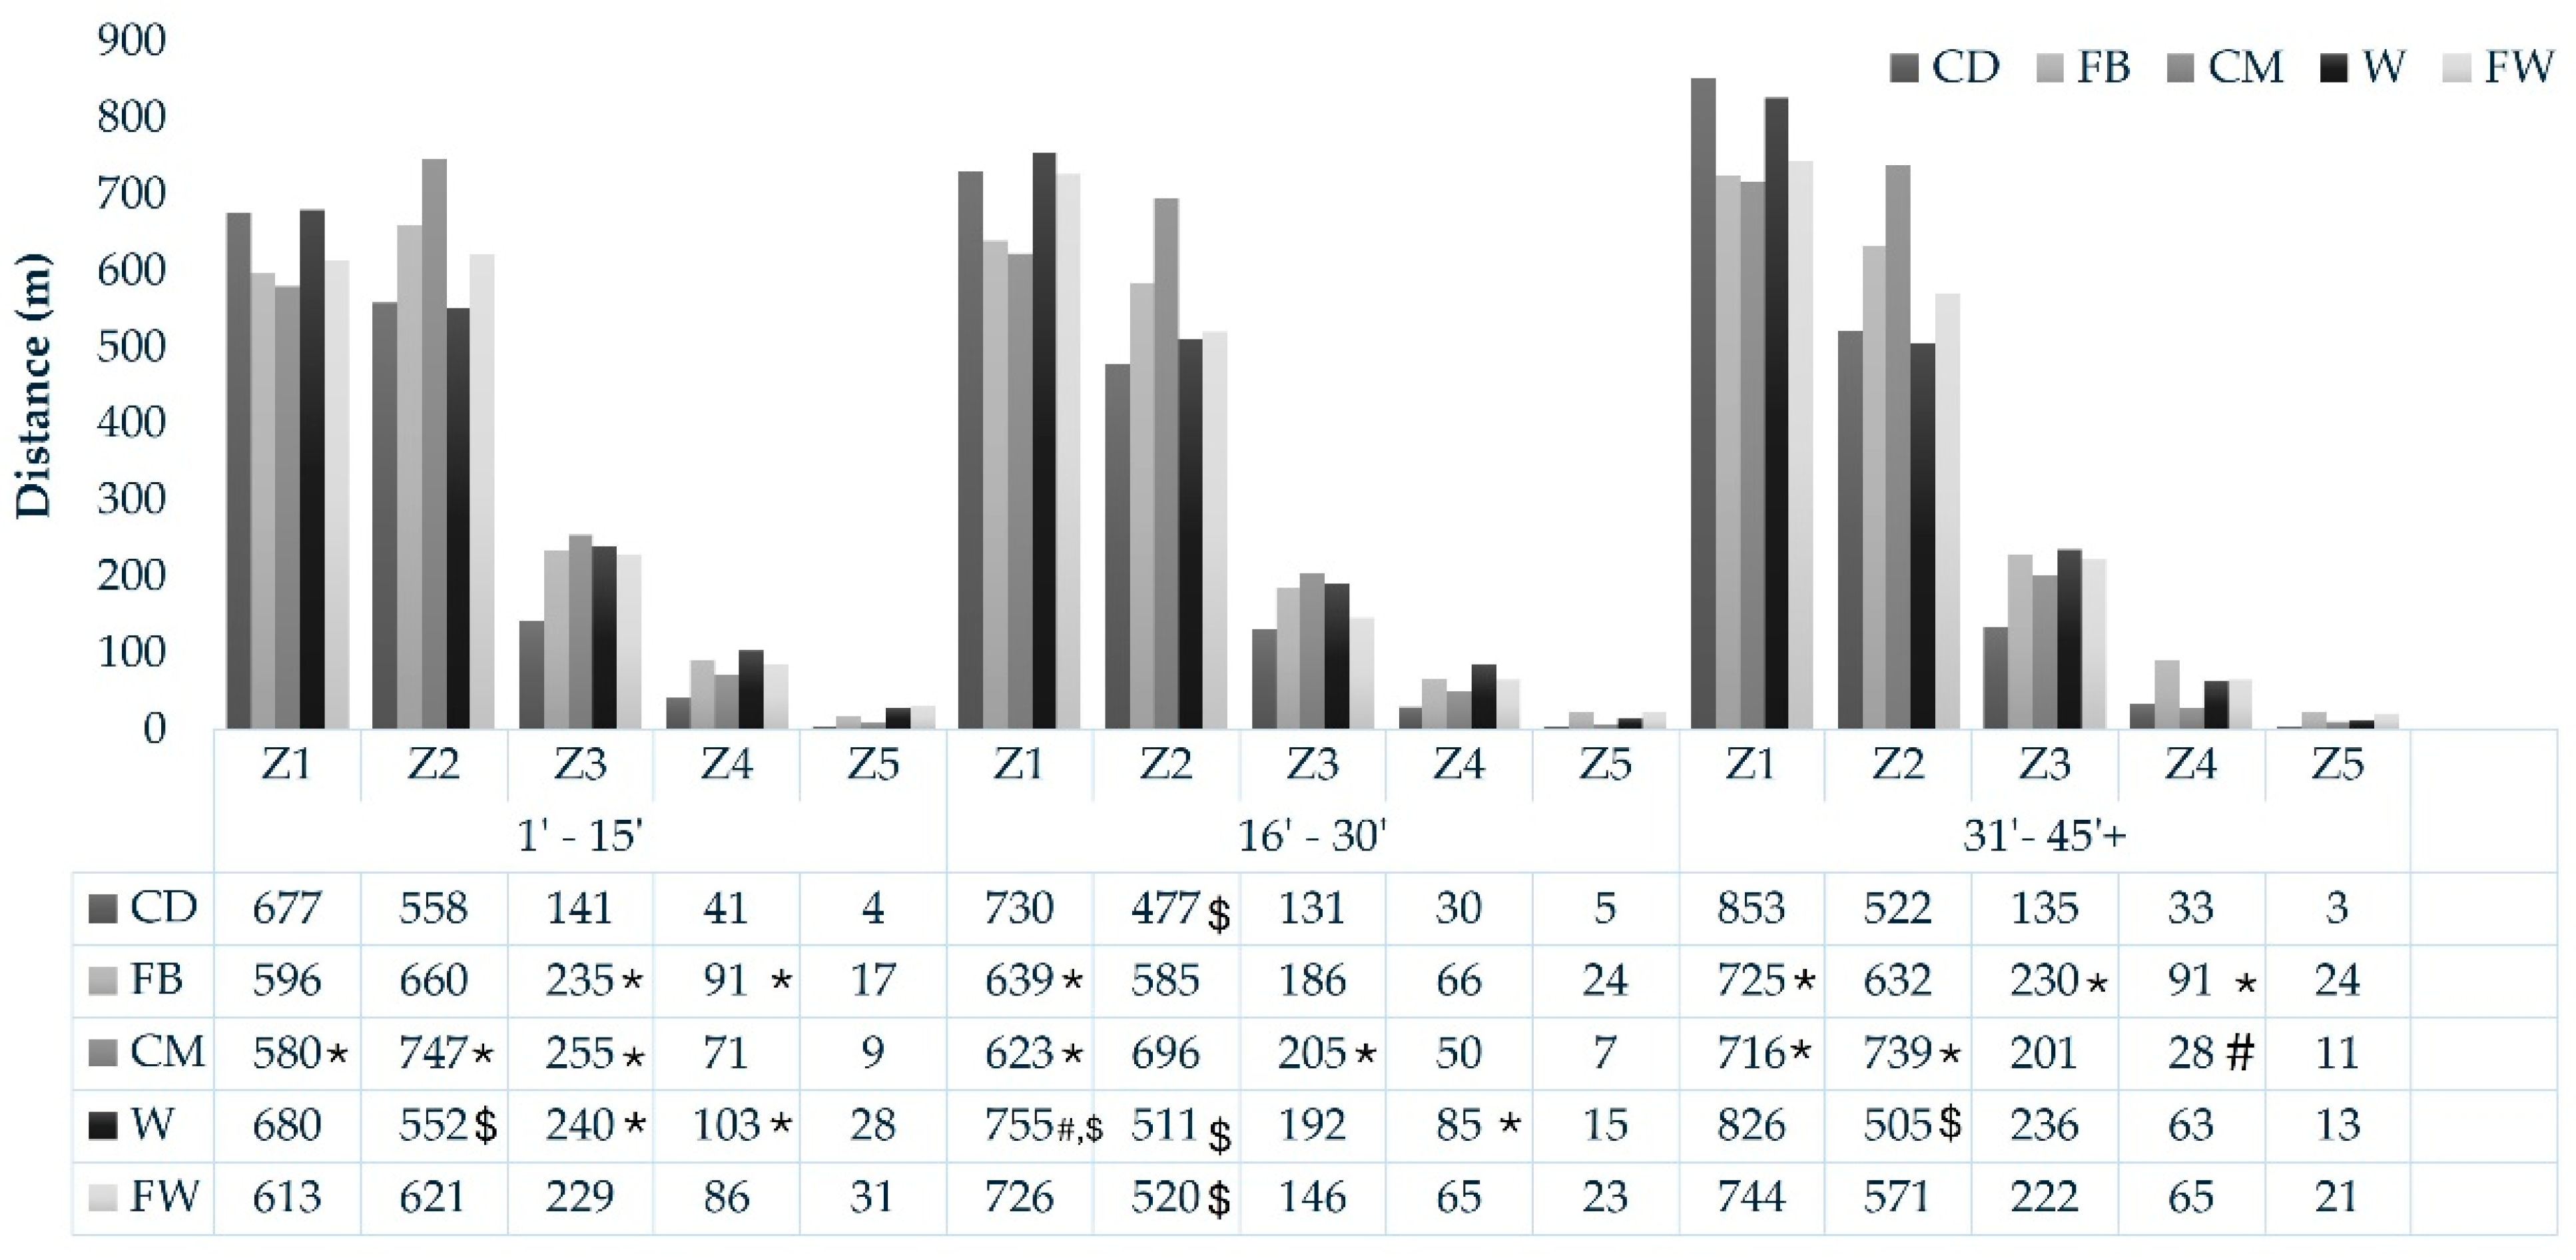
Figure 1.
Total distance covered per position, in each speed zone and per 15 min time interval of the 1st half. Central Defender (CD), Fullback (FB), Central Midfielder (CM), Winger (W), and Forward (FW). * denotes significant difference with CD (p < 0.05); # denotes significant difference with FB (p < 0.05); $ denotes significant difference with CM (p < 0.05); Ζ1, Zone 1: 0.1–7.19 km/h; Z2, Zone 2: 7.2–14.39 km/h; Z3, Zone 3: 14.4–19.79 km/h; Z4, Zone 4: 19.8–25.19 km/h; Z5, Zone 5: ≥25.2 km/h.
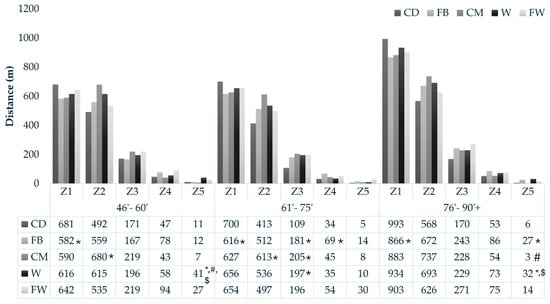
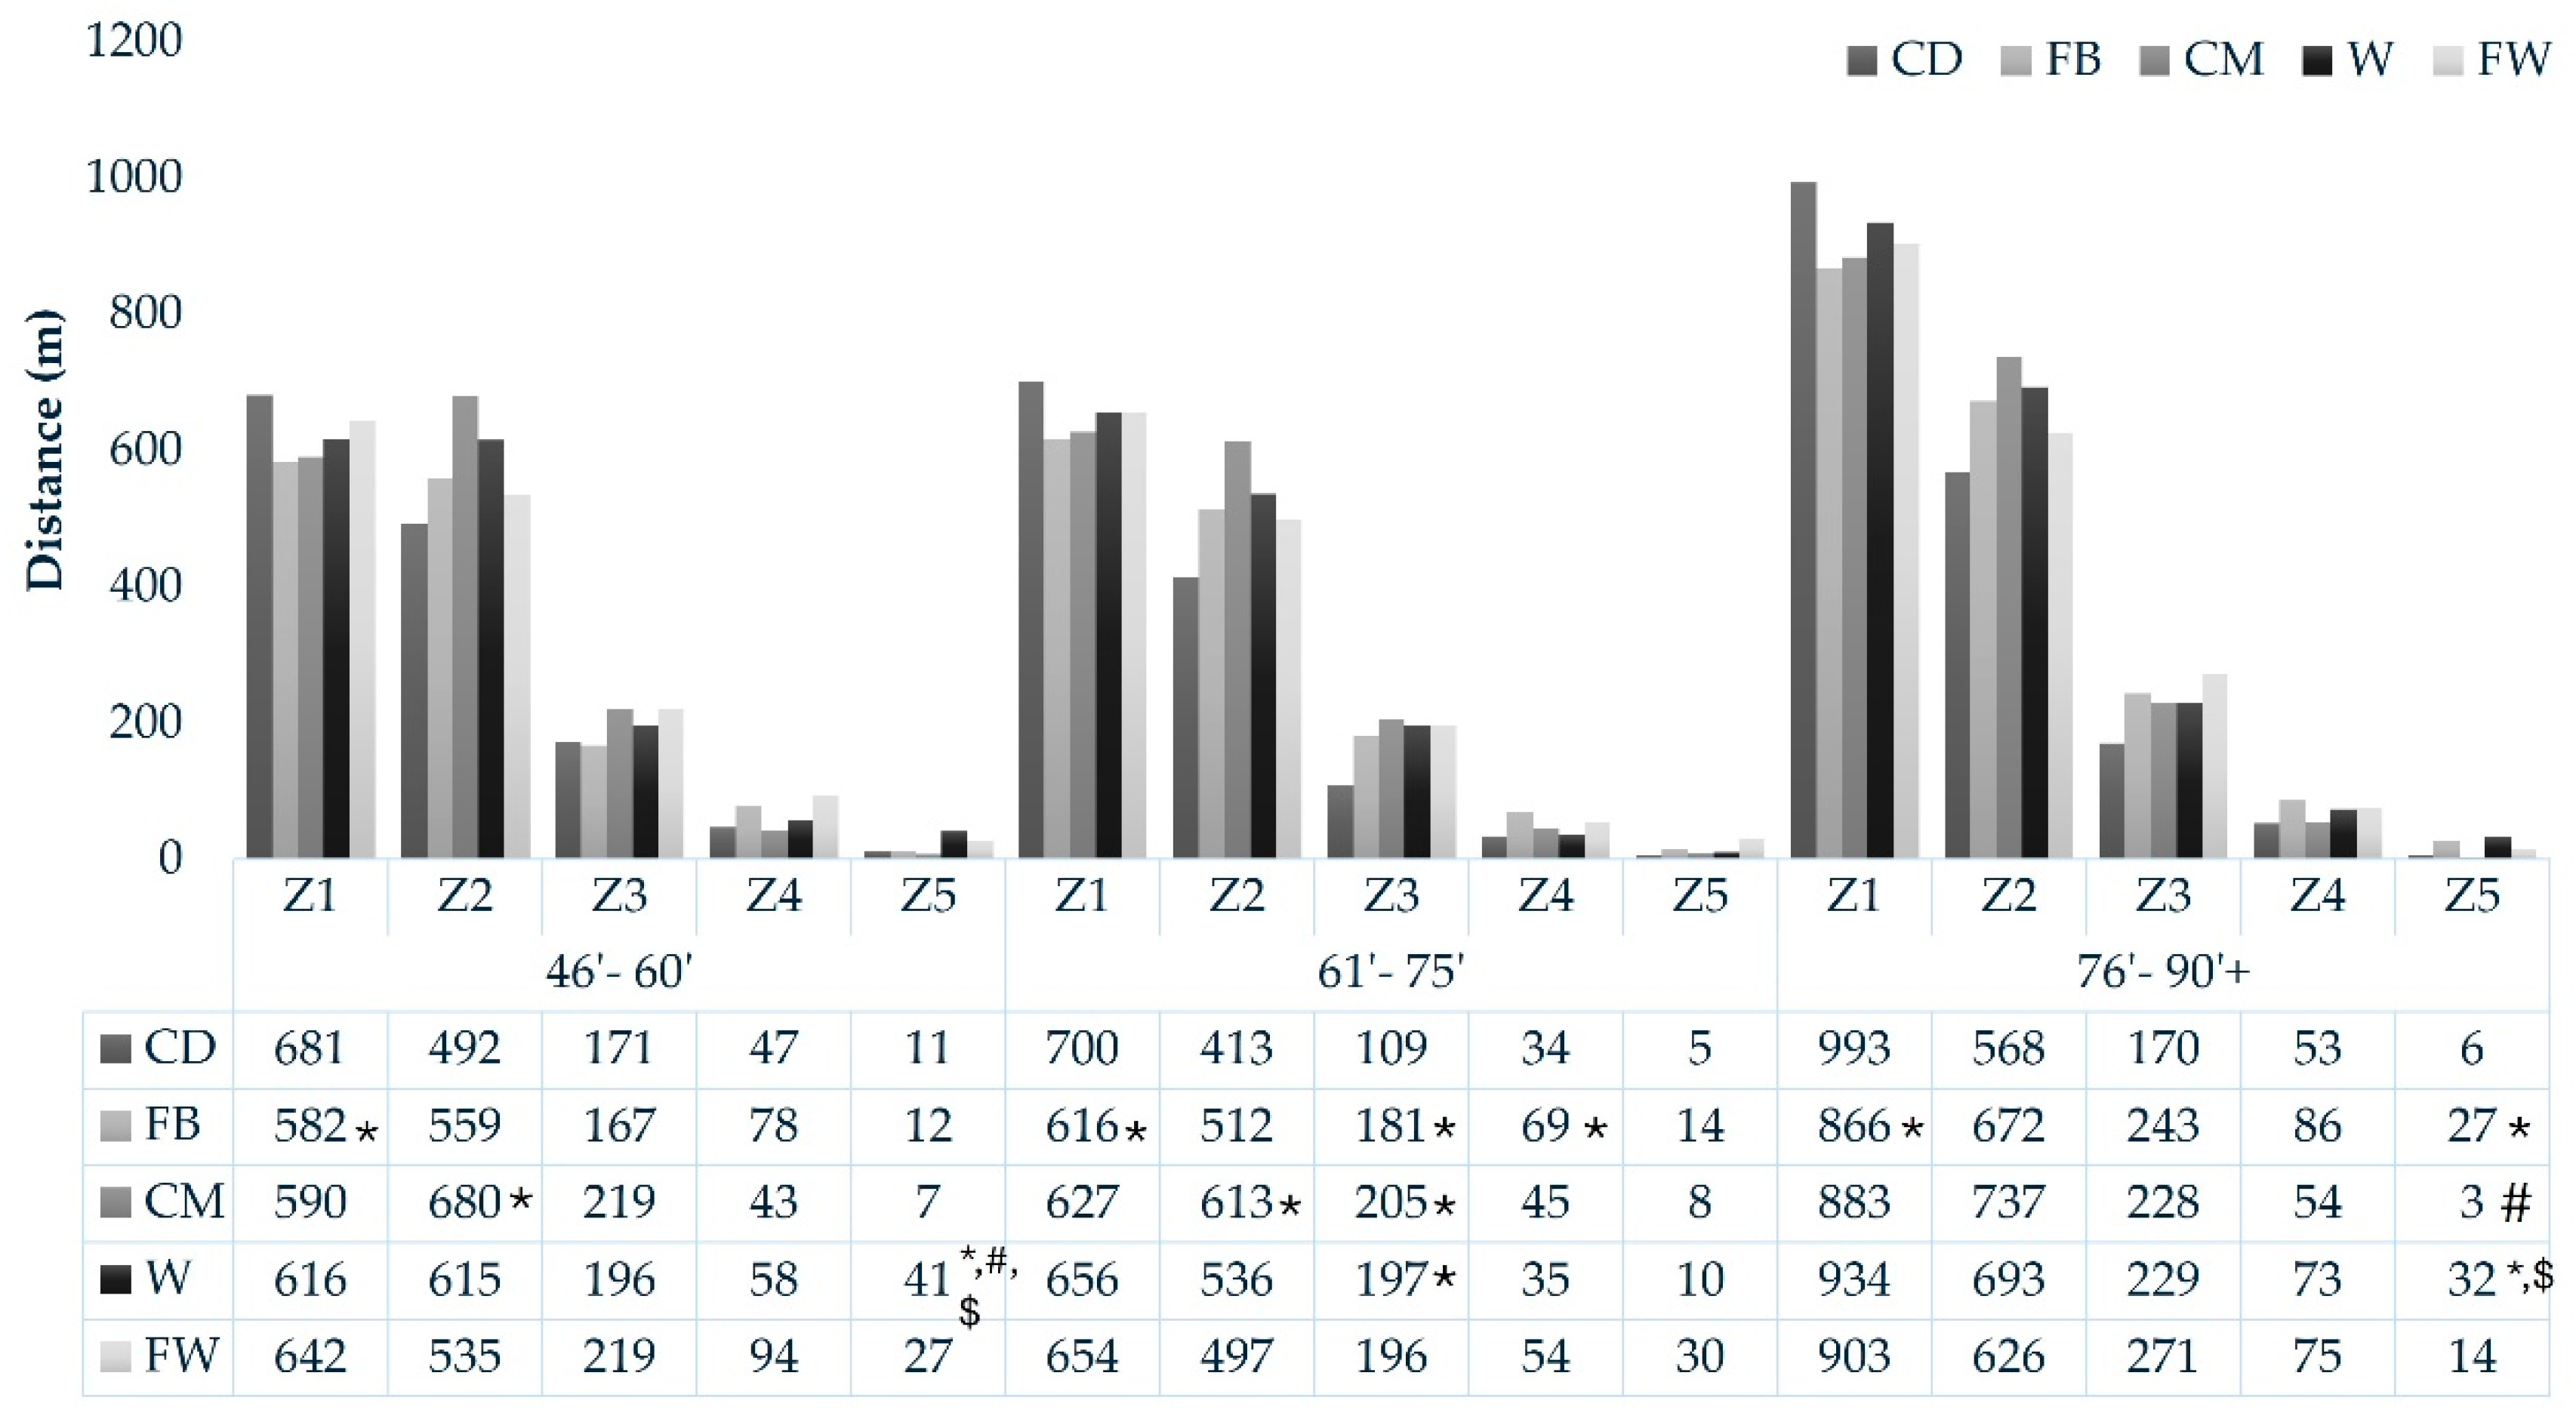
Figure 2.
Total distance covered per position in each speed zone and per 15 min time interval of the 2nd half. Central Defender (CD), Fullback (FB), Central Midfielder (CM), Winger (W), and Forward (FW). * denotes significant difference with CD (p < 0.05); # denotes significant difference with FB (p < 0.05); $ denotes significant difference with CMs (p < 0.05); Ζ1, Zone 1: 0.1–7.19 km/h; Z2, Zone 2: 7.2–14.39 km/h; Z3, Zone 3: 14.4–19.79 km/h; Z4, Zone 4: 19.8–25.19 km/h; Z5, Zone 5: ≥25.2 km/h.

Table 1.
Statistical p values of differences between positions per zone and per 15 min time period.
3.2. Total Distance Covered (and in Each Speed Zone) per Corresponding 15 min Time Interval between the Two Halves
The differences observed from the statistical analysis regarding the differences for each position in each speed zone during the 15 min periods are presented in Figure 3 and Figure 4. Also, the p values of each difference are presented in Table 2.
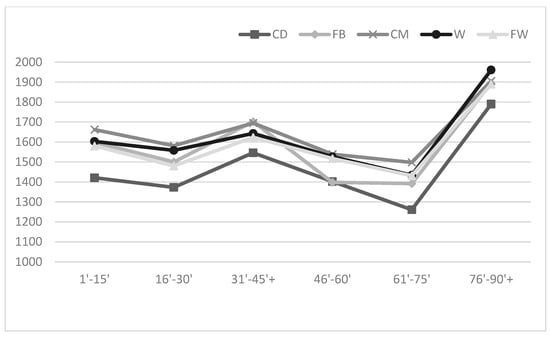
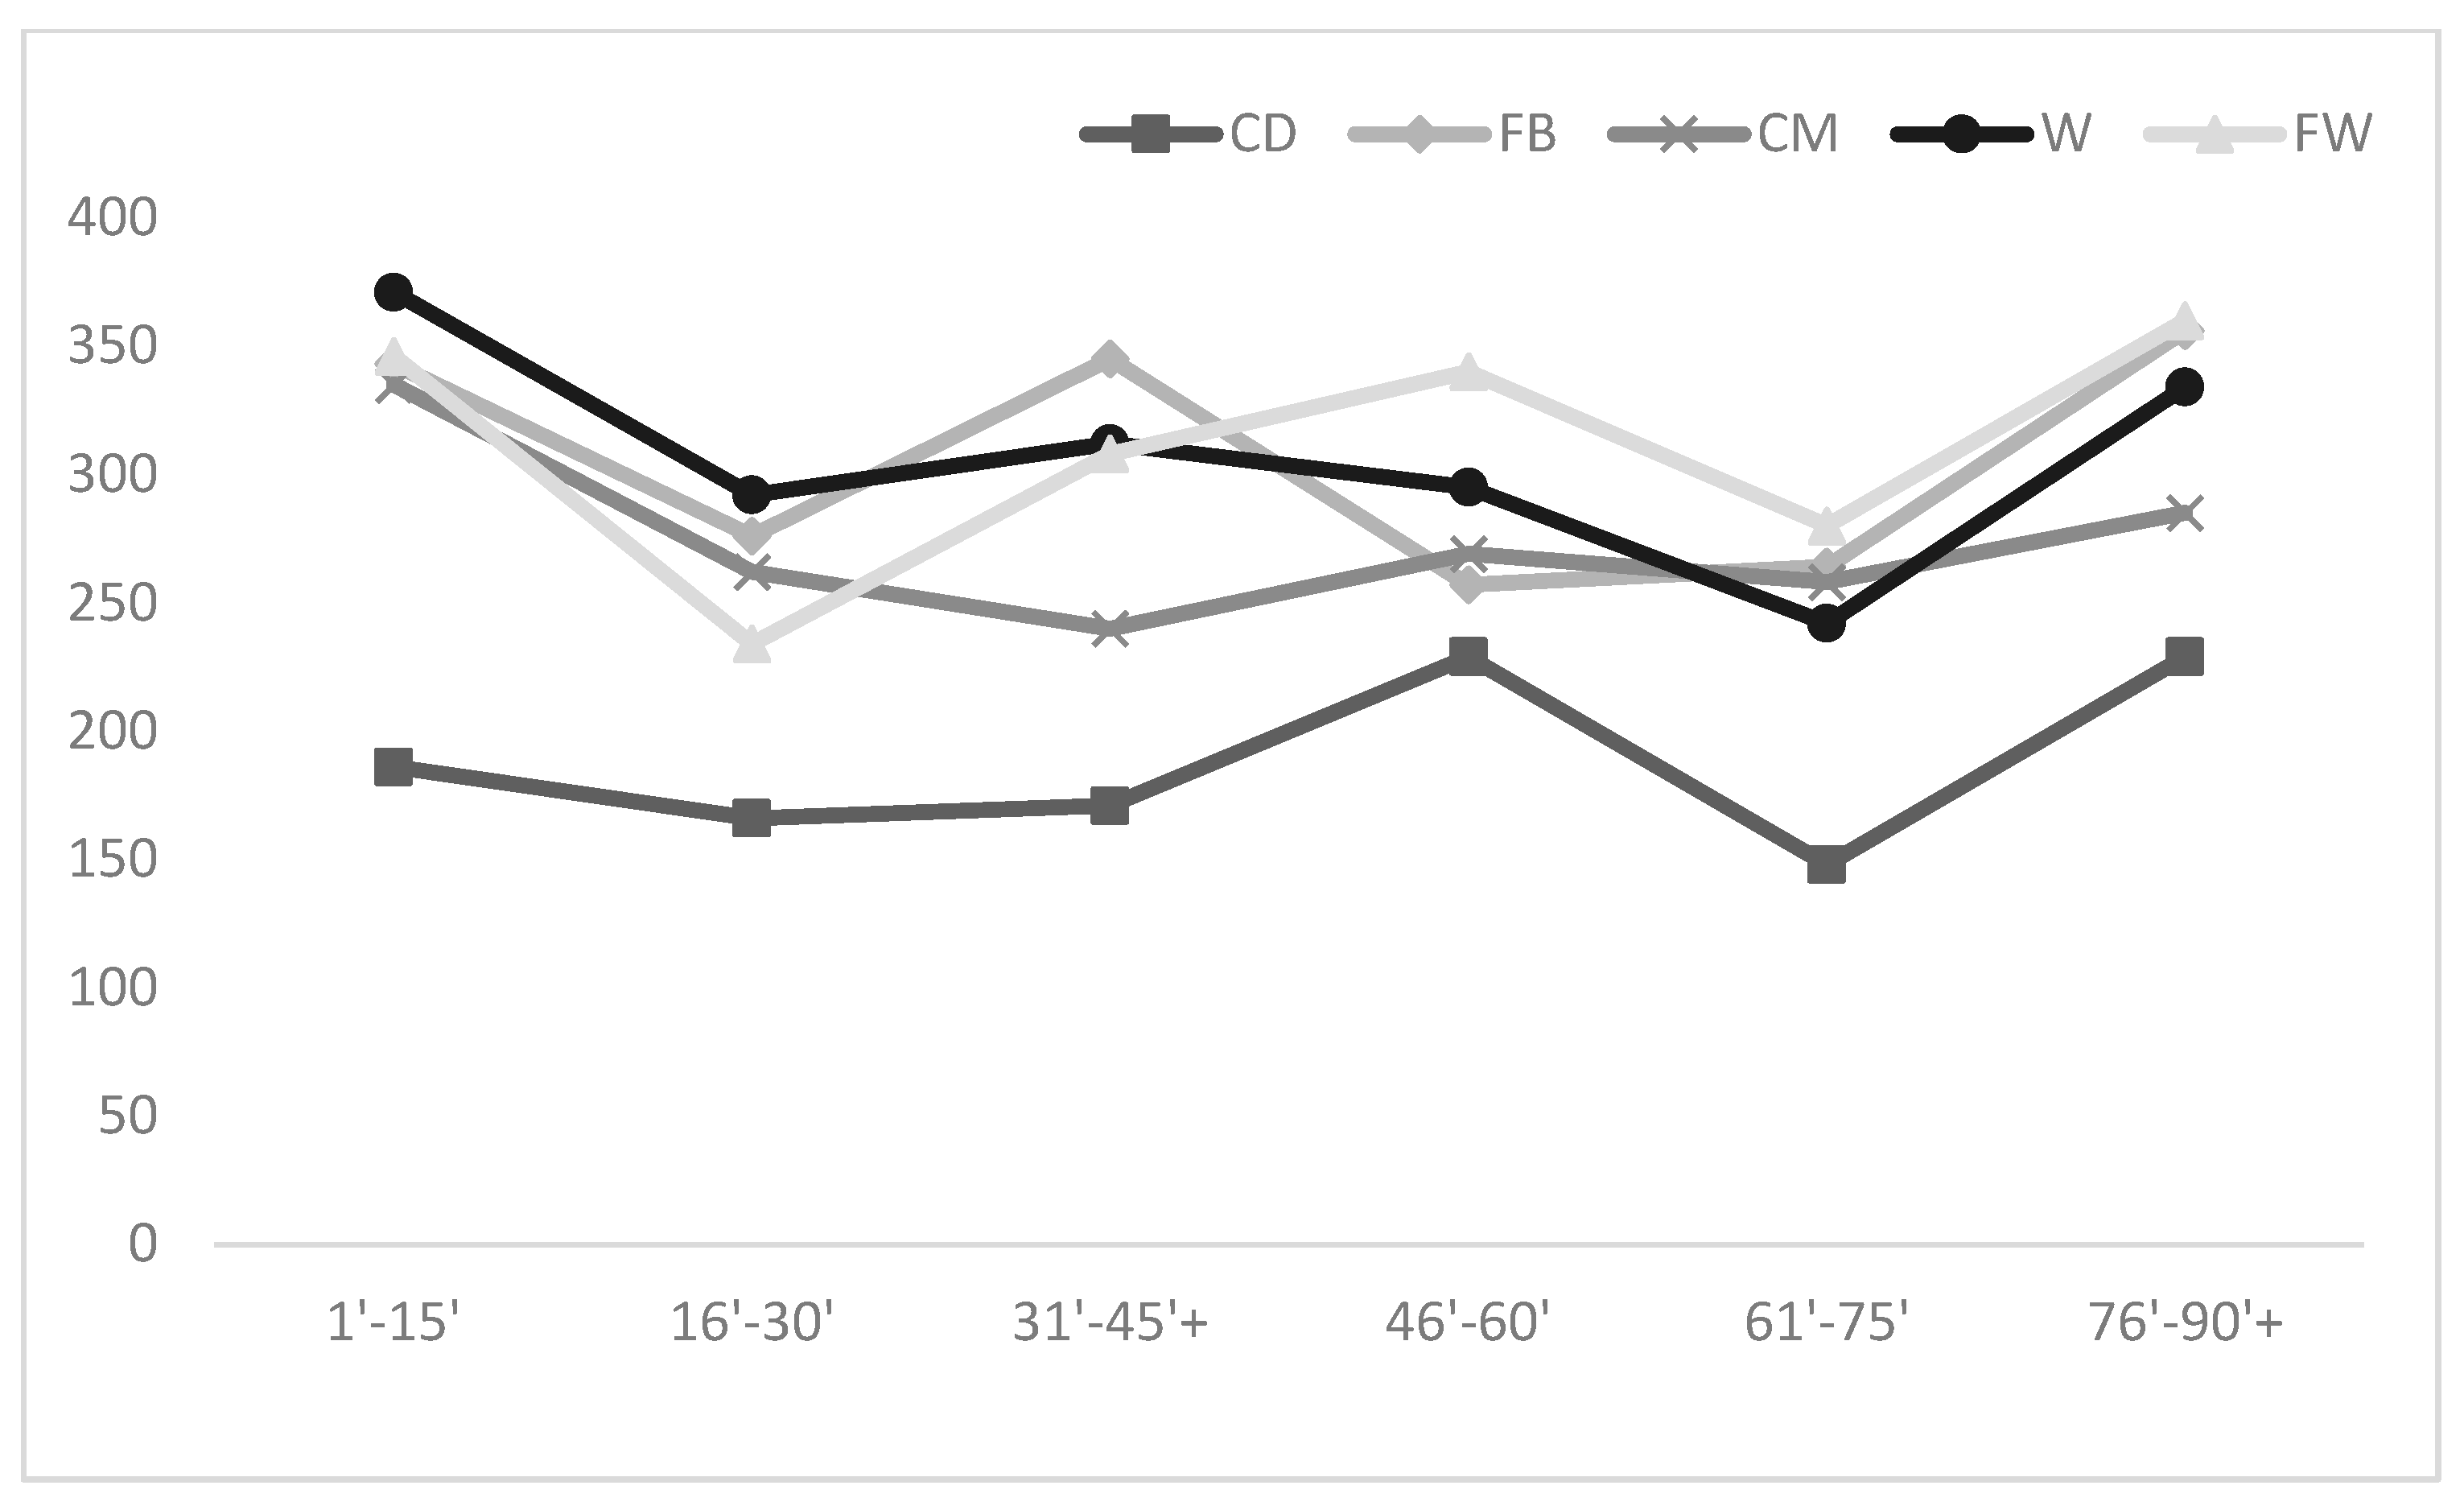
Figure 3.
Total distance covered per position, and per 15 min time interval. Central Defender (CD), Fullback (FB), Central Midfielder (CM), Winger (W), and Forward (FW).

Figure 4.
Total high speed distance covered per position, and per 15 min time interval. Central Defender (CD), Fullback (FB), Central Midfielder (CM), Winger (W), and Forward (FW).
Table 2.
The p values of differences observed for each position in each zone during the 15 min time periods.
4. Discussion
The purpose of the research was to investigate the differences between players in different positions in a 1-4-3-3 formation regarding the total distance covered per speed zone and per 15-min interval. The results showed that most of our hypotheses were confirmed. Specifically, a decline in performance was observed during the first two 15 min periods of the second half: center defenders (CDs) exhibited the lowest running performance, while wingers (Ws) and central midfielders (CMs) showed the highest performances. Contrary to our initial hypothesis, the best performance in total distance was observed in the third 15 min period (although it should be noted that this included extra time).
Total Distance Covered in Each Different Speed Zone per 15-min Interval of the First Half
From the results of the present study, it appears that the total distance covered by football players in each playing position shows the lowest value during the 60′–75′ period. Additionally, it was observed that in the last 15 min (76′–90′+), players in all positions exhibited a greater overall running performance compared to all other time periods with the second-best running performance appearing in the third 15 min period (31′–45′+). This is likely due to the additional time (stoppage time) included at the end of the match and at the end of the first half. If these periods are excluded from the results, it appears that the lowest overall running performance for all playing positions occurred during the 61′–75′+ period. In a study conducted in the English Premier League, it was observed that players ran 14% less distance in the last five minutes of the match compared to the first five minutes [8]. The findings are similar in studies using 15 min periods. Specifically, in their study in the English Premier League, Bradley et al. (2010) [24] observed that players ran 18% less high-intensity distance. In a more recent study [9] in the German Bundesliga, players covered 21% fewer meters at high intensity and 28% fewer meters sprinting. Additionally, in a study conducted in the UEFA Champions League [10], it was observed that the total distance and high-intensity distance in the first 15 min were 14% and 15% greater, respectively. In the same study, the decrease observed between the first 15 min and the fifth (61′–75′) for total distance was 15%, and for high-intensity running, it was 22%. In a recent study [25] on professional football players, the highest running performance was observed in the first 15 min of the match (total distance, Acc, Dec), while in the third 15 min (31′–45′), the highest high metabolic load distance and sprint distance were noted. The lowest physical performance was observed during the period of 61′–75′ (total distance, high metabolic load distance, Acc, Dec), and for the sprint distance, it was during the period of 76′–90′. Similar findings are reported by other researchers [26]. Specifically, they observed [26] that distances with high-intensity accelerations and decelerations were noted in the first 15 min. In the present study, as mentioned earlier, amateur football players exhibited the highest running performance (total distance) during the third 15 min.
In the present study, high-intensity running (excluding the periods that included extra time) was observed during the period of 1′–15′. Also, reduced performances in high-intensity running were noted during the second time period (16′–30′) except for the period of 61′–75′ mentioned earlier. Lozano et al. [25] observed the most intense actions during the third 15 min period (31′–45′). In contrast to the above study, researchers observed in the Spanish LaLiga that the most sprints with speeds greater than 30 km/h were performed during the first and last 15 min periods [27]. In agreement with our findings, previous studies [27,28] report that the greatest sprint distance was observed during 0′–15′ and 46′–60′. They also mention that players’ performances decreased during the last 15 min of each half. Differences between studies may be due to variations in GPS speed zones, data collection methods, differences in participants, and naturally, the impact of contextual variables. Specifically, running performance can be influenced by the location of the match (home or away) and the current score of the match (win, loss, draw). In a recent study [29], it is reported that high-intensity running, Acc, and Dec were higher in away matches. Additionally, higher values were observed when the match was tied compared to when the team was winning or losing.
In the present study, excluding the period of 76′–90′+ (which includes extra time), it was observed that the total distance covered by all players decreased during the first two 15 min periods of the second half. The observed progressive decrease may likely be explained by the effect of fatigue [25,28]. However, another factor that may influence this is the effective playing time. Specifically, a previous study reports that the effective playing time during the period of 0′–15′ is 66%, while during the period of 76′–90′, it is 55% [9]. These differences in effective playing time may be due not only to fatigue but also to tactical factors such as maintaining the score (for the team that benefits).
Additionally, the position and tactical role [25] appear to influence the running performance of players during the 15 min periods. Specifically, center defenders (CDs) were observed to have the lowest running performance in all time periods both in total distance and in high-intensity running. Regarding total distance, central midfielders (CMs) covered the greatest distance in most of the 15 min periods, which were followed by wingers (Ws). In high-intensity running distance, wingers (Ws) and fullbacks (FBs) dominated in the first three 15 min periods, while in the time periods of the second half, forwards (FWs), wingers (Ws), and fullbacks (FBs) outperformed the others. The running performance of players in all positions in zones 3, 4, and 5 (z3, z4, z5) showed similar variation. Specifically, the longer duration of the 30′–45′+ and 76′–90′+ periods seem to have influenced these results. Notably, in the final period (76′–90′+), CDs (center defenders), FBs (fullbacks), and FWs (forwards) ran the most meters at high intensity. Excluding these two periods, there was a decrease in high-intensity running performance across all positions during the 61′–75′ period. Compared to the running performance in the first period, CDs reduced their performance by 20%, FBs by 23%, CMs (central midfielders) by 23%, Ws (wingers) by 35%, and FWs by 19%.
Regarding the variations in players’ running performance in relation to position and 15 min periods, it appears there are not many studies that have investigated this. Specifically, in one of the studies we found, Modric et al. (2022) [10] observed that concerning the total distance in the last 15 min, players in all positions covered less distance compared to the first 15 min (CD −13%, FB −12%, CM −15%, W −15%, and FW −17%). A recent study reported that center defenders (CDs) exhibited the lowest running performance during the 15 min periods of the match, whereas wingers (Ws) showed the highest physical performance (Acc, Dec, sprint running distance, high metabolic load distance), and central midfielders (CMs) covered the greatest distance [25]. The superiority of players in wide positions in terms of the distance covered at high intensity is also mentioned in previous studies [4,27]. Additionally, the formation can affect the running performance of the football players [30]. However, it should be noted that the above study concerned elite European football players, while the present study was conducted with amateur football players.
The fact that all footballers cover more meters in the last 15 min of both the first and second halves at low intensity compared to the other 15-min intervals is presumably based on the logic that fatigue affects the players’ efforts, and as expected, the intensity of the game justifiably drops for both teams. The players’ intensities are similar throughout the game, and the division of halves does not seem to affect this aspect. Finally, as mentioned above, an explanation for why FBs cover greater distances at high intensity at the start of the match is that games in the early minutes, before the teams recognize each other, are more chaotic, meaning there are more transitions, both offensive and defensive, with defenders likely having to cover greater distances due to their high positioning on the field during offensive phases based on the advanced playstyle of the 1-4-3-3 in modern football. Additionally, all players covered greater distances in the last 15 min of the second half compared to the first for the reasons mentioned above, and because stoppages are almost always more frequent in the second half. We must also consider the technical and tactical factors. The study was conducted on an amateur adult team (not youth), so in every football match, the main goal was victory. In previous studies concerning professional football, it has been reported that a team’s ranking is related to ball possession and, more specifically, to the total distance covered by players with the ball and high-speed running with the ball [31]. Therefore, the technical skill of the players and the style in which a team plays can affect running performance.
The study presents some limitations. The total number of matches that comprised the study sample was limited to the first round of the competitive season. Therefore, the results should be interpreted with caution, and generalizations cannot be made. Another limitation is that the time periods of the two 15-min intervals, 31′–45′ and 76′–90′, included the stoppage time of each match. As a result, these periods are difficult to compare with the other periods. However, we compared them knowingly because the additional time is playing time, and many football matches are often decided during this time interval. Additionally, it is also known that the quality of the opposing team, the significance of the match in relation to the team’s ranking, and the match score affect the running performance of the football players. Finally, another limitation of the study is the limited external load variables that it examines. In this particular study, none of these factors were evaluated. Further studies that consider these factors with a larger sample of amateur football players will provide a clearer picture of their running performance in relation to position, formation, and time period.
5. Conclusions
The study recorded the running performance data of amateur-level football players, comparing them by position in a 1-4-3-3 formation during football matches. After analyzing the data, we can conclude that on average, the players covered similar distances to those at the elite level, with midfielders and attacking midfielders (CMs, Ws) covering the greatest distances.
Moreover, all players, regardless of position, covered greater distances at low intensity in the last 15 min of both halves. The FB covered greater distances in the first 15 min of the first half compared to the second half at high intensity. Finally, comparing the last 15 min of both halves, the players covered greater distances at low intensity in the second half.
Since the 1-4-3-3 formation is one of the most popular in modern football, coaches, in collaboration with their technical staff, need to consider the loads players experience based on their playing positions. They should adjust their training planning and session design according to the intensities at which players operate in realistic match conditions, selecting appropriate stimuli each time to enhance performance or facilitate recovery after demanding match periods.
Future studies could use different samples (e.g., women, elite players, youth players). Also, conducting research on all official games of a season, under consistent conditions (e.g., same formation), might provide even more reliable results due to the larger sample size. Finally, it would be interesting to compare different formations, whether similar (e.g., 1-4-2-3-1) or different (e.g., 1-3-5-2).
Author Contributions
Y.M., V.K., T.I.M. and I.G., designed this study and provided critical feedback on the manuscript; V.K. and Y.M., collected, processed and analyzed the data and revised the first draft; Y.M. conducted the statistical analysis. All authors have read and agreed to the published version of the manuscript.
Funding
This research received no external funding.
Institutional Review Board Statement
The Ethics Committee of the School of Physical Education and Sport Science at Thessaloniki hereby approves this study, and the approval number is 179/2023.
Informed Consent Statement
Informed consent was obtained from all subjects involved in this study.
Data Availability Statement
Data are available upon request from the corresponding author.
Conflicts of Interest
The authors declare no conflicts of interest.
References
- Available online: https://publications.fifa.com/en/annual-report-2021/around-fifa/professional-football-2021/ (accessed on 1 January 2023).
- Barnes, C.; Archer, D.; Bush, M.; Hogg, R.; Bradley, P. The evolution of physical and technical performance parameters in the English Premier League. Int. J. Sports Med. 2014, 35, 1095–1100. [Google Scholar] [CrossRef] [PubMed]
- Modric, T.; Jelicic, M.; Sekulic, D. Relative Training Load and Match Outcome: Are Professional Soccer Players Actually Undertrained during the In-Season? Sports 2021, 9, 139. [Google Scholar] [CrossRef] [PubMed]
- Vardakis, L.; Michailidis, Y.; Mandroukas, A.; Mavrommatis, G.; Christoulas, K.; Metaxas, T. Analysis of the running performance of elite soccer players depending on position in the 1-4-3-3 formation. Ger. J. Exerc. Sport Res. 2019, 50, 241–250. [Google Scholar] [CrossRef]
- Plakias, S.; Mandroukas, A.; Kokkotis, C.; Mavrommatis, G.; Metaxas, T. The correlation of the penetrative pass on the offensive third with the possession of the ball in high level soccer. Gazz. Med. Ital.–Arch. Sci. Med. 2022, 181, 633–638. [Google Scholar] [CrossRef]
- Vardakis, L.; Michailidis, Y.; Topalidis, P.; Zelenitsas, C.; Mandroukas, A.; Gissis, I.; Christoulas, K.; Mavrommatis, G.; Metaxas, T. Application of a Structured Training Plan on Different-Length Microcycles in Soccer—Internal and External Load Analysis between Training Weeks and Games. Appl. Sci. 2023, 13, 6935. [Google Scholar] [CrossRef]
- Fousekis, A.; Fousekis, K.; Fousekis, G.; Vaitsis, N.; Terzidis, I.; Christoulas, K.; Michailidis, Y.; Mandroukas, A.; Metaxas, T. Two or Four Weeks Acute: Chronic Workload Ratio Is More Useful to Prevent Injuries in Soccer? Appl. Sci. 2023, 13, 495. [Google Scholar] [CrossRef]
- Weston, M.; Drust, B.; Gregson, W. Intensities of exercise during match-play in FA Premier League referees and players. J. Sport. Sci. 2011, 29, 527–532. [Google Scholar] [CrossRef] [PubMed]
- Linke, D.; Link, D.; Weber, H.; Lames, M. Decline in match running performance in football is affected by an increase in game interruptions. J. Sport. Sci. Med. 2018, 17, 662. [Google Scholar]
- Modric, T.; Versic, S.; Alexe, D.I.; Gilic, B.; Mihai, I.; Drid, P.; Radulovic, N.; Saavedra, J.M.; Menjibar, R.B. Decline in Running Performance in Highest-Level Soccer: Analysis of the UEFA Champions League Matches. Biology 2022, 11, 1441. [Google Scholar] [CrossRef]
- Forcher, L.; Forcher, L.; Jekauc, D.; Woll, A.; Gross, T.; Altmann, S. Center backs work hardest when playing in a back three: The influence of tactical formation on physical and technical match performance in professional soccer. PLoS ONE 2022, 17, e0265501. [Google Scholar] [CrossRef]
- Michailidis, Y.; Bagkos, T.; Kaldaras, V.; Gissis, I.; Metaxas, T.I. The profile of the internal load of amateur soccer players during official matches with formation 1-4-3-3 and relationships with indexes of external load. Appl. Sci. 2024, 14, 258. [Google Scholar] [CrossRef]
- Dellal, A.; Wong, D.P.; Moalla, W.; Chamari, K. Physical and technical activity of soccer players in the French First League–with special reference to their playing position. Int. Sports Med. J. 2010, 11, 278–290. [Google Scholar]
- Aquino, R.; Carling, C.; Palucci Vieira, L.H.; Martins, G.; Jabor, G.; Machado, J.; Santiago, P.; Garganta, J.; Puggina, E. Influence of situational variables, team formation, and playing position on match running performance and social network analysis in brazilian professional soccer players. J. Strength Cond. Res. 2020, 34, 808–817. [Google Scholar] [CrossRef] [PubMed]
- Rivilla-Garcia, J.; Calvo, L.C.; Jimenez-Rubio, S.; Paredes-Hernandez, V.; Munoz, A.; van den Tillaar, R.; Navandar, A. Characteristics of very high intensity runs of soccer players in relation to their playing position and play-ing half in the 2013–2014 Spanish La Liga season. J. Hum. Kinet. 2018, 66, 213–222. [Google Scholar] [CrossRef] [PubMed]
- Baptista, I.; Johansen, D.; Figueiredo, P.; Rebelo, A.; Pettersen, S.A. A comparison of match-physical demands between different tactical systems: 1-4-5-1 vs. 1-3-5-2. PLoS ONE 2019, 14, e0214952. [Google Scholar] [CrossRef] [PubMed]
- Bradley, P.S.; Carling, C.; Archer, D.T.; Roberts, J.; Dodds, A.; Di Mascio, M.; Paul, D.; Diaz, A.G.; Peart, D.; Krustrup, P. The effect of playing formation on high-intensity running and technical profiles in English FA Premier League soccer matches. J. Sports Sci. 2011, 29, 821–830. [Google Scholar] [CrossRef] [PubMed]
- Tierney, P.J.; Young, A.; Clarke, N.D.; Duncan, M.J. Match play demands of 11 versus 11 professional football using Global Positioning System tracking: Variations across common playing formations. Hum. Mov. Sci. 2016, 49, 1–8. [Google Scholar] [CrossRef] [PubMed]
- Muñoz-Castellanos, B.; Rabano-Muñoz, A.; Requena, B.; Suarez-Arrones, L.; Asian-Clemente, J.A. Congested Period in Professional Youth Soccer Players Showed a Different High Decelerations Profile in the Group Performance and a Specific Positional Behaviour. J. Funct. Morphol. Kinesiol. 2022, 7, 108. [Google Scholar] [CrossRef] [PubMed]
- Slaughter, M.H.; Lohman, T.G.; Boileau, R.A.; Horswill, C.A.; Stillman, R.G.; Van loan, M.D.; Bemben, D.A. Skinfold equations for estimation of body fatness in children and youth. Hum. Biol. 1988, 60, 709–723. [Google Scholar]
- Siri, W.E. The gross composition of the body. Adv. Biol. Med. Phys. 1956, 4, 239–280. [Google Scholar]
- Durnin, J.V.G.A.; Rahaman, M.M. The assessment of the amount of fat in the human body from measurements of skinfold thickness. Br. J. Nutr. 1967, 21, 681–689. [Google Scholar] [CrossRef] [PubMed]
- Cohen, J. Statistical Power Analysis for the Behavioral Sciences, 2nd ed.; Lawrence Erlbaum Associates: Mahwah, NJ, USA, 1988. [Google Scholar]
- Bradley, P.S.; Di Mascio, M.; Peart, D.; Olsen, P.; Sheldon, B. High-intensity activity profiles of elite soccer players at different performance levels. J. Strength Cond. Res. 2010, 24, 2343–2351. [Google Scholar] [CrossRef]
- Oliva-Lozano, J.M.; Granero-Gil, P.; Panascì, M. Changes in Physical Performance Throughout Professional Soccer Match-Play. J. Strength Cond. Res. 2024, 38, 123–127. [Google Scholar] [CrossRef] [PubMed]
- Russell, M.; Sparkes, W.; Northeast, J.; Cook, C.J.; Love, T.D.; Bracken, R.M.; Kilduff, L.P. Changes in Acceleration and Deceleration Capacity Throughout Professional Soccer Match-Play. J. Strength Cond. Res. 2016, 30, 2839–2844. [Google Scholar] [CrossRef]
- Oliva-Lozano, J.M.; Fortes, V.; Muyor, J.M. When and how do elite soccer players sprint in match play? A longitudinal study in a professional soccer league. Res. Sports Med. 2023, 31, 1–12. [Google Scholar] [CrossRef] [PubMed]
- Mohr, M.; Krustrup, P.; Bangsbo, J. Match performance of high-standard soccer players with special reference to development of fatigue. J. Sports Sci. 2003, 21, 519–528. [Google Scholar] [CrossRef]
- Augusto, D.; Brito, J.; Aquino, R.; Paulucio, D.; Figueiredo, P.; Bedo, B.L.S.; Touguinhó, D.; Vasconcellos, F. Contextual variables affect peak running performance in elite soccer players: A brief report. Front. Sports Act. Living 2022, 4, 966146. [Google Scholar] [CrossRef]
- Modric, T.; Versic, S.; Sekulic, D. Position Specific Running Performances in Professional Football (Soccer): Influence of Different Tactical Formations. Sports 2020, 8, 161. [Google Scholar] [CrossRef]
- Chmura, P.; Oliva-Lozano, J.M.; Muyor, J.M.; Andrzejewski, M.; Chmura, J.; Czarniecki, S.; Kowalczuk, E.; Rokita, A.; Konefał, M. Physical Performance Indicators and Team Success in the German Soccer League. J. Hum. Kinet. 2022, 83, 257–265. [Google Scholar] [CrossRef]

Disclaimer/Publisher’s Note: The statements, opinions and data contained in all publications are solely those of the individual author(s) and contributor(s) and not of MDPI and/or the editor(s). MDPI and/or the editor(s) disclaim responsibility for any injury to people or property resulting from any ideas, methods, instructions or products referred to in the content. |
© 2024 by the authors. Licensee MDPI, Basel, Switzerland. This article is an open access article distributed under the terms and conditions of the Creative Commons Attribution (CC BY) license (https://creativecommons.org/licenses/by/4.0/).