Article

Coastal Zone Classification Based on U-Net and Remote Sensing

1
Hainan Academy of Ocean and Fisheries Sciences, Haikou 571125, China
2
Yazhou Bay Innovation Institute, Hainan Tropical Ocean University, Sanya 570100, China
3
Department of Architecture and Engineering, Baiyin Vocational College of Mining and Metallurgy, Baiyin 730900, China
4
School of Geography and Environmental Sciences, Hainan Normal University, Haikou 571158, China
*
Authors to whom correspondence should be addressed.
Appl. Sci. 2024, 14(16), 7050; https://doi.org/10.3390/app14167050 (registering DOI)
Submission received: 2 July 2024 / Revised: 1 August 2024 / Accepted: 4 August 2024 / Published: 12 August 2024
(This article belongs to the Special Issue Remote Sensing Image Processing and Application, 2nd Edition)

Abstract

:
The coastal zone is abundant in natural resources but has become increasingly fragile in recent years due to climate change and extensive, improper exploitation. Accurate land use and land cover (LULC) mapping of coastal zones using remotely sensed data is crucial for monitoring environmental changes. Traditional classification methods based on statistical learning require significant spectral differences between ground objects. However, state-of-the-art end-to-end deep learning methods can extract advanced features from remotely sensed data. In this study, we employed ResNet50 as the feature extraction network within the U-Net architecture to achieve accurate classification of coastal areas and assess the model’s performance. Experiments were conducted using Gaofen-2 (GF-2) high-resolution remote sensing data from Shuangyue Bay, a typical coastal area in Guangdong Province. We compared the classification results with those obtained from two popular deep learning models, SegNet and DeepLab v3+, as well as two advanced statistical learning models, Support Vector Machine (SVM) and Random Forest (RF). Additionally, this study further explored the significance of Gray Level Co-occurrence Matrix (GLCM) texture features, Histogram Contrast (HC) features, and Normalized Difference Vegetation Index (NDVI) features in the classification of coastal areas. The research findings indicated that under complex ground conditions, the U-Net model achieved the highest overall accuracy of 86.32% using only spectral channels from GF-2 remotely sensed data. When incorporating multiple features, including spectrum, texture, contrast, and vegetation index, the classification accuracy of the U-Net algorithm significantly improved to 93.65%. The major contributions of this study are twofold: (1) it demonstrates the advantages of deep learning approaches, particularly the U-Net model, for LULC classification in coastal zones using high-resolution remote sensing images, and (2) it analyzes the contributions of spectral and spatial features of GF-2 data for different land cover types through a spectral and spatial combination method.

1. Introduction

The coastal zone, characterized by a unique sea–land transitional ecosystem, is rich in natural resources and offers significant geographical advantages. It hosts diverse ecosystems [1], supports major industries [2], and provides essential life support services for human survival and development [3,4]. However, the ecological environment in coastal zones is fragile and has been increasingly degraded due to accelerated human activities [5,6,7,8]. Accurate land use and land cover (LULC) classification is crucial for monitoring environmental changes in these areas and is a key research focus for scholars and academic organizations worldwide [9,10,11].
With the rapid advancement of satellite remote sensing technology, the spatial and spectral resolution of remotely sensed data has significantly improved, greatly enhancing the innovation of information interpretation techniques [12]. In the field of remote sensing data interpretation, traditional human interaction methods have achieved satisfactory classification accuracies ranging from 70% to 90% [13,14]. However, these approaches are often costly and inefficient [15,16], and they struggle to handle massive and complex datasets [17]. Researchers have explored the use of machine learning and artificial intelligence to extract coastal zone information, such as the threshold method. However, calculating the appropriate threshold is challenging, especially in areas with low contrast or complex backgrounds, which can significantly affect extraction results [18,19,20,21]. Pixel-based statistical learning methods, including support vector machine (SVM), maximum likelihood classifier (MLC), and minimum distance algorithm (MDA), have been tested for classification. These methods primarily rely on spectral features and require significant spectral differences between ground objects [22,23,24]. However, traditional statistical learning methods often overlook spatial and contextual semantic information in remotely sensed data, leading to issues like “same spectrum with different objects” and “same object with different spectra”, which can increase misclassification and omission errors [25]. Furthermore, object-based image analysis (OBIA) methods, as well as those combining OBIA with spectral, shape, texture, and spatial information, have been investigated. However, determining the appropriate scale for OBIA segmentation remains a challenge and is often experience based [26,27,28].
In recent years, deep learning, a key component of artificial intelligence, has played a crucial role in the advancement of image classification. Deep learning techniques offer several advantages in remote sensing image classification, including the ability to automatically adjust model parameters, generate models with strong generalization capabilities, improve accuracy, handle large and complex datasets, perform automatic feature extraction, and learn from multi-source and multi-temporal data [29,30,31,32]. For instance, Zhu et al. [33] discussed the state of the art in deep learning for remote sensing and highlighted the significant improvements in classification accuracy achieved by these methods. Ma et al. [34] reviewed deep learning applications in remote sensing and emphasized their ability to manage large and complex datasets. They illustrated how convolutional neural networks (CNNs) can automatically extract relevant features from hyperspectral images, eliminating the need for manual feature engineering [35]. Popular deep network architectures include CNN [36], AlexNet [37], VGG [38], GoogLeNet [39], and ResNet [40]. CNNs are foundational for semantic segmentation in deep learning, typically generating several fully connected layers with multiple convolutional layers. They map high-dimensional feature images into N-dimensional feature vectors to predict the probability of each pixel belonging to a specific category [41]. To address the limitations of CNNs, such as high computational cost and limited ability to capture contextual information, J Long et al. [42] designed a fully convolutional network (FCN) in 2015. FCN replaces the fully connected layers in CNNs with deconvolution layers, creating an end-to-end network structure that produces segmentation results with the same resolution as the input image, thus enabling accurate image classification [43,44]. Building on FCN, Zuo et al. [45] proposed an end-to-end multi-layer fusion fully convolutional neural network, which can fuse deep features of images obtained from different sensory field sizes. However, FCNs also have some limitations, including high computation cost [46], limited ability to capture contextual information [47], challenges in handling multi-scale objects [48], tendency to overfit training data [49], reliance on extensive labeled datasets for training [50], and sensitivity to noise and variability in remote sensing images, which may impact classification accuracy [51]. To overcome these challenges, Ronneberger et al. [52] extended the FCN and introduced a new symmetric network called U-Net. In the U-Net structure, the encoding part on the left adopts the VGG-Net network, while the decoding part on the right is cascaded with the left part. This structure allows for the combination of low-level features obtained through down-sampling with high-level features obtained through up-sampling, accurately locating pixel information. The U-Net not only produces classification results with the same resolution as the input image but also ensures that the target objects have well-defined contour information [53].
This paper aimed to (1) develop a model with high accuracy for coastal zone classification using GF-2 remote sensing images, (2) evaluate the effectiveness of texture, Normalized Difference Vegetation Index (NDVI), and contrast features in the U-Net model, and (3) propose a LULC classification solution suitable for coastal areas, constructing a strategy based on high-resolution remote sensing images. To achieve these goals, we first generated an LULC map using the original multispectral GF-2 imagery and the U-Net model. Then, the classification results were compared with those obtained from mainstream deep learning architectures such as SegNet [54] and DeepLab v3+ [55,56,57,58], as well as state-of-the-art statistical classifiers like SVM and RF. Next, we constructed different feature spaces using Gray Level Co-occurrence Matrix (GLCM) texture [59,60], Histogram Contrast (HC) [61], and NDVI index [62]. Finally, we divided all features and the original spectral data into five groups, selecting each group as input for the best-performing classifier to test feature sensitivity. The experiments were conducted on GF-2 high-resolution data from Shuangyue Bay, a typical coastal zone in Guangdong Province.

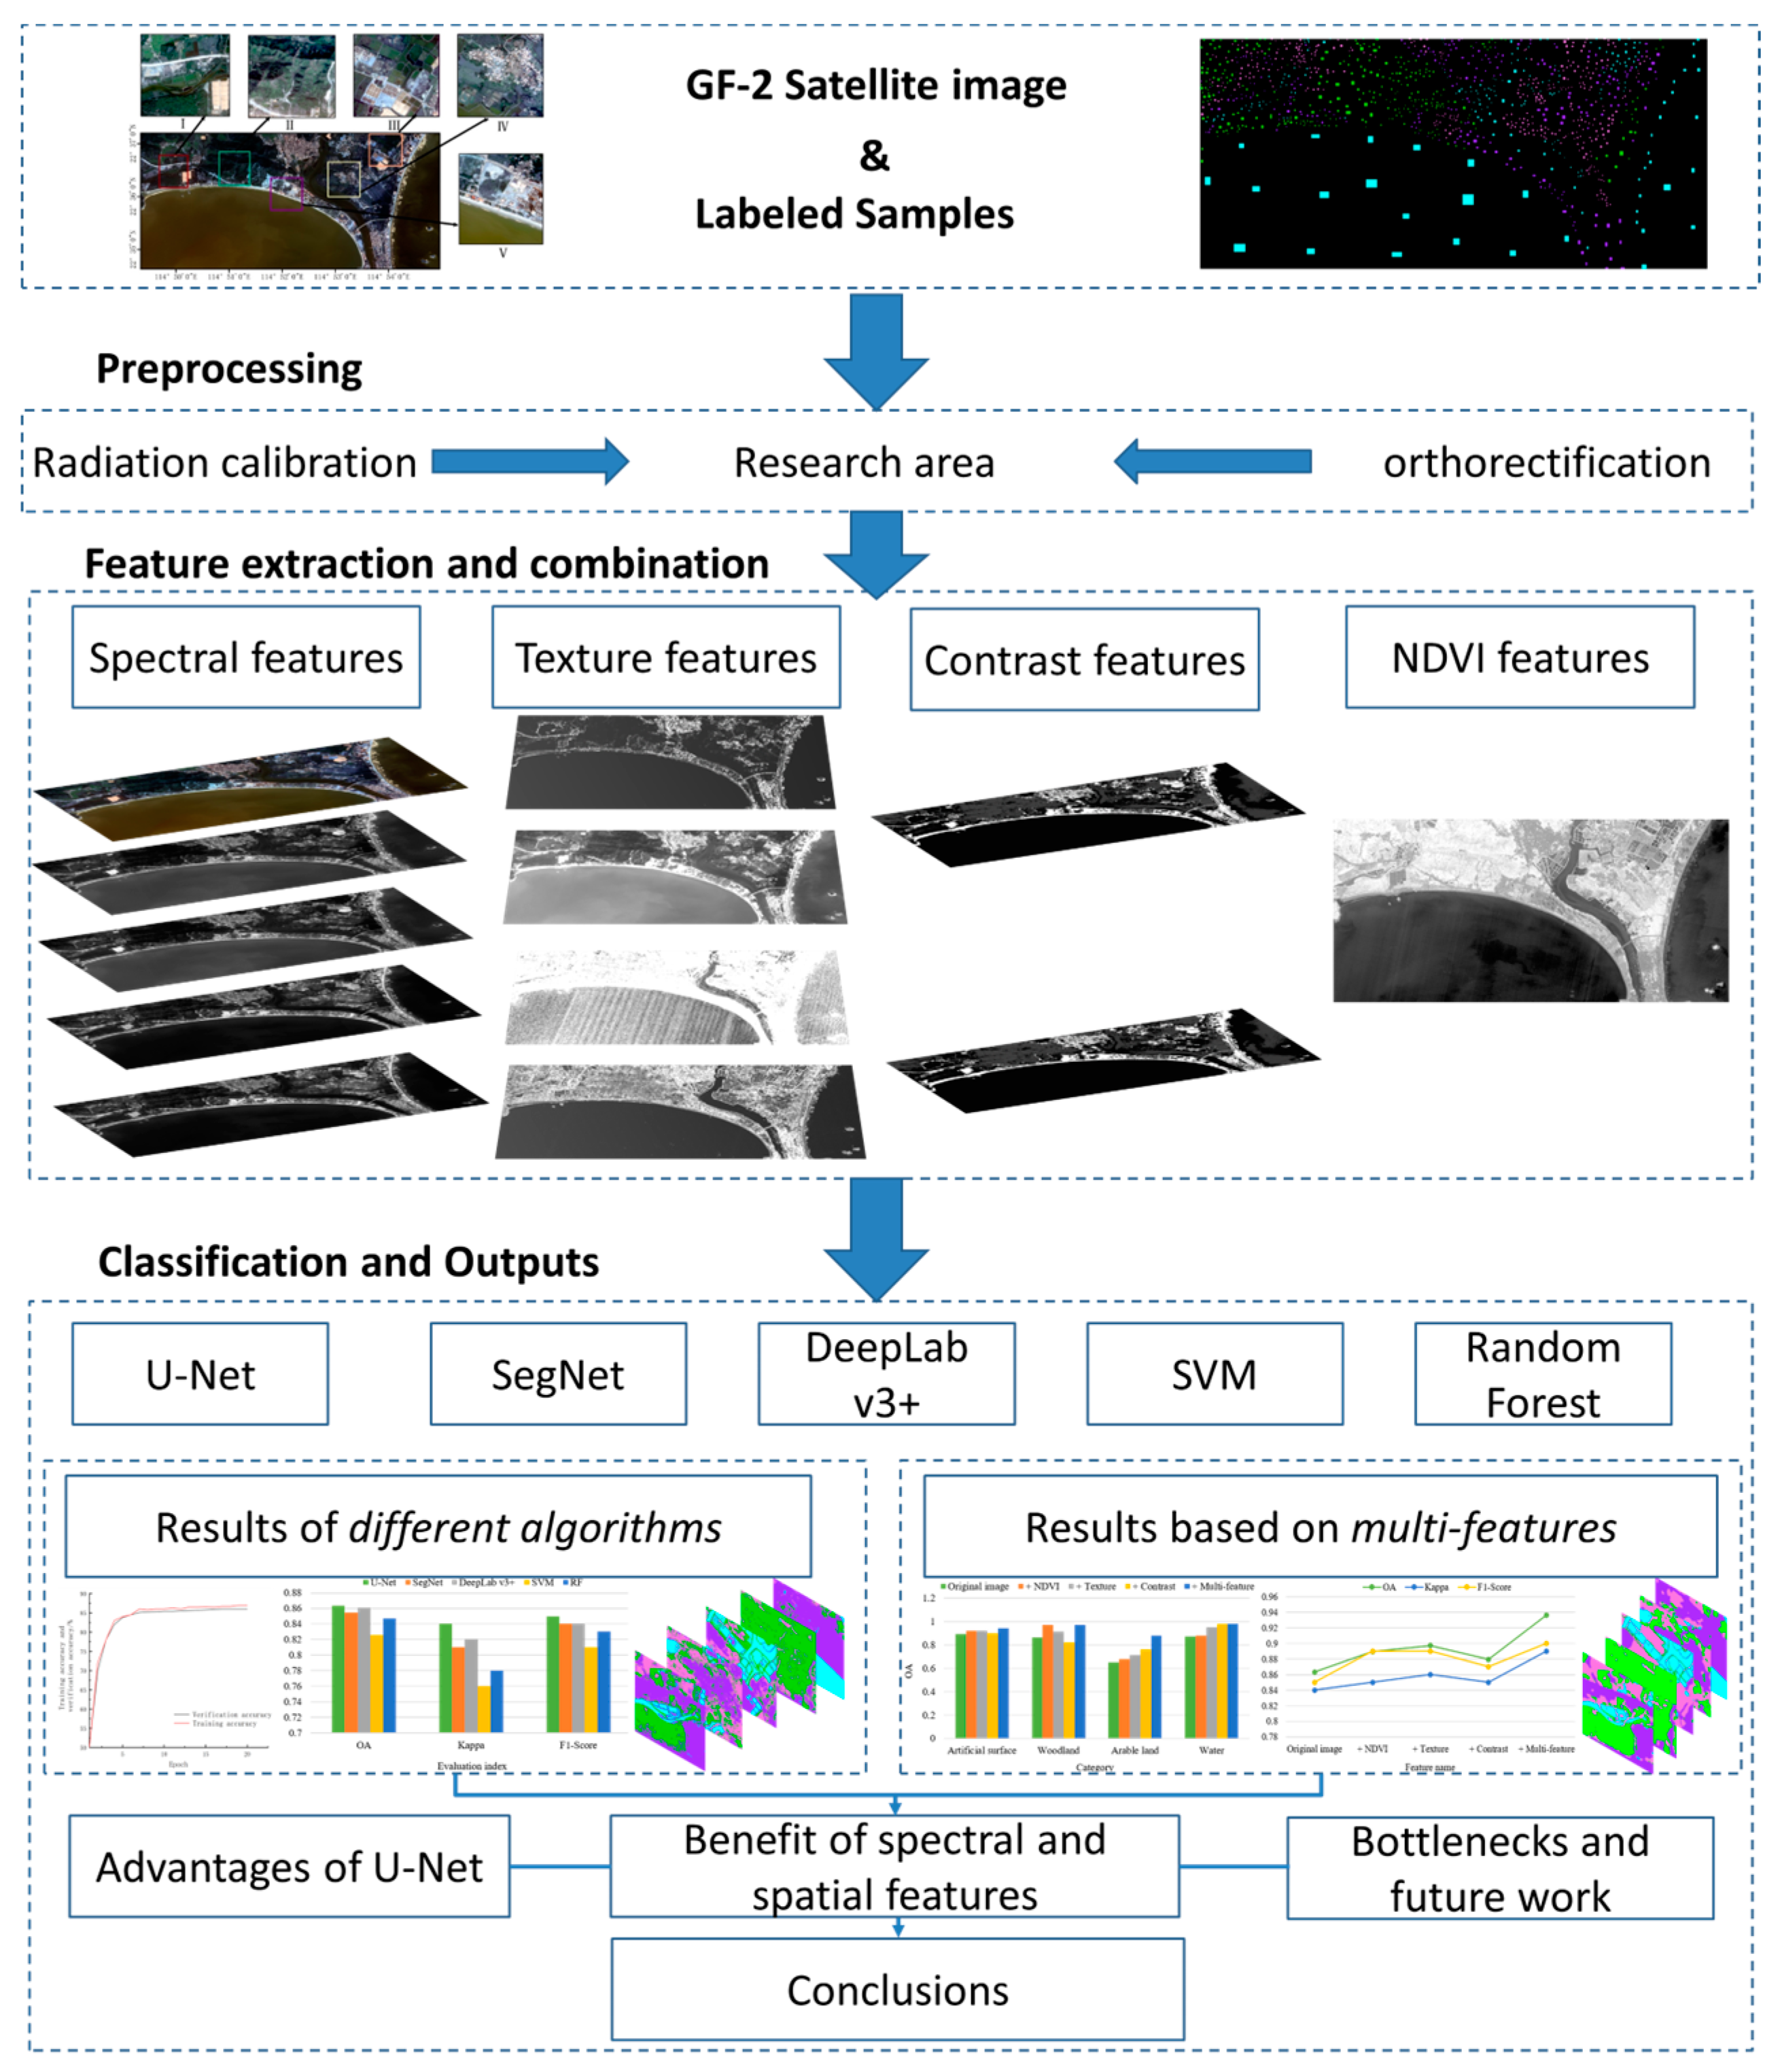
2. Experimental Methods

2.1. Study Area and Experimental Environment

2.1.1. Study Area and Datasets

The selected study area is Shuangyue Bay (114.553°–115.420° N, 22.544°–23.388° E), a typical coastal zone in Guangdong Province, China. Located in Huidong County, Huizhou City, Eastern Guangdong, Shuangyue Bay is renowned for its distinctive dual crescent-shaped bays, creating a unique and picturesque coastal landscape. This characteristic makes it an ideal case for studying coastal geomorphology [63]. Like many coastal zones, Shuangyue Bay faces environmental pressures from human activities such as tourism, fishing, and urbanization, making it a representative area for studying the impact of human activities on coastal environments and developing management strategies [64]. The total length of the continental coastline in the study area is approximately 16 km, with a land area of about 55 km2 (Figure 1). A scene of GF-2 high-resolution remotely sensed data, captured on 26 January 2017, was selected as the data source for this study (https://data.cresda.cn/#/2dMap).
The GF-2 remote sensing satellite provides the highest resolution data available for civil land observation in China. It is equipped with four multispectral and one panchromatic image acquisition sensor. The multispectral image resolution is 4 m, covering three visible spectral bands (blue, green, and red) and one near-infrared band, with a 10-bit radiometric resolution. The wavelength ranges for the visible and near-infrared bands are 0.45–0.52 μm, 0.52–0.59 μm, 0.63–0.69 μm, and 0.77–0.89 μm, respectively. The panchromatic band has a resolution of 1 m and a wavelength range from 0.45 to 0.90 μm [65,66].

2.1.2. Experimental Environment and Preprocessing

Figure 2 presents the workflow for coastal zone classification using the U-Net deep learning framework and GF-2 remotely sensed data. The preprocessing of the GF-2 remote sensing images involved radiometric calibration, atmospheric correction, and cropping of the study area. The Apply Gain and Offset tool provided by ENVI®5.3 was utilized for radiometric calibration of the multispectral data. The absolute calibration coefficients for the GF-2 remote sensing images from 2017 are as follows: PAN channel (gain = 0.1503, bias = 0), B1 channel (gain = 0.1193, bias = 0), B2 channel (gain = 0.1530, bias = 0), B3 channel (gain = 0.1424, bias = 0), and B4 channel (gain = 0.1569, bias = 0). Based on field investigation and visual interpretation, the study area was classified into four categories: water body, artificial surface, forest land, and farm land. “Forest land” refers to areas dominated by trees, including both natural forests and plantations. “Water body” includes areas covered by water, such as rivers, lakes, wetlands, and artificial water bodies like reservoirs and ponds. “Farm land” encompasses land used for agricultural production, including arable land, orchards, vineyards, pastures, and agricultural facilities, primarily used for growing crops, raising livestock, and aquaculture. “Artificial surface” denotes areas where the natural land cover has been replaced by human-made constructions, including urban and rural buildings, roads, airports, industrial areas, and other infrastructure, typically covered by materials such as concrete, asphalt, and bricks. The corresponding training and testing label data were produced by remote sensing experts. Due to the large size of the full image, inputting it directly into the deep learning model could cause memory issues on the workstation. Therefore, the image was cropped into 256 × 256-pixel slices, and 50 images were selected as sample data. The total number of pixels was 94,960, with a relatively balanced distribution across each category (as detailed in Table 1). The sample data were divided into an 8:2 ratio for training and validation.
The experiments in this study were conducted on a Windows 10 operating system, using a hardware setup comprising an Intel Xeon(R) Gold 5118 processor, 128 GB of RAM, a 2 TB disk, and an RTX 2080Ti 11 GB graphics card. The U-Net model was implemented using the MATLAB® R2020a programming environment. The training utilized the stochastic gradient descent with momentum (Sgdm) optimization method, set for 20 epochs, with each epoch consisting of 1000 iterations. The batch size was set to 16, the learning rate was fixed at 0.005, and the momentum was set at 0.9.

2.2. U-Net Network

The U-Net network model is an end-to-end, U-shaped symmetric network, originally derived from the FCN architecture [67]. U-Net is known for achieving good segmentation performance, even when the training sample size is relatively small [68,69]. The network consists of two main parts: an encoder and a decoder. The encoder, located on the left side, is responsible for extracting feature information from the input image. The decoder, on the right side, accurately locates and restores detailed information from the extracted feature image [70]. The encoder is composed of four groups of identical coding blocks. Each coding block employs two convolutional layers with a kernel size of 3 × 3. The rectified linear unit (ReLU) is used as the activation function, and a 2 × 2 max-pooling filter with a stride of 2 is applied for down-sampling. With each down-sampling operation, the spatial dimensions of the feature map are halved, while the depth of the feature map doubles. The decoder mirrors the encoder with four identical decoding blocks. In each decoding block, a 2 × 2 kernel is first used for transposed convolution to up-sample the feature map, effectively halving its depth. This is followed by a skip connection that merges the up-sampled feature map with the corresponding feature map from the encoder. Two additional convolutional layers with 3 × 3 kernels are then applied, reducing the feature map’s spatial dimensions to half of its original size. The final layer of the U-Net employs a 1 × 1 convolution kernel to map the 64-dimensional feature vector to a 256 × 256 output image. The Softmax function was then used to generate a classification map with the same resolution as the input image. The detailed structure of the U-Net network is illustrated in Figure 3.

2.3. Image Feature Extraction

High-resolution remote sensing images contain a wealth of information beyond conventional spectral data, including rich geometric, spatial, and texture information. This complexity arises because different ground objects can exhibit similar spectral characteristics, such as buildings and ground surfaces, while identical objects can display varied spectral information, like roofs of buildings made from different materials. Additionally, GF-2 images are limited to three visible light bands and one near-infrared band, providing insufficient spectral information. Due to these characteristics, relying solely on spectral data for training deep learning models often yields suboptimal results, as the models may not adequately capture the diverse feature information present in the images. Therefore, it is essential to construct a variety of image features to complement the original spectral data and enhance classification accuracy. In this study, we constructed and integrated image texture features, contrast features, and vegetation features as supplements to the original spectral data. These features were combined and fed into the deep learning network, specifically the U-Net model, to provide more comprehensive inputs. By focusing on the unique characteristics of the U-Net model, this research aimed to utilize a fusion of three-category feature information with spectral data, offering the model more robust and sufficient inputs for accurate classification.
Focusing on the characteristics of the U-Net deep learning model, this research constructed three types of feature information and integrated them with spectral information to provide the model with more comprehensive inputs.
(1) Texture features extracted with GLCM.
GLCM texture feature extraction is based on a statistics algorithm. In this research, five texture features were extracted, including contrast (CON), correlation (COR), angular second moment (ASM), mean, and entropy (ENT), using GF-2 RGB channels with four angle directions (0°, 45°, 90°, and 135°).
The C O N measures the local variations in the GLCM matrix, reflecting image clarity and texture depth. The calculation formula of CON is described in Equation (1) as follows:
C O N = i , j ( i j ) 2 P ( i , j )
where i and j mean the row and column indices in the GLCM, and P ( i , j ) means the normalized frequency of the co-occurrence of gray levels i and j in the GLCM.
The C O R measures the degree to which a pixel is correlated with its neighbors across the entire image, reflecting the correlation of local grayscale values. The calculation formula for COR can be described with the following Equation (2):
C O R = i , j ( i μ i ) ( j μ j ) P ( i , j ) σ i σ j
where i and j mean the row and column indices in the GLCM, P ( i , j ) means the normalized frequency of the co-occurrence of gray levels i and j in the GLCM. μ _ i is the mean gray level of row i in the GLCM, μ _ j is the mean gray level of column j in the GLCM, δ i and δ _ j are the standard deviations of the gray levels in row i and column j , respectively.
The ASM, also known as energy, measures the uniformity or texture uniformity of the image. It reflects the uniformity of the grayscale distribution and the texture’s fineness. The calculation formula for ASM can be described with Equation (3), as follows:
A S M = i , j P ( i , j ) 2
where i and j mean the row and column indices in the GLCM, and P ( i , j ) means the normalized frequency of the co-occurrence of gray levels i and j in the GLCM.
Mean represents the average value of the intensities in the GLCM, indicating the overall brightness of the image tone. The calculation formula for the mean can be described with Equation (4), as follows:
M e a n = i , j i P ( i , j )
where i and j mean the row and column indices in the GLCM, respectively, and P ( i , j ) means the normalized frequency of the co-occurrence of gray levels i and j in the GLCM.
ENT measures the randomness or complexity of the texture within the image, indicating the randomness and the amount of information contained. The calculation formula for ENT can be described with Equation (5), as follows:
E N T = i , j P ( i , j ) l o g P ( i , j )
where i and j mean the row and column indices in the GLCM, respectively, and P ( i , j ) means the normalized frequency of the co-occurrence of gray levels i and j in the GLCM. Log is the logarithm function, typically base 2 or natural logarithm.
(2) Contrast feature extracted with HC algorithm.
To simplify the calculation and enhance efficiency, the data values of each channel were quantized into 12 levels. This approach reduces the possible data values in the image to a maximum of 123, which is significantly lower than the original maximum color value of 2563. Additionally, pixels with a frequency of appearance less than 5% were classified into the high-frequency value group with the closest color distance. To further facilitate color perception, the LAB color space was utilized to measure color distance. The calculation formula for the contrast value of a pixel in the image can be described with the following Equation (6):
S ( I k ) = I i I D ( I k , I i )
where S ( I k ) is the contrast value of pixel I k , and D ( I k , I i ) is the color distance between pixel I k and pixel I i in LAB space. Equation (1) can be expanded as Equation (7), as follows:
S ( I k ) = D ( I k , I 1 ) + D ( I k , I 2 ) + + D ( I k , I n )
where n is the total number of pixels in the image I . Since the color depth is quantized to a certain level, Equation (2) is rearranged to group pixels with the same color value c j together. The contrast value of a pixel I k can be expressed as follows with Equation (8):
S ( I k ) = S ( C l ) = j = 1 n f j D ( c l , c j )
where c l is the color value of the pixel I k , n is the total colors numbers in image, and f j is the frequency of c i in the image I . Since color quantization can introduce inaccuracies, a weighted and averaged smoothing operation was applied to refine the contrast value of each color, thereby reducing noise points. The calculation for this operation is represented in Equation (9), as follows:
S ( c ) = 1 ( m 1 ) T i = 1 m ( T D ( c , c i ) ) S ( c i )
where m is the number of colors to improve the contrast of color c , usually 1/4 of the total number of colors, and T is the sum of the color distances between color c and its m nearest neighbors c i .
(3) NDVI features.
NDVI is used to enhance vegetation in satellite images. To accurately extract vegetation information, NDVI features are computed. The calculation of NDVI is expressed in Equation (10), as follows:
N D V I = N I R R N I R + R
where N I R is the reflection value in the near-infrared band, and R is the reflection value in the red band.

2.4. Accuracy Assessment

In remote sensing classification tasks, accurately evaluating the performance of classification algorithms is crucial. Commonly used metrics for this purpose include overall accuracy (OA), the Kappa coefficient, and the F1-score [71,72]. In this study, these metrics were selected for quantitative evaluation of classification results [73,74]. OA was chosen because (1) OA is straightforward to understand and calculate; (2) it provides a quick overview of the classifier’s performance; (3) it is a standard metric in many fields, making results easily comparable across studies. The Kappa coefficient was selected because (1) it accounts for the agreement occurring by chance; (2) it is less sensitive to class imbalance; (3) Kappa values closer to 1 indicate better agreement than expected by chance, while values below 0 indicate worse than random performance. The F1-score was included because (1) it provides a single metric that balances both false positives and false negatives; (2) it is useful in cases of class imbalance by considering both precision and recall; (3) it offers detailed insights into the classifier’s performance.
OA represents the ratio of correctly classified samples to the total number of samples. The calculation formula for OA is shown in Equation (11), as follows:
O A = T P + T N T P + T N + F N + F P
where TP (true positive) represents the number of positive samples that are classified correctly, TN (true negative) represents the number of negative samples that are classified correctly, FP (false positive) represents the number of positive samples that are classified incorrectly, and FN (false negative) represents the number of negative samples classified incorrect.
The Kappa coefficient is a classification evaluation index based on the confusion matrix, with values ranging from −1 to 1, although in practical applications it typically falls between 0 and 1. The Kappa coefficient reflects the overall classification accuracy of a given model, with higher values indicating greater accuracy. The calculation formula for the Kappa coefficient is shown in Equation (12), as follows:
K a p p a = N × i = 1 p a i i ( a i + × a + i ) N 2 ( a i + × a + i )
where p represents the row or column of a confusion matrix, a i i represents the number of correctly classified, which corresponding to the value of the i -th row and i -th column on the diagonal, a + i represents the sum of the i -th row, a i + represents the sum of the i -th column, and N is total number of samples.
The F1-score is the harmonic mean of precision (P) and recall (R). It is a comprehensive indicator that reflects the model’s ability to distinguish between positive and negative samples. The calculation formula for the F1-score is shown in Equation (13), as follows:
F 1 = 2 × P × R P + R
where P = T P T P + F P , R = T P T P + F N , TP , FP , and FN are defined the same as in Formula (11).

3. Results and Analysis

3.1. Classification Results by Different Methods

Deep learning-based classification heavily relies on training data. To prevent overfitting and improve the generalization ability of the network, we applied data augmentation techniques such as random rotation and mirroring of the training sets. As shown in Figure 4, as the number of iterations increases, the training accuracy improves and the training loss decreases, gradually stabilizing until the model reaches a state of convergence.
To verify the effectiveness of high-resolution remote sensing imagery classification using the U-Net method, we compared the U-Net model with SegNet, DeepLab v3+, RF, and SVM, using the same training and validation data. For each model, evaluation metrics were averaged over multiple experiments (three repetitions) to minimize random errors. These five models were applied to five distinct areas, as shown in Figure 5a, with the corresponding experimental results presented in Figure 5b–f.
The classification accuracy results in Table 2 indicated that the U-Net model outperformed the others in terms of OA, Kappa, and F1-score. All five algorithms achieved an OA value above 80%, with the three deep learning algorithms exceeding 85%, surpassing the two traditional statistical learning models. When analyzing Figure 4 and Table 2 together, it is evident that the three deep learning models effectively suppressed the “noise” phenomenon and significantly improved the classification of mixed pixels and minor objects. This advantage arises because traditional classification methods focus only on shallow features, whereas deep learning can extract contextual and semantic information from high-resolution remote sensing images. A comprehensive analysis demonstrated that the U-Net model provided superior robustness in classification performance and was particularly well-suited for coastal classification tasks.

3.2. Classification with Multi-Features

To illustrate the impact of multi-feature classification, we present the results for the original image classification, the original image combined with texture features, NDVI features, contrast features, and all features combined (Figure 6). The averaged OA, Kappa coefficients, and F1-score for each class achieved using the U-Net model with these multi-features are shown in Table 3.
As seen in Table 3, compared to the original image classification results, the accuracy for forest land classification increased by 11% with the addition of NDVI features. This improvement highlights the significant impact of NDVI features on the accuracy of vegetation category classification. When contrast features were combined with the original images, the classification accuracy for forest land decreased slightly by 0.04, but this reduction was minor and did not significantly affect the overall accuracy. Notably, the classification accuracy for water bodies and cultivated land improved substantially (both increasing by 0.11), indicating that the addition of contrast features enhances the distinction between water bodies, cultivated land, and other ground objects. The inclusion of texture features with the original image improved the classification accuracy across all categories, demonstrating the strong influence of texture features in the classification process. As shown in Table 3 and Figure 7, the highest overall classification accuracy (OA of 92.65% and Kappa coefficient of 0.89) was achieved by combining texture, vegetation, and contrast features.
In summary, the U-Net model that integrates texture, NDVI, and contrast features achieves superior classification results. This model fully leverages the information from high-resolution remote sensing images, making it particularly well-suited for coastal LULC classification.

4. Discussion

4.1. Advantages of U-Net Deep Learning Models

In this research, we conducted a comprehensive comparison of the U-Net model for coastal zone LUCC against other state-of-the-art deep learning models, such as SegNet and DeepLab v3+, as well as traditional machine learning models like SVM and RF. The experimental results demonstrated that U-Net was a powerful tool for LUCC tasks due to its unique architecture. The U-Net design includes a contracting path to capture contextual information and a symmetric expanding path for precise localization, which are particularly beneficial for tasks requiring detailed boundary preservation [52]. Unlike traditional machine learning models such as SVM and RF, which require extensive feature engineering to perform well, deep learning models like U-Net can automatically learn relevant features from raw data. This capability makes U-Net more flexible and less dependent on the quality of manually engineered features [75,76]. Our experimental results show that the three selected deep learning algorithms, including U-Net, achieved an OA greater than 85%, outperforming the two traditional statistical learning models. This finding aligns with Li’s research conclusions in the Shenzhen area [77]. Although DeepLab v3+ offers high accuracy, its complexity and computational intensity are greater than those of U-Net [58]. U-Net excels in accuracy and detailed segmentation, especially when dealing with complex boundaries and limited training data. While SegNet provides computational efficiency, it may compromise some details. DeepLab v3+ delivers state-of-the-art performance but at the cost of increased complexity and computational demands. In contrast, SVM and Random Forest, although robust traditional methods, require extensive feature engineering and may struggle with high-dimensional data scenarios where the automatic feature extraction capabilities of deep learning provide a significant advantage.

4.2. Benefit of Spectral and Spatial Features

The combination of spectral and spatial features in the U-Net model achieved the best classification performance (OA over 93%) using GF-2 images of Shuangyue Bay, Guangdong Province, where the surface cover was complex. The analysis results indicated that NDVI was particularly sensitive to vegetation characteristics. This sensitivity arises because NDVI exploits the strong absorption of red light by green plants and their high reflectance in the near-infrared, enhancing the spectral response difference between vegetation and other ground objects. In addition, texture features significantly improved the classification accuracy across all classes. As regional features, texture attributes utilized image information to describe the spatial distribution of each pixel, considering both macroscopic properties and fine structures more effectively than other features. The contrast feature was found to be particularly sensitive to water bodies and farm land. This sensitivity is due to the contrast feature’s ability to combine the gray levels of low-frequency pixels and stretch the gray levels of high-frequency pixels, thereby highlighting image details and enhancing the distinction between water bodies, cultivated land, and other features. The fusion of texture, NDVI, and contrast features resulted in the best classification outcomes. This superior performance is mainly because each feature contributes differently to various categories. When combined, these features complement each other, allowing their advantages to be fully utilized, and thus achieving the highest classification accuracy.

4.3. Key Bottlenecks and Future Directions

Deep learning methods require a large amount of data to train models effectively, but acquiring and labeling datasets can be costly and challenging. Additionally, despite the inclusion of spectral and spatial features, the improvement in classification accuracy for artificial surfaces remains limited. This limitation suggests that the selected features are not sufficiently sensitive to artificial surfaces. Developing building index features could address this issue. However, constructing a normalized building index often requires a mid-infrared channel, which is absent in most high-resolution remote sensing images that only have red, green, blue, and near-infrared channels [78]. To overcome this limitation, future research could explore using hyperspectral remote sensing data or combining high-resolution satellite images with medium-resolution remote sensing images. This approach could compensate for the deficiencies in optical resolution satellite images for accurately extracting building features. By integrating these data sources, it may be possible to enhance the sensitivity and accuracy of artificial surface classification in complex environments.

5. Conclusions

This study analyzed the LULC classification of a coastal zone using the U-Net method based on GF-2 remote sensing images. The research verified the effectiveness of GLCM texture features, NDVI, and contrast features within the U-Net model, constructing a strategy tailored to high-resolution remote sensing images for coastal area classification. The comprehensive analysis of the experimental results demonstrated the following: (1) The U-Net classification algorithm that combines texture, NDVI, and contrast features significantly improves classification accuracy. (2) The proposed model effectively classifies artificial surfaces, forest land, farm land, and water bodies, achieving high performance in coastal feature classification with an accuracy of 93.65%, making it suitable for practical applications.
However, there are still some limitations that need to be addressed: (1) The limited spectral bands of GF-2 may not capture all the necessary information for distinguishing various coastal features, particularly those with similar spectral signatures; (2) the U-Net model requires a substantial amount of high-quality annotated training data, which can be labor-intensive and costly to produce; (3) deep learning models trained in one coastal region might not generalize well to other regions due to differing environmental conditions; (4) coastal zones may exhibit imbalanced classes, with some land cover types being underrepresented, leading to biases in the model and inaccuracies in classifying less frequent categories.
To overcome these shortcomings, future research can focus on the following aspects: (1) Integrating GF-2 data with other high-resolution and hyperspectral datasets to enhance spectral and temporal resolution; (2) exploring hybrid architectures that combine U-Net with other models (e.g., LSTM for temporal data) to improve performance in dynamic environments; (3) utilizing synthetic data generation techniques (e.g., GANs) to create additional training samples, especially for underrepresented classes; and (4) investigating semi-supervised learning approaches to use large amounts of unlabeled data, thereby reducing the dependency on annotated data.

Author Contributions

C.W. collected the data and wrote the paper; R.H. and M.Y., review; P.L., review and editing. All authors have read and agreed to the published version of the manuscript.

Funding

This research was supported by the Hainan Provincial Natural Science Foundation of China (423MS120), a National Natural Science Foundation of China grant (42071007), a provincial-level project of Hainan Province, Hainan Academy of Marine and Fishery Sciences (KYL-2024-06), a China Scholarship Council grant (201808410212), the Major Science and Technology Plan Project of Yazhou Bay Innovation Research Institute of Hainan Tropical Ocean University (2022CXYZD003), and the Hebei Provincial Natural Science Foundation of China (D2020409002).

Institutional Review Board Statement

Not applicable.

Informed Consent Statement

Not applicable.

Data Availability Statement

The data presented in this study are available on request from the first author. The data are not publicly available due to [Since GF-2 is neither public data nor commercial data, and a data confidentiality agreement has been signed with the Provincial GF Center, the data cannot be shared at present].

Acknowledgments

The authors would like to thank the researchers who provided the open-source algorithms, which were extremely helpful to the research conducted in this paper. We also thank the anonymous reviewers and editors for their contributions.

Conflicts of Interest

The authors declare no conflicts of interest.

References

  1. Costanza, R.; d’Arge, R.; de Groot, R.; Farber, S.; Grasso, M.; Hannon, B.; Limburg, K.; Naeem, S.; O’Neill, R.V.; Paruelo, J.; et al. The value of the world’s ecosystem services and natural capital. Nature 1997, 387, 253–260. [Google Scholar] [CrossRef]
  2. Barbier, E.B. Progress and challenges in valuing coastal and marine ecosystem services. Rev. Environ. Econ. Policy 2012, 6, 1–19. [Google Scholar] [CrossRef]
  3. Liu, R.; Pu, L.; Zhu, M.; Huang, S.; Jiang, Y. Coastal resource-environmental carrying capacity assessment: A comprehensive and trade-off analysis of the case study in Jiangsu coastal zone, eastern China. Ocean Coast. Manag. 2020, 186, 105092. [Google Scholar] [CrossRef]
  4. Hamid, A.I.A.; Din, A.H.M.; Abdullah, N.M.; Yusof, N.; Hamid, M.R.A.; Shah, A.M. Exploring space geodetic technology for physical coastal vulnerability index and management strategies: A review. Ocean Coast. Manag. 2021, 214, 105916. [Google Scholar] [CrossRef]
  5. Melet, A.; Teatini, P.; Le, C.G.; Jamet, C.; Conversi, A.; Benveniste, J.; Almar, R. Earth observations for monitoring marine coastal hazards and their drivers. Surv. Geophys. 2020, 41, 1489–1534. [Google Scholar] [CrossRef]
  6. Nazeer, M.; Waqas, M.; Shahzad, M.; Zia, I.; Wu, W. Coastline vulnerability assessment through landsat and cubesats in a coastal mega city. Remote Sens. 2020, 12, 749. [Google Scholar] [CrossRef]
  7. Wei, B.; Li, Y.; Suo, A.; Zhang, Z.; Xu, Y.; Chen, Y. Spatial suitability evaluation of coastal zone, and zoning optimisation in ningbo, China. Ocean Coast. Manag. 2021, 204, 105507. [Google Scholar] [CrossRef]
  8. Rempis, N.; Alexandrakis, G.; Tsilimigkas, G.; Kampanis, N. Coastal use synergies and conflicts evaluation in the framework of spatial, development and sectoral policies. Ocean Coast. Manag. 2018, 166, 40–51. [Google Scholar] [CrossRef]
  9. Micallef, A.; Williams, A.T. Theoretical strategy considerations for beach management. Ocean. Coast. Manag. 2002, 45, 261–275. [Google Scholar] [CrossRef]
  10. Kuleli, T.; Guneroglu, A.; Karsli, F.; Dihkan, M. Automatic detection of shoreline change on coastal Ramsar wetlands of Turkey. Ocean Eng. 2011, 38, 1141–1149. [Google Scholar] [CrossRef]
  11. Seto, K.C.; Fragkias, M. Quantifying spatiotemporal patterns of urban land-use change in four cities of China with time series landscape metrics. Landsc. Ecol. 2005, 20, 871–888. [Google Scholar] [CrossRef]
  12. Zhu, Q.; Sun, X.; Zhong, Y.; Zhang, L. High-resolution remote sensing image scene understanding: A review. In Proceedings of the IEEE International Geoscience and Remote Sensing Symposium, Yokohama, Japan, 28 July–2 August 2019; pp. 3061–3064. [Google Scholar]
  13. Franklin, S.E.; Wulder, M.A. Remote sensing methods in medium spatial resolution satellite data land cover classification of large areas. Prog. Phys. Geogr. 2002, 26, 173–205. [Google Scholar] [CrossRef]
  14. Harris, P.M.; Ventura, S.J. The integration of geographic data with remotely sensed imagery to improve classification in an urban area. Photogramm. Eng. Remote Sens. 1995, 61, 993–998. [Google Scholar]
  15. Zheng, X.; Chen, T. High spatial resolution remote sensing image segmentation based on the multiclassification model and the binary classification model. Neural. Comput Appl. 2021, 35, 3597–3604. [Google Scholar] [CrossRef]
  16. Feng, S.; Zhao, J.; Liu, T.; Zhang, H.; Zhang, Z.; Guo, X. Crop type identification and mapping using machine learning algorithms and sentinel-2 time series data. IEEE J. Sel. Top. Appl. Earth Obs. Remote Sens. 2019, 12, 3295–3306. [Google Scholar] [CrossRef]
  17. Wang, P.; Fan, E.; Wang, P. Comparative analysis of image classification algorithms based on traditional machine learning and deep learning. Pattern Recognit. Lett. 2021, 141, 61–67. [Google Scholar] [CrossRef]
  18. Bishop-Taylor, R.; Sagar, S.; Lymburner, L.; Alam, L.; Sixsmith, J. Sub-pixel waterline extraction: Characterising accuracy and sensitivity to indices and spectra. Remote Sens. 2019, 11, 2984. [Google Scholar] [CrossRef]
  19. Yan, J.; Wang, M.; Su, F.; Wang, T.; Xiao, R. Construction of knowledge rule sets for the classification of land cover information for the coastal zone of Peninsular Malaysia. Eur. J. Remote Sens. 2020, 53, 293–308. [Google Scholar] [CrossRef]
  20. Zhao, X.; Wang, X.; Zhao, J.; Zhou, F. Water–land classification using three-dimensional point cloud data of airborne LiDAR bathymetry based on elevation threshold intervals. J. Appl. Remote Sens. 2019, 13, 034511. [Google Scholar] [CrossRef]
  21. Sun, C.; Li, J.; Liu, Y.; Liu, Y.; Liu, R. Plant species classification in salt marshes using phenological parameters derived from Sentinel-2 pixel-differential time-series. Remote Sens. Environ. 2021, 256, 112320. [Google Scholar] [CrossRef]
  22. Maponya, M.G.; Van Niekerk, A.; Mashimbye, Z.E. Pre-harvest classification of crop types using a Sentinel-2 time-series and machine learning. Comput. Electron. Agric. 2020, 169, 105164. [Google Scholar] [CrossRef]
  23. Ghayour, L.; Neshat, A.; Paryani, S.; Shahabi, H.; Shirzadi, A.; Chen, W.; Ahmad, A. Performance Evaluation of Sentinel-2 and Landsat 8 OLI Data for Land Cover/Use Classification Using a Comparison between Machine Learning Algorithms. Remote Sens. 2021, 13, 1349. [Google Scholar] [CrossRef]
  24. Sheykhmousa, M.; Mahdianpari, M.; Ghanbari, H.; Mohammadimanesh, F.; Ghamisi, P.; Homayouni, S. Support vector machine vs. random forest for remote sensing image classification: A Meta-analysis and systematic review. IEEE J. Sel. Top. Appl. Earth Obs. Remote Sens. 2020, 13, 6308–6325. [Google Scholar]
  25. Wan, S.; Gong, C.; Zhong, P.; Pan, S.; Li, G.; Yang, J. Hyperspectral image classification with context-aware dynamic graph convolutional network. IEEE Trans. Geosci. Remote Sens. 2020, 59, 597–612. [Google Scholar] [CrossRef]
  26. Zheng, Z.; Zhong, Y.; Wang, J.; Ma, A.; Zhang, L. Building damage assessment for rapid disaster response with a deep object-based semantic change detection framework: From natural disasters to man-made disasters. Remote Sens. Environ. 2021, 265, 112636. [Google Scholar] [CrossRef]
  27. Tang, Z.; Wang, H.; Li, X.; Li, X.; Cai, W.; Han, C. An object-based approach for mapping crop coverage using multiscale weighted and machine learning methods. IEEE J. Sel. Top. Appl. Earth Obs. Remote Sens. 2020, 13, 1700–1713. [Google Scholar] [CrossRef]
  28. Hossain, M.D.; Chen, D. Segmentation for Object-Based Image Analysis (OBIA): A review of algorithms and challenges from remote sensing perspective. ISPRS J. Photogramm. Remote Sens. 2019, 150, 115–134. [Google Scholar] [CrossRef]
  29. Dou, P.; Shen, H.; Li, Z.; Guan, X. Time series remote sensing image classification framework using combination of deep learning and multiple classifiers system. Int. J. Appl. Earth Obs. Geoinf. 2021, 103, 102477. [Google Scholar] [CrossRef]
  30. Ma, A.; Wan, Y.; Zhong, Y.; Wang, J.; Zhang, L. SceneNet: Remote sensing scene classification deep learning network using multi-objective neural evolution architecture search. ISPRS J. Photogramm. Remote Sens. 2021, 172, 171–188. [Google Scholar] [CrossRef]
  31. Yang, R.; Qi, Y.; Su, Y. U-Net Neural Networks and Its Application in High Resolution Satellite Image Classification. Remote Sens. Technol. Appl. 2020, 35, 767–774. [Google Scholar]
  32. Wang, Z.; Tang, C.; Sima, X.; Zhang, L. Research on Application of Deep Learning Algorithm in Image Classification. In Proceedings of the IEEE Asia-Pacific Conference on Image Processing, Electronics and Computers (IPEC), Dalian, China, 14–16 April 2021; pp. 1122–1125. [Google Scholar]
  33. Zhu, X.X.; Tuia, D.; Mou, L.; Xia, G.-S.; Zhang, L.; Xu, F.; Fraundorfer, F. Deep learning in remote sensing: A comprehensive review and list of resources. IEEE Geosci. Remote Sens. Mag. 2017, 5, 8–36. [Google Scholar] [CrossRef]
  34. Ma, L.; Liu, Y.; Zhang, X.; Ye, Y.; Yin, G.; Johnson, B.A. Deep learning in remote sensing applications: A meta-analysis and review. ISPRS J. Photogramm. Remote Sens. 2019, 152, 166–177. [Google Scholar] [CrossRef]
  35. Chen, Y.; Jiang, H.; Li, C.; Jia, X.; Ghamisi, P. Deep feature extraction and classification of hyperspectral images based on convolutional neural networks. IEEE Trans. Geosci. Remote Sens. 2016, 54, 6232–6251. [Google Scholar] [CrossRef]
  36. LeCun, Y.; Bottou, L. Gradient-based learning applied to document recognition. In Proceedings of the IEEE, Seattle, WA, USA, 12 May 1998; Volume 86, pp. 2278–2324. [Google Scholar]
  37. Krizhevsky, A.; Sutskever, I.; Hinton, G.E. Imagenet classification with deep convolutional neural networks. Adv. Neural Inf. Process. Syst. 2012, 25, 1097–1105. [Google Scholar] [CrossRef]
  38. Simonyan, K.; Zisserman, A. Very deep convolutional networks for large-scale image recognition. arXiv 2014, arXiv:1409.1556. [Google Scholar]
  39. Szegedy, C.; Liu, W.; Jia, Y.; Sermanet, P.; Rabinovich, A. Going deeper with convolutions. In Proceedings of the IEEE Conference on Computer Vision and Pattern Recognition, Boston, MA, USA, 8–10 June 2015; pp. 1–9. [Google Scholar]
  40. He, K.; Zhang, X.; Ren, S.; Sun, J. Deep residual learning for image recognition. In Proceedings of the IEEE Conference on Computer Vision and Pattern Recognition, Las Vegas, NV, USA, 26 June–1 July 2016; pp. 770–778. [Google Scholar]
  41. Cheng, G.; Xie, X.; Han, J.; Guo, L.; Xia, G.S. Remote sensing image scene classification meets deep learning: Challenges, methods, benchmarks, and opportunities. IEEE J. Sel. Top. Appl. Earth Obs. Remote Sens. 2020, 13, 3735–3756. [Google Scholar] [CrossRef]
  42. Long, J.; Shelhamer, E.; Darrell, T. Fully convolutional networks for semantic segmentation. In Proceedings of the IEEE Conference on Computer Vision and Pattern Recognition, Boston, MA, USA, 7–12 June 2015; pp. 3431–3440. [Google Scholar]
  43. Han, Z.; Dian, Y.; Xia, H.; Zhou, J.; Jian, Y.; Yao, C.; Li, Y. Comparing fully deep convolutional neural networks for land cover classification with high-spatial-resolution Gaofen-2 images. ISPRS Int. J. Geoinf. 2020, 9, 478. [Google Scholar] [CrossRef]
  44. He, C.; Li, S.L.; Xiong, D.; Fang, P.; Liao, M. Remote sensing image semantic segmentation based on edge information guidance. Remote Sens. 2020, 12, 1501. [Google Scholar] [CrossRef]
  45. Zuo, T.; Feng, J.; Chen, X. HF-FCN: Hierarchically fused fully convolutional network for robust building extraction. In Proceedings of the Asian Conference on Computer Vision, Taipei, Taiwan, China, 20–24 November 2016; pp. 291–302. [Google Scholar]
  46. Zhang, C.; Wei, S.; Zhang, Y. A Review on Image Segmentation Techniques with Remote Sensing Perspective. IEEE Geosci. Remote Sens. Mag. 2018, 6, 61–77. [Google Scholar]
  47. Fu, G.; Liu, C.; Zhou, R.; Sun, T.; Zhang, Q. Classification for High Resolution Remote Sensing Imagery Using a Fully Convolutional Network. Remote Sens. 2017, 9, 498. [Google Scholar] [CrossRef]
  48. Masi, G.; Cozzolino, D.; Verdoliva, L.; Scarpa, G. Pansharpening by Convolutional Neural Networks. Remote Sens. 2016, 8, 594. [Google Scholar] [CrossRef]
  49. Kemker, R.; Luu, R.; Kanan, C. Low-Shot Learning for the Semantic Segmentation of Remote Sensing Imagery. IEEE Trans. Geosci. Remote Sens. 2018, 56, 329–340. [Google Scholar] [CrossRef]
  50. Volpi, M.; Tuia, D. Deep multi-task learning for a geographically-regularized semantic segmentation of aerial images. ISPRS J. Photogramm. Remote Sens. 2017, 144, 48–60. [Google Scholar] [CrossRef]
  51. Makantasis, K.; Karantzalos, K.; Doulamis, A.; Doulamis, N. Deep Supervised Learning for Hyperspectral Data Classification Through Convolutional Neural Networks. IEEE Geosci. Remote Sens. Lett. 2015, 13, 5–9. [Google Scholar]
  52. Ronneberger, O.; Fischer, P.; Brox, T. U-net: Convolutional Networks for Biomedical Image Segmentation. In Proceedings of the International Conference on Medical Image Computing and Comput-er-Assisted Intervention, Munich, Germany, 5–9 October 2015; pp. 234–241. [Google Scholar]
  53. Ahmed, I.; Ahmad, M.; Jeon, G. A real-time efficient object segmentation system based on U-Net using aerial drone images. J. Real-Time. Image Proc. 2021, 18, 1745–1758. [Google Scholar] [CrossRef]
  54. Badrinarayanan, V.; Kendall, A.; Cipolla, R. Segnet: A deep convolutional encoder-decoder architecture for image segmentation. IEEE Trans. Pattern Anal. Mach. Intell. 2017, 39, 2481–2495. [Google Scholar] [CrossRef] [PubMed]
  55. Chen, L.C.; Papandreou, G.; Kokkinos, I.; Murphy, K.; Yuille, A.L. Semantic image segmentation with deep convolutional nets and fully connected crfs. arXiv 2014, arXiv:1412.7062. [Google Scholar]
  56. Chen, L.C.; Papandreou, G.; Kokkinos, I.; Murphy, K.; Yuille, A.L. Deeplab: Semantic image segmentation with deep convolutional nets, atrous convolution, and fully connected crfs. IEEE Trans. Pattern Anal. Mach. Intell. 2017, 40, 834–848. [Google Scholar] [CrossRef] [PubMed]
  57. Chen, L.C.; Papandreou, G.; Schroff, F.; Adam, H. Rethinking atrous convolution for semantic image segmentation. arXiv 2017, arXiv:1706.05587. [Google Scholar]
  58. Chen, L.C.; Zhu, Y.; Papandreou, G.; Schroff, F.; Adam, H. Encoder-decoder with atrous separable convolution for semantic image segmentation. In Proceedings of the European Conference on Computer Vision (ECCV), Munich, Germany, 8–14 September 2018; Springer: Berlin/Heidelberg, Germany, 2018; pp. 801–818. [Google Scholar]
  59. Deur, M.; Gašparović, M.; Balenović, I. Tree Species Classification in Mixed Deciduous Forests Using Very High Spatial Resolution Satellite Imagery and Machine Learning Methods. Remote Sens. 2020, 12, 3926. [Google Scholar] [CrossRef]
  60. Srivastava, D.; Rajitha, B.; Agarwal, S.; Singh, S. Pattern-based image retrieval using GLCM. Neural. Comput Applic. 2020, 32, 10819–10832. [Google Scholar] [CrossRef]
  61. Cheng, M.M.; Mitra, N.J.; Huang, X.; Torr, P.H.S.; Hu, S. Global Contrast Based Salient Region Detection. IEEE Trans. Pattern Anal. Mach. Intell. 2014, 37, 569–582. [Google Scholar] [CrossRef] [PubMed]
  62. Tian, X.; Zhang, M.; Yang, C.; Ma, J. Fusionndvi: A computational fusion approach for high-resolution normalized difference vegetation index. IEEE Trans. Geosci. Remote Sens. 2020, 59, 5258–5271. [Google Scholar] [CrossRef]
  63. Li, M.; Wang, H.; Zhang, W. The Geographical Characteristics and Tourism Resources of Shuangyue Bay, Guangdong. Geogr. Res. 2014, 33, 789–797. [Google Scholar]
  64. Liu, Z.; Zhang, J.; Huang, W. Preliminary Study on the Impact of Human Activities on the Coastal Environment of Shuangyue Bay, Guangdong Province. Mar. Sci. 2015, 40, 112–120. [Google Scholar]
  65. Zhang, R.; Jia, M.; Wang, Z.; Zhou, Y.; Wen, X.; Tan, Y.; Cheng, L. A Comparison of Gaofen-2 and Sentinel-2 Imagery for Mapping Mangrove Forests Using Object-Oriented Analysis and Random Forest. IEEE J. Sel. Top. Appl. Earth Obs. Remote Sens. 2021, 14, 4185–4193. [Google Scholar] [CrossRef]
  66. Jia, K.; Liu, J.; Tu, Y.; Li, Q.; Sun, Z.; Wei, X.; Yao, Y.; Zhang, X. Land use and land cover classification using Chinese GF-2 multispectral data in a region of the North China Plain. Front. Earth Sci. 2019, 13, 327–335. [Google Scholar] [CrossRef]
  67. Pan, Z.; Xu, J.; Guo, Y.; Hu, Y.; Wang, G. Deep learning segmentation and classification for urban village using a worldview satellite image based on U-Net. Remote Sens. 2020, 12, 1574. [Google Scholar] [CrossRef]
  68. Wang, S.; Chen, W.; Xie, S.M.; Azzari, G.; Lobell, D.B. Weakly supervised deep learning for segmentation of remote sensing imagery. Remote Sens. 2020, 12, 207. [Google Scholar] [CrossRef]
  69. Shao, Y.; Cooner, A.J.; Walsh, S.J. Assessing Deep Convolutional Neural Networks and Assisted Machine Perception for Urban Mapping. Remote Sens. 2021, 13, 1523. [Google Scholar] [CrossRef]
  70. Zhang, Z.; Liu, Q.; Wang, Y. Road extraction by deep residual u-net. IEEE Geosci. Remote Sens. Lett. 2018, 15, 749–753. [Google Scholar] [CrossRef]
  71. Stehman, S.V. Selecting and interpreting measures of thematic classification accuracy. Remote Sens. Environ. 1997, 62, 77–89. [Google Scholar] [CrossRef]
  72. Powers, D.M. Evaluation: From precision, recall and F-measure to ROC, informed, markedness and correlation. J. Mach. Learn. Technol. 2011, 2, 37–63. [Google Scholar]
  73. Shang, R.; Zhang, J.; Jiao, L.; Li, Y.; Marturi, N.; Stolkin, R. Multi-scale adaptive feature fusion network for semantic segmentation in remote sensing images. Remote Sens. 2020, 12, 872. [Google Scholar] [CrossRef]
  74. Wei, S.; Zhang, H.; Wang, C.; Wang, Y.; Xu, L. Multi-temporal SAR data large-scale crop mapping based on U-Net model. Remote Sens. 2019, 11, 68. [Google Scholar] [CrossRef]
  75. Pal, M.; Mather, P.M. Support Vector Machines for Classification in Remote Sensing. Int. J. Remote Sens. 2005, 26, 1007–1011. [Google Scholar] [CrossRef]
  76. Belgiu, M.; Drăguţ, L. Random Forest in Remote Sensing: A Review of Applications and Future Directions. ISPRS J. Photogramm. Remote Sens. 2016, 114, 24–31. [Google Scholar] [CrossRef]
  77. Li, Z.; Chen, B.; Wu, S.; Su, M.; Chen, J.M.; Xu, B. Deep learning for urban land use category classification: A review and experimental assessment. Remote Sens. Environ. 2024, 311, 114290. [Google Scholar] [CrossRef]
  78. Zhang, Q.; Seto, K.C. Mapping urbanization dynamics at regional and global scales using multitemporal DMSP/OLS nighttime light data. Remote Sens. Environ. 2011, 115, 2320–2329. [Google Scholar] [CrossRef]
Figure 1. Study area. (I) Mixed forest and farm land areas. (II) Woodland-dominated areas. (III) Low-density artificial surface areas. (IV) High-density artificial surface areas. (V) Mixed land and water boundary zone.
Applsci 14 07050 g001
Figure 2. Workflow of a coastal classification framework.
Applsci 14 07050 g002
Figure 3. Structure of U-Net network.
Applsci 14 07050 g003
Figure 4. Training accuracy, verification accuracy, and loss value of U-Net model.
Applsci 14 07050 g004
Figure 5. Classification results of different models. (a) Original RGB image. (b) Classification results based on the U-Net model. (c) Classification results based on the SegNet model. (d) Classification results based on the DeepLab v3+ model. (e) Classification results based on the SVM model. (f) Classification results based on the RF model.
Applsci 14 07050 g005
Figure 6. Multi-feature image classification results based on U-Net. (a) Original RGB image. (b) Original RGB image classification results. (c) Original image + texture feature classification result. (d) Original image + NDVI classification result. (e) Original image + contrast feature classification result. (f) Original image + multi-feature (texture, vegetation, contrast) classification result.
Applsci 14 07050 g006aApplsci 14 07050 g006b
Figure 7. Performance of U-Net model after fusion of multiple features.
Applsci 14 07050 g007
Table 1. Selected training and testing samples.
CategoriesWater BodyArtificial SurfaceForest LandFarm LandTotal
Training samples16,65820,51821,77917,01375,968
Testing samples416451305445425318,992
Total20,82225,64827,22421,26694,960
Table 2. Averaged OA, Kappa, and F1-score of selected models.
U-NetSegNetDeepLab v3+SVMRF
OA/%86.3285.4886.1282.5884.73
Kappa0.840.810.820.760.78
F1-score0.850.840.840.810.83
Table 3. Averaged accuracy value per land cover class achieved with multi-feature using U-Net classifier.
Original Image+NDVI+Texture+Contrast+Multi-Feature
Artificial surface0.890.920.920.90.94
Wood land0.860.970.910.820.97
Farm land0.650.680.710.760.88
Water body0.870.880.950.980.98
OA/%86.3288.9589.7487.9393.65
Kappa0.840.850.860.850.89
F1-score0.850.890.890.870.90
Disclaimer/Publisher’s Note: The statements, opinions and data contained in all publications are solely those of the individual author(s) and contributor(s) and not of MDPI and/or the editor(s). MDPI and/or the editor(s) disclaim responsibility for any injury to people or property resulting from any ideas, methods, instructions or products referred to in the content.

