
Numerical Methods as an Aid in the Selection of Roof Bolting Systems for Access Excavations Located at Different Depths in the LGCB Mines


Abstract
1. Introduction
- Roof bedding (vertical split);
- Concentration of mineralised cracks;
- Fault concentration;
- Average fault throw;
- Tensile strength of the roof rock beam.
2. Predictions of the Stability of Headings in the LGCB Mines
- σ1—value of the maximum principal effective stress at failure,
- σ3—value of the minimum principal effective stress at failure,
- mb—the Hoek–Brown constant for the rock mass,
- s and a—constants depending on the rock mass properties,
- σci—uniaxial compressive strength of the rock sample.
- σ1—effective maximum stress at failure,
- σ3—effective minimum stress at failure,
- φ—internal friction angle,
- c—cohesion,
- σt—uniaxial tensile strength of the rock mass.

| Location | Rock Type | h [m] | Es [MPa] | ν [-] | σt [MPa] | φ [°] | c [MPa] | δ [°] | φres [°] | cres [MPa] |
|---|---|---|---|---|---|---|---|---|---|---|
| Anhydrite I-III | 5.50 | 29,356.00 | 0.24 | 0.871 | 38.66 | 8.137 | 2.00 | 36.73 | 1.627 | |
| Roof | Anhydrite IV | 9.30 | 28,066.78 | 0.24 | 0.696 | 38.66 | 6.505 | 2.00 | 36.73 | 1.301 |
| Dolomite I-VIII | 7.20 | 52,975.30 | 0.25 | 3.611 | 39.00 | 14.879 | 2.00 | 37.05 | 2.976 | |
| Walls | Dolomite—shale—sandstone formations | 3.50 | 17,435.35 | 0.20 | 0.976 | 37.41 | 5.971 | 2.00 | 35.54 | 1.194 |
| Floor | Sandstone | 9.50 | 7072.00 | 0.14 | 0.093 | 39.06 | 2.520 | 2.00 | 39.06 | 2.520 |
- σz—vertical stresses,
- σx and σy—horizontal stresses.
| Depth H [m] | Vertical Stresses σz [MPa] | Horizontal Stresses σx [MPa] | Horizontal Stresses σy [MPa] |
|---|---|---|---|
| 1000 | 22.11 | 22.11 | 22.11 |
| 1300 | 30.12 | 30.12 | 30.12 |
- Load variant 1 (heading depth H = 1000 m b.g.l.):
- –
- side edges: px = 22.11 MPa;
- –
- upper edge and bottom edge: pz = 22.11 MPa;
- –
- direction perpendicular to plate surface: py = 22.11 MPa.
- Load variant 2 (heading depth H = 1300 m b.g.l.):
- –
- side edges: px = 30.12 MPa;
- –
- upper edge and bottom edge: pz = 30.12 MPa;
- –
- direction perpendicular to plate surface: py = 30.12 MPa.
- Step 1: original state of the rock mass (no mining excavations present in the analysed plate);
- Step 2: state with the excavations present (four mining excavations present in the rock mass).
3. Modelling Results
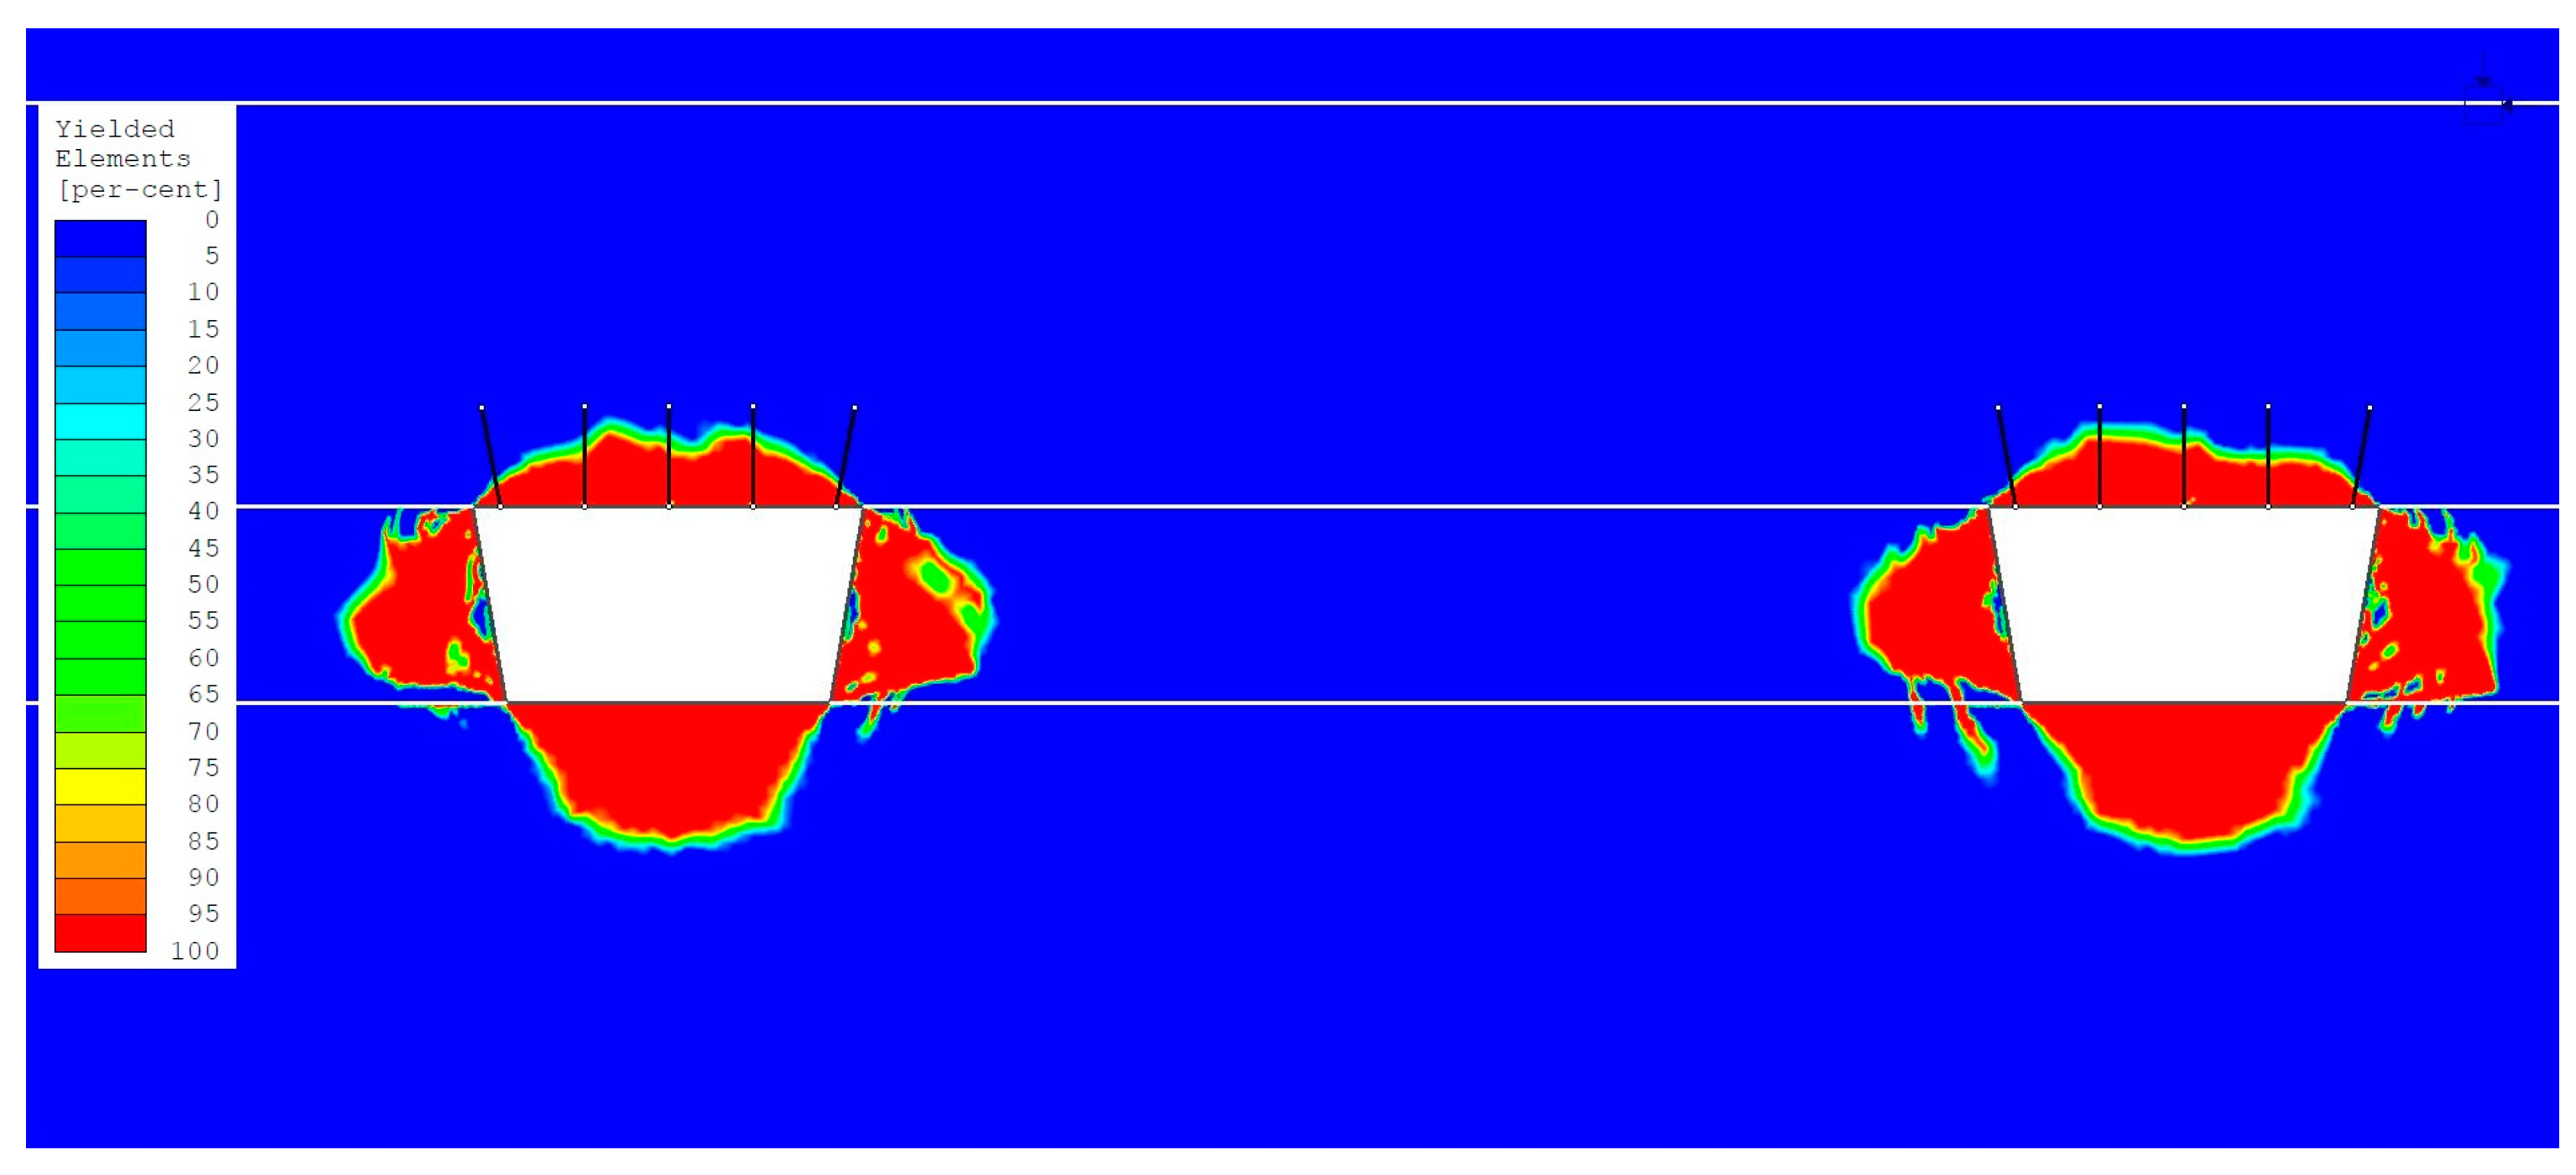
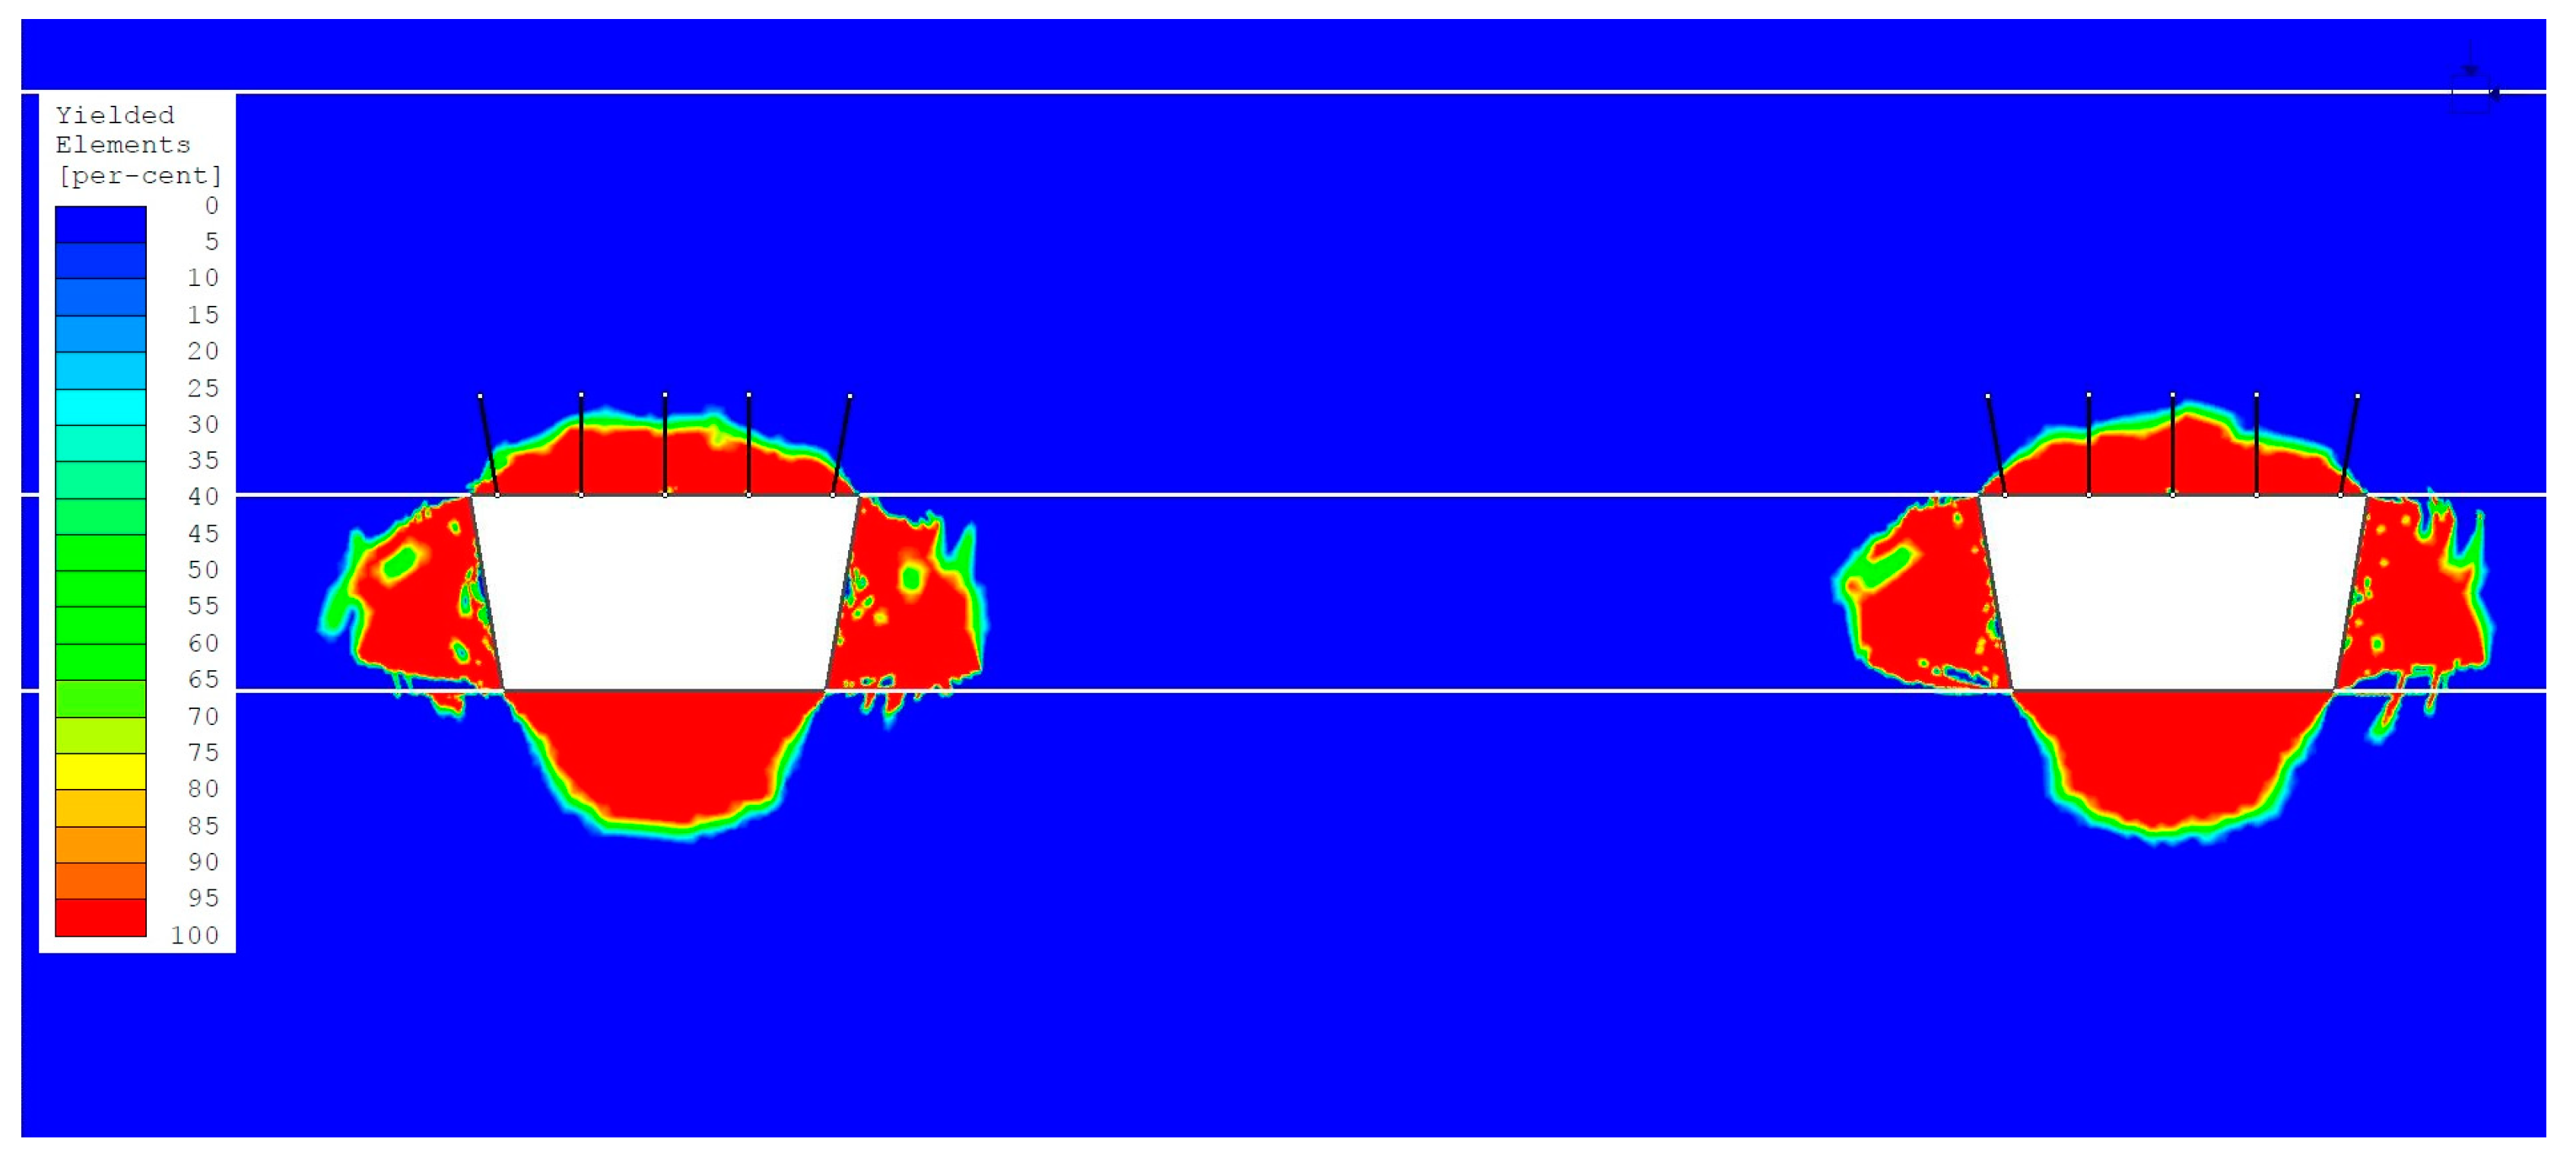
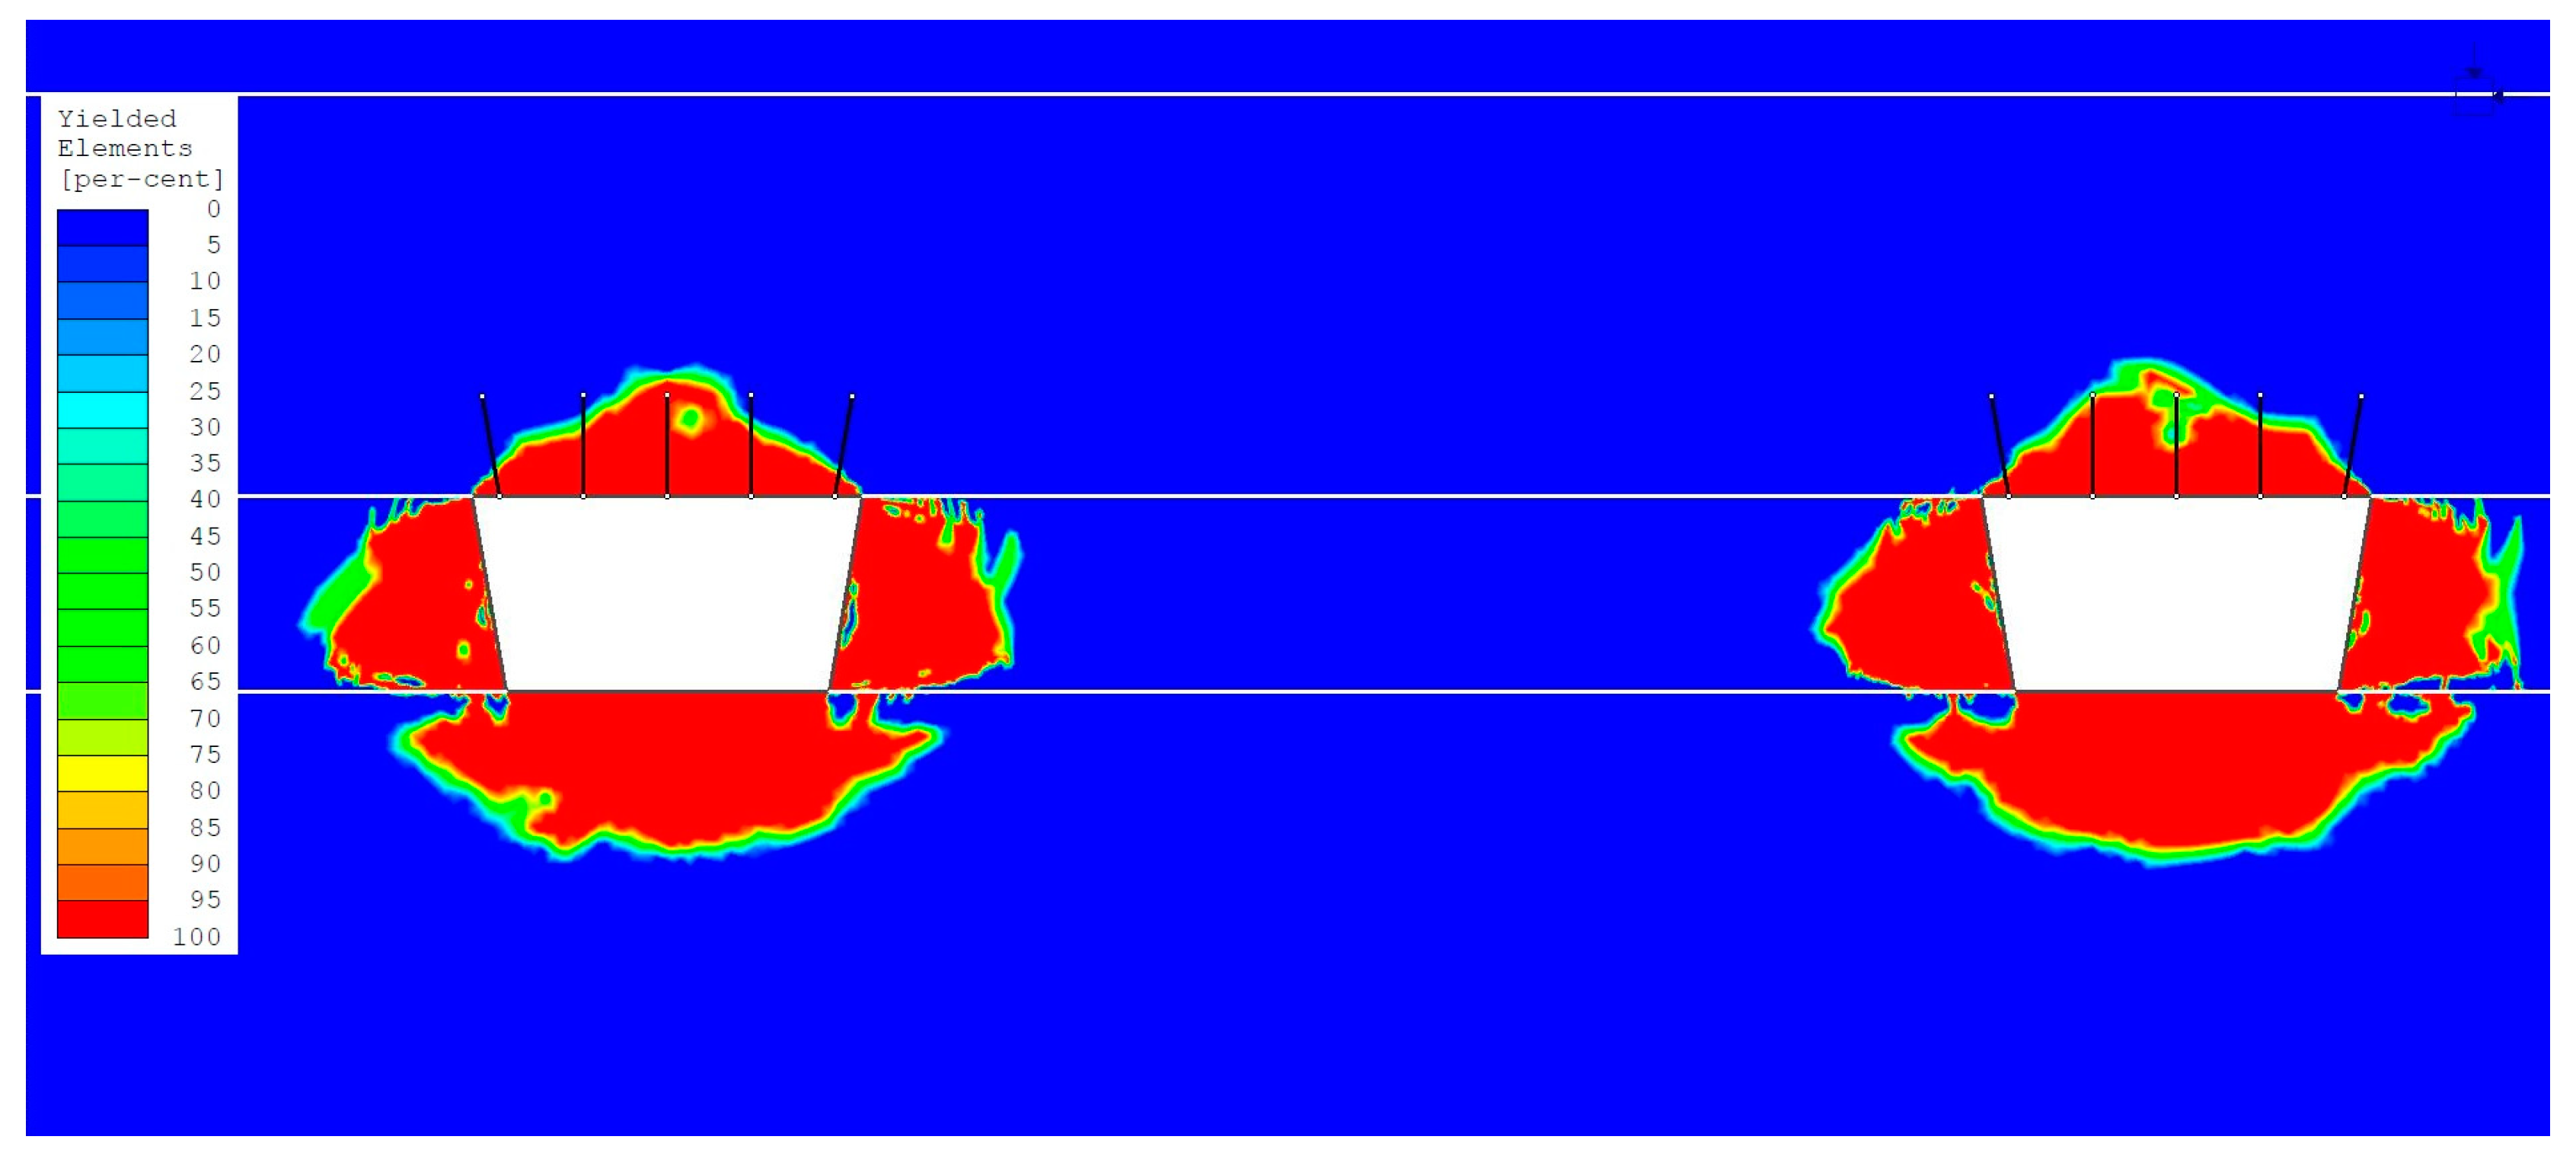
- The maximum range of the yielded rock mass (from 50% to 100%) in the roof (Table 8) of the headings located at the depth of 1000 m b.g.l. (load variant 1) was from 1.35 m to 1.54 m (Figure 3 and Figure 4). For comparison, the maximum range of the yielded rock mass (from 50% to 100%) in the roof of the headings located at the depth of 1300 m b.g.l. (load variant 2) was from 1.97 m to 2.33 m (Figure 5 and Figure 6). A change in the heading depth from 1000 m b.g.l. to 1300 m b.g.l. has thus caused the range of the yielded rock mass in the heading roof to increase from 0.43 m (heading 4) to 0.98 m (heading 2). The maximum range of the yielded rock mass in the roofs of all headings was greater than the 1.8 m range of the bolted zone. This fact indicates that in the LGCB mines, the heading depth in the rock mass may have a decisive impact on its stability. Problems with heading stability may occur when the yielded rock zone in the roof is larger than the bolted zone.
- The surface of the yielded rock area around a group of headings increases together with an increase in the excavation depth (increase in primary stress in the rock mass); this phenomenon negatively influences the stability of mining excavations and is strictly related to the stress and strain parameters of the rock layers surrounding the excavations.
- The maximum range of the yielded rock mass (from 50% to 100%) in the walls (Table 9) of the headings located at the depth of 1000 m b.g.l. was from 2.69 m to 3.02 m (Figure 3 and Figure 4). For comparison, the maximum range of the yielded rock mass (from 50% to 100%) in the walls of the headings located at the depth of 1300 m b.g.l. was from 3.23 m to 3.47 m (Figure 5 and Figure 6). A change in the heading depth from 1000 m b.g.l. to 1300 m b.g.l. has thus caused the range of the yielded rock mass in the walls to increase from 0.32 m (heading 4, left wall) to 0.62 m (heading 1, left wall).
- A more complex formation mechanism of yielded rock mass was observed in the floors of the excavations. A change in the heading depth from 1000 m b.g.l. to 1300 m b.g.l. has caused the vertical range of the yielded rock mass in the floors to increase only to a limited degree in comparison to the change in the horizontal range. The maximum vertical range of the yielded rock mass (from 50% to 100%) in the floors of the headings (Table 10) was from 2.53 m to 2.58 m (for the depth of 1000 m b.g.l.) and from 2.92 m to 3.13 m (for the depth of 1300 m b.g.l.) A change in the heading depth caused the vertical range of the yielded rock mass to increase from 0.38 m (heading 1 and heading 4) to 0.60 m (heading 3).
- The horizontal ranges of the yielded rock mass in the floors changed more significantly due to the change in the heading depth (Table 11). The maximum horizontal range of the yielded rock mass (from 50% to 100%) in the floors of the headings located at the depth of 1000 m b.g.l. was 5.80 m and was equal to the width of the heading at the floor. In the headings located at the depth of 1300 m b.g.l., the horizontal range of the yielded rock mass in the floors increased significantly and was from 9.52 m to 10.25 m. A change in the heading depth has thus caused the horizontal range of the yielded rock mass to increase from 3.72 m (heading 1) to 4.45 m (heading 2).
- The results of the numerical analyses obtained for the plastic-elastic model with rock softening correspond best to the observed cases of stability loss in the mining excavations in the LGBC mines.
4. Discussion
Author Contributions
Funding
Institutional Review Board Statement
Informed Consent Statement
Data Availability Statement
Conflicts of Interest
References
- KGHM Polska Miedz, S.A. Available online: https://kghm.com/pl/biznes/wydobycie-i-wzbogacanie (accessed on 20 April 2024).
- Collaborative Publication. Instructions on Determining the Geomechanical Parameters of Roof Rocks with Respect to Roof Classes in Copper Mines, as Required in the Selection of a Roof Bolting System Design; KGHM Polska Miedz S.A.: Lubin, Poland, 2017. (In Polish) [Google Scholar]
- Collaborative Publication. Regulations on the Selection, Construction and Control of Excavation Support in the KGHM Polska Miedz S.A. Mines; KGHM Polska Miedz S.A.: Lubin, Poland, 2017. (In Polish) [Google Scholar]
- Pawelus, D. Stability assessment of headings situated in a field of high horizontal stress in Polish copper mines by means of numerical methods. IOP Conf. Ser. Earth Environ. Sci. 2019, 221, 012097. [Google Scholar] [CrossRef]
- Pande, G.; Beer, G.; Williams, J. Numerical Methods in Rock Mechanics; Wiley: New York, NY, USA, 1990. [Google Scholar]
- Zeller, S.S.; Pollard, D.D. Boundary conditions for rock fracture analysis using the boundary element method. J. Geophys. Res. Solid Earth 1992, 97, 1991–1997. [Google Scholar] [CrossRef]
- Beer, G.; Pousen, A. Efficient numerical modelling of faulted rock using the boundary element method. Int. J. Rock Mech. Min. Sci. 1995, 31, 485–506. [Google Scholar] [CrossRef]
- Cerrolaza, M.; Garcia, R. Boundary elements and damage mechanics to analyze excavations in rock mass. Eng. Anal. Bound. Elem. 1997, 20, 1–16. [Google Scholar] [CrossRef]
- Pan, E.; Amadei, B.; Kim, Y.I. 2D BEM analysis of anisotropic half-plane problems—Application to rock mechanics. Int. J. Rock Mech. Min. Sci. 1998, 35, 69–74. [Google Scholar] [CrossRef]
- Shou, K.J. A three-dimensional hybrid boundary element method for non-linear analysis of a weak plane near an underground excavation. Tunn. Undergr. Space Technol. 2000, 15, 215–226. [Google Scholar] [CrossRef]
- Jing, L.; Hudson, J.A. Numerical methods in rock mechanics. Int. J. Rock Mech. Min. Sci. 2002, 39, 409–427. [Google Scholar] [CrossRef]
- Jing, L. A review of technics, advances and outstanding issues in numerical modelling for rock mechanics and rock engineering. Int. J. Rock Mech. Min. Sci. 2003, 40, 283–353. [Google Scholar] [CrossRef]
- Yasitli, N.E.; Unver, B. 3D numerical modelling of longwall mining with top-coal caving. Int. J. Rock Mech. Min. Sci. 2005, 42, 219–235. [Google Scholar] [CrossRef]
- Henning, J.G.; Mitri, H.S. Numerical modelling of ore dilution in blasthole stoping. Int. J. Rock Mech. Min. Sci. 2007, 44, 692–703. [Google Scholar] [CrossRef]
- Wang, J.; Apel, D.B.; Pu, Y.; Hall, R.; Wei, C.; Sepehri, M. Numerical modeling for rockbursts: A state-of-the-art review. J. Rock Mech. Geotech. Eng. 2021, 13, 457–478. [Google Scholar] [CrossRef]
- Kruszewski, M.; Montegrossi, G.; Balcewicz, M.; Igbokwe, O.A.; Backers, T.; Saenger, E.H. 3D in situ stress state modelling and fault reactivation risk exemplified in the Ruhr region (Germany). Geomech. Energy Environ. 2022, 32, 100386. [Google Scholar] [CrossRef]
- Wang, J.; Apel, D.B.; Dyczko, A.; Walentek, A.; Prusek, S.; Xu, H.; Wei, C. Analysis of the damage mechanism of strainbursts by a global-local modeling approach. J. Rock Mech. Geotech. Eng. 2022, 14, 1671–1696. [Google Scholar] [CrossRef]
- Chen, D.; Zhu, J.; Ye, Q.; Ma, X.; Xie, S.; Guo, W.; Li, Z.; Wang, Z.; Feng, S.; Yan, X. Application of Gob-Side Entry Driving in Fully Mechanized Caving Mining: A Review of Theory and Technology. Energies 2023, 16, 2691. [Google Scholar] [CrossRef]
- Shabanimashcool, M.; Li, C.C. Numerical modelling of longwall mining and stability analysis of the gates in a coal seam. Int. J. Rock Mech. Min. Sci. 2012, 51, 24–34. [Google Scholar] [CrossRef]
- Zhu, D.; Tu, S. Mechanisms of support failure induced by repeated mining under gobs created by two-seam room mining and prevention measures. Eng. Fail. Anal. 2017, 82, 161–178. [Google Scholar] [CrossRef]
- Feng, G.; Wang, P. Simulation of recovery of upper remnant coal pillar while mining the ultra-close lower panel using longwall top coal caving. Int. J. Min. Sci. Technol. 2020, 30, 55–61. [Google Scholar] [CrossRef]
- Sepehri, M.; Apel, D.B.; Adeeb, S.; Leveille, P.; Hall, R.A. Evaluation of mining induced energy and rockburst prediction at a diamond mine in Canada using a full 3D elastoplastic finite element model. Eng. Geol. 2020, 266, 105457. [Google Scholar] [CrossRef]
- Wang, J.; Qiu, P.; Ning, J.; Zhuang, L.; Yang, S. A numerical study of the mining-induced energy redistribution in a coal seam adjacent to an extracted coal panel during longwall face mining: A case study. Energy Sci. Eng. 2020, 8, 817–835. [Google Scholar] [CrossRef]
- Wei, C.; Zhang, C.; Canbulat, I. Numerical analysis of fault-slip behaviour in longwall mining using linear slip weakening law. Tunn. Undergr. Space Technol. 2020, 104, 103541. [Google Scholar] [CrossRef]
- Xiaojun, F.; Qiming, Z.; Muhammad, A. 3D modelling of the strength effect of backfill-rock on controlling rockburst risk: A case study. Arab. J. Geosci. 2020, 13, 128. [Google Scholar] [CrossRef]
- Zhang, Z.; Deng, M.; Wang, X.; Yu, W.; Zhang, F.; Dao, V.D. Field and numerical investigations on the lower coal seam entry failure analysis under the remnant pillar. Eng. Fail. Anal. 2020, 115, 104638. [Google Scholar] [CrossRef]
- Jendrys, M.; Hadam, A.; Cwiekala, M. Directional Hydraulic Fracturing (DHF) of the Roof, as an Element of Rock Burst Prevention in the Light of Underground Observations and Numerical Modelling. Energies 2021, 14, 562. [Google Scholar] [CrossRef]
- Adach-Pawelus, K. Back-calculation method for estimation of geomechanical parameters in numerical modeling based on in-situ measurements and statistical methods. Energies 2022, 15, 4729. [Google Scholar] [CrossRef]
- Wang, J.; Apel, D.B.; Xu, H.; Wei, C. Evaluation of the performance of yielding rockbolts during rockbursts using numerical modeling method. Int. J. Coal Sci. Technol. 2022, 9, 87. [Google Scholar] [CrossRef]
- Guo, Y.; Luo, L.; Wang, C. Research on Fault Activation and Its Influencing Factors on the Barrier Effect of Rock Mass Movement Induced by Mining. Appl. Sci. 2023, 13, 651. [Google Scholar] [CrossRef]
- Jaiswal, A.; Shrivastva, B.K. Numerical simulation of coal pillar strength. Int. J. Rock Mech. Min. Sci. 2009, 46, 779–788. [Google Scholar] [CrossRef]
- Lucas, D.S.; Vakili, A.; Hutchison, B.J. Three-dimensional numerical modelling for successful design of steep slopes at the Kanmantoo copper mine. In Slope Stability 2020: Proceedings of the 2020 International Symposium on Slope Stability in Open Pit Mining and Civil Engineering; Dight, P.M., Ed.; Australian Centre for Geomechanics: Perth, Australia, 2020; pp. 1083–1096. [Google Scholar] [CrossRef]
- Adach-Pawelus, K.; Pawelus, D. Influence of driving direction on the stability of a group of headings located in a field of high horizontal stresses in the Polish underground copper mines. Energies 2021, 14, 5955. [Google Scholar] [CrossRef]
- Batugin, A.; Wang, Z.; Su, Z.; Sidikovna, S.S. Combined support mechanism of rock bolts and anchor cables for adjacent roadways in the external staggered split-level panel layout. Int. J. Coal Sci. Technol. 2021, 8, 659–673. [Google Scholar] [CrossRef]
- Skrzypkowski, K. 3D Numerical modelling of the application of cemented paste backfill on displacements around strip excavations. Energies 2021, 14, 7750. [Google Scholar] [CrossRef]
- Tahmasebinia, F.; Yang, A.; Feghali, P.; Skrzypkowski, K. A Numerical investigation to calculate ultimate limit state capacity of cable bolts subjected to impact loading. Appl. Sci. 2023, 13, 15. [Google Scholar] [CrossRef]
- Tahmasebinia, F.; Yang, A.; Feghali, P.; Skrzypkowski, K. Structural evaluation of cable bolts under static loading. Appl. Sci. 2023, 13, 1326. [Google Scholar] [CrossRef]
- Feng, C.; Liu, S.; Jia, H.; Fu, M.; He, D. Strengthening Device for Improving Shear Performance of Anchor Cable in Rock Support. Materials 2024, 17, 197. [Google Scholar] [CrossRef] [PubMed]
- Hoek, E.; Carranza-Torres, C.T.; Corkum, B. Hoek-Brown failure criterion—2002 edition. In Proceedings of the North American Rock Mechanics Society Meeting, Toronto, ON, Canada, 7–10 July 2002. [Google Scholar]
- Hoek, E. Strength of rock and rock masses. ISRM News J. 1994, 2, 4–16. [Google Scholar]
- Hoek, E.; Brown, E.T. Practical estimates of rock mass strength. Int. J. Rock Mech. Min. Sci. 1997, 34, 1165–1186. [Google Scholar] [CrossRef]
- Hoek, E.; Marinos, P. GSI: A geologically friendly tool for rock mass strength estimation. In Proceedings of the ISRM International Symposium, Melbourne, Australia, 19–24 November 2000. [Google Scholar]
- Minova. Available online: https://www.minovaglobal.com/emea-cis/products/steel-gfrp/rock-bolts/resin-bolts-type-rm-18/ (accessed on 20 February 2024).
- Polish Standard PN-G-05016:1997; Mining Shafts, Casing, Loads. Polish Committee for Standardization (PKN): Warsaw, Poland, 1997. (In Polish)
- Pawelus, D.; Butra, J.; Madziarz, M.; Debkowski, R. Regulations on the Selection of Support Systems for Special-Purpose Room Excavations in Copper Ore Mines—Stage 1; KGHM Polska Miedz S.A.: Wroclaw, Poland, 2015. (In Polish) [Google Scholar]
- Pawelus, D.; Butra, J.; Adach, K.; Madziarz, M.; Debkowski, R. Regulations on the Selection of Support Systems for Special-Purpose Room Excavations in Copper Ore Mines—Stage 2; KGHM Polska Miedz S.A.: Wroclaw, Poland, 2015. (In Polish) [Google Scholar]
- Pawelus, D. Regulations on the Selection of Support Systems for Special-Purpose Room Excavations in Copper Ore Mines—Stage 3; KGHM Polska Miedz S.A.: Wroclaw, Poland, 2016. (In Polish) [Google Scholar]


| Roof Class | Maximum Excavation Width [m] | Bolting Mesh [m] |
|---|---|---|
| I | 6.0 | 1.0 × 1.0 |
| II | 7.0 | 1.0 × 1.0 |
| III | 7.0 | 1.5 × 1.5 |
| IV | 7.0 | 2.0 × 2.0 |
| V | 8.0 | 2.0 × 2.0 |
| Location | Rock Type | h [m] | ρ [MPa] | Rc [MPa] | Rr [MPa] | Ei [MPa] | ν [-] |
|---|---|---|---|---|---|---|---|
| Roof | Anhydrite I | 0.70 | 2.94 | 132.49 | 6.43 | 42,420.00 | 0.24 |
| Anhydrite II | 1.80 | 2.94 | 117.61 | 5.25 | 38,240.00 | 0.24 | |
| Anhydrite III | 3.00 | 2.94 | 97.88 | 5.58 | 40,600.00 | 0.24 | |
| Anhydrite IV | 9.30 | 2.94 | 86.93 | 5.94 | 38,300.00 | 0.24 | |
| Dolomite I | 1.20 | 2.81 | 175.86 | 7.20 | 68,400.00 | 0.26 | |
| Dolomite II | 1.70 | 2.79 | 156.21 | 8.03 | 47,290.00 | 0.25 | |
| Dolomite III | 0.60 | 2.63 | 194.22 | 10.05 | 89,800.00 | 0.27 | |
| Dolomite IV | 0.70 | 2.64 | 186.60 | 8.98 | 82,050.00 | 0.28 | |
| Dolomite V | 1.00 | 2.70 | 165.69 | 4.55 | 65,050.00 | 0.24 | |
| Dolomite VI | 0.70 | 2.73 | 126.89 | 9.59 | 23,400.00 | 0.22 | |
| Dolomite VII | 0.60 | 2.65 | 188.90 | 10.87 | 84,400.00 | 0.27 | |
| Dolomite VIII | 0.70 | 2.80 | 118.44 | 5.45 | 39,150.00 | 0.23 | |
| Dolomite IX | 1.60 | 2.71 | 95.00 | 10.16 | 27,170.00 | 0.22 | |
| Walls | Dolomitic shale | 0.60 | 2.69 | 111.49 | 9.06 | 28,890.00 | 0.23 |
| Sandstone I | 1.20 | 2.40 | 47.85 | 2.93 | 16,940.00 | 0.17 | |
| Floor | Sandstone II | 9.50 | 2.33 | 36.19 | 2.78 | 13,600.00 | 0.14 |
| Location | Rock Type | c [MPa] | φ [°] | σt [MPa] | Erm [MPa] |
|---|---|---|---|---|---|
| Roof | Anhydrite I | 9.914 | 38.66 | 1.061 | 31,085.97 |
| Anhydrite II | 8.801 | 38.66 | 0.942 | 28,022.81 | |
| Anhydrite III | 7.324 | 38.66 | 0.784 | 29,752.25 | |
| Anhydrite IV | 6.505 | 38.66 | 0.696 | 28,066.78 | |
| Dolomite I | 16.040 | 39.00 | 3.893 | 60,215.79 | |
| Dolomite II | 14.248 | 39.00 | 3.458 | 41,631.65 | |
| Dolomite III | 17.715 | 39.00 | 4.299 | 79,055.23 | |
| Dolomite IV | 17.020 | 39.00 | 4.131 | 72,232.54 | |
| Dolomite V | 15.113 | 39.00 | 3.668 | 57,266.63 | |
| Dolomite VI | 11.574 | 39.00 | 2.809 | 20,600.14 | |
| Dolomite VII | 17.229 | 39.00 | 4.182 | 74,301.36 | |
| Dolomite VIII | 10.803 | 39.00 | 2.622 | 34,465.62 | |
| Dolomite IX | 7.579 | 37.69 | 1.442 | 22,180.23 | |
| Walls | Dolomitic shale | 6.447 | 30.41 | 1.327 | 18,250.37 |
| Sandstone I | 3.589 | 40.54 | 0.180 | 10,701.33 | |
| Floor | Sandstone II | 2.520 | 39.06 | 0.093 | 7072.00 |
| Excavation Height hw [m] | Excavation Width Below the Roof dr [m] | Excavation Width at the Floor df [m] | Mean Excavation Width da [m] | Excavation Surface Area Sr [m2] |
|---|---|---|---|---|
| 3.50 | 7.00 | 5.80 | 6.40 | 22.40 |
| Parameter | Value |
|---|---|
| Bar diameter [mm] | 18.2 |
| Bar length [m] | 1.8 |
| Bar material | steel |
| Young’s modulus [MPa] | 210,000.0 |
| Real load-capacity [kN] | 170.0 |
| Residual load-capacity [kN] | 17.0 |
| Pretension [kN] | 30.0 |
| Excavation | Yield Range in the Roof [m] | Increase in Yield Range in the Roof | ||
|---|---|---|---|---|
| Load Variant 1 | Load Variant 2 | [m] | [%] | |
| 1 | 1.42 | 2.15 | 0.73 | 51.41 |
| 2 | 1.35 | 2.33 | 0.98 | 72.59 |
| 3 | 1.36 | 2.27 | 0.91 | 66.91 |
| 4 | 1.54 | 1.97 | 0.43 | 27.92 |
| Excavation | Yield Range in the Wall [m] | Increase in Yield Range in the Wall | ||
|---|---|---|---|---|
| Load Variant 1 | Load Variant 2 | [m] | [%] | |
| 1 (left wall) | 2.83 | 3.45 | 0.62 | 21.91 |
| 1 (right wall) | 2.79 | 3.26 | 0.47 | 16.85 |
| 2 (left wall) | 2.87 | 3.47 | 0.60 | 20.91 |
| 2 (right wall) | 2.69 | 3.23 | 0.54 | 20.07 |
| 3 (left wall) | 2.89 | 3.32 | 0.43 | 14.88 |
| 3 (right wall) | 2.78 | 3.24 | 0.46 | 16.55 |
| 4 (left wall) | 3.02 | 3.34 | 0.32 | 10.60 |
| 4 (right wall) | 2.73 | 3.25 | 0.52 | 19.05 |
| Excavation | Yield Range in the Floor [m] | Increase in Yield Range in the Floor | ||
|---|---|---|---|---|
| Load Variant 1 | Load Variant 2 | [m] | [%] | |
| 1 | 2.54 | 2.92 | 0.38 | 14.96 |
| 2 | 2.58 | 2.97 | 0.39 | 15.12 |
| 3 | 2.53 | 3.13 | 0.60 | 23.72 |
| 4 | 2.58 | 2.96 | 0.38 | 14.73 |
| Excavation | Horizontal Range of Yielded Rock Mass in the Floor [m] | Increase in Horizontal Yield Range in the Floor | ||
|---|---|---|---|---|
| Load Variant 1 | Load Variant 2 | [m] | [%] | |
| 1 | 5.80 | 9.52 | 3.72 | 64.14 |
| 2 | 5.80 | 10.25 | 4.45 | 76.72 |
| 3 | 5.80 | 9.98 | 4.18 | 72.07 |
| 4 | 5.80 | 9.71 | 3.91 | 67.41 |
Disclaimer/Publisher’s Note: The statements, opinions and data contained in all publications are solely those of the individual author(s) and contributor(s) and not of MDPI and/or the editor(s). MDPI and/or the editor(s) disclaim responsibility for any injury to people or property resulting from any ideas, methods, instructions or products referred to in the content. |
© 2024 by the authors. Licensee MDPI, Basel, Switzerland. This article is an open access article distributed under the terms and conditions of the Creative Commons Attribution (CC BY) license (https://creativecommons.org/licenses/by/4.0/).
Share and Cite
Pawelus, D.; Butra, J. Numerical Methods as an Aid in the Selection of Roof Bolting Systems for Access Excavations Located at Different Depths in the LGCB Mines. Appl. Sci. 2024, 14, 7052. https://doi.org/10.3390/app14167052
Pawelus D, Butra J. Numerical Methods as an Aid in the Selection of Roof Bolting Systems for Access Excavations Located at Different Depths in the LGCB Mines. Applied Sciences. 2024; 14(16):7052. https://doi.org/10.3390/app14167052
Chicago/Turabian StylePawelus, Daniel, and Jan Butra. 2024. "Numerical Methods as an Aid in the Selection of Roof Bolting Systems for Access Excavations Located at Different Depths in the LGCB Mines" Applied Sciences 14, no. 16: 7052. https://doi.org/10.3390/app14167052
APA StylePawelus, D., & Butra, J. (2024). Numerical Methods as an Aid in the Selection of Roof Bolting Systems for Access Excavations Located at Different Depths in the LGCB Mines. Applied Sciences, 14(16), 7052. https://doi.org/10.3390/app14167052