Article

An Investigation on the Pore Structure Characterization of Sandstone Using a Scanning Electron Microscope and an Online Nuclear Magnetic Resonance System

1
Shandong Energy Group, Jinan 250101, China
2
Energy Administration of Shandong Province, Jinan 250014, China
*
Authors to whom correspondence should be addressed.
Appl. Sci. 2024, 14(16), 7063; https://doi.org/10.3390/app14167063 (registering DOI)
Submission received: 1 July 2024 / Revised: 31 July 2024 / Accepted: 5 August 2024 / Published: 12 August 2024
(This article belongs to the Special Issue Advances in Risk and Reliability Analysis)

Abstract

:
The micropore structure of porous media (such as natural rocks and man-made materials) is very complex and has strong micro heterogeneity, and pore structure is a critical parameter to estimate the rock quality. However, the pore structure characterization of rocks under load is not studied well. In this paper, sandstone specimens were preloaded to six different stress levels, and then the pore structure of rock was characterized by SEM and NMR, respectively. The results show the following: (1) The damage in sandstone increases with predefined stress, and the rate significantly increases over 0.8 uniaxial compressive strength (UCS). (2) There is a critical value in the process of rock damage (0.8 UCS), and when it is less than this critical value, the microstructure in the rock is mainly composed of pores and micro-cracks, and the length is generally less than 5 μm; when it exceeds the critical value, there are obvious cracks or even groups of cracks inside the rock. (3) The changes in porosity can be divided into three stages, showing a “√” shape tendency. (4) The pore structure can be visually presented using NMR and SEM, and the distribution mode of the pores changes from separated points to concentrated patches to finally interconnected networks of pores with an increase in the predefined stress. Overall, NMR provides a new method for characterizing rock damage and studying rock microstructure.

1. Introduction

The complex microstructure of a rock plays a decisive role in its macroscopic mechanical properties and permeability, as typical rock samples are composed of a variety of minerals and cement, potentially crossed by joints and fractures [1]. In addition, due to the complexity of the geological environment (surrounding rock stress, confining pressure, water pressure and hydrochemical solution) in which the rock is located, changes in the microstructure and macroscopic mechanical properties of the rock are very complex and highly variable. The influence of the surrounding environment on rocks cannot be neglected, along with the external load. Also, this geological environmental complexity results in nonlinear damage to the rock and is often characterized by large deformations, high strain rates and high permeability. This directly weakens the mechanical properties of the rock and its stiffness and severely affects the safety construction of geotechnical engineering, such as side slopes, foundation pits and tunnel engineering. In addition, under the action of an external load, the internal fractures expand and continuously develop, which leads to increased damage to the rock.
Currently, the study of the damage mechanism of rocks under the action of an external load is mostly based on macroscopic mechanical properties, and the few studies that focus on the impact on the microscopic level use numerical simulation and theoretical research. To some extent, these studies have a role in the mechanism of rock damage. However, for the ease of analysis and calculations, these studies often use various assumptions, decreasing the accuracy of actual changes in the rock. These simulation results and theoretical analysis do have a certain guiding purpose on the actual geotechnical engineering construction, yet a quantitative analysis of microscopic rock damage and its stability are needed to improve the accuracy of field applications.
In recent years, the development of and improvement in experimental techniques have provided the possibility of observing the internal microscopic damage of rocks. In particular, nuclear magnetic resonance (NMR) has been successfully applied in many fields due to its advantages of continuous, rapid, non-destructive testing, low cost and simple operation. NMR can clearly and accurately visualize the internal structure, composition, material and defects of an object and can quantitatively study the internal pore size based on NMR relaxation. Currently, NMR has gradually developed into a mature tool in the field of geotechnical engineering to detect the internal microscopic damage of rocks and evaluate rock stability, covering, for instance, CO2 storage [2,3], shale gas [4,5,6,7], exploration studies of hydrocarbon reservoirs [8,9], and the ability of geotechnical structures [10,11]. Chen et al. [12] used a low-field NMR to study fluid percolation and distribution during imbibition and self-drainage. The distribution of pore size was obtained using NMR from the linear relationship between the pore volume and signal strength and the relationship between the melting point and pore size [13]. Liu et al. [11] studied the structure and seepage characteristics of coal samples under different stresses and pore water pressures using NMR and found that the internal fissure–pore structures of coal samples were interwoven after water injection, and the distribution of the pore radius was diverse. Four main pore types can be identified and classified according to low-field NMR results [4]. Sun et al. [14,15] used the NMR technique to study the damage evolution law of sandstone under loading and seepage and established the discriminant equation of the damage degree of the rock body. The distribution rule of the pore size in coal can be obtained based on the linear relation between the pore volume and signal intensity using NMR [16]. The above research using NMR to detect rock microstructure characteristics provides a deeper understanding of rock damage evolution mechanisms and shows that it is reasonable to use NMR technology to study microstructural rock damage.
In this paper, uniaxial compression tests and NMR technology are used to investigate the damage mechanisms of rock samples at different stress levels from a microscopic view. The sandstone specimens were first preloaded to six different stress levels (0, 0.60 UCS, 0.7 UCS, 0.8 UCS, 0.9 UCS, and 0.95 UCS) and then unloaded to zero. NMR was then used to observe the internal microstructure and porosity changes. Changes in the T2 spectral distribution, T2 peak area, porosity, and pore size were quantified, and the distribution of pores in the rocks at different stress levels was directly observed using NMR imaging. Finally, the damage mechanisms of sandstone based on the porosity are discussed.

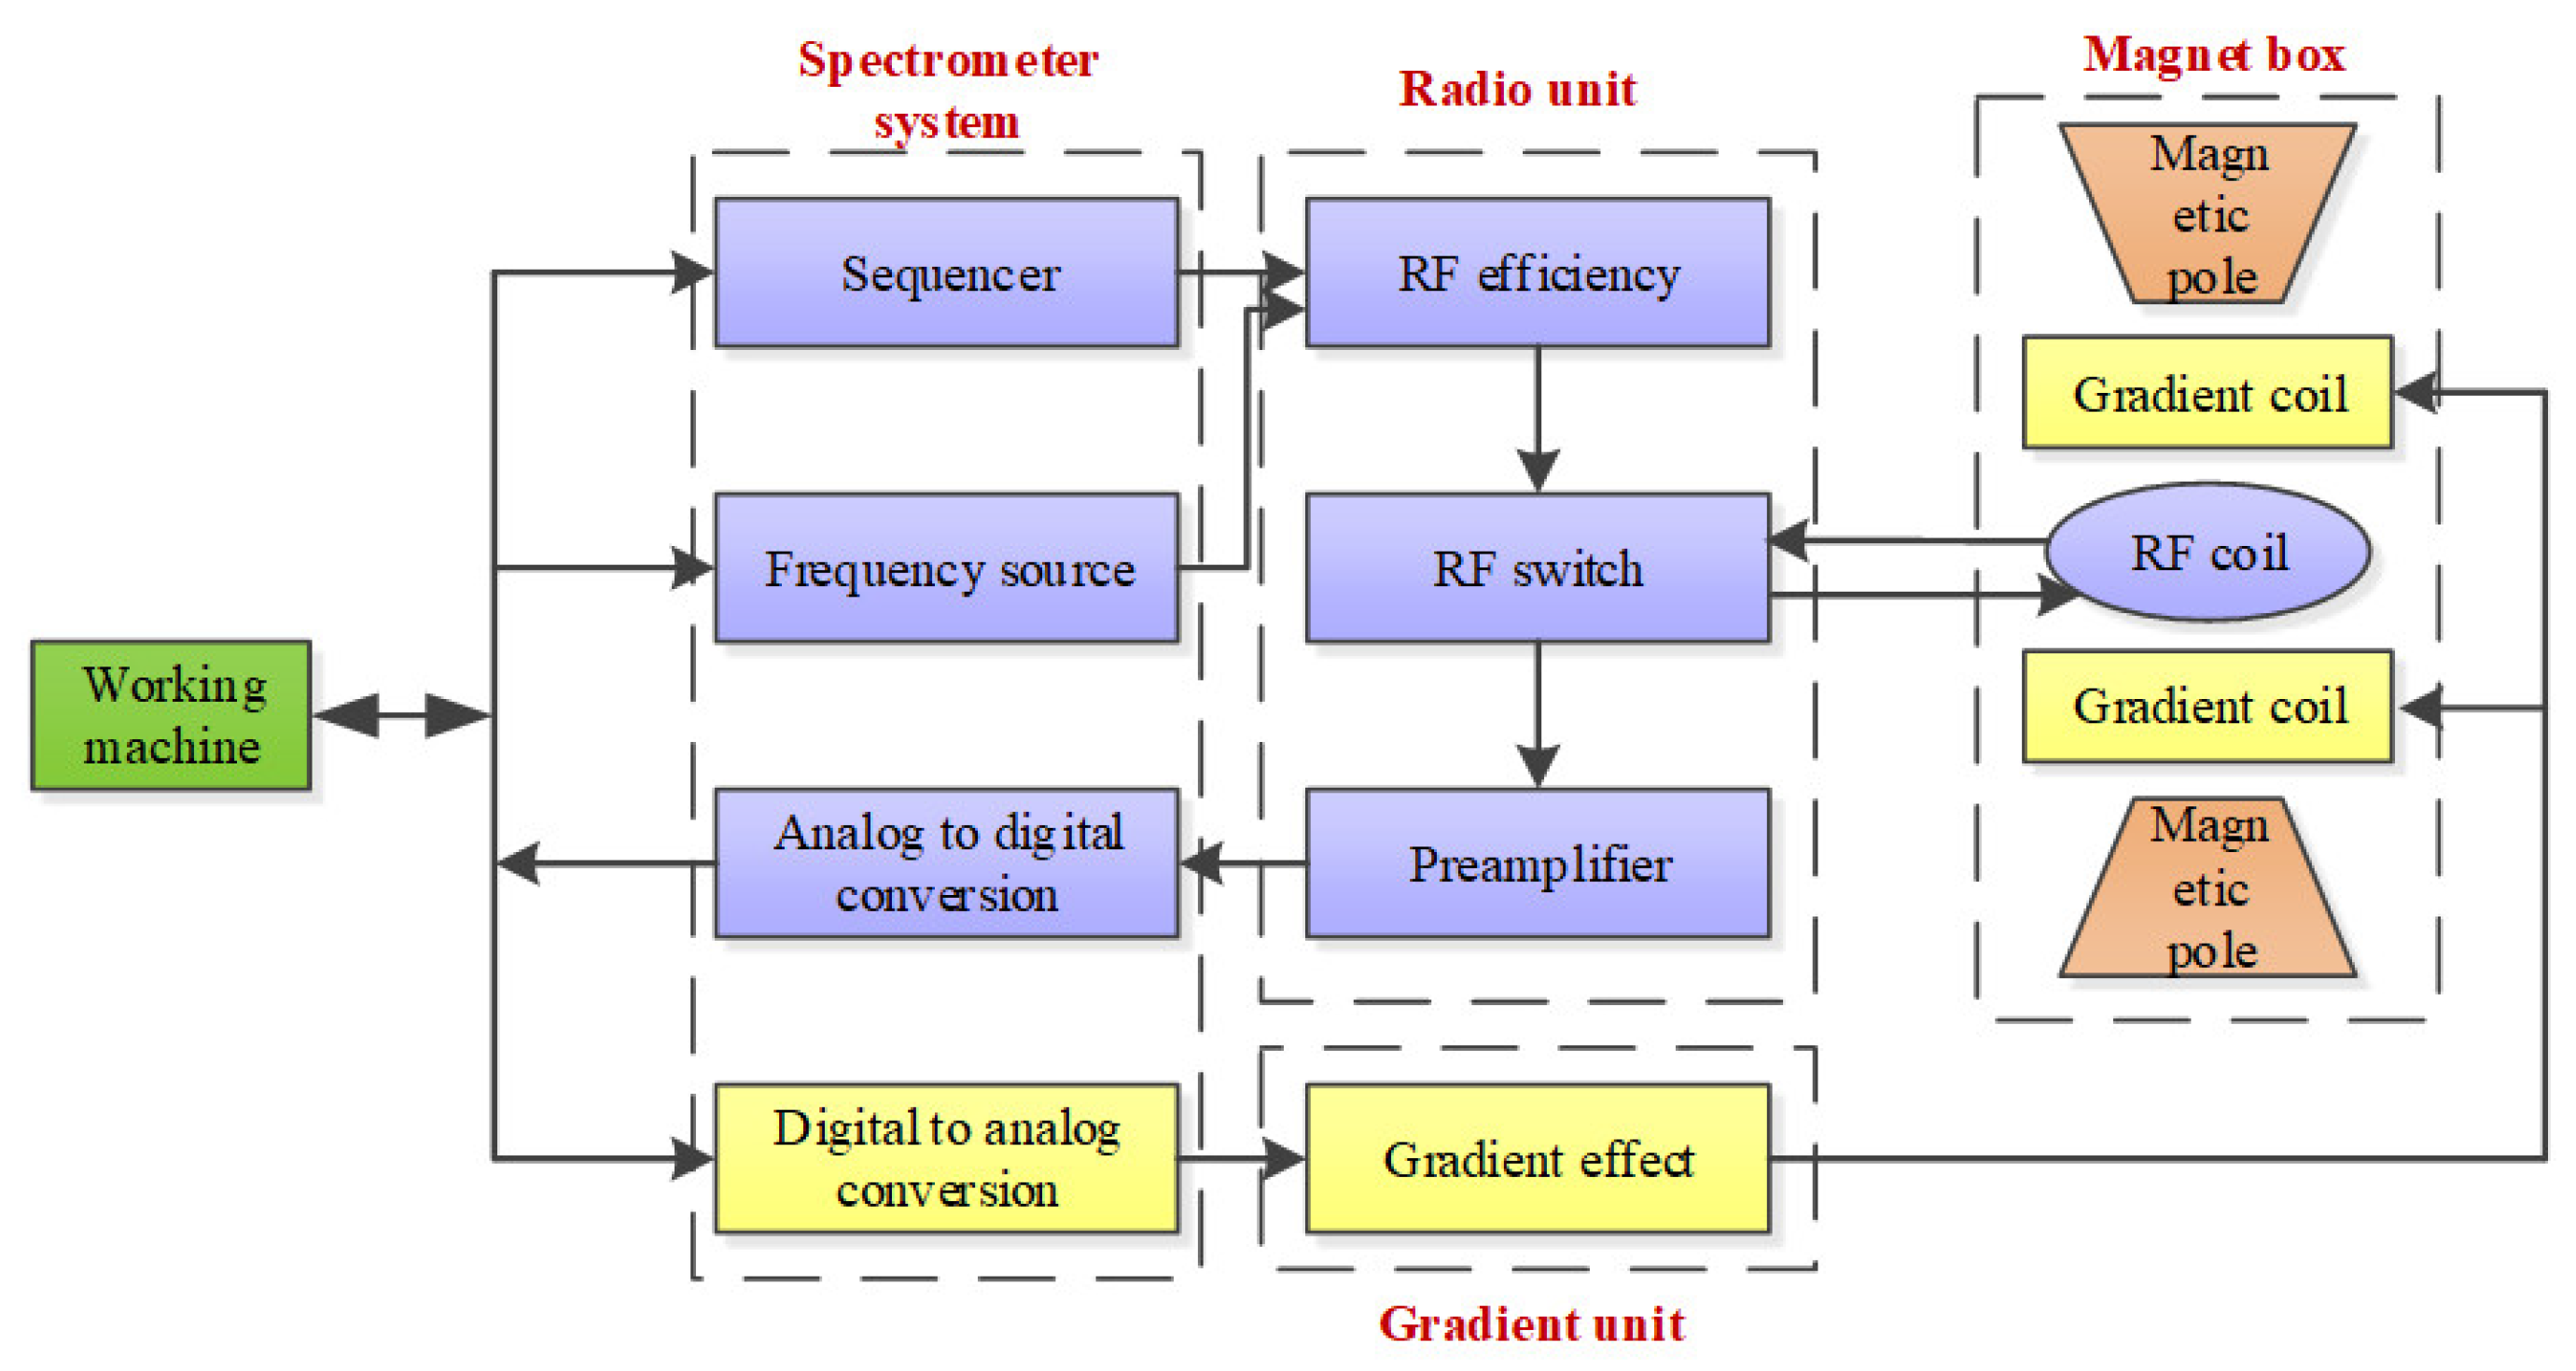
2. The Principle of NMR Method

Nuclear magnetic resonance (NMR) measurements of rock pore structure are closely related to the relaxation characteristics of hydrogen-containing fluids in the pores due to the magnetism of the nucleus and its interaction with an external magnetic field [17]. After the specimen is situated into the magnetic field, the H proton resonates by emitting a certain frequency of radiofrequency pulses, and the H proton absorbs the energy of the radio frequency pulse. The process of releasing energy from the H proton can be detected by a special coil, which is the NMR signal. The energy release rate of samples with different properties is different, and therefore, a change in the characteristics of rock pore structure can be directly reflected by comparing the difference in sample nuclear magnetic signals before and after the application of stress.
The detected magnetization signals are featured in the relaxation time, depending on the properties of the pore-filled fluids interactions between filled fluids and pores, pore size distribution, and surface relaxivity [18]. The total transverse relaxation time is determined, as shown in Equation (1) [19]:
1 T 2 = 1 T 2 s u r f a c e + 1 T 2 m o l e c u l e s + 1 T 2 f r e e
where T 2 is the total transverse relaxation time; T 2 s u r f a c e is the transverse relaxation time of the surface; T 2 m o l e c u l a r is the transverse relaxation time of the free diffusion of molecular hydrogen; and T 2 f r e e is the transverse relaxation time of the free fluid.
Under ideal diffusion conditions (i.e., the porosity of the rock is small, and the surface relaxation rate is very slow), the transverse relaxation time of the surface for a fluid-filled rock pore can be simply expressed as follows:
1 T 2 s u r f a c e = ρ 2 ( S V ) pore
where ρ 2 is the surface relaxivity; S is the surface area of the pores; V is the volume of the pores; and S/V is the surface-to-volume ratio of the pores.
As illustrated by Liu et al. [20], for saturated rocks, T 2 m o l e c u l a r and T 2 f r e e can be negligible. Therefore, combining Equations (1) and (2), T2 can be simply expressed as follows [21]:
1 T 2 1 T 2 s u r f a c e = ρ 2 ( S V ) pore
As shown in Equation (3), the pore structure characteristics of rock specimens can be accurately obtained by measuring T 2 .
Magnetic resonance imaging (MRI) is based on the different attenuation characteristics of the released energy in different structural environments within the specimen. The position and type of the atomic nucleus of the specimen can be obtained by detecting the electromagnetic waves emitted from an external gradient magnetic field, and a structural image of the specimen can be drawn accordingly. Therefore, characteristics of the pore structure of a rock can be obtained by MRI.

3. Materials and Methods

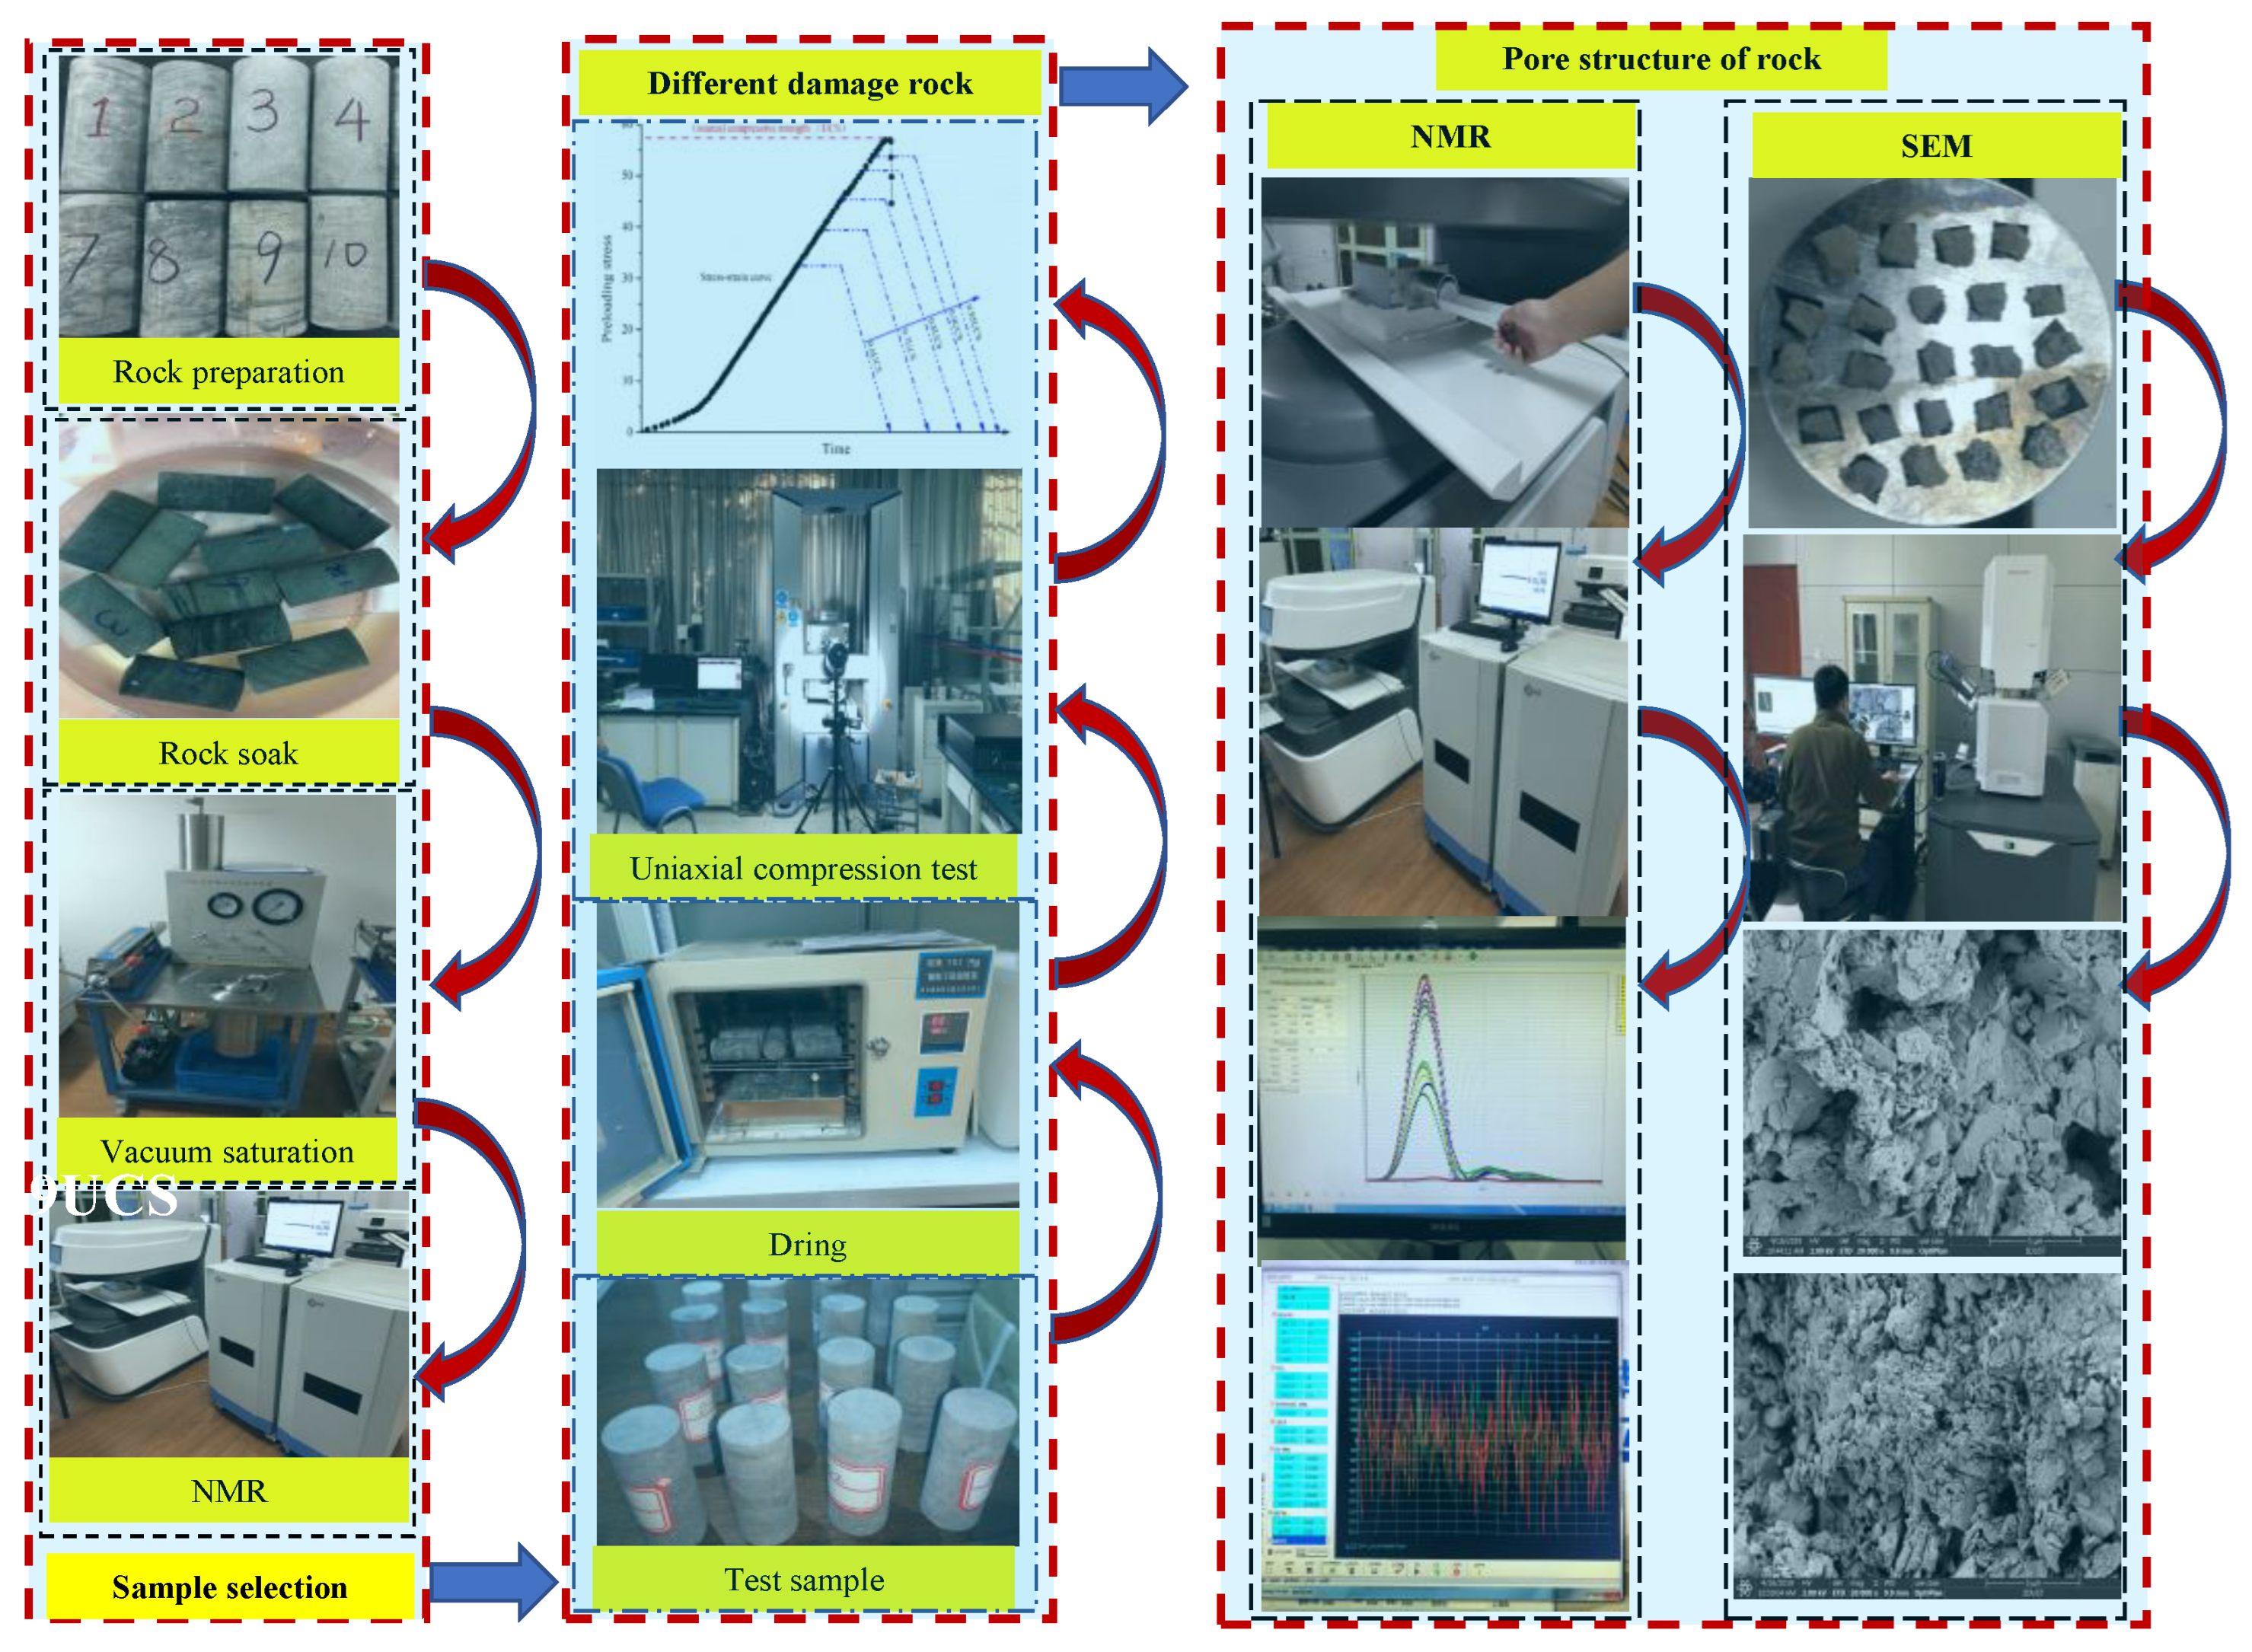
3.1. Materials and Experiment Procedure

All rock specimens used in the test were medium-grained sandstone. The sandstone is light gray with quartz, feldspar, green minerals, and a muddy cement. The mine rock body was a typical representative of the loaded rock body in underground engineering, and the sandstone samples used in the experiments were taken from the same rock body in the mine workings and were processed into a number of cylindrical rock specimens of (50 ± 0.02) mm × 100 mm. In order to study the pore structure characteristics of rocks under load, according to the change rule of the stress–strain curve and NMR characteristics of sandstone, the external load is less than 0.60 uniaxial compressive strength (UCS), and the pore structure is basically the same. Therefore, sandstone specimens were preloaded to five different stress levels (0.60 UCS, 0.7 UCS, 0.8 UCS, 0.9 UCS, and 0.95 UCS). It should be noted that each rock mass has different damage characteristics in order to avoid the influence of the original damage of rock mass on the test results. The experiment carried out the NMR test on all rock samples and selected the rock samples with a similar NMR curve for subsequent tests. This experiment mainly includes three parts: the selection of rock samples, the preparation of the rock under different loads, and the observation of rock pore structure characteristics, and the details are shown in Figure 1.

3.2. Experiment Equipment and Method

3.2.1. Loading and Unloading Tests

Loading and unloading tests were conducted on a Shimadzu AG-X250 electronic universal testing machine. Uniaxial compression tests on the specimens until failure were first carried out to gain the uniaxial compressive strength (UCS). Four sandstone specimens were loaded until failure, and their UCS values were obtained (the average UCS was 57.8 MPa). The UCS is a reference standard used to determine other load stresses. According to previous analysis, different damage stages in the uniaxial compression test can be characterized by the ratio between the stress level under load and the peak strength under corresponding rock conditions, which can reflect the formation conditions, evolution process and genetic mechanism of damage inside the rock. Generally, it was found when the preloading stress reached 0.6 UCS, the fracture inside the rock began to expand steadily, which was the linear failure stage in the process of uniaxial compression. Therefore, the loading levels are predefined to be 0, 0.6 UCS, 0.7 UCS, 0.8 UCS, 0.9 UCS, and 0.95 UCS for six groups of specimens.

3.2.2. SEM Analysis

The microstructure of the rock mass was observed using an APREO field emission group scanning electron microscope manufactured by Thermo Fisher, Waltham, MA, USA. In order to improve the electrical conductivity and prevent damage to the instrument, the sample must be coated with metal before testing. The sample surface area is 0.5 cm2, one side is polished smooth with sandpaper, and it is easy to paste on the sample table. The other side was left untreated. The sample magnification was 5000 and 20,000 times, respectively.

3.2.3. NMR Analysis

The MacroMR12 150H Type I NMR system produced by Suzhou Neway Analytical Instrument Co., Ltd., Suzhou, China, was used in the experiment to detect changes in the microstructure characteristics of rocks. It is composed of a spectrometer system, a radio unit, a gradient unit, and a magnetic box, as shown in Figure 2. The device can configure a radio coil with a maximum 150 mm diameter, which ensures a standard rock specimen can be detected. The magnetic field intensity is 0.45 T, with the resonance frequency of 1 to 30 MHz. The accuracy of nuclear magnetic resonance imaging is up to 80 μm, which ensures pores and cracks inside the rock can be observed. To ensure that water can enter all the pores inside the specimens, all specimens were submerged in water until the mass of rock was constant. Based upon experimental results, the submersion of the samples occurred for 48 h so that the samples were completely saturated. NMR was then performed using the NMR imaging system.

4. Experimental Results and Discussion

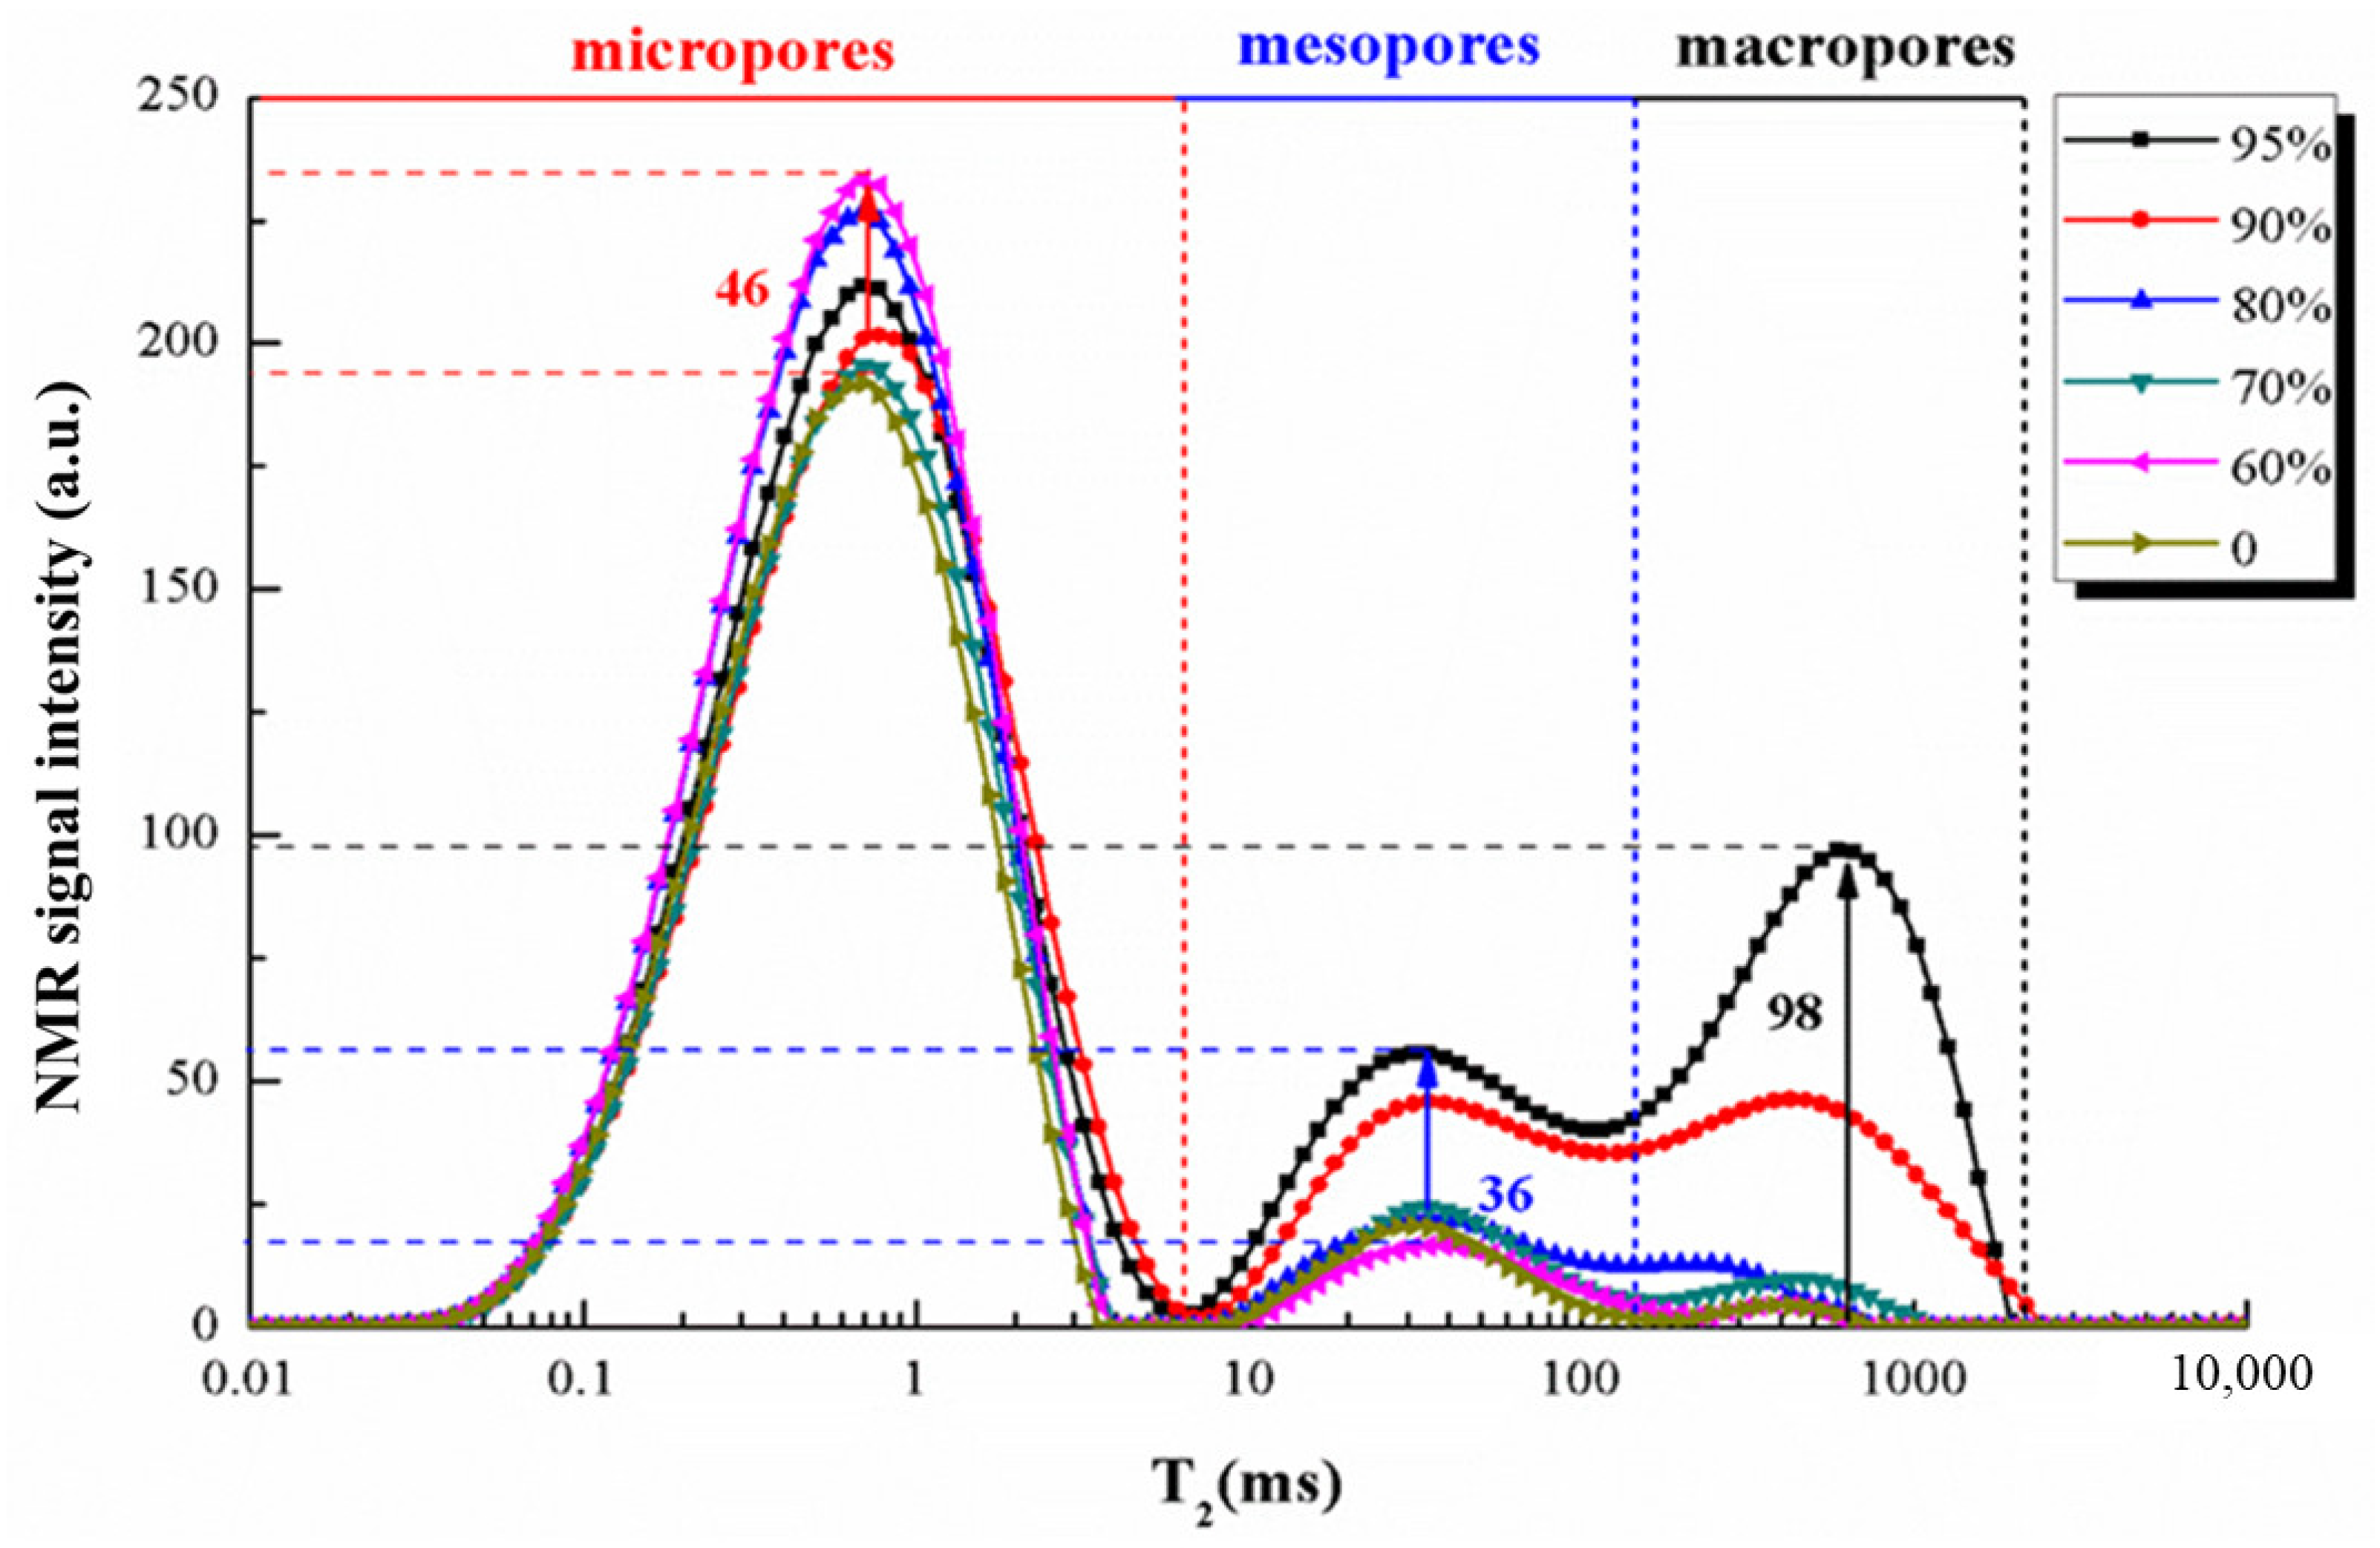
4.1. T2 Spectrum Distribution Curves

(1)
Change in the T2 spectrum distribution curves
According to the principle of NMR technology, the characteristics of mesoscopic structures in rocks can be characterized by the T2 distribution curve. The T2 value reflects the size of the pores, and the amplitude of the T2 spectrum demonstrates the number of pores inside the rock. The T2 spectrum distribution curves of the samples are shown in Figure 3.
The T2 spectrum curves for all the six groups of the specimen consist of three spectral peaks. From left to right, the peaks correspond to the micropores, mesopores, and macropores. However, generally, the amount of change in the T2 spectrum curves is quite different. For micropores, the peak and area under the peak of the micropore spectrum are the largest, indicating that the rock specimen is relatively dense, and most of the internal pores are micropores. The mesopore and macropore peaks increase with an increase in the external load. The T2 spectrum distribution curves gradually change from two independent peaks to steadily expanding their volumes until the two peaks overlap. Overall, the T2 value and spectral peak area increase, especially when the external load is greater than 80% UCS.
(2)
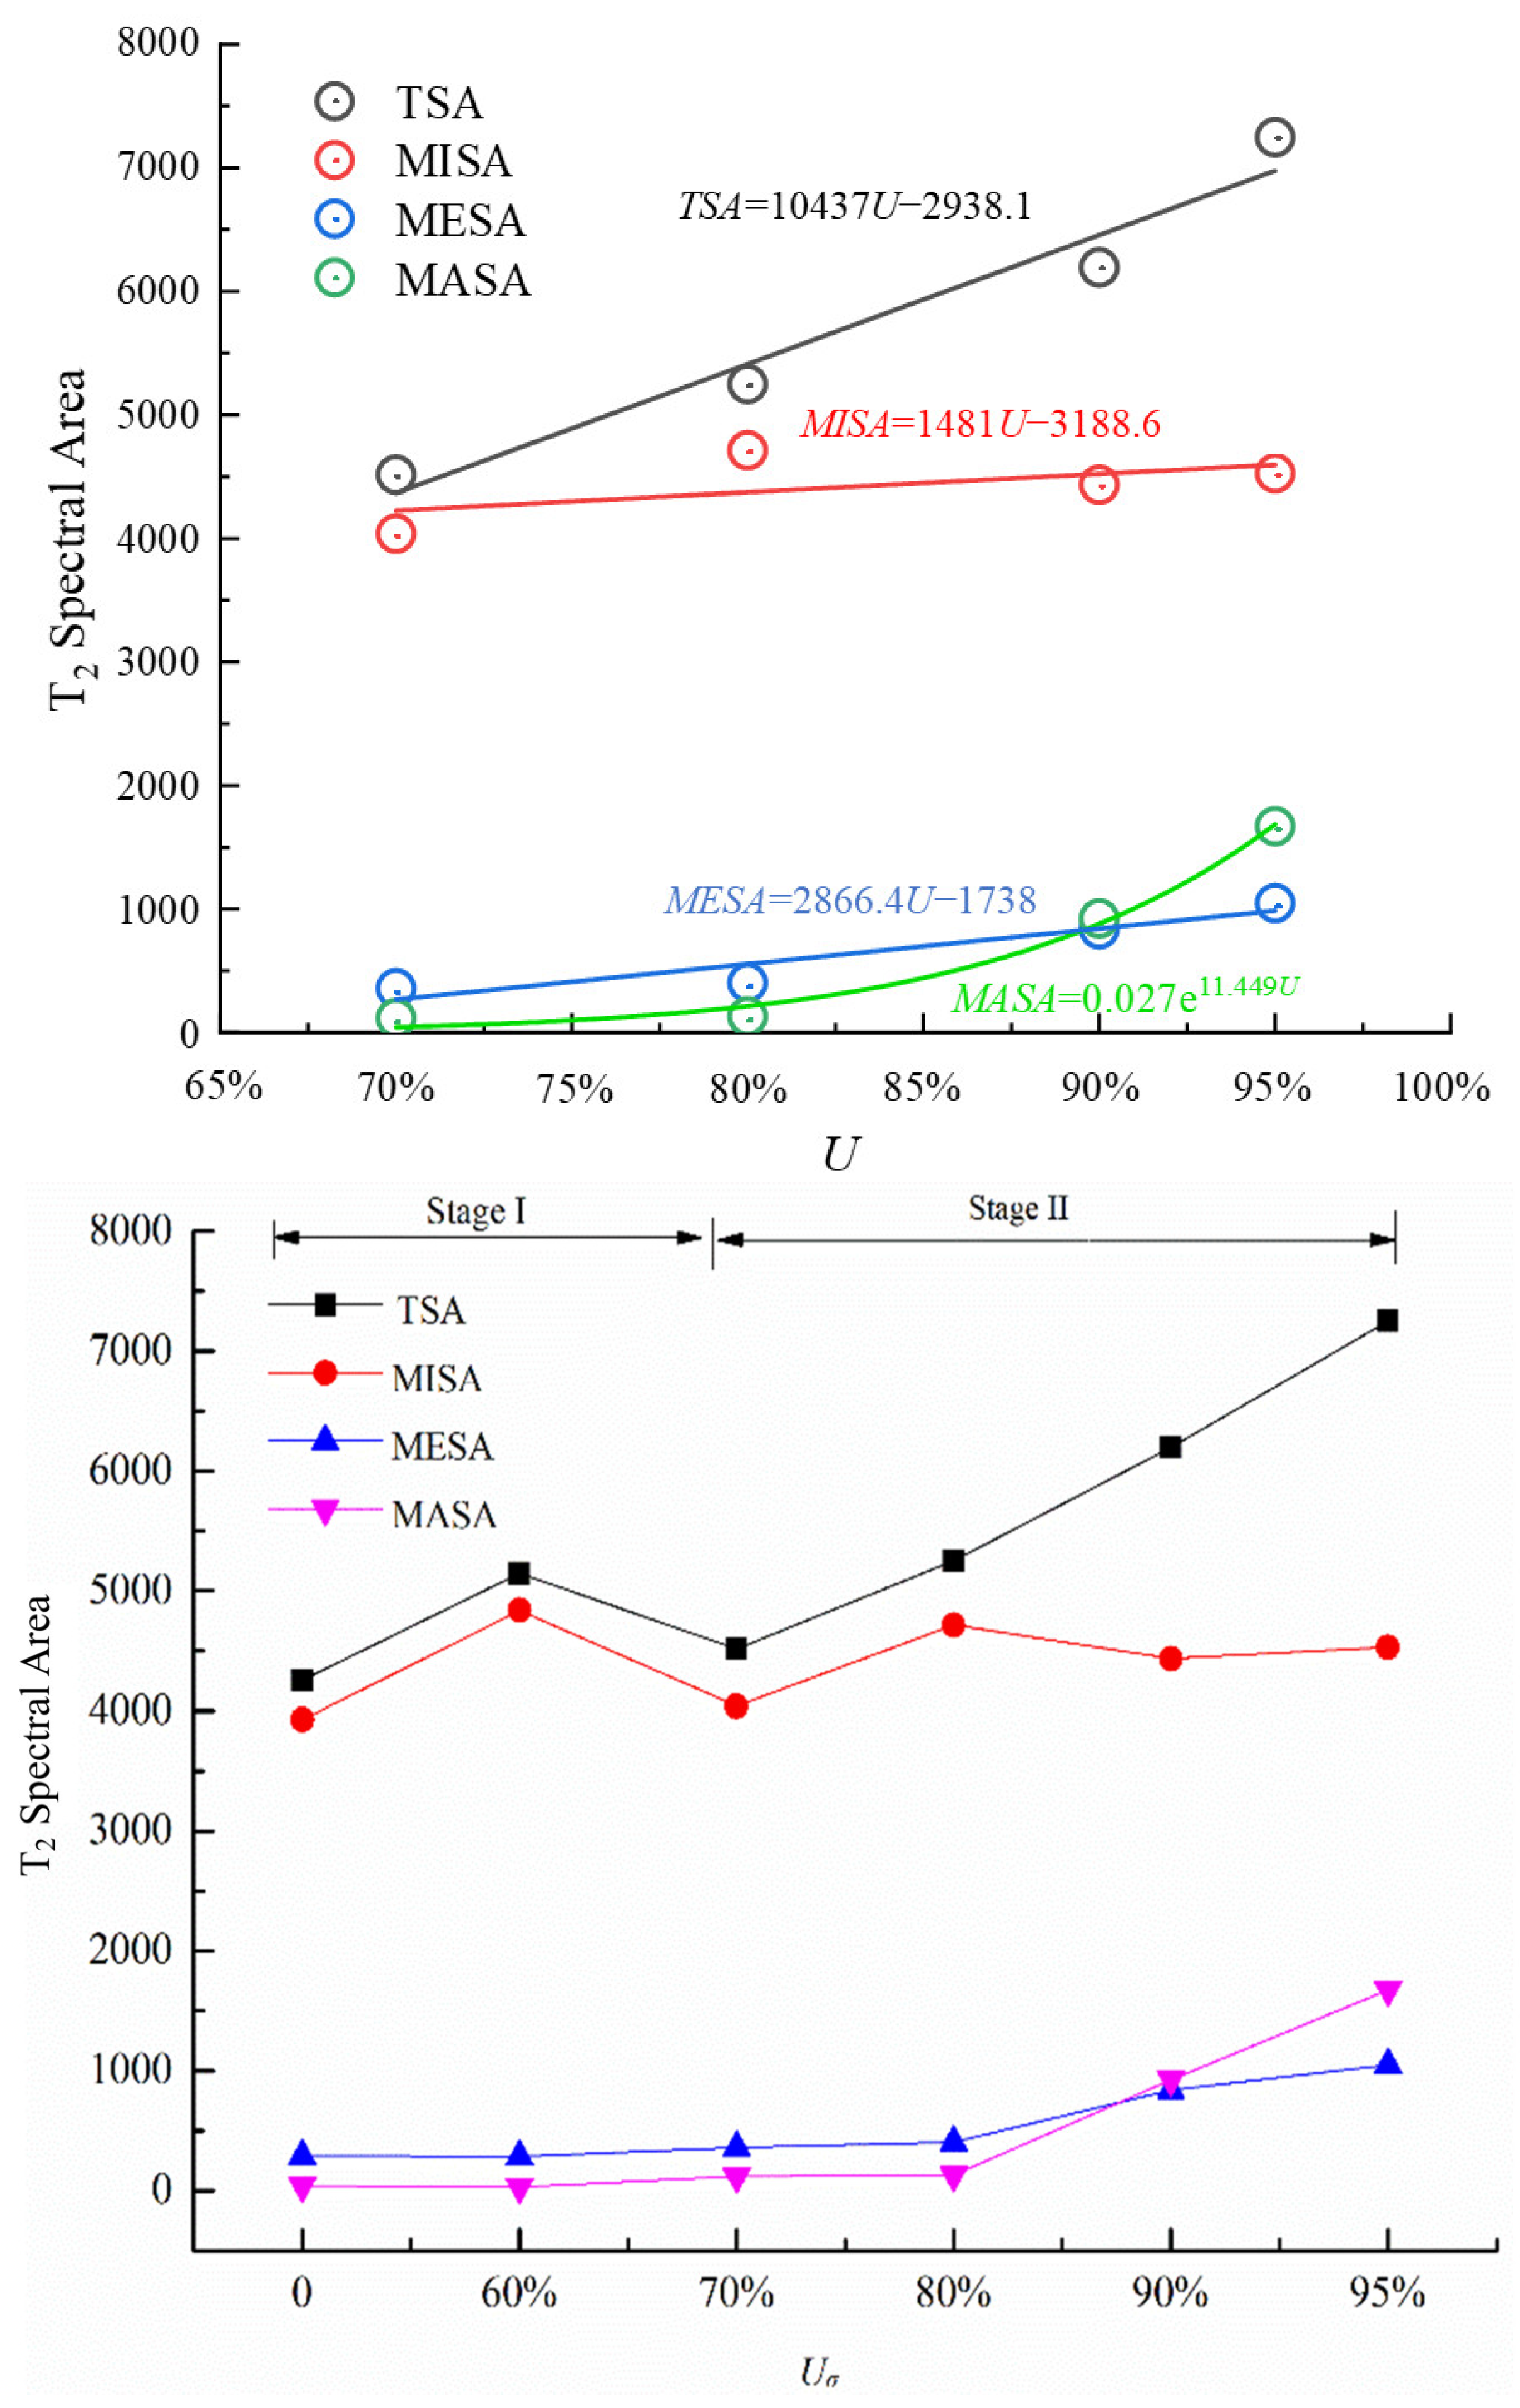
Analysis of T2 spectral area
The T2 spectral area is positively related to the number of pores and the porosity. The T2 spectral area is the area enclosed by the T2 spectral curve and the coordinate axis. Therefore, we can obtain the area of each spectral peak via integration. The spectral area of the three aperture pores and the proportion are shown in Table 1 and Figure 4 and Figure 5.
A specimen is mainly composed of micropores, especially when the preloading stress is less than 80% UCS, accounting for up to 90% of the total pore area, while macropores account for less than 3%. When the preloading stress increases to greater than 80% UCS, macropores increase their overall volume and account for 15%.
When the loading ratio increases from 60% to 70%, the total area of the T2 spectra distribution actually decreases, indicating that the number of pores in the rock decreases during this process, as shown in Figure 6a. This is because the internal pores of the rock are compacted under external loads, and the rock has not reached the point of mechanical failure. With a continued increase in the external load, the proportion of micropores in the rock decreases, while the percentage of mesopores and macropores increases. This indicates that under the action of an increasing external load, the expansion of internal pores in the rock leads to an increase in the number and size of the pores, which eventually leads to the destruction of the pore structure within the rock.
In order to quantitatively analyze the change in the pores in the samples, the variation rate of pore proportions in the samples was established, as shown in Formula (4). We define the ratio of axial compression when the internal damage of a rock suddenly changes as the critical value of damage.
Δ Pr = Pr 2 Pr 1 Pr 1
where Δ Pr is the variation rate of pore volume proportions in rocks, %; Pr 1 is the proportion of pore volume in the first stage, %; Pr 2 is the proportion of pore volume in the second stage, %.
When the ratio of axial compression increases from 0 to 80%, the variation rates of micropores, mesopores, and macropores are 2.71%, 13.24% and 177.8%, respectively. When the ratio of axial compression increases from 80% to 95%, the rates of change in micropores, mesopores and macropores are 30.40%, 87.01% and 824.0%. This indicates that when the axial compression ratio exceeds 80%, there is a rapid increase in the number of micropores, mesopores and macropores within the sandstone samples.

4.2. Porosity

Porosity is a physical quantity that is often used to represent damage and has been successfully used to evaluate the damaged state of rock samples [22,23,24]. According to the principle of NMR, the porosity under different external loads can be calculated using NMR, as shown in Figure 6. On the whole, the variation in porosity under an external load can be divided into three stages, with an overall “√” shape tendency.
Stage I (0~70%): When the ratio of axial compression is between 0% and 70%, the rock interior is dominated by micropores, and the number of mesopores and macropores is small. The variation in porosity is relatively small, and the growth trend is primarily horizontal. Because of the diversity of the degree of damage and pore expansion in the rock, pores or cracks may be compacted when they develop and expand or penetrate under an external load in this range, slightly reducing the porosity. As can be seen from Figure 7b, although the T2 spectrum area of the micropores continues to increase, the overall porosity trend is relatively consistent and even, indicating that micropores play a small role in the overall porosity development.
Stage II (70~80%): When the ratio of axial compression is between 70% and 80%, the overall slope of the porosity increases. It can be seen from Figure 7b,c that the change in porosity caused by changes in the micropores is small, while the change in porosity caused by changes in the mesopores and macropores has a significant increase. This indicates that the mesopores and macropores play a decisive role in the porosity change in rocks.
Stage IIII (80~95%): When the ratio of axial compression is greater than 80% (the critical value of damage), the slope of the porosity has a sharp increase. The porosity caused by the each of the three kinds of pore increases, as shown in Figure 7c–e. Especially when the ratio of axial compression exceeds 90%, the porosity caused by mesopores and macropores accounts for 50% of the total porosity.

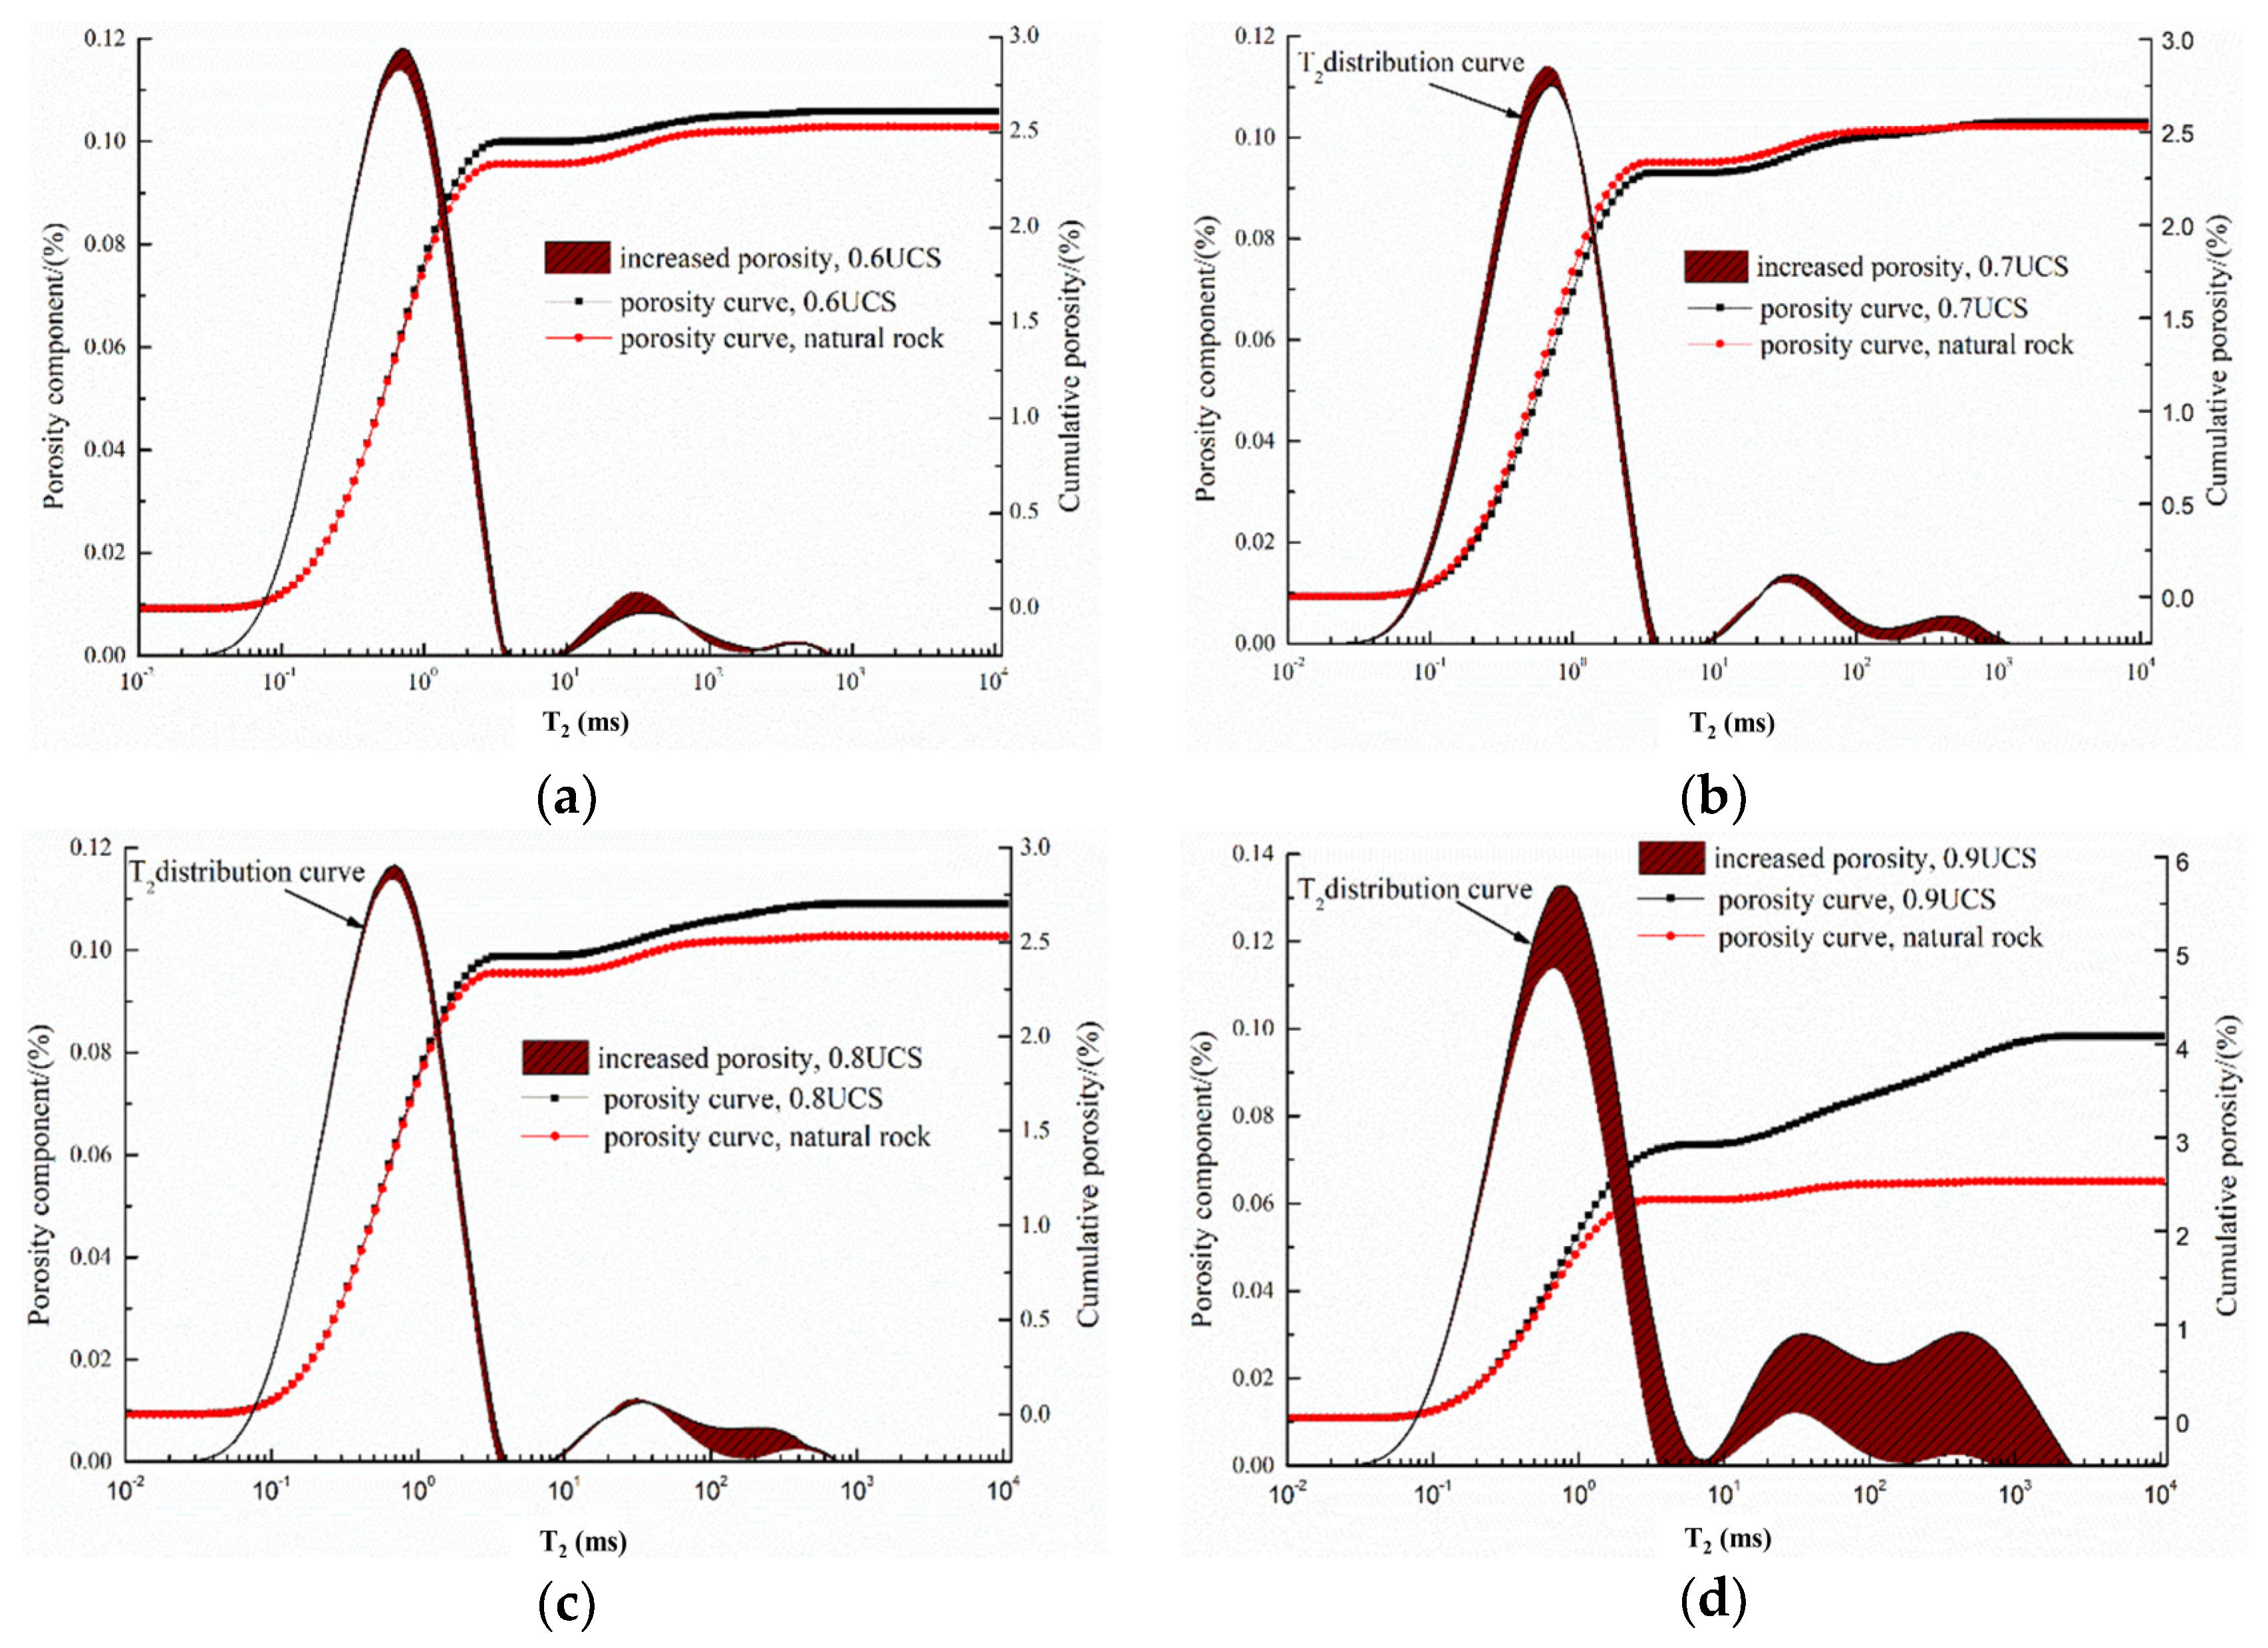
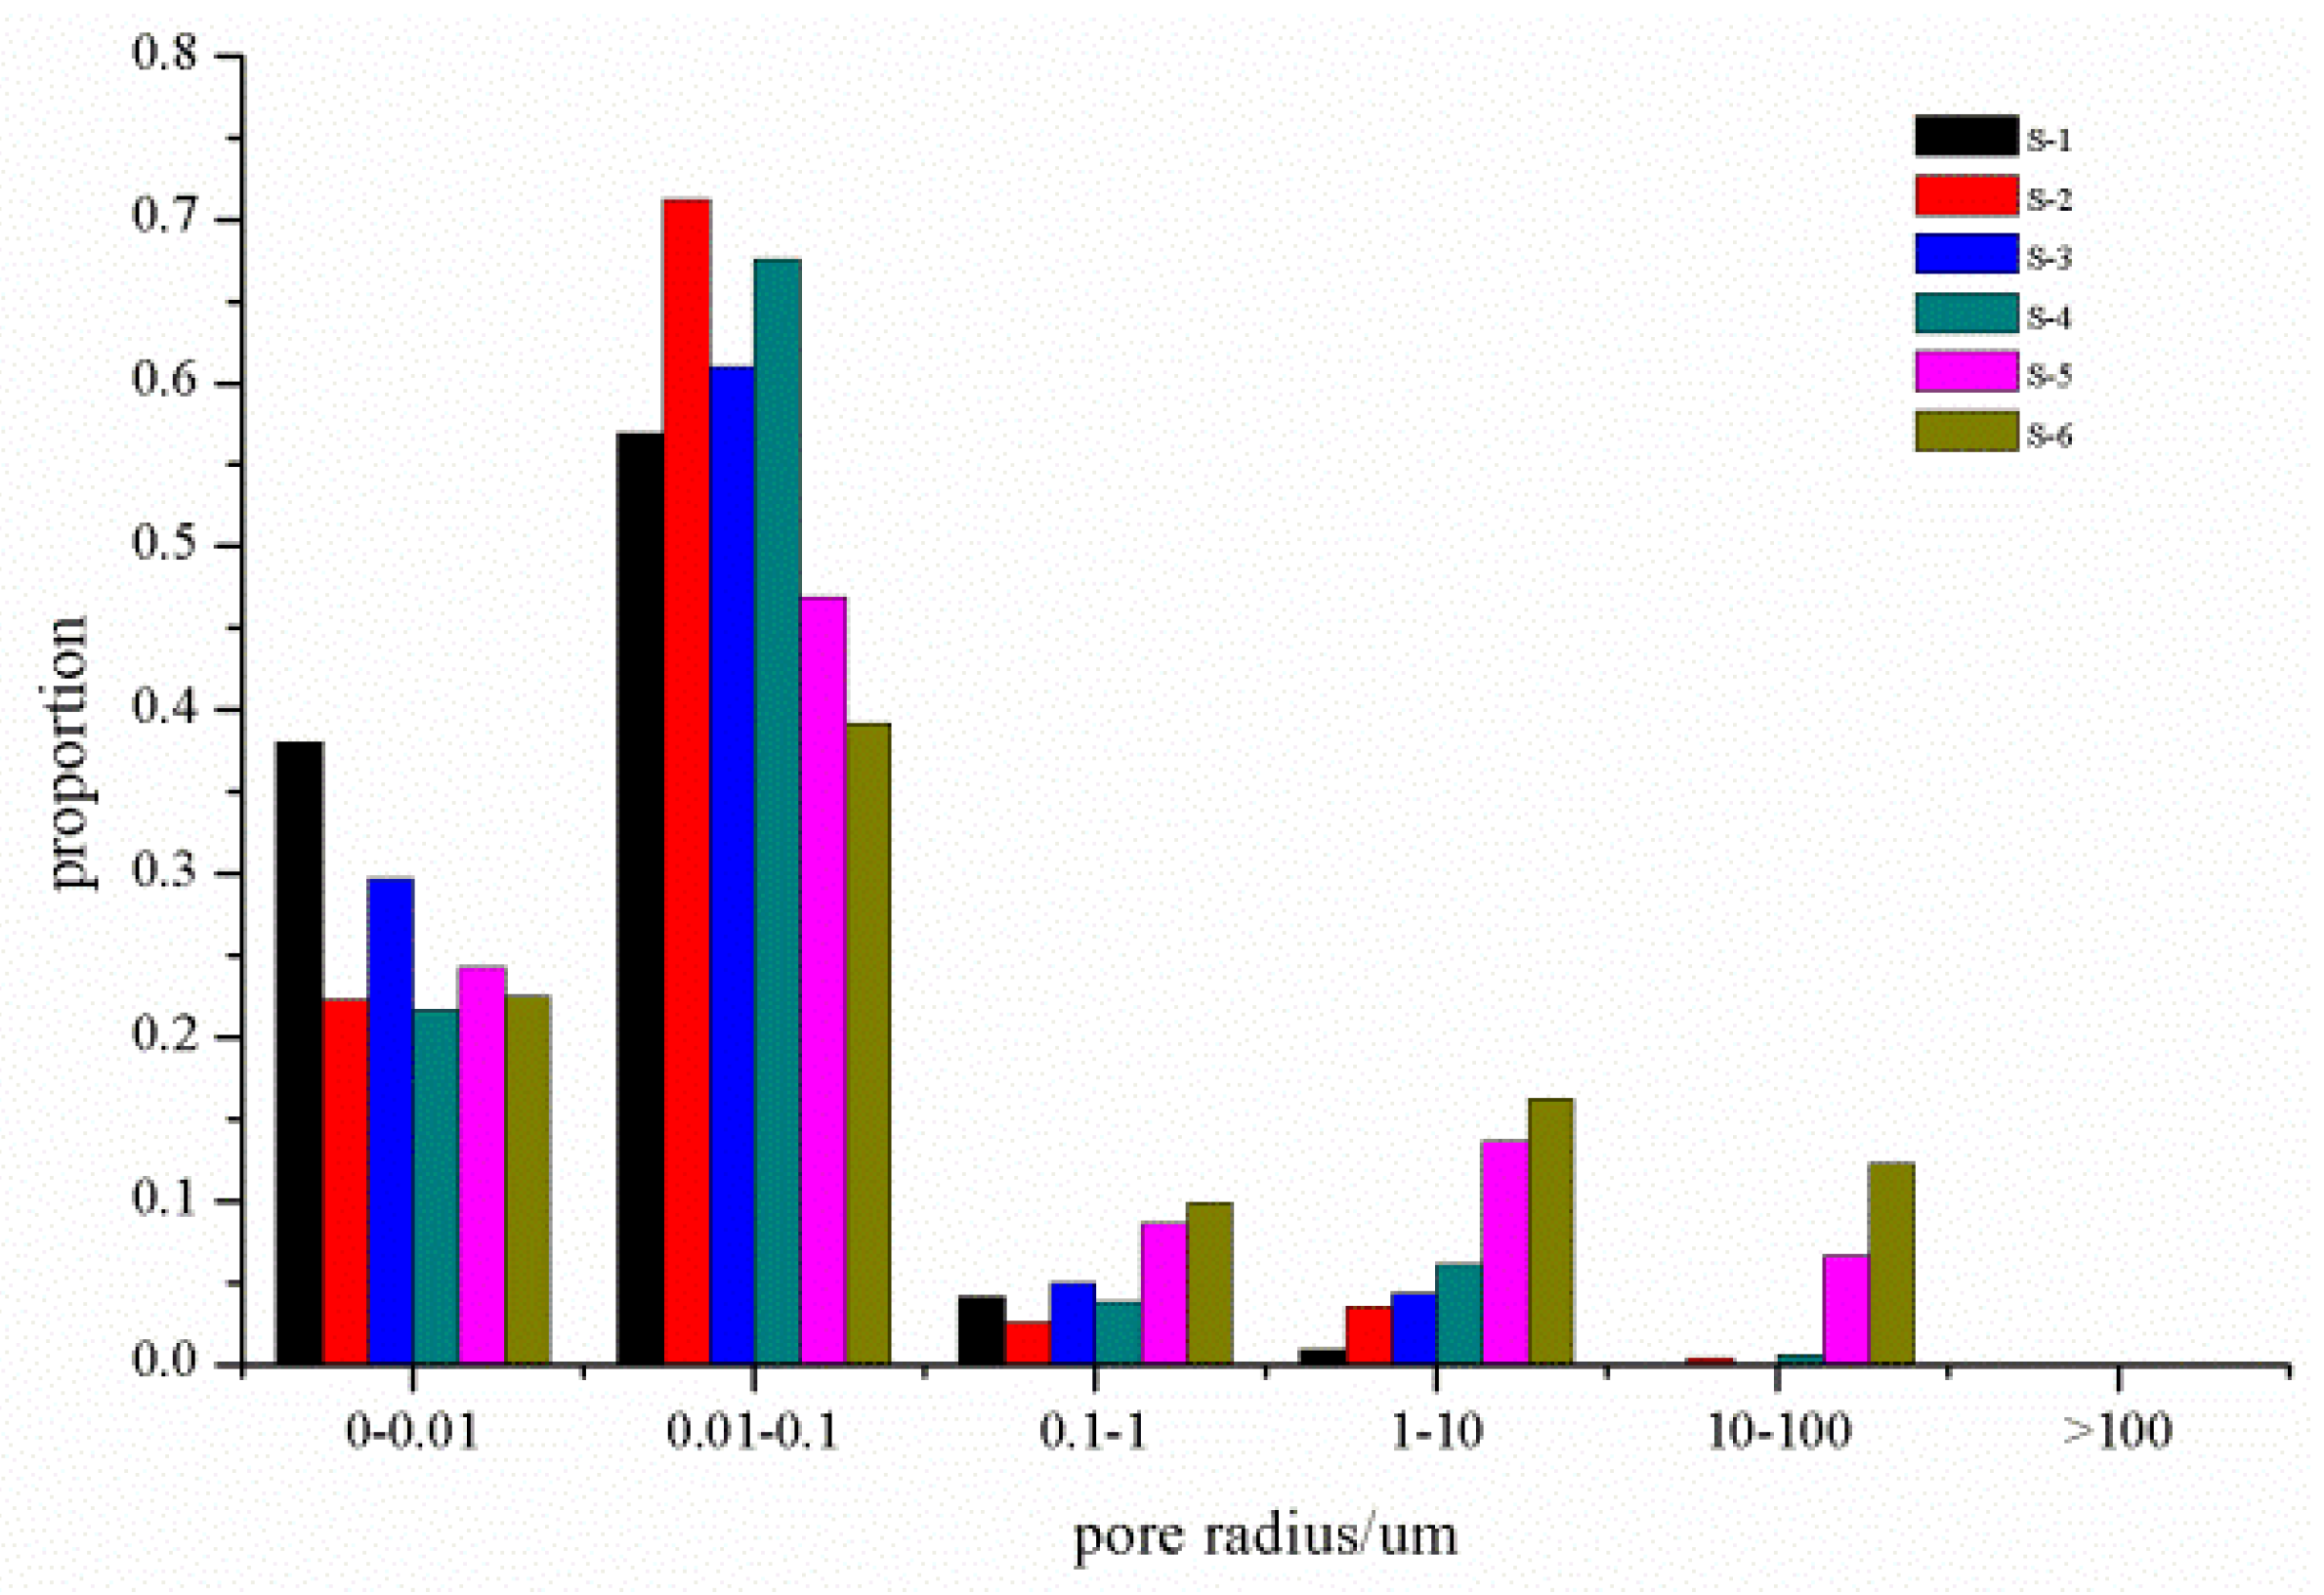
4.3. Analysis of Pore Size Distribution
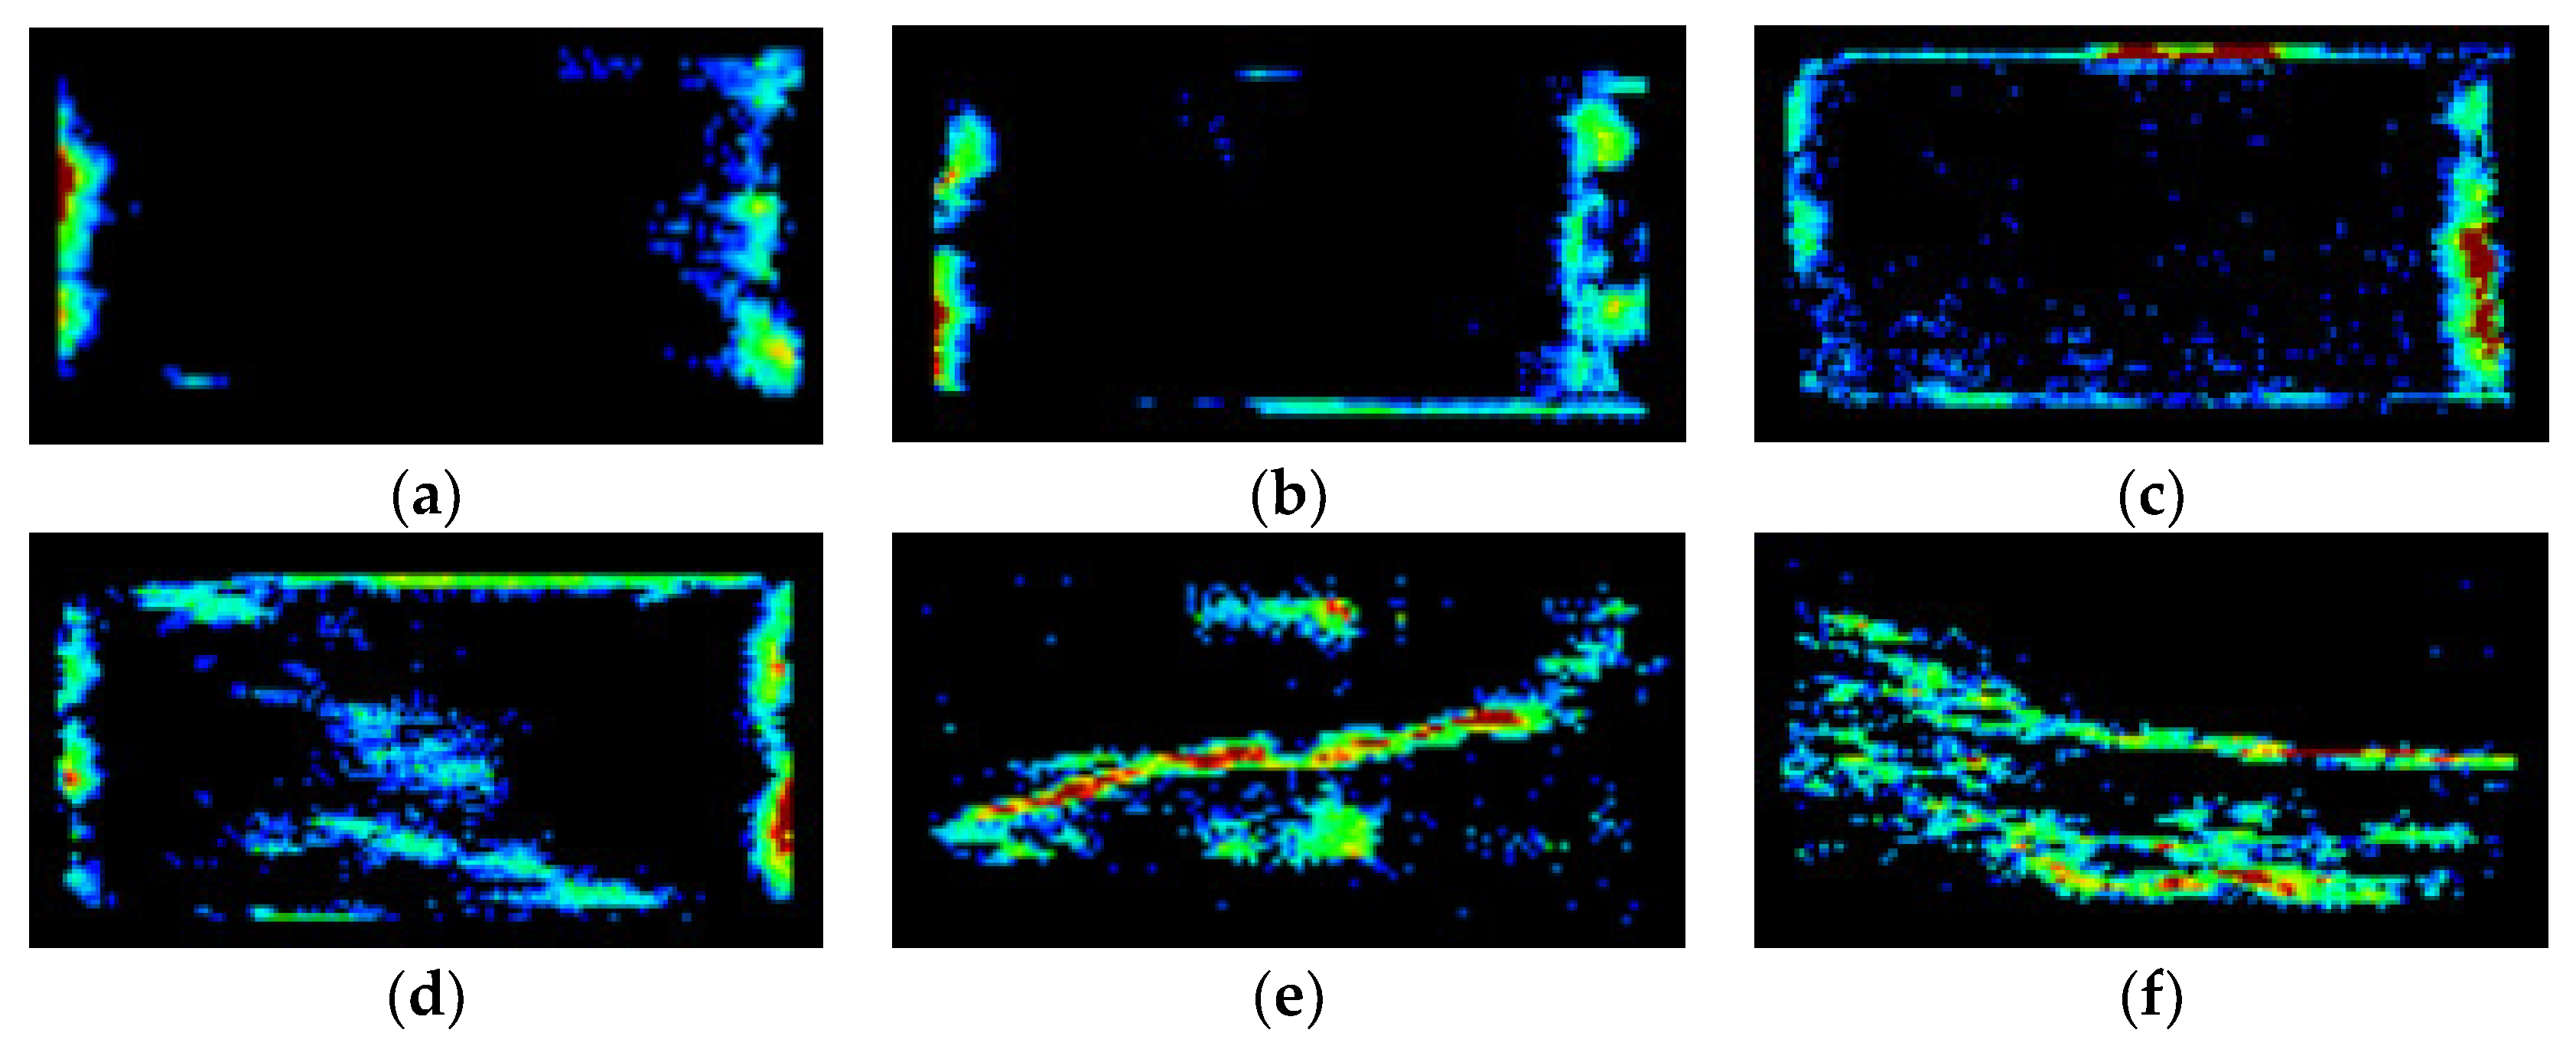
T2 is directly proportional to the pore size, according to Formula (3). The pore of the rock is assumed to be a tube bundle in this experiment; therefore, Formula (3) can be expressed as follows:
r = ρ × T 2 × a
where r is the pore radius of the specimen; ρ is the empirical coefficient; ρ = 10 ms/m; and a is the coefficient of the tube bundle, a = 2.
Combining the NMR data and Equation (5), the pore radius of a rock can be determined, as shown in Figure 8. Moreover, 70% of the pore diameter of saturated sandstone is less than 1 μm, and there are numerous micropores throughout the sample. More than 85% of the pore diameters are less than 100 μm. When the axial pressure ratio is more than 80%, only 50% of the pore diameters of the saturated sandstone are less than 1 μm, and the proportion of internal micropores decreases. Over 15% of the pores have diameters larger than 100 μm. This indicates that crack initiation, expansion and penetration occur at this level of external loading, which leads to an increase in the size and number of pores and cracks.

5. Discussion

With an increase in the external load, the internal damage of the rock is continuously enhanced, and the pore structure will change accordingly, as shown in Figure 8. When sandstone specimens were preloaded to 0.6 UCS and 0.7 UCS, the interior of the rock is mainly composed of pores and micro-cracks. Although some large cracks can be seen in Figure 8, they are all less than 5 μm in length, which is consistent with the NMR results. With the continuous increase in load, the rock structure is destroyed, the pores continue to expand into micro-cracks, and the micro-cracks expand into large cracks or even crack groups. When sandstone specimens are preloaded to 0.8 UCS, it is obvious that the length of multiple fractures is 5 μm, indicating that the internal expansion of the rock has changed from quantitative to qualitative.
The position and type of the atomic nucleus of a specimen can be obtained by detecting the electromagnetic waves emitted from an external gradient magnetic field, and the structural image of the specimen can be drawn accordingly. Based on the MRI data, the NMR imaging of the sandstones with different axial compression ratios is shown in Figure 9 It is noted that the bright color area is the image of the specimen, and black is the background color. The brightness of the image reflects the amount of water content in the rock, with brighter areas corresponding to higher the water contents.
(1)
NMR images of S-1, S-2, and S-3: The NMR images of the rock specimen are generally dark, with bright spots concentrated at the ends of the sample. Overall, the distribution is a point shape at the ends. This color distribution indicates that there are no apparent cracks throughout the sample before an external load is applied.
(2)
NMR images of S-4: Compared with the first three samples, the NMR images of S-4 are brighter overall, and the areas that were bright in S-1, S-2, and S-3 are now brighter in this image after an external load has been applied. Bright patches also appear in the center of the rock in a patchy pattern. This indicates the generations of cracks in the rock, and micropores are continuously expanding into macropores and cracks.
(3)
NMR images of S-5: Compared to the previous images, S-5 is significantly brighter overall, and the brightness covers a much larger area. There are significant bright spots in multiple sections of the sample, especially an obvious bright strip in the diagonal position of the sample, which is regarded as a large crack. This indicates that a large number of cracks interconnected to form even larger cracks.
(4)
NMR images of S-6: the brightness of the NMR image is significantly brightened, with two bright crack channels clearly seen in the center of the rock.
Figure 9. NMR images of sandstone with different axial compression ratios. (a) S-1; (b) S-2; (c) S-3; (d) S-4; (e) S-5; (f) S-6.
Applsci 14 07063 g009
In summary, in the low-damage stage (the low-axial-compression-ratio stage), there are fewer warm or white spots in the NMR images of the rock samples. With an increase in the stress level, the warm spots in the rock samples become more and more bright or colorful, indicating the pore size of the rock sample increases and the pore structure of rock sample is destroyed. The warm spots are gradually connected into sheets from the initial discrete points, which is due to the porosity gradually increasing. The pores connect until the rock is destroyed, and fractures and a water channel in the rock sample are clearly visible. When the stress level reaches the damage threshold, the white spots inside the rock sample suddenly brighten, and the width of the cracks and water channel in the rock sample continue to increase. The NMR images of rock samples with different axial compression ratios are consistent with the T2 spectrum distribution and porosity analysis. Overall, the dynamic development of fractures in rock samples can be visually shown using NMR imaging, which is of great significance for the analysis of crack propagation in rock samples in microstructures.

6. Conclusions

T2 spectrum distribution curves, porosity, pore size, and NMR imaging of saturated sandstones with different axial compression ratios were studied using NMR, and the main conclusions obtained are as follows:
(1)
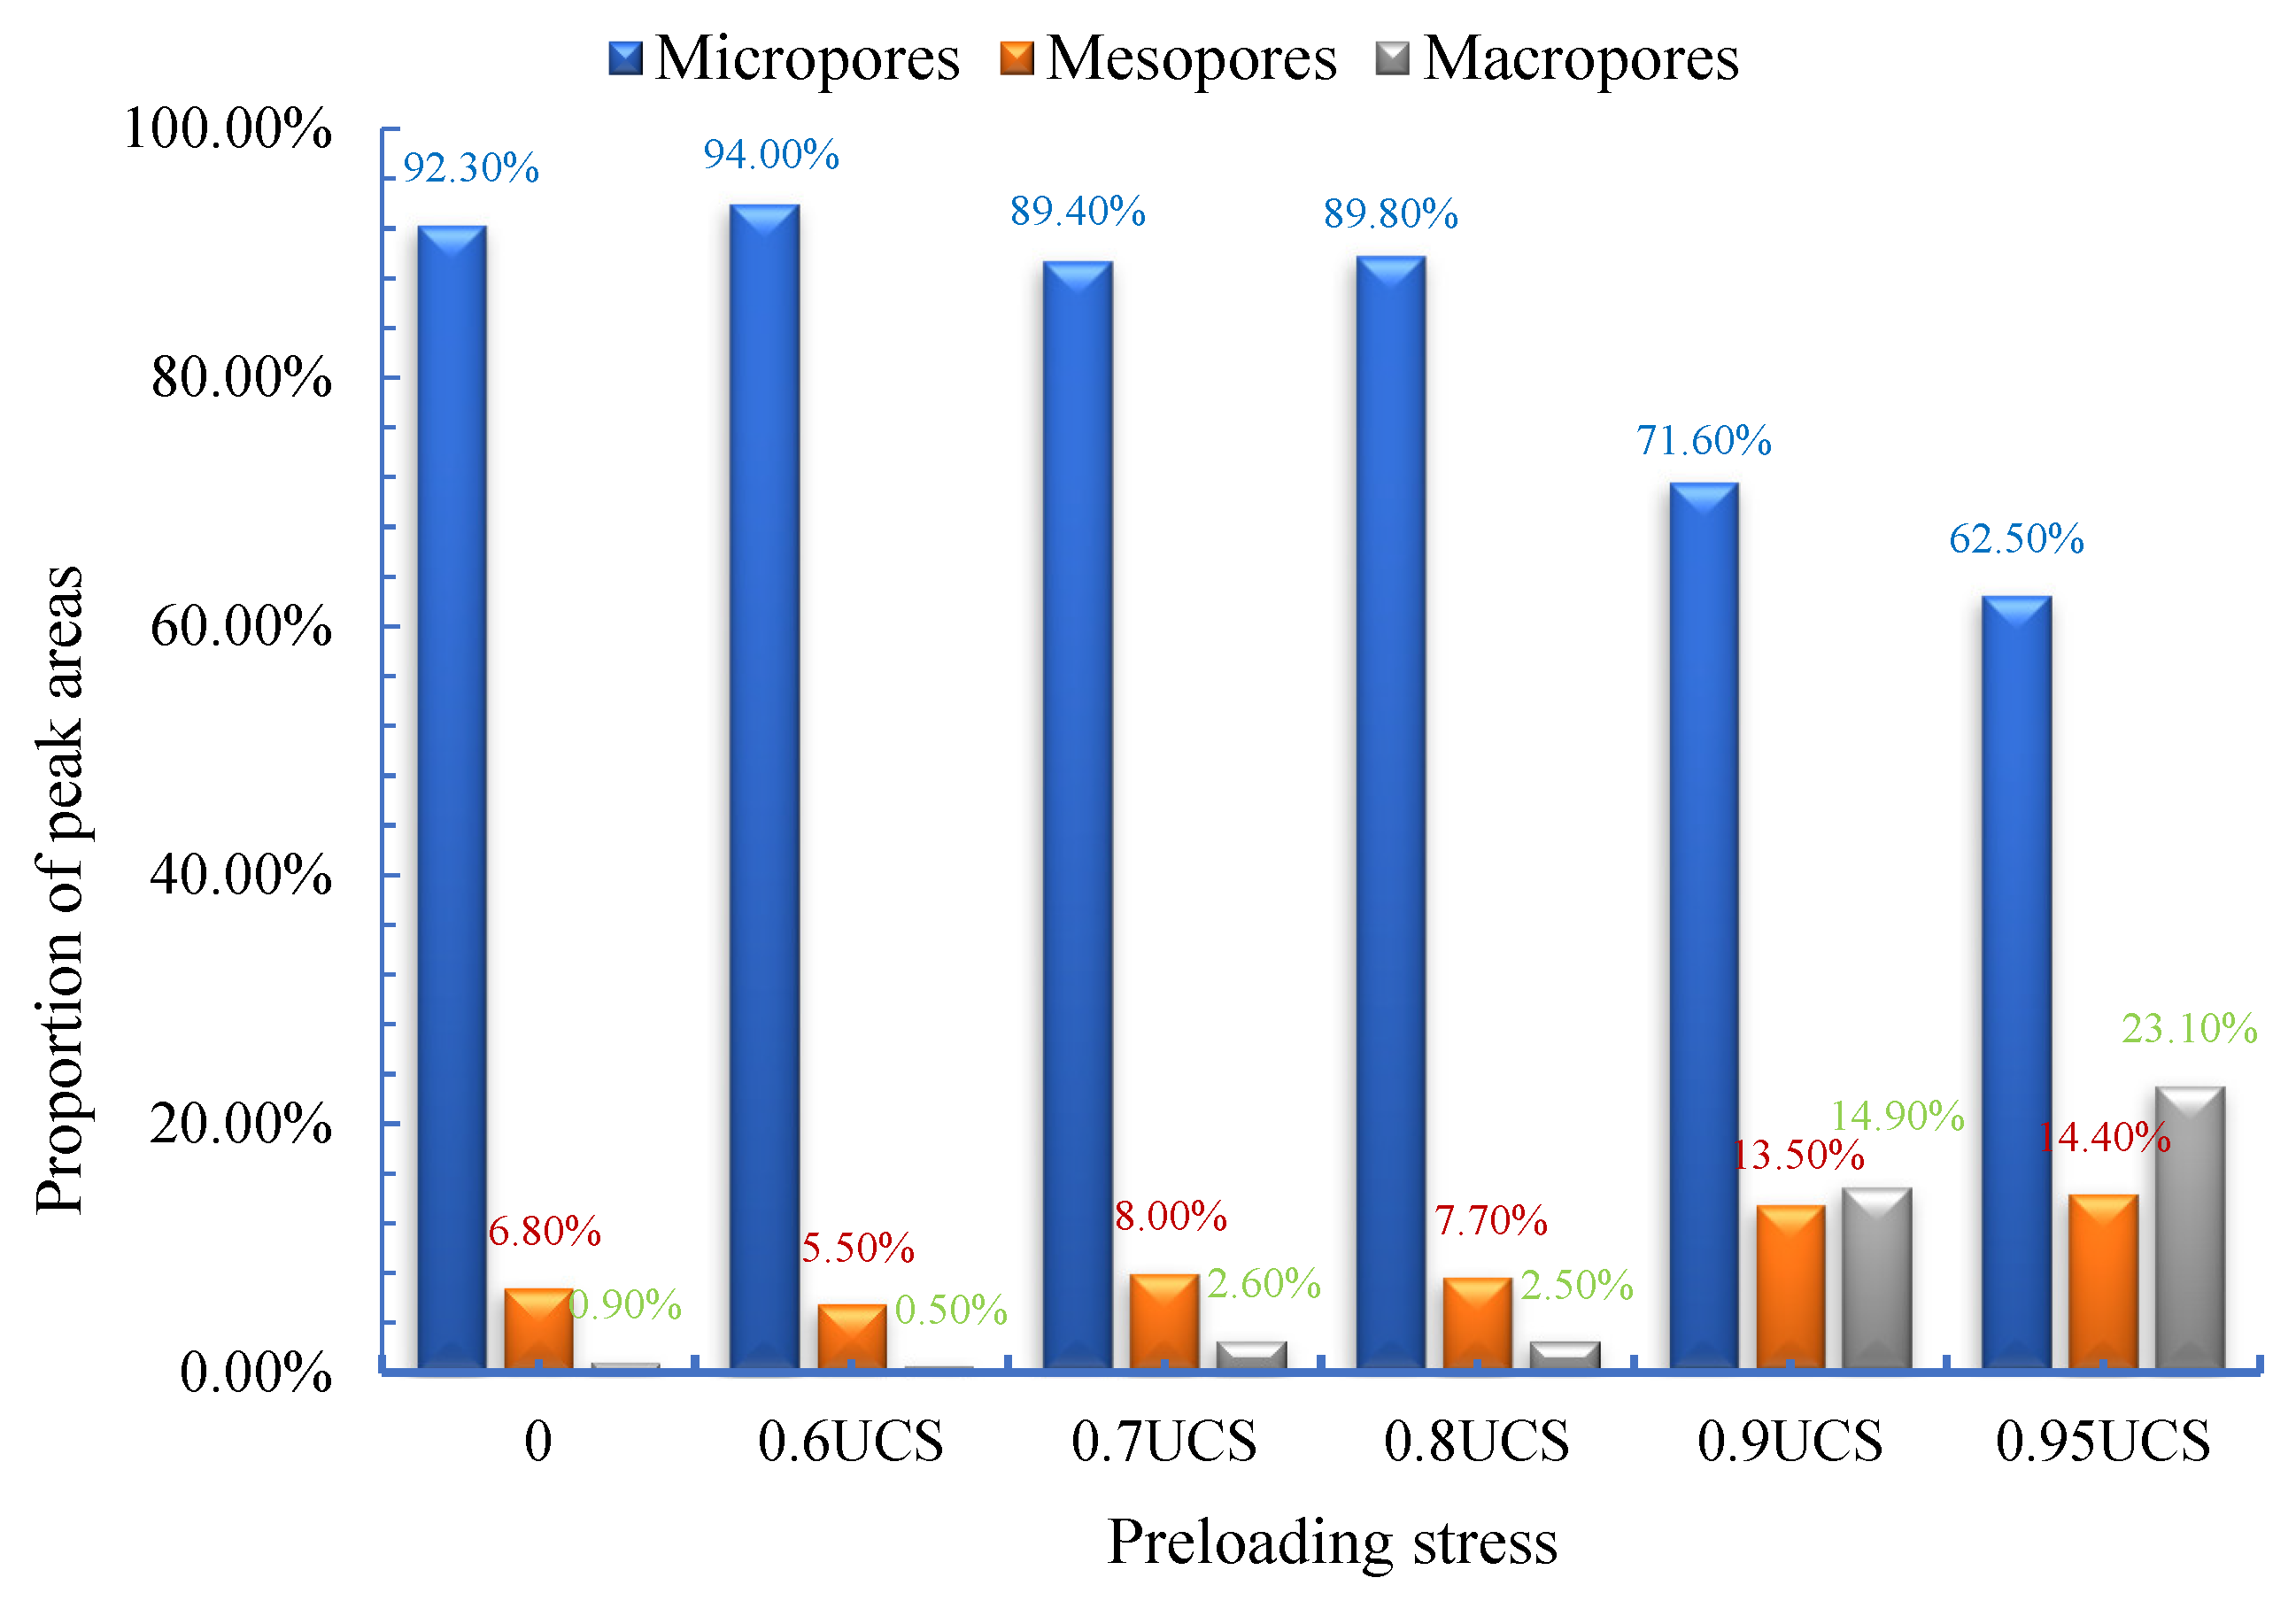
When the axial compression ratio is less than 80%, the rock interior mainly contains micropores, and the growth of the mesopores and macropores is low. The variation rate of mesopores and macropores shows a significant increase when the predefined stress is more than 0.8 UCS, which is due to the rapid generation, expansion and transgression of pores. There is a critical value in the process of rock damage (0.8 UCS), and when it is less than this critical value, the microstructure in the rock is mainly composed of pores and micro-cracks, and the length is generally less than 5 μm. When it exceeds this value, there are obvious cracks or even groups of cracks inside the rock.
(2)
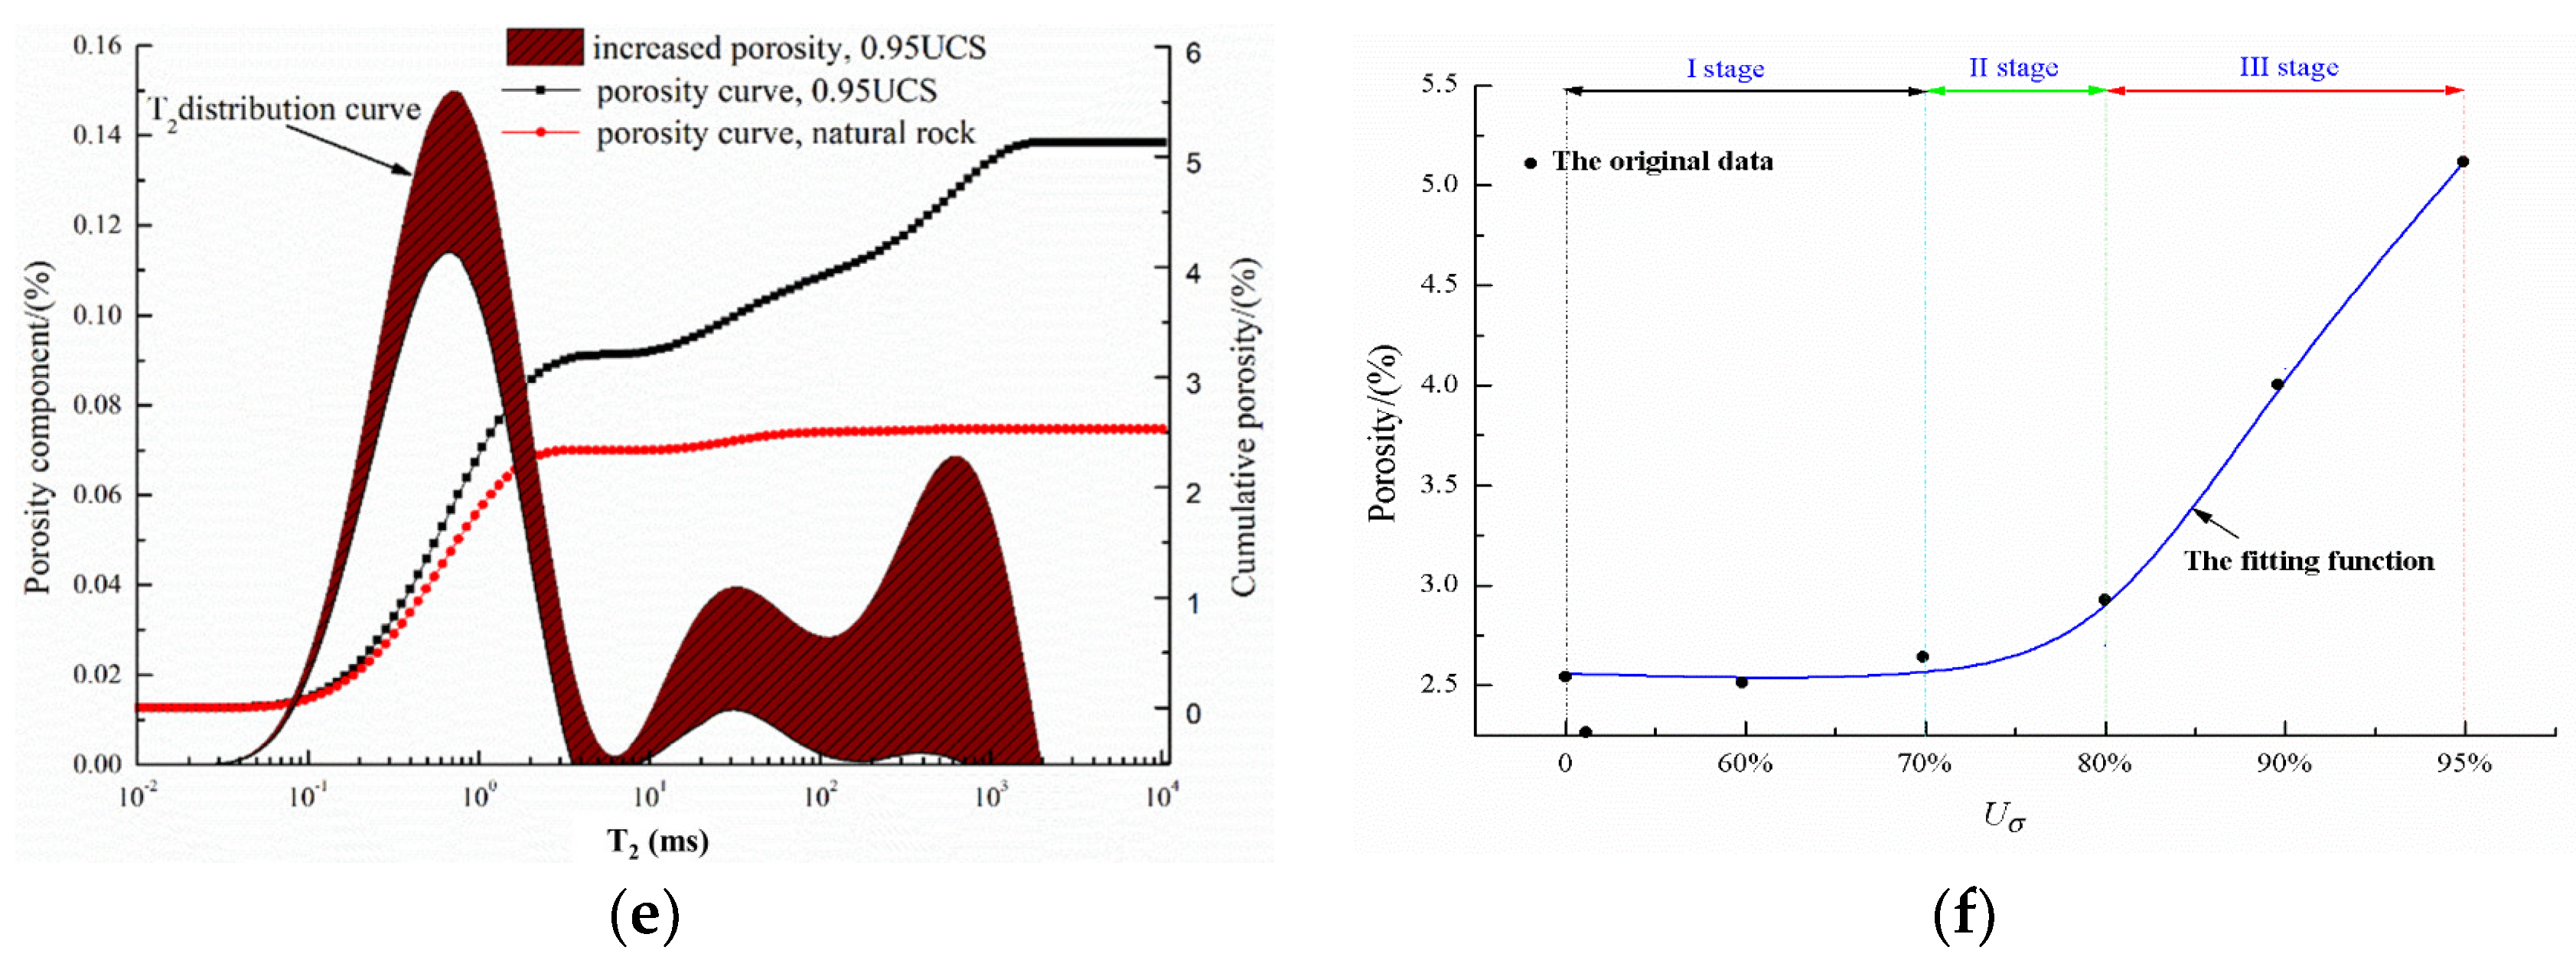
The variation in porosity can be divided into three stages, with an overall “√” shape tendency in porosity growth. The growth trend is mostly flat when the axial compression ratio is between 0% and 70%, which is mainly because the interior of the rock is dominated by micropores, and the growth of macropores and mesopores is low. The porosity in sandstone increases with an increasing axial compression ratio; however, due to the small size and number of macropores and mesopores, the porosity growth rate is very low; the variation rate shows a significant increase when the axial compression ratio reaches the damage threshold.
(3)
The pore structure of a rock can be visually presented using SEM and NMR imaging. The distribution mode of pores changes from separated points to thick patches and finally to connected networks with an increase in predefined stress.

Author Contributions

B.T.: investigation, methodology, writing—original draft, writing—review and editing. X.D.: data curation, investigation, methodology, project administration, writing—original draft. C.P.: investigation, methodology, writing—original draft, writing—review and editing. X.M.: investigation, writing—original draft. All authors have read and agreed to the published version of the manuscript.

Funding

This research received no external funding.

Institutional Review Board Statement

Not applicable.

Informed Consent Statement

Not applicable.

Data Availability Statement

The original contributions presented in the study are included in the article, further inquiries can be directed to the corresponding author.

Conflicts of Interest

Authors Bo Tian, Xuexiang Deng and Xiangxi Meng were employed by the company Shandong Energy Group. Author Congwang Pan was employed by the company Energy Administration of Shandong Province. The companies declare that the research was conducted in the absence of any commercial or financial relationships that could be construed as a potential conflict of interest.

References

  1. Han, T.; Shi, J.; Chen, Y.; Cao, X. Quantifying Microstructural Damage of Sandstone after Hydrochemical Corrosion. Int. J. Geomech. 2018, 18, 04018121. [Google Scholar] [CrossRef]
  2. Li, W.; Liu, H.; Song, X. Influence of Fluid Exposure on Surface Chemistry and Pore-Fracture Morphology of Various Rank Coals: Implications for Methane Recovery and CO2 Storage. Energy Fuels 2017, 31, 12552–12569. [Google Scholar] [CrossRef]
  3. Alam, M.M.; Hjuler, M.L.; Christensen, H.F.; Fabricius, I.L. Petrophysical and rock-mechanics effects of CO2 injection for enhanced oil recovery: Experimental study on chalk from South Arne field, North Sea. J. Pet. Sci. Eng. 2014, 122, 468–487. [Google Scholar] [CrossRef]
  4. Zhu, H.; Ju, Y.; Qi, Y.; Huang, C.; Zhang, L. Impact of tectonism on pore type and pore structure evolution in organic-rich shale: Implications for gas storage and migration pathways in naturally deformed rocks. Fuel 2018, 228, 272–289. [Google Scholar] [CrossRef]
  5. Wang, L.; Fu, Y.; Li, J.; Sima, L.; Wu, Q.; Jin, W.; Wang, T. Mineral and pore structure characteristics of gas shale in Longmaxi formation: A case study of Jiaoshiba gas field in the southern Sichuan Basin, China. Arab. J. Geosci. 2016, 9, 733. [Google Scholar] [CrossRef]
  6. Tan, M.; Mao, K.; Song, X.; Yang, X.; Xu, J. NMR petrophysical interpretation method of gas shale based on core NMR experiment. J. Pet. Sci. Eng. 2015, 136, 100–111. [Google Scholar] [CrossRef]
  7. Sigal, R.F.; Odusina, E. Laboratory NMR Measurements on Methane Saturated Barnett Shale Samples. Petrophysics 2011, 52, 32–49. [Google Scholar]
  8. Hosseini, M.; Tavakoli, V.; Nazemi, M. The effect of heterogeneity on NMR derived capillary pressure curves, case study of Dariyan tight carbonate reservoir in the central Persian Gulf. J. Pet. Sci. Eng. 2018, 171, 1113–1122. [Google Scholar] [CrossRef]
  9. Gao, H.; Wang, C.; Cao, J.; He, M.; Dou, L. Quantitative study on the stress sensitivity of pores in tight sandstone reservoirs of Ordos basin using NMR technique. J. Pet. Sci. Eng. 2019, 172, 401–410. [Google Scholar] [CrossRef]
  10. Feng, S.; Chai, J.; Xu, Z.; Qin, Y. Evaluating the Mesostructural Changes of Laboratory Created Soil-Rock Mixtures Using a Seepage Test Based on NMR Technology. J. Test. Eval. 2018, 46, 879–891. [Google Scholar] [CrossRef]
  11. Liu, Z.; Yang, H.; Wang, W.; Cheng, W.; Xin, L. Experimental Study on the Pore Structure Fractals and Seepage Characteristics of a Coal Sample Around a Borehole in Coal Seam Water Infusion. Transp. Porous Media 2018, 125, 289–309. [Google Scholar] [CrossRef]
  12. Chen, M.; Dai, J.; Liu, X.; Qin, M.; Pei, Y.; Wang, Z. Differences in the Fluid Characteristics between Spontaneous Imbibition and Drainage in Tight Sandstone Cores from Nuclear Magnetic Resonance. Energy Fuels 2018, 32, 10333–10343. [Google Scholar] [CrossRef]
  13. Zhao, Y.; Sun, Y.; Liu, S.; Wang, K.; Jiang, Y. Pore structure characterization of coal by NMR cryoporometry. Fuel 2017, 190, 359–369. [Google Scholar] [CrossRef]
  14. Ren, Y.; Sun, Y.; Meng, X. Multi-scale structural characteristics and the damage evolution mechanism of rock under load. Mater. Lett. 2023, 331, 133430. [Google Scholar] [CrossRef]
  15. Sun, Y.; Meng, X.; Ren, Y. Experimental study on the evolution of rock microstructure under dynamic water pressure. Mater. Lett. 2023, 349, 134825. [Google Scholar] [CrossRef]
  16. Li, H.; Zhong, Z.; Liu, X.; Sheng, Y.; Yang, D. Micro-damage evolution and macro-mechanical property degradation of limestone due to chemical effects. Int. J. Rock Mech. Min. Sci. 2018, 110, 257–265. [Google Scholar] [CrossRef]
  17. Blümich, B.; Casanova, F.; Perlo, J.; Anferova, S.; Anferov, V.; Kremer, K.; Goga, N.; Kupferschlager, K.; Adams, M. Advances of unilateral mobile NMR in nondestructive materials testing. Magn. Reson. Imaging 2005, 23, 197–201. [Google Scholar] [CrossRef] [PubMed]
  18. Zhou, Y.; You, L.; Zi, H.; Lan, Y.; Cui, Y.; Xu, J.; Fan, X.; Wang, G. Determination of pore size distribution in tight gas sandstones based on Bayesian regularization neural network with MICP, NMR and petrophysical logs. J. Nat. Gas Sci. Eng. 2022, 100, 104468. [Google Scholar] [CrossRef]
  19. Lai, J.; Wang, G.; Fan, Z.; Chen, J.; Wang, S.; Zhou, Z.; Fan, X. Insight into the Pore Structure of Tight Sandstones Using NMR and HPMI Measurements. Energy Fuels 2016, 30, 10200–10214. [Google Scholar] [CrossRef]
  20. Liu, D.; Ge, H.; Liu, J.; Shen, Y.; Wang, Y.; Liu, Q.; Jin, C.; Zhang, Y. Experimental investigation on aqueous phase migration in unconventional gas reservoir rock samples by nuclear magnetic resonance. J. Nat. Gas Sci. Eng. 2016, 36, 837–851. [Google Scholar] [CrossRef]
  21. Zhou, Y.; Liu, Y.; Liu, B.; Wu, Z.; Weng, L.; Liu, Q. Experimental investigation of strength repairing effects of chemical grouting on fractured porous sandstone under different temperature conditions. Int. J. Rock Mech. Min. Sci. 2023, 170, 105552. [Google Scholar] [CrossRef]
  22. Ghobadi, M.H.; Babazadeh, R. Experimental Studies on the Effects of Cyclic Freezing-Thawing, Salt Crystallization, and Thermal Shock on the Physical and Mechanical Characteristics of Selected Sandstones. Rock Mech. Rock Eng. 2015, 48, 1001–1016. [Google Scholar] [CrossRef]
  23. Martínez-Martínez, J.; Benavente, D.; Gomez-Heras, M.; Marco-Castaño, L.; Garcia-del-Cura, M.Á. Non-linear decay of building stones during freeze-thaw weathering processes. Constr. Build. Mater. 2013, 38, 443–454. [Google Scholar] [CrossRef]
  24. Meng, T.; Xiangxi, M.; Donghua, Z.; Hu, Y. Using micro-computed tomography and scanning electron microscopy to assess the morphological evolution and fractal dimension of a salt-gypsum rock subjected to a coupled thermal-hydrological-chemical environment. Mar. Pet. Geol. 2018, 98, 316–334. [Google Scholar] [CrossRef]
Figure 1. Experiment process and scheme.
Applsci 14 07063 g001
Figure 2. Configuration of NMR test equipment.
Applsci 14 07063 g002
Figure 3. T2 spectrum distribution of sandstone.
Applsci 14 07063 g003
Figure 4. The peak area variation in the T2 spectrum.
Applsci 14 07063 g004
Figure 5. The relationship between area of T2 spectra distribution and loading ratio.
Applsci 14 07063 g005
Figure 6. Change in porosity rock under different external loads. (a) Cumulative porosity of 0.6UCS. (b) Cumulative porosity of 0.7UCS. (c) Cumulative porosity of 0.8UCS. (d) Cumulative porosity of 0.9UCS. (e) Cumulative porosity of 0.95UCS. (f) The variation law between porosity and UCS.
Applsci 14 07063 g006aApplsci 14 07063 g006b
Figure 7. Microstructure characteristics of rock mass under different loads. (a) Rock SEM image magnified 5000 times at 0.7 UCS. (b) Rock SEM image magnified 20,000 times at 0.7 UCS. (c) Rock SEM image magnified 5000 times at 0.8 UCS. (d) Rock SEM image magnified 20,000 times at 0.8 UCS. (e) Rock SEM image magnified 5000 times at 0.9 UCS. (f) Rock SEM image magnified 20,000 times at 0.9 UCS. (g) Rock SEM image magnified 5000 times at 0.95 UCS. (h) Rock SEM image magnified 20,000 times at 0.95 UCS.
Applsci 14 07063 g007
Figure 8. Pore size distribution of rock samples with different axial compression ratios.
Applsci 14 07063 g008
Table 1. NMR T2 spectral area of different rock samples.
SamplesTSAMISAProportionMESAProportionMASAProportion
004256.863928.7392.3%290.616.8%37.520.9%
S-260%5148.544837.0794.0%281.515.5%29.960.5%
S-370%4516.694038.8589.4%359.258.0%118.592.6%
S-480%5250.304714.4589.8%404.857.7%131.002.5%
S-590%6196.254435.0271.6%838.0513.5%923.1814.9%
S-695%7249.234529.5962.5%1047.9814.4%1671.6623.1%
TSA is total spectrum area; MISA is spectrum area of micropores; MESA is spectral area of mesopores; MASA is spectral area of macropores.
Disclaimer/Publisher’s Note: The statements, opinions and data contained in all publications are solely those of the individual author(s) and contributor(s) and not of MDPI and/or the editor(s). MDPI and/or the editor(s) disclaim responsibility for any injury to people or property resulting from any ideas, methods, instructions or products referred to in the content.

