Abstract
This investigation concentrates on refining the accuracy of earthquake parameters as reported by various Saudi seismic networks, addressing the significant challenges arising from data discrepancies in earthquake location, depth, and magnitude estimations. The application of sophisticated machine learning techniques, particularly the Isolation Forest algorithm, has markedly enhanced the precision in the estimation of seismicity parameters by effectively identifying and eliminating outliers and discrepancies. A newly developed and refined seismicity catalog was employed to accurately determine key seismic parameters such as the magnitude of completeness (), a-value, and b-value, thereby underlining their indispensable role in regional seismic hazard assessment. The research underscores the substantial impact of data inconsistencies on the evaluation of seismic hazards, thereby advocating for the advancement of research methodologies within the field of seismotectonics. The insights derived from this study significantly contribute to a more profound understanding of the seismotectonic processes in the region. These insights are crucial for the development of comprehensive seismic hazard assessments and the formulation of targeted earthquake preparedness strategies, thereby enhancing resilience against seismic risks in the region.
1. Introduction
Understanding the discrepancies in reported parameters of earthquake sources is crucial for developing effective mitigation strategies to minimize potential seismic damage. Earthquake parameters, such as magnitude, depth, and origin-time, are pivotal in seismic hazard analysis and the design of earthquake-resistant structures [1]. Inconsistencies in these parameters, arising from varied measurement techniques and interpretational differences, can lead to significant variations in seismic hazard assessments [2]. These variations can impact the predicted ground motion intensities and, consequently, the design parameters for buildings and infrastructure. Accurate determination and consensus on these parameters are therefore imperative for the reliability of seismic risk assessments and the effectiveness of mitigation strategies [3]. This necessity is highlighted in regions with high seismicity, where discrepancies in earthquake parameters can lead to underestimation or overestimation of seismic hazards, significantly affecting public safety and economic losses [4]. Therefore, addressing these discrepancies is critical. It necessitates ongoing research to refine seismic measurement techniques and improve data interpretation.
Seismic networks play a pivotal role in monitoring and reporting seismic activity in various regions, including the geologically significant Red Sea area. The Red Sea, a geologically dynamic region located between the Arabian and African Plates, has long been a subject of seismic study, given its complex tectonic interactions and the significant seismic activity they generate [5]. The Saudi seismic networks play an instrumental role in capturing this seismicity, providing crucial data that necessitates sophisticated spatial analysis for a comprehensive understanding [6]. These networks consist of an array of seismograph stations strategically positioned around the Red Sea. Furthermore, the seismic networks in the Red Sea region often collaborate with international seismic monitoring organizations. This collaboration enhances the overall understanding of seismicity patterns and contributes to the development of more comprehensive models for earthquake prediction and risk assessment [7]. The Saudi seismic networks, while collectively providing crucial insights into the seismicity of the Red Sea, are likely to report discrepancies in the parameters of earthquake sources, primarily due to variations in their operation times and spatial coverages. Each network, operating independently with distinct timelines and geographical focuses, may capture differing aspects of seismic events. These discrepancies can manifest in variations in reported earthquake magnitudes, depths, and epicentral locations, influenced by the specific technological capabilities and spatial distribution of the seismographs in each network [8]. Furthermore, the coverage area of each network, whether it’s concentrated in specific regions or spread across a broader area, can lead to differences in the detection and characterization of seismic events, particularly in the spatially complex and tectonically active Red Sea region. These variations underscore the importance of integrating data from all networks for a more comprehensive understanding of the Red Sea’s seismicity [9].
Traditionally, seismologists have relied on statistical methods to analyze seismic data, but these methods often struggle with the complex, multi-dimensional nature of the data generated by seismic networks [10]. Machine learning approaches, particularly the implementation of Isolation Forests [11], have opened new avenues for seismologists to identify discrepancies in seismic data, a crucial aspect in the study of earthquake phenomena. Isolation Forests are an ensemble-based machine learning algorithm, primarily designed for anomaly detection. This method is particularly adept at identifying data points that deviate significantly from the norm, which in the context of seismology, translates to discrepancies in earthquake parameters such as magnitude, depth, or epicentral coordinates reported by different seismic monitoring stations [12]. The strength of Isolation Forests lies in their ability to handle high-dimensional datasets efficiently, making them well-suited for seismic data which is typically multi-faceted and voluminous. This is especially valuable in regions like the Red Sea, where multiple seismic networks with varying operation times and spatial coverages operate [2].
The present study endeavors to leverage machine learning techniques, specifically Isolation Forests, to tackle the issue of identifying inconsistencies in seismic data collected by various Saudi seismic networks monitoring the Red Sea. The primary impetus for utilizing machine learning techniques in the study was to address the intrinsic complexities and challenges associated with seismic data analysis [13,14]. Traditional methodologies frequently encounter difficulties due to the high dimensionality and non-linear characteristics of seismic data, often leading to inaccuracies in identifying and characterizing seismic events. Conversely, machine learning techniques are adept at managing such complexities through their capacity to learn patterns and relationships from extensive datasets. The Isolation Forest algorithm was selected for several reasons [11,12]. Its efficiency in handling high-dimensional data makes it particularly suitable for analyzing intricate seismic datasets, ensuring effective anomaly identification without being overwhelmed by the data’s volume and complexity. Unlike conventional anomaly detection methods that focus on modeling normal data points, the Isolation Forest algorithm isolates anomalies by constructing binary trees, facilitating more effective outlier identification, as anomalies typically exhibit shorter path lengths in the trees. This feature is vital for detecting unusual seismic activity that may signify significant geological events. Additionally, the algorithm’s scalability makes it appropriate for extensive seismic datasets, efficiently processing large volumes of data and proving ideal for regional seismic hazard assessments [2,15,16]. By isolating and removing outliers, the Isolation Forest algorithm also enhances the precision of seismicity parameter estimations, which is crucial for parameters such as the magnitude of completeness (), a-value, and b-value, all of which are essential for seismic hazard assessments. The implementation of the Isolation Forest algorithm in the study conferred several notable advantages: it resulted in more precise estimations of seismicity parameters, improved the overall quality of the seismic dataset by filtering out anomalous data points, and enabled the prompt identification of unusual seismic patterns. This capability is crucial for timely interventions to mitigate seismic hazards [17,18,19].
The ultimate goal of this step is to enhance both the accuracy and comprehensiveness of seismic data interpretation, thereby achieving a deeper understanding of seismic activities in the Red Sea region. This research produces a harmonized seismicity catalog, which is subsequently used to compute the frequency-magnitude distribution, or the b-value, of seismic activity across multiple regions in the Red Sea. Additionally, the a-value and the magnitude of completeness () are assessed to refine seismic hazard mitigation strategies [1,20]. The improved accuracy and reliability of the seismicity parameters—namely, , a-value, and b-value—are instrumental for vulnerability assessments. By providing more precise data on seismic activity, these refined parameters enable better-informed decisions regarding building codes, retrofitting strategies, and risk management practices. The revised manuscript will include a detailed explanation of how these enhanced parameters can be effectively utilized to improve vulnerability assessments and support more resilient urban planning and infrastructure development [21,22,23,24,25].
The structure of the current article is as follows: Section 1 introduces the study’s scope and objectives. Section 2 presents the seismotectonic setting of the Red Sea region. Section 3 describes the research methodology used. Section 4 discusses the experimental design, including data collection and statistical techniques for data analysis. Finally, Section 5 and Section 6 present and interpret the findings, concluding with the study’s contributions.
2. Seismotectonic Framework
The Red Sea region, a significant rift zone between the African and Arabian tectonic plates, presents a complex and intriguing seismotectonic framework that has been the focus of extensive geological and seismological studies [26,27,28,29,30]. The Red Sea formed as a result of the divergent motion between the African and Arabian plates, which began in the late Oligocene to early Miocene (Figure 1a). This rifting process is part of the larger Red Sea–Gulf of Aden–East African Rift system, a classic example of a triple junction [26,30,31]. The extensional forces led to the formation of a rift valley, which subsequently evolved into a young oceanic basin. The rifting was accompanied by extensive volcanic activity, evidenced by the presence of basaltic flows and other volcanic rocks along the rift margins. The Red Sea basin’s morphology varies along its length, transitioning from narrow and deep in the south to wide and shallow in the north. This morphological variation reflects differences in the spreading rates and the stage of oceanic crust formation. The central and southern parts are characterized by a well-developed axial trough, indicative of active sea-floor spreading [26,30,31]. The northern part, however, is marked by a wide shelf area and less pronounced bathymetric features. Structurally, the region is marked by a series of transform faults and fracture zones that accommodate the differential motion between the plates [31]. These transform faults often host significant seismic activity and are crucial in understanding the seismic hazard of the region. The Red Sea is seismically active, with the distribution and characteristics of seismicity varying along its length. The central and southern segments, where active sea-floor spreading occurs, exhibit moderate to high seismicity (Figure 1b) with relatively shallow focus earthquakes [28]. These earthquakes are primarily associated with the normal faulting mechanism, consistent with the extensional regime of an active rift. In contrast, the northern segment shows lower seismic activity, with earthquakes occurring at greater depths. This variation in seismicity is attributed to the differences in the crustal and lithospheric structures along the rift [28]. The seismic activity in the region provides valuable insights into the ongoing tectonic processes, such as the rate and nature of the spreading and the dynamics of the transform faults. The seismotectonic framework of the Red Sea has significant implications for regional geodynamics. The study of seismicity patterns and focal mechanisms provides insights into the strain distribution and stress regime in the rift system. Furthermore, the Red Sea region serves as a natural laboratory for studying the processes of continental breakup and the transition from rifting to drifting, offering a window into the early stages of ocean basin formation [26,30,31].
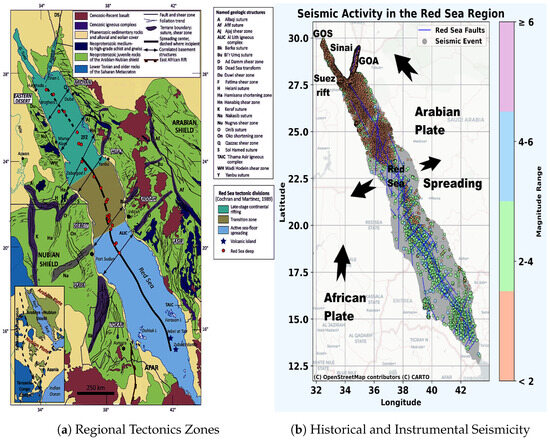
Figure 1.
(a) Tectonic Divisions and Geological Characteristics of the Red Sea Region Derived from [27,31]. (b) Spatial Distribution of Seismic Activity in the Red Sea Region as Recorded by Various Saudi Arabian Seismic Networks.
Recent spatial distributions of seismicity, as illustrated in Figure 1b, provide substantial evidence of the active plate boundaries encircling the Arabian Peninsula. The frequency of earthquakes in the Gulf of Aqaba presents a notable seismic hazard, especially to the northern regions of Saudi Arabia. In addition, catastrophic earthquakes in the Zagros Mountains of southern Iran pose the risk of long-period ground motion shaking in eastern Saudi Arabia. The seismic activity associated with the Dead Sea Transform is characterized by a combination of swarm and mainshock-aftershock types of earthquake occurrences, as identified by [32].
3. Anomaly Detection and Quantification of Seismicity Parameters
Anomaly detection in seismic activity, particularly through the application of Isolation Forest algorithms, represents a critical frontier in seismology, offering a nuanced approach to identifying irregular patterns indicative of seismic events. The Isolation Forest method, distinct from traditional anomaly detection techniques, operates on the principle of isolating anomalies instead of profiling normal data points. This is achieved through a mechanism akin to the random forest algorithm, utilizing numerous decision trees. Each tree isolates a data point by randomly selecting a feature and then randomly selecting a split value between the maximum and minimum values of the chosen feature. The fundamental premise rests on the notion that anomalies are ’easier’ to isolate due to their inherent differences from normal observations. This leads to shorter paths in the tree structure for anomalies. Mathematically, this can be represented as the path length for a data point x, where anomalies will, on average, have shorter path lengths. The anomaly score is computed using the equation [11]:
where is the average path length of x over all the trees in the forest, n is the number of external nodes, and is the normalization factor to standardize the path length. In the context of seismic activity, this methodology allows for the swift and effective identification of seismic events that deviate from established patterns, thereby facilitating timely and informed responses to potential seismic hazards. By employing this technique, seismologists can efficiently sift through vast datasets to pinpoint potential seismic anomalies, which are crucial for early warning systems and risk assessment. The application of the Isolation Forest algorithm for anomaly detection in seismic activity leverages its unique approach to identify irregular seismic patterns, which significantly deviates from conventional methods.
Unlike standard anomaly detection techniques that focus on modeling the normal data points, the Isolation Forest algorithm isolates anomalies. This isolation is executed through the construction of binary trees. For each tree in the forest, the algorithm randomly selects a feature and then randomly chooses a split value between the maximum and minimum values of that feature. This process partitions the data space, and the path length from the root node to the terminal node becomes a measure of normality [11]. In an Isolation Forest comprising multiple trees, the path length for a data point x is shorter for anomalies. This is quantified as:
where is the anomaly score, is the expected path length of x, and is the normalization factor, calculated as
with being the harmonic number. In seismic data analysis, this technique can identify outliers which could signify unusual seismic activity. The algorithm’s efficiency stems from its ability to handle multi-dimensional data, making it adept at processing complex seismic datasets. The average path length becomes a critical metric, as shorter paths indicate anomalies. This is especially pertinent in seismology, where early detection of such anomalies can lead to timely interventions and potentially mitigate the risks associated with seismic events. The Isolation Forest thus serves as a robust tool in the arsenal of seismologists, enabling them to discern and react to aberrant seismic patterns with greater accuracy and speed. The computational methodology employed in this study is delineated in Algorithm 1, providing a structured outline of the procedural steps and analytical techniques utilized.
| Algorithm 1 Isolation Forest for Anomalous Seismic Activity Detection |
|
The initial phase of ascertaining the seismic parameters a- and b-value involves computing the magnitude of completeness (()) for the Saudi earthquake catalog [33]. () is pivotal in seismicity analyses as it represents the minimum magnitude recorded comprehensively across the entire dataset [34]. Notably, the () value in earthquake catalogs generally diminishes over time with the augmentation of seismograph numbers and the advancement of analytical methodologies, as noted by [35]. For this study, the maximum curvature method [10] is employed to determine () within the Red Sea region, offering a straightforward and efficient approach for () calculation. This method also proves effective in predicting the spatial dynamics of Frequency-Magnitude Distribution (FMD) correlations [36,37].
The incorporated methodology utilizes a time window spanning 100 seismic events, a shift interval of 10 occurrences, and the application of bootstrapping techniques [10] to ascertain the confidence level of () derived from the Saudi earthquake catalog. The Gutenberg-Richter magnitude-frequency relationship in this context is represented by the equation, as elucidated by [36]:
N(Mw) is the magnitude of an earthquake larger than or equal to Mw, and a and b are the Gutenberg-Richter model parameter constants [38]. The value of a is a parameter indicating seismic activity in several locations at a given moment. It is known as the seismic index, whereas b is a tectonic parameter that specifies the slope of the distribution of the magnitude of the earthquake frequency. The b-values were computed using ZMAP [10]:
is the average value of the magnitude group with and then, the standard error value is also calculated for the b value of the frequency-magnitude relationship.
4. Saudi Networks and Seismicity Database Development
This section describes the creation of the Saudi Seismicity Database, detailing data collection and standardization from Saudi seismic networks and highlighting its role in regional seismic hazard. This bifurcation in seismic monitoring infrastructure reflects the nation’s commitment to enhancing its capabilities in seismological research and hazard assessment.
4.1. KSU Seismographic Network (KSUSN)
Since 1985, King Saud University (KSU) has operated a seismological network (KSUSN), which includes a central station in Riyadh and has expanded to thirty stations, with focused subnetworks in the Gulf of Aqaba and southwestern Saudi Arabia [39]. The Riyadh station is equipped with both short-period and long-period seismometers, and has both analog and digital recording. Data processing and analysis within the KSUSN network are utilized to handle real-time event detection, automated analysis, and more detailed waveform analysis [39], including event location and magnitude determination. The network’s comprehensive setup allows for a thorough analysis of seismic data across the network [39,40]. The spatial distribution of seismic events reported by the King Saud University Seismic Network (KSUSN) is depicted in Figure 2b.
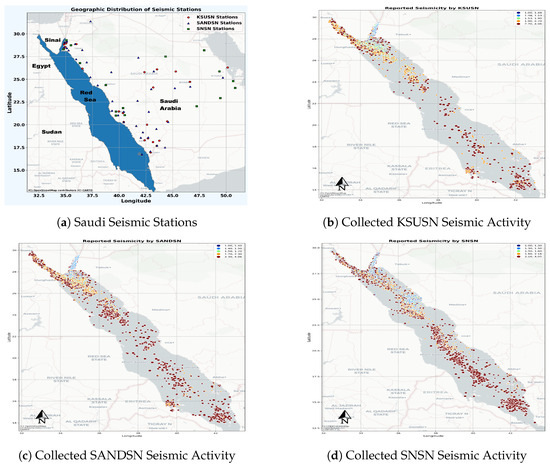
Figure 2.
(a) Geographic Distribution of Utilized Seismographic Stations in Saudi Arabian Networks [6]. (b) Compilation of Seismic Data Recorded by the King Saud University Seismic Network (KSUSN). (c) Aggregated Seismic Activity Data Captured by the Saudi Arabian National Digital Seismographic Network (SANDSN). (d) Comprehensive Collection of Seismic Events Recorded by the Saudi National Seismographic Network (SNSN).
Table 1 presents a comprehensive statistical analysis of seismic activity as reported by the KSUSN. The statistical analysis of seismic activity in the Red Sea area, spanning the years 1985–2003. The data, encompassing a count of 22,304 events. The mean year of occurrence is centered around the year 2000, with a standard deviation suggesting a concentration of activity within a relatively short timeframe. The interquartile range and quartile deviation further indicate that the majority of seismic events occurred in a narrow time span. Monthly and daily distributions show a more uniform spread throughout the year and month, respectively, with negligible skewness and kurtosis, implying a random distribution of seismic events over these periods. The spatial analysis of latitude and longitude data, as illustrated in Figure 2b, reveals a notable concentration of seismic activity within distinct geographic areas, primarily in the northern Red Sea region and the Gulfs of Aqaba and Suez. This concentration is characterized by lower standard deviations and higher kurtosis values, indicating a focused clustering of seismic events within these regions. The significant standard deviation and notably high kurtosis observed in the depth data suggest a broad spectrum of seismic event depths, including several exceptionally deep occurrences. This pattern may indicate the presence of data contaminations or outliers within the dataset. The magnitude data, characterized by an average of 1.92 and a comparatively low standard deviation, indicates that most seismic events recorded were of low to moderate intensity. An exception to this trend is the period of the catastrophic 7.2 magnitude Aqaba earthquakes in 1995, which stands out as a significant deviation from the general pattern.

Table 1.
Comprehensive Statistical Analysis of Seismic Activity in the Red Sea Area (1985–2003) as Reported by the King Saud University Seismic Network (KSUSN).
4.2. KACST Seismographic Network (SANDSN)
In 1993, the King Abdulaziz City for Science and Technology (KACST) established a seismological network and observatory. This network comprises several seismic stations that gather data and transmit it to the central facility located within KACST. Subsequently, this facility was upgraded to become the Saudi Arabian National Digital Seismographic Network (SANDSN), also managed by KACST. This development represents a significant enhancement in the region’s seismic monitoring capabilities. Set to become operational in 1999, this network incorporates modern technology with broadband sensors and real-time data transmission. It includes thirty-two seismic stations, providing comprehensive coverage for monitoring seismic activity. The network is capable of handling large volumes of data, ensuring efficient processing and analysis [39,40]. Figure 2c compiles the seismic activity data reported by SANDSN, encompassing the period from 1993 to 2005.
The detailed statistical analysis of seismic activity in the Red Sea area from 1993 to 2005, as recorded by the SANDSN is given in Table 2. The dataset encompasses 34,812 seismic events, providing an extensive overview across a 13-year span. An analysis of the temporal distribution, as reflected in the annual data, reveals a notable increase in seismic activity in the latter part of the period under study. This clustering, emphasized by the negative skewness, could be reflective of a period of increased tectonic activity or improved seismic detection capabilities. Monthly and daily distributions exhibit a near-uniform spread over the course of a year and a month, with minimal skewness and kurtosis. This indicates a consistent, non-seasonal pattern of seismic occurrences. The spatial distribution of events, as depicted in Figure 2c, demonstrates concentrated seismic activity within specific geographic regions, as the patterns previously illustrated by KSUSN data. The depth data exhibits a wide range of seismic event depths, as indicated by the large standard deviation and high kurtosis. Magnitude data indicates that the majority of seismic events were of low to moderate intensity, with a mean magnitude of 1.697. The data reported by both KSUSN and SANDSN exhibit analogous temporal and spatial characteristics and behaviors, indicating consistency in seismic activity patterns as captured by these networks.
Table 2.
Detailed Statistical Analysis of Seismic Activity in the Red Sea Area from 1993 to 2005, as Recorded by the Saudi Arabian National Digital Seismographic Network (SANDSN).
4.3. SGS Seismographic Network (SNSN)
In 2005, the Saudi Geological Survey (SGS) commenced the operation of the Saudi National Seismographic Network (SNSN). The network comprises 27 broadband stations across the Arabian Shield and Platform, equipped with state-of-the-art seismic monitoring tools and satellite-based data transmission and remote control systems. Centralized in Jeddah, it efficiently manages seismic data collection, processing, and analysis. The network operates on specialized software, designed to withstand harsh environments, and maintains rigorous station performance monitoring, ensuring high reliability and efficiency in seismic activity monitoring [6,40]. Figure 2d illustrates the spatial distribution of earthquake activity reported by SNSN in the Red Sea region, covering the period from 2005 to 2020.
Table 3 presents a statistical overview of seismic activity in the Red Sea Area from 2005 to 2020, as recorded by SNSN, offering essential insights into the seismicity of the region. The data set encompasses 23,731 seismic events. The temporal analysis shows a mean year of seismic activity centered around 2010, with a standard deviation indicating a spread of events over the 15-year period. The skewness value suggests a slight concentration of events in the latter part of the period, which could indicate either an increase in seismic activity or advancements in seismic detection capabilities. The distribution of events across months and days shows a fairly uniform spread, with minimal skewness and kurtosis, indicating a non-seasonal pattern of seismic occurrences. From a spatial perspective (Figure 2d), the data suggest a broader range of seismic activity across the region, as indicated by the higher standard deviations compared to earlier periods. This might suggest improvements in the network’s spatial coverage. The depth data reveals a wide range of seismic event depths, with a significant standard deviation and extremely high kurtosis. In terms of magnitude, the majority of seismic events were of low to moderate intensity, with a mean magnitude of 1.586. The presence of events with magnitudes up to 5.8, however, highlights the potential for significant seismic occurrences within the region.
Table 3.
Comprehensive Statistical Overview of Seismic Activity in the Red Sea Area (2005–2020) as Documented by the Saudi National Seismic Network (SNSN), Managed by the Saudi Geological Survey (SGS).
5. Results and Discussions
This section presents the results of the seismic analysis and discusses their implications. These findings provide new insights into the seismic and tectonic processes of the Red Sea region, enhancing the understanding of regional seismic activity. Subsequent subsections detail the observations and their significance in the context of Red Sea seismic hazards.
5.1. Discrepancies in Collected Seismicity Data
This analysis utilizes earthquake data from the comprehensive KSUSN, SANDSN, and SNSN seismographic networks in Saudi Arabia. The detailed seismic data, is rigorously recorded and processed, proving invaluable for this study. This dataset offers an in-depth view of seismicity in the Red Sea region.
The initial stage of the analysis involves a detailed univariate assessment, systematically exploring the distributions of eight key parameters: Year, Month, Day, Hour, Latitude, Longitude, Magnitude, and Depth. This is depicted in Figure 3, which exclusively presents non-duplicated data as reported by each individual seismic network. The analysis offers insights into temporal trends, diurnal patterns, and spatial concentrations of seismic events. These patterns are pivotal for discerning the operational characteristics of each network, understanding data quality issues, such as contamination, and interpreting the underlying tectonic processes in the Red Sea region. We employed Kernel Density Estimations (KDE) to analyze discrepancies in seismic activity parameters among the KSUSN, SANDSN, and SNSN networks, due to KDE’s ability to provide a continuous, smooth visualization of data distributions, crucial for handling the variable and irregular nature of seismic activity data. KDE’s suitability for comparative analysis is particularly beneficial, as it highlights differences and similarities in seismic recordings across the networks. It also excels in identifying concentrated zones of seismic activity, aiding in the assessment of regional seismic risks. The use of KDE, given its robustness and flexibility, ensures our analysis is not overly influenced by outliers or rigid distributional assumptions, making it an ideal choice for a nuanced understanding of seismic behavior and potential hazards across these diverse seismological networks.
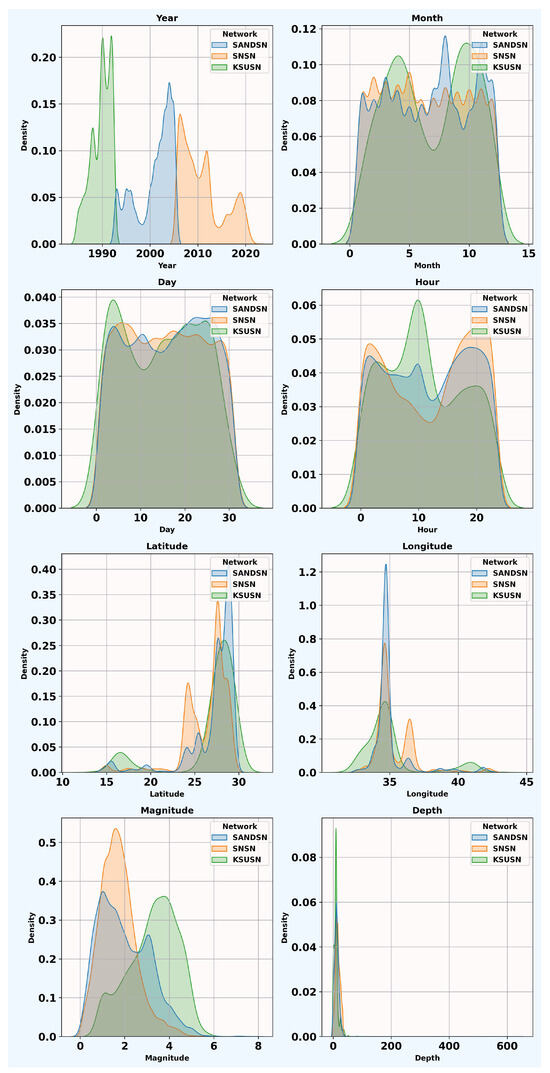
Figure 3.
Kernel density estimations (KDE) of seismic activity parameters as recorded by three seismic networks in Saudi Arabia: SANDSN, SNSN, and KSUSN. The distributions across eight different parameters: Year, Month, Day, Hour, Latitude, Longitude, Magnitude, and Depth. The figure presents exclusively non-duplicated data as reported by each individual seismic network.
For the year-to-year comparisons, the kernel density estimation (KDE) plots reveal distinct periods of increased seismic activity, as indicated by prominent peaks in the data collected by the SANDSN and KSUSN networks. Such temporal clustering could suggest either episodic seismic episodes or an enhancement in the operational capacity and sensitivity of the recording instruments. The monthly seismicity exhibits noticeable trends. A quasi-seasonal cyclicity is apparent in the KDE plots for all networks, with the SANDSN network showing more significant variability. This implies a temporal pattern in seismicity, potentially linked to natural or anthropogenic factors that fluctuate on a monthly basis. Additionally, diurnal patterns have been observed. The data distributions across the days of the month do not show significant peaks, indicating a lack of daily periodicity in seismic events within the observational scope of these networks. Furthermore, the hourly concentration of seismic activity is highlighted. Distinct peaks at specific hours could indicate diurnal rhythms in seismic activity, although these might also result from data logging methods or the operational schedules of the networks.
The latitudinal distribution shows acute peaks at certain latitudes in the SANDSN and KSUSN distributions, indicating localized zones of seismic activity and suggesting concentrated stress or fault line activity in these regions, while the SNSN’s distribution is more diffuse, pointing to a more heterogeneous distribution of seismicity across latitudes. In terms of longitudinal spread, the SANDSN exhibits a pronounced peak at a particular longitude, indicative of a concentrated longitudinal seismic zone, whereas the SNSN and KSUSN portray a more distributed pattern, reflecting a broader longitudinal range of seismic activity. Regarding magnitude variation, the SANDSN’s broader magnitude spectrum with a peak at lower magnitudes echoes the general principle that smaller earthquakes occur more frequently, and the distinct peaks in the SNSN and KSUSN datasets may be representative of the networks’ detection thresholds or specific geological structures influencing regional seismicity. In the depth profile, all networks show a preference for recording shallow seismic events, with a rapid decrease in density with increasing depth, indicating that the majority of detectable seismic activity in these networks occurs at shallower geological strata. Conclusively, this analysis reveals the intricate variances in seismic activity as captured by the triad of networks, underscoring differences in detection capabilities and regional seismotectonic characteristics. The pronounced peaks in specific temporal and spatial parameters underscore potential loci and intervals of increased seismic hazard, providing invaluable insights for the formulation of comprehensive seismic hazard assessments and the development of mitigation strategies within the region.
The hourly distribution of seismic activity density for the KSUSN and SNSN networks, as shown in Figure 3, exhibits a pronounced discrepancy during daytime hours. This discrepancy can be attributed to several factors. One contributing factor could be the significant seismic activity associated with the large-magnitude earthquake that occurred in the Gulf of Aqaba in 1995. This event and its subsequent aftershocks likely influenced the seismic activity recorded during that period, potentially resulting in an anomalous distribution in the data. Moreover, the observed relative increase in seismic activity during nighttime can be explained by the enhanced detection capability of the networks during these hours. At night, the signal-to-noise (S/N) ratio is typically higher, leading to improved detection of smaller seismic events that might not be as easily identified during the day due to increased ambient noise levels [2].
The kernel density estimations of seismic parameters reported and depicted in Figure 3 bear significant implications for understanding both data contamination issues and the tectonics of the Red Sea region. Data contamination can arise from various sources such as instrumental noise, environmental factors, or human-induced seismicity, which can be inferred from the temporal distribution patterns. The pronounced peaks and troughs in the annual seismicity data from SANDSN might not solely represent actual changes in seismic activity but could also reflect periods of increased noise or changes in detection thresholds, which constitute a form of data contamination. Similarly, the diurnal patterns observed in the hourly distributions could be attributed to anthropogenic noise, which is particularly relevant near urban centers or industrial activities. The spatial distributions of seismic events, as indicated by the latitude and longitude density plots, show a clustering of seismicity which should be interpreted in the context of the Red Sea’s tectonics. The Red Sea is a region of active continental rifting, and the concentration of events in certain latitudinal and longitudinal bands suggests alignment with the tectonic features such as the central rift axis or transform faults. The variation in the magnitude and depth distributions across the networks could be related to the differential capability of each network to detect the smaller, more frequent events that are characteristic of rifting processes, versus the larger, less frequent events associated with transform faulting. The Red Sea’s tectonic regime, characterized by spreading and transform faulting, should produce seismicity at varying depths and magnitudes, but the KDE plots show a notable scarcity of deep events. This could indicate either a true absence of deep seismicity, which would be unusual for a rifting environment, or a significant under-detection by the seismic networks, which would be a critical deficiency in monitoring the complete tectonic activity. Ultimately, the interpretation of these kernel density estimates must consider the possibility of data contamination and the fundamental tectonic processes at play in the Red Sea region. Such considerations are essential for refining the seismic hazard assessment for Saudi Arabia, calibrating the seismic networks for better data quality, and understanding the geodynamic evolution of this tectonically active zone.
In the second phase of our investigation into discrepancies in reported parameters of Red Sea earthquake sources, we conducted an in-depth analysis of the temporal variations in earthquake magnitudes and depths. This analysis was segmented into four distinct temporal scales: yearly, monthly, daily, and hourly as shown in Figure 4. By dissecting the temporal variations of earthquake magnitudes and depths across these four time scales, we aimed to gain a comprehensive understanding of the seismic behavior in the Red Sea region, thereby enhancing our ability to predict and prepare for potential seismic hazards.
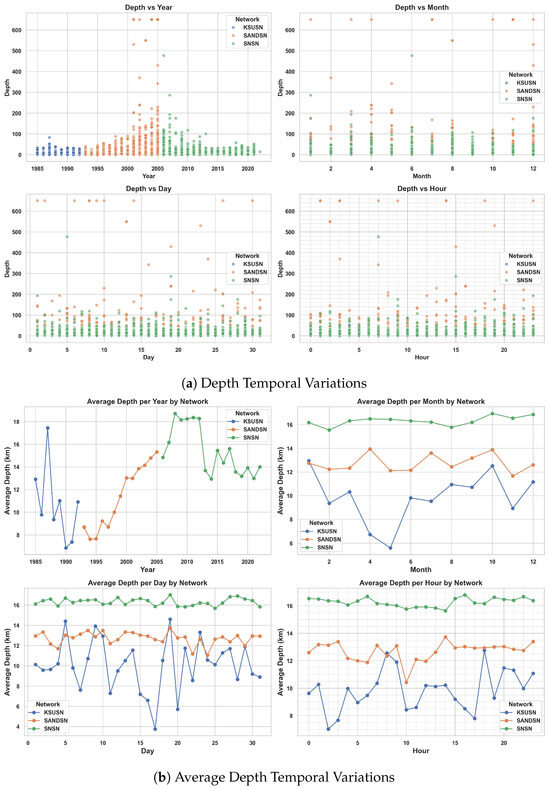
Figure 4.
Analysis of Temporal Variation in Seismic Depth Over Different Time Intervals in the Red Sea.
We meticulously examined how earthquake magnitudes and depths varied year-over-year, uncovering potential long-term trends or cycles in seismic activity. This part of the analysis aimed to establish if there were any significant shifts in seismic patterns over longer periods, which could suggest evolving geological conditions or changes in the Earth’s crust in the Red Sea region. On a monthly basis, our investigation focused on identifying any recurring seasonal patterns or anomalies. This could reveal insights into how seasonal climatic or human-induced factors, might influence the frequency and intensity of seismic events. The daily analysis was designed to detect any patterns that emerge on a 24-h scale, which could be significant for understanding the daily stress cycle of the Earth’s crust in the Red Sea area. This could provide crucial insights into the diurnal variations in seismic activity. Lastly, our hourly examination delved into the minutest temporal scale, investigating the hourly distribution of earthquake magnitudes and depths. This detailed scrutiny aimed to reveal any daily patterns or anomalies, which could be crucial for understanding the immediate triggers of seismic events.
Figure 4a presents the spatiotemporal dynamics of seismic activity in the Red Sea region through four scatter plots, correlating the depth of seismic events with annual, monthly, daily, and hourly time scales. The yearly distribution of earthquake depths reveals an increasing trend in both the number and depth of events, hinting at a potential intensification of tectonic processes over time. This trend is punctuated by episodic occurrences of deeper seismic events, possibly linked to the complex spreading and transform faulting systems characteristic of Red Sea tectonics. On a monthly scale, the earthquake depth distribution does not show a clear seasonal pattern, suggesting that seismicity in the region is not markedly influenced by seasonal factors. As the analysis moves to finer temporal resolutions, the daily distribution of earthquake depths appears random, lacking any discernible pattern. This might indicate that daily environmental factors or human activities do not significantly trigger seismic events in this region. Similarly, the hourly distribution does not reveal any diurnal patterns, implying that the natural tectonic processes in the Red Sea region overshadow any potential daily cyclical influences. Moreover, the consistency in reported earthquake depths across the KSUSN, SANDSN, and SNSN seismic networks indicates that they likely employ a similar velocity structure in their analyses, as no significant disparities are observed among the networks regarding the depth of detected seismic events. This consistency suggests a well-coordinated and uniform regional seismic observation system, enhancing the reliability of seismic data interpretation in the Red Sea region.
We calculate the average of reported depth values after investigating individual seismic events to distill the vast amount of data into a more manageable form that helps in identifying central tendencies and underlying patterns in the data, which might be obscured when dealing with individual data points. This approach is particularly useful in highlighting long-term trends, such as the gradual shift in seismic activity to different depths, which could indicate changes in geophysical processes or stress distributions within the Earth’s crust. Moreover, averaging also aids in reducing the noise inherent in the data, smoothing out short-term fluctuations or anomalies that might not be relevant to the broader geological understanding. Figure 4b depicts the average seismic depth reported by the KSUSN, SANDSN, and SNSN networks across the various temporal scales. The annual distribution of seismic activity for each network shows unique trends, with KSUSN indicating a significant increase in average depth over the years, potentially signaling changes in seismic activity or adjustments in network sensitivity. SANDSN follows a similar upward trend, albeit less pronounced, while SNSN exhibits more variability, reflecting differences in the depths of seismic events captured or in reporting methods. Notably, early data from KSUSN show considerable fluctuation, suggesting initial challenges in data collection or evolution in monitoring technologies and approaches. When examining the monthly distribution of seismic activity, all networks display variability without a clear seasonal pattern. However, KSUSN shows notable deviations in certain months, which might be attributed to geological phenomena or data collection anomalies. The daily distribution of seismic activity, particularly with KSUSN, demonstrates marked variability compared to other networks, which could be due to daily reporting practices or genuine variations in seismic activity. The hourly distribution of seismic activity illustrates relative consistency for SNSN, while KSUSN and SANDSN exhibit more variability. The pronounced deviations in KSUSN’s data could represent outliers or actual deep seismic events. Ranking the networks based on the extent of outliers or deviations, KSUSN appears first with the most significant range of variation, especially in the annual and monthly distributions. SANDSN, showing less variability than KSUSN, follows next. SNSN appears to have the least amount of outliers or deviations, suggesting either a more consistent data collection process or a more stable seismic regime. The presence of outliers in the data across all networks necessitates thorough scrutiny. These anomalies could reflect real variations in seismic depth, which are crucial for understanding the tectonic dynamics of the region, or they might indicate inconsistencies or errors in data collection, processing, or reporting. Further analysis, including an evaluation of the methodologies used by each network, is essential to validate these observations and ensure that the reported averages accurately reflect the seismic behavior in the Red Sea region.
To gain a comprehensive understanding of seismic activity, we apply the same procedure to individual variations in magnitude as well as to the average variation over different temporal periods. This dual approach allows us to capture the full spectrum of seismic behavior. By analyzing individual magnitude variations, we can identify specific events that are outliers or particularly significant, providing insights into the most extreme or unusual seismic activities in the region. Simultaneously, by calculating the average magnitude over various time frames, we can discern broader patterns and trends that might not be apparent from individual events alone. This averaging process helps in smoothing out short-term fluctuations and focusing on longer-term trends, providing a clearer picture of the overall seismic dynamics. It allows us to see how seismic activity might be evolving over time, potentially influenced by geological processes or human activities. By combining these two analytical approaches, we ensure a holistic understanding of seismic magnitudes.
Figure 5a expands the analysis of seismic activity in the Red Sea region to include the magnitudes of seismic events, using the same temporal metrics previously considered. The annual variation in reported magnitudes reveals a notable trend in seismic activity over the decades, characterized by an increasing frequency of events. Additionally, a shift towards higher magnitudes in recent years can be observed, potentially indicative of escalating tectonic stress within the region’s crust. This aligns with the geologically active nature of the Red Sea, a site of divergent tectonic plate movement involving the spreading of the African and Arabian plates. The monthly variation in reported magnitudes does not suggest a strong seasonal pattern, implying that tectonic processes in the area are not significantly influenced by seasonal climatic variations. The scatter plot showing daily variations in reported magnitudes appears uniform, indicating that seismicity does not exhibit a daily periodicity. Similarly, the hourly variation in reported magnitudes demonstrates a relatively even distribution of seismic magnitudes throughout the day, suggesting that diurnal factors do not significantly influence the region’s seismicity. Comparing the data across different seismic networks (KSUSN, SANDSN, and SNSN), there is a notable consistency in the capture of seismic events of various magnitudes. This reflects a robust and well-integrated seismic monitoring infrastructure in the Red Sea region. The consistency across networks also suggests that the recorded seismic activity accurately represents the regional tectonic behavior and is not merely an artifact of observational bias.
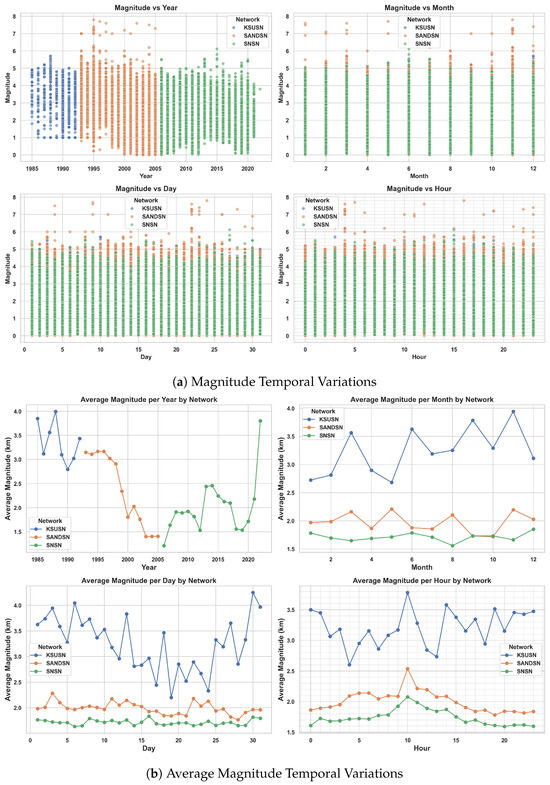
Figure 5.
Analysis of Temporal Variation in Seismic Magnitude Over Different Time Intervals in the Red Sea.
Figure 5b provides an analytical representation of the average earthquake magnitudes recorded over various temporal scales by the KSUSN, SANDSN, and SNSN seismic networks. This data is crucial for understanding seismic trends and the operational characteristics of each network in relation to regional tectonic activity. The annual distribution of average magnitudes from KSUSN initially shows higher values that decrease over time, while SNSN displays a general increase, marked by a pronounced escalation in later years. SANDSN maintains relatively stable average magnitudes throughout the period. The recent surge in average magnitude reported by SNSN could indicate a shift in tectonic activity or changes in the network’s detection capabilities. The monthly distribution from KSUSN reveals significant fluctuations in magnitude, possibly reflecting real variations in seismicity or seasonal influences on data collection. SANDSN and SNSN demonstrate more consistency, though SANDSN exhibits some variability, raising questions about outliers or seasonal seismic behavior. The daily distribution from KSUSN shows high variability, with some days reporting significantly higher average magnitudes, potentially indicative of outliers. In contrast, the more consistent trends from SANDSN and SNSN suggest a steadier detection of seismic magnitudes, although occasional deviations are present. The hourly distribution of average magnitudes from KSUSN shows the most significant variations, suggesting potential outliers within the hourly data. SANDSN exhibits a modest range of variation, while SNSN maintains a relatively stable pattern, with fewer deviations that could be outliers. Ranking the networks by the apparent number of outliers or deviations, KSUSN has the most notable fluctuations across all temporal scales, possibly indicative of outlier contamination. SANDSN follows with a moderate degree of variability, and SNSN is last, displaying the least variability and suggesting a more uniform data collection process.
The analysis of the spatial distribution of seismic data, as depicted in Figure 6, offers valuable insights into the dynamics of the rifting zones. The precise locations of earthquake clusters, in relation to established geological features, can shed light on the current state of rifting and the kinematics of the tectonic plates involved.
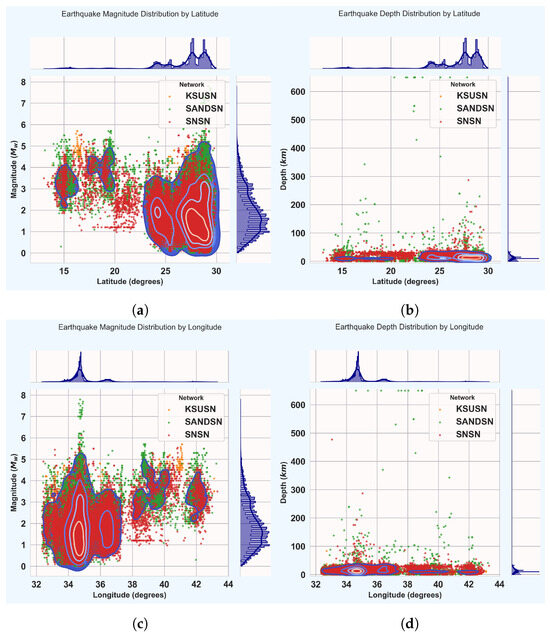
Figure 6.
Multifaceted Analysis of Spatial Earthquake Distribution Characteristics in the Red Sea: (a,c) showing the distribution of earthquake magnitudes across latitudinal and longitudinal ranges. (b,d) depicting the depth distribution of earthquakes along latitudinal and longitudinal coordinates.
Figure 6a,c illustrates the spatial distribution of seismic events in relation to geographic latitude and longitude, as recorded by the KSUSN, SANDSN, and SNSN seismic networks. These figures include marginal histograms that summarize the univariate distributions of earthquake magnitudes and geographic coordinates. Contour overlays superimposed on the scatter plots highlight areas of increased seismic activity, revealing pronounced clusters of events that may indicate the presence of fault zones or tectonic interfaces. These clusters, marked by peaks within the contour lines, signify a heightened frequency of seismic activity, which is critical for seismic hazard assessment and mitigation strategies. Additionally, the marginal histograms reveal a predominance of low-magnitude seismic events, with frequencies decreasing as magnitudes increase, which is consistent with recognized seismicity patterns. The distributions of seismicity across geographic axes, as captured by the different networks, may reflect the operational ranges and detection sensitivities of these systems. Furthermore, the spatial distribution of seismic events reveals a concentration of earthquakes along specific latitudinal and longitudinal bands, likely related to the rifting dynamics of the Red Sea and the adjacent Gulf of Suez and Gulf of Aqaba. The histograms indicate that the majority of seismic events are low in magnitude, a common characteristic of rifting zones where the crust undergoes extension, resulting in numerous but typically minor earthquakes as the lithosphere accommodates the tensional forces.
Figure 6b,d illustrates the distributions of earthquake depths in relation to latitude and longitude, respectively. The histograms located at the top of the plots reveal a notable aggregation of earthquake occurrences at specific latitudinal and longitudinal coordinates. Correspondingly, the depth histograms positioned on the right side of the figures highlight a predominance of shallow earthquakes over deeper ones. Both figures exhibit a discernible trend of decreasing earthquake frequency with increasing depth, as observed from the concentration of points near the bottom axis—a distribution pattern that aligns with global observations, where shallow earthquakes are more frequent than their deeper counterparts. The contour lines in the scatter plots represent kernel density estimations, furnishing a smoothed portrayal of point density that underscores areas with elevated earthquake frequencies. The clustering of seismic events at particular depths and geographic coordinates suggests the existence of fault lines or rifting zones. Furthermore, the aggregation of earthquakes at distinct latitudes and longitudes points to potential areas of intense tectonic activity, such as spreading centers or transform faults, indicative of divergent plate boundaries similar to those found in the Red Sea region. The prevalence of shallow seismicity indicates that tectonic deformation is predominantly taking place near the Earth’s surface, which is characteristic of nascent spreading centers like that of the Red Sea.
The individual spatial analysis of magnitude and depth of seismic activity, as presented in Figure 6, suggests active seafloor spreading in the Red Sea. The majority of seismic events occur at shallow depths, which correlates with the genesis of new oceanic crust. The aggregation of earthquakes along specific latitudes and longitudes is likely indicative of the structural characteristics of the Red Sea rift, including segmented spreading centers and transform faults. Such analysis enhances the comprehension of tectonic dynamics within the Red Sea and contributes to the refinement of models that describe plate interactions in this region.
5.2. Anomaly Pattern Detection
Anomaly pattern detection is crucial for understanding seismic activity in the Red Sea region. By identifying irregular seismic patterns, unusual tectonic events could be detected. This proactive identification of anomalies aids in the assessment of seismic hazards in this dynamic area.
Figure 7 delineates the variability and central tendencies of seismic parameters as recorded by the KSUSN, SANDSN, and SNSN seismic networks. The examination of Figure 7 reveals that the SNSN network tends to report a more constricted interquartile range of earthquake magnitudes compared to the KSUSN network, which documents a broader dispersion in magnitudes, with fewer atypical values. The SANDSN network demonstrates an interquartile range akin to that of SNSN but is distinguished by a significant number of outliers, suggestive of the intermittent recording of seismic events with considerably higher magnitudes. Regarding depth, both KSUSN and SNSN networks present a considerable number of outliers, implying the detection of events with depths markedly divergent from the majority. In contrast, the SANDSN network illustrates a more compact range and fewer outliers, reflecting a consistency in the recording of seismic depths. The distribution of latitude shows that KSUSN has outliers denoting seismic activities that occur substantially south of the primary cluster, whereas SNSN exhibits a wider range in the detection of latitudes. The SANDSN network, while encompassing a breadth of latitudes, records fewer outliers. For longitude, KSUSN’s data indicate a narrower range but with conspicuous outliers, hinting at the occasional detection of seismic events at extreme eastern or western longitudes. Conversely, SANDSN indicates a wide spectrum of detection, and SNSN suggests a concentrated collection of events with a handful of outliers. When ordered by the visible frequency of outliers or deviations in their collected data, SANDSN appears most prominent in magnitude outliers, followed by SNSN, then KSUSN. For depth, KSUSN and SNSN portray a comparable prevalence of outliers, whereas SANDSN displays fewer. Regarding latitudinal and longitudinal distributions, SNSN exhibits the widest scope of outliers, with KSUSN in succession and SANDSN recording the fewest. The manifestation of outliers warrants meticulous investigation to affirm the integrity of the data.
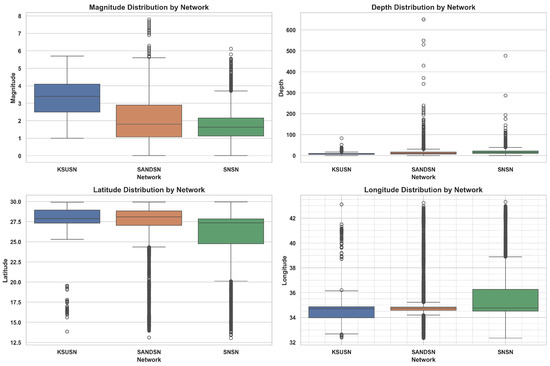
Figure 7.
Comparative Distribution of Seismic Parameters by Monitoring Network.
This study introduces the application of the Isolation Forest algorithm to identify and eliminate anomalous patterns observed in the seismicity of the Red Sea region. Isolation Forest, an effective machine learning method for anomaly detection, operates by isolating outliers rather than profiling normal data points. This approach is particularly suited for seismic data, where anomalies can indicate either significant geological events or data irregularities. By applying this technique to the seismicity of the Red Sea, the study aims to enhance the accuracy and reliability of seismic data interpretation, crucial for understanding the complex tectonic dynamics of this geologically active area. In accordance with the methodology outlined in Algorithm 1, anomalous seismicity patterns were identified.
The effectiveness of the Isolation Forest algorithm in refining seismic data for the Red Sea region is clearly demonstrated in Figure 8. This is evident from the general characteristics of the database, post-removal of outliers, which are the earthquakes that the isolation forest algorithm has identified as being the most different from the rest of the data. The algorithm proficiently differentiates between the prevailing seismic trends and atypical events, thereby purifying the dataset for enhanced analytical accuracy. Furthermore, the spatial distribution of the inliers prominently highlights the seismic zone of the rift, potentially offering valuable insights into the stress distribution and fault line dynamics within the Red Sea region. The outliers pinpointed by the analysis are primarily clustered in two regions: the northern part of the Red Sea, in proximity to the Gulf of Aqaba, and the southern part, near the Gulf of Aden. These zones are recognized for their seismic activity and have historically hosted some of the largest earthquakes in the region. Conversely, the inliers exhibit a more uniform distribution across the entirety of the Red Sea area.
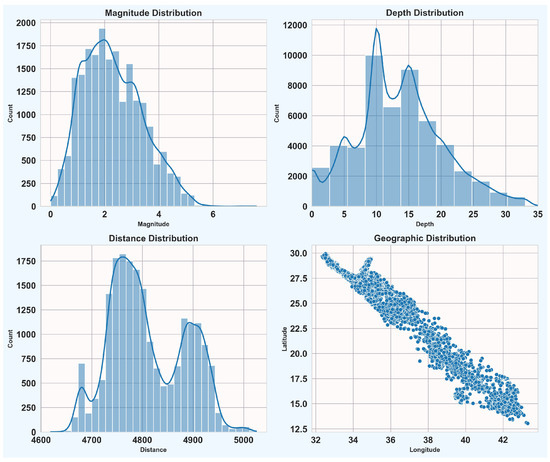
Figure 8.
General characteristics of the refined database for the Red Sea region, post-removal of outliers identified by the Isolation Forest technique.
Figure 8 illustrates the results of a comprehensive analysis of seismic activity in the Red Sea region, utilizing data gathered by Saudi monitoring networks. This analysis employs an isolation forest machine learning algorithm for the identification of anomalies. The figure delineates three key aspects of the seismic data: magnitude distribution, distance distribution, and geographic spread of the seismic events. The magnitude distribution indicates a predominance of seismic events with magnitudes below 2.5, alongside a minority of events exceeding a magnitude of 4.0. In terms of distance distribution, most events are observed within a 500 km radius from the monitoring stations, although a few extend up to 1750 km. Geographically, seismic activity is notably higher in the northern and central areas of the Red Sea, with a reduced frequency in the southern region. The overall interpretation of this data suggests that the Red Sea region exhibits significant seismic activity. While the majority of events are of lower magnitude, the presence of occasional larger magnitude events is notable. The geographical concentration of these events in the northern and central Red Sea is also evident. The application of the isolation forest technique has successfully identified a small subset of anomalous data points, which may be attributed to various causes such as data inaccuracies or the occurrence of atypical seismic events.
Table 4 presents the descriptive statistics of the newly developed unified seismicity catalog for Saudi Arabia and the Red Sea region. This comprehensive dataset, comprising 70,497 recorded events, provides valuable insights into the seismic activity of the area.
Table 4.
Descriptive Statistics of the Newly Developed Unified Seismicity Catalog for Saudi Arabia and the Red Sea Region.
The dataset encompasses a 37-year period from 1985 to 2022, with an average year of 2005.19 and a standard deviation of 6.75 years. This indicates a slight skew towards more recent events, attributed to the increased number of seismic stations and improved detection and recording capabilities over time. The uniform distribution across months (mean 6.53, std 3.48) shows that seismic activity in the region is not seasonal. The mean coordinates (26.80° N, 35.17° E) place the center of seismic activity in the northern part of the Red Sea and the two gulfs. The relatively small standard deviations in latitude (2.85°) and longitude (1.53°) suggest a concentration of events within a specific area corresponding to the Red Sea rift zone, Gulf of Suez, and Gulf of Aqaba. However, the range of coordinates (notably the maximum longitude of 43.31° E) indicates that some events occur in the surrounding regions.
The mean focal depth of 13.58 km with a standard deviation of 7.32 km suggests that most seismic activities in this region are shallow to moderate in depth, consistent with the tectonic setting of the Red Sea. The interquartile range (9.00 km to 18.10 km) further supports the prevalence of shallow to moderate-depth seismicity. With a mean magnitude of 1.88 and a standard deviation of 1.03, the data show that most recorded events are small. The interquartile range (1.10 to 2.50) reinforces this observation. However, the maximum magnitude of 7.80 indicates that the region can produce significant earthquakes, particularly in the Gulf of Aqaba area. The wide range of magnitudes (0.01 to 7.80) suggests a complex seismotectonic environment, possibly reflecting various tectonic processes including rifting and fault movements.
The newly developed seismicity catalog of the Red Sea clearly depicts the region’s active seismicity, characterized predominantly by frequent minor events but with the potential for occasional large earthquakes. The shallow depth profile aligns with the area’s geological setting as a divergent plate boundary. The spatial distribution likely correlates with the rift axis and associated fault systems.
The comparative analysis of seismicity parameters derived from the refined catalog, following machine-learning-based outlier removal, versus the original dataset from the three seismographic networks inclusive of anomalous entries, reveals both notable distinctions and intriguing similarities across key seismicity attributes.
In terms of magnitude distribution, the refined catalog exhibits a more constrained range and a lower mean magnitude. This suggests that the machine-learning outlier removal process effectively eliminated spurious seismic events, likely artifacts of instrumentation errors or misidentification. Consequently, this refinement provides a more representative portrayal of the region’s typical seismic energy release patterns.
Depth profiles between the two catalogs show marked differences, with the cleaned dataset presenting a shallower mean focal depth and reduced standard deviation. This adjustment aligns more closely with the expected crustal structure of the Red Sea rift zone, offering a more accurate representation of the depth distribution of seismogenic sources in the region.
Geographical distribution parameters demonstrate subtle yet significant shifts post-outlier removal. The refined catalog exhibits a more concentrated spatial clustering, evidenced by reduced standard deviations in both latitudinal and longitudinal dimensions. This spatial consolidation likely reflects a more accurate delineation of the active tectonic boundaries and associated fault systems within the Red Sea region.
Despite these differences, certain similarities persist between the two catalogs, particularly in the overall temporal distribution of events and the general trends in magnitude-frequency relationships. These enduring similarities lend credence to the fundamental patterns of seismic activity in the region. However, the observed differences underscore the critical importance of rigorous data cleaning and outlier removal in seismological studies.
5.3. Frequency-Magnitude Distribution Analysis
In tectonically active zones like the Red Sea region, data typically encompass a range of seismic events, including main shocks as well as aftershocks and foreshocks. The latter, although integral to seismic activities, may distort the analysis if the focus is on the primary seismic events. Prior to declustering, it’s a standard practice to eliminate outliers from the dataset. In the Saudi seismicity catalog, outliers arise from various sources, such as instrumental inaccuracies, incorrectly recorded events, or non-tectonic activities (e.g., explosions). Removing these outliers is essential to enhance the subsequent analysis’s accuracy and reliability. The final stage in examining seismicity in the Red Sea region, particularly following the exclusion of non-standard seismic events using the isolation forest method, involves two key activities: declustering the seismic catalog and estimating the frequency-magnitude distribution of events. This phase is pivotal for a more in-depth understanding of the area’s tectonic behavior. Declustering the seismic catalog entails differentiating main shock events from their associated aftershocks and foreshocks. This separation is critical for a precise characterization of the region’s seismicity, as it enables the analysis of independent seismic events without the influence of clusters commonly resulting from aftershock sequences. Declustering refines the dataset, more accurately reflecting the region’s inherent tectonic seismicity rather than the seismicity induced by preceding events. Following the removal of outliers, the data were processed using the Gardner and Knopoff technique, a method well-regarded in seismology for its ability to distinguish main seismic events from their aftershocks and foreshocks. This approach is grounded in the statistical analysis of the spatial and temporal distribution of earthquakes. The dataset, once declustered, offers a more transparent view of the primary seismic events, devoid of the impact of aftershocks and foreshocks. This clarity is vital for precise seismic hazard assessments, comprehending tectonic processes, and preparing for potential seismic occurrences in the region.
Following declustering, estimating the frequency-magnitude distribution is essential. This analysis offers insights into the probabilistic relationship between the frequency of seismic events and their magnitudes, a key factor in understanding seismic hazards. The frequency-magnitude distribution is a cornerstone in seismology for assessing seismic risk, as it informs about the likelihood of different magnitude events in the area. By examining this distribution, researchers can infer critical information about the stress regime and tectonic processes in the Red Sea region, contributing to a more comprehensive understanding of its seismic behavior. Together, these processes provide a comprehensive view of the seismicity in the Red Sea region, laying the groundwork for further exploration into its tectonic framework and potential seismic risks. The earthquake catalog, compiled from various seismic networks in the region, features different magnitude scales. To standardize these scales, we employed empirical equations formulated by [2,41]. These equations were instrumental in converting all magnitude recordings to the moment magnitude scale, ensuring uniformity and comparability across the data set.
To examine the spatial distribution of key seismicity parameters, including the magnitude of completeness (()) and the frequency-magnitude distribution (a- and b-values), the study area was segmented into multiple seismogenic zones. These zones were delineated based on the framework proposed by [42] in their seismic study. This division is critical for a detailed analysis of seismicity patterns, as it allows for a zone-specific assessment of seismic characteristics, enhancing our understanding of regional seismic behavior. The Red Sea area was partitioned into distinct seismic source zones for a focused analysis of seismicity. These zones include the Gulf of Suez, the Gulf of Aqaba, the Northern Red Sea, the Central Red Sea, and the Southern Red Sea Seismic Source Zones. This segmentation facilitates a detailed and region-specific study of seismic parameters, enabling a comprehensive understanding of the seismic behavior in each of these zones.
As a preliminary step to estimate the b-value, it is crucial to determine the magnitude of completeness (). This is the threshold above which all earthquakes in a region are detected and below which some smaller earthquakes might be missed. The magnitude of completeness is a crucial parameter in seismology as it signifies the lowest magnitude at which 100% of the events in a dataset are detected. In this study, the Maximum Curvature method (MAXC), delineated by [35], was utilized. The point of maximum curvature on the plot corresponds to the magnitude of completeness. Mathematically, this is where the second derivative of the earthquake frequency with respect to magnitude is at a maximum.
Figure 9 illustrates the values obtained for the entire area, including the Gulf of Suez (Figure 9b), the Gulf of Aqaba (Figure 9c), the Northern Red Sea (Figure 9d), the Central Red Sea (Figure 9e), and the Southern Red Sea (Figure 9f). The variation in the magnitude of completeness () across different regions suggests differences in seismic network sensitivity, seismicity rates, or both. The Gulf of Aqaba area has the lowest (), indicating that the seismic network in this region is able to detect and record very small earthquakes. This could be due to a dense network of high-quality seismometers or high seismic activity that allows for a better statistical representation of smaller events. In contrast, the Southern Red Sea area has the highest (), which suggests that only larger earthquakes are being reliably detected. This could be due to fewer or less sensitive instruments in the region, greater distances between the seismic sources and the detectors, or a lower seismicity rate, meaning that there are naturally fewer small magnitude earthquakes to detect.
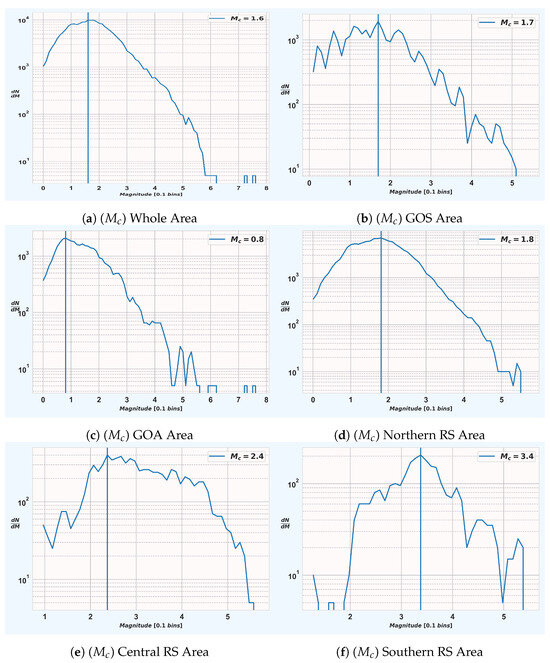
Figure 9.
Magnitude of completeness () of Seismic Activity in the Red Sea Spanning Various region.
The values in the other regions fall between the two extremes mentioned above. These values indicate a moderate level of detection capability, where the network is able to record earthquakes of small to moderate size. The comparative uniformity of values in these areas suggests a level of consistency in seismic detection capabilities and/or earthquake occurrence rates.
The b-value, a statistical parameter derived from the frequency-magnitude relationship delineated by [36], serves as a pivotal metric for characterizing seismic activity and offers significant insights into seismotectonic configurations and the potential seismic hazards within the Red Sea area. This parameter is extensively applied across various magnitude scales to assess seismic phenomena, particularly within the context of differing tectonic environments, stress heterogeneity, and anisotropic media. The spatial distribution of b-values, which ranges from low to high, correlates with the accumulation of stress, indicative of structural heterogeneities. These heterogeneities are often attributed to the presence of cracks with varying orientations. A high b-value is typically associated with seismicity dominated by smaller magnitude events, whereas a low b-value suggests a comparative prevalence of larger earthquakes relative to smaller ones, as elucidated by [38].
The distribution of b-values, as depicted in Figure 10, exhibits a considerable range of variation, extending from 0.55 to 0.93. This variation in b-value patterns, indicative of zones alternately characterized by low and high b-values, suggests an influence stemming either from heterogeneity in the stress field or from variations in material properties. Notably, the Gulf of Aqaba and the Gulf of Suez regions are marked by lower b-values, in stark contrast to the remaining areas of the Northern Red Sea region, which display a dynamic range of b-values, alternating between low and high. The lower b-values identified in the Gulf of Aqaba, the Gulf of Suez, and the northern part of the Red Sea are in alignment with the b-value estimations previously reported by [8,43,44]. The observed variations in the b-value are predominantly influenced by a constellation of geological and geophysical factors, including the nature of tectonic settings, crustal heterogeneity, variations in pore fluid pressures, and the prevailing stress state within the Earth’s crust [38]. Conversely, the a-values, ranging from 3.97 to 5.5 as shown in Figure 10, denote the level of seismic activity. These values vary based on several critical factors: the size of the deformation area, the time span considered, the frequency of seismic events, and the observed magnitude ranges.
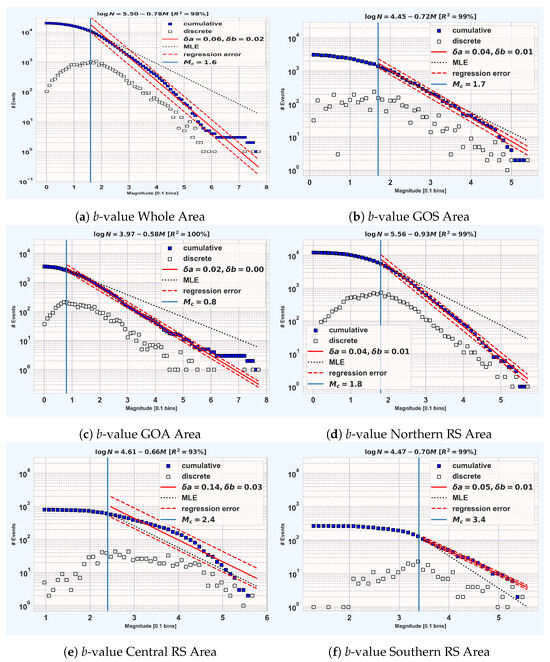
Figure 10.
Frequency-magnitude distribution (b-value) of Seismic Activity in the Red Sea Spanning Various region.
6. Conclusions
The comprehensive analysis of seismic activities in the Red Sea region, focusing on the interaction between the African and Arabian tectonic plates, underscores the criticality of accurate earthquake parameter estimation. Discrepancies in earthquake data, notably in aspects such as location, depth, and magnitude, are highlighted, underscoring the necessity for a more critical examination of reported information. The diversity in data collection methods, compounded by the uneven distribution of seismic networks, significantly affects the consistency and reliability of seismic data. Machine learning methodologies, particularly the Isolation Forest algorithm, were employed to examine the anomalous patterns of seismic activity in the region. This technique was instrumental in identifying and filtering out anomalous parameters, thereby improving the accuracy in the computation of seismicity parameters, including the magnitude of completeness (), a-value, and b-value. This study presents a comprehensive analysis of seismic parameters, particularly focusing on the distribution and implications of b-values and a-values in specific geographical regions. The observed variability in b-values, spanning a range from 0.55 to 0.93, elucidates the complex nature of seismic activity and highlights the significant influence of geological and geophysical factors such as stress field heterogeneity, material property variations, and crustal characteristics. Particularly, the lower b-values in the Gulf of Aqaba and the Gulf of Suez, as compared to the fluctuating patterns observed in the broader Northern Red Sea region, align with prior research, underscoring the consistency and reliability of these findings. Moreover, the study’s insights into the a-values, which range from 3.97 to 5.5, offer a nuanced understanding of seismic activity levels. These values are shaped by factors including the extent of deformation areas, the duration of the observational period, and the range and frequency of seismic events. The alignment of these findings with earlier studies not only reinforces their validity but also contributes to a deeper understanding of seismic risk assessment in these regions. Future research should aim to further explore the intricate relationships between these seismic parameters and their environmental and geological contexts, thereby enhancing our capability to predict and mitigate seismic hazards effectively.
Author Contributions
Conceptualization, methodology, software development, validation, data collection, analysis, and writing: S.S.R.M. Conceptualization, review, and editing: M.H.Y. and M.M. Data collection, Analysis A.M.F. and B.E. All authors have read and agreed to the published version of the manuscript.
Funding
The authors would like to thank the Research Supporting Project number (RSP2024R89), King Saud University, Riyadh, Saudi Arabia for funding this work.
Institutional Review Board Statement
Not applicable.
Informed Consent Statement
Not applicable.
Data Availability Statement
The data presented in this study are available upon reasonable request from the first author.
Acknowledgments
The authors would like to express their sincere gratitude to the Egyptian National Seismic Network (ENSN) at the National Research Institute of Astronomy and Geophysics (NRIAG) for their invaluable assistance with this research. The authors would like to thank the Research Supporting Project number (RSP2024R89), King Saud University, Riyadh, Saudi Arabia for funding this work.
Conflicts of Interest
The authors declare no conflict of interest.
References
- Kowsari, M.; Eftekhari, N.; Kijko, A.; Yousefi Dadras, E.; Ghazi, H.; Shabani, E. Quantifying seismicity parameter uncertainties and their effects on probabilistic seismic hazard analysis: A case study of Iran. Pure Appl. Geophys. 2019, 176, 1487–1502. [Google Scholar] [CrossRef]
- Moustafa, S.S.; Mohamed, G.E.A.; Metwaly, M. Production of a homogeneous seismic catalog based on machine learning for northeast Egypt. Open Geosci. 2021, 13, 1084–1104. [Google Scholar] [CrossRef]
- Bommer, J.J.; Douglas, J.; Scherbaum, F.; Cotton, F.; Bungum, H.; Fah, D. On the selection of ground-motion prediction equations for seismic hazard analysis. Seismol. Res. Lett. 2010, 81, 783–793. [Google Scholar] [CrossRef]
- Musson, R. On the Nature of Logic Trees in Probabilistic Seismic Hazard Assessment. Earthq. Spectra 2012, 28, 1291–1296. [Google Scholar] [CrossRef]
- Pedone, R.; Lombardo, P.; Diamantidis, D. Seismotectonic regionalization of the Red Sea area and its application to seismic risk analysis. Nat. Hazards 1992, 5, 233–247. [Google Scholar] [CrossRef]
- Soliman, M.S.; Zahran, H.M.; Elhadidy, S.Y.; Alraddadi, W.W. Evaluation of Saudi National Seismic Network (SNSN) detectability. Arab. J. Geosci. 2019, 12, 330. [Google Scholar] [CrossRef]
- Hussein, H.; Elenean, K.A.; Marzouk, I.; Peresan, A.; Korrat, I.; El-Nader, E.A.; Panza, G.; El-Gabry, M. Integration and magnitude homogenization of the Egyptian earthquake catalogue. Nat. Hazards 2008, 47, 525–546. [Google Scholar] [CrossRef]
- Al-Amri, A.; Punsalan, B.; Uy, E. Spatial distribution of the seismicity parameters in the Red Sea regions. J. Asian Earth Sci. 1998, 16, 557–563. [Google Scholar] [CrossRef]
- Al-Ahmadi, K.; Al-Amri, A.; See, L. A spatial statistical analysis of the occurrence of earthquakes along the Red Sea floor spreading: Clusters of seismicity. Arab. J. Geosci. 2014, 7, 2893–2904. [Google Scholar] [CrossRef]
- Wiemer, S. A software package to analyze seismicity: ZMAP. Seismol. Res. Lett. 2001, 72, 373–382. [Google Scholar] [CrossRef]
- Liu, F.T.; Ting, K.M.; Zhou, Z.H. Isolation forest. In Proceedings of the 2008 Eighth IEEE International Conference on Data Mining, Pisa, Italy, 15–19 December 2008; pp. 413–422. [Google Scholar]
- Mensi, A.; Bicego, M. Enhanced anomaly scores for isolation forests. Pattern Recognit. 2021, 120, 108115. [Google Scholar] [CrossRef]
- Asim, K.M.; Moustafa, S.S.; Niaz, I.A.; Elawadi, E.A.; Iqbal, T.; Martínez-Álvarez, F. Seismicity analysis and machine learning models for short-term low magnitude seismic activity predictions in Cyprus. Soil Dyn. Earthq. Eng. 2020, 130, 105932. [Google Scholar] [CrossRef]
- Qaedi, K.; Abdullah, M.; Yusof, K.A.; Hayakawa, M. Feasibility of Principal Component Analysis for Multi-Class Earthquake Prediction Machine Learning Model Utilizing Geomagnetic Field Data. Geosciences 2024, 14, 121. [Google Scholar] [CrossRef]
- Abdalzaher, M.S.; Moustafa, S.S.; Yassien, M. Development of smoothed seismicity models for seismic hazard assessment in the Red Sea region. Nat. Hazards 2024, 1–30. [Google Scholar] [CrossRef]
- Ghaffarian, S.; Taghikhah, F.R.; Maier, H.R. Explainable artificial intelligence in disaster risk management: Achievements and prospective futures. Int. J. Disaster Risk Reduct. 2023, 98, 104123. [Google Scholar] [CrossRef]
- Moustafa, S.S.; Abdalzaher, M.S.; Abdelhafiez, H. Seismo-Lineaments in Egypt: Analysis and Implications for Active Tectonic Structures and Earthquake Magnitudes. Remote Sens. 2022, 14, 6151. [Google Scholar] [CrossRef]
- Abdalzaher, M.S.; El-Hadidy, M.; Gaber, H.; Badawy, A. Seismic hazard maps of Egypt based on spatially smoothed seismicity model and recent seismotectonic models. J. Afr. Earth Sci. 2020, 170, 103894. [Google Scholar] [CrossRef]
- Wu, X.; Huang, S.; Xiao, Z.; Wang, Y. Building precise local submarine earthquake catalogs via a deep-learning-empowered workflow and its application to the challenger deep. Front. Earth Sci. 2022, 10, 817551. [Google Scholar] [CrossRef]
- Moustafa, S.S.; SN Al-Arifi, N.; Jafri, M.K.; Naeem, M.; Alawadi, E.A.; A Metwaly, M. First level seismic microzonation map of Al-Madinah province, western Saudi Arabia using the geographic information system approach. Environ. Earth Sci. 2016, 75, 251. [Google Scholar] [CrossRef]
- Ruggieri, S.; Calò, M.; Cardellicchio, A.; Uva, G. Analytical-mechanical based framework for seismic overall fragility analysis of existing RC buildings in town compartments. Bull. Earthq. Eng. 2022, 20, 8179–8216. [Google Scholar] [CrossRef]
- Chieffo, N.; Fasan, M.; Romanelli, F.; Formisano, A.; Mochi, G. Physics-based ground motion simulations for the prediction of the seismic vulnerability of masonry building compounds in Mirandola (Italy). Buildings 2021, 11, 667. [Google Scholar] [CrossRef]
- Stepinac, M.; Gašparović, M. A review of emerging technologies for an assessment of safety and seismic vulnerability and damage detection of existing masonry structures. Appl. Sci. 2020, 10, 5060. [Google Scholar] [CrossRef]
- Rinaldin, G.; Fasan, M.; Noé, S.; Amadio, C. The influence of earthquake vertical component on the seismic response of masonry structures. Eng. Struct. 2019, 185, 184–193. [Google Scholar] [CrossRef]
- Moretić, A.; Chieffo, N.; Stepinac, M.; Lourenço, P.B. Vulnerability assessment of historical building aggregates in Zagreb: Implementation of a macroseismic approach. Bull. Earthq. Eng. 2023, 21, 2045–2065. [Google Scholar] [CrossRef]
- Bosworth, W.; Huchon, P.; McClay, K. The red sea and gulf of aden basins. J. Afr. Earth Sci. 2005, 43, 334–378. [Google Scholar] [CrossRef]
- Stern, R.J.; Johnson, P.R. Constraining the Opening of the Red Sea: Evidence from the Neoproterozoic Margins and Cenozoic Magmatism for a Volcanic Rifted Margin; Springer: New York, NY, USA, 2019; pp. 53–79. [Google Scholar]
- Mitchell, N.C.; Stewart, I.C. The modest seismicity of the northern Red Sea rift. Geophys. J. Int. 2018, 214, 1507–1523. [Google Scholar] [CrossRef]
- Ruch, J.; Keir, D.; Passarelli, L.; Di Giacomo, D.; Ogubazghi, G.; Jonsson, S. Revealing 60 years of earthquake swarms in the southern red sea, Afar and the Gulf of Aden. Front. Earth Sci. 2021, 9, 664673. [Google Scholar] [CrossRef]
- Amjadi, A.; Akashe, B.; Ariamanesh, M.; Pourkermani, M. The comparison of the divergent and convergent tectonic plates margins seismicity—The case study: Red Sea and Zagros. Contrib. Geophys. Geod. 2020, 50, 261–285. [Google Scholar] [CrossRef]
- Martínez, F.; Cochran, J.R. Geothermal measurements in the northern Red Sea: Implications for lithospheric thermal structure and mode of extension during continental rifting. J. Geophys. Res. Solid Earth 1989, 94, 12239–12265. [Google Scholar] [CrossRef]
- Al-Amri, A.; Punsalan, B.; Khalil, A.; Uy, E.; Center, S.S. Seismic hazard assessment of western Saudi Arabia and the Red Sea region. Bull. Inter. Inst. Seismol. Earth Eng. (IISEE) Jpn. Spec. Ed. 2003, 95–112. [Google Scholar]
- Stepp, J. Analysis of completeness of the earthquake sample in the Puget Sound area and its effect on statistical estimates of earthquake hazard. In Proceedings of the 1st International Conference on Microzonazion, Seattle, WA, USA, 30 June–7 July 1972; USDA: Washington, DC, USA, 1972; Volume 2, pp. 897–910. [Google Scholar]
- Smirnov, V. Earthquake catalogs: Evaluation of data completeness. J. Volcanol. Seismol. 1998, 19, 497–510. [Google Scholar]
- Wiemer, S.; Wyss, M. Minimum magnitude of completeness in earthquake catalogs: Examples from Alaska, the western United States, and Japan. Bull. Seismol. Soc. Am. 2000, 90, 859–869. [Google Scholar] [CrossRef]
- Gutenberg, B.; Richter, C.F. Frequency of earthquakes in California. Bull. Seismol. Soc. Am. 1944, 34, 185–188. [Google Scholar] [CrossRef]
- Scholz, C. The frequency-magnitude relation of microfracturing in rock and its relation to earthquakes. Bull. Seismol. Soc. Am. 1968, 58, 399–415. [Google Scholar] [CrossRef]
- Marzocchi, W.; Sandri, L. A review and new insights on the estimation of the b-value and its uncertainty. Ann. Geophys. 2003, 46, 3472. [Google Scholar]
- Al-Amri, M.S.; Al-Amri, A.M. Configuration of the seismographic networks in Saudi Arabia. Seismol. Res. Lett. 1999, 70, 322–331. [Google Scholar] [CrossRef]
- Endo, E.; Zahran, H.; Nofal, H.; Hadidy, S. The Saudi national seismic network. Seismol. Res. Lett. 2007, 78, 439–445. [Google Scholar] [CrossRef]
- Babiker, N.; Mula, A.; El-hadidy, S. A unified Mw-based earthquake catalogue and seismic source zones for the Red Sea region. J. Afr. Earth Sci. 2015, 109, 168–176. [Google Scholar] [CrossRef]
- Rehman, F.; El-Hady, S.M.; Atef, A.H.; Harbi, H.M. Seismic hazard assessment of Western Coastal Province of Saudi Arabia: Deterministic approach. Earthq. Sci. 2016, 29, 299–309. [Google Scholar] [CrossRef]
- El-Isa, Z.; Shanti, A.A. Seismicity and tectonics of the Red Sea and western Arabia. Geophys. J. Int. 1989, 97, 449–457. [Google Scholar] [CrossRef]
- Abdelfattah, A.K.; Jallouli, C.; Qaysi, S.; Al-Qadasi, B. Crustal Stress in the Northern Red Sea Region as Inferred from Seismic b-values, Seismic Moment Release, Focal Mechanisms, Gravity, Magnetic, and Heat Flow Data. Surv. Geophys. 2020, 41, 963–986. [Google Scholar] [CrossRef]
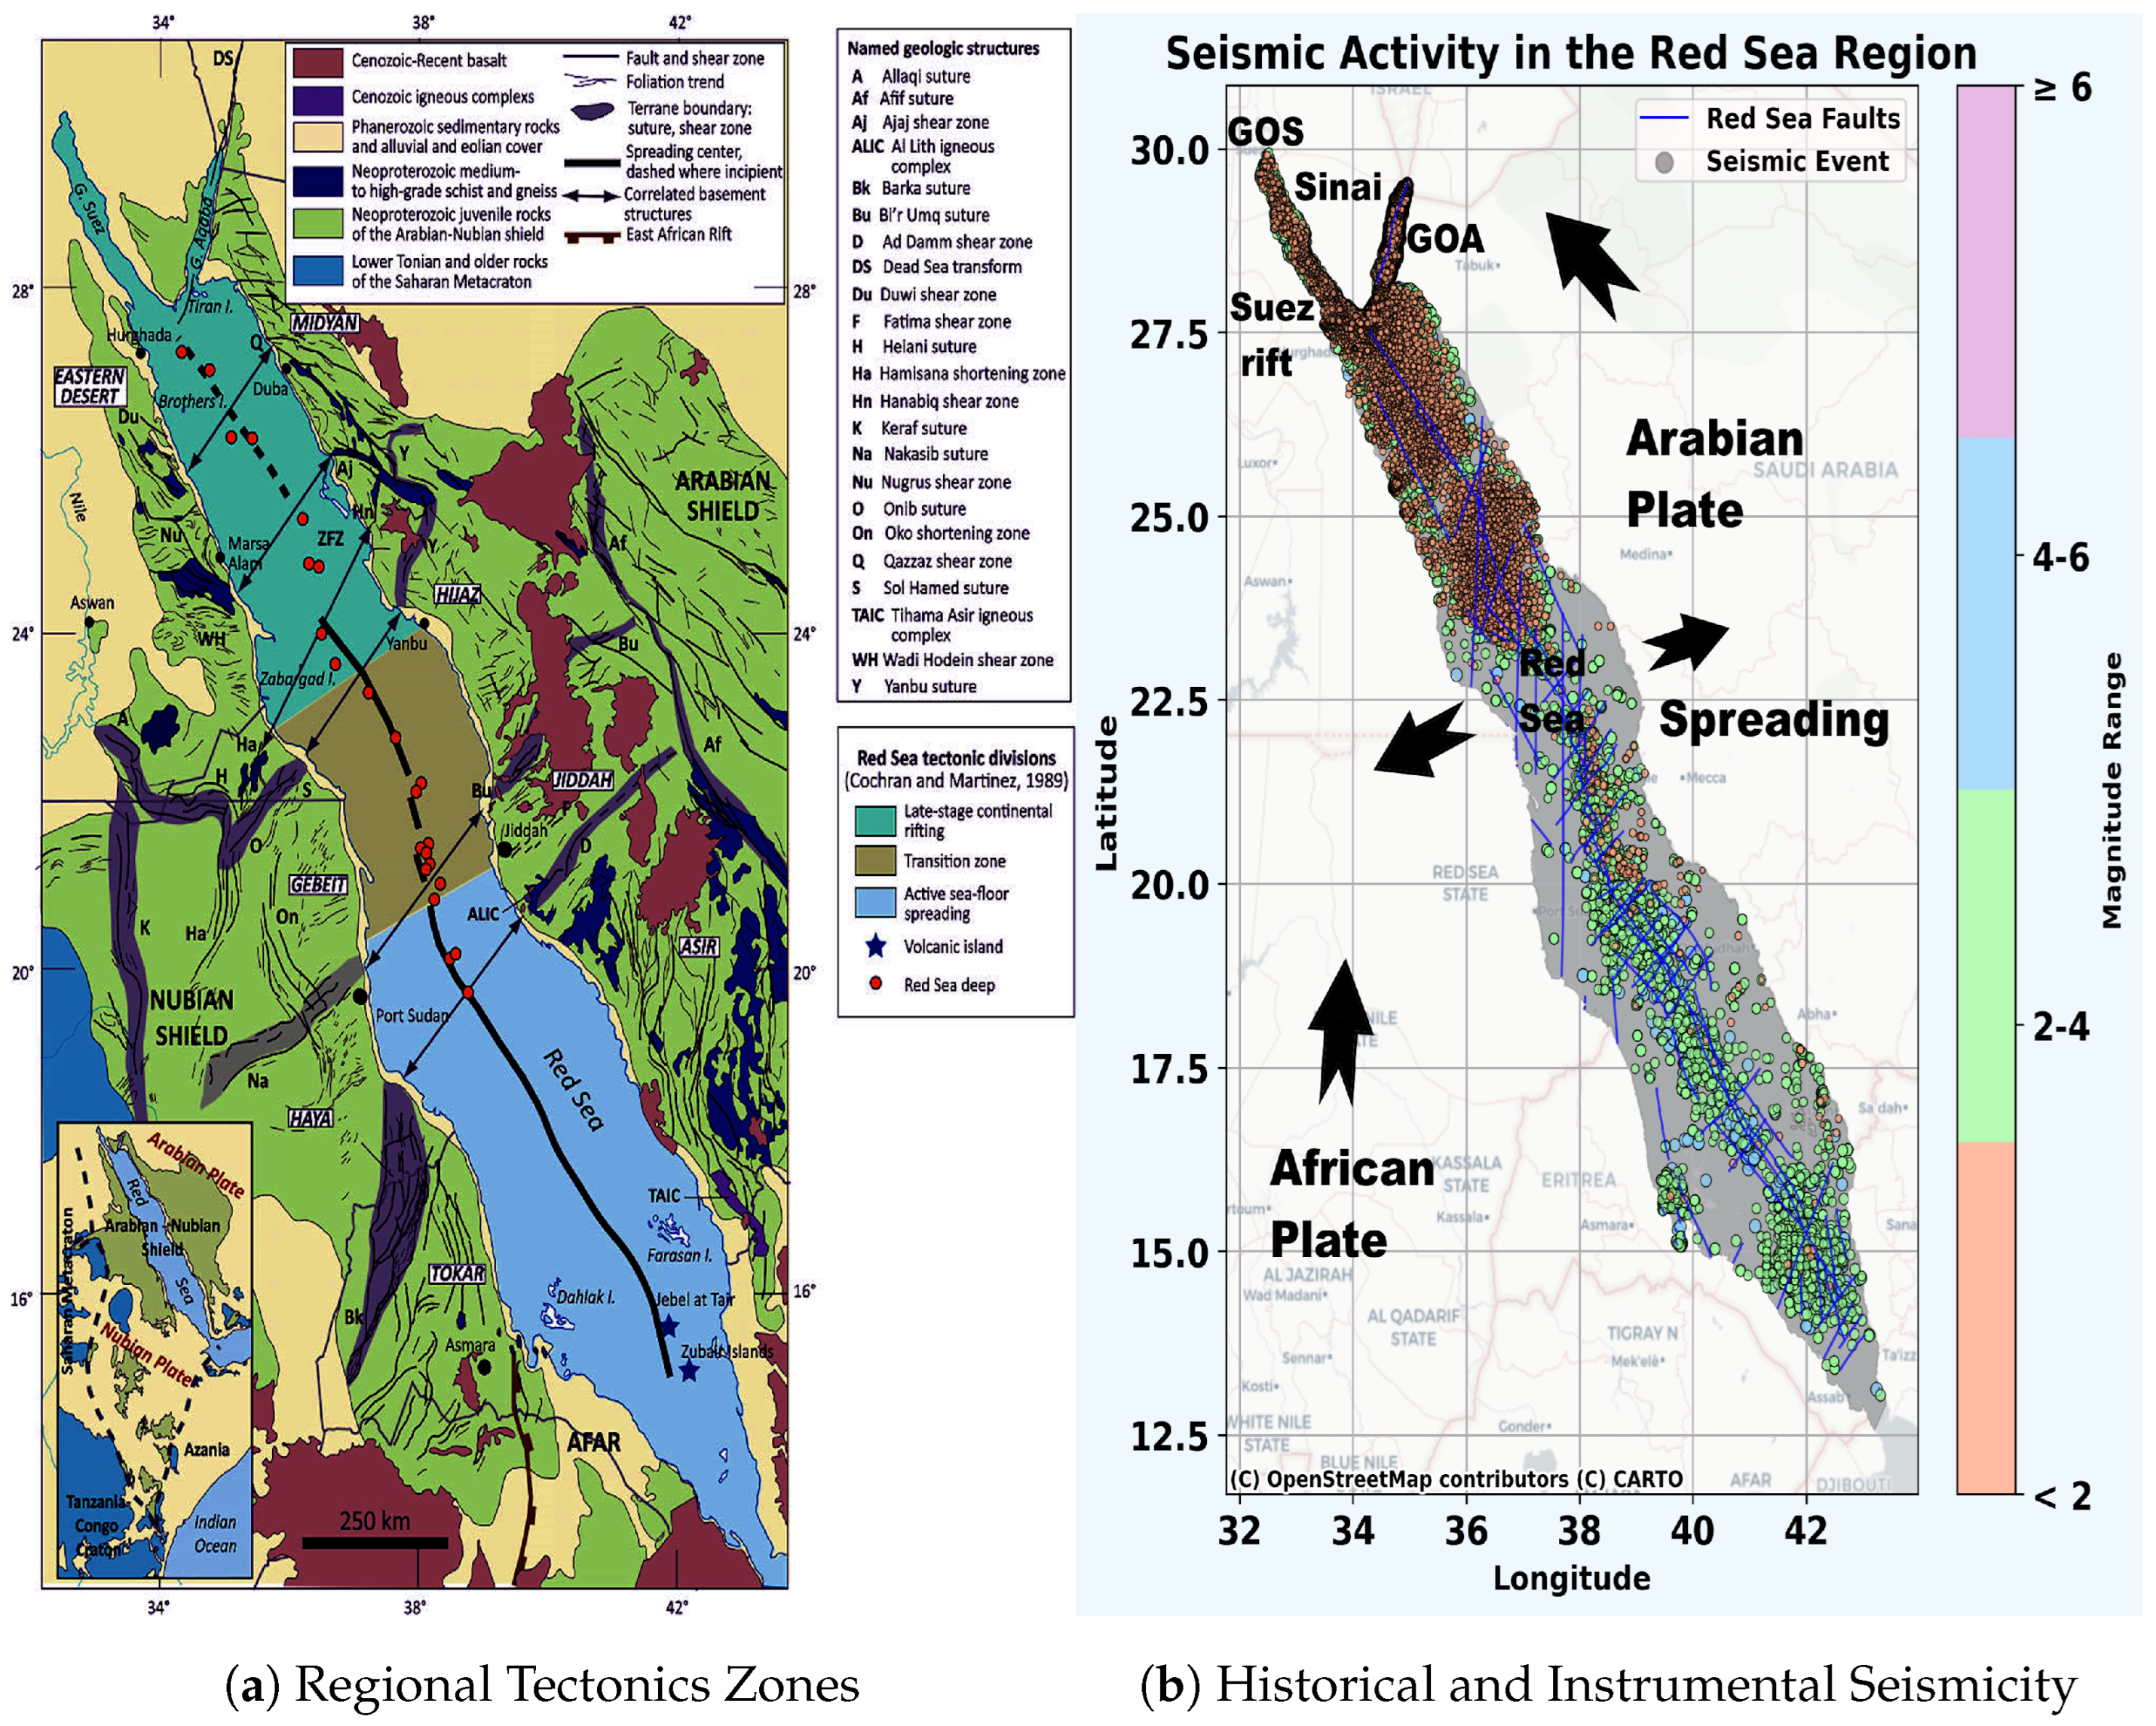
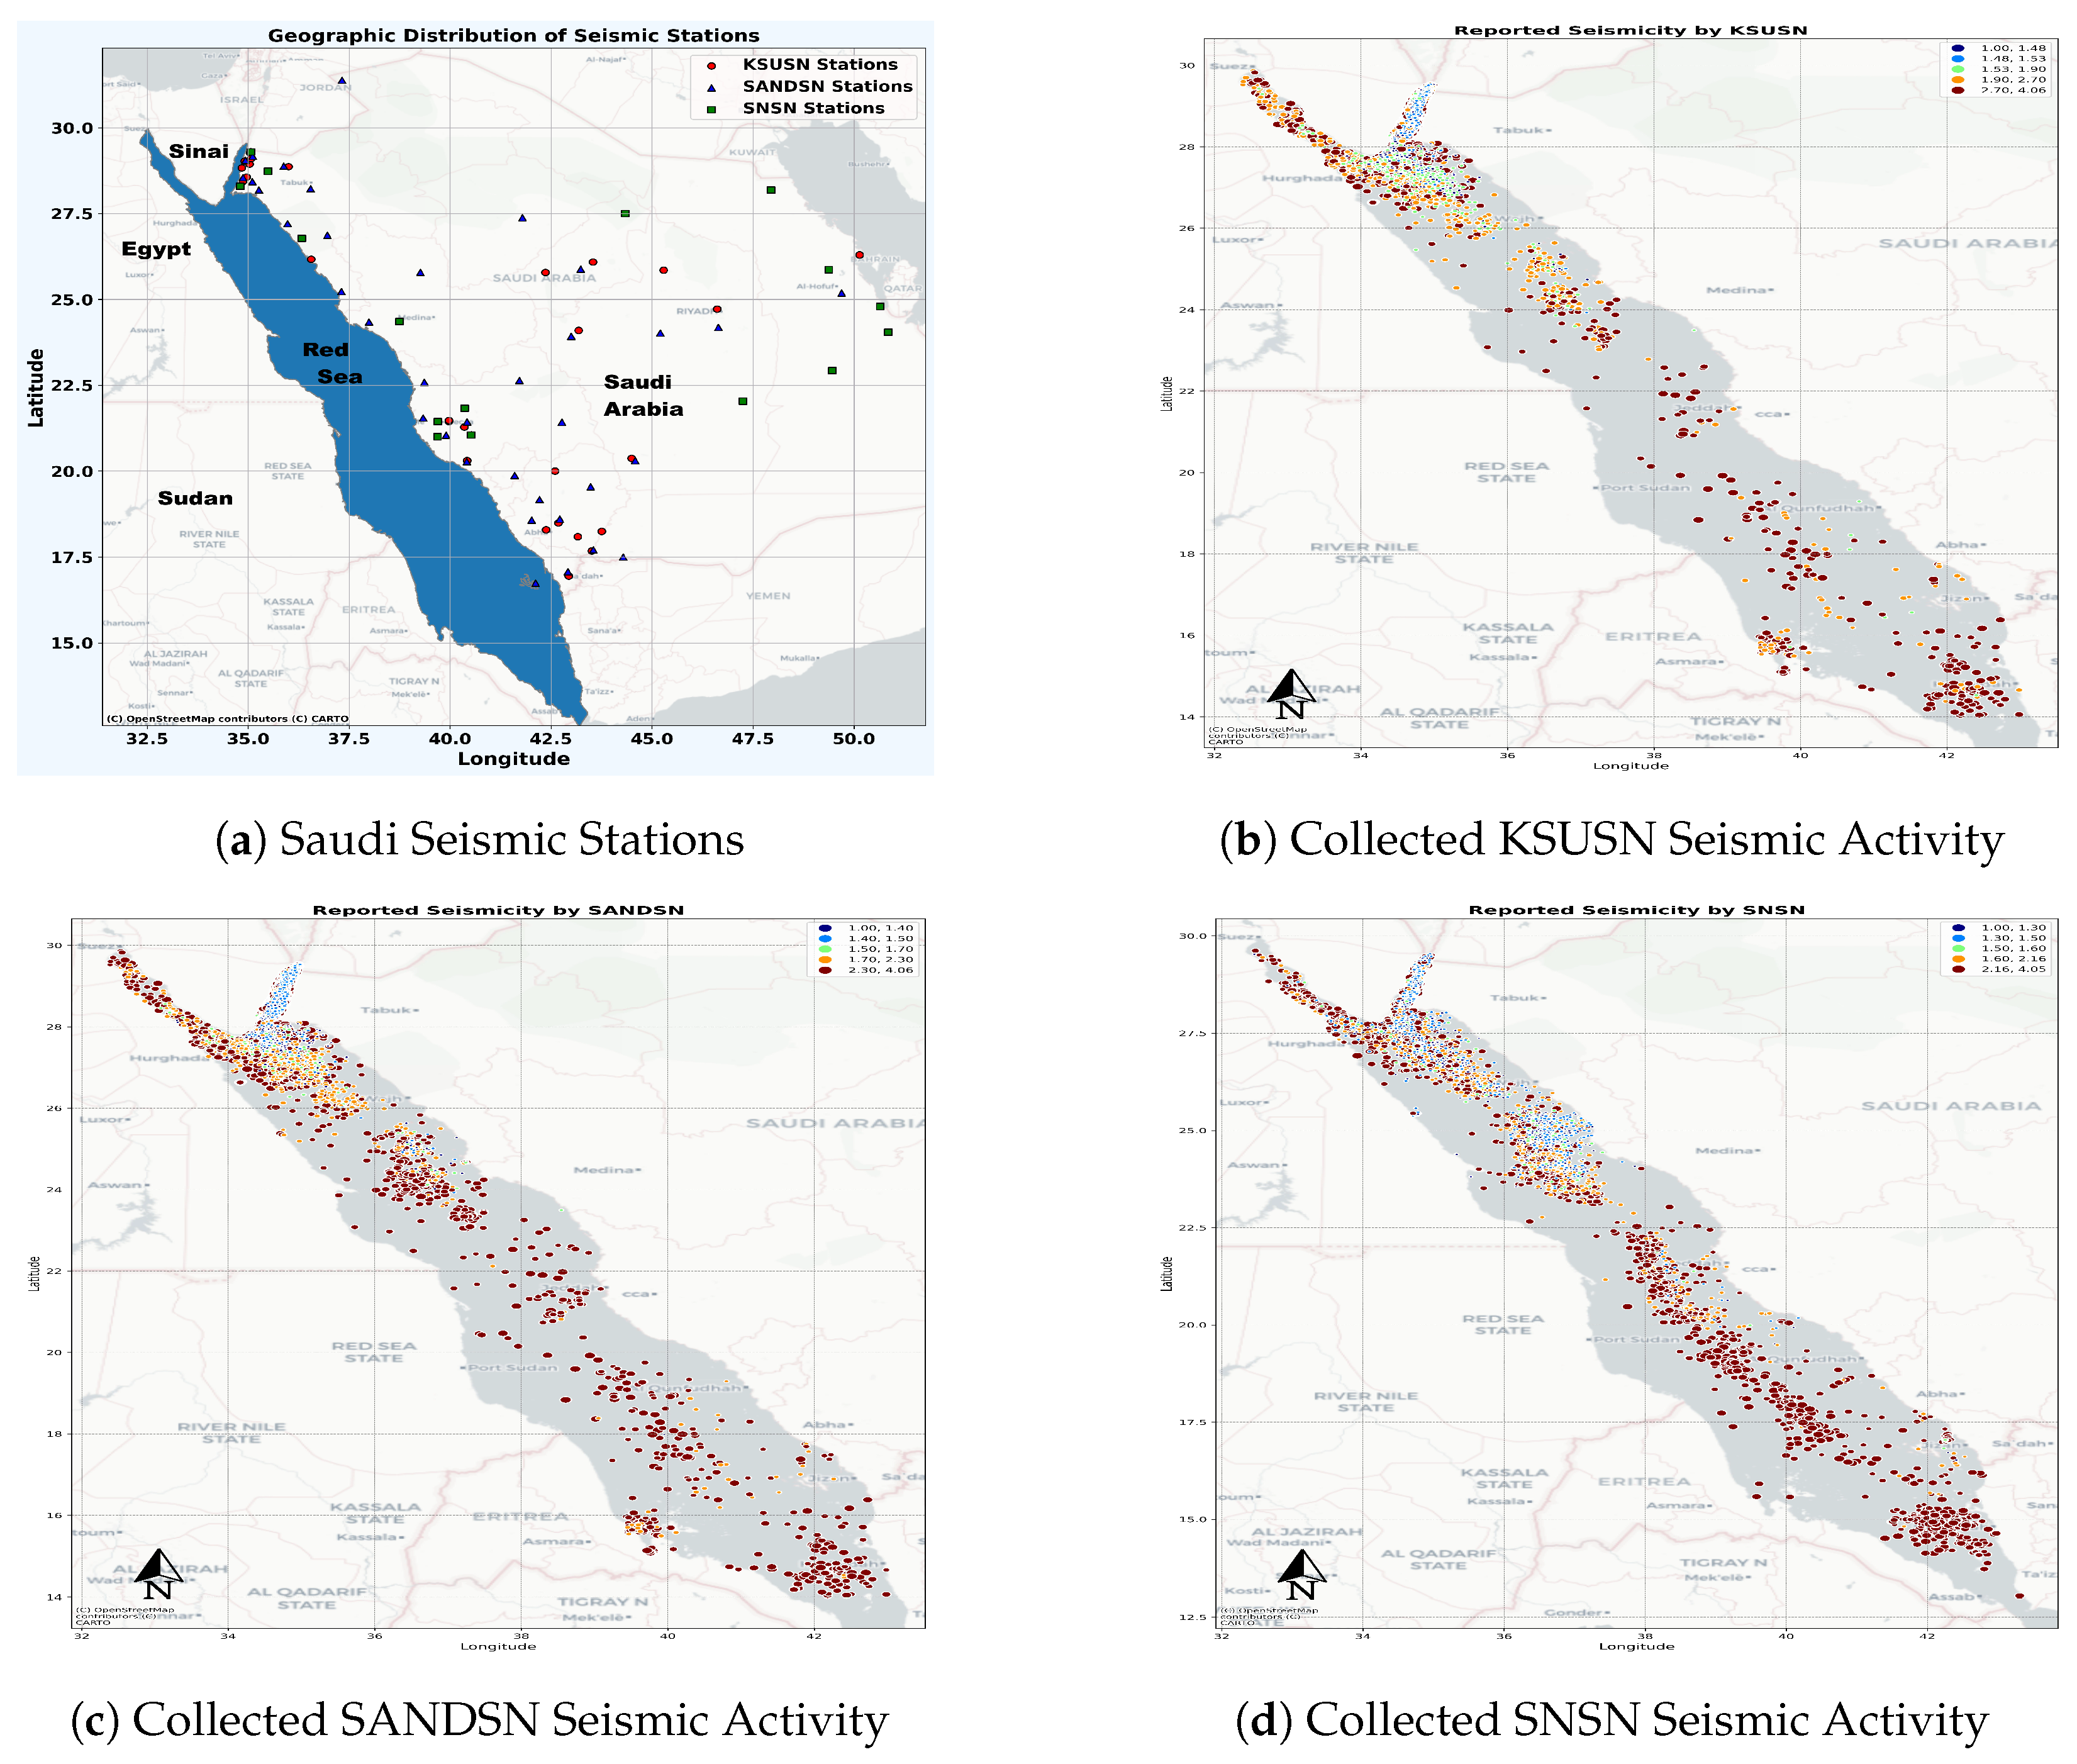
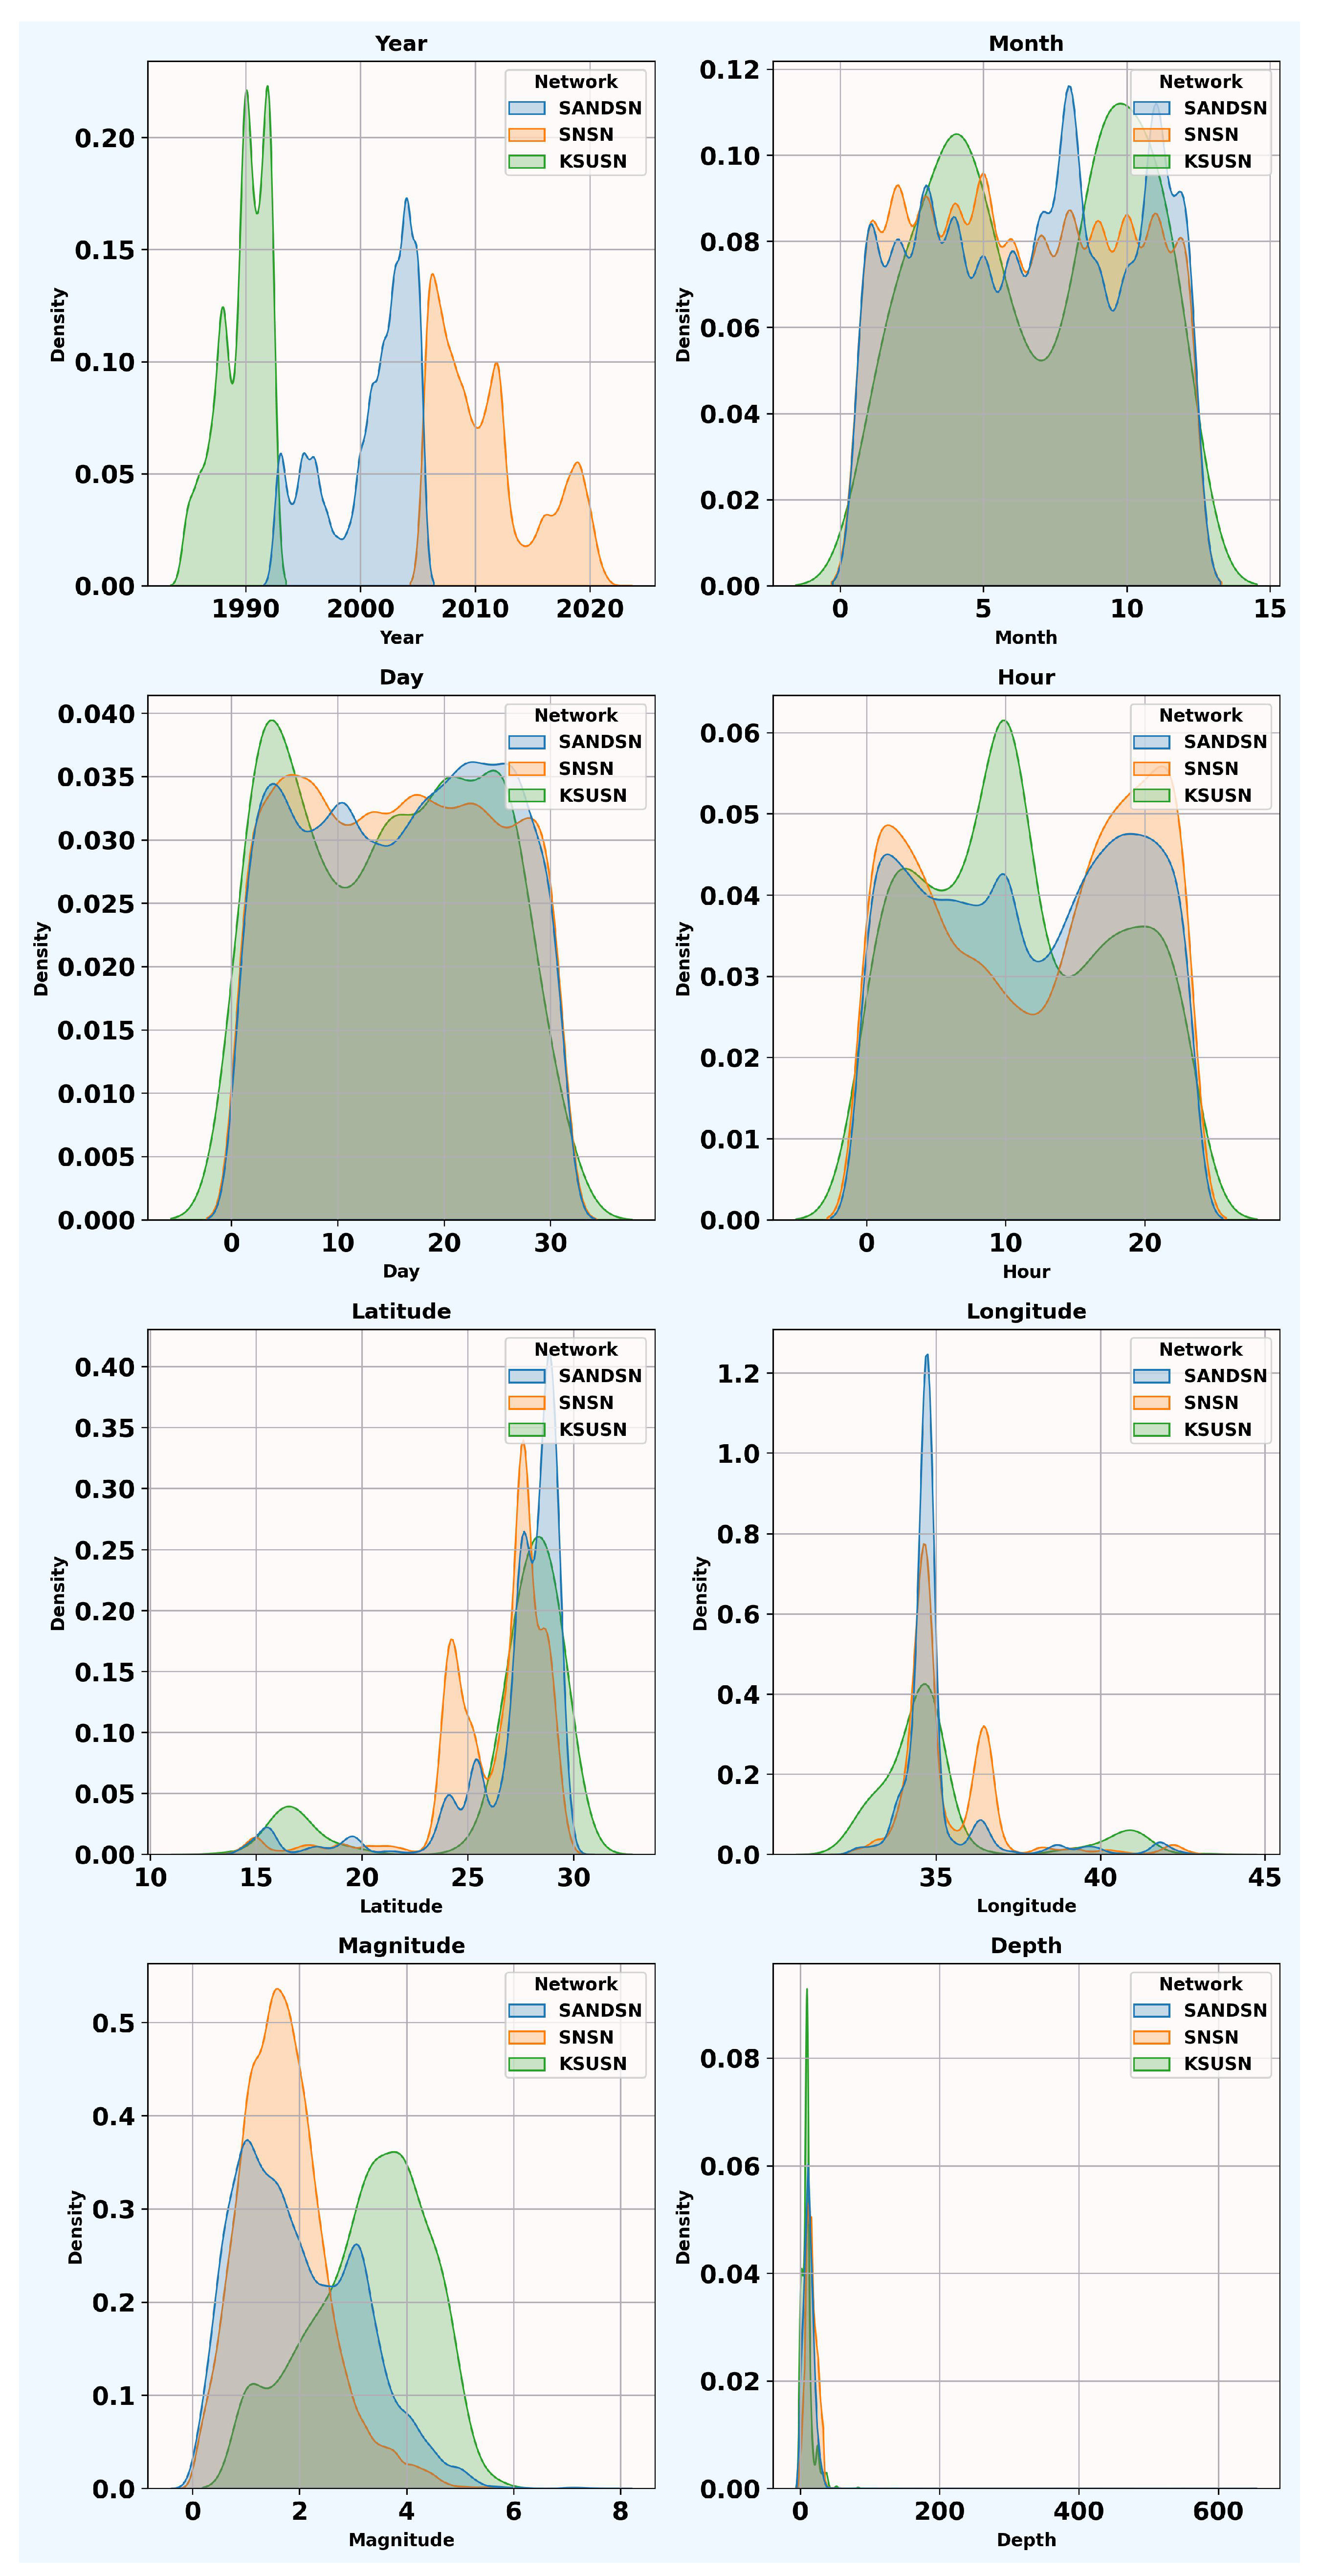
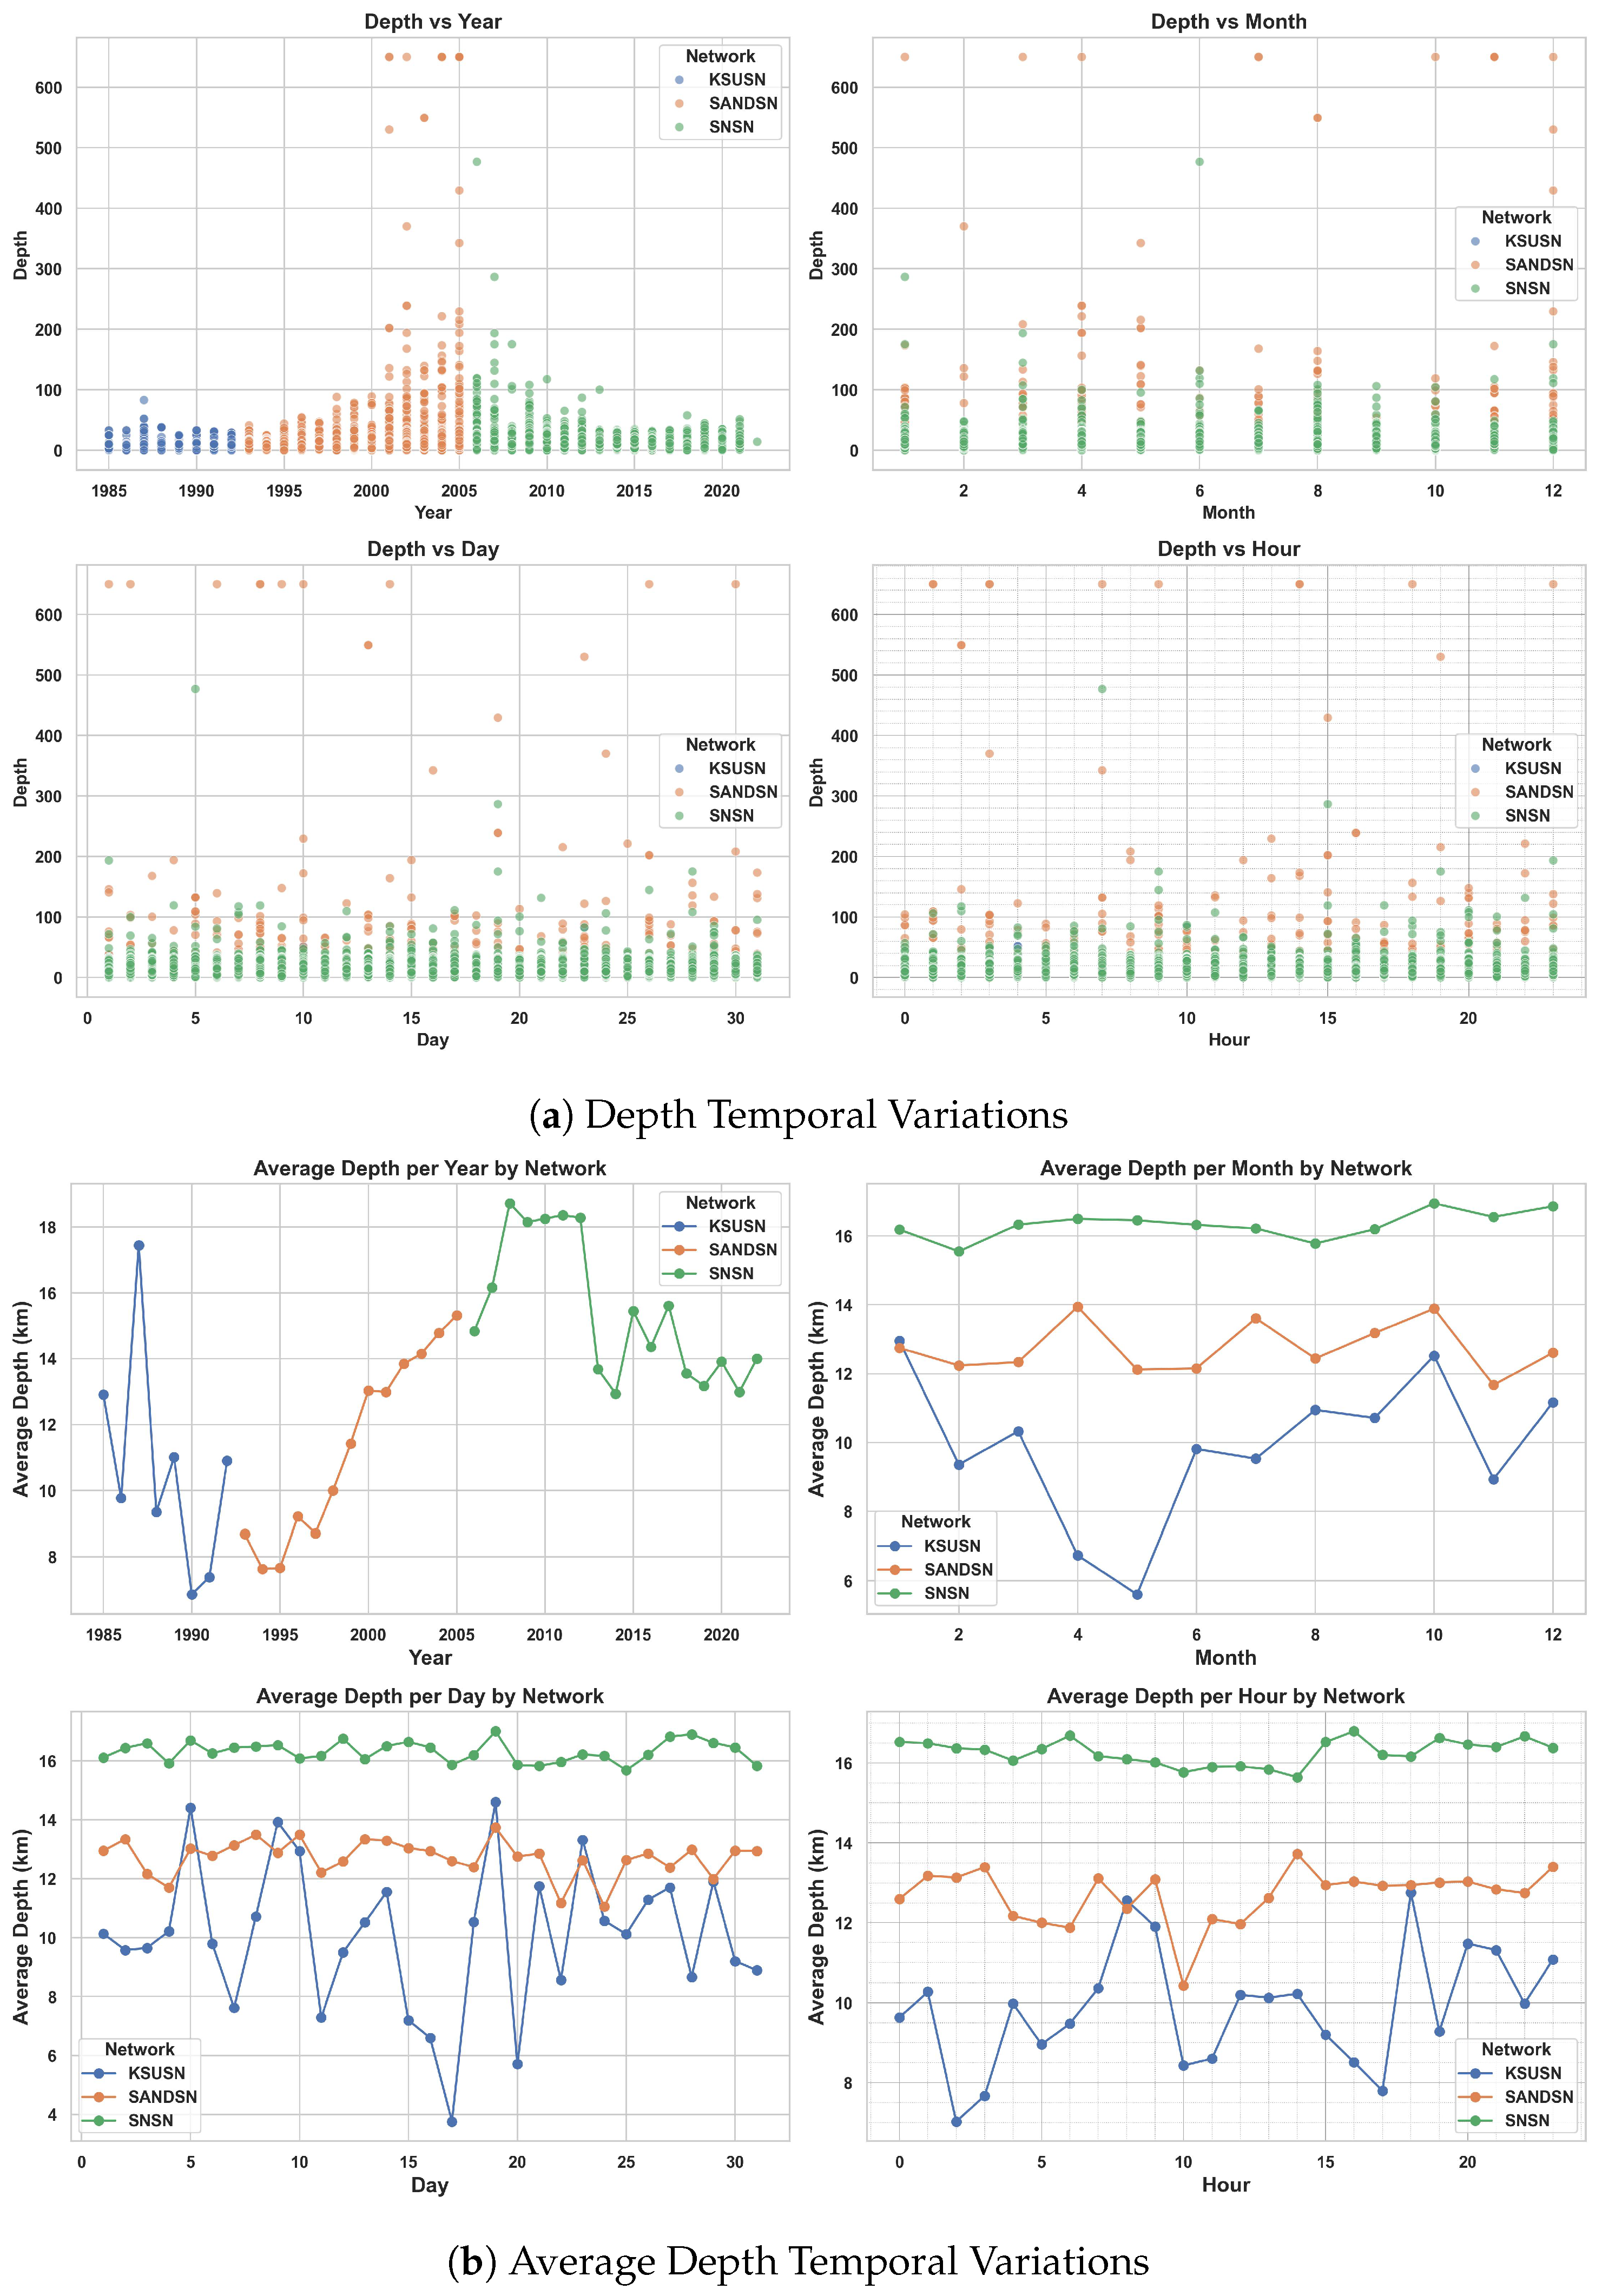


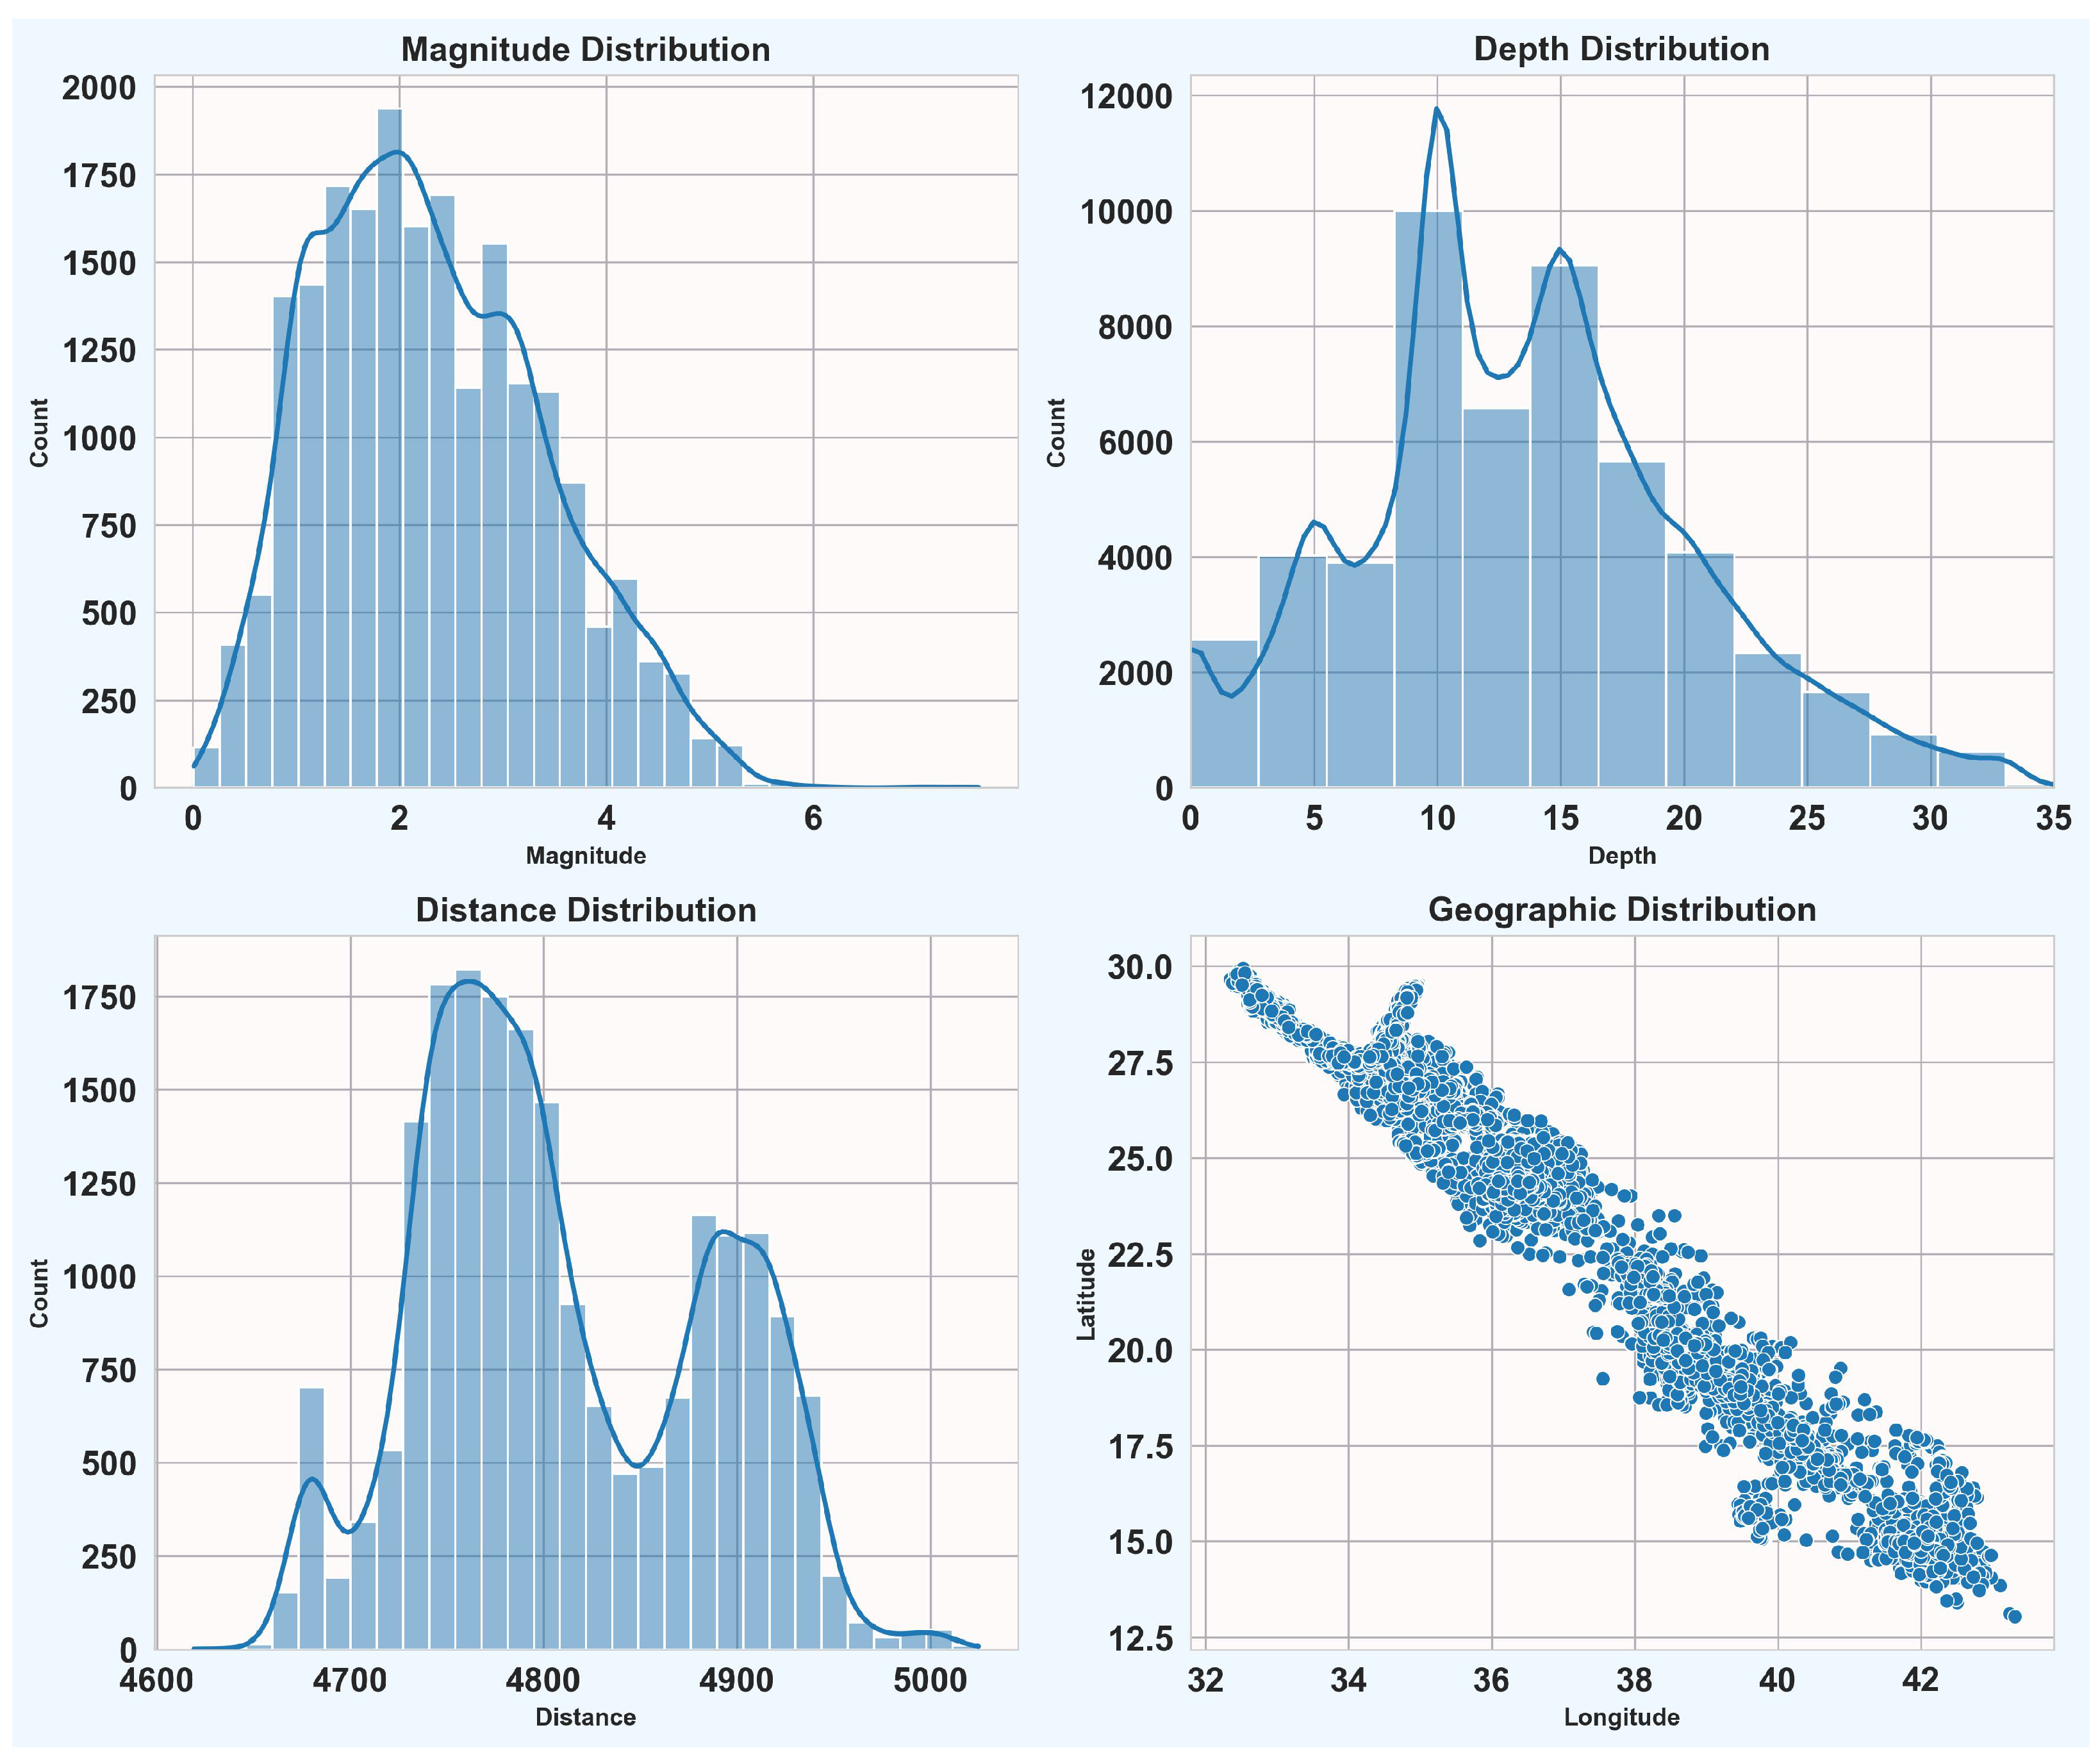
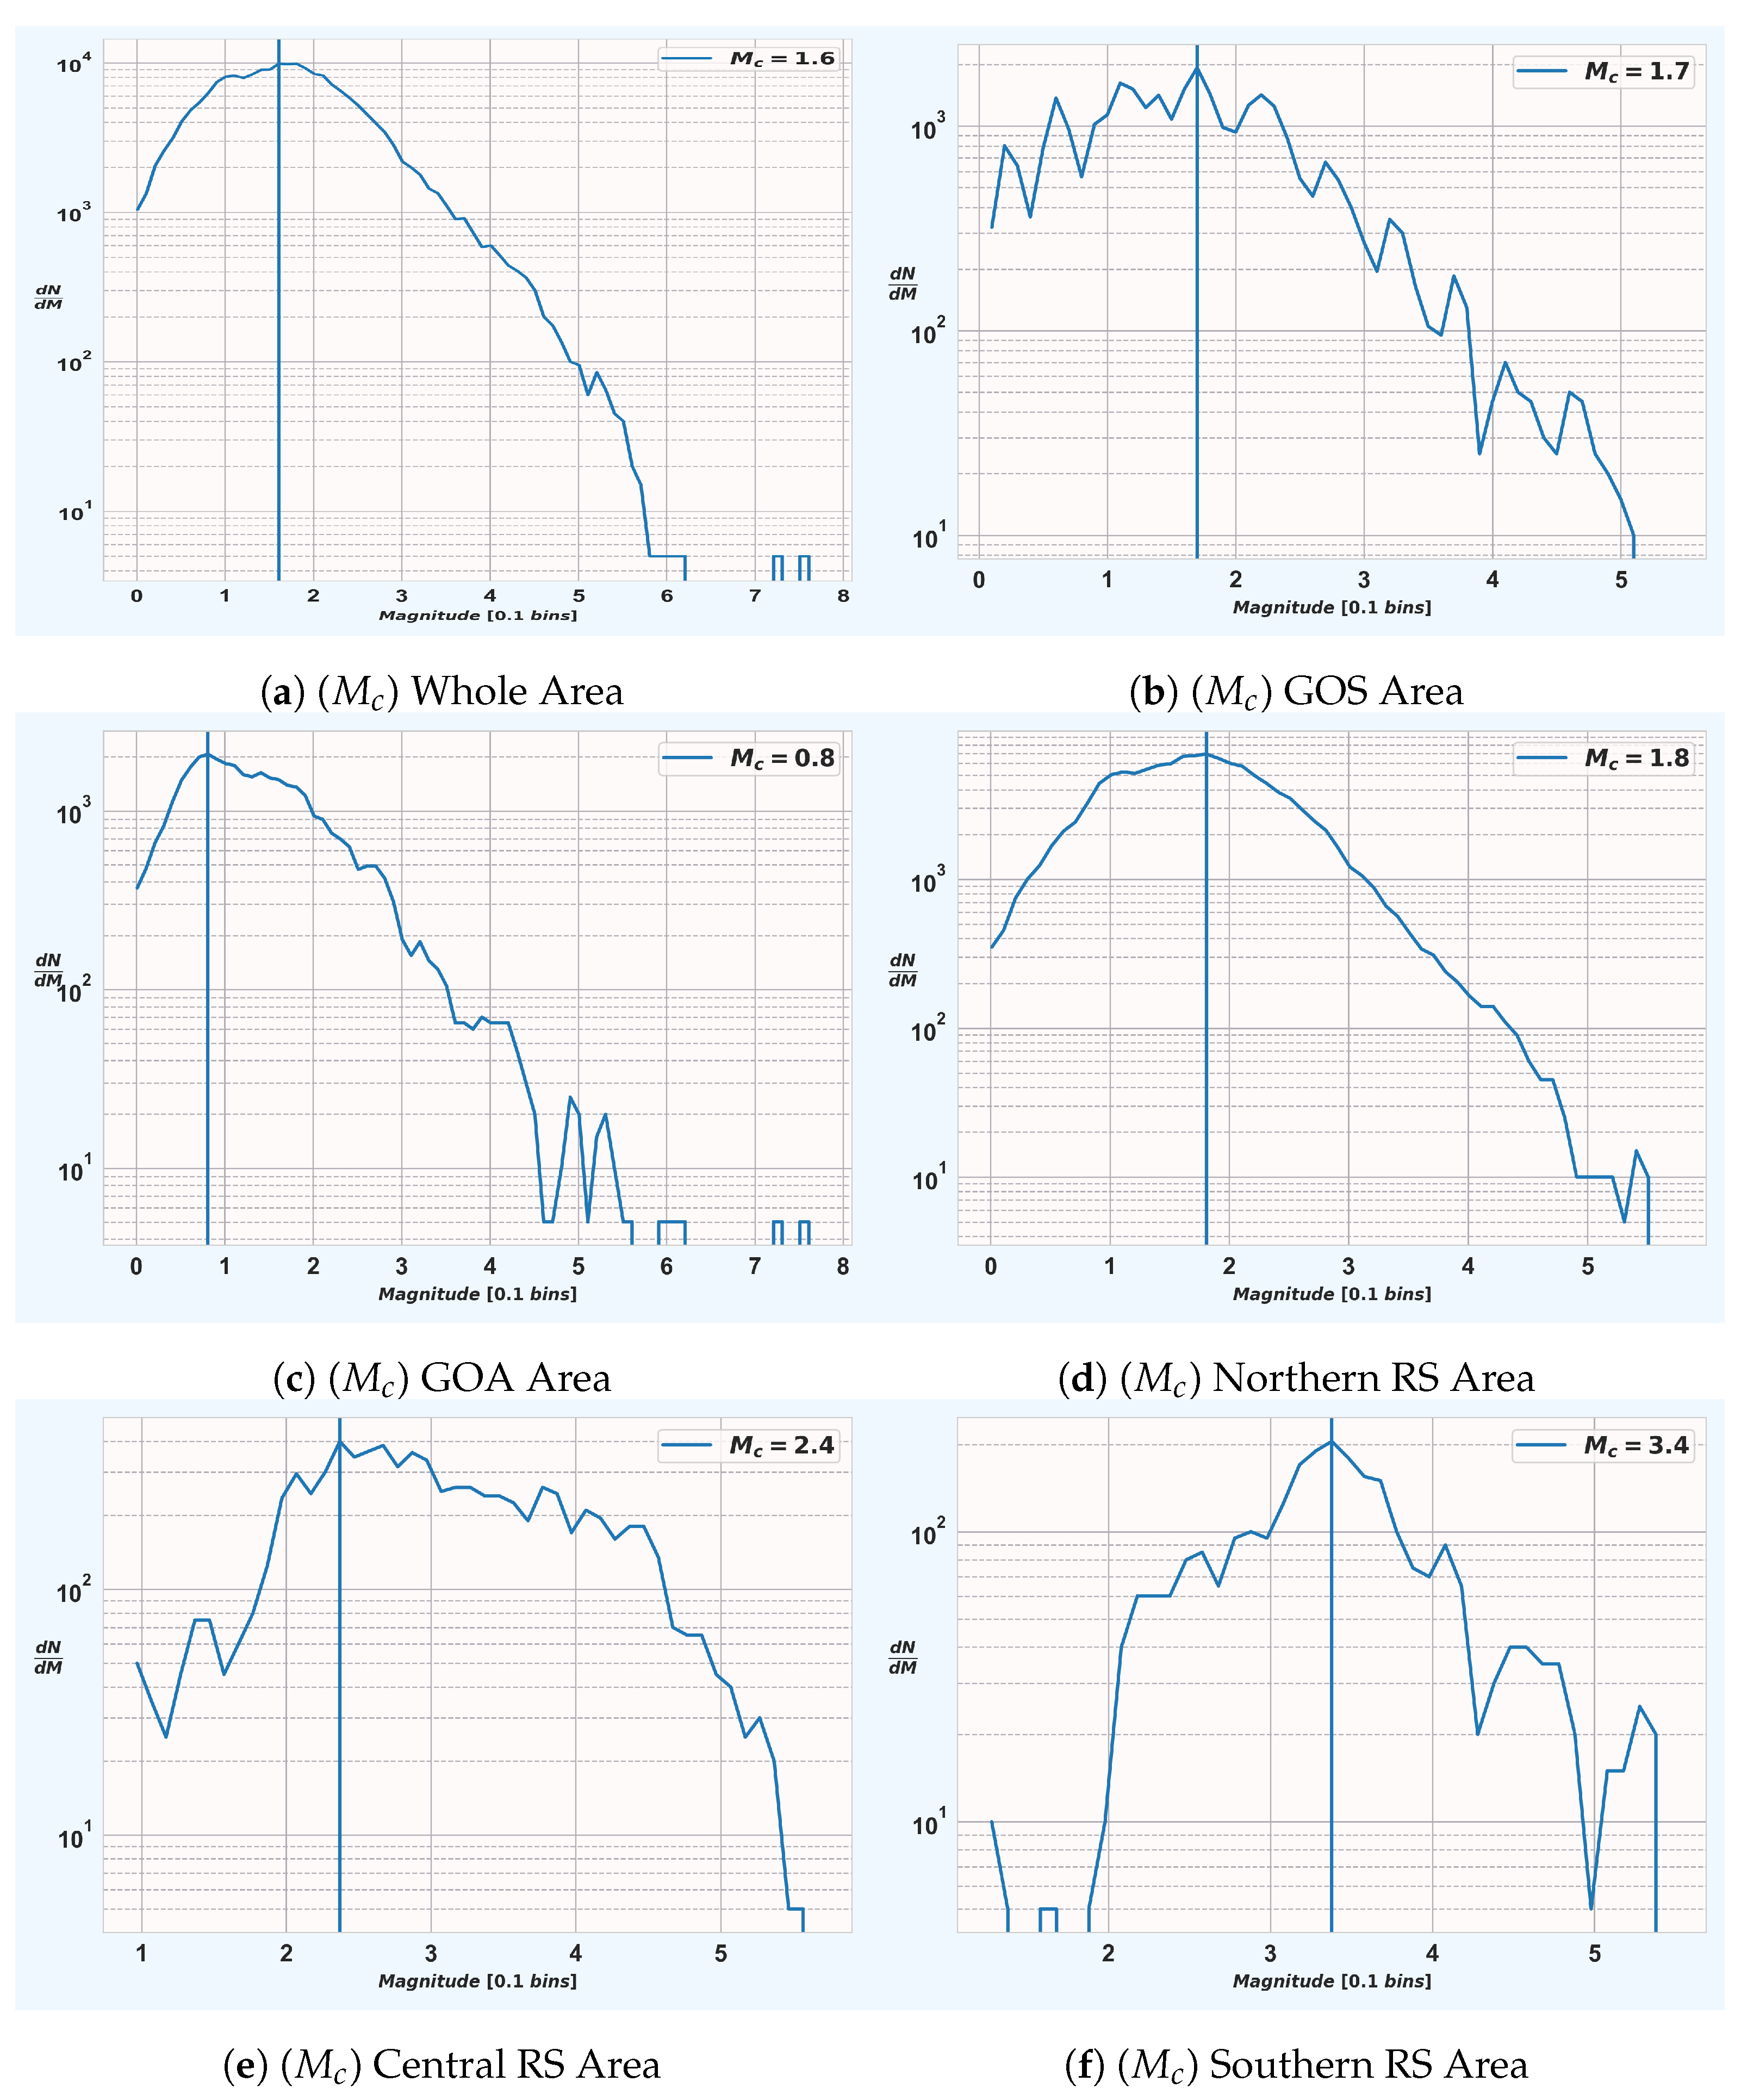
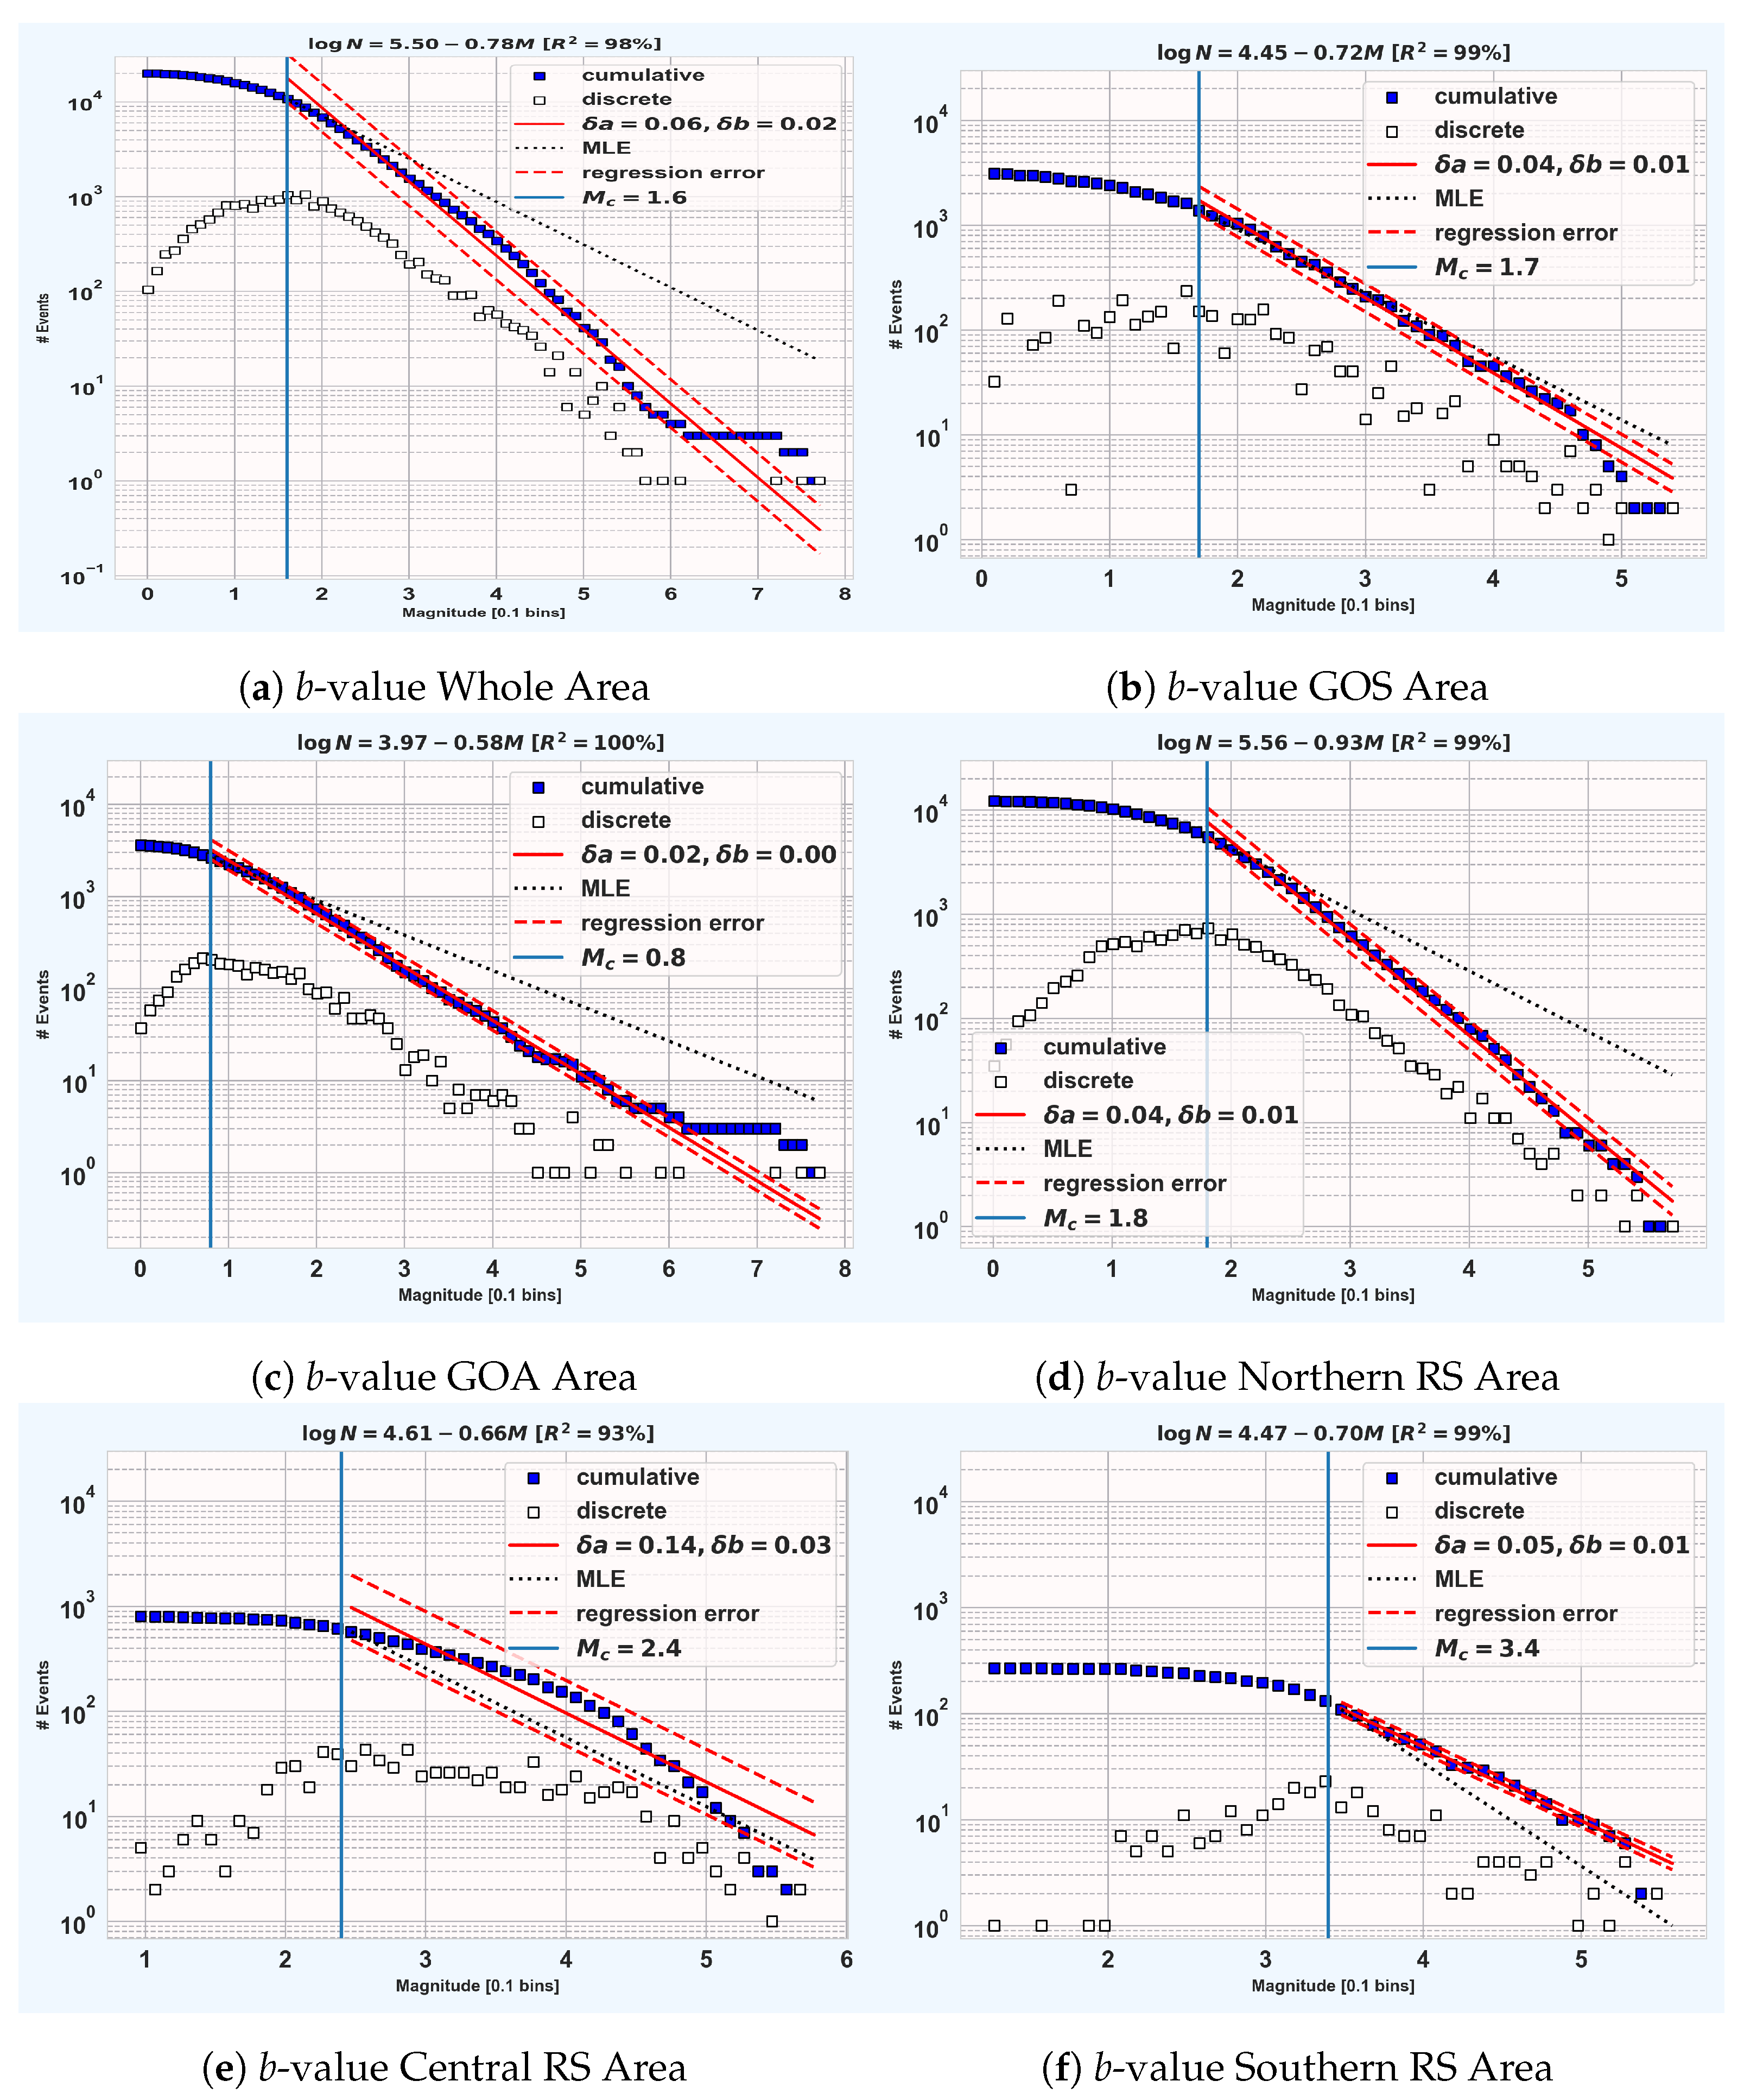
Disclaimer/Publisher’s Note: The statements, opinions and data contained in all publications are solely those of the individual author(s) and contributor(s) and not of MDPI and/or the editor(s). MDPI and/or the editor(s) disclaim responsibility for any injury to people or property resulting from any ideas, methods, instructions or products referred to in the content. |
© 2024 by the authors. Licensee MDPI, Basel, Switzerland. This article is an open access article distributed under the terms and conditions of the Creative Commons Attribution (CC BY) license (https://creativecommons.org/licenses/by/4.0/).