Article

Study on Thermal Radiation Characteristics and the Multi-Point Source Model of Hydrogen Jet Fire

by
Haiyang Zhang
1,
Xun Cao
1,
Xuhao Yuan
1,
Fengrong Wu
2,
Jing Wang
1,
Yankang Zhang
1,
Qianqian Li
1,*,
Hu Liu
1 and
Zuohua Huang
1
1
State Key Laboratory of Multiphase Flow in Power Engineering, Xi’an Jiaotong University, Xi’an 710049, China
2
China Petroleum Pipeline Engineering Corporation, Langfang 065000, China
*
Author to whom correspondence should be addressed.
Appl. Sci. 2024, 14(16), 7098; https://doi.org/10.3390/app14167098
Submission received: 3 July 2024 / Revised: 8 August 2024 / Accepted: 8 August 2024 / Published: 13 August 2024
(This article belongs to the Section Energy Science and Technology)

Abstract

:
Hydrogen safety remains a paramount concern in pipeline transportation. Once hydrogen leaks and ignites, it quickly escalates into a jet fire incident. The substantial thermal radiation released poses significant risks of fire and explosion. Therefore, studying the thermal radiation characteristics of hydrogen jet fires and developing accurate prediction models are crucial for establishing relevant safety standards. To address the oversimplified consideration of weighted coefficients in thermal radiation prediction models, this study investigated the thermal radiation characteristics of hydrogen jet fire by carrying out experiments and numerical simulations. The results reveal the significant impacts of the leakage diameter and pressure on thermal radiation. Increases in both the leakage diameter and pressure lead to a rapid escalation in the thermal radiation release, highlighting their critical importance in establishing safety standards for hydrogen pipeline transportation. Additionally, this study optimized the weight coefficients in the multi-point source prediction model based on temperature distribution along the flame axis. The optimized model was validated through comparison with experimental data. After optimization, the prediction error of the multi-point source radiation model was reduced from 19.5% to 13.9%. This model provides significant support for accurately evaluating the risk of hydrogen jet fire.

1. Introduction

Global climate change is a pressing issue that has garnered significant attention worldwide. Hydrogen energy, known for its high calorific value, cleanliness, pollution-free nature, widespread availability, and diverse utilization forms, is considered one of the most promising alternative energy sources for the future [1]. Several countries, including the United States and Europe, have elevated hydrogen energy to the level of national strategic planning, establishing initial industrial systems spanning from hydrogen production to utilization [2]. However, the density of hydrogen is only 0.089 g/L under standard conditions, making the development of efficient and safe storage and transportation technologies crucial for improving hydrogen energy utilization efficiency [3]. Currently, there are several methods for large-scale hydrogen transportation, including high-pressure tankers, liquid hydrogen transport, pipeline transport, etc. Compared with high-pressure tankers and liquid hydrogen transport, pipeline transport is an economical and efficient method, making it more suitable for long-distance scenarios. Various countries are developing hydrogen pipeline networks, with notable examples in the United States and parts of Europe. Currently, the US has constructed several thousand kilometers of hydrogen pipelines, with the longest network reaching 965 km [4].
However, hydrogen has certain hazardous properties. Under high pressure, hydrogen’s wide flammability limits, low ignition energy, and fast combustion rate can lead to large-scale fires and explosions following a leak [5]. Additionally, the “hydrogen embrittlement” effect in hydrogen pipelines increases the likelihood of leakage accidents. Hydrogen jet fires are a common and severely harmful type of disaster [6,7]. Upon leakage, hydrogen can form jet fires that produce continuous intense thermal radiation and can also motivate chain reactions, leading to secondary or even higher-level accidents [8]. Therefore, addressing the safety issues of hydrogen pipelines is of utmost importance. It is urgent and necessary to focus on the characteristics of jet fires formed by hydrogen pipeline leaks and the thermal radiation hazards they cause and to establish more comprehensive thermal radiation prediction models.
In recent years, many scholars have conducted a series of studies on the flame size and thermal radiation characteristics of hydrogen jet fires following leaks in medium- and high-pressure pipelines [9]. Regarding the size of hydrogen jet fires, the visible flame length is an important parameter closely related to the range and severity of thermal radiation. Delichatsios et al. [10] studied the transition characteristics of jet flames from buoyancy-dominated to momentum-dominated, introducing the dimensionless Froude number to describe the normalized flame length based on the nozzle diameter. Schefer et al. [11] redefined the Froude number and validated the flame length model across infrared, visible, and ultraviolet spectra. Subsequently, Schefer et al. [12] calculated nominal nozzle parameters using a virtual nozzle model, combining these with the flame length model to account for hydrogen’s non-ideal behavior at high pressures. Mogi et al. [13] conducted small-diameter hydrogen jet fire experiments, finding that the ratio of the flame width to length was approximately 0.18. Molkov et al. [14] analyzed extensive experimental data on hydrogen jet flame lengths, using new parameter groups to more accurately describe the dimensionless relationships of the flame length. Liu et al. [15] conducted an experimental study on the stability and size characteristics of hydrogen jet flames, finding that the stability and length of the jet flame are proportional to the fuel injection velocity. Gong et al. [16] measured hydrogen jet flame lengths under various leakage pressures and temperatures, discovering that the flame length and width increased with a higher release pressure and a lower release temperature.
Research on the thermal radiation characteristics of hydrogen jet fires has increasingly utilized numerical simulations with Computational Fluid Dynamics (CFD) software. Cirrone et al. [17,18] simulated hydrogen jet fires with leakage pressures of 0.5 MPa and temperatures of 48–82 K, comparing the simulated flame length and radiation heat flux data with experimental results, thus validating the accuracy of the CFD model. Additionally, Cirrone et al. [19] simulated 90 MPa high-pressure hydrogen jet flames using ANSYS Fluent, achieving good agreement with the experimental results of Prouts [20]. Choi et al. [21] used the FLACS program to analyze the hydrogen concentration, temperature, and thermal radiation distribution in confined spaces following high-pressure hydrogen leaks and ignitions. Mashhadimoslem et al. [22] compared the thermal radiation released by hydrogen and propane jet flames, finding that the axial radiation rate of hydrogen was 3.5 times lower than that of propane under similar conditions. Jang et al. [23] used CFD software to study large hydrogen jet fires under a leakage pressure of 16 MPa and a flow rate of 15.0 kg/s, finding that the thermal radiation could reach 100 kW/m2 even 70 m from the jet fire source, posing serious risks to humans and facilities. Panda et al. [24] conducted experimental studies on hydrogen thermal radiation release during low leakage and ambient temperature, finding that low-temperature hydrogen jet flames had a higher radiation heat flux density at certain mass flow rates compared with ambient-temperature jet flames.
The multi-point source thermal radiation model, based on the weighted distribution of heat sources, performs well in predicting near-field and far-field thermal radiation. This model, proposed by Hankinson et al. [25], uses a weighted superposition method based on the single-point source thermal radiation model. Baillie et al. [26] compared experimental data with predicted thermal radiation values under similar conditions, finding the model to have a good predictive performance. Kong et al. [27] optimized the heat source-weighted coefficients along the jet flame axis using an inversion method. The predicted values of the optimized radiation model showed a smaller deviation from the experimental data, indicating that the improvement of the flame length prediction model and the weighted coefficients can significantly improve the accuracy of the weighted multi-point source model. Peng et al. [28] predicted the thermal radiation of methane well blowout flames by the multi-point source prediction model and optimized the weighted coefficient by the inverse optimization method. Then, the predicted values were compared with the CFD simulation results. The results showed that the weighted coefficient optimization method can further improve the accuracy of the multi-source model for predicting the thermal radiation of methane jet fires. Park et al. [29] predicted the thermal radiation release from combustible materials, noting that rapid flame formation must account for flame shape changes in thermal radiation prediction. Ekoto et al. [30] optimized the traditional multi-point source prediction model by considering the buoyancy effect on the flame centerline trajectory, improving the model’s practical application accuracy.
In the weighted multi-point source thermal radiation prediction model, the accurate calculation of weight coefficients significantly impacts the predictive accuracy of the model. In the classic multi-point source thermal radiation prediction model for methane jet fires proposed by Hankinson et al. [25], the weighted coefficients were assumed to linearly increase from zero, reaching a maximum value at 75% of the flame length, and then linearly decrease to zero at the flame tip. Although this weighted multi-point source model has demonstrated practical utility in some applications, the underlying assumption for calculating these weights is overly simplistic, limiting the accuracy of the model. The current research on the thermal radiation prediction of hydrogen jet fires by multi-point source models is limited. Extensive literature indicates that the precision of thermal radiation prediction models for hydrogen jet fires under complex conditions still requires enhancement. Determining the optimal weight coefficients remains a critical challenge that must be addressed.
This study aimed to further optimize the weighted coefficients in prediction models for hydrogen jet fires under complex conditions. Experimental investigations were conducted within a leakage pressure range of 1 MPa and leakage diameters of 1.2 mm, 1.5 mm, and 2.0 mm. A series of experiments were conducted to analyze the size and thermal radiation characteristics of jet flames at various flame heights and radial distances. Computational fluid dynamics (CFD) simulations were used to study the temperature and thermal radiation distribution of jet fires under high-pressure conditions. Furthermore, based on the temperature distribution along the flame axis, discrete weighted coefficients in the multi-point source radiation model were optimized, and the optimized model was validated with experimental data.

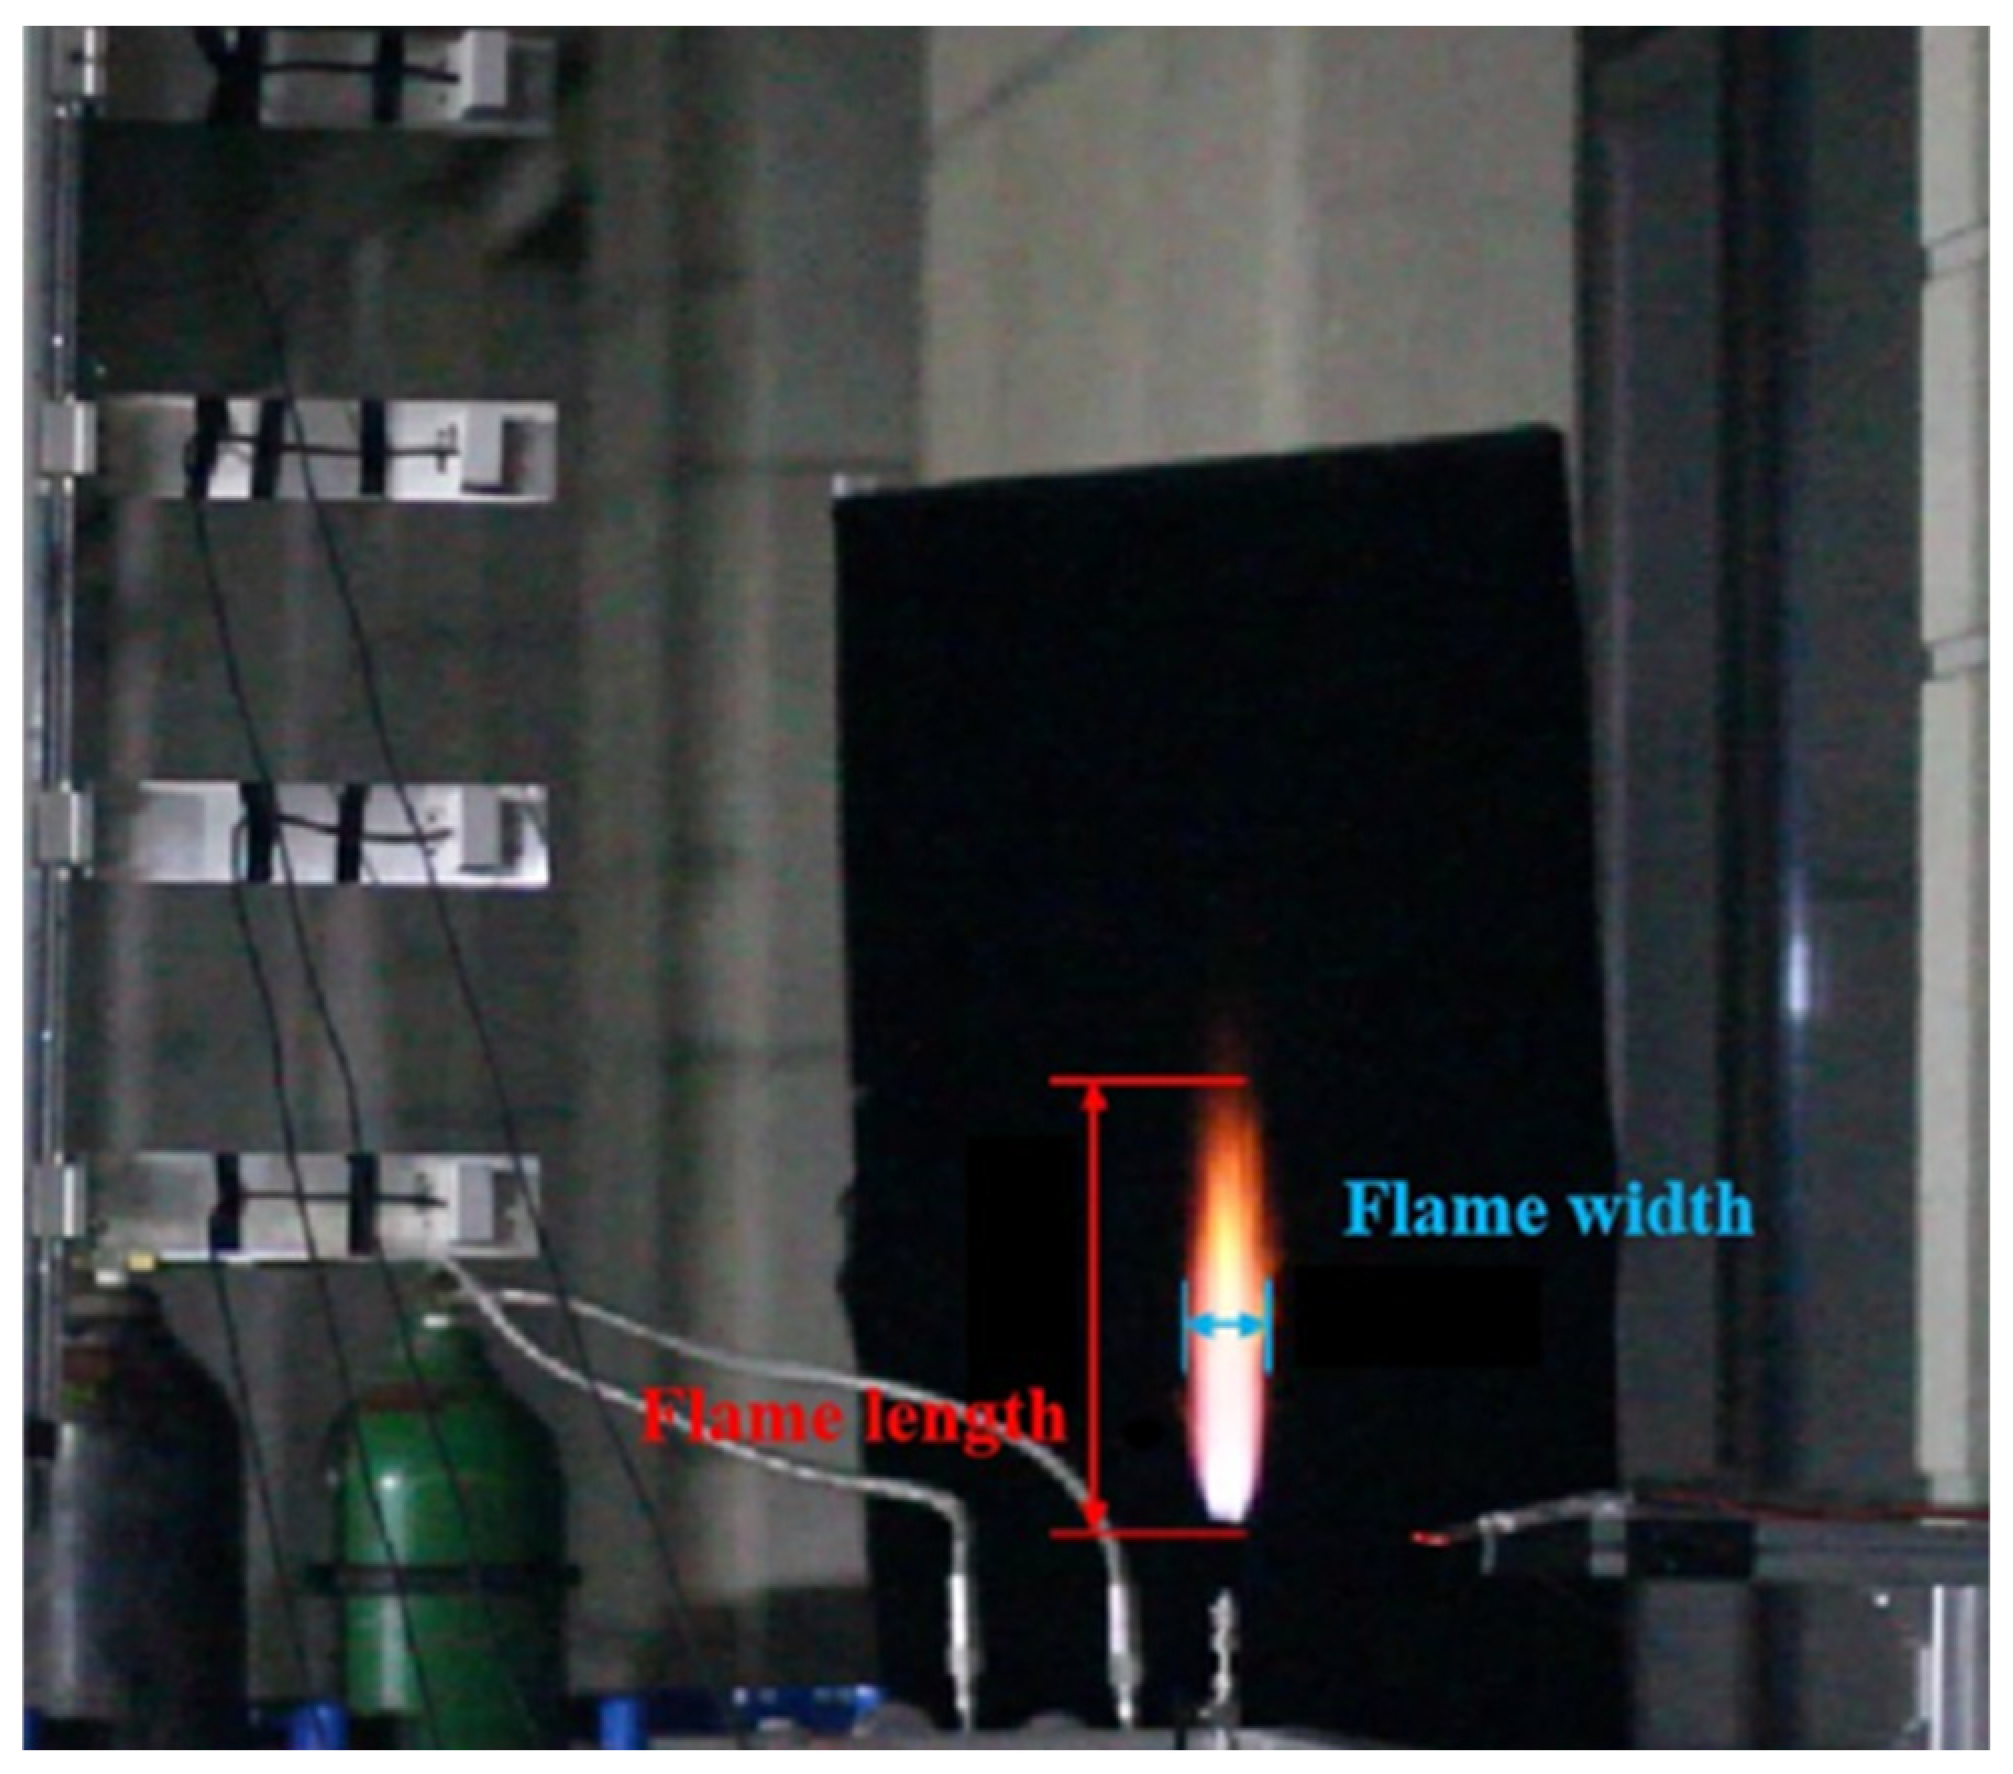
2. Experimental Setup

Figure 1 shows a schematic diagram of the experimental setup for the hydrogen jet fire experiments conducted in this study. This platform was designed to generate hydrogen jets under varying leakage diameters and pressures. The hydrogen purity used in the experiment was 99.999%. The hydrogen was stored in a cylinder of 12.5 MPa and introduced into a storage tank to provide a steadily varying hydrogen flow. The storage tank was a cylindrical container with a length of 60 cm and an outer diameter of 12 cm, with a hydrogen storage capacity of 7 L. It was made of 304 stainless steel and had a maximum pressure capacity of 15 MPa. The release pressure could be adjusted using a valve. The remote pressure gauge (LFT6200, LEFOO, Yueqing, China) ensured the hydrogen pressure in the storage tank was stabilized at 1 MPa before each experiment, and also monitored the pressure changes during hydrogen release. The release pressure at the leakage point was measured using the pressure gauge data. Nitrogen gas was used to purge residual gases in the storage tank before the experiment to prevent accidental combustion under flammable conditions. The ignition system consisted of a high-voltage pack and an ignition needle. The input voltage of the high-voltage package was 220 V, the output was 15 kV, and the distance between the two ends of the ignition needle head was 5 mm.
During the experiments, hydrogen was released through stainless-steel nozzles with diameters of 1.2 mm, 1.5 mm, and 2.0 mm. A black background panel was placed behind the flame, and a digital camera (Canon EOS X5, Canon, Tokyo, Japan) was used to record the dynamic behavior of the hydrogen jet flames. The captured hydrogen jet flame images are shown in Figure 2. Using the MATLAB R2022b software, the color frames were converted into grayscale images to extract the flame length and width parameters. The maximum flame length and width of the hydrogen jet fire in the experiments were 0.9 m and 0.15 m, respectively. The jet fire experiments in this study aimed to obtain precise thermal radiation data at specific spatial locations, which are crucial for thermal radiation analysis and optimization model validation. The instantaneous thermal radiation from the hydrogen jet flames was measured using four radiometers. The radiometers were positioned along the axial direction of the flames on a vertical rail, at radial distances of 0.23 m and 0.50 m from the flame axis. The longitudinal positions of the four radiometers were 0.25 m, 0.50 m, 0.75 m, and 1.00 m, respectively.
Considering the advantages of radiometers in terms of precise point measurements, high sensitivity, and reliability at high temperatures, a TS-34C heat radiometer manufactured by Captec, Lille, France, was selected for the experiment. These radiometers operated in the 0.3 to 50 μm wavelength range, accurately measuring radiation in both the visible and infrared bands, with a response time of 50 ms and a sensitivity of less than 0.3 μV·W−1·m2. The output voltage signals from the radiometers and the remote pressure gauge were collected using a data acquisition device (JK360, Changzhou Jinailian Electronic Technology Co., Ltd., Changzhou, China). The voltage measurement range of the data acquisition device was 0.001 mV to 100 V, with a sampling frequency of up to 1000 Hz. By synchronizing the video footage captured by the camera with the data from the JK360, the dependence of the flame length, width, and thermal radiation on the leakage pressure under different conditions was obtained. Additionally, a portable gas detector was used to continuously monitor the hydrogen concentration in the environment during the experiments to prevent the accumulation of hydrogen to dangerous levels.

3. Theoretical Basis of Numerical Simulation

3.1. Control Equations

In this study, the thermal radiation characteristics of hydrogen jet fire under high leakage pressure were analyzed by Fluent 2021 R1 software. The numerical simulations involved four crucial control equations: the component conservation equation, the continuity equation, the momentum conservation equation, and the energy conservation equation [17,19].
  • The component conservation equation is:
t ( ρ φ ) + x j ( u i ρ φ ) = x j [ ρ Γ φ x j ( φ ) ] + S φ
where φ is the arbitrary variable; ρ is the fluid density; u i is the velocity vector in the i-direction; x j is the velocity vector in the j-direction/m; Γ φ is the diffusion coefficient; and S φ is the source term.
2.
Continuity equation
The continuity equation is the fundamental equation describing the law of mass conservation. It ensures mass conservation before and after the reaction, expressed as
ρ t + x i ( ρ u i ) = 0
where t is the time variable, and x i is the integration variable of the i-direction.
3.
Momentum conservation equation
The momentum conservation equation states that the momentum of a closed system remains constant in the absence of external forces. The formula is as follows:
ρ u i t + x j ( ρ u j u i ) = p x j + x j τ i j + ρ g i
where τ i j is the stress tensor; g i is the gravitational acceleration component in the i-direction; and p is the fluid pressure.
4.
Energy conservation equation
The energy conservation equation is expressed as
t ( ρ e ) + x j ( ρ u j e + u j p ) = x i { k T x j + u i τ i j } + S h
where e is the specific energy of the fluid, and k is the heat flux.

3.2. Turbulence Model

This study used the k- ε model based on the RANS equations as the turbulence model [19,28]. The turbulent kinetic energy k represents the total energy in the turbulent flow field. The turbulence dissipation rate represents the rate of energy dissipation in the turbulent flow field:
t ( ρ k ) + x i ( ρ k u i ) = x j [ ( μ + μ σ k ) k x j ] + G k + G b ρ ε Y m + S k
t ( ρ ε ) + x i ( ρ ε u i ) = x j [ ( μ + μ i σ ε ) ε x j ] + C 1 ε k ( G k + C 3 G b ) C 2 ρ ε 2 k + S e
where G k is the turbulent kinetic energy resulting from the increase in laminar velocity; G b is the turbulent kinetic energy caused by buoyancy; and C 1 , C 2 , and C 3 are the relevant constant coefficients.

3.3. Combustion Model

The 21-step detailed reaction mechanism was used in this study for hydrogen combustion. The eddy dissipation concept (EDC) model was chosen as the combustion model [17,19,28]. The turbulent structures in the flow field are divided into primary and secondary vortices. The small vortex resolution is expressed as
ξ * = C ζ ( v e k 2 ) 3 / 4
where C ζ is the volume fraction constant, and v is the kinematic viscosity.
The time scale of the chemical reaction is given by
τ * = C r ( v ε ) 1 / 2
where C r is the reaction time constant.
The source term in the component conservation equation is
R i = ρ ( ξ * ) 2 τ * [ 1 ( ξ * ) 3 ] ( Y i * Y i )
where Y i * is the time scale of the eddy; ξ * is the mass fraction of the reactant; and Y i is the reactant concentration.

3.4. Radiation Model

Considering the combustion characteristics of hydrogen, this study adopted the P1 model to calculate the thermal radiation [31,32]. The P1 model is a simplified form of the radiative transfer equation (RTE) and is commonly used to describe the transfer of radiation in a medium. This model assumes that the radiative transfer in the atmosphere can be separated, dividing the atmosphere into several layers with relatively independent radiative transfer processes in each layer. The radiative transfer equation is defined as
σ s 4 π 4 π I ( Ω ) Φ ( Ω , Ω ) d Ω
where σ s is the scattering coefficient; Φ is the scattering phase function from the Ω direction to the Ω -direction; and I is the incident radiation intensity. The P1 model converts the original problem approximately to
( D P 1 G ) κ ( G 4 π I b ) = 0
where G is the incident radiation; I b is the blackbody radiation intensity; κ is the absorption coefficient; and D P 1 is the diffusion coefficient of the P1 radiation model. The diffusion coefficient D P 1 is defined as
D P 1 = 1 3 κ + σ s ( 3 a 1 )

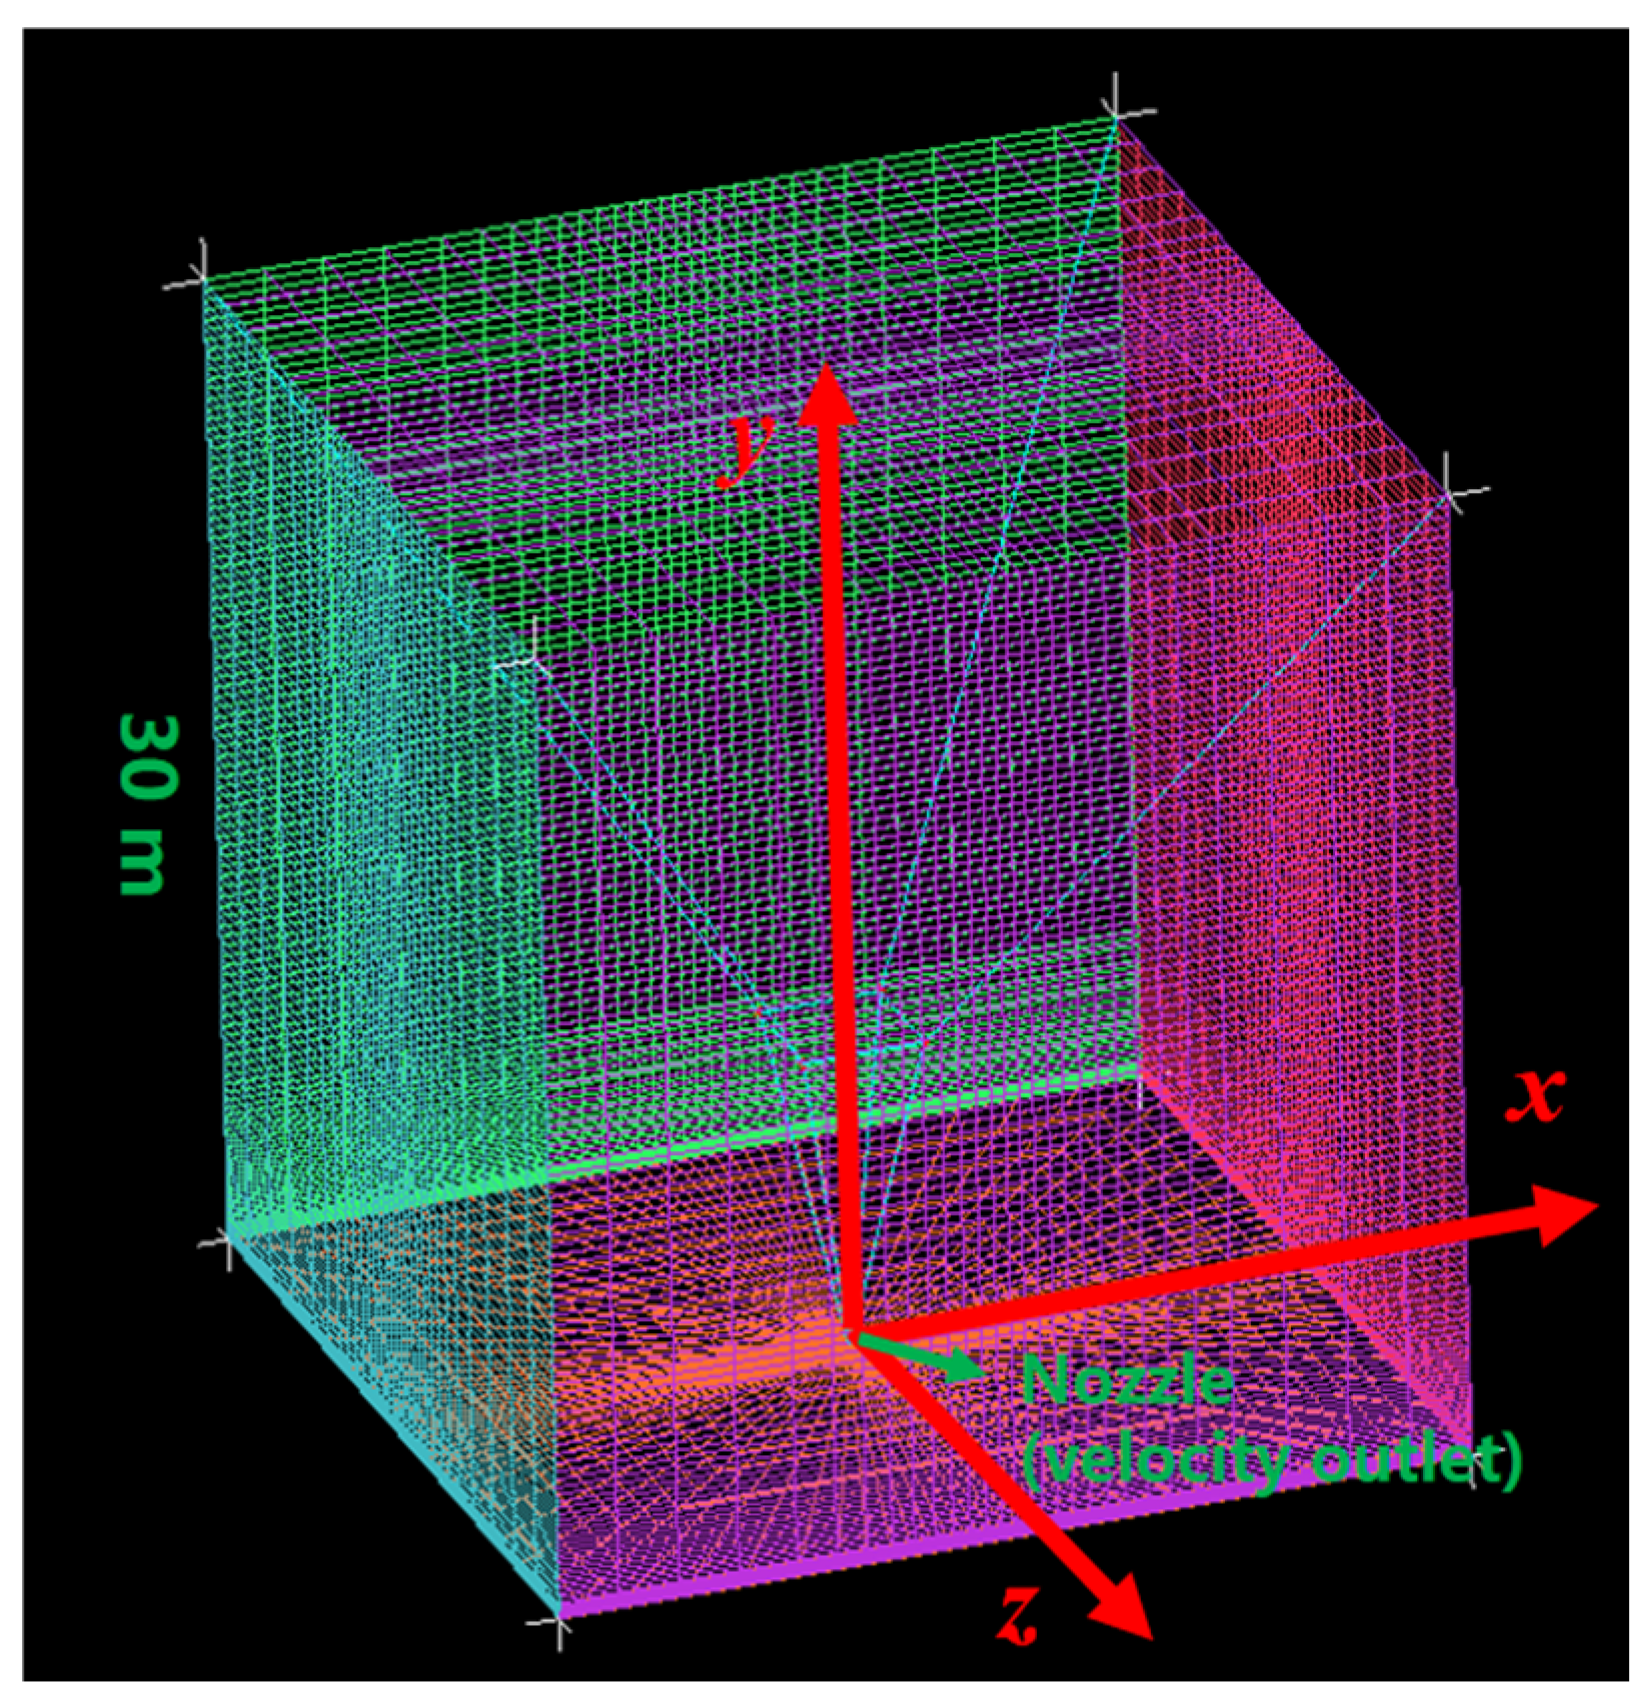
3.5. Computational Domain and Boundary Conditions

In this study, the hydrogen jet fire under leakage pressures of 4 MPa, 8 MPa, and 12 MPa and leakage diameters of 10 mm, 20 mm, and 40 mm were numerically investigated. The simulation conditions are shown in Table 1. We focused on the discussion of the temperature variations along the flame axis and the spatial distribution of the thermal radiation.
As shown in Figure 3, a 30 m cubic 3D space was set as the computational domain to simulate the space environment in which the jet fire was formed and affected. The three-dimensional computational domain was meshed using the ICEM 2021 R1. Due to the high pressure and velocity gradients present near the hydrogen leakage nozzle, the mesh near the nozzle was encrypted using multiple O-type block mesh divisions. This approach ensured a higher mesh density near the nozzle and a coarser mesh further away, optimizing the computational accuracy.
The boundaries of the cubic computational domain were specified as pressure outlets, while the ground was defined as an isothermal wall boundary. The material chosen from the Fluent material library was CaCO3, and the wall temperature was set to 300 K, in line with the ambient temperature.
A round nozzle was used to simulate the hydrogen leakage hole, which was defined as a velocity outlet. The diameter and velocity of the leakage nozzle were determined using the virtual nozzle model. The governing equations were solved using the finite volume method, employing the coupled algorithm to manage the pressure–velocity coupling. For the high-pressure hydrogen leakage condition, since the flow velocity near the nozzle was substantial, a second-order upwind scheme was used for the discretization of both the convective and diffusive terms.

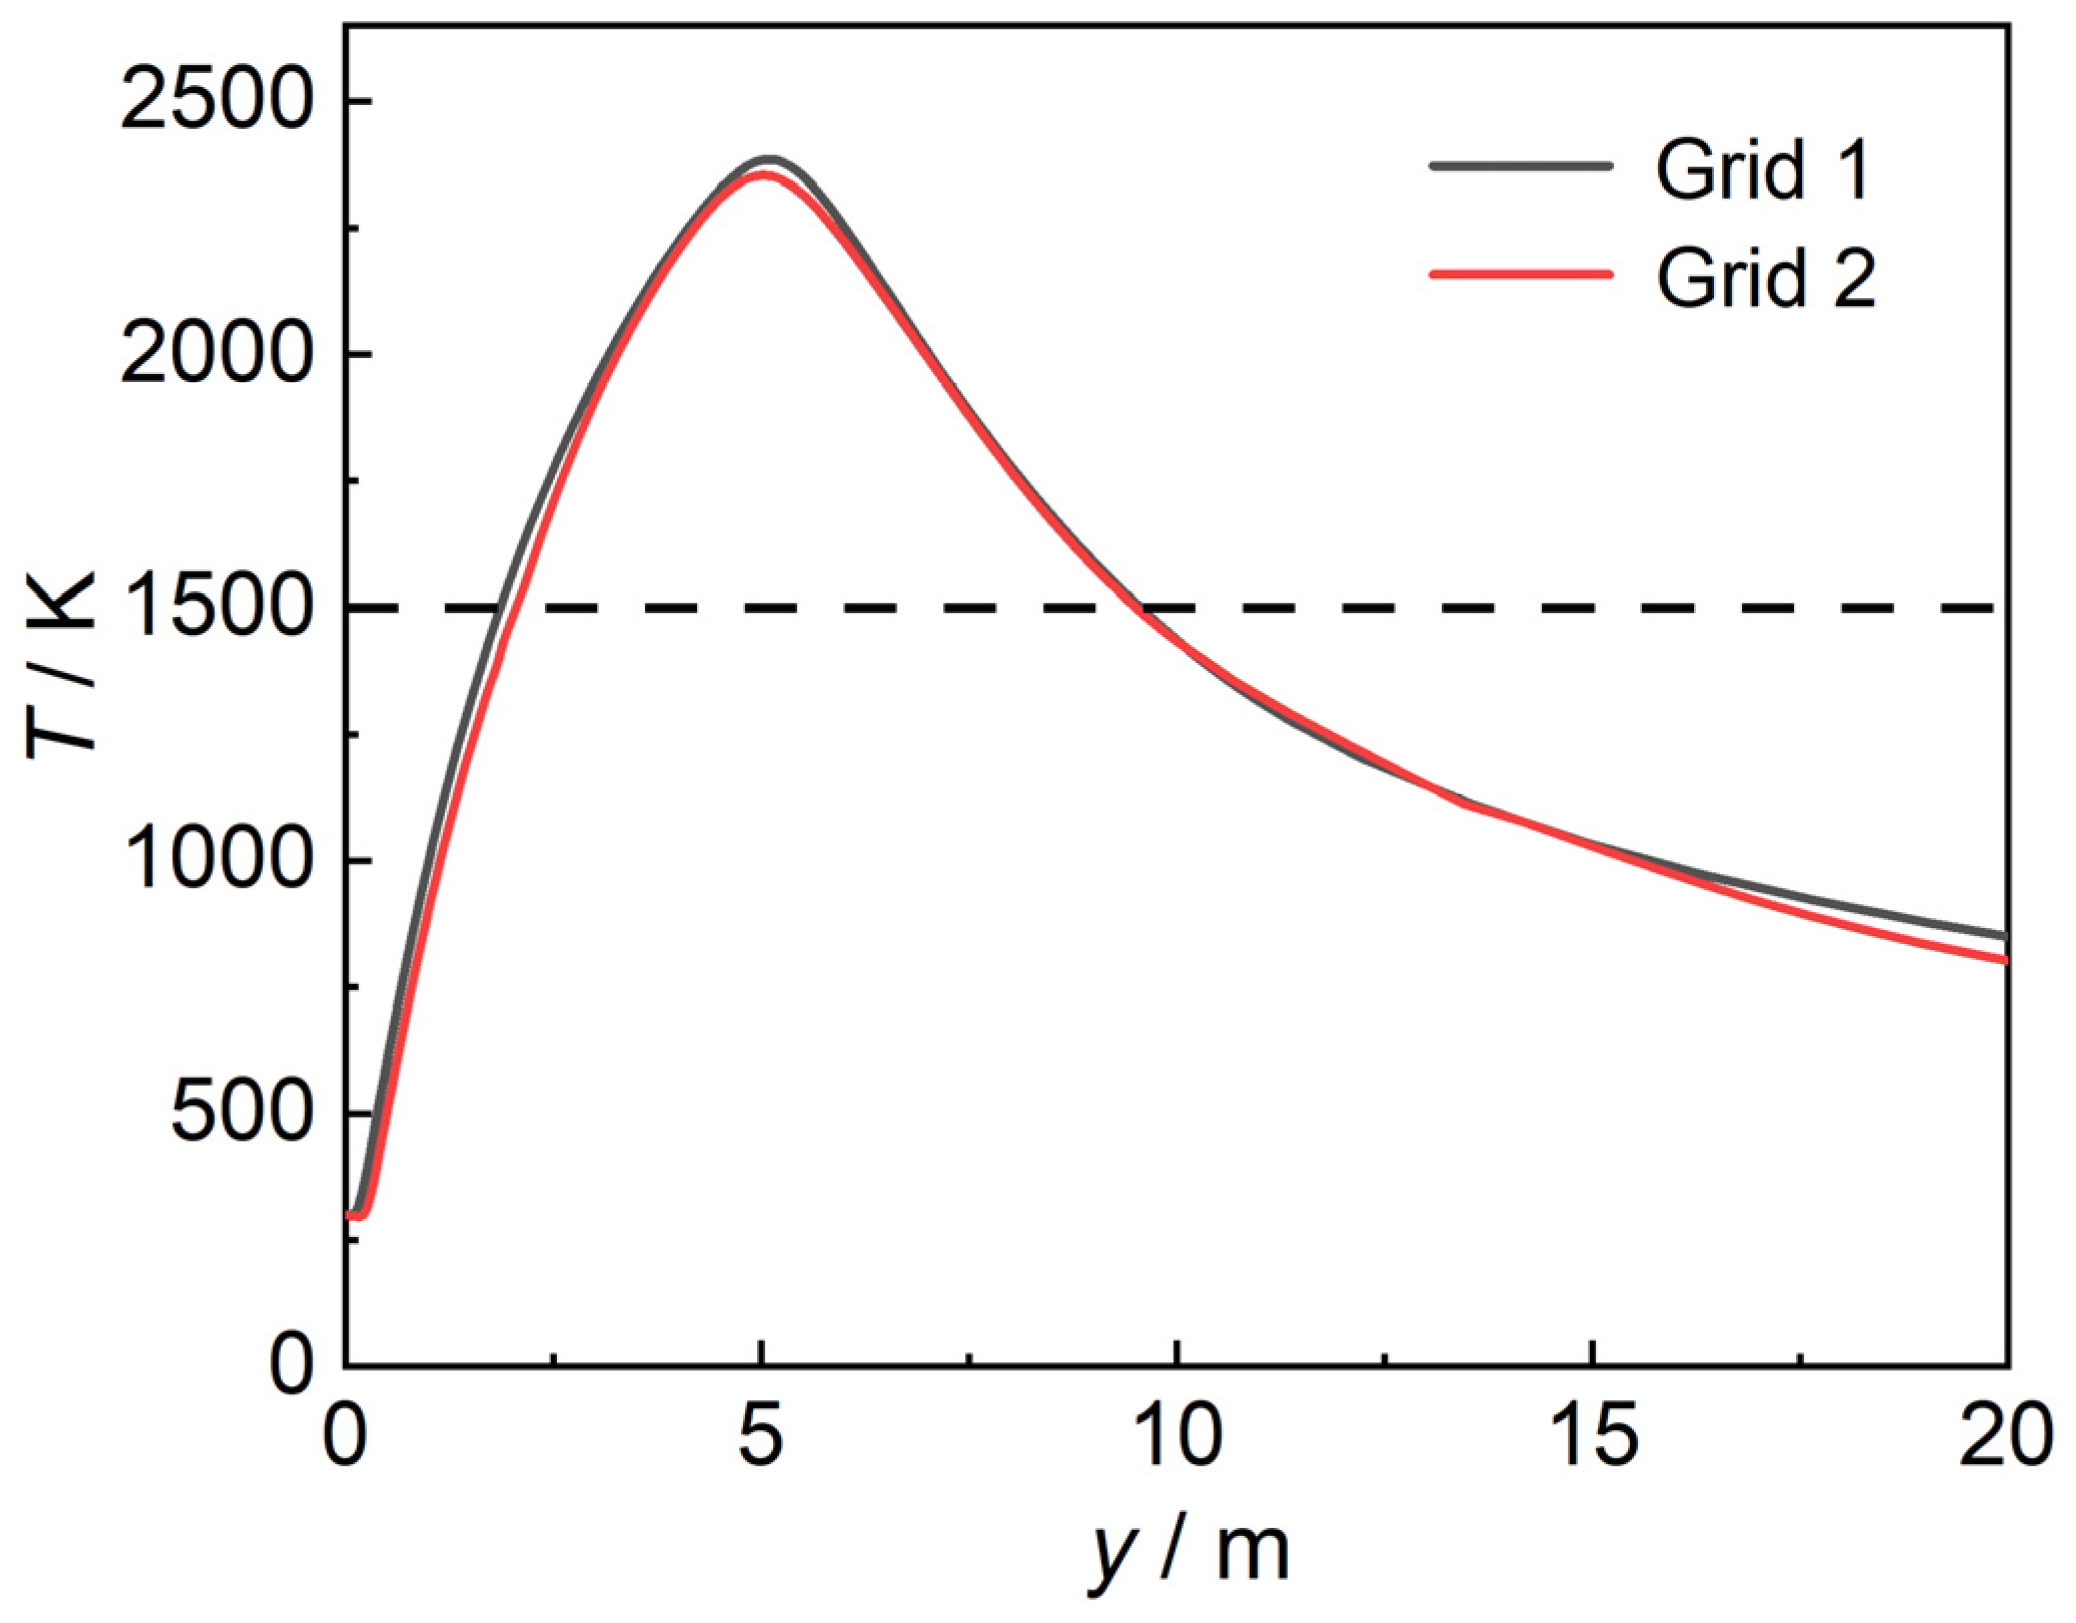
3.6. Grid Independence Verification

Sensitivity tests were conducted under conditions of 4 MPa leakage pressure and a 10 mm leakage diameter. Two grid sizes were tested, with grid 2 being a refinement in the y-direction based on grid 1, resulting in 1,019,648 grid nodes. The y-direction temperature distribution along the flame axis calculated by the two grid sizes is shown in Figure 4. The results show minimal numerical differences between grid 1 and grid 2, with negligible differences in the temperature distribution along the flame axis. Based on a flame temperature of 1500 K, the flame lengths obtained by grid 1 and grid 2 were 7.53 m and 7.39 m, respectively. Considering the computational load and accuracy, grid 1 was ultimately selected as the computational grid size.

3.7. Optimization of Thermal Radiation Prediction Model

Based on the multi-point source radiation model proposed by Lowesmith et al. [25,33], the discrete weight coefficients in the model were optimized using the temperature distribution along the jet flame axis obtained from the numerical simulations, enhancing the accuracy of the prediction model for calculating the thermal radiation from the hydrogen jet flames.
This study focused on the vertical hydrogen jet fire. In the multi-point source thermal radiation model, the flame can be considered as a collection of several particles distributed on the flame axis. The heat flux at a target point is expressed as
q ˙ x , y , z = i w i α i χ r Q ˙ 4 π r i 2 cos θ i
where w i is the weight coefficient of the heat source point i; α i is the transmittance of the radiation of the heat source point i in the air; χ r is the radiative emission coefficient of the flame; Q ˙ is the total heat power of the flame; θ i is the angle between the line connecting the heat source point with the target point and the horizontal plane; and r i is the distance from the heat source point i to the target point.
α i can be calculated by the following equation [34]:
α i = 1.06 R i 0.09
The emission coefficient of hydrogen was measured by experimentation and can be expressed as [12]
χ r = 0.072 lg τ f + 0.156
where τ f indicates flame stopping time, calculated by the following equation:
τ f = ρ f D f 2 L f f s 3 ρ e d e 2 u e
where ρ f is the flame equivalent density.
According to Planck’s blackbody law of thermal radiation, thermal radiation results from the radiative emission of high-temperature combustion products and is calculated by the following equation:
E b λ = c 1 λ 5 e c 2 λ T 1
where E b λ is the blackbody radiation force; λ is the radiation wavelength; and T is the blackbody temperature.
If the effect of the wavelength is neglected, the thermal radiation is calculated by the following equation according to the Stefan–Boltzmann law:
E b = σ T 4
where σ is the Stepan–Boltzmann constant, equal to 5.67 × 10⁻⁸.
Therefore, the flame temperature distribution directly affects the intensity and distribution of thermal radiation. When the flame trace is assumed to consist of i discrete points, the contribution weight of each point to the total radiation can be calculated by the following equation:
w i = V i T 4 ( x , y , z ) d x d y d z
where V i is the area encompassed by the 1500 K temperature flame surface around point source i. The flame temperature distribution was obtained through simulation.
The weight coefficients required for the multi-point source model can be obtained by normalizing w i according to the following equation:
w i = w i i n w i

4. Results and Discussion

4.1. Model Validation
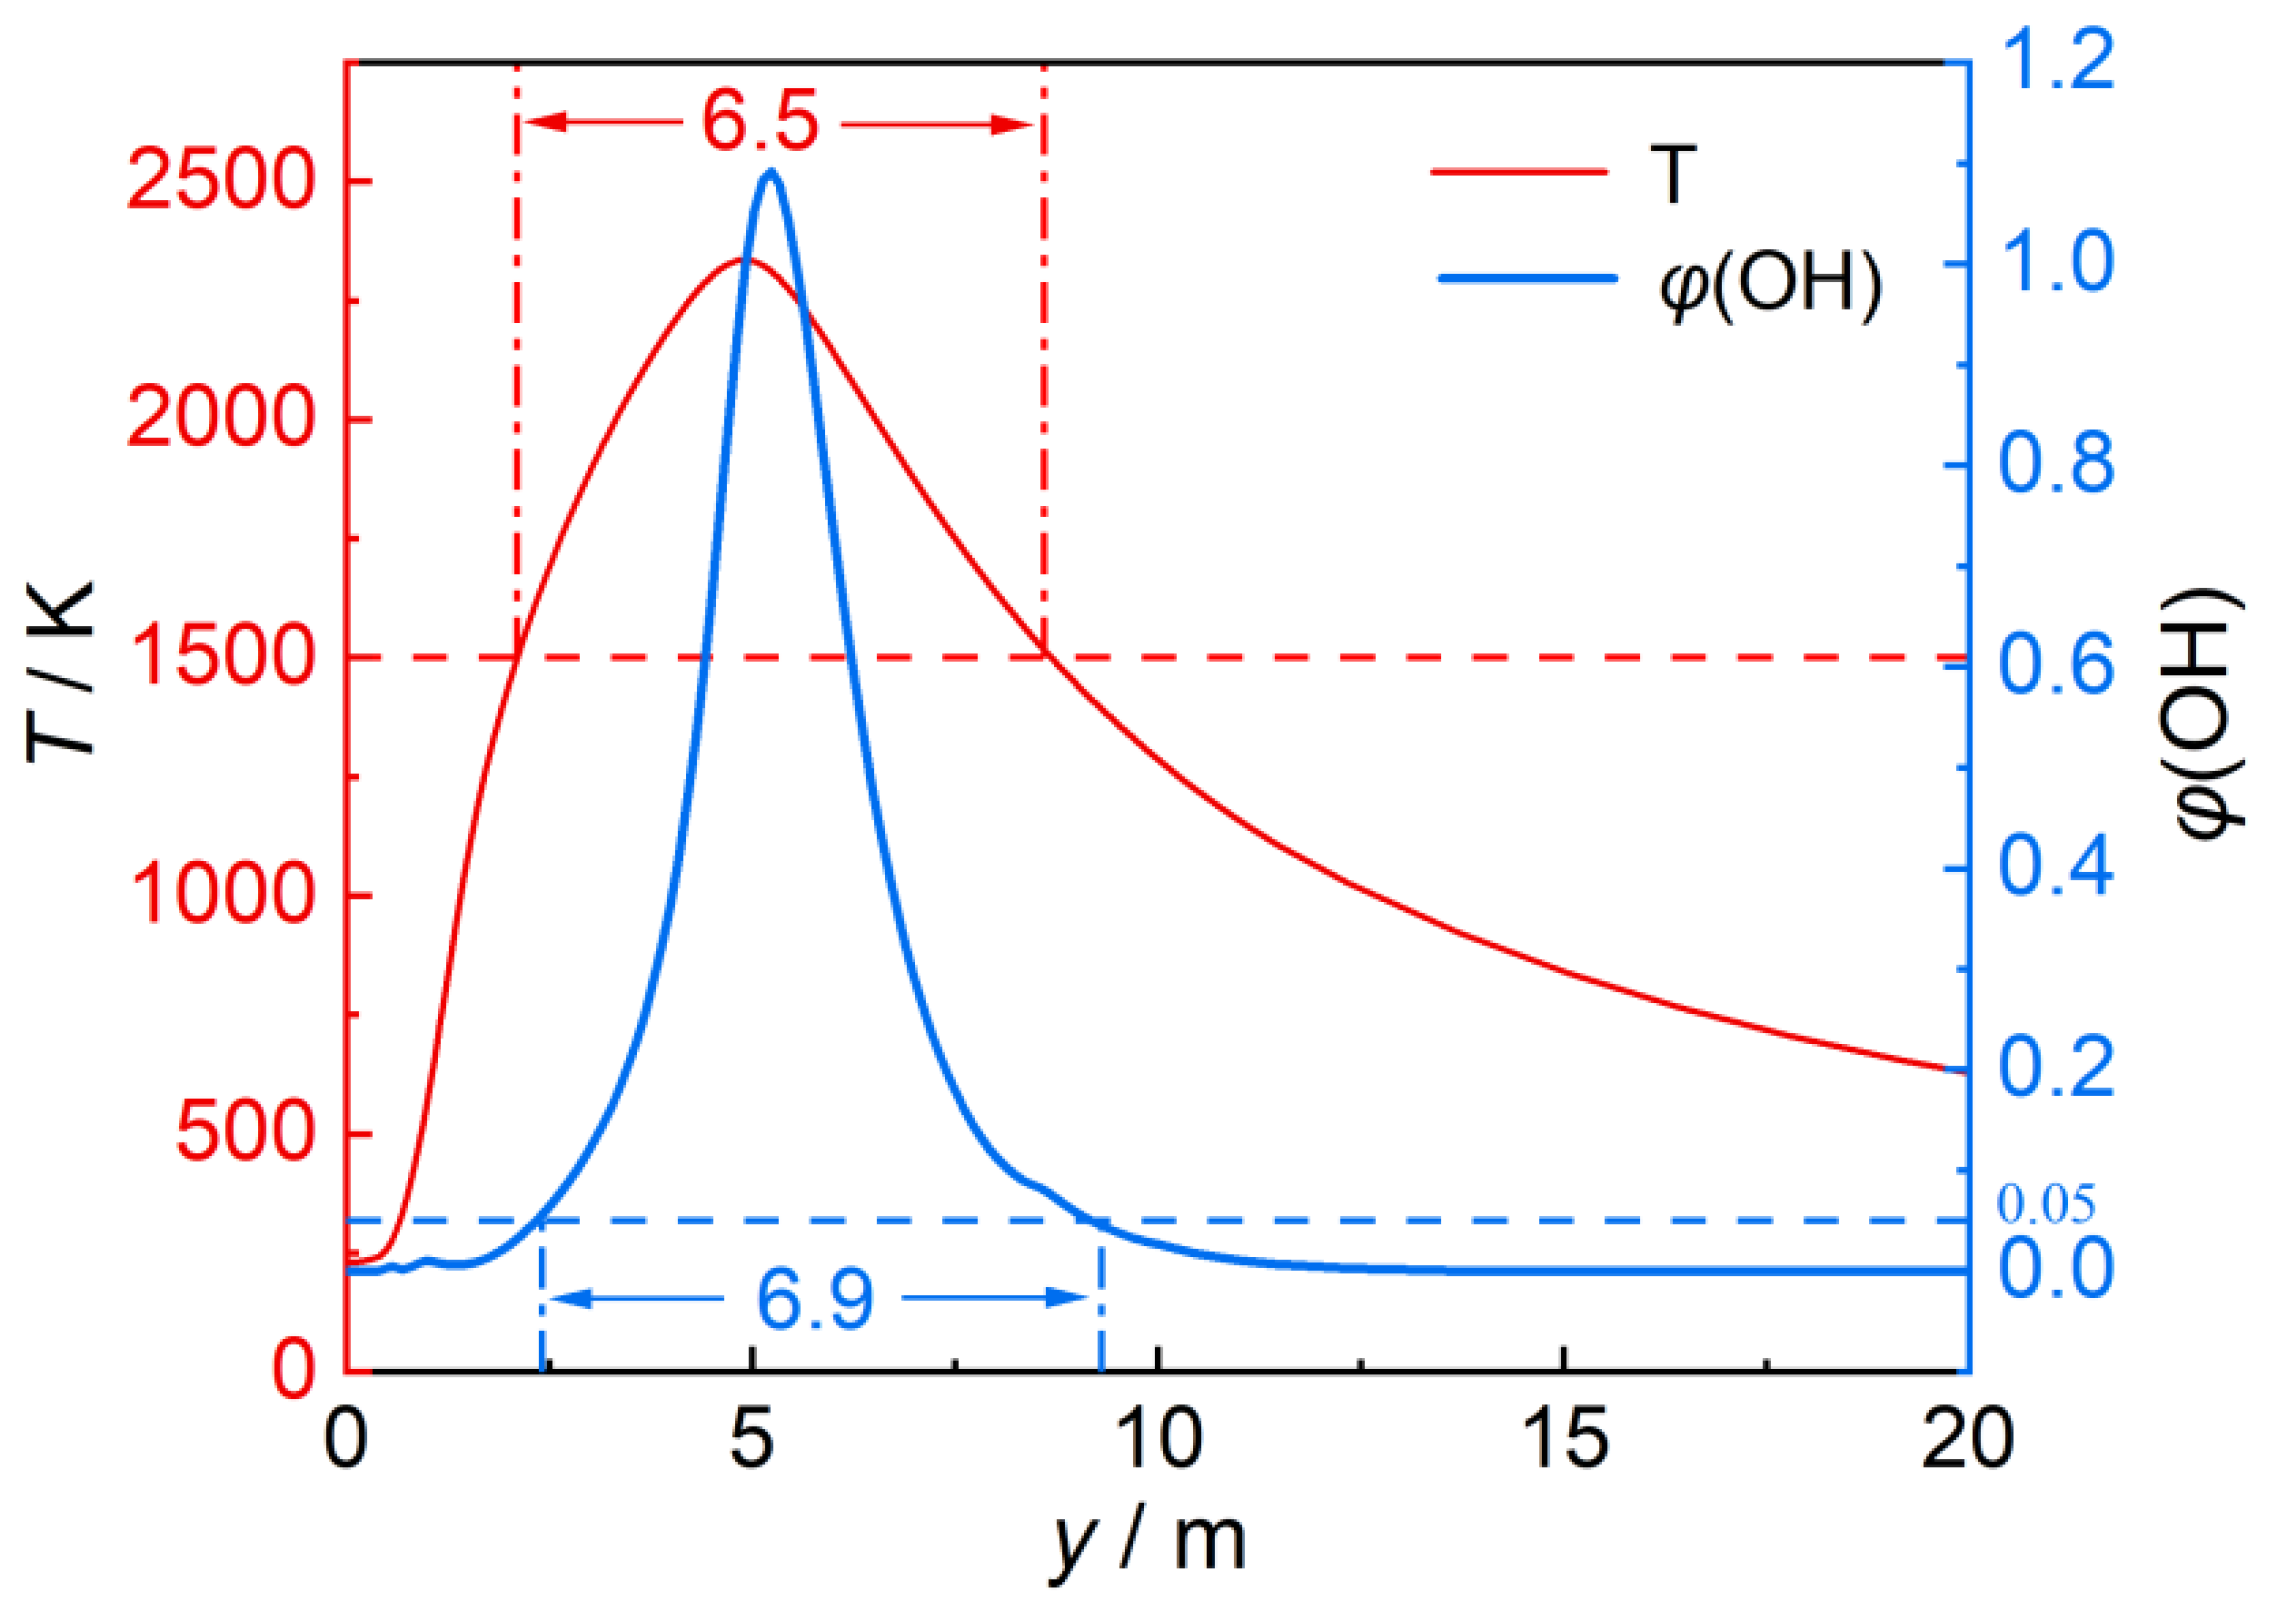
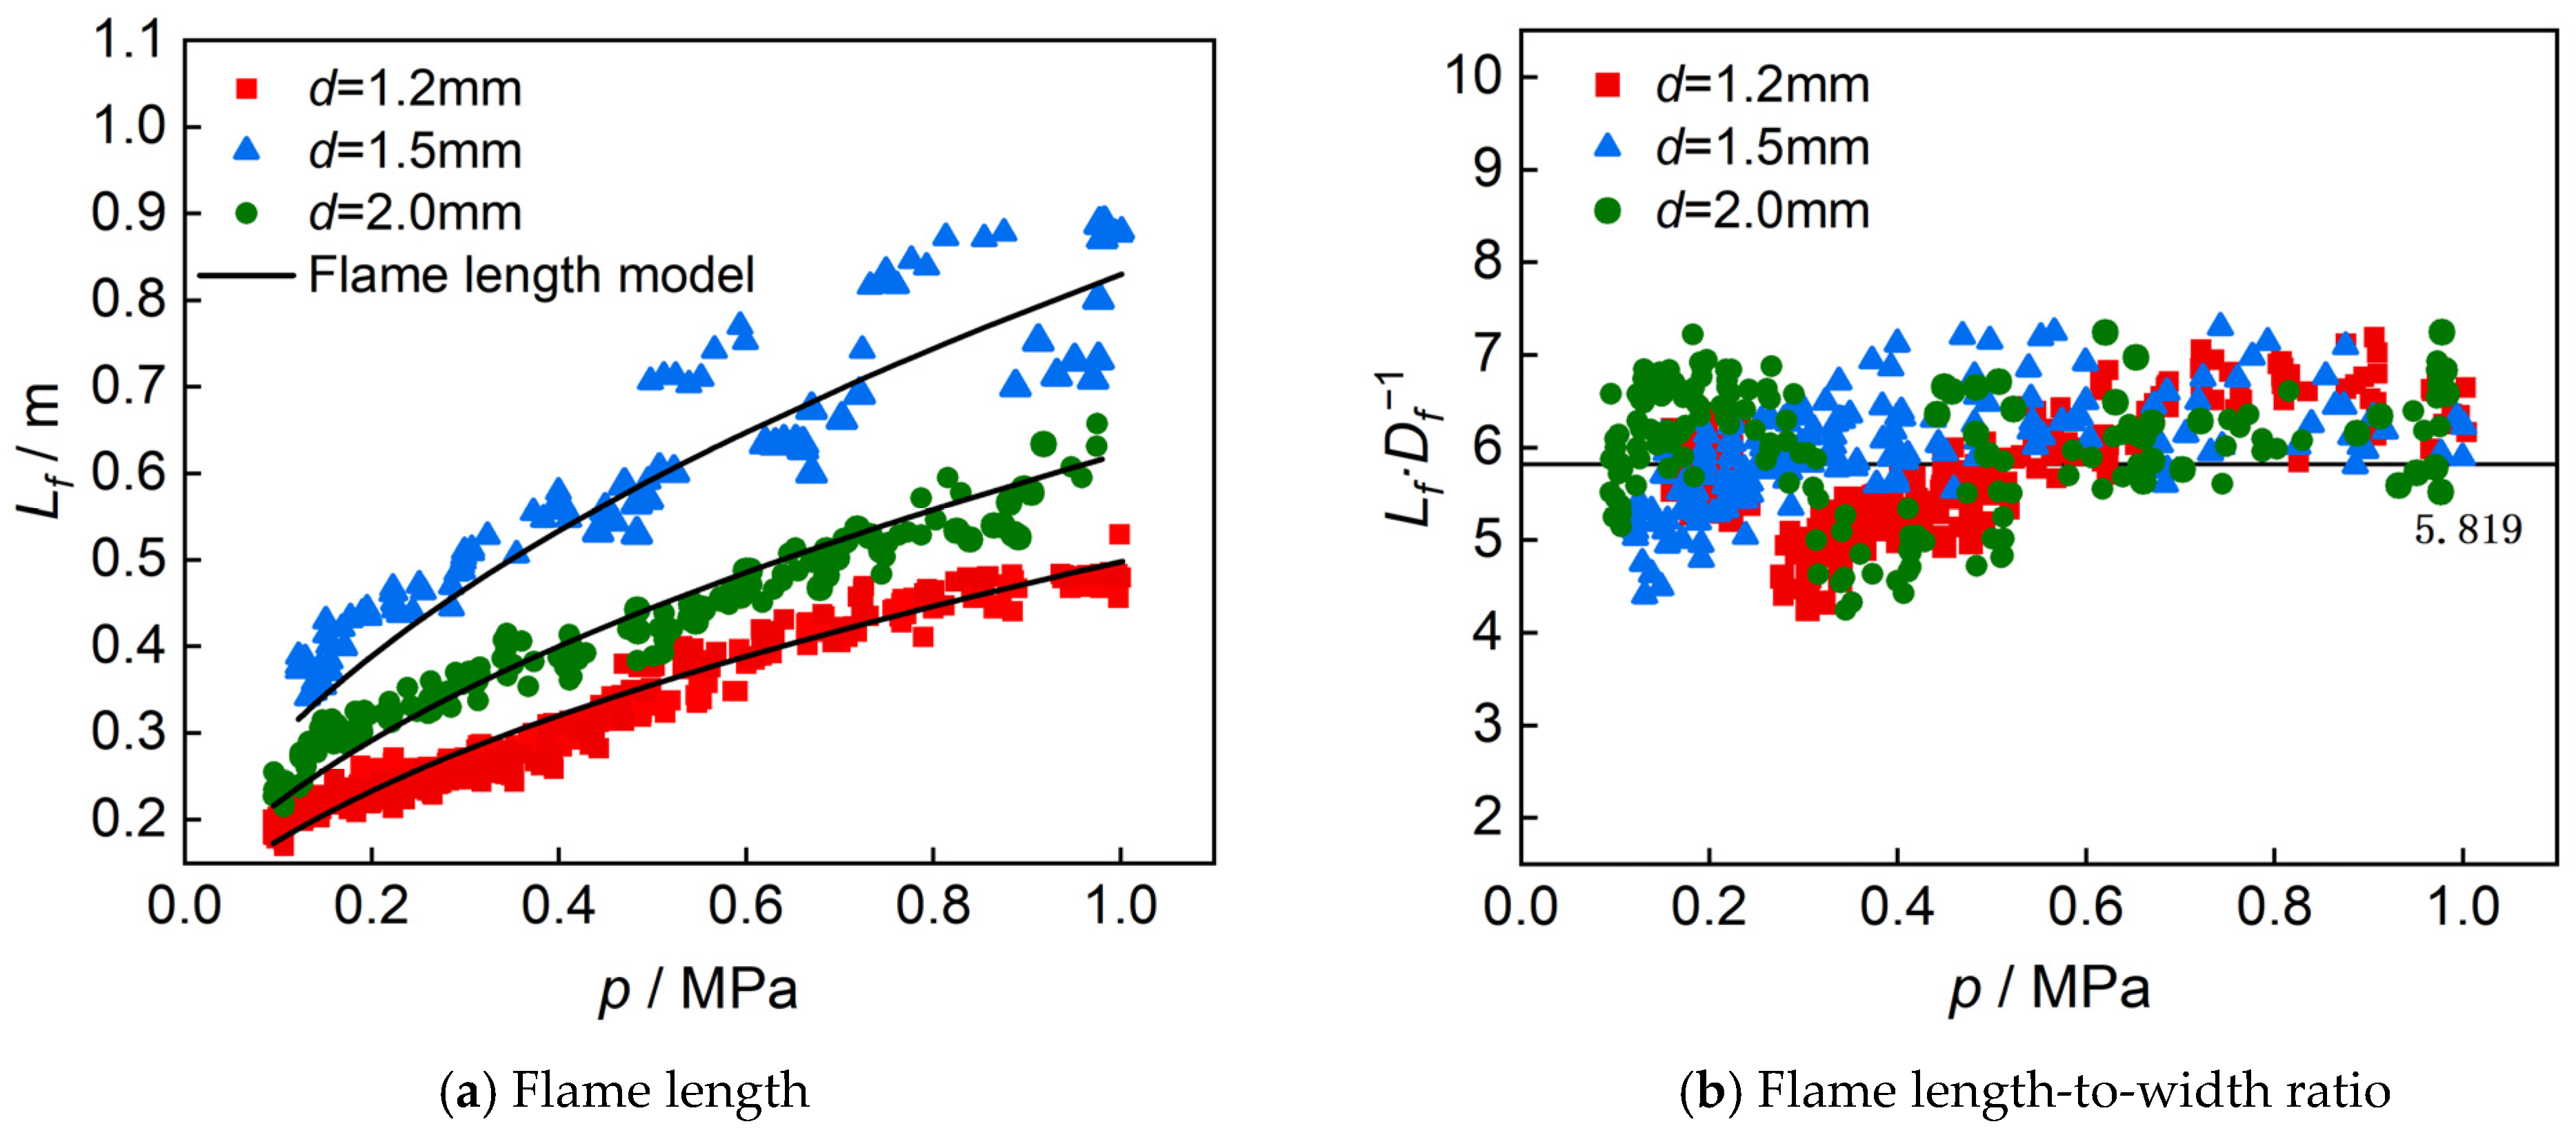
Water vapor is the main product of hydrogen combustion. Figure 5 shows the contour plots of the temperature, OH radical, and water vapor mass fraction distributions for the hydrogen jet fire under the validation conditions. In Figure 5, it can be observed that the distribution range of water vapor largely coincides with the high-temperature region, and the flame temperature peak appears at the same flame height as the highest OH concentration. This is because OH is a crucial radical in the reaction of H2 and air, participating in major stepwise exothermic reactions, which results in higher temperatures in this flame region. The rapid increase and decrease in the OH concentration along the flame direction indicate that OH is quickly generated and consumed. The distribution of the OH radicals reveals the jet region that is primarily involved in the combustion reaction.
To verify the accuracy of the numerical simulation model, the present simulation results were compared with the experimental results of Schefer et al. [12] under the same conditions. The flame length is a critical parameter in studying large-scale jet fires, and this study adopted the flame length as the validation parameter. The flame length derived through simulation was determined using two methods. The first method was the temperature threshold, which was proposed by Schefer et al. [12], who used a flame temperature of 1300–1500 K as the criterion for the flame length, and this study set the temperature threshold at 1500 K. Moreover, the OH concentration is usually used to determine the main reaction region of hydrogen combustion, and the flame length is determined by selecting 5% of the maximum OH concentration as the OH threshold. By extracting the flame temperature and OH concentration distribution of the jet fire, the flame lengths calculated by the two methods were 6.5 m and 6.9 m, respectively, as shown in Figure 6. The experimental flame length obtained by Schefer et al. under the same conditions was 6.7 m, indicating a small discrepancy between the simulated and experimental flame lengths, demonstrating the reliability of the simulation method.

4.2. Flame Size

The curves of the flame length and the ratio of length to width with different leakage pressures and leakage diameters are shown in Figure 7. In Figure 7a, it can be seen that for a given leakage diameter, the flame length exhibits an approximately linear relationship with the leakage pressure. As the leakage pressure increases, the flame length increases, and the difference in the flame length for different leakage diameters gradually becomes more pronounced. At a constant leakage pressure, a larger leakage diameter results in a longer flame length. This is because higher leakage pressure and diameter result in a greater hydrogen leakage rate from the leakage hole, leading to a larger jet fire scale.
The flame length was calculated using the flame Froude number length prediction model and is indicated with the solid line in Figure 7a. The experimental flame length agrees well with the predicted length from the model, showing a consistent trend and overlap. Therefore, this flame length prediction model can be used to calculate flame lengths under different conditions in the thermal radiation prediction model. Additionally, the relationship between the flame length-to-width ratio and the leakage pressure is shown in Figure 7b. It is observed that the length-to-width ratio fluctuates within a certain range and is independent of the leakage pressure and diameter. The average ratio obtained from the present experiment was 5.819, consistent with the range of 5–6 reported by Mogi et al. [13].

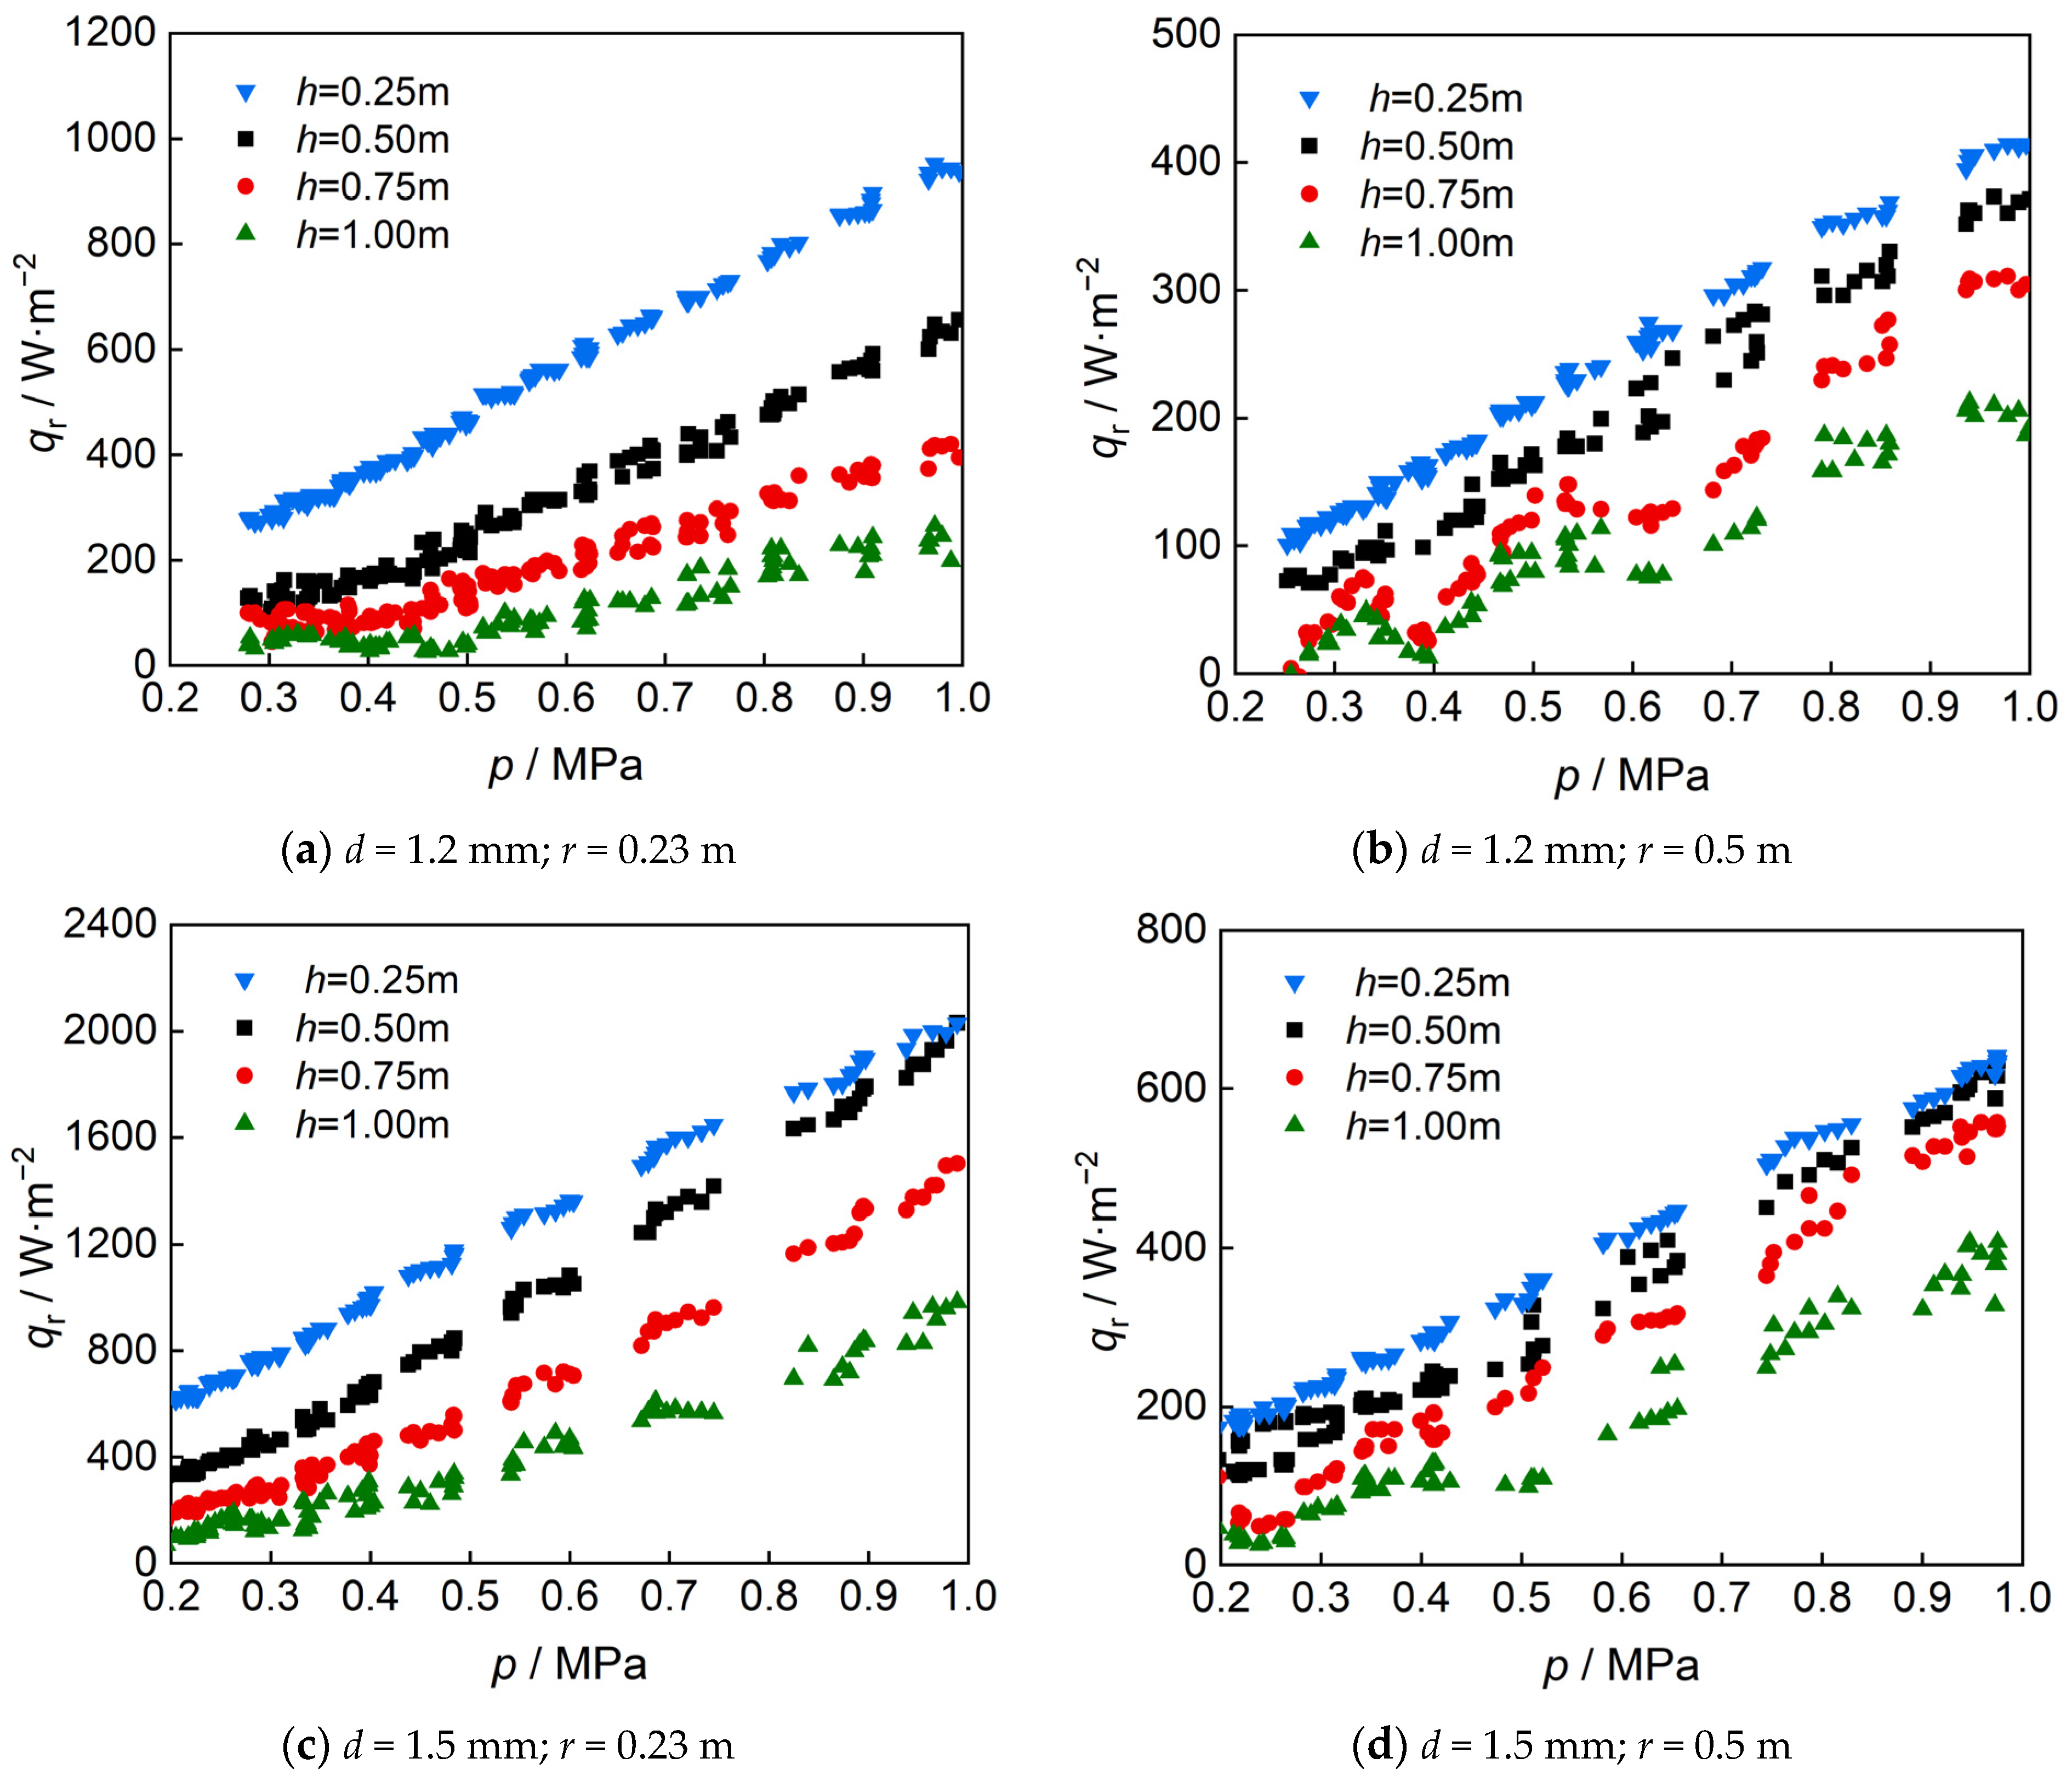
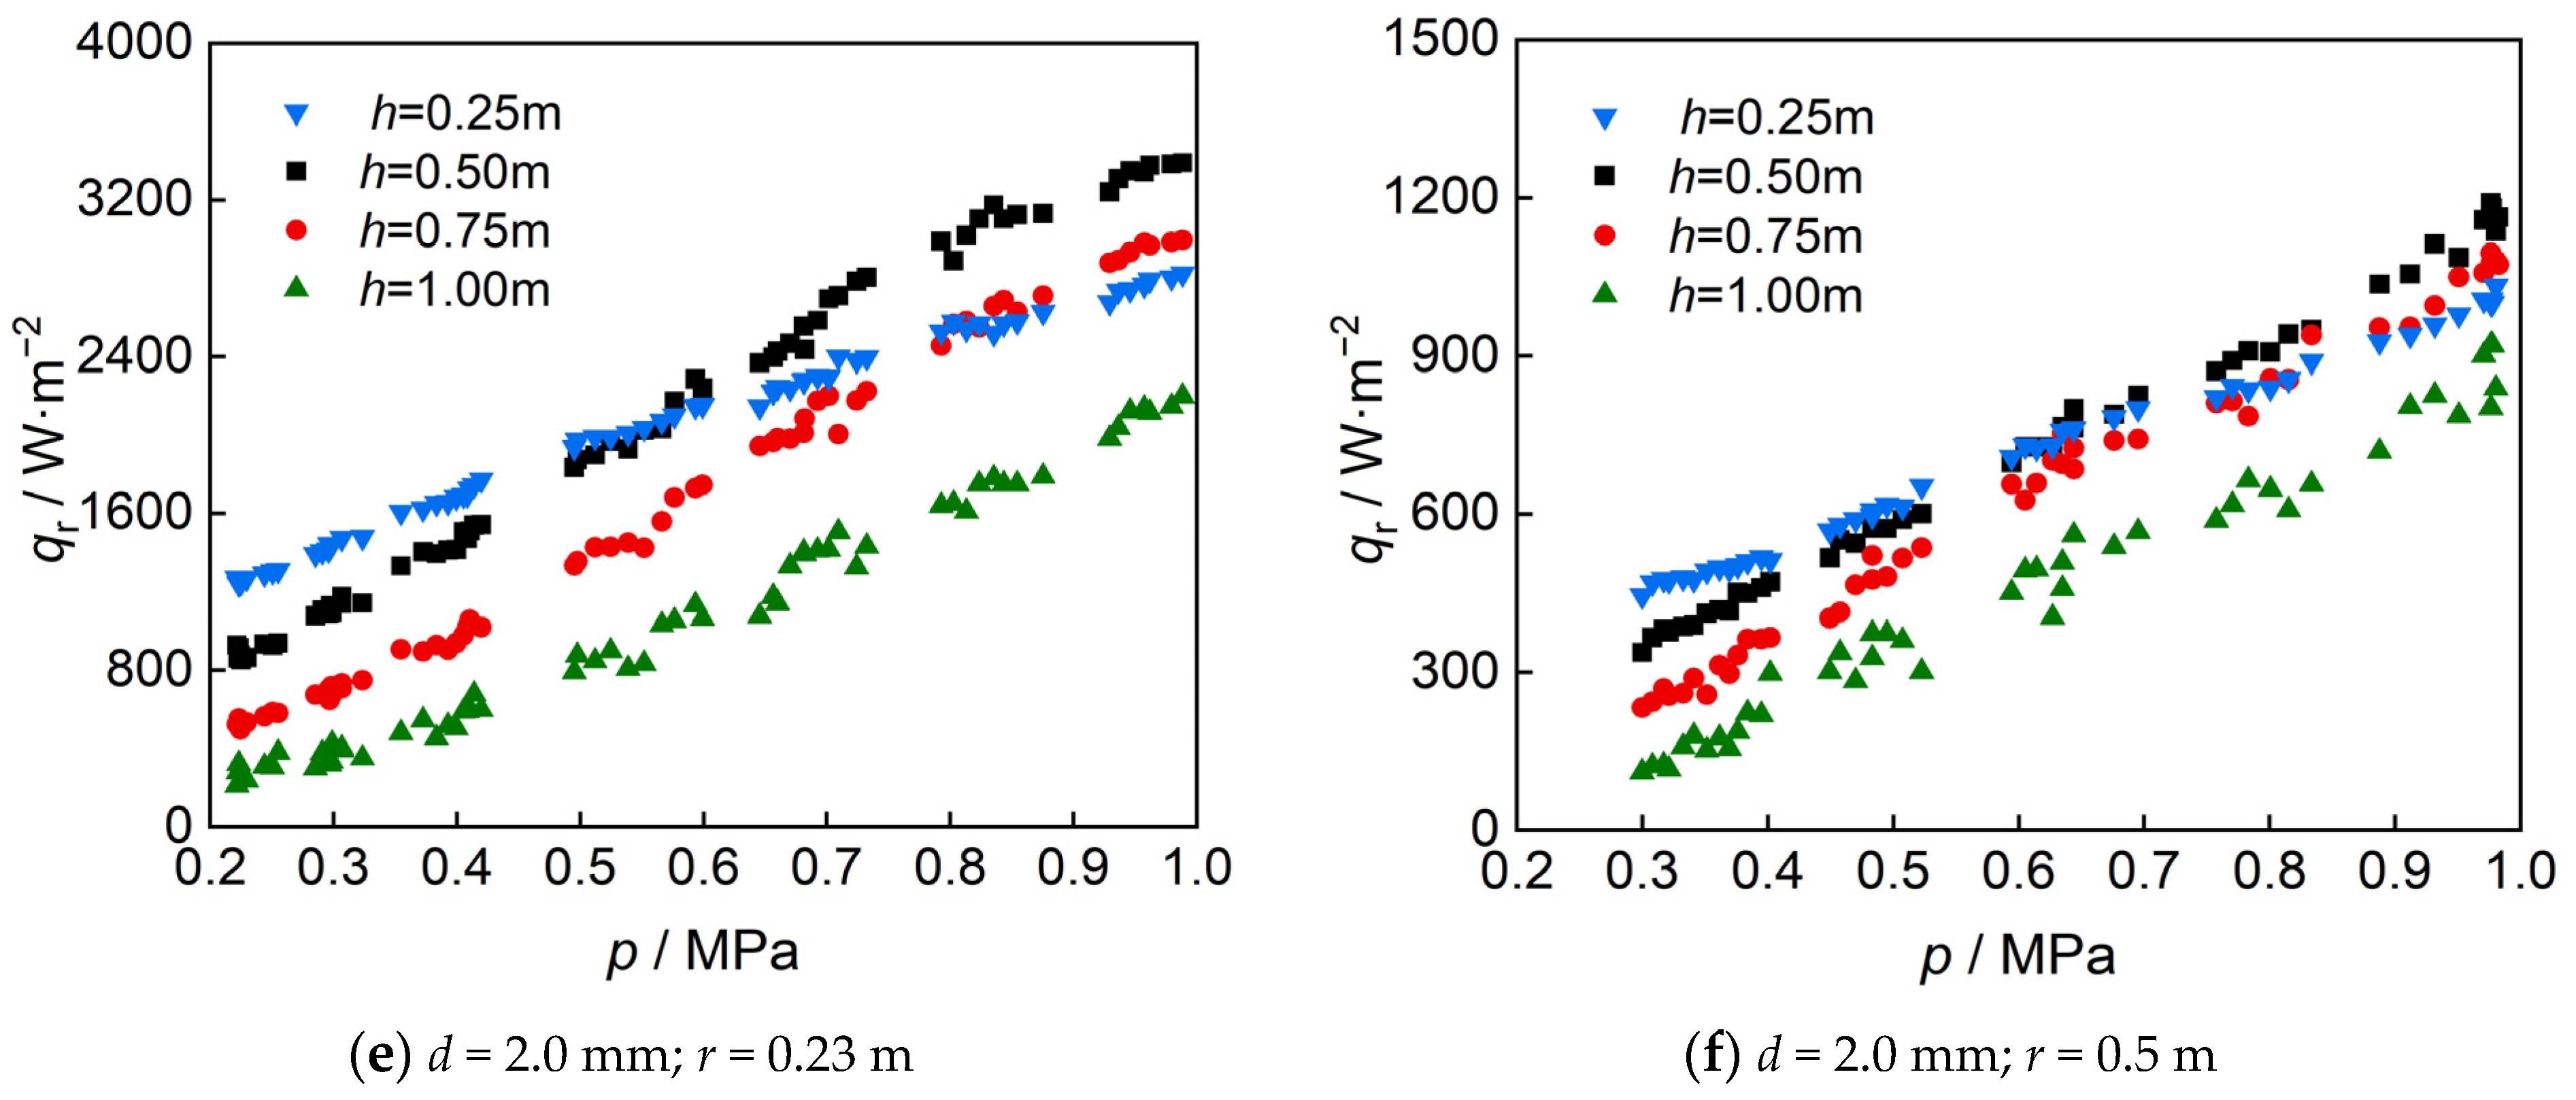
4.3. Thermal Radiation

The relationship between the thermal radiation and the leakage pressure at different flame heights and different leakage diameters is shown in Figure 8. The height at the nozzle is defined as zero. Each figure represents thermal radiation data at different measurement heights for specific leakage diameters and radial distances.
It is observed that the thermal radiation at various heights increases with increasing leakage pressure, displaying almost a linear relationship. This is primarily because a higher leakage pressure results in an increased hydrogen leakage rate, leading to a higher thermal power of the hydrogen jet flame. A linear relationship exists between the thermal radiation and the flame thermal power. For most conditions, the maximum thermal radiation is observed at a flame height of 0.25 m. The thermal radiation decreases with the increase in the flame height, with the minimum thermal radiation measured at a height of 1.0 m. However, for the condition of a leakage diameter of 2.0 mm, a different trend is observed. When the leakage pressure exceeds 0.55 MPa, the maximum thermal radiation is at a flame height of 0.5 m. This is because flame length increases at higher leakage diameters and pressures, resulting in an upward shift of the maximum radiation position along the axis. Under this condition, the flame height of 0.5 m has a higher local radiation emission coefficient compared with the height of 0.25 m. As the pressure decreases, the flame length decreases, and the maximum thermal radiation returns back to a 0.25 m height. Thus, the thermal radiation at different flame heights is significantly influenced by the flame length.
Comparing Figure 8a,c,e, it is found that as the leakage diameter increases from 1.2 mm to 2.0 mm, the thermal radiation rapidly increases. For the radial measurement distance of 0.23 m, the maximum thermal radiation is 952.8 W·m−2 for a diameter of 1.2 mm, and 3378.1 W·m−2 for a diameter of 2.0 mm, which is 3.5 times the thermal radiation value for 1.2 mm. It is evident that the diameter of the leakage hole significantly affects the thermal radiation emitted by the jet fire. Compared with the smaller leakage hole, the thermal radiation increases much more rapidly for the larger leakage hole. As a consequence, the heat source power of hydrogen jet fire is higher. This is because the relationship between the hydrogen leakage rate and the leakage diameter is not linear. Therefore, when the leakage diameter increases from 1.2 mm to 2.0 mm, the thermal radiation exhibits dramatic changes and is much stronger.
Additionally, the variation in the thermal radiation in the different radial distances of the hydrogen jet flame was investigated. Comparing Figure 8a–f, it is found that as the radial distance from the flame axis increases from 0.23 m to 0.5 m, the thermal radiation at the same height decreases. For example, under the condition of a 1.5 mm leakage diameter and a leakage pressure of 0.6 MPa, the maximum thermal radiation at the distance of 0.23 m is 1360.5 W·m−2, while this value is only 412.1 W·m−2 at a radial distance of 0.5 mm, less than one-third of the value at 0.23 m. Moreover, in the measured thermal radiation density at a flame height of 1.0 m, relatively obvious oscillation characteristics are observed. This is related to the greater strength of the oscillations at the flame head. These oscillations are more pronounced at higher leakage pressures, mainly due to the stronger turbulence intensity of the hydrogen jet at higher outlet pressures, causing the hydrogen jet flame, especially the flame front, to oscillate. This oscillation leads to irregular fluctuations in the thermal radiation flux density measured at specific locations.

4.4. Numerical Simulation

Numerical simulations were adopted to study the thermal radiation of the jet fires under higher pressure and larger leakage hole conditions. The simulation conditions with different leakage pressures and diameters are shown in Table 1. In the numerical model of the vertical jet fire in Figure 3, the combustion temperature and thermal radiation variable data in the y- and x-directions (y = 2 m plane) for the hydrogen jet fire under each simulation condition are extracted. The y-direction corresponds to the different flame height positions of the jet fire, and the x-direction corresponds to the radial position change from the flame axis.

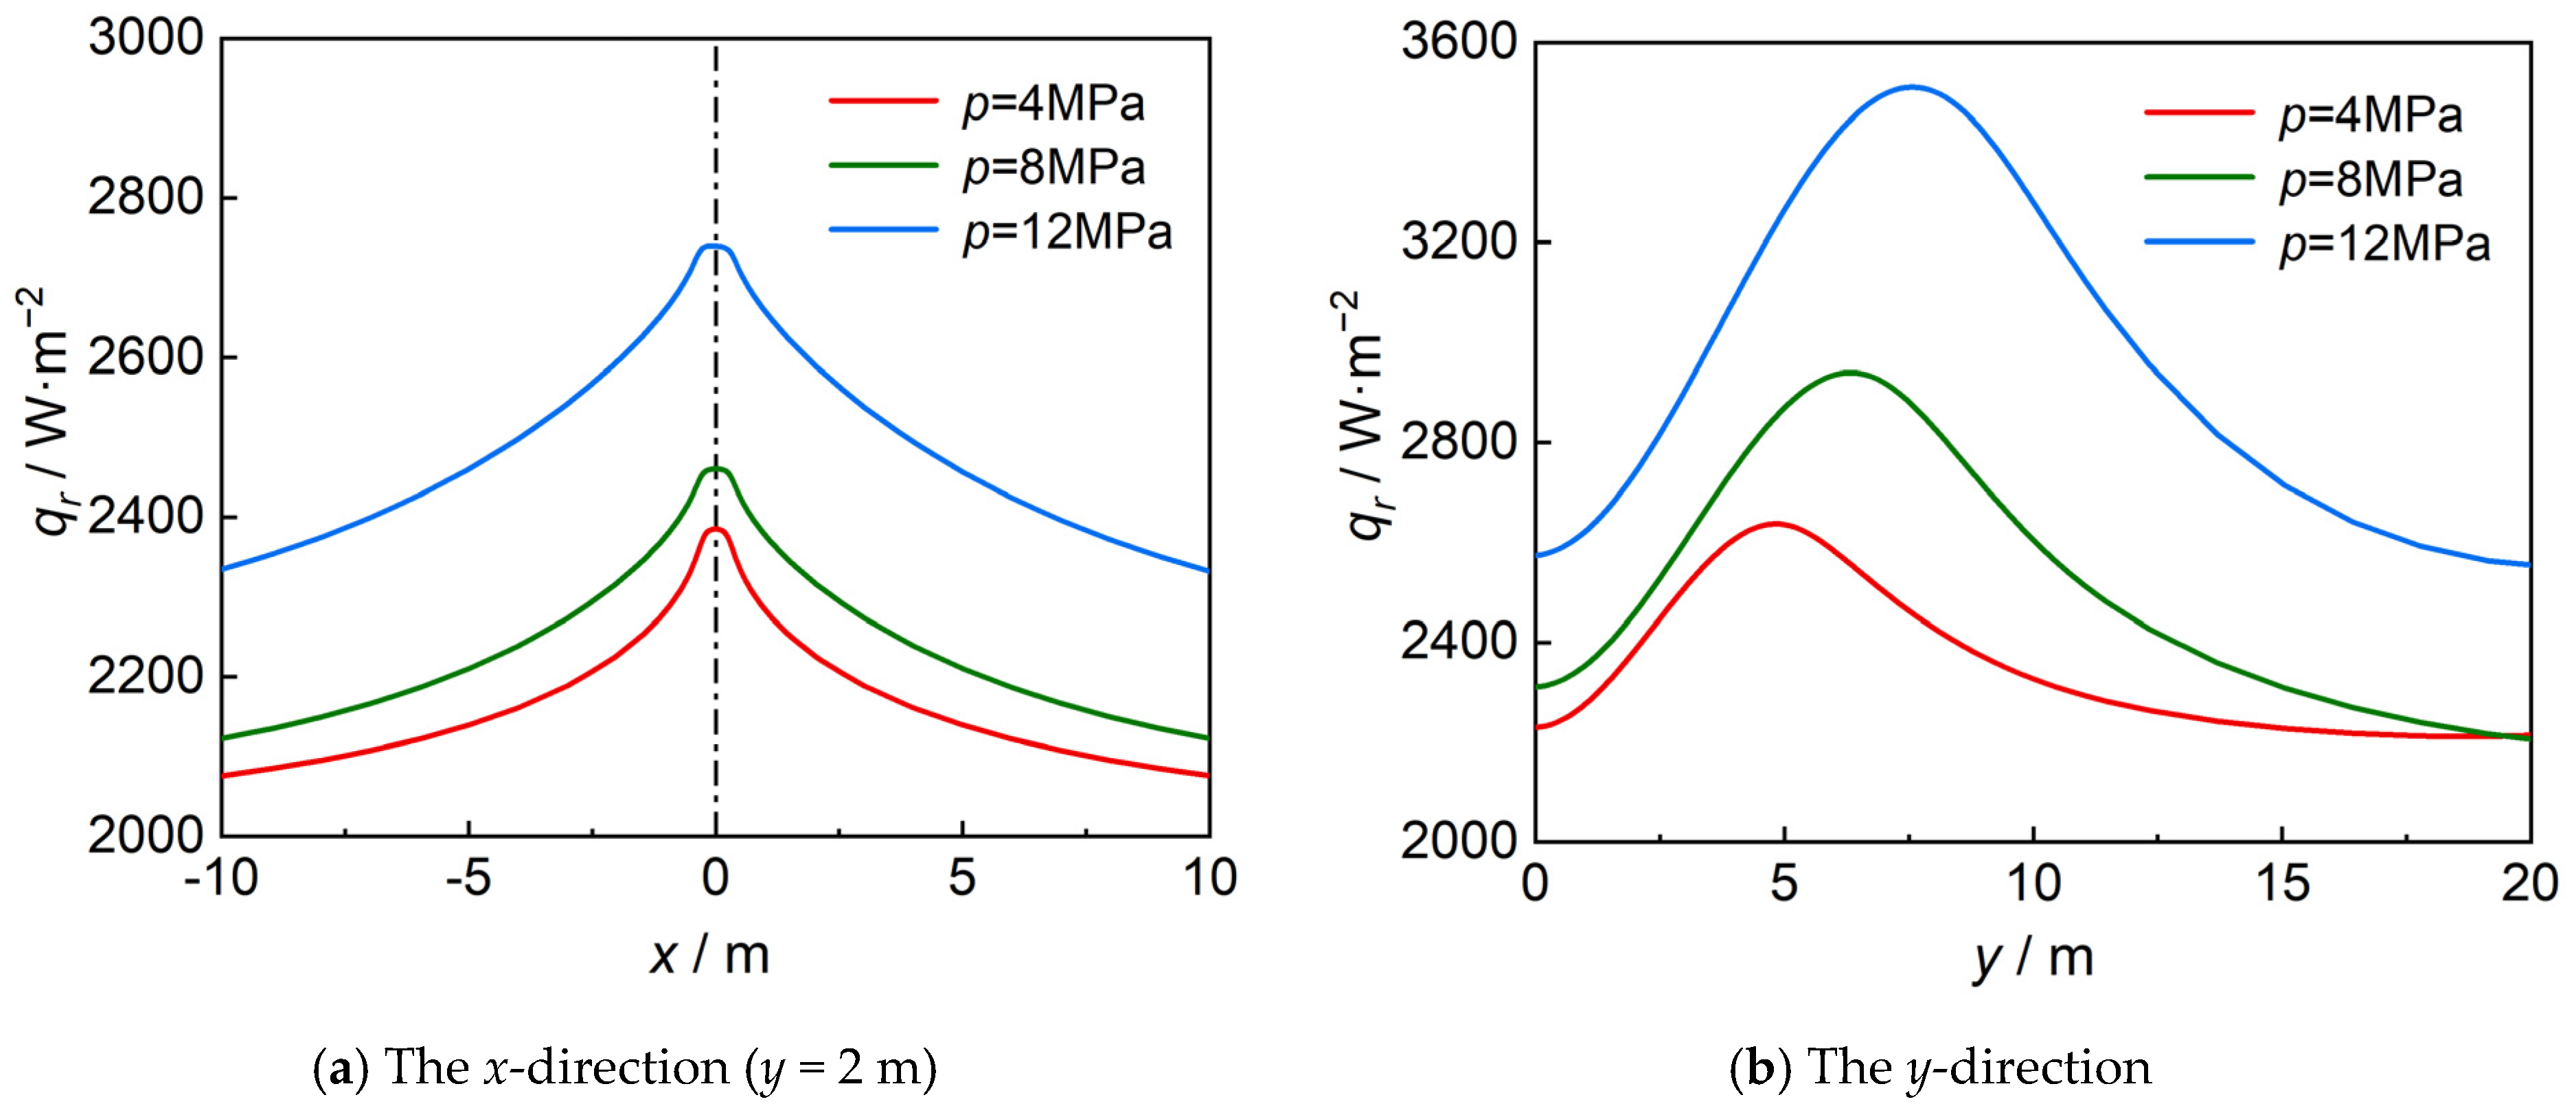
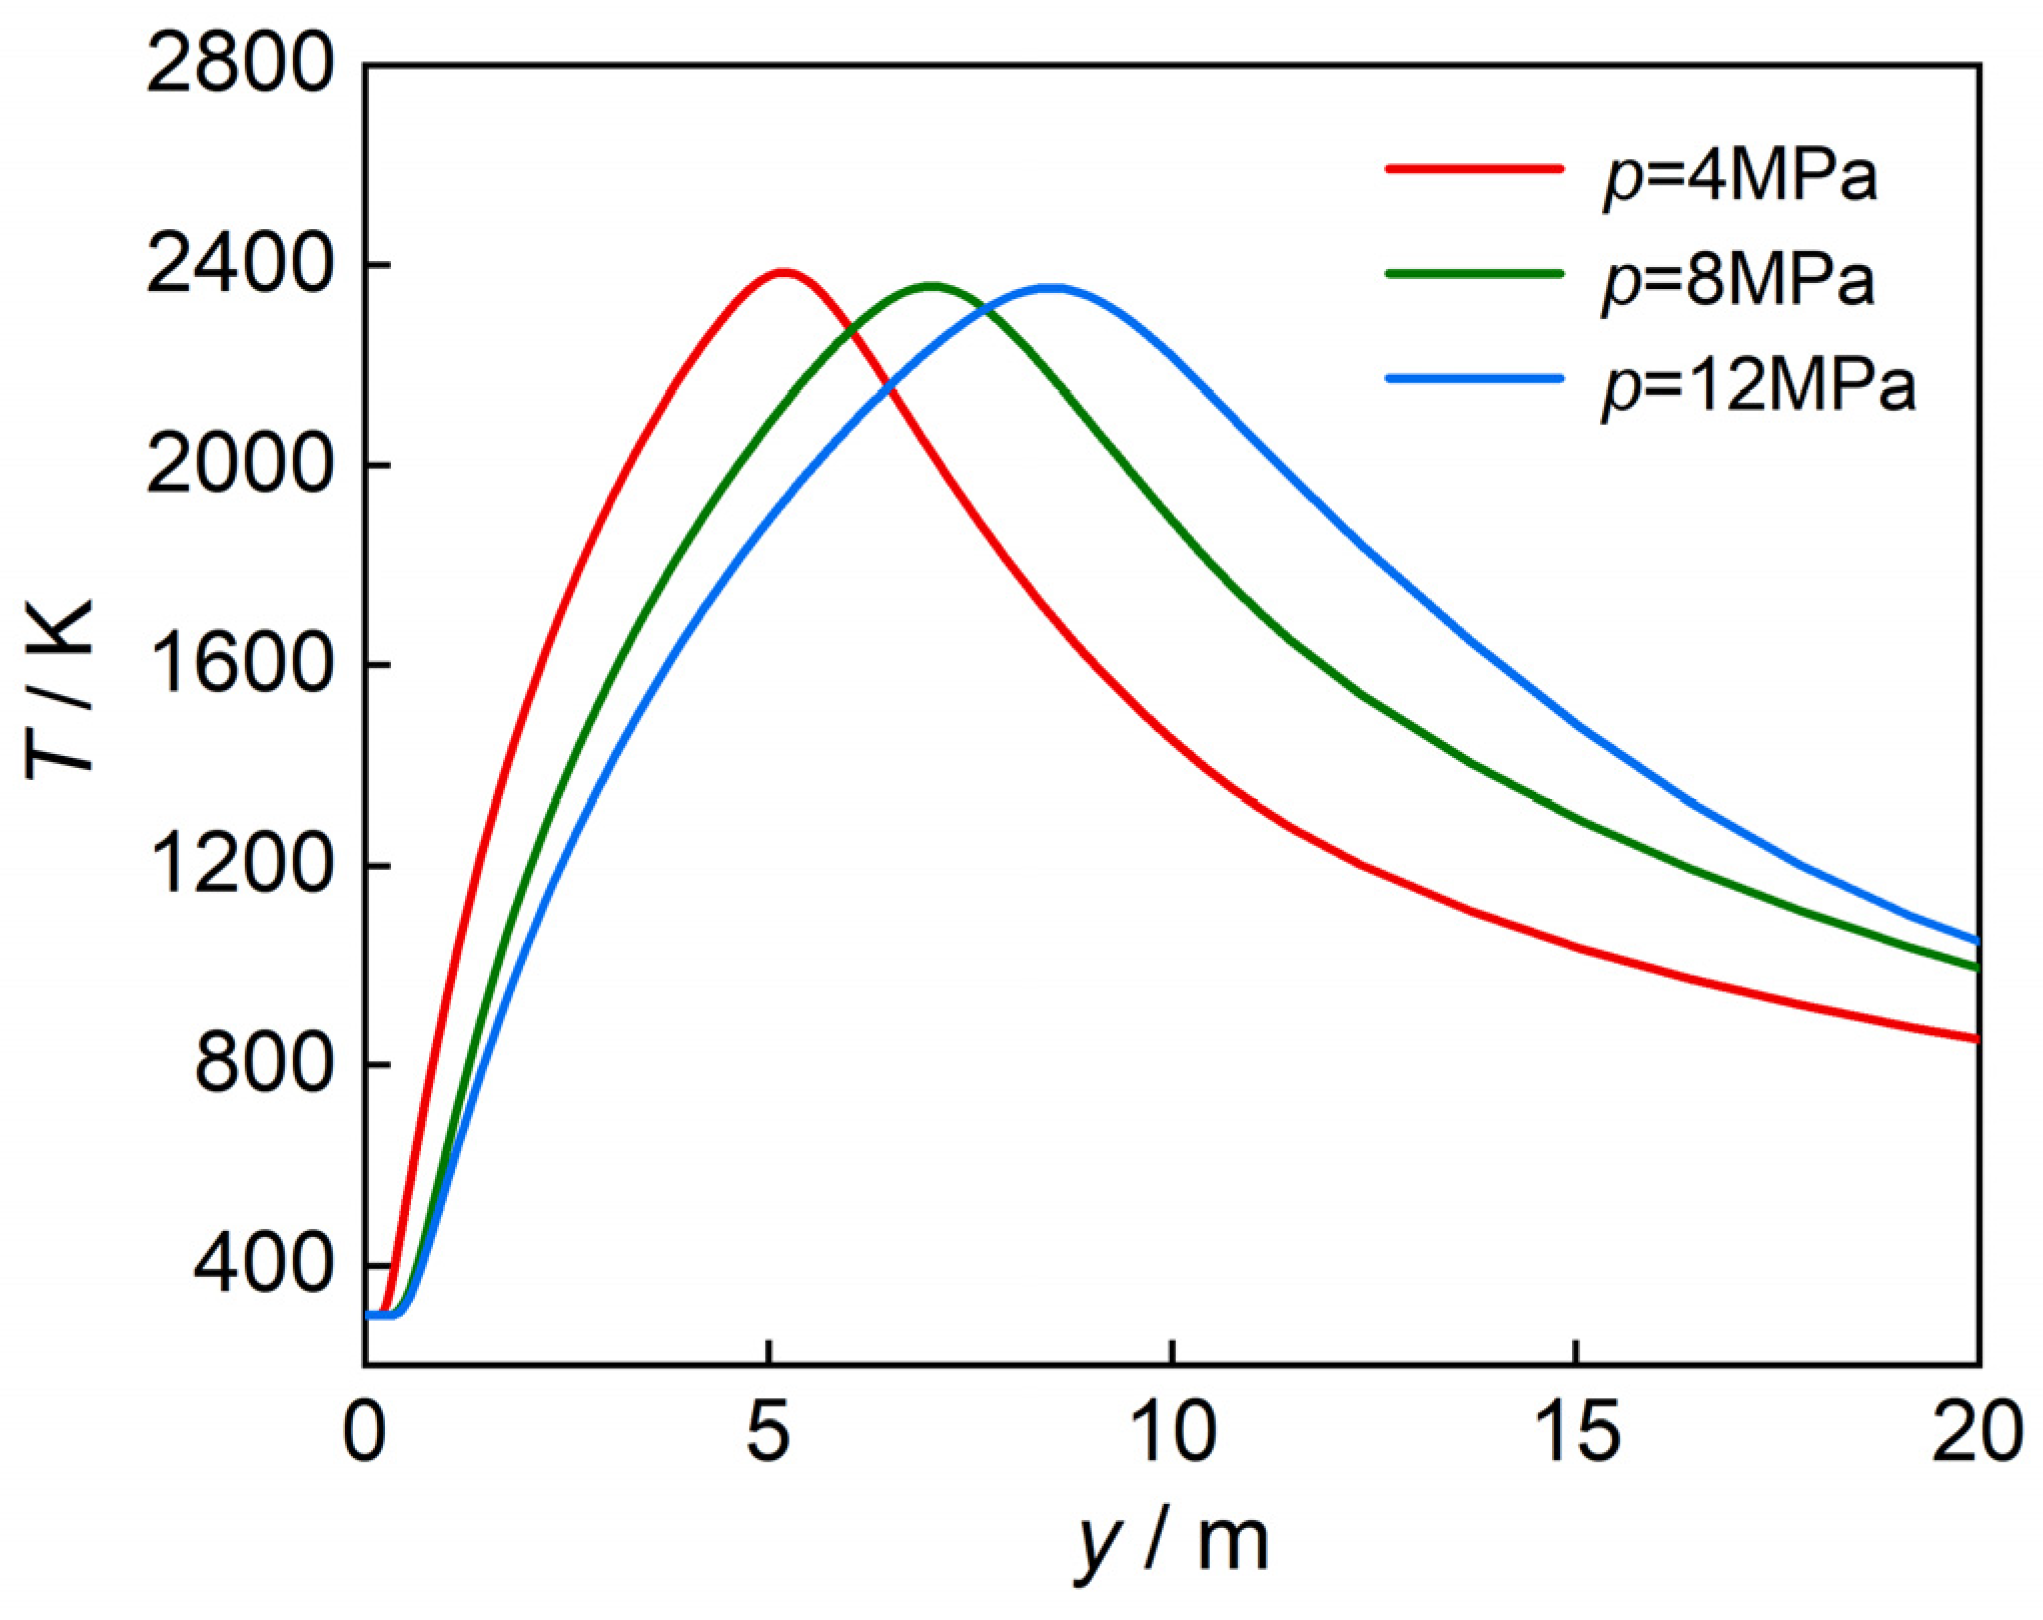
4.4.1. Effect of Leakage Pressure

For the leakage diameter of 10 mm, the thermal radiation data in the y-direction and x-direction (y = 2 m plane) were extracted at the leakage pressures of 4 MPa, 8 MPa, and 12 MPa, as shown in Figure 9.
Figure 9a shows that at the flame height of 2 m, as the leakage pressure increases, the maximum thermal radiation also increases. This increase is more pronounced when the pressure increases from 8 MPa to 12 MPa. Figure 9b shows that in the y-direction, the thermal radiation also increases with the increase in the leakage pressure, and similar behavior can be observed in that the increment is more significant at a higher pressure of 12 MPa. Additionally, along the flame axis, the thermal radiation increases first and then decreases. The position of the peak thermal radiation along the flame axis shifts to a higher flame height with increasing leakage pressure, consistent with the experimental observations.
Figure 10 shows the temperature distribution along the flame axis in the y-direction for the three pressure conditions. It is seen that the hydrogen jet flames have close values of the maximum temperatures under different pressures, indicating that the maximum flame temperature is independent of the pipeline pressure. As the pipeline pressure increases, the flame axis position corresponding to the highest temperature also increases. This is influenced by the hydrogen leakage rate. That is, when the hydrogen leakage rate increases, more oxygen is required for the reaction, leading to a longer flame length. Comparing the temperature and thermal radiation data in the y-direction, it is found that the high-temperature and high-radiation heat flux density regions tend to overlap, indicating a significant influence of temperature on thermal radiation release.

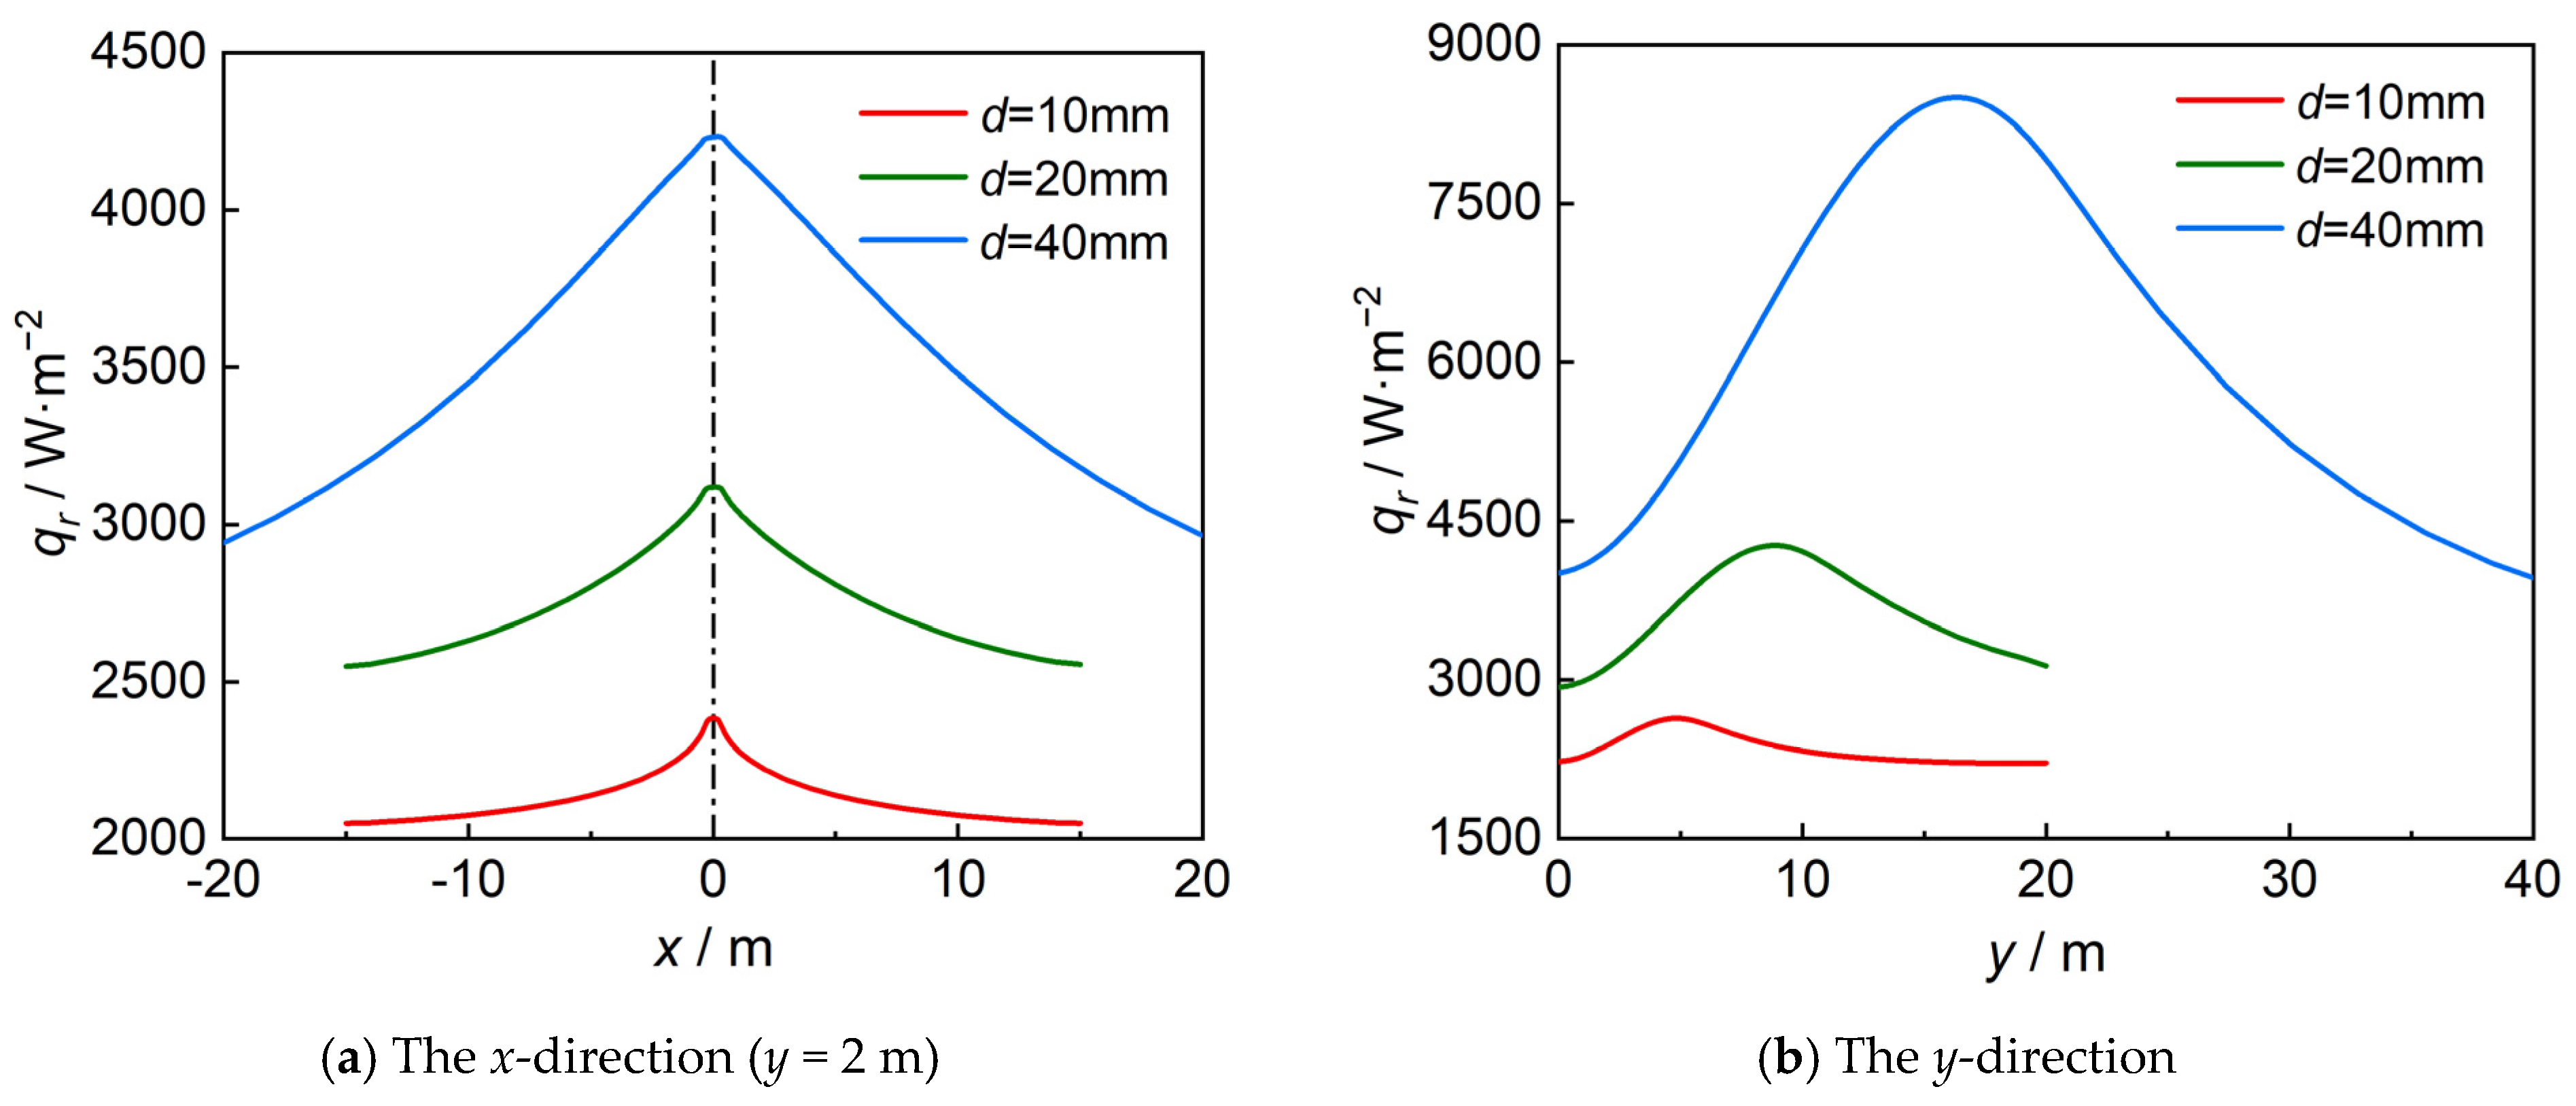
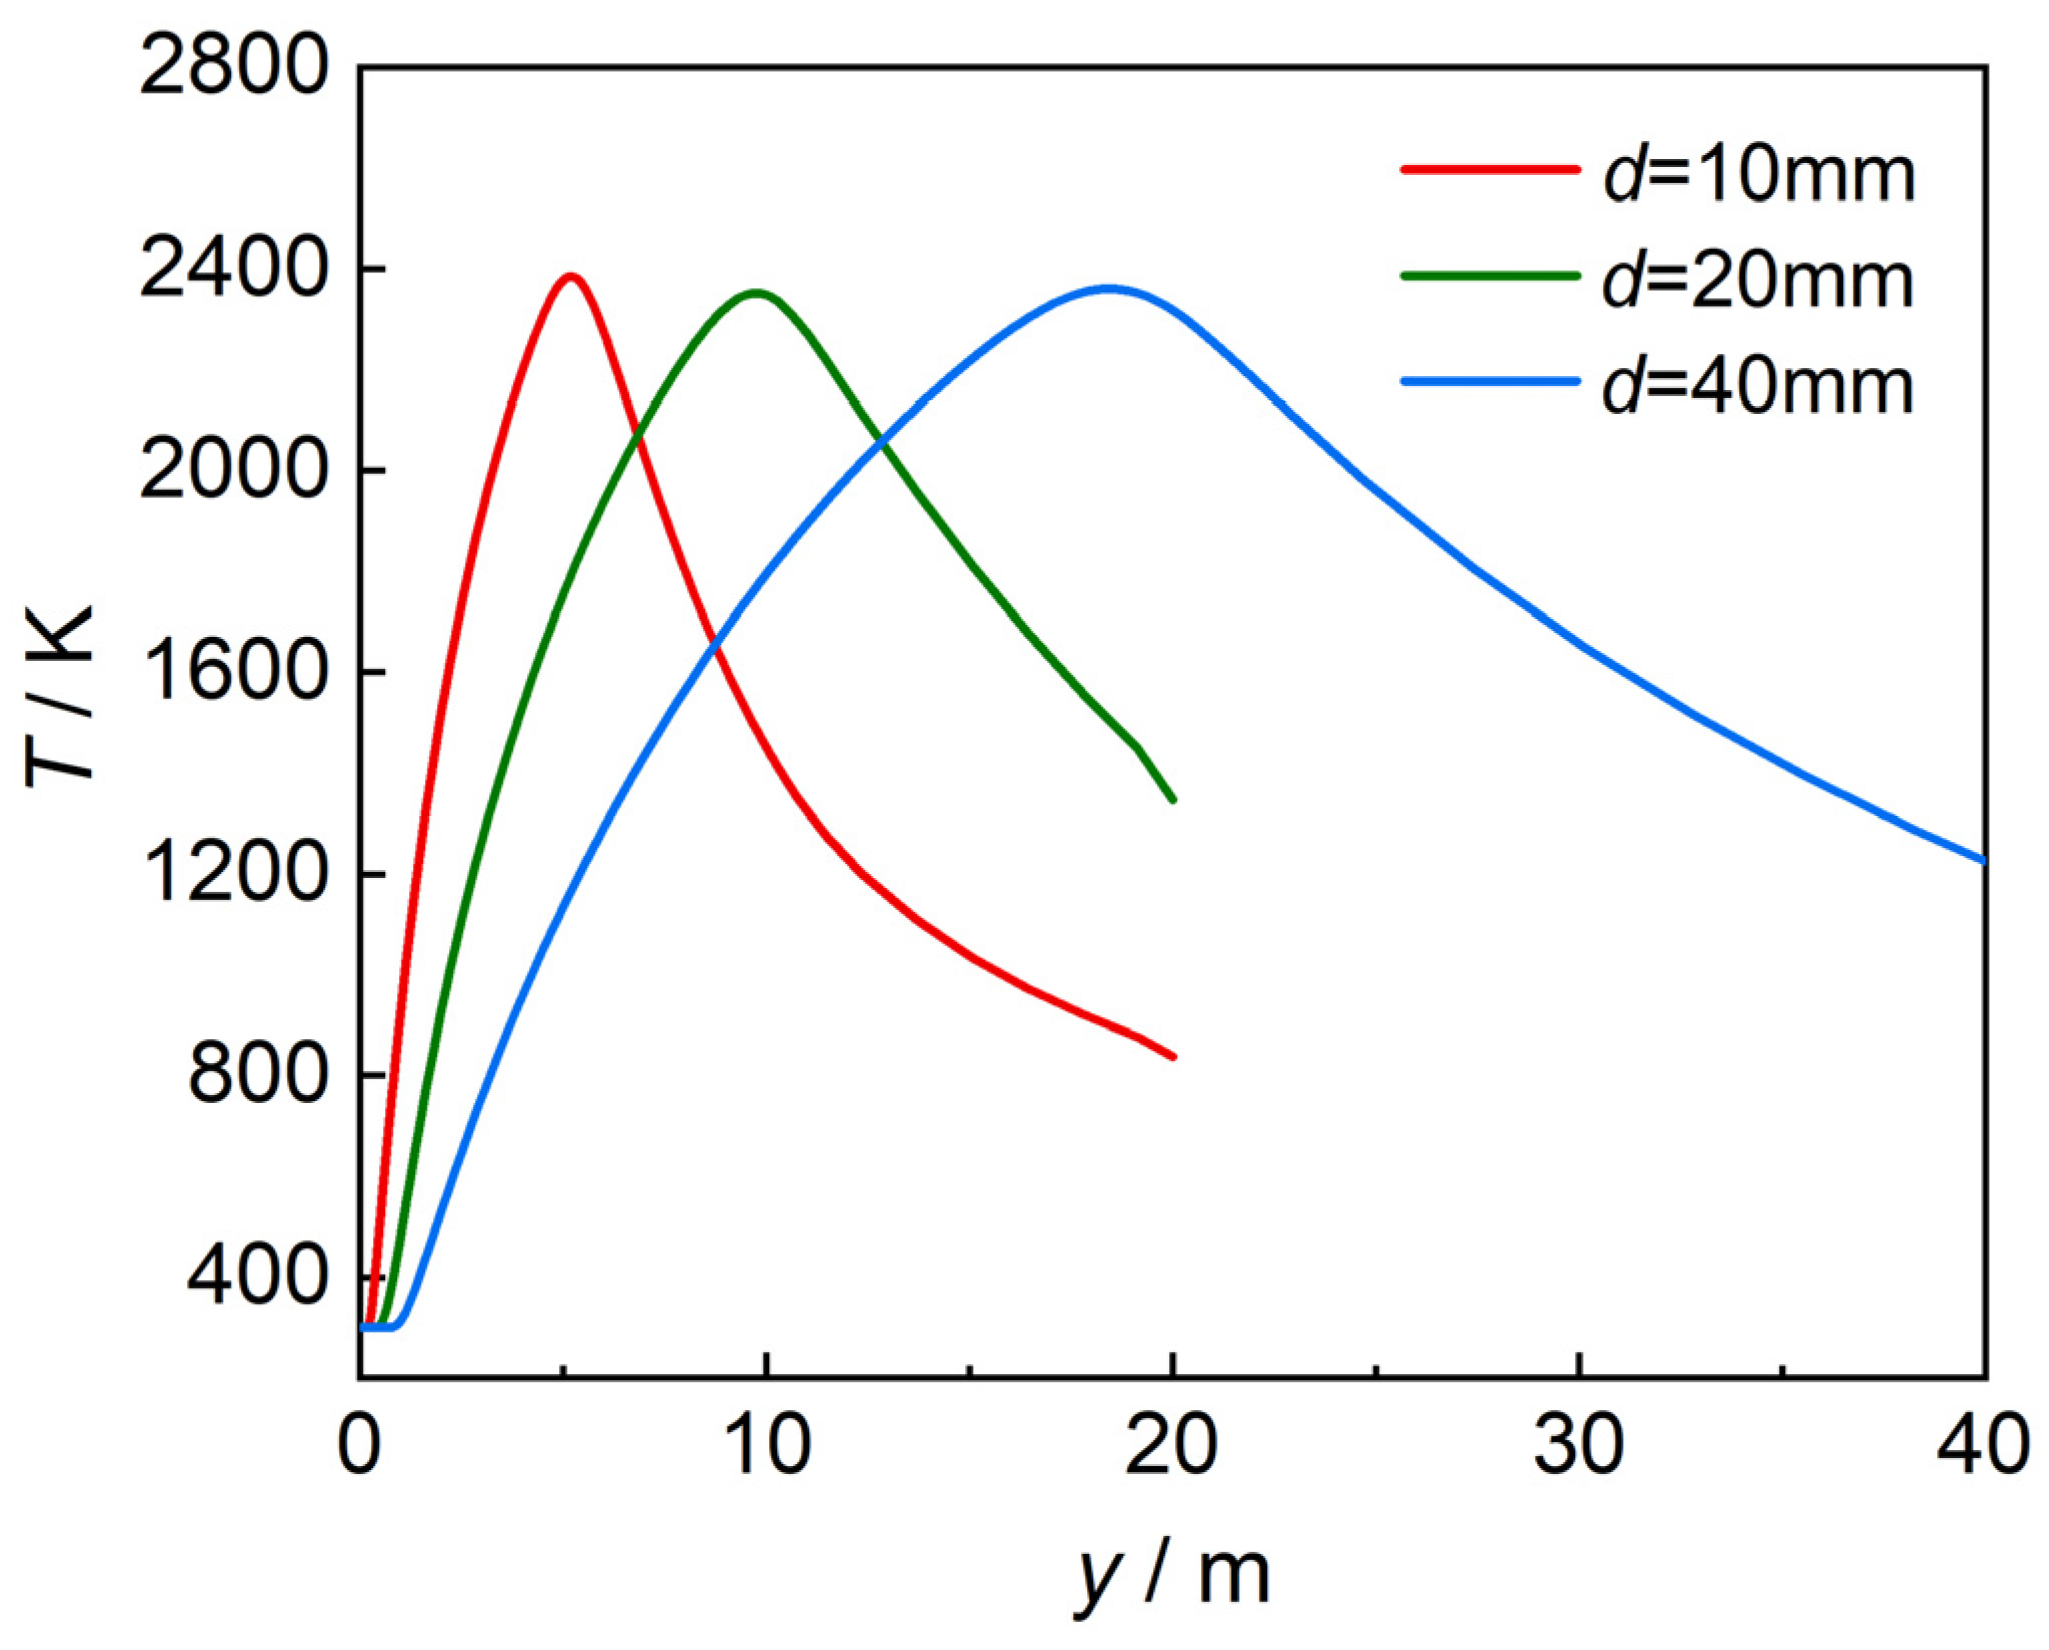
4.4.2. Effect of Leakage Diameter

Jet fires were simulated at the leakage pressure of 4 MPa and leakage diameters of 10 mm, 20 mm, and 40 mm. The thermal radiation data along the flame axis in the y-direction and x-direction (y = 2 m plane) were extracted and plotted as shown in Figure 11. The temperature distribution along the flame axis in the y-direction is depicted in Figure 12. Figure 11a shows that as the leakage diameter increases, the thermal radiation intensity in the x-direction also significantly increases. However, at the position far from the flame axis, the thermal radiation release is decreased. Similar behavior is observed under the conditions of the three leakage diameters. Hydrogen jet fire with a large leakage diameter significantly expands the impact range of thermal radiation. Figure 11b shows that as the leakage diameter increases, the thermal radiation intensity in the y-direction significantly increases, and the flame height at which the maximum thermal radiation occurs also increases. Additionally, comparing the thermal radiation data under different leakage diameters, it is found that the thermal radiation intensity increases more rapidly with the increasing leakage diameter, which is consistent with the experimental findings discussed earlier.
Figure 12 shows the temperature distribution along the flame axis in the y-direction. The maximum temperature of the hydrogen jet flame does not significantly change with the increase in the leakage diameter, while its corresponding height obviously moves upward. Comparing the results of the thermal radiation and temperature distributions, it is found that regions with high temperatures have higher thermal radiation intensities. The above analysis indicates that temperature is a critical factor affecting thermal radiation release.

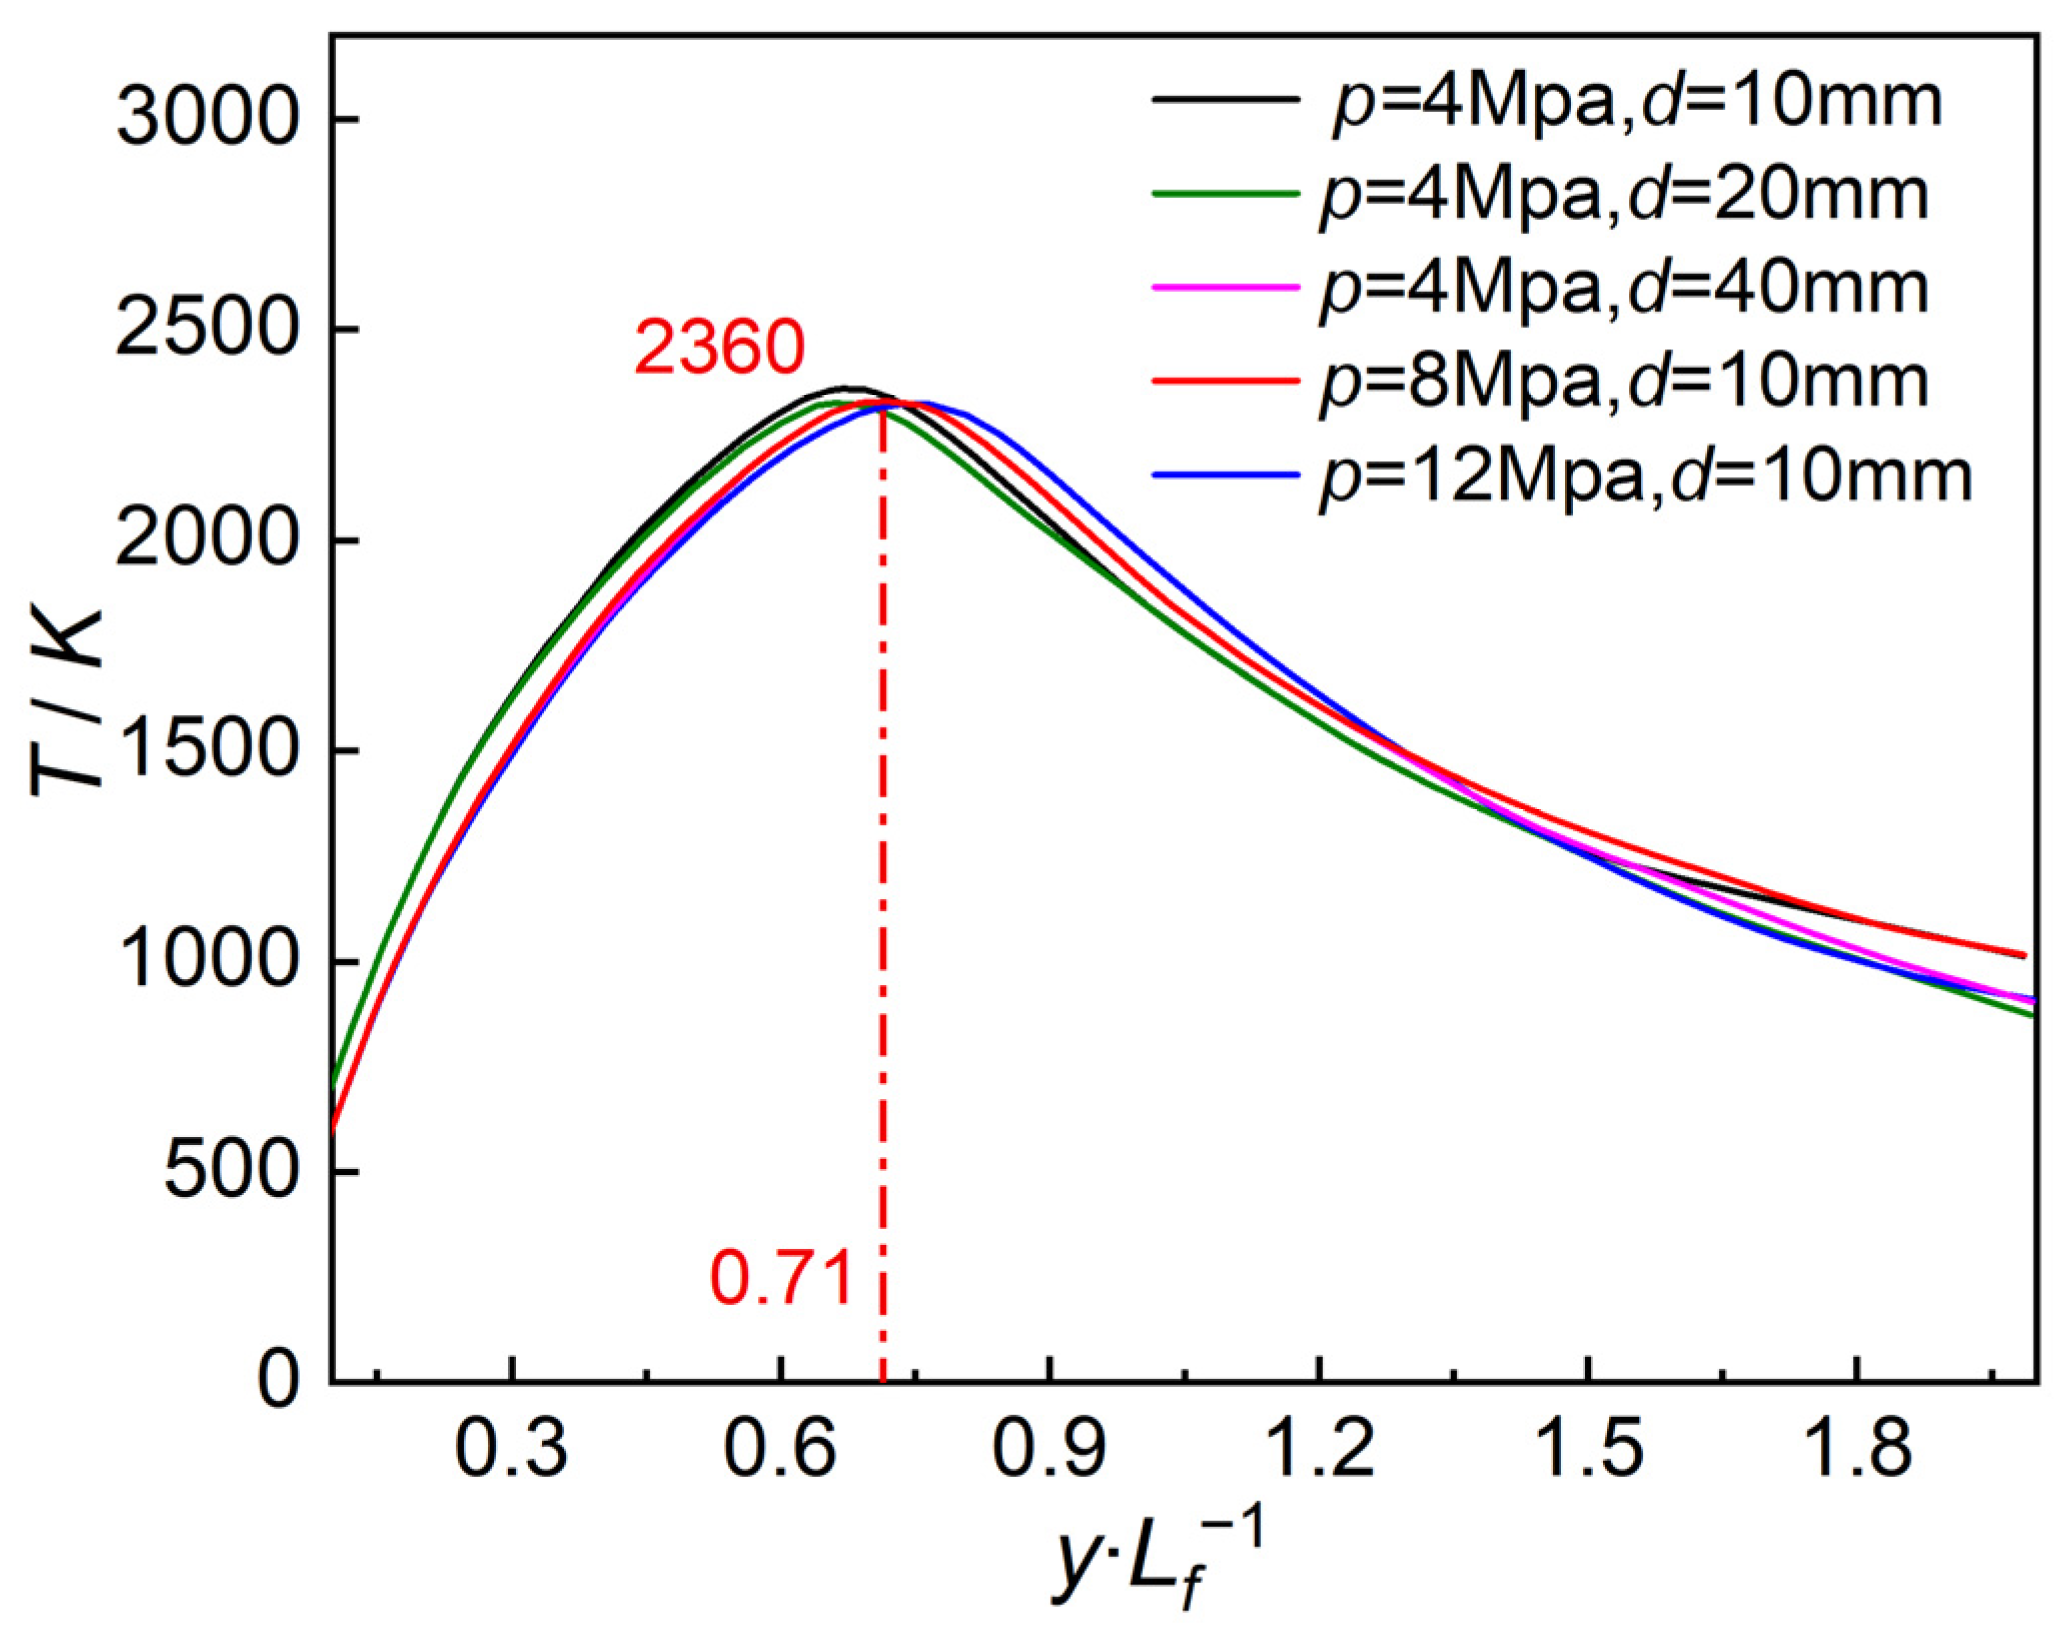
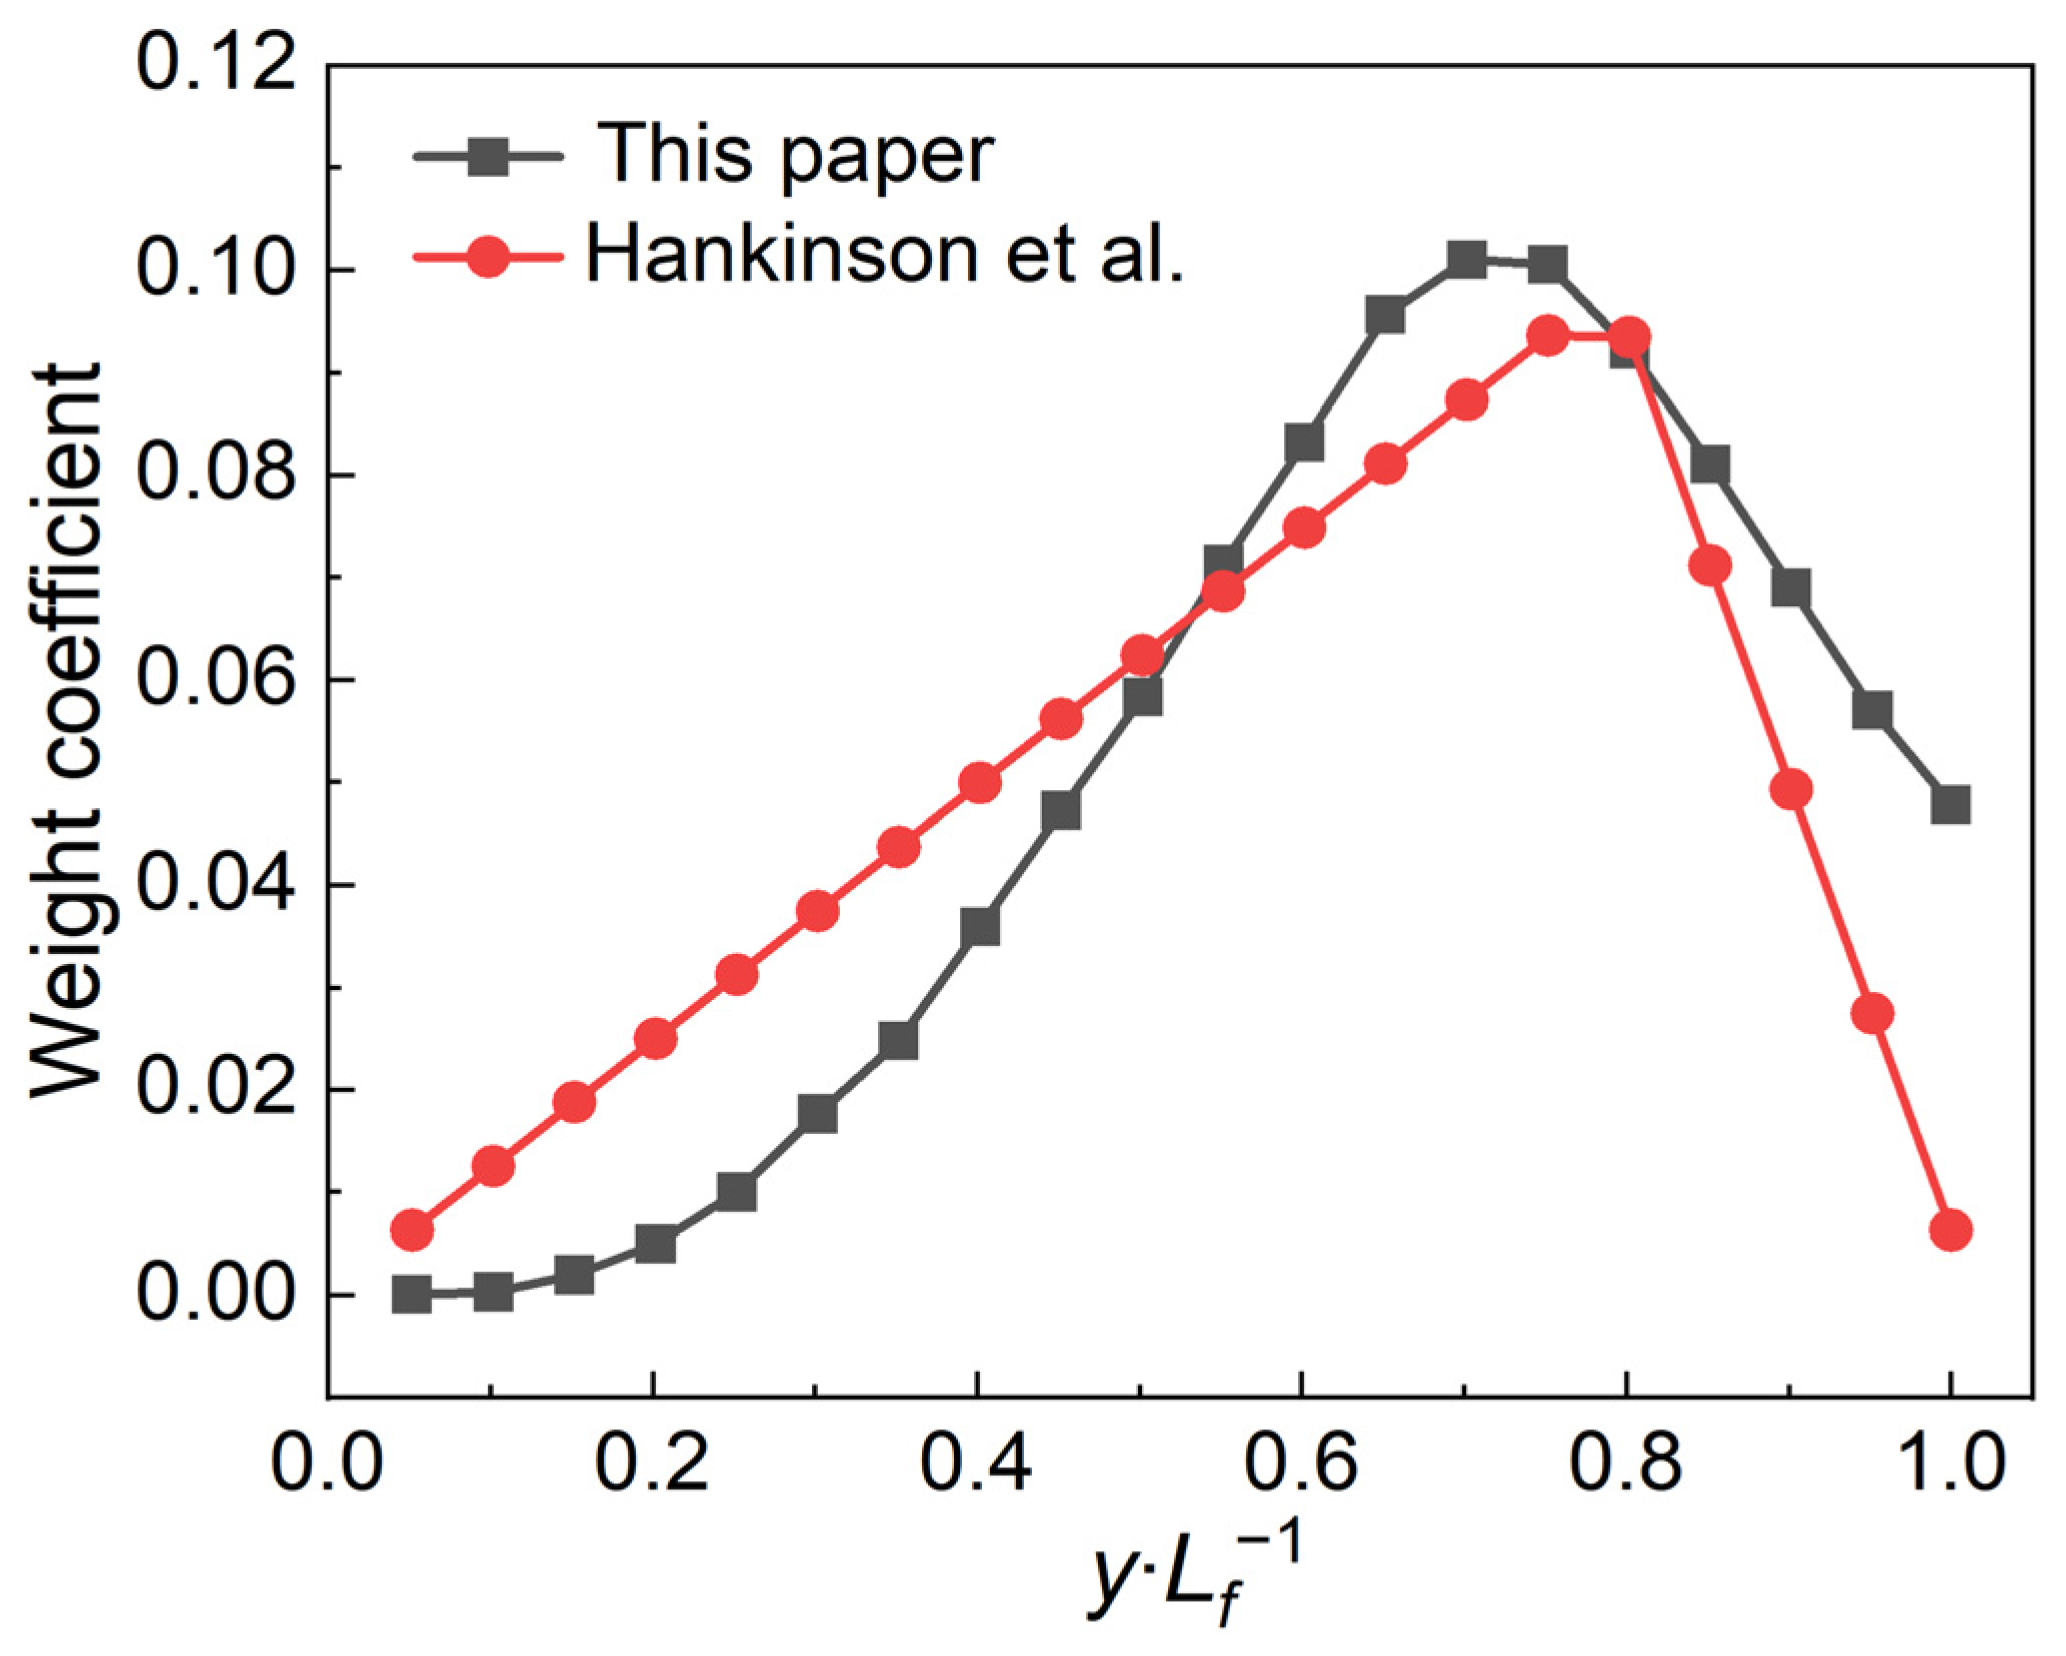
4.5. Optimization of Thermal Radiation Prediction Model

The above analysis shows that the flame temperature significantly affects the thermal radiation release of the flame. The details of the weight coefficient optimization based on the temperature distribution along the flame axis are presented in Section 3.7. The temperature distribution along the y-axis of jet fires under different conditions is illustrated in Figure 13. It is evident that the temperature distribution follows a similar pattern across various conditions. Starting from the nozzle, the temperature along the flame’s vertical axis initially rises and then falls, increasing from the initial temperature of hydrogen to the peak value of approximately 2300 K. The flame temperature at different points along the axis shows minimal variation under different conditions, with the highest flame temperature consistently occurring at about 0.71 y · L f 1 . This pattern has been corroborated by experimental data [35]. Consequently, the thermal source weight coefficient in the thermal radiation prediction model can be optimized based on the temperature distribution along the jet flame axis. Figure 14 presents a comparison between the optimized and non-optimized weight coefficients.
Utilizing the thermal radiation prediction model optimized by the flame axis temperature distribution, the thermal radiation of the hydrogen jet fire under the same experimental conditions of this study was predicted. Table 2 compares the experimental and predicted thermal radiation values of the jet flame. As shown in Table 2, the optimized thermal radiation model achieves a better predictive performance at lower flame heights. Specifically, compared with the thermal radiation predictions at a height of 0.75 m, the model’s predictions at the 0.25 m and 0.5 m flame heights are closer to the experimental measurements.
To more clearly illustrate the predictive effectiveness of the optimized model, the errors between the model predictions and experimental measurements under different conditions were calculated, as shown in Figure 15. In Figure 15, the horizontal axis represents the conditions sequentially numbered as in Table 2. It is observed that the thermal radiation prediction model performs satisfactorily at lower flame heights. For a flame height of 0.25 m, the minimum prediction error obtained is 2.52%, with an average error of 14.09%. At the height of 0.5 m, the minimum error is 2.05%, and the average error is 15.36%. However, at a height of 0.75 m, the minimum prediction error is only 18.57%, while the average error is 47.06%. Therefore, the thermal radiation prediction model close to the flame tip requires more factors to be considered.
The accuracy of the current multi-point source thermal radiation model is inevitably constrained by the flame shape, resulting in certain prediction errors. At higher flame heights, the model predictions exhibit relatively larger errors. This discrepancy is probably due to the pronounced increase in oscillatory phenomena at higher flame positions. When hydrogen is released at high pressures from the leakage hole, the initial jet kinetic energy and turbulent Reynolds number are significantly higher, leading to noticeable oscillations in the flame. These oscillations cause the flame tip to move irregularly, leading to a quite unstable flame tip and, thus, higher uncertainty in the experimental measurements of the thermal radiation. Consequently, substantial deviations in radiation predictions could be generated at higher flame positions. Furthermore, in the near-field range of the flame, the influence of the flame width cannot be neglected. Therefore, modeling the jet flame as several thermal source points distributed along the flame axis lines inevitably introduces certain errors.
Furthermore, to demonstrate the effectiveness and accuracy of the present optimized thermal radiation prediction model, we compared the predictions of our optimized model with those from the original thermal radiation prediction model against experimental jet fire results [12]. Under the six comparative conditions, the leakage diameters range from 4.2 mm to 6.4 mm, with leakage pressures varying between several tens of MPa. The radial measurement positions range from a 2.9 m to 30.5 m distance to the flame axis. Table 3 presents the comparative predictive performance under different conditions. In this table, the prediction data from our optimized model are denoted as qmod,new, while the prediction data from the model of Hankinson et al. [25] are denoted as qmod,old. As shown in Table 3, the predictions of the present optimized model are generally closer to the experimental values, indicating a higher predictive accuracy.
Additionally, the prediction errors of the two thermal radiation models under different conditions are compared and presented in Figure 16. It is observed that the optimized model proposed in this study exhibits an overall better predictive performance. For the six experimental conditions, the minimum error of the optimized model in this study is 5.6%, and the maximum error does not exceed 21.7%. The average error of the optimized model across the six conditions is 13.9%, which is an improvement over the 19.5% average error of the old model.
The optimized multi-point source model demonstrated a better predictive performance. This improvement is mainly attributed to the current study not retaining the simplified assumptions of the original model that the weight coefficients increase linearly along the axis and then decrease linearly. Instead, the influence of flame temperature on thermal radiation release was fully considered. As shown in Figure 14, the weight coefficients slowly change at first from the flame bottom and then rapidly increase. The weight coefficients reach the maximum value at approximately 72% of the flame length, which is close to the 75% flame length observed in the original model. It can be seen that, compared with the simplified linear variation, considering the variation in the flame temperature along the axis makes the weight coefficient calculations in the model more accurately reflect the real situation. This approach significantly improves the accuracy of the multi-point source prediction model.

5. Conclusions

To address the current limitations in accurately predicting the thermal radiation from hydrogen jet fires under complex conditions, this study utilized CFD simulations to optimize the discrete weight coefficients in the multi-point source radiation model. This optimization enhanced the accuracy of the model for predicting the thermal radiation in hydrogen jet fires. Additionally, experimental investigations were conducted to examine the variations in the thermal radiation and flame dimensions under different leakage pressures, orifice diameters, and radial distances. The experimental data were used to validate and compare the performance of the optimized thermal radiation prediction model. The main conclusions are as follows.
  • The study of the hydrogen jet flame dimensions indicated that both the flame length and width increase with higher leakage pressures and diameters. The flame length prediction model based on the Froude number is particularly suitable for medium–high-pressure hydrogen jet fires. The flame shapes under different leakage pressures and diameters exhibited a certain degree of similarity, with the ratio coefficient of the flame length to width being 5.819.
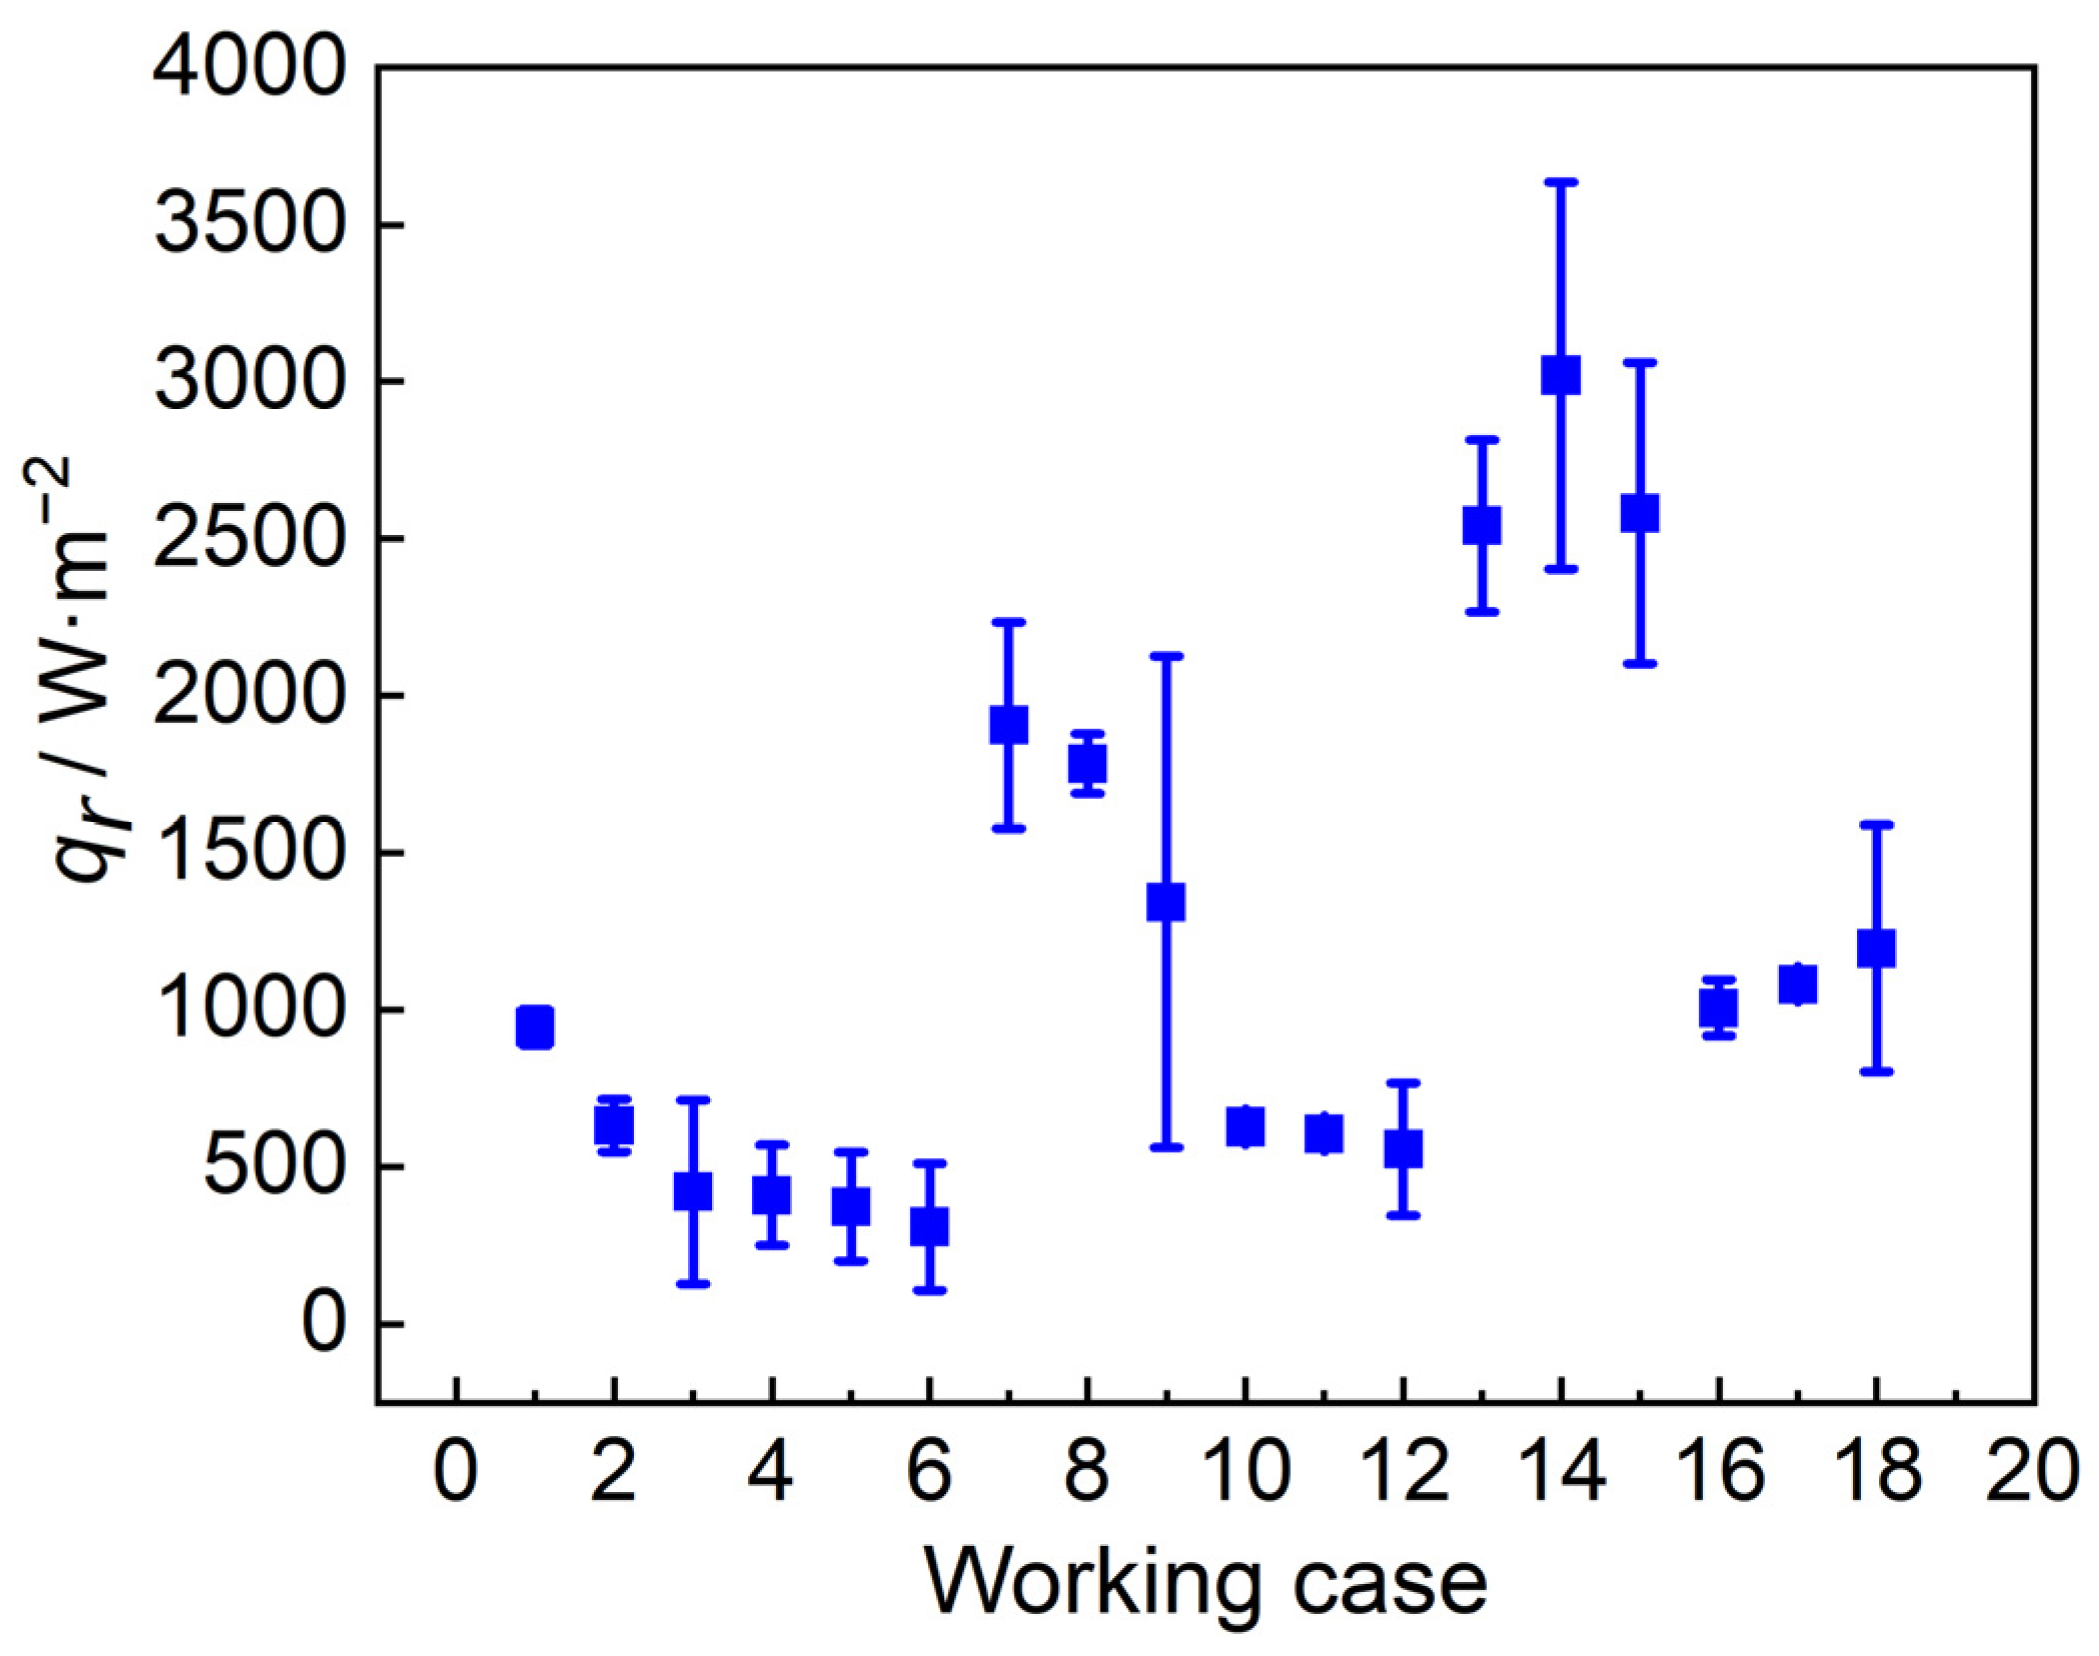
  • The thermal radiation density significantly decreased with increasing radial distance and height. The thermal radiation at various spatial positions was influenced by flame oscillations and showed an approximately linear increase with a rising leakage pressure and diameter. Additionally, increased leakage pressures and diameters elevated the flame height corresponding to the maximum thermal radiation.
  • Optimizing the heat source weight coefficients based on the flame axis temperature distribution significantly reduced the prediction error of the multi-point source radiation model by 5.6%. In six comparative scenarios, the average prediction error of the optimized model was 13.9%, compared with 19.5% for the original model, demonstrating a higher predictive accuracy.

Author Contributions

Conceptualization, H.Z. and X.C.; methodology, H.Z. and X.Y.; software, J.W.; validation, X.C. and Y.Z.; formal analysis, X.Y.; investigation, X.C.; resources, F.W.; data curation, H.Z.; writing—original draft preparation, H.Z.; writing—review and editing, Q.L. and H.L.; supervision, Z.H.; project administration, F.W.; funding acquisition, Q.L. and Z.H. All authors have read and agreed to the published version of the manuscript.

Funding

This work was supported by the Science and Technology Plan Program of Yulin (CXY-2021-119), the Natural Science Basic Research Program of Shaanxi Province (2020JM-053), and the China Petroleum Pipeline Engineering Corporation.

Data Availability Statement

The data presented in this study are available upon request from the corresponding author (Q.L.).

Conflicts of Interest

The authors declare that they have no known competing financial interests or personal relationships that could have appeared to influence the work reported in this paper. Author Fengrong Wu was employed by the company China Petroleum Pipeline Engineering Corporation, who provided funding and technical support for the work. The funder had no role in the design of the study; in the collection, analysis, or interpretation of data, in the writing of the manuscript, or in the decision to publish the results.

References

  1. Sadeq, A.M.; Homod, R.Z.; Hussein, A.K.; Togun, H.; Mahmoodi, A.; Isleem, H.F.; Patil, A.R.; Moghaddam, A.H. Hydrogen energy systems: Technologies, trends, and future prospects. Sci. Total Environ. 2024, 939, 173622. [Google Scholar] [CrossRef] [PubMed]
  2. Sikiru, S.; Oladosu, T.L.; Amosa, T.I.; Olutoki, J.O.; Ansari, M.N.M.; Abioye, K.J.; Rehman, Z.U.; Soleimani, H. Hydrogen-powered horizons: Transformative technologies in clean energy generation, distribution, and storage for sustainable innovation. Int. J. Hydrogen Energy 2024, 56, 1152–1182. [Google Scholar] [CrossRef]
  3. Kummer, J.-R.; Essmann, S.; Markus, D.; Grosshans, H.; Maas, U. Assessing ignitions of explosive gas mixtures by low-energetic electrical discharges using OH-LIF and 1D-simulations. Combust. Sci. Technol. 2021, 195, 1–23. [Google Scholar] [CrossRef]
  4. Yang, R.; Schell, C.A.; Ruiz-Tagle, A.; Grabovetska, V.; Gupta, A.J.; Groth, K.M. Research gaps in quantitative risk assessment (QRA) of hydrogen transmission pipelines. Int. J. Hydrogen Energy 2024, 71, 916–929. [Google Scholar] [CrossRef]
  5. Weis, C.; Martin Sentko, M.; Stelzner, B.; Habisreuther, P.; Zarzalis, N.; Trimis, D. Experimental and numerical investigations of the laminar burning velocities of premixed fuel-rich methane oxy-fuel and oxygen-enhanced flames. Fuel 2024, 368, 131601. [Google Scholar] [CrossRef]
  6. Sun, B.; Zhao, H.; Dong, X.; Teng, C.; Zhang, A.; Kong, S.; Zhou, J.; Zhang, X.-C.; Tu, S.-T. Current challenges in the utilization of hydrogen energy-a focused review on the issue of hydrogen-induced damage and embrittlement. Adv. Appl. Energy 2024, 14, 100168. [Google Scholar] [CrossRef]
  7. Palacios, A.; Muñoz, M.; Darbra, R.M.; Casal, J. Thermal radiation from vertical jet fires. Fire Saf. J. 2012, 51, 93–101. [Google Scholar] [CrossRef]
  8. Ivanytskyi, Y.; Blikharskyy, Y.; Sęp, J.; Blikharskyy, Z.; Selejdak, J.; Holiian, O. Evaluation of the Technical Condition of Pipes during the Transportation of Hydrogen Mixtures According to the Energy Approach. Appl. Sci. 2024, 14, 5040. [Google Scholar] [CrossRef]
  9. Yang, N.; Deng, J.; Wang, C.; Bai, Z.; Qu, J. High pressure hydrogen leakage diffusion: Research progress. Int. J. Hydrogen Energy 2024, 50, 1029–1046. [Google Scholar] [CrossRef]
  10. Delichatsios, M.A. Transition from Momentum to Buoyancy-Controlled Turbulent Jet Diffusion Flames and Flame Height Relationships. Combust. Flame 1993, 92, 349–364. [Google Scholar] [CrossRef]
  11. Schefer, R.; Houf, W.; Bourne, B.; Colton, J. Spatial and radiative properties of an open-flame hydrogen plume. Int. J. Hydrogen Energy 2006, 31, 1332–1340. [Google Scholar] [CrossRef]
  12. Schefer, R.W.; Houf, W.G.; Williams, T.C.; Bourne, B.; Colton, J. Characterization of high-pressure, underexpanded hydrogen-jet flames. Int. J. Hydrogen Energy 2007, 32, 2081–2093. [Google Scholar] [CrossRef]
  13. Mogi, T.; Horiguchi, S. Experimental study on the hazards of high-pressure hydrogen jet diffusion flames. J. Loss Prev. Process Ind. 2009, 22, 45–51. [Google Scholar] [CrossRef]
  14. Molkov, V.; Saffers, J.-B. Hydrogen jet flames. Int. J. Hydrogen Energy 2013, 38, 8141–8158. [Google Scholar] [CrossRef]
  15. Liu, J.-Y.; Fan, Y.-Q.; Zhou, K.-B.; Jiang, J.-C. Prediction of Flame Length of Horizontal Hydrogen Jet Fire during High-pressure Leakage Process. Procedia Eng. 2018, 211, 471–478. [Google Scholar] [CrossRef]
  16. Gong, L.; Mo, T.; Han, Y.; Zheng, X.; Yang, S.; Yao, Y.; Zhang, Y. Experimental investigation on the behaviors and temperature distribution of cryogenic hydrogen jet flames. Int. J. Hydrogen Energy 2024, 50, 1062–1074. [Google Scholar] [CrossRef]
  17. Cirrone, D.; Makarov, D.; Kuznetsov, M.; Friedrich, A.; Molkov, V. Effect of heat transfer through the release pipe on simulations of cryogenic hydrogen jet fires and hazard distances. Int. J. Hydrogen Energy 2022, 47, 21596–21611. [Google Scholar] [CrossRef]
  18. Cirrone, D.M.C.; Makarov, D.; Molkov, V. Thermal radiation from cryogenic hydrogen jet fires. Int. J. Hydrogen Energy 2019, 44, 8874–8885. [Google Scholar] [CrossRef]
  19. Cirrone, D.M.C.; Makarov, D.; Molkov, V. Simulation of thermal hazards from hydrogen under-expanded jet fire. Int. J. Hydrogen Energy 2019, 44, 8886–8892. [Google Scholar] [CrossRef]
  20. Proust, C.; Jamois, D.; Studer, E. High pressure hydrogen fires. Int. J. Hydrogen Energy 2011, 36, 2367–2373. [Google Scholar] [CrossRef]
  21. Choi, S.Y.; Oh, C.B.; Do, K.H.; Choi, B.-I. A Computational Study of Hydrogen Dispersion and Explosion after Large-Scale Leakage of Liquid Hydrogen. Appl. Sci. 2023, 13, 12838. [Google Scholar] [CrossRef]
  22. Mashhadimoslem, H.; Ghaemi, A.; Palacios, A.; Hossein Behroozi, A. A new method for comparison thermal radiation on large-scale hydrogen and propane jet fires based on experimental and computational studies. Fuel 2020, 282, 118864. [Google Scholar] [CrossRef]
  23. Jang, C.B.; Jung, S. Numerical computation of a large-scale jet fire of high-pressure hydrogen in process plant. Energy Sci. Eng. 2016, 4, 406–417. [Google Scholar] [CrossRef]
  24. Panda, P.P.; Hecht, E.S. Ignition and flame characteristics of cryogenic hydrogen releases. Int. J. Hydrogen Energy 2017, 42, 775–785. [Google Scholar] [CrossRef]
  25. Hankinson, G.; Lowesmith, B.J. A consideration of methods of determining the radiative characteristics of jet fires. Combust. Flame 2012, 159, 1165–1177. [Google Scholar] [CrossRef]
  26. Baillie, S.; Caulfield, M.; Cook, D.K.; Docherty, P. A Phenomenological Model for Predicting the Thermal Loading to a Cylindrical Vessel Impacted by High Pressure Natural Gas Jet Fires. Process Saf. Environ. Prot. 1998, 76, 3–13. [Google Scholar] [CrossRef]
  27. Kong, Y.; Li, Y.; Wang, S.; Duan, P.; Zhu, J.; Han, H.; Han, J. Large-scale experimental study on jet flame length of hydrogen-blended natural gas and inverse methods for optimizing the weighted multi-point source model. Fuel 2024, 367, 131434. [Google Scholar] [CrossRef]
  28. Peng, Y.; Fu, G.; Sun, B.; Sun, X.; Wang, J.; Chen, J. Well blowout Flame’s thermal radiation prediction under environmental wind based on multi-point heat sources and inverse analysis. Geoenergy Sci. Eng. 2024, 234, 212609. [Google Scholar] [CrossRef]
  29. Park, K.-W.; Mizuno, M.; Cho, C.-G.; Jeong, J.-J. Estimation of Thermal Radiation in Bed Mattresses. Appl. Sci. 2022, 12, 11099. [Google Scholar] [CrossRef]
  30. Ekoto, I.W.; Ruggles, A.J.; Creitz, L.W.; Li, J.X. Updated jet flame radiation modeling with buoyancy corrections. Int. J. Hydrogen Energy 2014, 39, 20570–20577. [Google Scholar] [CrossRef]
  31. Li, X.; Hao, Y.; Wu, F.; Xing, Z.; Zhuang, S.; Wang, X. Numerical simulation of leakage jet flame hazard of high-pressure hydrogen storage bottle in open space. Int. J. Hydrogen Energy 2024, 62, 706–721. [Google Scholar] [CrossRef]
  32. Zhou, N. Simulation Study on Small Hole Leakage Accident of Hydrogen Transmission Pipeline. Master’s Thesis, South China University of Technology, Guangzhou, China, 2022. [Google Scholar]
  33. Lowesmith, B.J.; Hankinson, G. Large scale high pressure jet fires involving natural gas and natural gas/hydrogen mixtures. Process Saf. Environ. Prot. 2012, 90, 108–120. [Google Scholar] [CrossRef]
  34. Froeling, H.A.J.; Dröge, M.T.; Nane, G.F.; Van Wijk, A.J.M. Quantitative risk analysis of a hazardous jet fire event for hydrogen transport in natural gas transmission pipelines. Int. J. Hydrogen Energy 2021, 46, 10411–10422. [Google Scholar] [CrossRef]
  35. Cumber, P.S. Validation study of a turbulence radiation interaction model: Weak, intermediate and strong TRI in jet flames. Int. J. Heat Mass Transf. 2014, 79, 1034–1047. [Google Scholar] [CrossRef]
Figure 1. Schematic diagram of the experimental setup.
Applsci 14 07098 g001
Figure 2. Images of hydrogen jet fire.
Applsci 14 07098 g002
Figure 3. Hydrogen jet fire simulation grid.
Applsci 14 07098 g003
Figure 4. Temperature distribution in y-direction calculated by different grid sizes.
Applsci 14 07098 g004
Figure 5. Temperature and product distributions in xy-plane.
Applsci 14 07098 g005
Figure 6. Temperature and OH concentration in y-direction of hydrogen jet fire.
Applsci 14 07098 g006
Figure 7. Variations in flame shape parameters under various leakage conditions.
Applsci 14 07098 g007
Figure 8. Variation in flame thermal radiation with different parameters.
Applsci 14 07098 g008aApplsci 14 07098 g008b
Figure 9. Thermal radiation distributions in x- and y-directions for various leakage pressures.
Applsci 14 07098 g009
Figure 10. Flame temperature variations in y-direction under various leakage pressures.
Applsci 14 07098 g010
Figure 11. Thermal radiation distributions in x- and y-directions under different leakage diameters.
Applsci 14 07098 g011
Figure 12. Temperature distributions along the jet fire axis under different leakage diameters.
Applsci 14 07098 g012
Figure 13. The temperature distributions along the flame axis under different conditions.
Applsci 14 07098 g013
Figure 14. Diagram of weighting coefficient distributions [25].
Applsci 14 07098 g014
Figure 15. Error rate between experimental measurements and model predictions.
Applsci 14 07098 g015
Figure 16. Comparison of new and old models for flame thermal radiation prediction.
Applsci 14 07098 g016
Table 1. Simulation conditions under different leakage pressures and diameters.
ConditionLeakage Pressure/MpaLeakage Diameter/mmEnvironmental
Temperature/K
Description
010.55293Verification
1410300Different leakage
pressures
2810300
31210300
4420300Different leakage
diameters
5440300
Table 2. Comparison between experimental and predicted results of flame thermal radiation.
Diameter/mmRadial Distance/mHeight/mMeasurement/W·m−2Prediction/W·m−2Error/%
1.20.230.25944.21002.26.14
0.50630.9547.613.2
0.75420.6128.369.5
0.500.25409.8250.238.95
0.50373.3200.746.24
0.75309.0107.265.31
1.50.230.251905.62233.717.22
0.501783.31878.45.33
0.751343.3561.358.21
0.500.25626.6610.82.52
0.50605.2574.45.09
0.75555.8344.737.98
2.00.230.252540.82815.410.81
0.503019.33635.220.40
0.752581.52102.118.57
0.500.251006.4916.68.92
0.501081.51059.32.05
0.751195.3803.132.81
Table 3. Prediction effects of different models on jet fire experiment.
CaseP/MPad/mmR/mqexp/W·m−2qmod,new/W·m−2qmod,old/W·m−2
11.836.352.9155717291990
220.796.3513.09155712982045
351.814.2313.27155714701863
451.816.3512.46473237074181
551.816.3521.58155713031877
6103.526.3530.46155713641653
Disclaimer/Publisher’s Note: The statements, opinions and data contained in all publications are solely those of the individual author(s) and contributor(s) and not of MDPI and/or the editor(s). MDPI and/or the editor(s) disclaim responsibility for any injury to people or property resulting from any ideas, methods, instructions or products referred to in the content.

