Abstract
Occasionally intravenous insertion forms a challenge to a number of patients. Inserting an IV needle is a difficult task that requires a lot of skill. At the moment, only doctors and medical personnel are allowed to do this because it requires finding the right vein, inserting the needle properly, and carefully injecting fluids or drawing out blood. Even for trained professionals, this can be done incorrectly, which can cause bleeding, infection, or damage to the vein. It is especially difficult to do this on children, elderly people, and people with certain skin conditions. In these cases, the veins are harder to see, so it is less likely to be done correctly the first time and may cause blood clots. In this research, a low-cost embedded system utilizing Near-Infrared (NIR) light technology is developed, and two novel approaches are proposed to detect and select the best candidate veins. The two approaches utilize multiple computer vision tools and are based on contrast-limited adaptive histogram equalization (CLAHE). The accuracy of the proposed algorithm is 91.3% with an average 1.4 s processing time on Raspberry Pi 4 Model B.
1. Introduction
Intravenous (IV) cannulation is a procedure where a needle is inserted into a vein to draw blood or inject fluids and medications [1]. Approximately 80% of hospitalized patients undergo intravenous therapy as a routine procedure for clinical testing [2]. Currently, only trained medical professionals are allowed to perform IV cannulations as it requires preciseocalization and detection of veins, proper insertion of the needle, and adequate introduction of fluids or blood withdrawal. However, it is considered a challenging procedure and prone to human error. Improper venipunctureeads to many complications, including bleeding, swelling, infection, and damage to the vein [3,4]. IV insertion becomes more challenging among children and elderly patients, people with hairy skin or dark skin tone, and obese patients [5,6]. This is because the subcutaneous veins are not clearly visible in the visibleight spectrum [7,8]. As stated in [9], the success rate of IV cannulation from the first time in children ranges from 53% to 76%. Moreover, multiple attempts to perform venipuncture may cause vein thrombosis, and hematoma [10,11].
Near-infrared light (NIR) has been widely used for subcutaneous vein imaging to improve veinocalization. It works by projecting infrared light onto the hand or the arm. The deoxygenated hemoglobin in the veins absorbs the infrared light, which shows the veins as darkness when captured by the infrared camera [12]. These darkness are considered a map to guide the medical staff for an accurate IV insertion [5,13]. Many researchers have focused on utilizing NIR to calculate deep tissue depth and under-skin vein localization. In [14], the authors have used NIR with wavelengths of 700–950 nm by the implementation of fluorescence imaging with nanomaterials. This method has achieved unprecedented depth measurement of 3 mm, with 50 FPS speed and a spatial resolution of 3–4 µm.
In [15], the authors have designed a novel device for vein visualization by applying NIRight. Theight module is fixed directly onto the designated area of the skin. Then, the NIR beams are projected from two sides of theight module to the vein with a specific angle; this gives a penetration effect. By processing the captured images, vein vessels are accuratelyocalized. Moreover, in 2019 [16] Mela et al. combined two methods: visible spectrum images (VIS) with transmission mode NIR images in real-time. This method has achieved vein detection and under-tissue penetration up to 3 mm.
NIR images have been recently used with the help of computer vision-based approaches to achieve automated veinocalization. There are two main approaches that are applied for veinocalization: traditional image processing techniques and deepearning (DL) models [17]. Traditional image processing techniques usually include illumination enhancement, morphological operations, and edge detection [18]. For example, contrast-limited adaptive histogram equalization (CLAHE) methods boost the contrast of the acquired images. Afterward, segmentation techniques discriminate veins from the background. On the other hand, DL-based methods have achieved a huge advancement due to their generalization capabilities. However, the DL-based approaches require high-power microprocessors, which makes DL-based end devices harder to provide among healthcare institutes [19].
Liu et al. and Yang et al. [20,21] proposed methods that combine knowledge distillation for semantic segmentation. Yang et al. and Zhang et al. [22,23] proposed methods for deep mutualearning to improve visual representation in a segment.
Much research has focused on achieving autonomous vein detection andocalization. One particular method of interest commonly used for processing and extracting features of still images is contrast-limited adaptive histogram equalization (CLAHE) [24]. Many researchers have applied the CLAHE method for vein detection as it delivers exceptional results in vein imaging [25,26,27,28,29,30,31,32,33,34,35,36].
In [32], Pallavi et al. used the CLAHE method for image enhancement and then added a median filter for denoising. Also, the combination ofocal thresholding and Otsu binarization was used for segmenting the veins. The system used an LED array that emits IR of wavelength 850 nm. However, other research has shown that 830 nm is the best wavelength for revealing superficial veins in dark skin [37].
In 2024, Saeed et al. [38] explored a new approach to simplifying vein detection for IV procedures using a near-infrared imaging system. The system utilizes a special algorithm that involves image processing techniques to enhance the captured image and highlight veins just beneath the skin’s surface. The researchers considered various existing studies in related fields, including finger vein identification, robotic IV assistants, challenges faced inab settings, and patient experiences with difficult IV insertions. They also explored the potential benefits of remote monitoring for IV therapy, methods to reduce anxiety and pain during IV insertion in children, and even techniques to optimize the near-infraredight used in the system itself, along with advanced image analysis methods to create the clearest possible picture of veins for successful IV placement. However, only 80% of the males and 70% of the females revealed high visible vein structures; in addition, the delay of their proposed system was 4 s.
Multiple vein finders have been proposed and released to the market; for example, ACCuVein provides simultaneousocalization and projection of detected veins; however, their prices range from USD 1800 to USD 7000 per unit [39], which hinders its spread in many medical centers in developing countries. Hence, the alternative solution is making use ofow-cost NIR medical imaging.
The contribution of this research is that after an image is captured in an adequate environment, a region of interest is selected to group the detected vein. A selection methodology is applied to supply the robotic machine (to be made in future work) with a veinocation to start the injection process. This paper presents aow-cost embedded system for acquiring NIR images of patients’ arms. Also, an improved vein detection algorithm based on CLAHE is proposed. This optimizedow-cost system is aimed to be implemented in intelligent healthcare facilities in order to replace manual vein detection and cannulation. Different computer vision tools were employed, and different approaches were analyzed. Besides extracting different veins in a patient’s arm, two novel approaches were proposed to select the best candidate vein for cannulation. This is a base step for performing autonomous cannulation, aiming to avoid human error.
2. Methods
This research is considered the first phase for an autonomous injection robotic portable device, in which an image of the patient’s forearm is acquired toocalize the veins and send theocation to a robotic arm, which stimulates a precise movement to deliver an injection into the patient’s forearm. This requires performing an efficient vein extraction so that it should be able to detect the most visible vein in the patient’s arm in addition to providing a suitable vein description for the following unit, the microcontroller, itself. Afterward, the microcontroller utilizes the provided information to guide the robotic arm to conduct the vein injection.
Vein selection for injection is usually not a critical issue for medical treatment. If the vein is visible, the manual injection proceeds normally. However, from the engineering side, there are several clues for raising errors that could be a great obstacle when applying the injection by the artificial arm. We might have a small error when approaching the artificial arm toward the patient’s arm. This is because several motors are in action, a very tiny error in one motor would propagate an error that results in performing an injection in the wrong place. Furthermore, the patient’s arm could make a slight movement before conducting the injection process. All these errors would require sufficient tolerance when selecting the vein. Therefore, the objective of the vein extraction module is to select the vein that should be wide enough and have aine-shaped appearance to ease the injection process itself.
The base idea of veinocalization is reflectedight imaging. When NIRight is projected from LEDs towards the targeted area, it penetrates the skin tissue. Deoxygenated hemoglobin has a higheright-absorbing capacity compared to other skin components; thus, veins appear as objects with darkines and curved shapes when captured by the camera [40].
2.1. Experimental Setup
The software is implemented using the Python V3.9.13 programminganguage. It uses well-known open-sourceibraries such as OpenCV, NumPy, and Matplotlibibraries. Theseibraries are essential to enable computer vision, numerical, and visualization operations, respectively.
The proposed embedded system is based on three main units: Raspberry Pi, an IR emitter, and an IR camera, as presented in Figure 1a. The following details show the description of the system’s components:
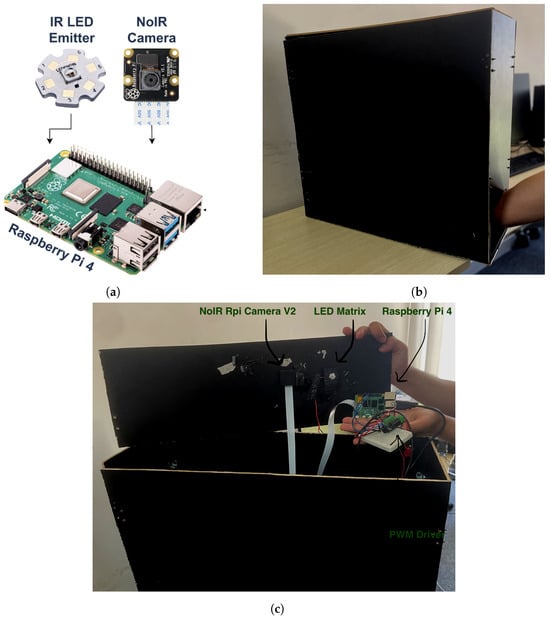
Figure 1.
Embedded system units: (a) system hardware diagram; (b) acquisition box; (c) system hardware actual model.
- Acquisition box is a black box with dimensions 20 × 60 × 60 cm (width × depth × height). It provides a controlled environment for vein injection where the patient’s arm is placed inside it as depicted in Figure 1b.
- Raspberry Pi-TBD is the microprocessor embedded system. It is a quad-core 64-bit ARM-Cortex A72 running at 1.5 GHz. It hosts and executes the proposed vein injection software and controls both the IR emitter and IR camera.
- IR emitter source, Model: LZ1-10R602-0000 [41]. It is aight source with an 850 nm wavelength and 3.2 W of power. It is used during the detection and injection of the vein. It is connected to the Raspberry Pi using an H-bridge (DRV8871) to control its intensity using pulse-width modulation (PWM). This emitter is sufficient for the experimental setup since it has single-color infrared with a high-power LED. Since the IR emitter has power, it is connected to an external power source and is controlled by the Raspberry Pi.
- IR camera, Model: NoIR Rpi Camera V2. It is connected to the Raspberry Pi board by the camera serial interface (CSI) cable. It is used to capture the infraredight band with an 850 nm wavelength.
The system unit is a compact device such that both the IR emitter source and the IR camera are firmly fixed inside the acquisition box from the upper side as illustrated in Figure 1c. They are placed pointing towards the patient’s arm. The costs for the Raspberry Pi, IR emitter, and NoIR camera are USD 70, USD 11, and USD 34, respectively. Thus, the cost for the three main units together for the proposed device is around USD 115. That is fairly costly for the proposed embedded system.
2.2. Vein Extraction Module
After capturing images for the patient’s arm, the captured images are fed to a novel vein extraction module. This module is responsible forocalizing the veins in the acquired image. Also, two novel approaches are proposed to select the best veins for cannulation. Moreover, the proposed vein extraction module outputs the entry point for the injection process. This information is critical to guide the robotic arm to perform the injection process.
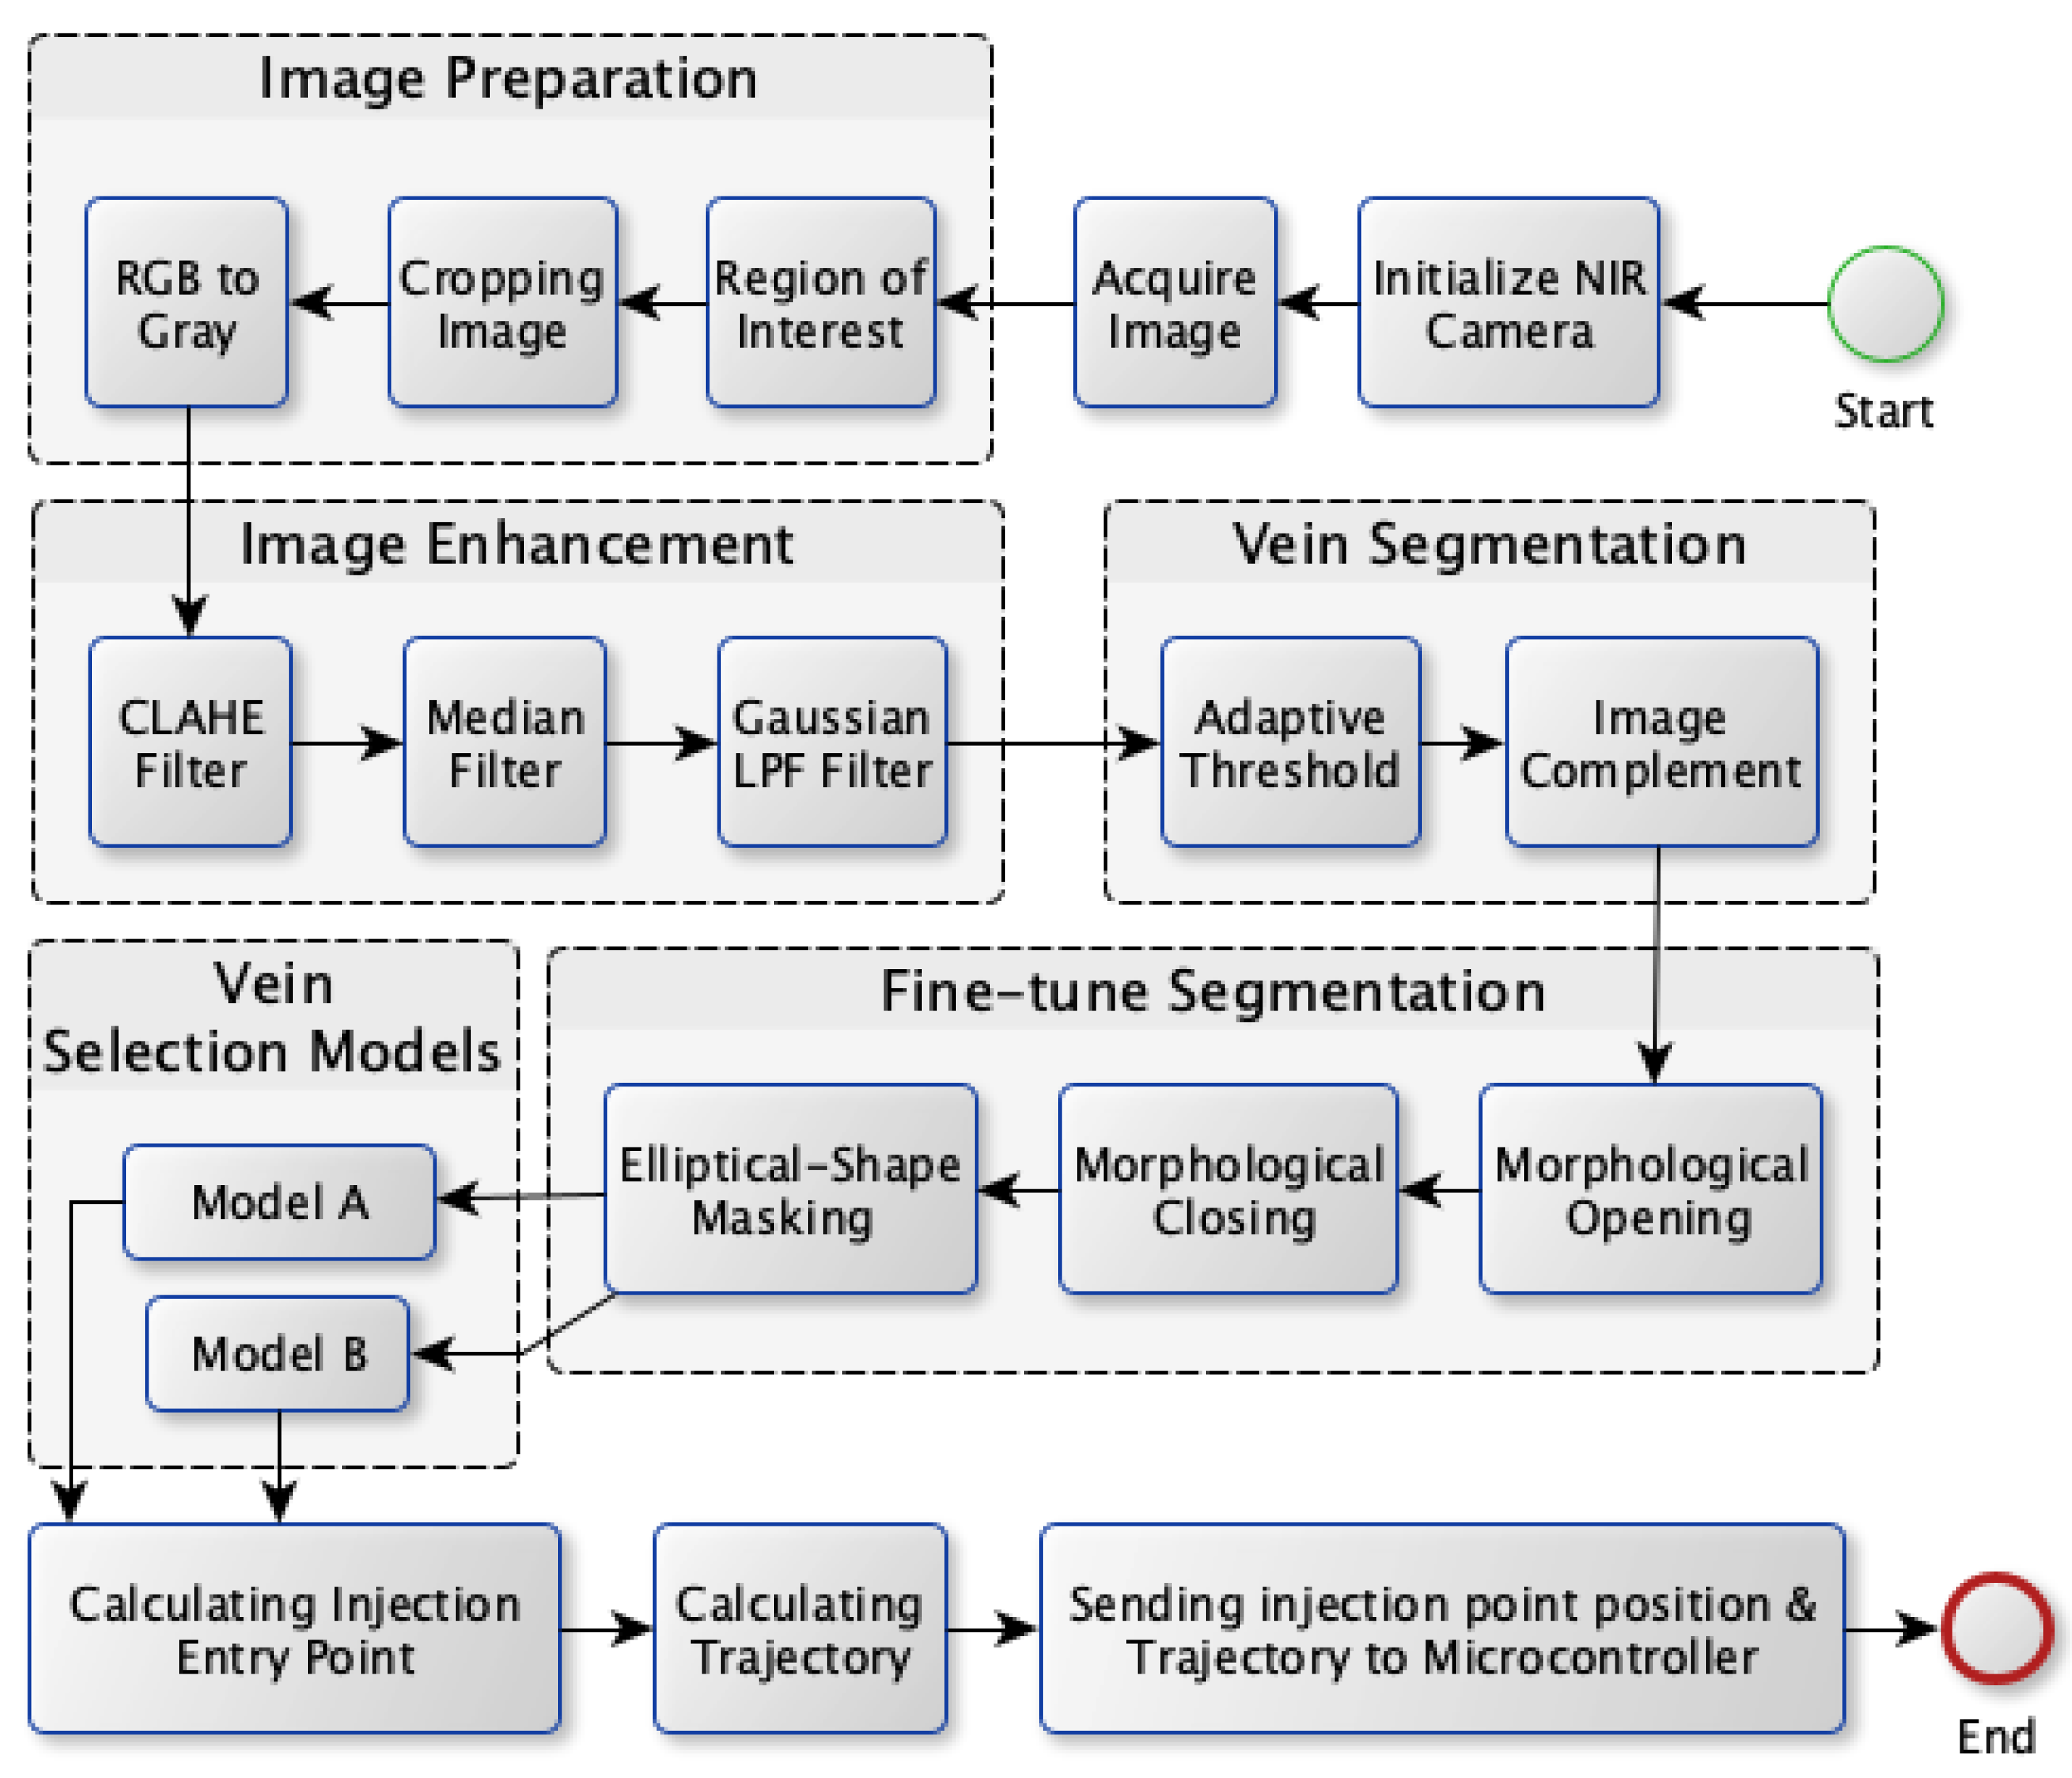
The proposed vein extraction module seeks to find an appropriate vein for injection. The process flow for vein extraction is shown in Figure 2. In order to choose the best candidate vein for injection, the most visibleine-shaped vein with suitable thickness would be convenient for injection compared to veins with other shapes. Therefore the objective of this module is to search for a vein that appears as a thickine, to facilitate the process of vein injection itself. The vein extraction module consists of five stages as depicted in Figure 2. These stages are image preparation, image enhancement, vein segmentation, fine-tuning segmentation, and vein selection.
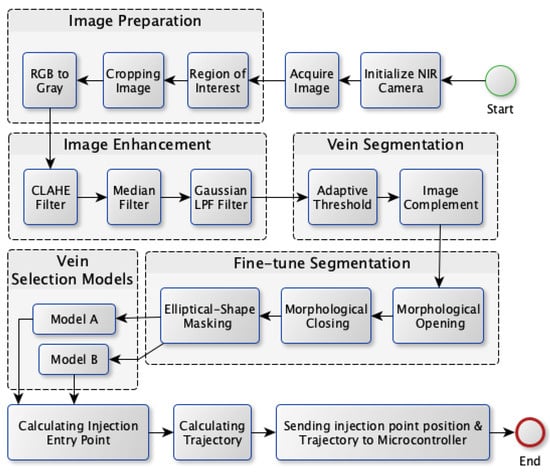
Figure 2.
Vein extraction module process flow.
The next subsections provide a detailed description of the vein extraction module. For each stage, an illustration is provided to visualize the output from each stage.
2.2.1. Image Preparation
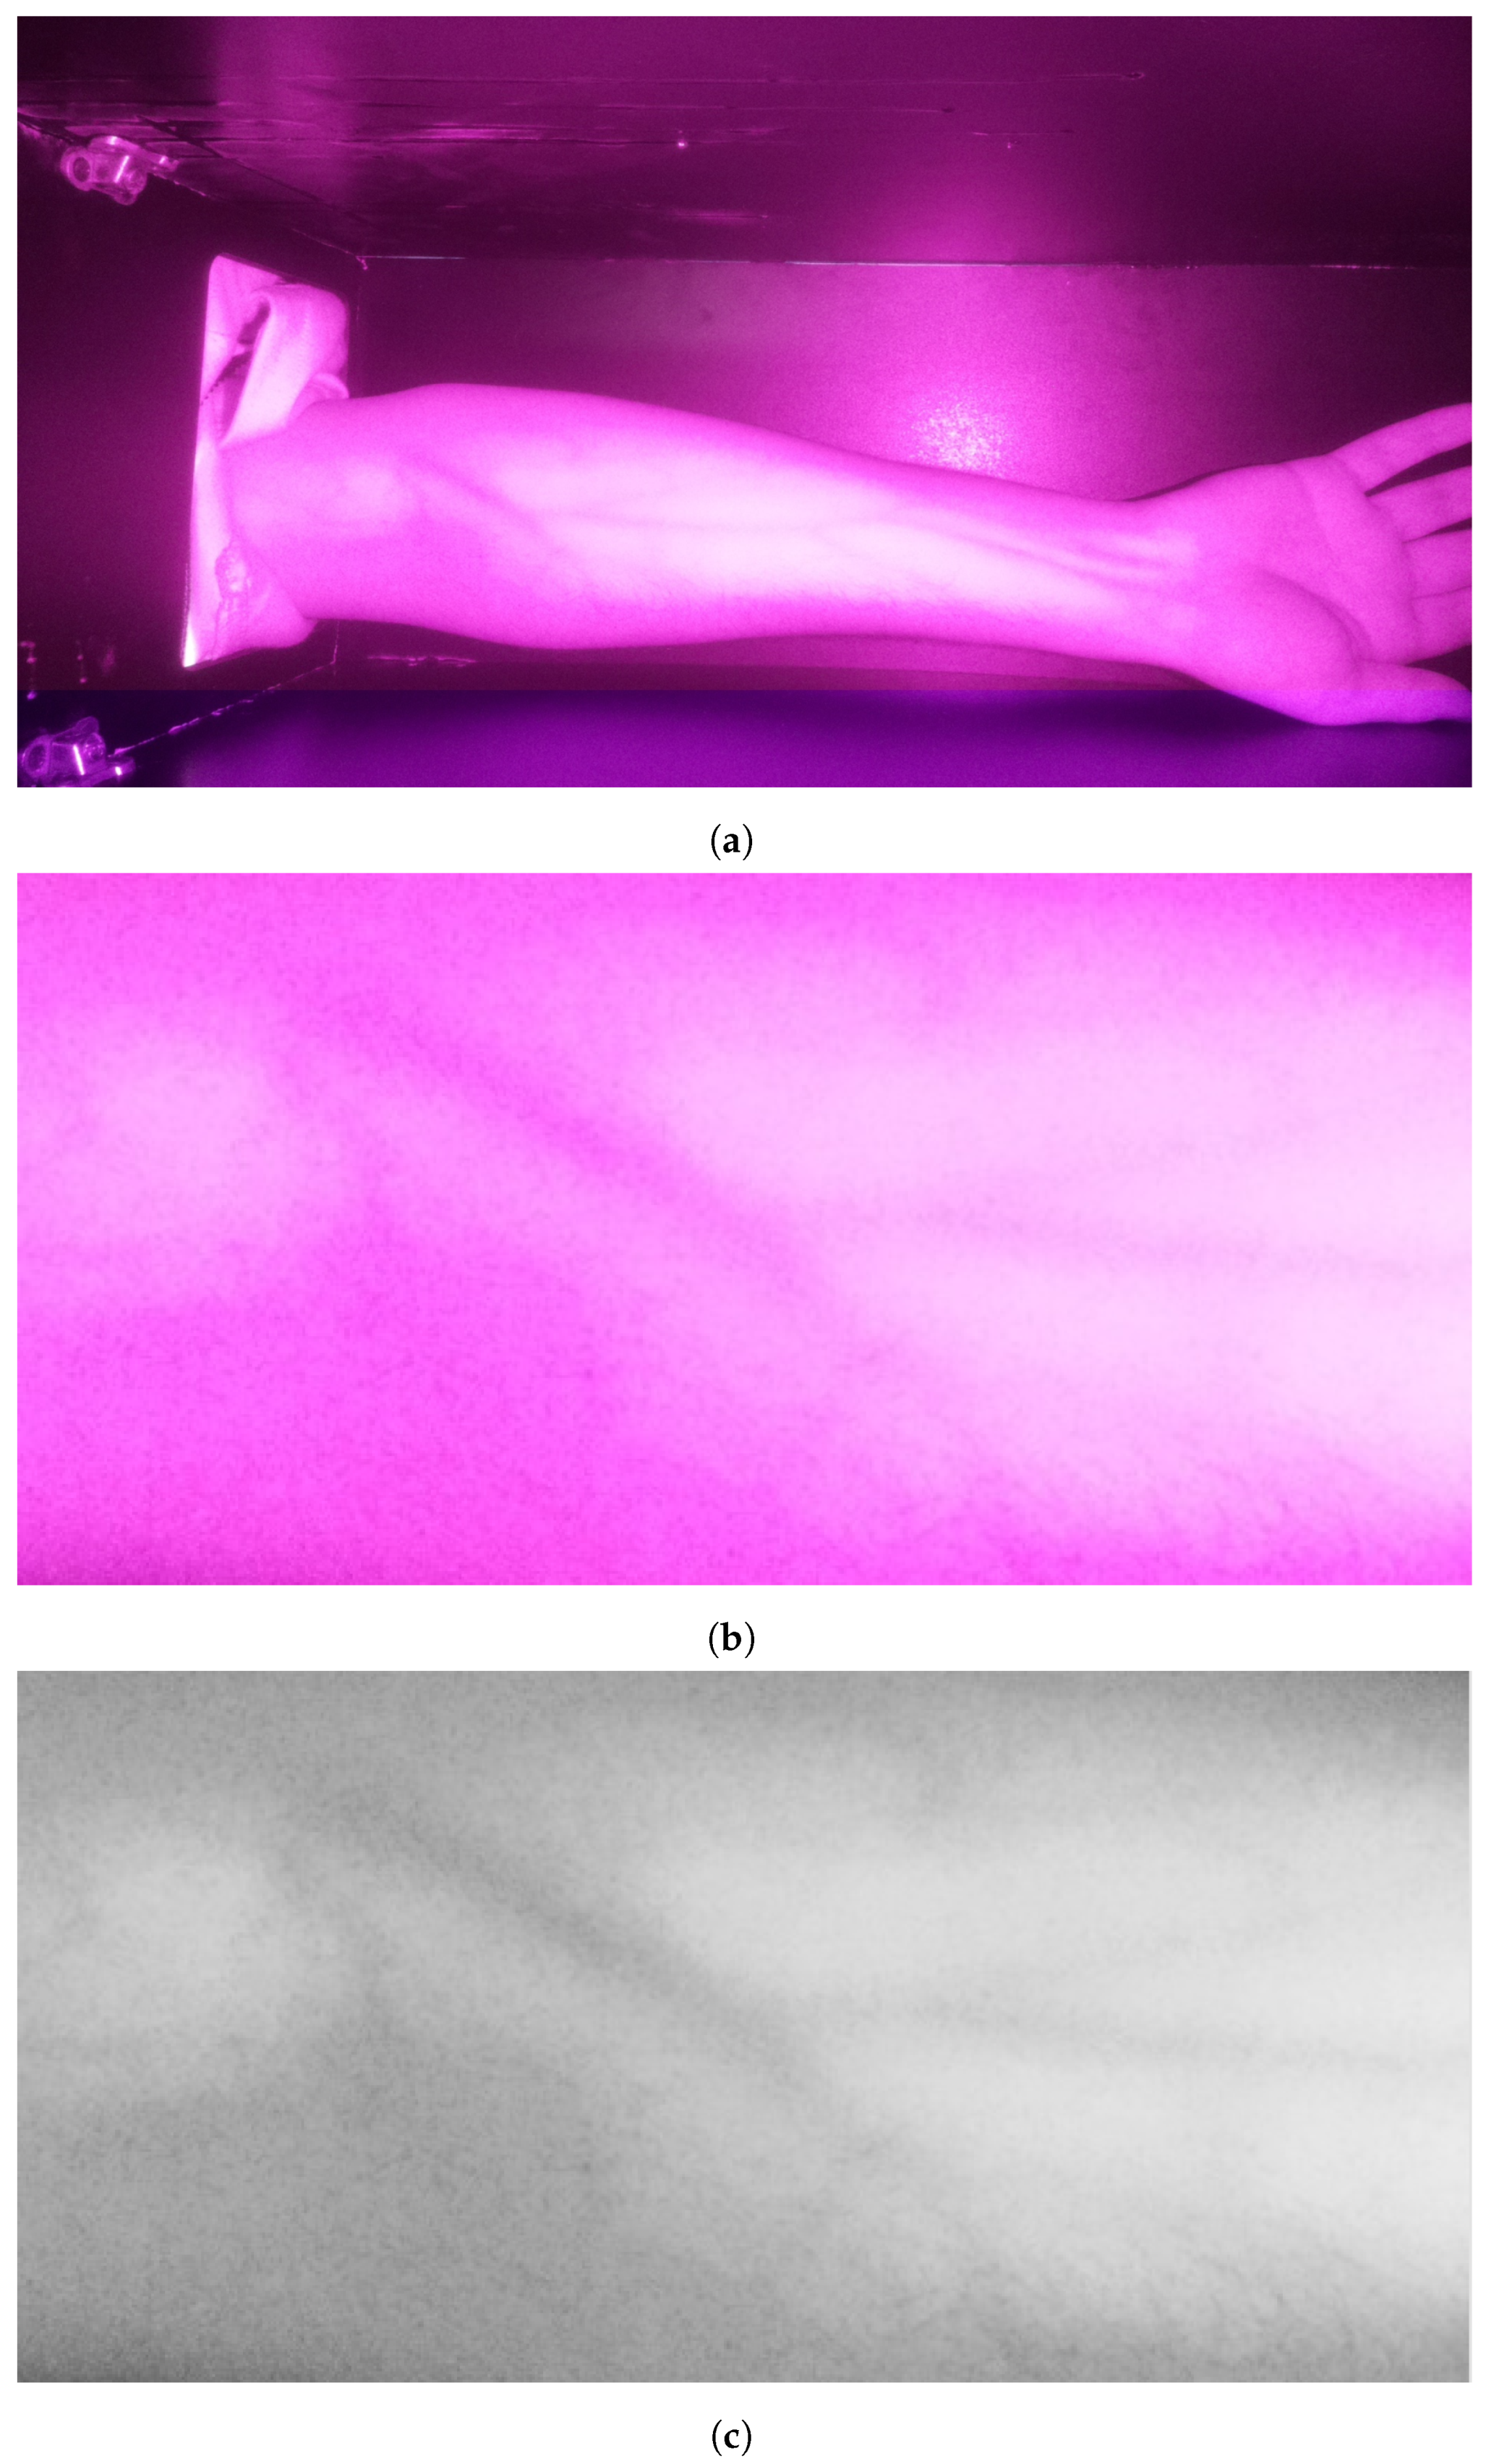
The preliminary stage is acquiring the image. After that, the image is prepared for processing. First, the operator selects the region of interest (ROI) by drawing a rectangle in the acquired image. The selection encloses the arm’s veins inside the bounding box as it appears as darkines. After that, the selected region is cropped and then converted to grayscale for further processing. These operations are essential to deploy the following processes only on the target area while color conversion from RGB into grayscale maintains the vein as dark edges. These processes are illustrated in Figure 3. It is clearly visible that the grayscale image contains a significant amount of noise in addition to a set of veins that appear as edges with various thicknesses and shapes.

Figure 3.
Stage 1, image preparation: (a) original image; (b) cropped image in RGB color; (c) cropped image in grayscale.
2.2.2. Image Enhancement
This is an essential stage that comes ahead of other computer vision-based operations. It enhances the quality of the captured images duringaboratory examinations. Captured images usually have distortion because of the nearbyight source, eading to issues such as glare and uneven brightness. To enhance the image quality, three spatial filters are used. These Filters are the contrast-limited adaptive histogram equalization (CLAHE) filter, the median filter, and the Gaussianow-pass filter.
The CLAHE filter is considered the core operation for image enhancement as it improves the image contrast. Its algorithm is presented in Algorithm 1. It deploys adaptive histogram equalization (AHE)ocally where the image is partitioned into several blocks called tiles. Each tile has a size of 8 × 8 pixels and is processed independently by histogram equalization. Since histogram equalization is applied to small areas, the noise is increased in homogenous regions. Therefore, the contractimit (CL) is applied toimit the contrast below a specificimit (set to 25) to reduce excessive saturation in these regions.
| Algorithm 1: CLAHE Algorithm |
| Input: |
| I—Original image of size |
| —Tile size |
| —Clip Limit (value between 0 and 1) |
| Output: |
| J—Contrast-Enhanced image of the same size as image I |
| 1. Divide image I into non-overlapping tiles of size |
| 2. Calculate the histogram for each tile |
| 3. Clip histogram: |
| Let top = = clippingimit |
| Let bottom = 0 |
| 4. Normalize histogram: |
| for tiles of I do |
| Normalize the clipped histogram such that . |
| end for |
| 5. Distribute normalized histogram:; |
| Pad the image with a border of size and on all sides. |
| for pixels of original image I do |
| Locate the tile that contains p. |
| Define neighbor set as all pixels within a radius of and around p (including pixels from neighboring tiles). |
| for do |
| Distribute the value proportionally among the pixels in based on their original intensity values. |
| end for |
| end for |
| 6. Bilinear interpolation: |
| 7. Crop image by removing the padded border from the enhanced image J |
CLAHE indeed improves the vein’s visibility. However, it produces significant noise. Therefore, part of this noise is removed by applying median filtering with a kernel size of 15 × 15. Median filtering is used to eliminate random noise while maintaining the main features ofines and edges within the captured images. Median filters work by replacing each pixel’s intensity with an intensityocated within the center of a set of values. These values correspond to a sorted intensity value of the neighboring pixels including the current pixel itself.
The remaining noise is decreased by blurring the image by deploying a Gaussianow-pass filter. At this stage, the image is ready for vein segmentation. Figure 4 shows snapshots of the results when applying image enhancement processes on the grayscale image shown in Figure 3c.
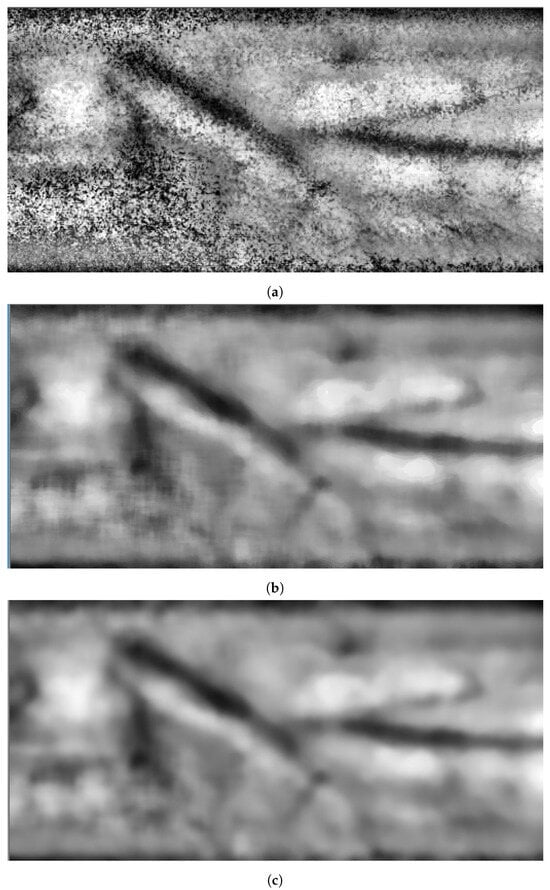
Figure 4.
Stage 2, image enhancement: (a) CLAHE filter; (b) median filter; (c) Gaussianow-pass filter.
2.2.3. Vein Segmentation
The third stage is vein segmentation. Considering that the captured image originally has non-uniform pixels’ intensities, the nearest spatial areas to the infrared sensor tend to have higher color intensities and are brighter in comparison to the farthest areas. Thus, applying a global threshold will notead to good separation results for the veins. Therefore, thresholding is applied to smaller spatial areas where adaptive thresholding would provide better vein segmentation to separate the pixels that correspond to the vein areas themselves from the other non-vein areas. The resulting binary image has segmented veins. The regions with black color are related to veins, while white areas are the background (plain areas). The binary image is complemented to correctlyabel the veins by white color before the next stage: morphological operations. The outputs from both adaptive threshold and image complement are illustrated in Figure 5.
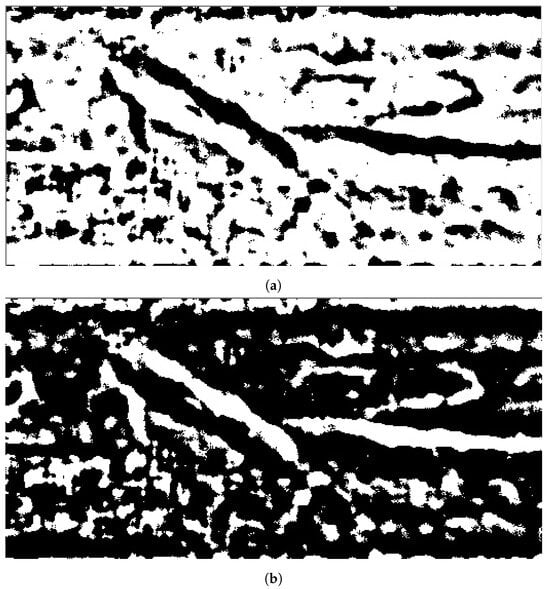
Figure 5.
Stage 3, vein segmentation: (a) segmentation using adaptive threshold; (b) image complement.
2.2.4. Fine-Tuning Segmentation
The fourth stage is deploying the necessary morphological operations to perform fine-tune segmentation for the processed image. Although the segmentation stage obtains the veins inside the acquired image, it does not provide accurate separation, which couldead to providing an inaccurateocation for vein injection. Therefore, morphological opening and closing are applied using structural elements of size 5 × 5. Both morphological operations smoothen the segmented vein areas. Morphological opening fuses any broken veins resulting from adaptive thresholding, while morphological closing truncates the holes within the segmented vein that have sizes smaller than the size of the structural element. Since the ROI has a rectangular shape, the objectsocated at the corner could reflect the arm’s boundary itself. Therefore, an elliptical-shaped mask is fitted inside ROI to remove any objectsocated at ROI’s corners. Figure 6 depicts the results when applying these processes on the binary image shown in Figure 5.
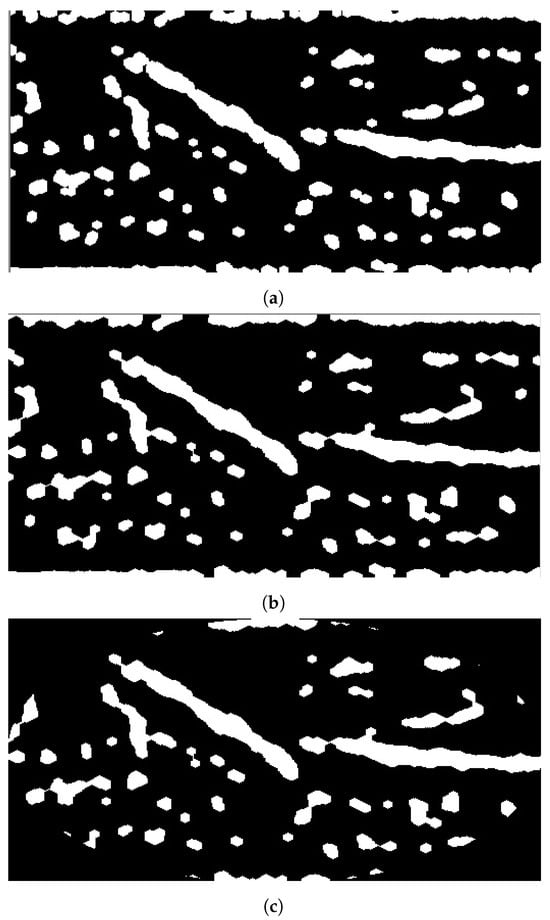
Figure 6.
Stage 4, fine-tuning segmentation: (a) morphological opening; (b) morphological closing; (c) elliptical mask.
2.2.5. Vein Selection
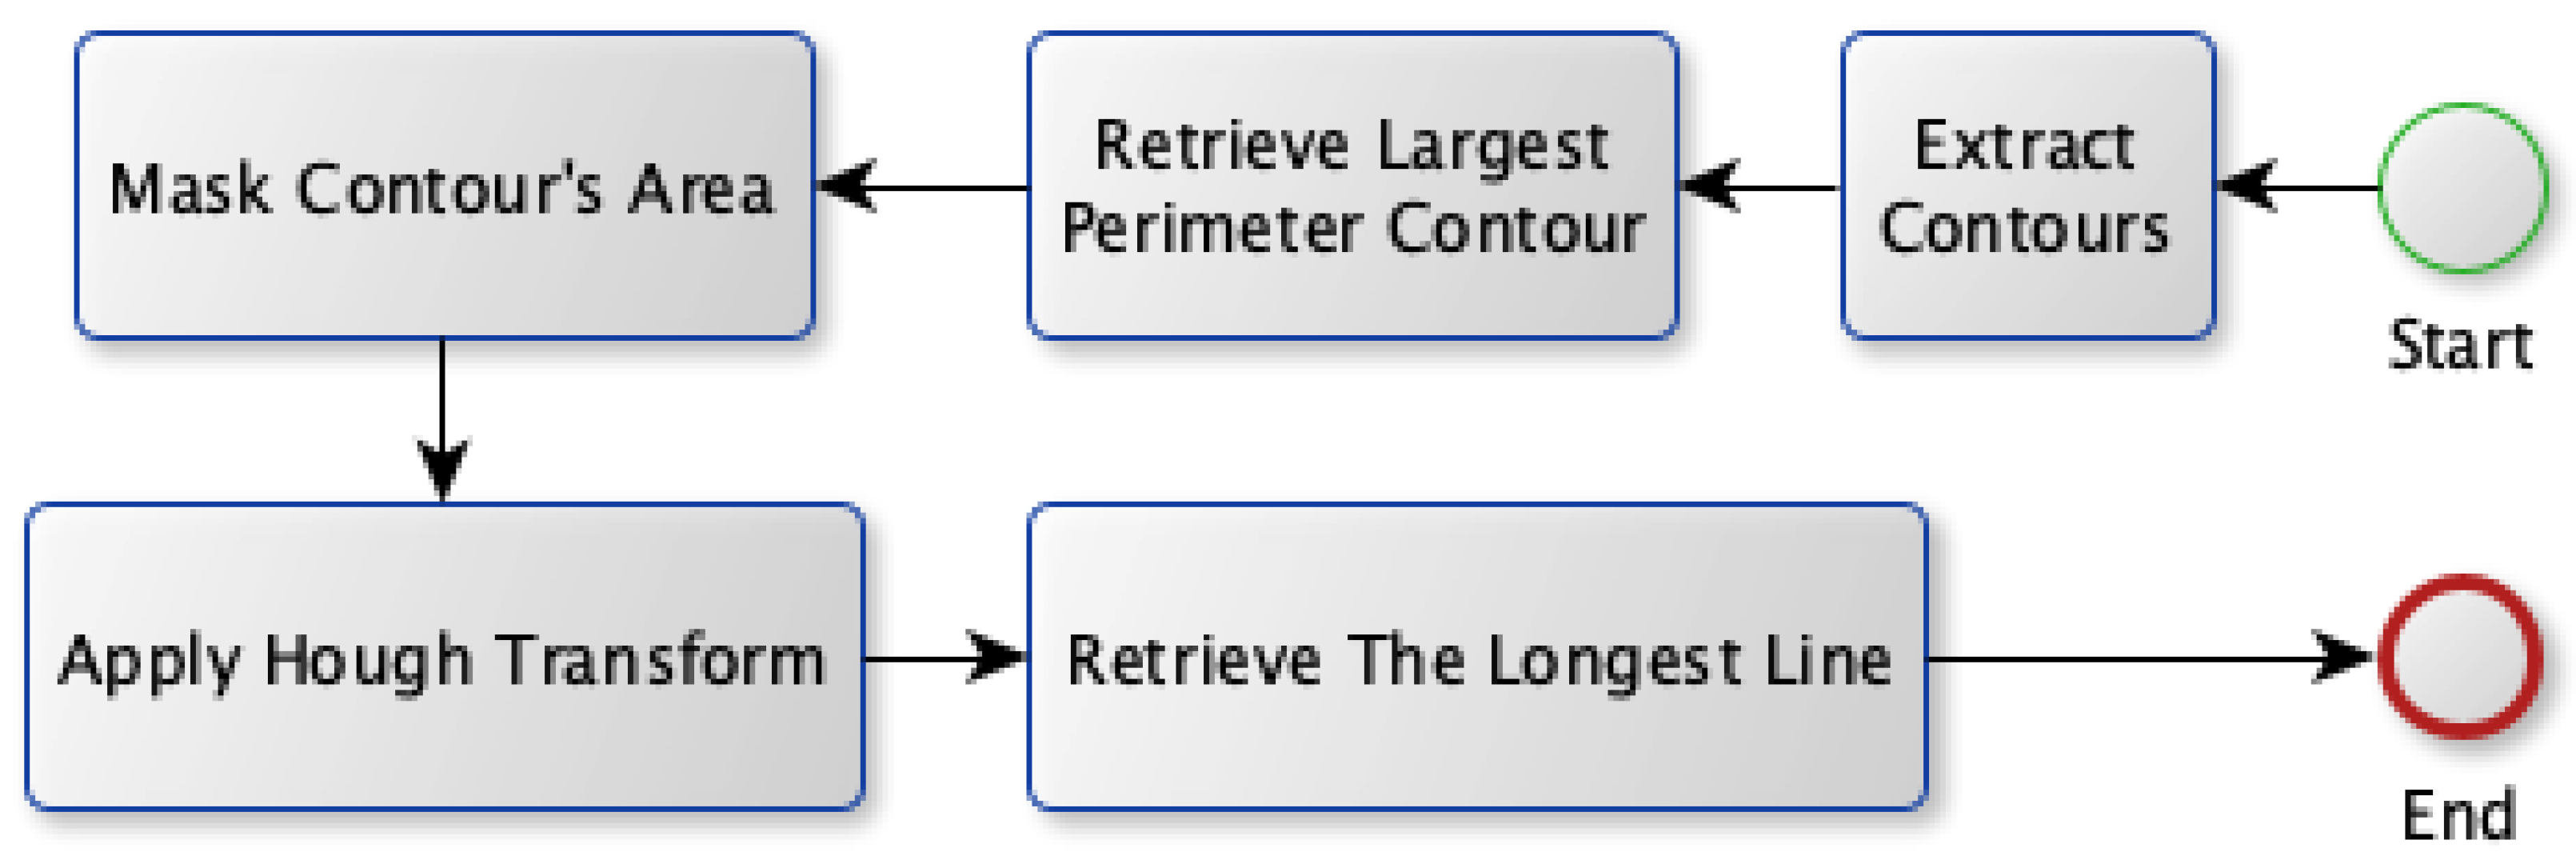
Two approaches are proposed in order to select the best candidate vein: Model A and Model B. Both models share the first four stages for the vein extraction module; however, they propose different approaches for the vein selection process. The block diagram for the first approach (Model A) is shown in Figure 7. Model A relies on finding the most visible vein that isocated inside a region with aarge perimeter (thick edge). First, it gets all the contours that exist in the binary image. Afterward, it searches for the contour that has theargest perimeter. Next, the Hough transform is applied to find allines existing in that contour. It transforms the image into a parameter space using both rho and theta. These parameters represent straightines in polar coordinates. Theongestine fitting inside that contour is used as the selected vein.
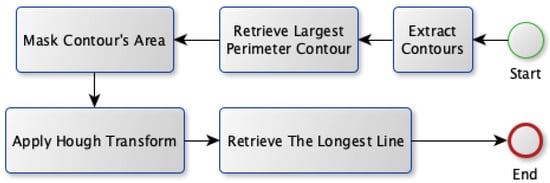
Figure 7.
Vein selection using Model A.
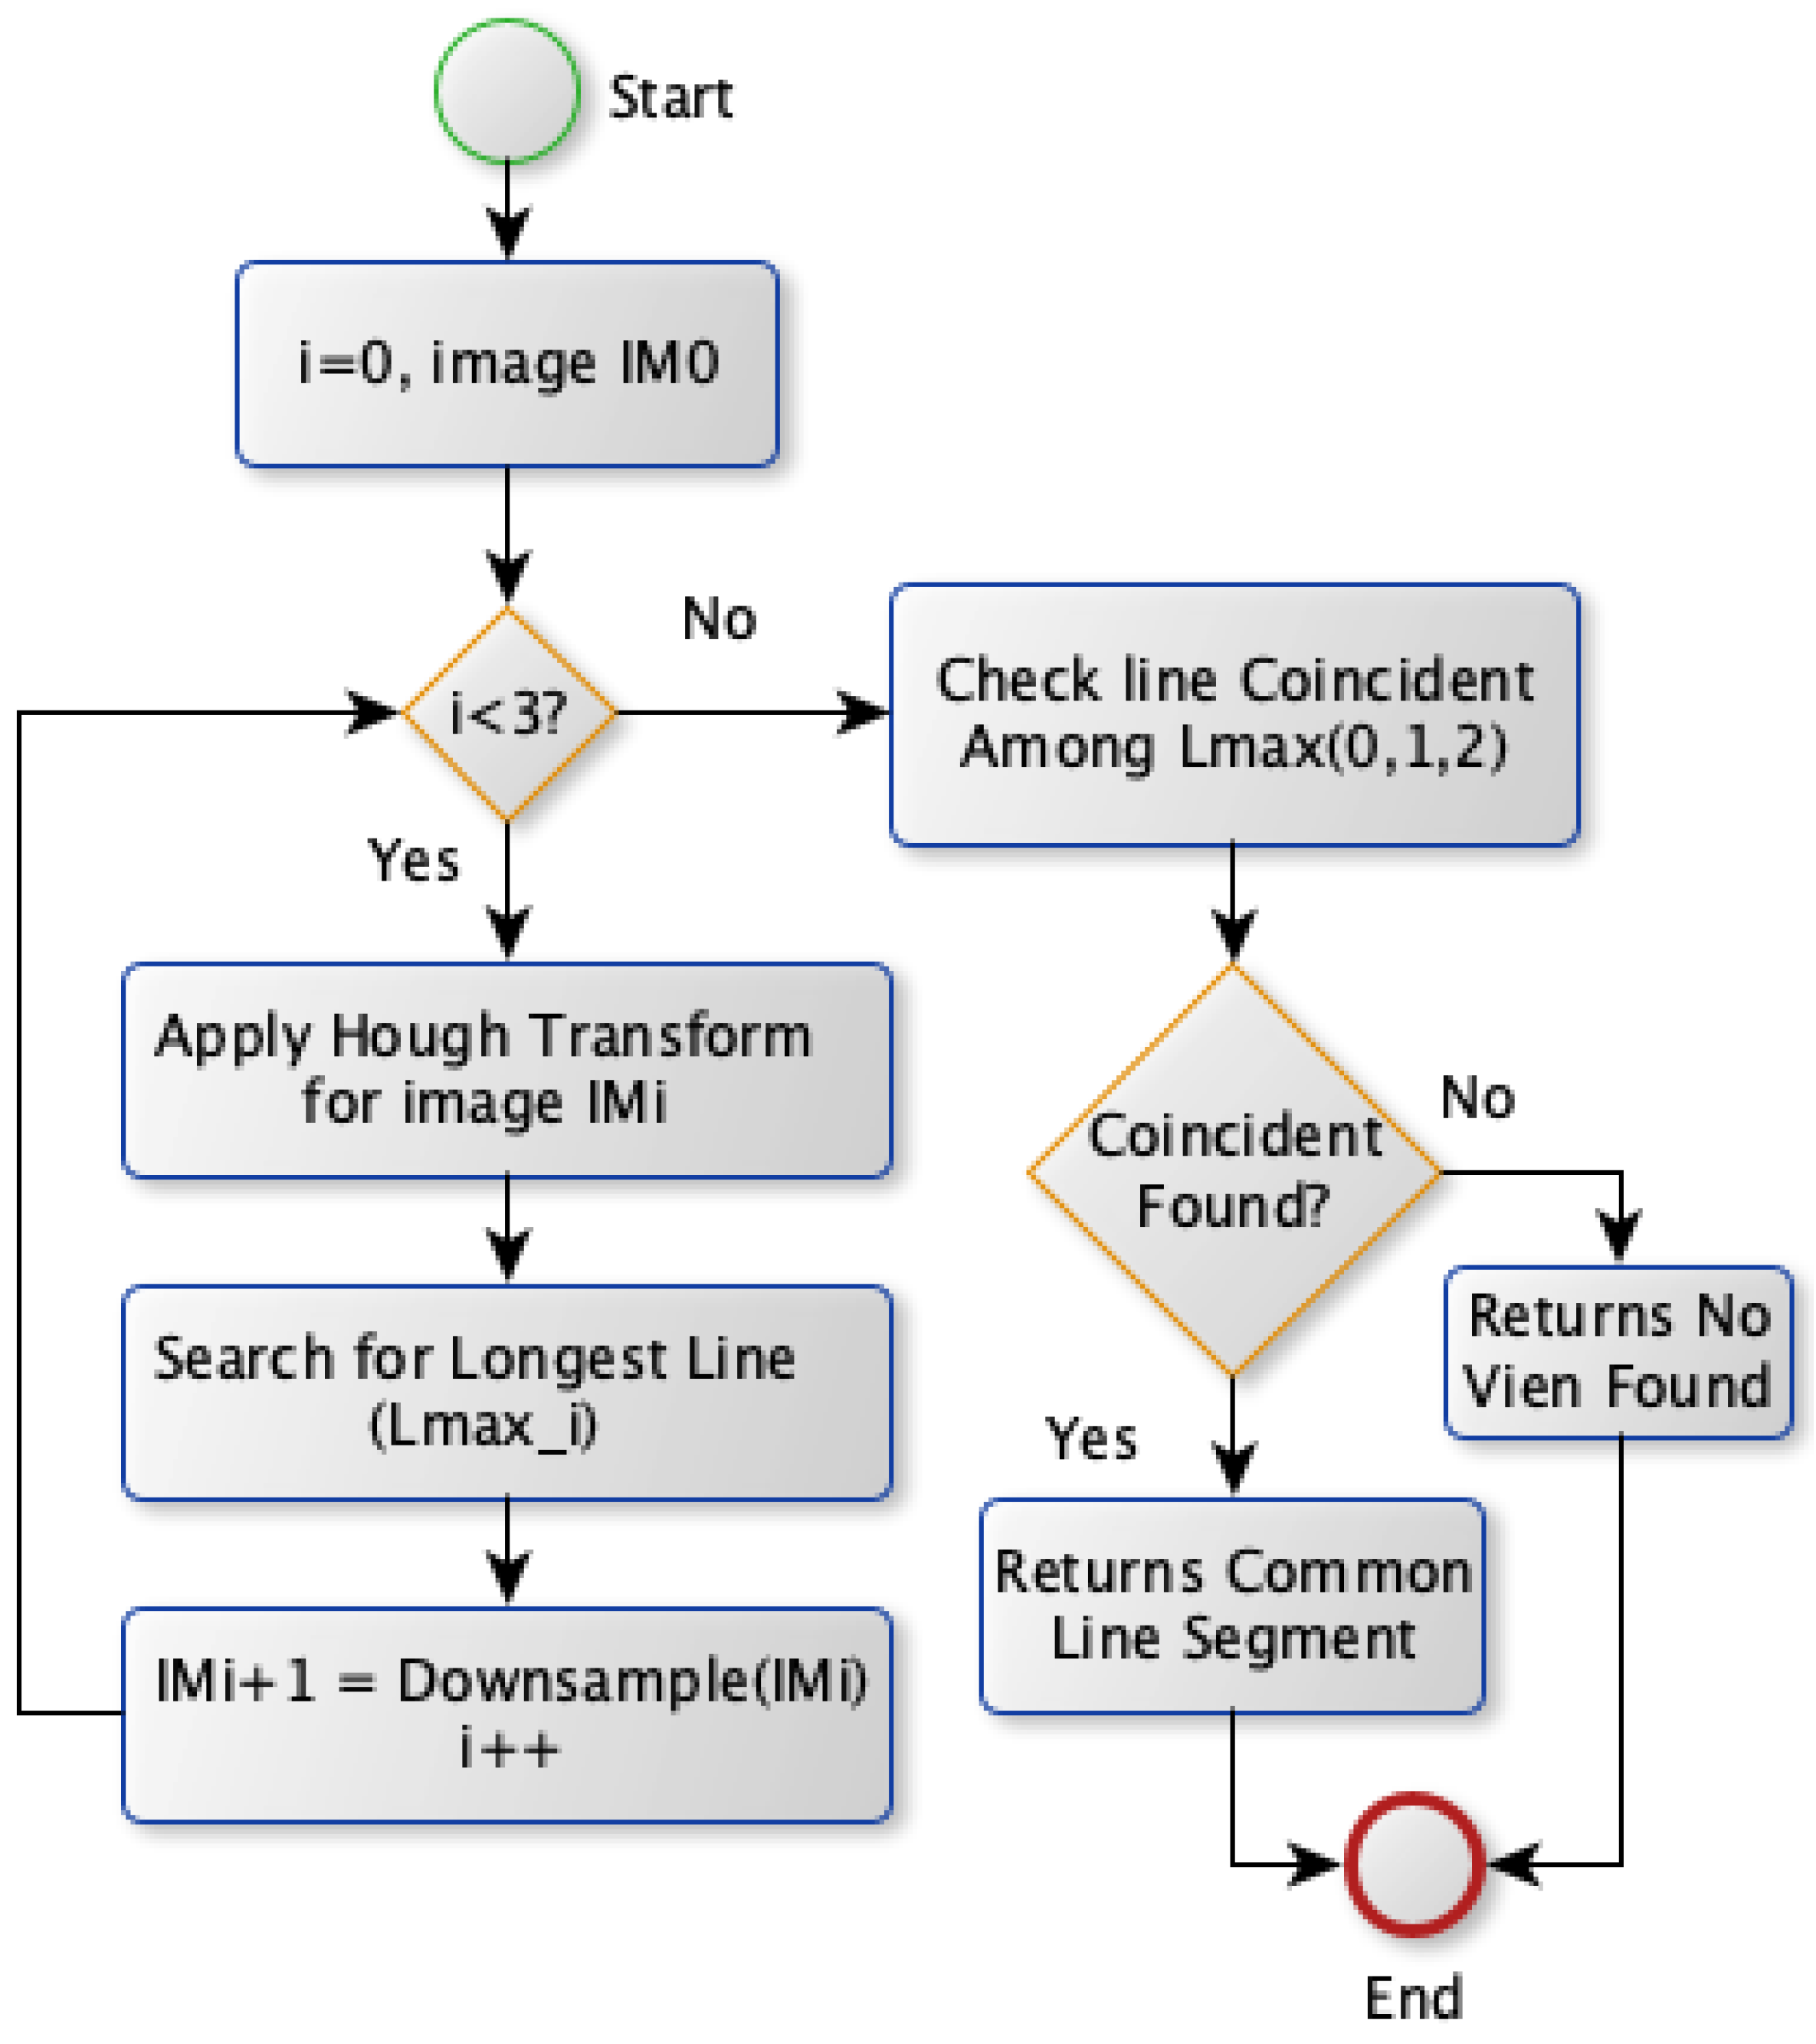
The second approach, Model B, selects the vein by applying the Hough transform on the image with various spatial resolutions. Model B diagram is shown in Figure 8. Theoretically, this approach is based on finding the vein that should survive when reducing the image’s spatial resolution. The most visible vein tends to survive more than other veins withess edge thickness when reducing the image resolution scale. Therefore, Model B obtains theines at different scales. Initially, the Hough transform is applied for the binary image to extractines where theongest one is stored. Afterward, the same transformation is conducted after downsampling the image by a factor of two horizontally and vertically. It extracts correspondingines and saves theongest one. This step is repeated twice where theongestines in the image with different scales are checked forine coincidence. If there are coincidentines, the commonine segment among theseines is chosen as a vein selection. Otherwise, noine is selected unless there is noine obtained for the image atower spatial resolutions. In this case, theongestine extracted from the original image scale will be chosen for vein selection.
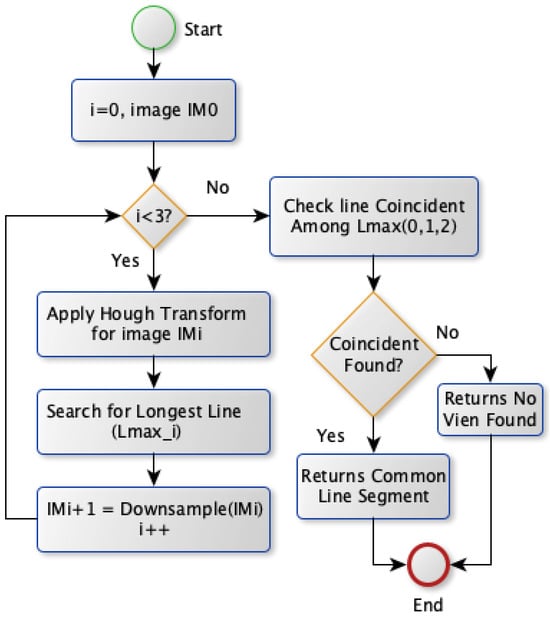
Figure 8.
Vein selection using Model B.
The results of applying Model A are shown in Figure 9a,b. The first figure shows a single contour that has theargest perimeter. This contour is marked by a green color while theongestine inside it isabeled with a red color. Theatter figure shows the detected vein highlighted within the original image.
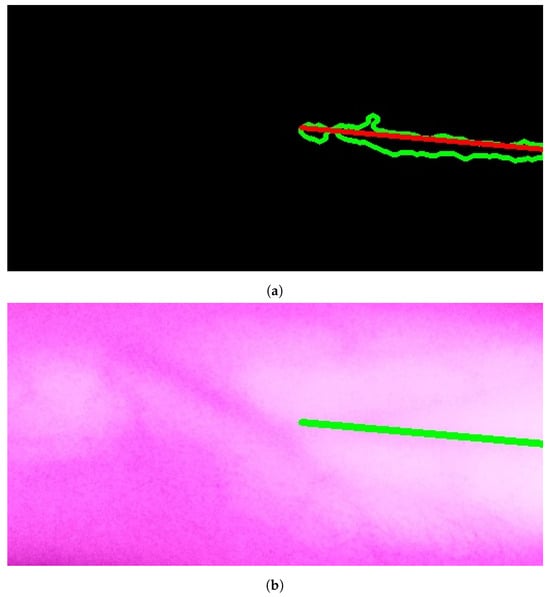
Figure 9.
Stage 5, vein selection using Model A: (a) contour with highest perimeter; (b) vein selection using Model A. The redine and greenine in (a,b) correspond to the vein extraction’s output that is displayed through the segmented and captured images respectively.
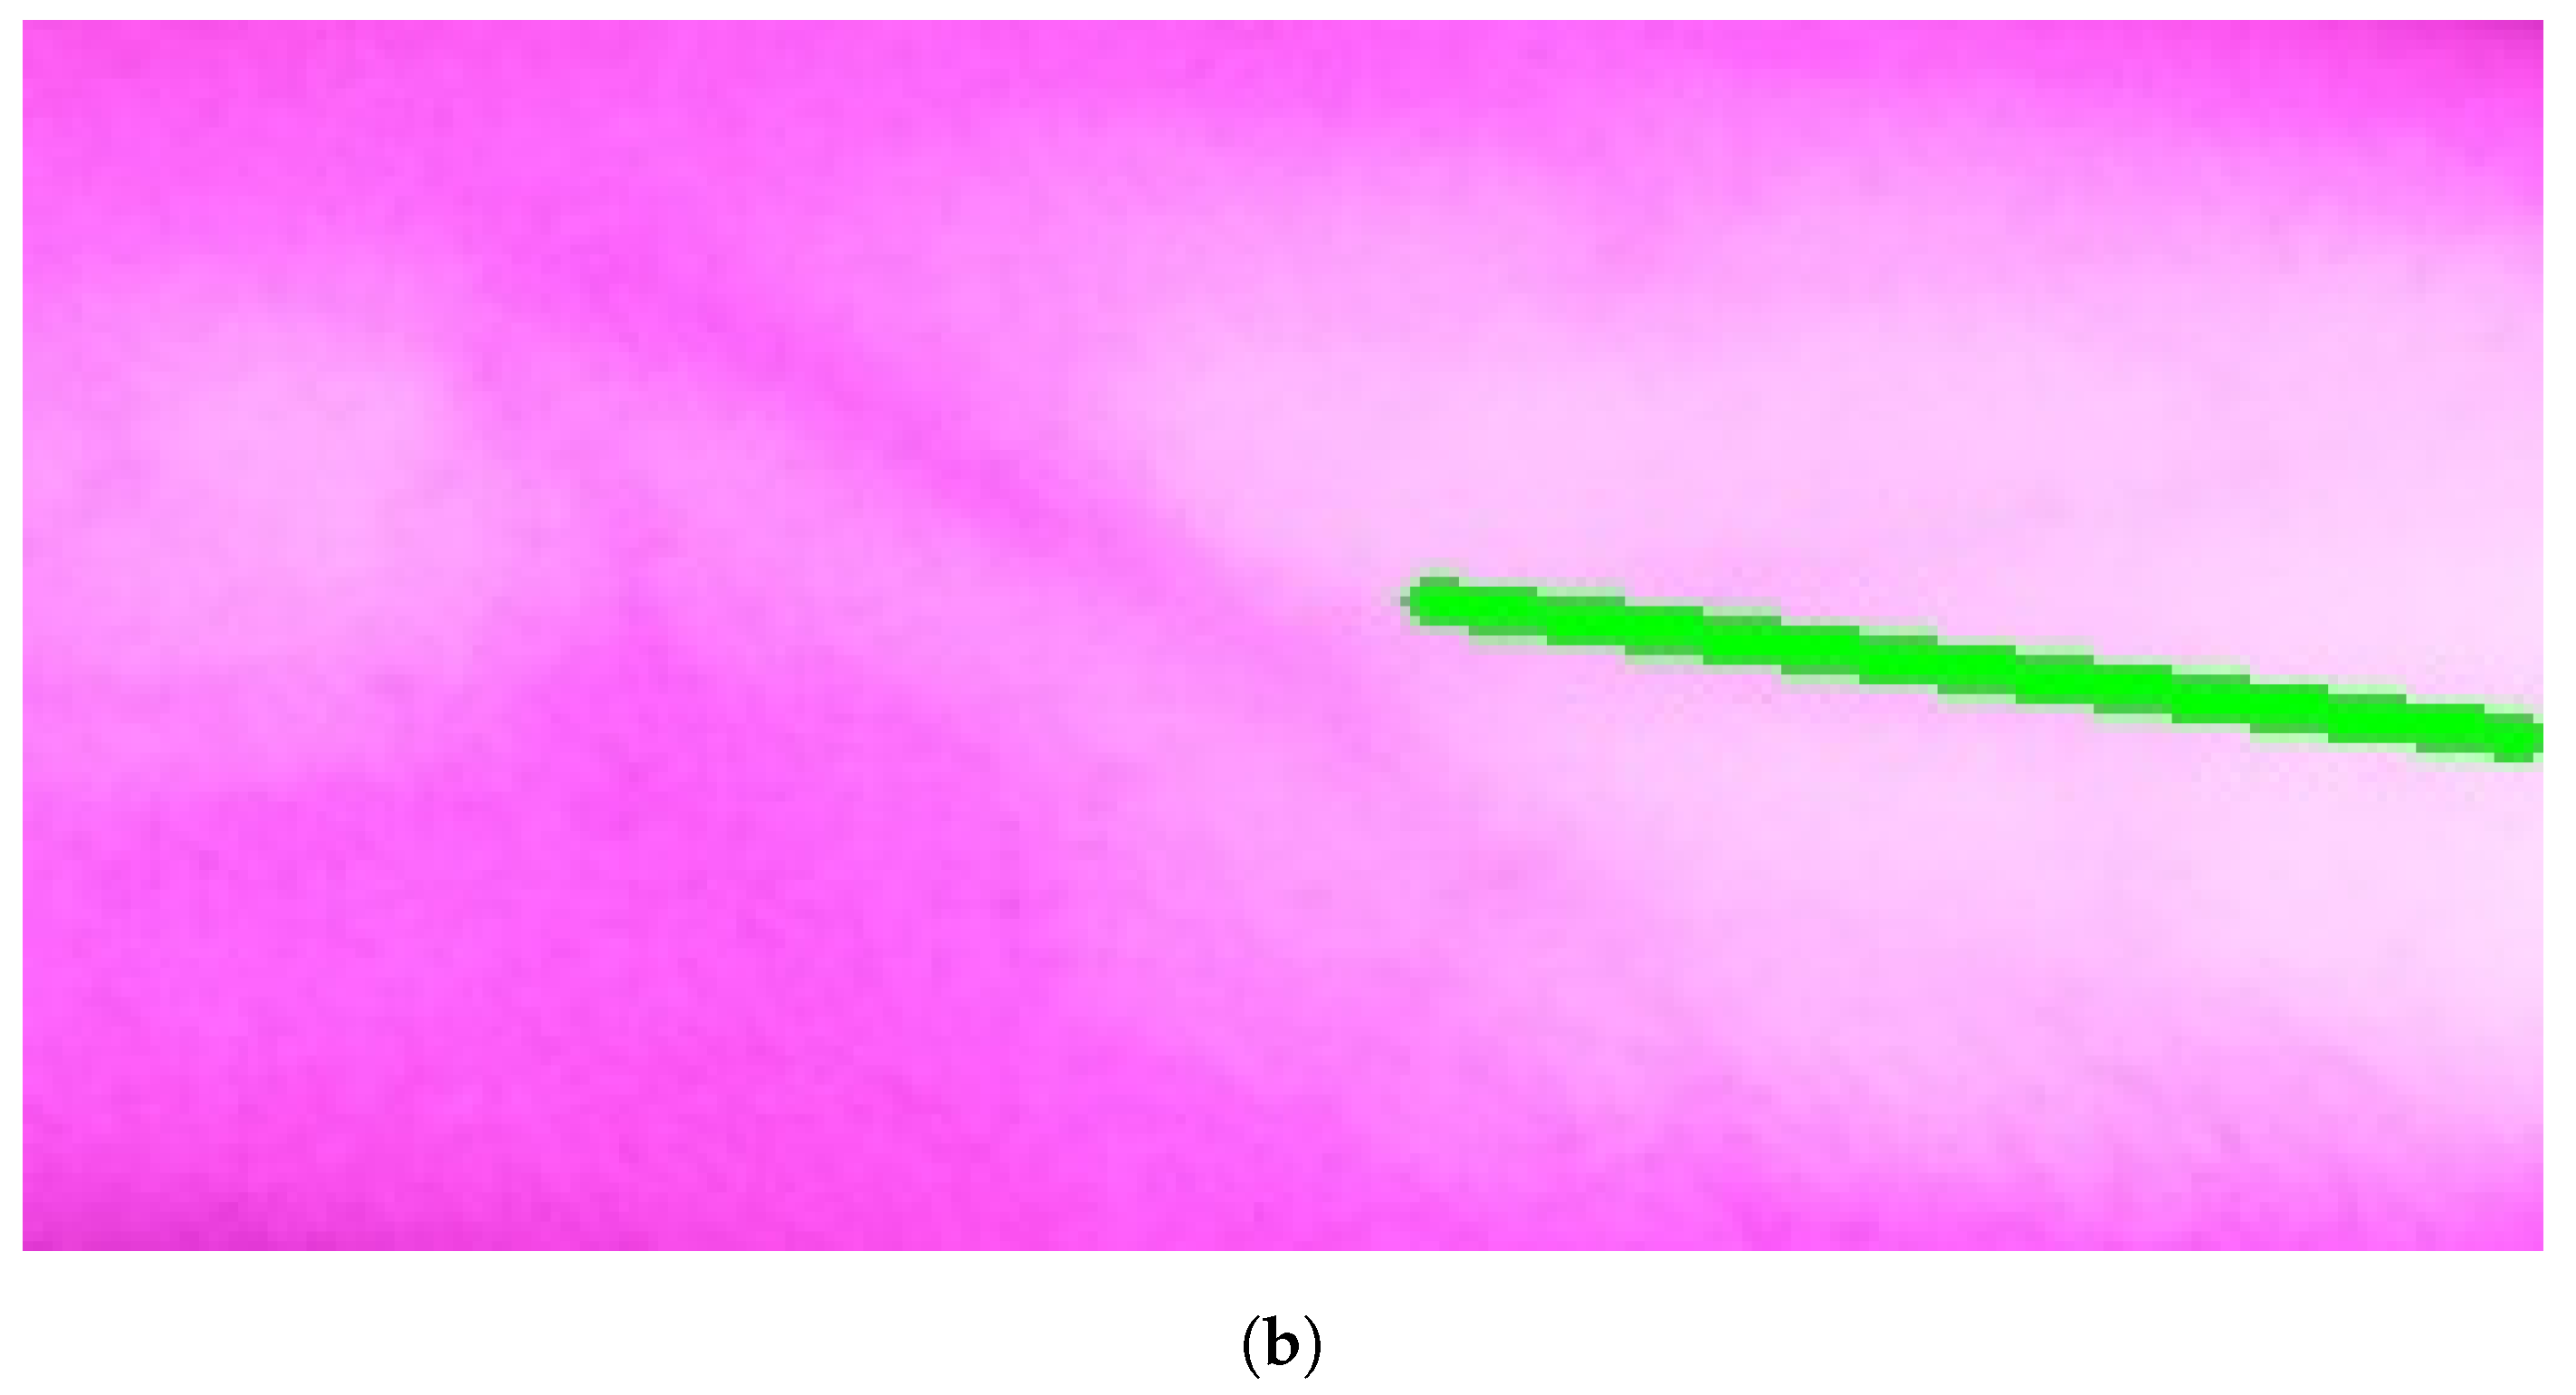
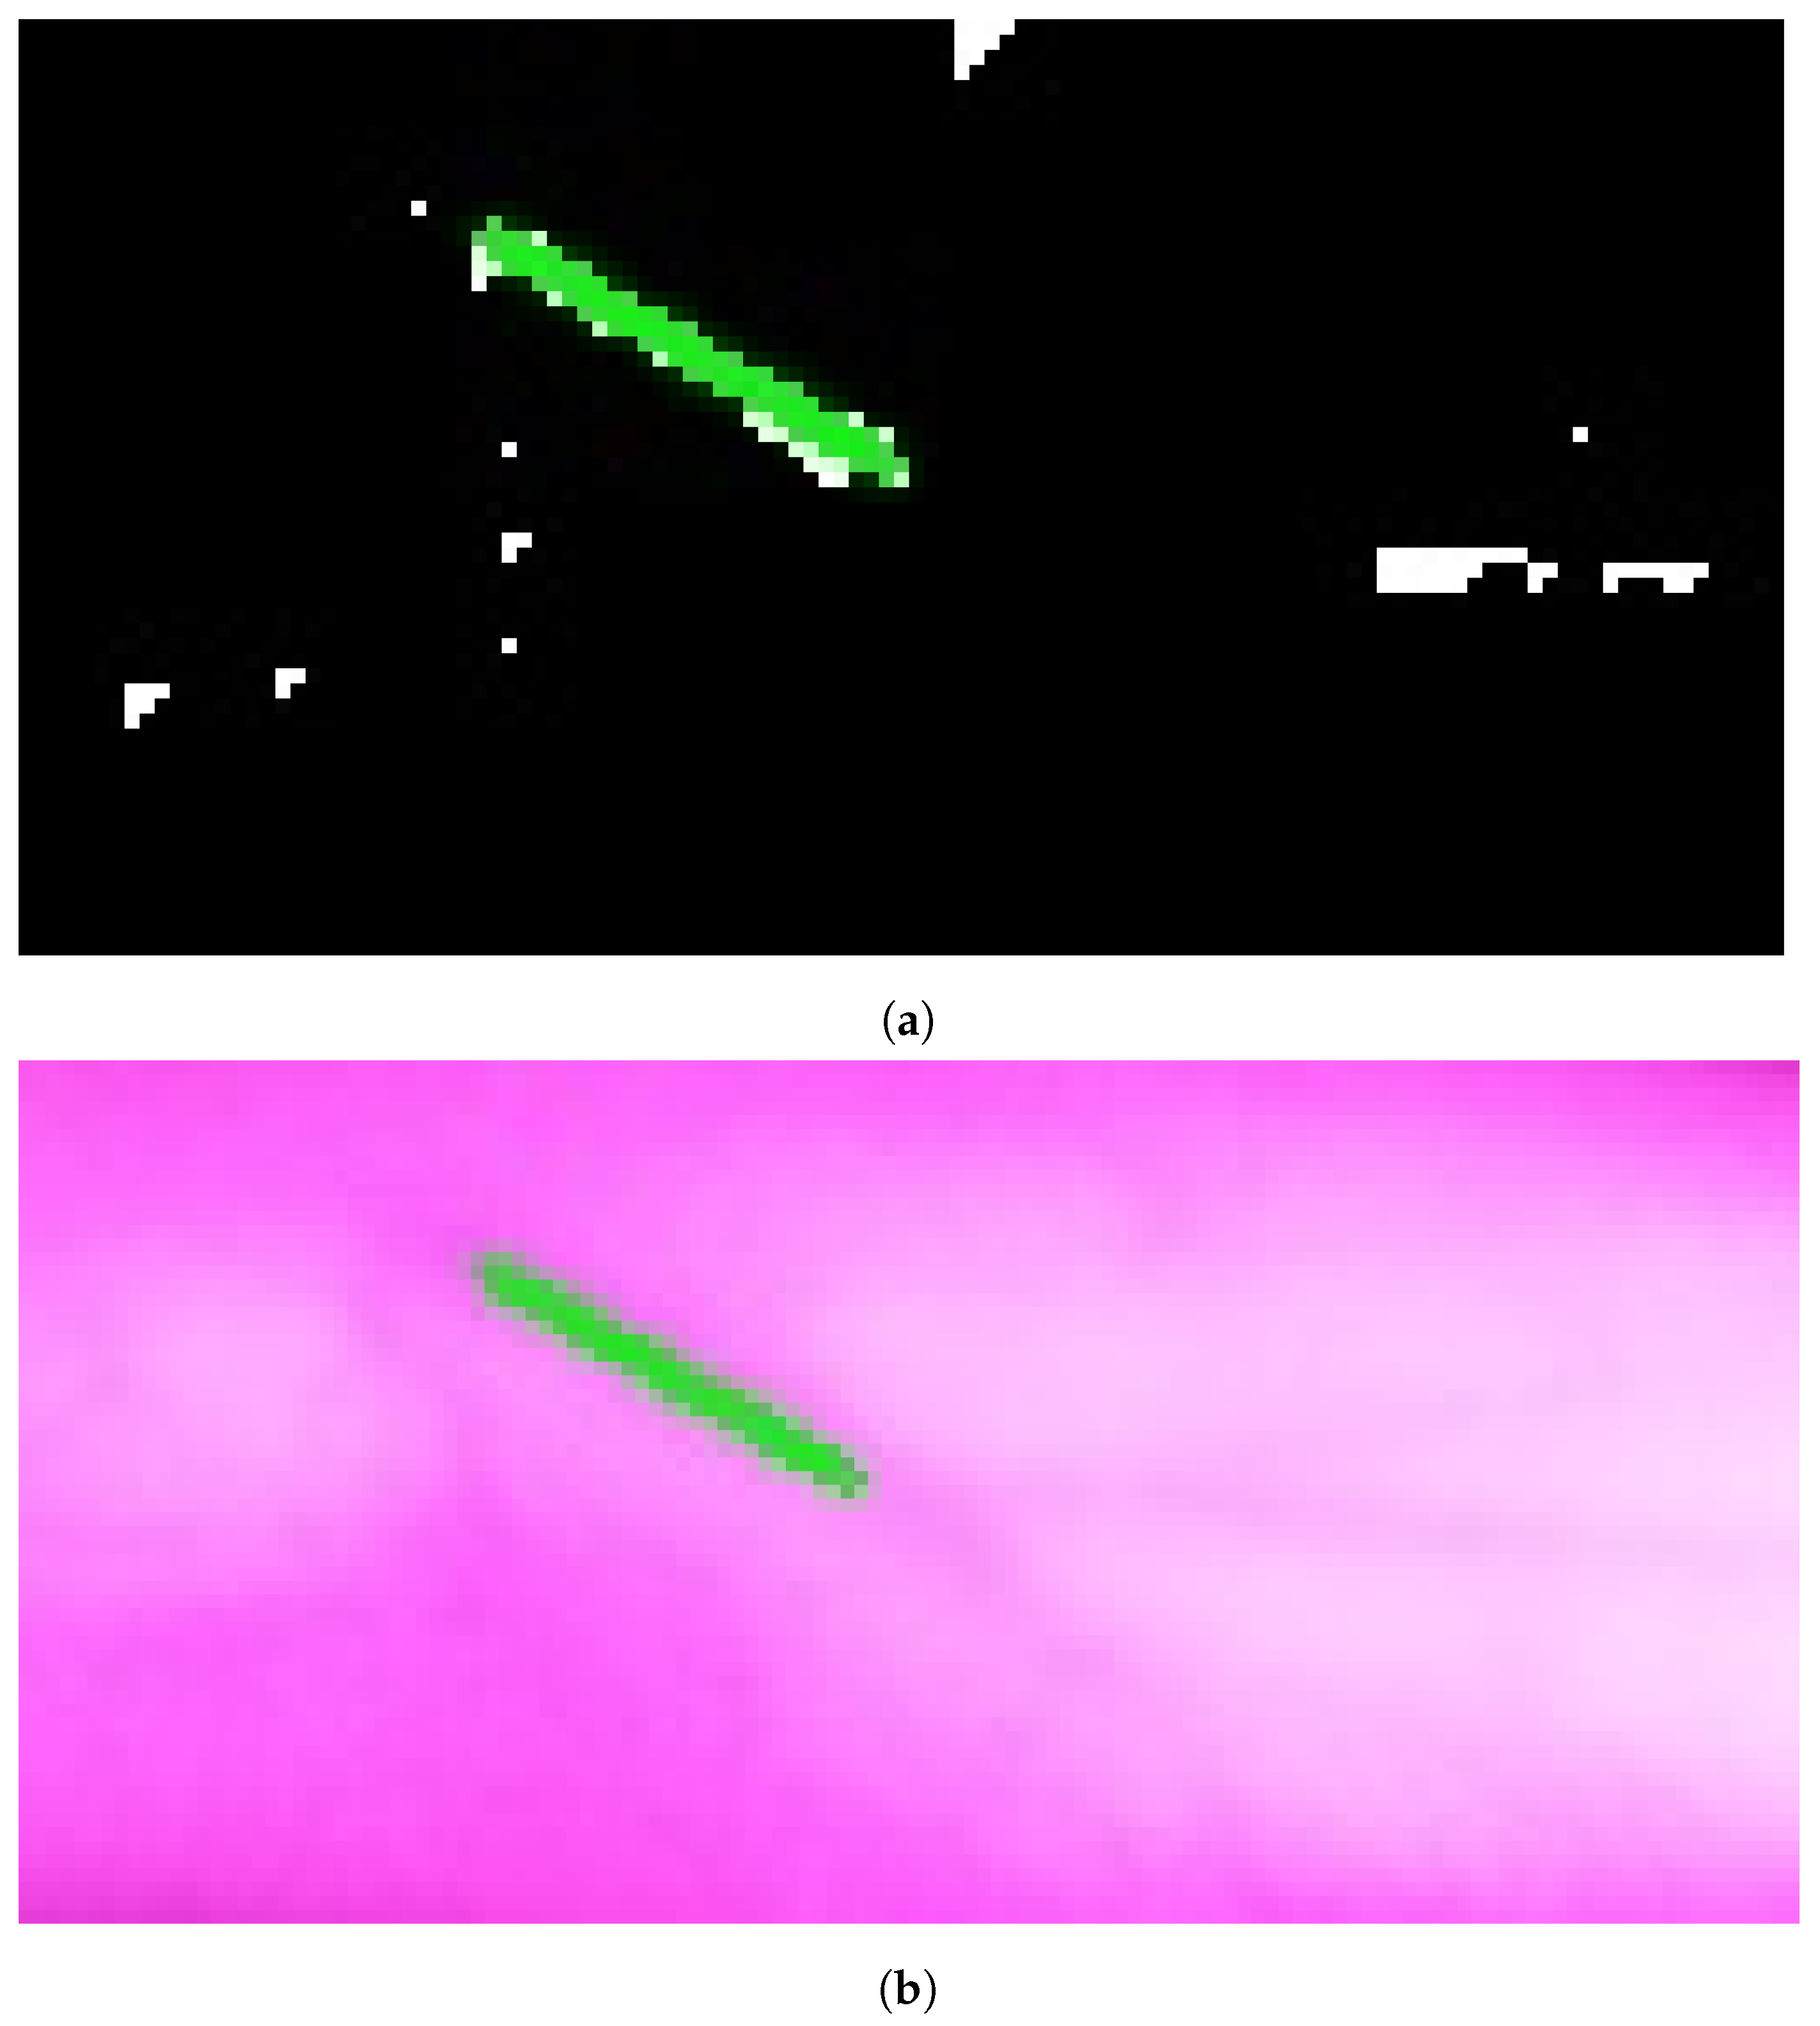
Figure 10a, Figure 11a, and Figure 12a show the results when applying Model B on the image shown in Figure 6c at different scales (original spatial resolution, 1evel and 2evels of downsampling). The corresponding final results when highlighting the resultingines on the original image are displayed in Figure 10b, Figure 11b, and Figure 12b.
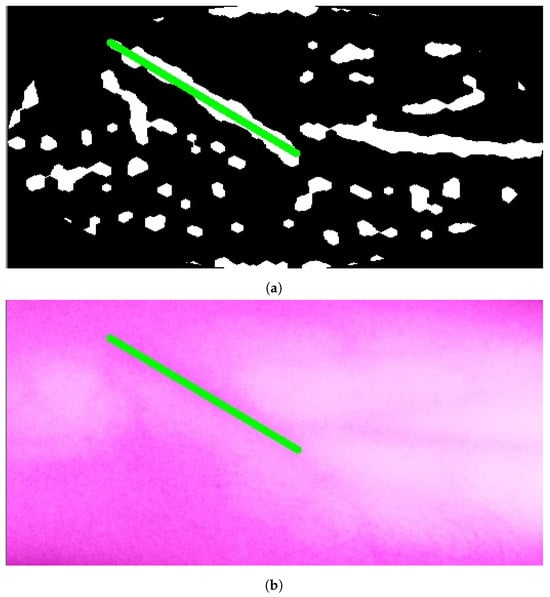
Figure 10.
Stage 5, vein selection using Model B for image with original spatial resolution: (a) highlighting vein for binary image; (b) detected vein in the cropped image. The greenine is the module selection output, and the rest of the image is the retrieved infrared image from the camera.
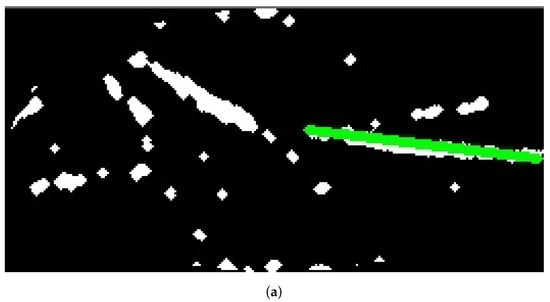
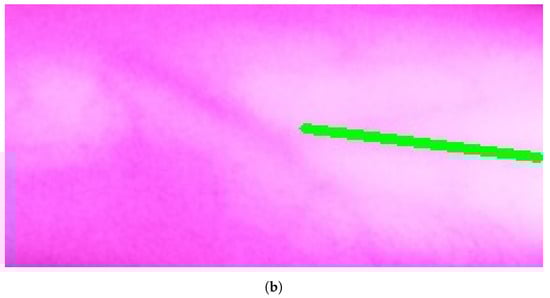
Figure 11.
Stage 5 Vein Selection using Model B for image with oneevel downsample: (a) Highlighting Vein for Binary Image; (b) Detected Vein in the Cropped Image.
Figure 12.
Stage 5, vein selection using Model B for image with twoevels downsample: (a) highlighting vein for binary image; (b) detected vein in the cropped image. The redine and greenine in (a,b) correspond to the vein extraction’s output that is displayed through the segmented and captured images respectively.
A medical expert examines the results obtained from vein selection approaches. When results are unsatisfactory, the vein extraction module is re-run using different IR emitter intensities. This increases the potential to find a suitable vein for injection.
Vein selection models mark the vein that is represented by aine by defining theine’s two-ended points. This information is used to calculate the required trajectory where the point’s positions and their trajectories are sent to the microcontroller that guides the robotic arm to process the actual vein injection itself.
3. Results
In this section, the performance of the proposed system is analyzed for twenty-three test cases. These images belong to twenty male participants and three females.
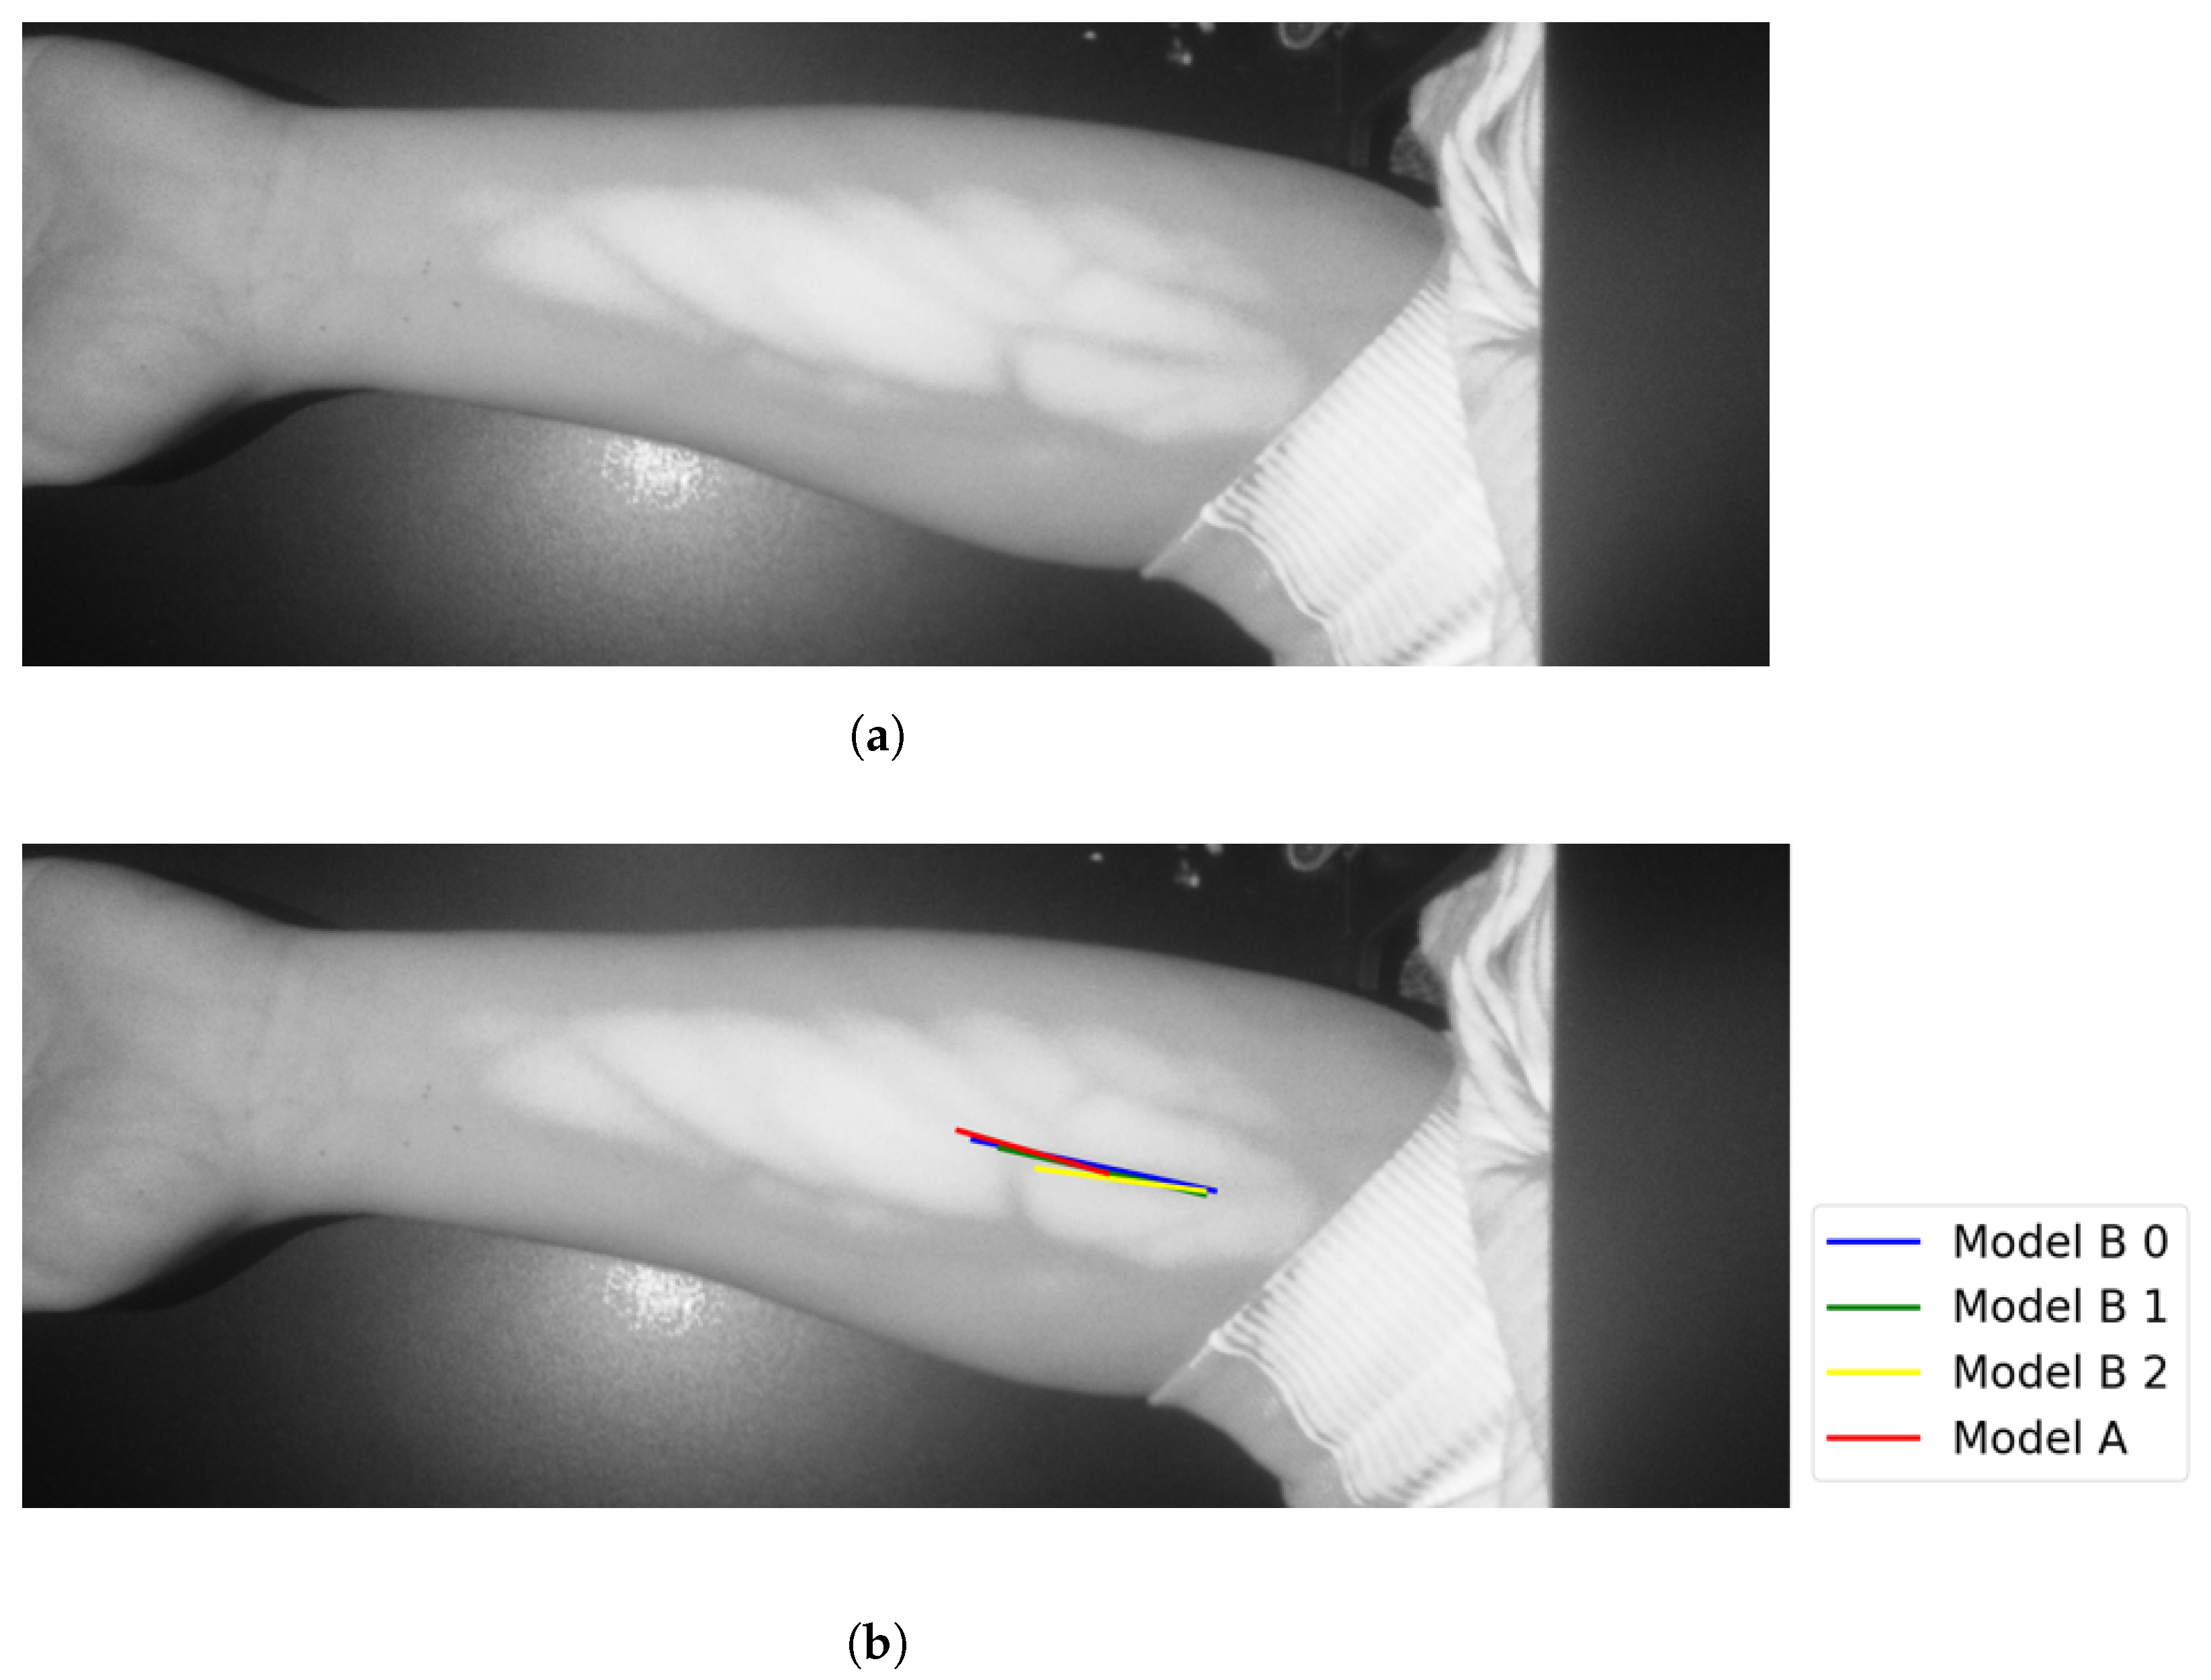
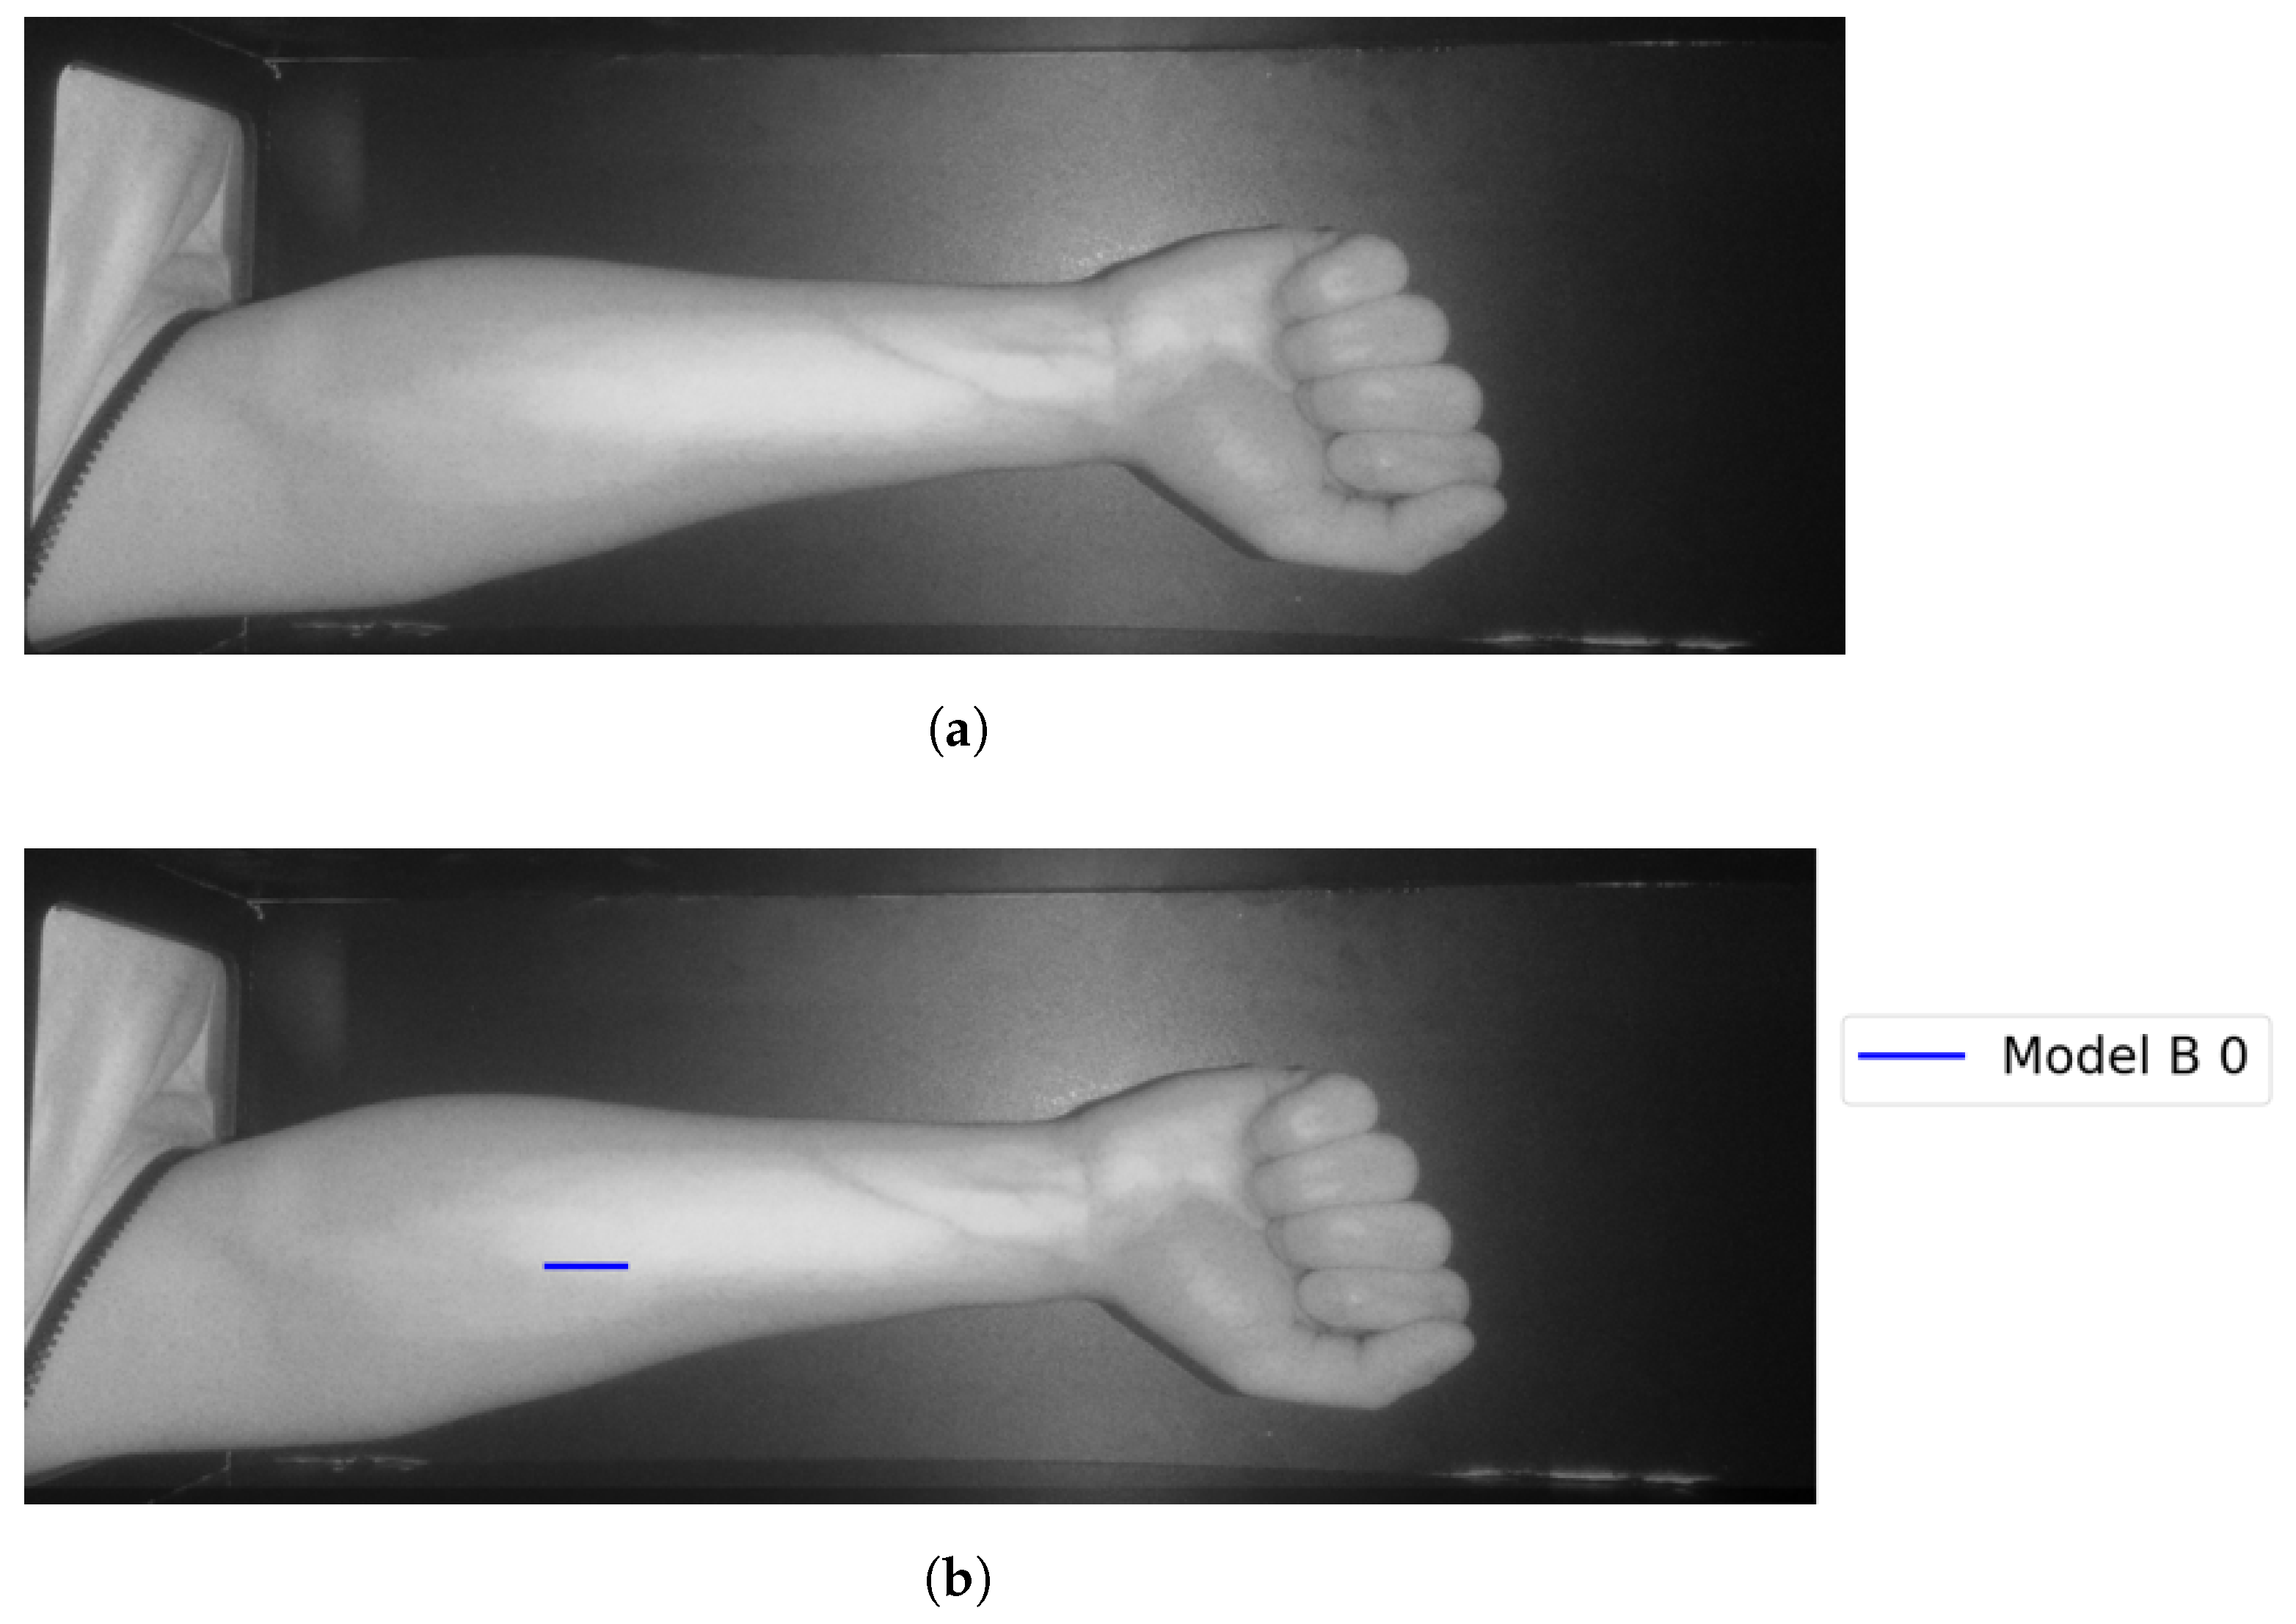
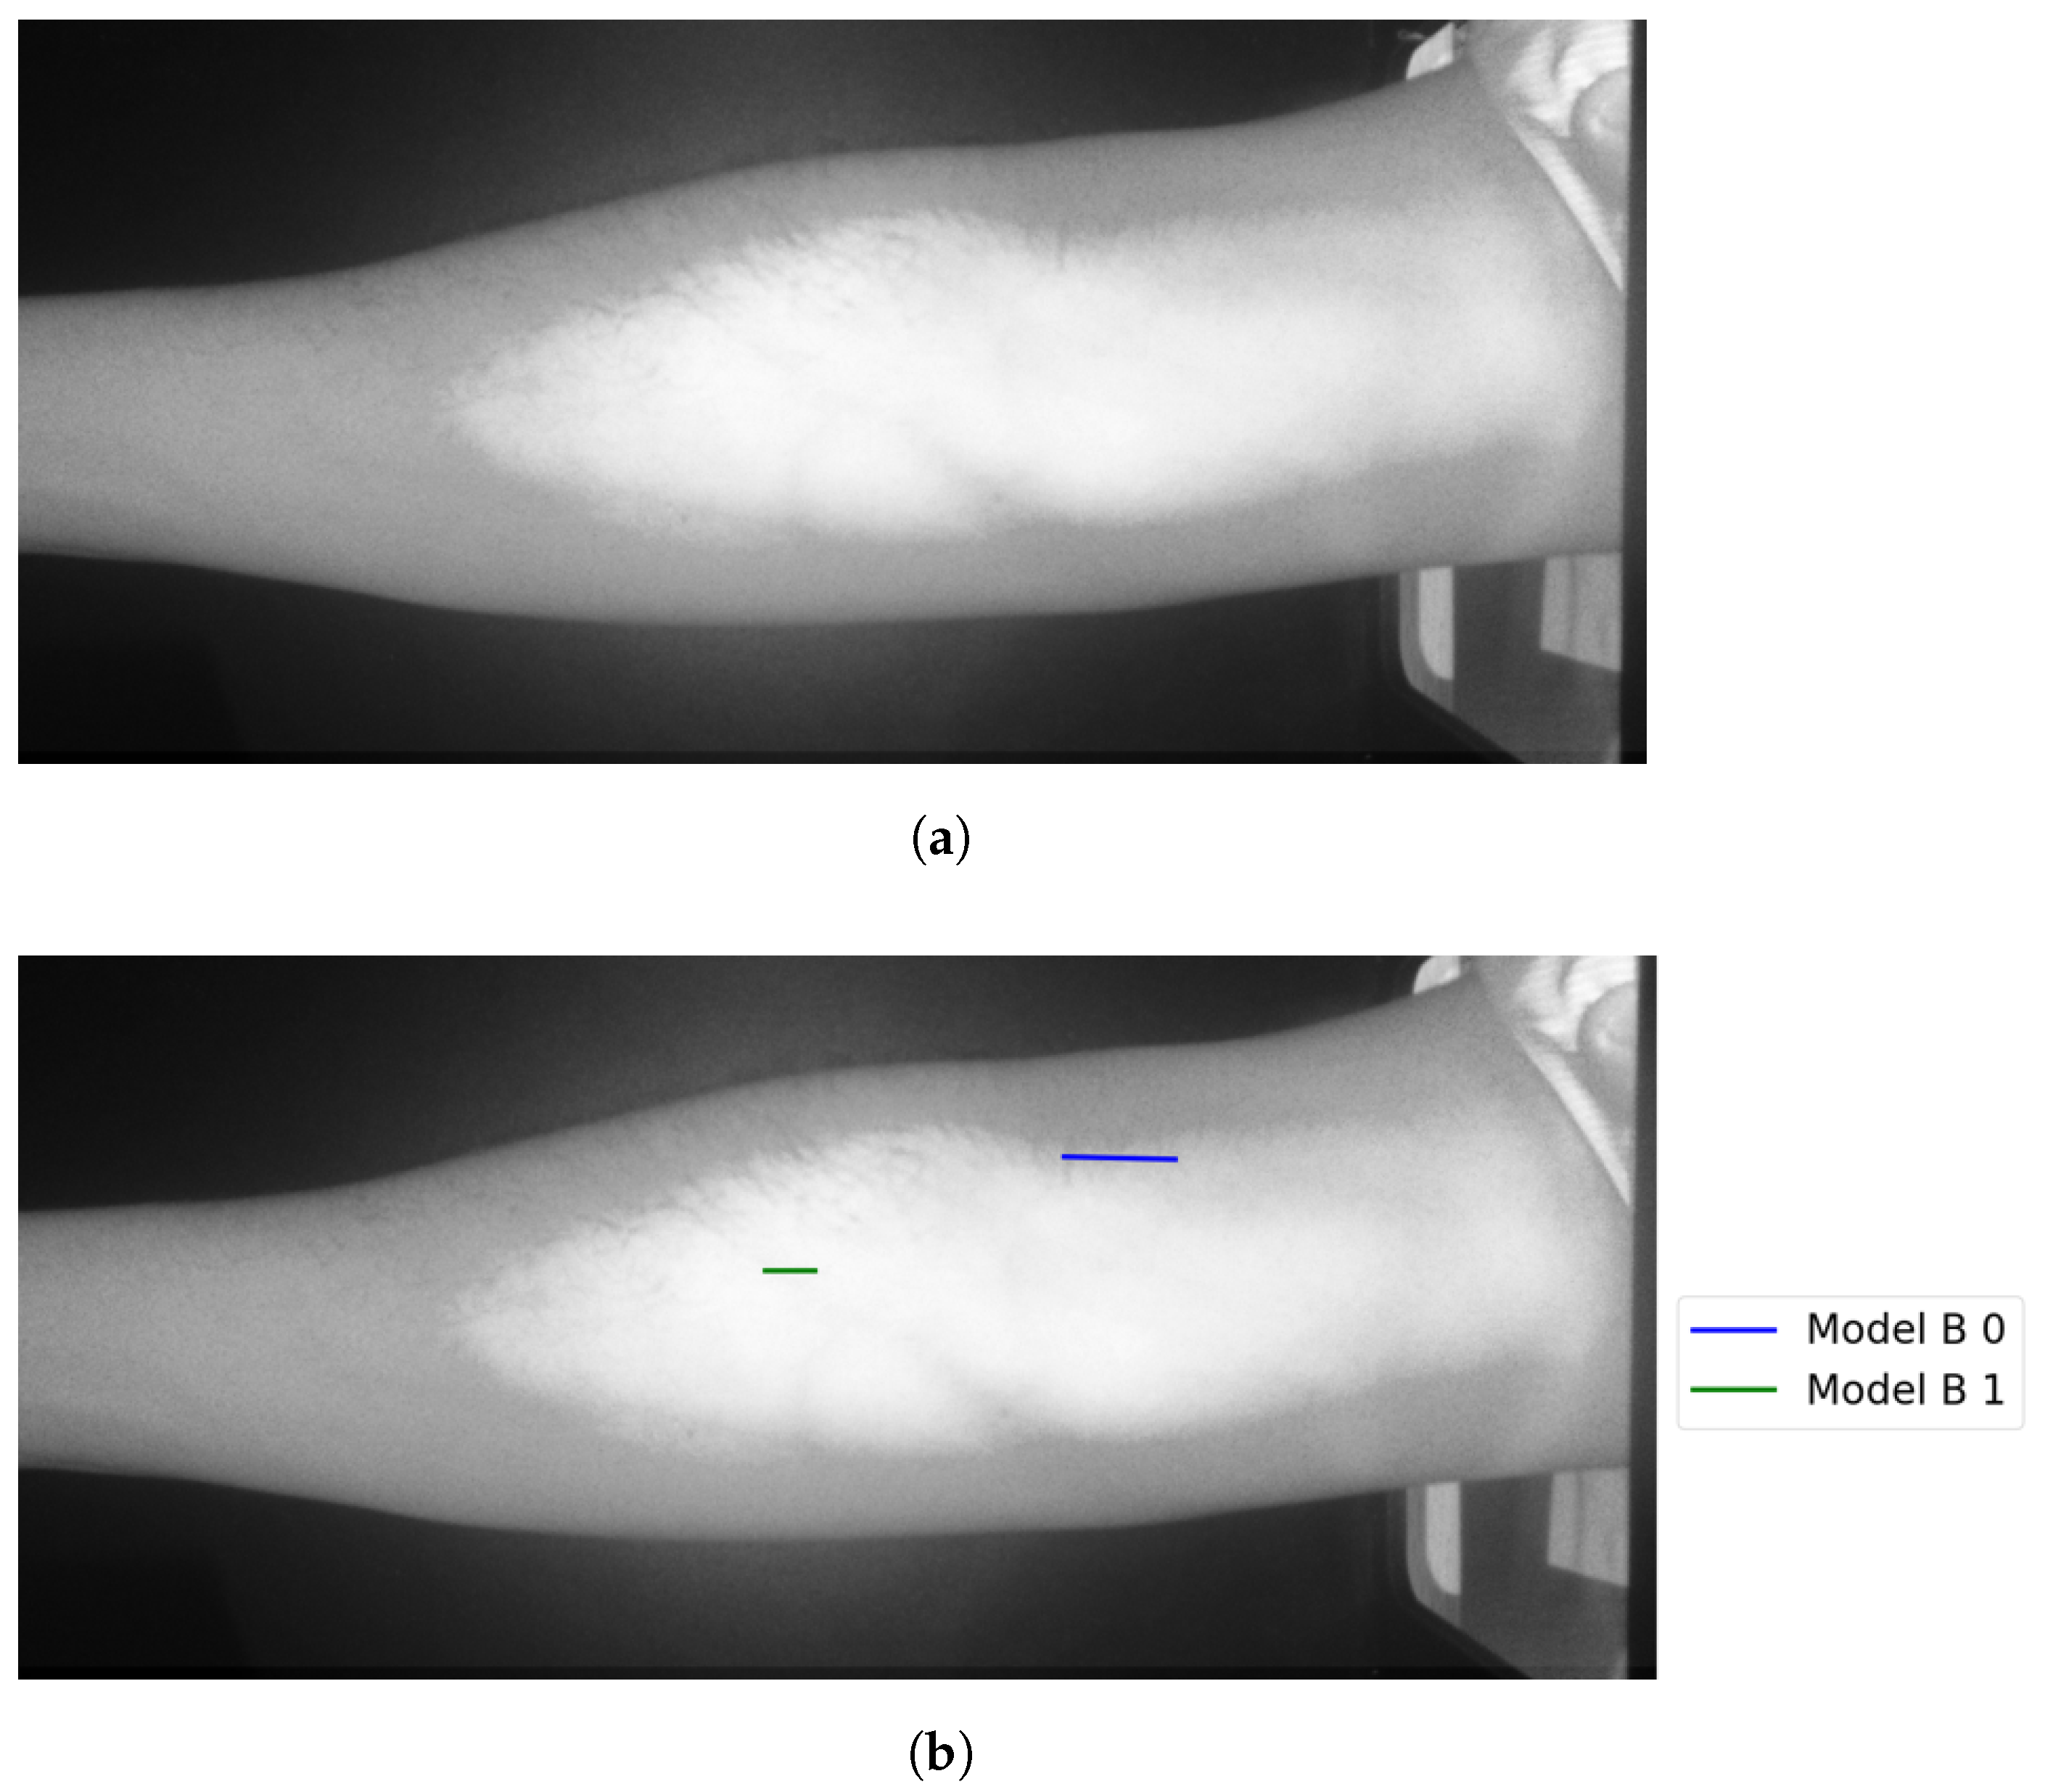
The following figures illustrate the proposed vein extraction module by presenting the results from the vein selection stage using Models A and B separately on a set of test cases images. There are six groups of vein selection results. Comparing both Model A and Model B, the selected vein is either identical, similar, or different. Group A refers to the vein selection results when vein selection is identical when deploying Model A or Model B. Group A has about 21.74% of the test cases. Figure 13 and Figure 14 show the identical vein selection from both models. In all figures, abels Model B0, Model B1, and Model B2 refer to Model B results when operating on original image resolution, oneevel of downsample and twoevels of downsample, respectively. Group B is related to the vein selection results when both Models A and B obtain similar vein selection. Group B contributes about 26.1% of the test cases. Part of this group’s cases are depicted in Figure 15 and Figure 16.
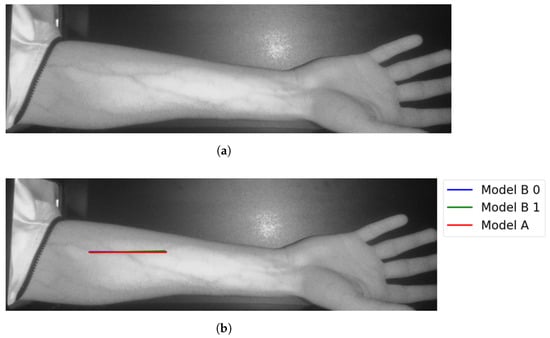
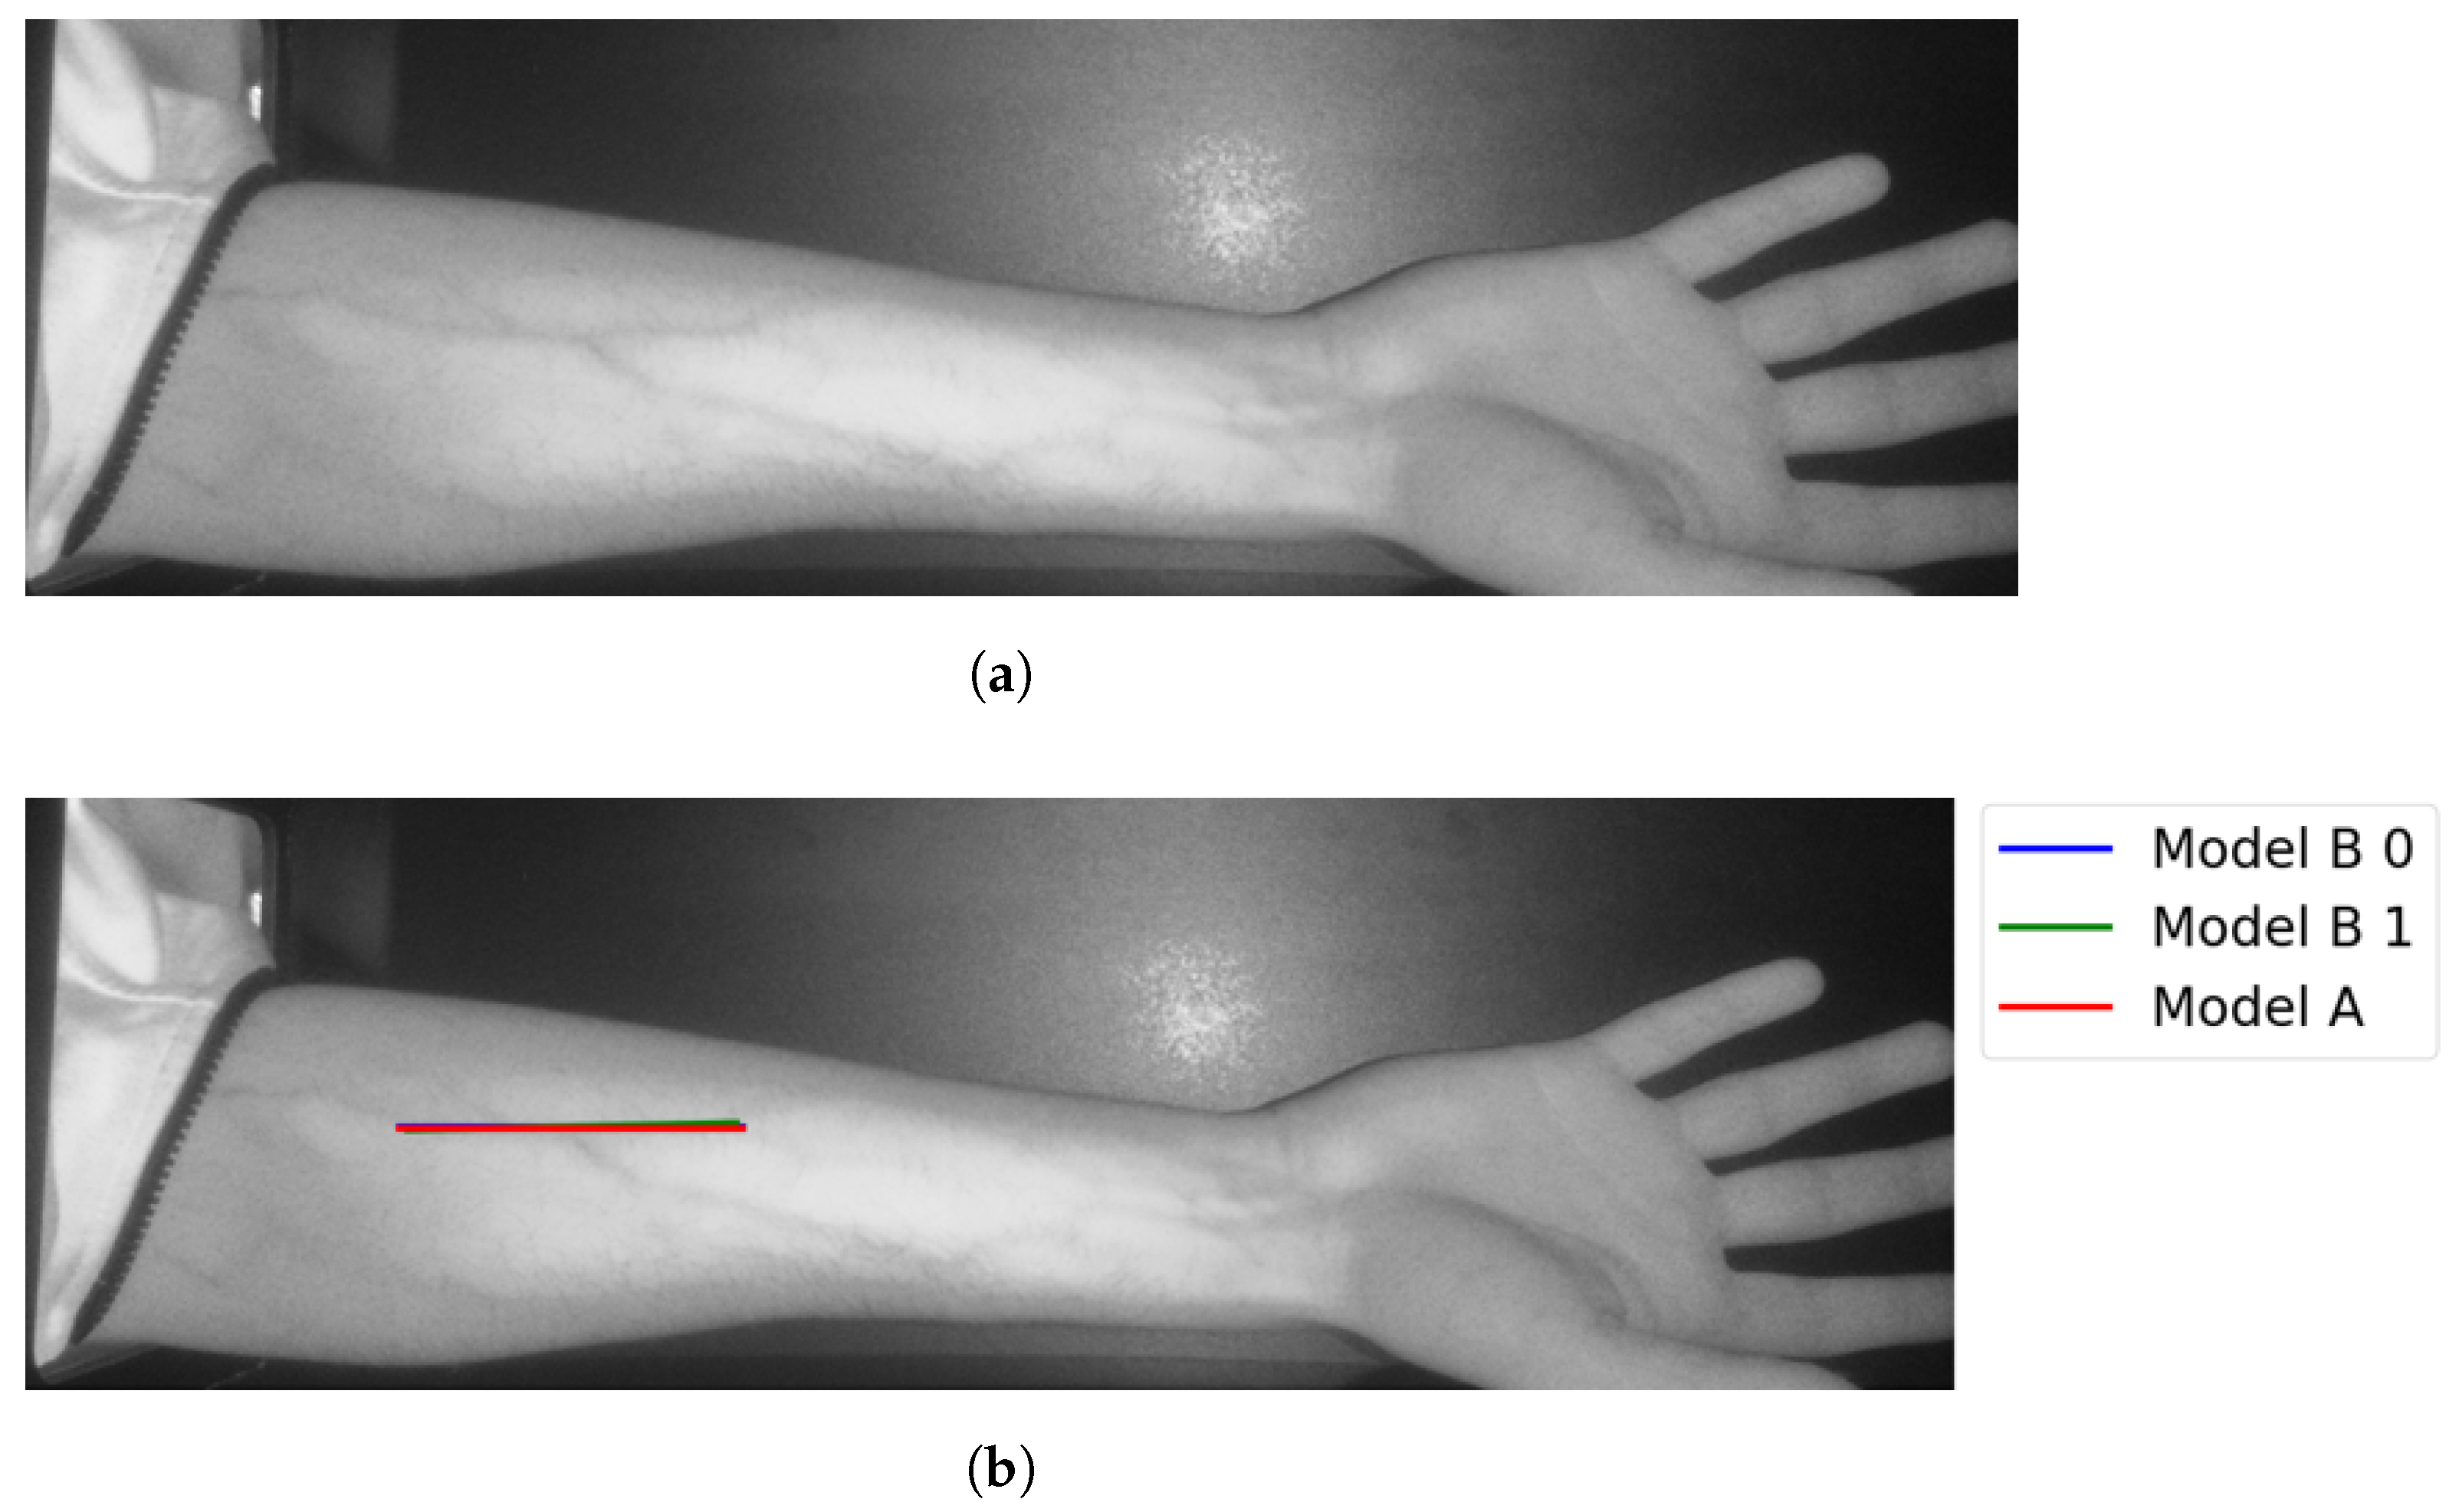
Figure 13.
Matching vein selection results for Image 7: (a) original image; (b) models’ output.
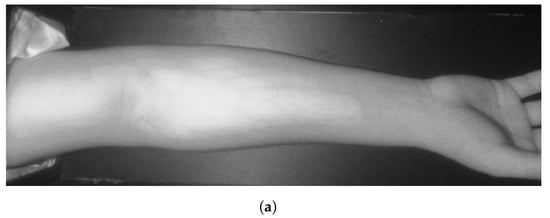
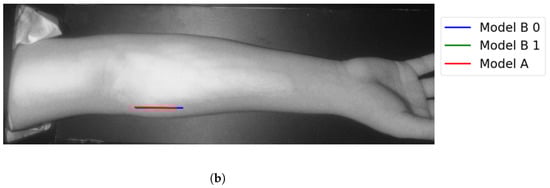
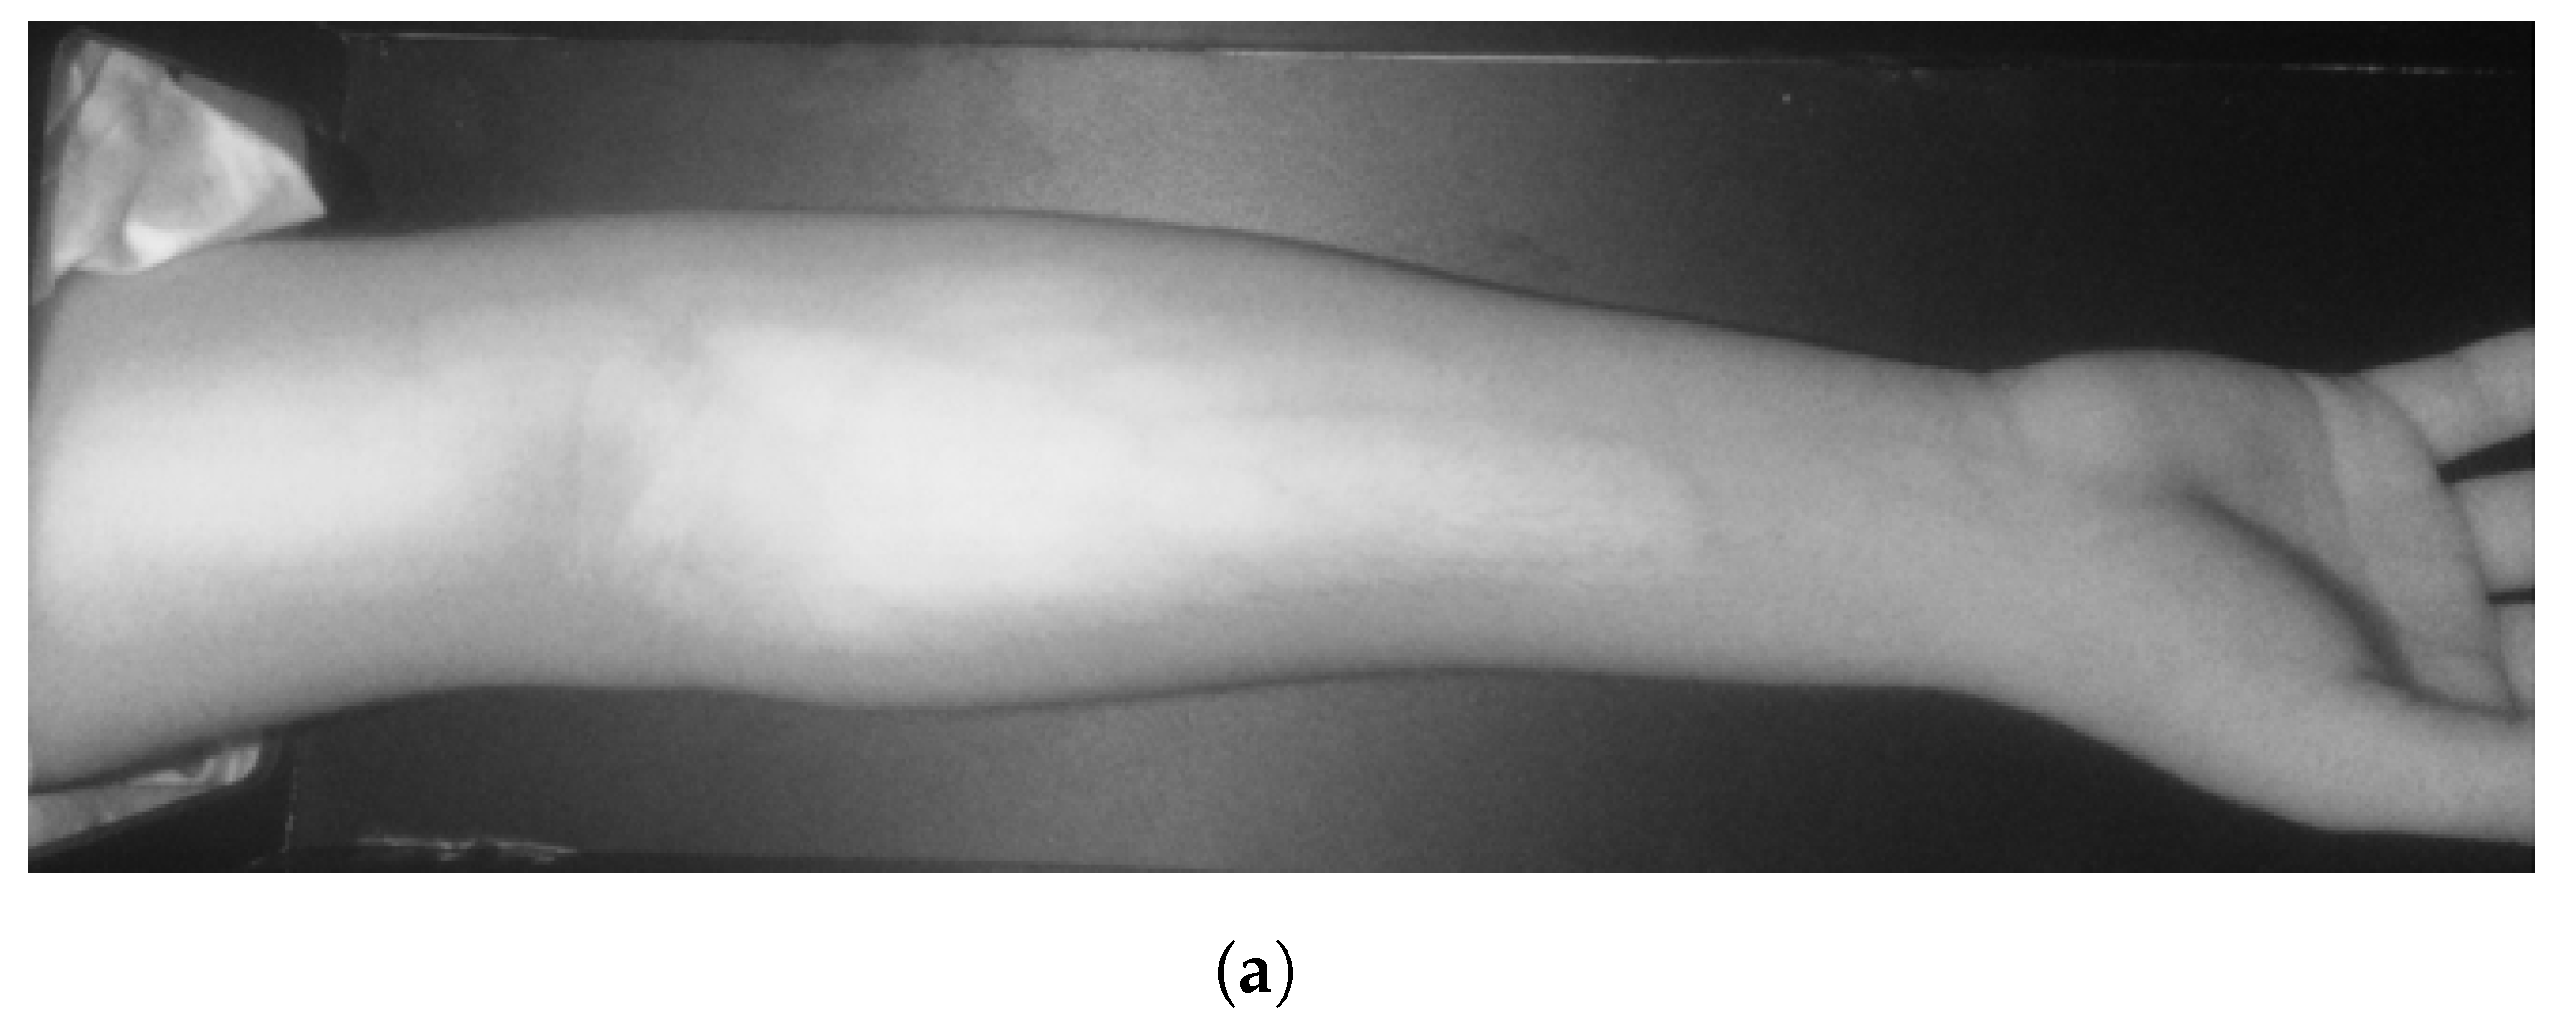
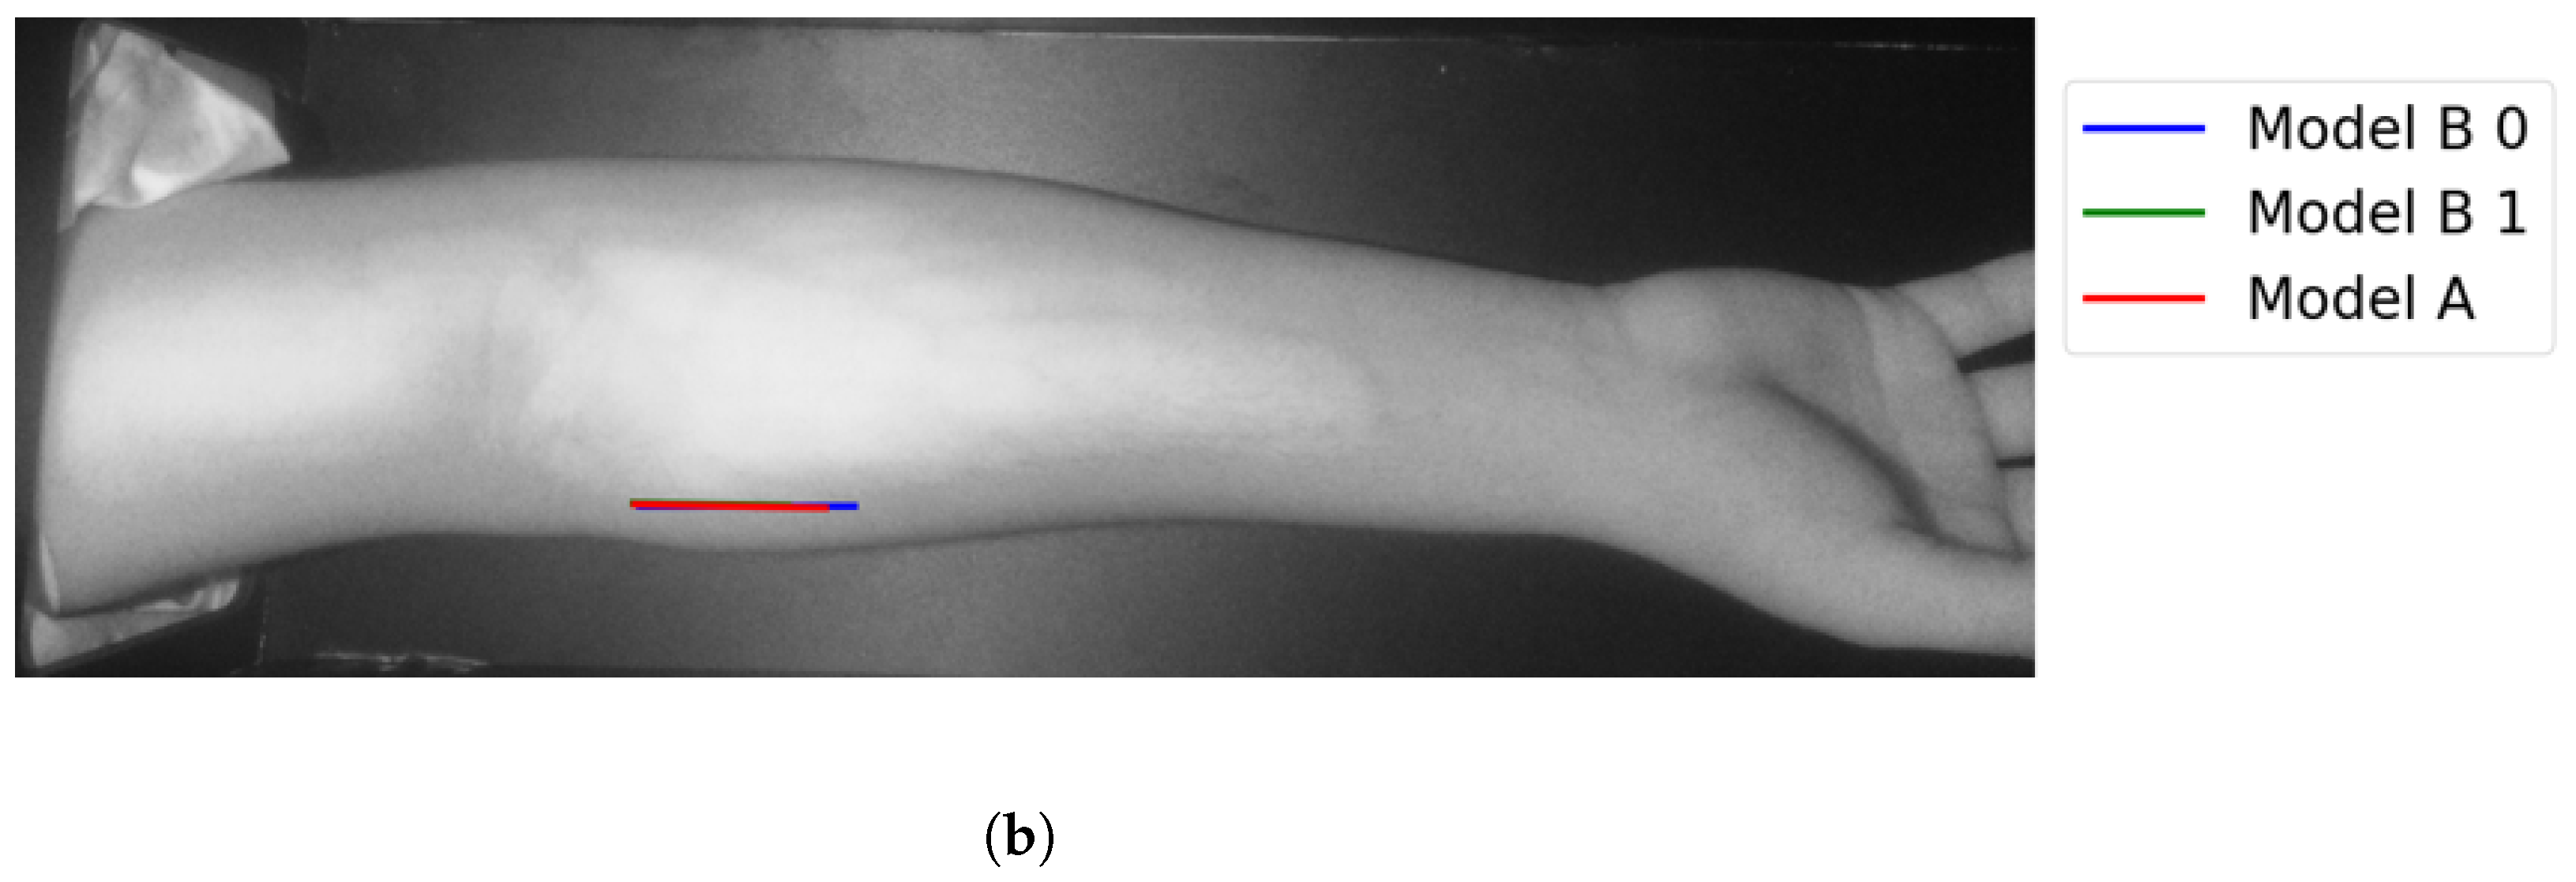
Figure 14.
Matching vein selection results for Image 12: (a) original image; (b) models’ output.
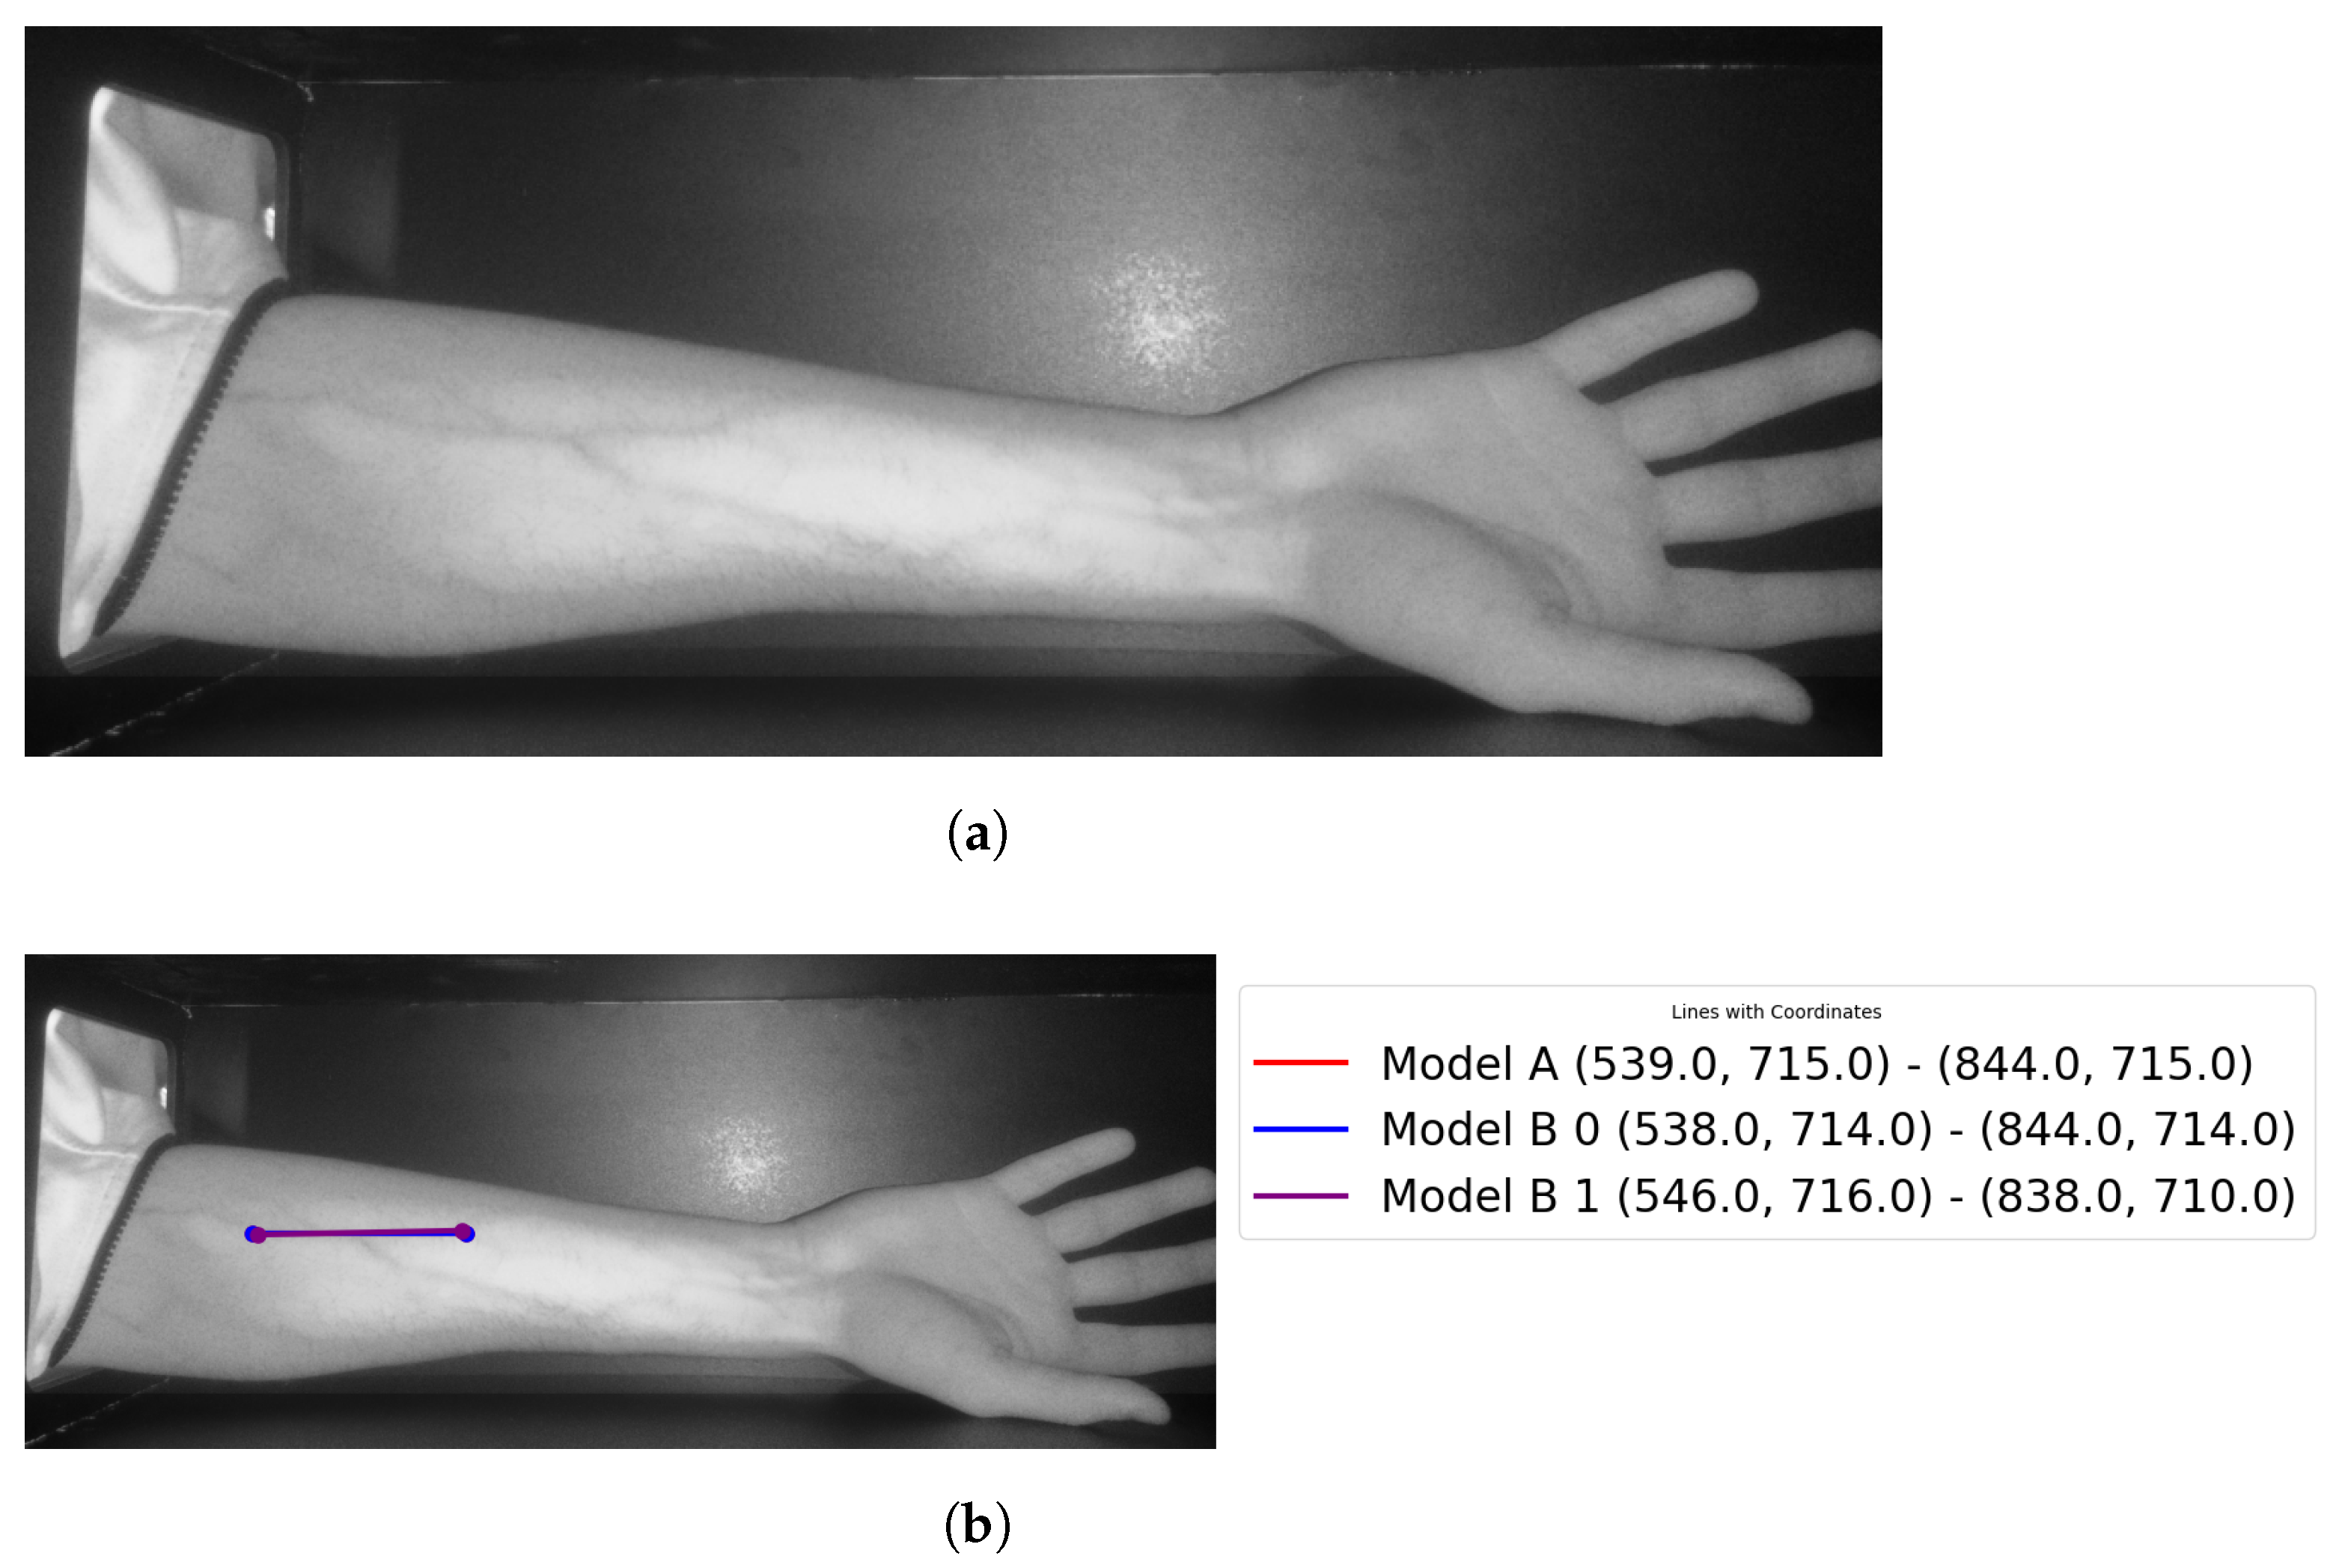
Figure 15.
Similar vein selection results for Image 16: (a) original image; (b) models’ output.
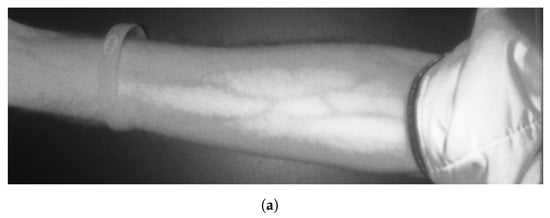
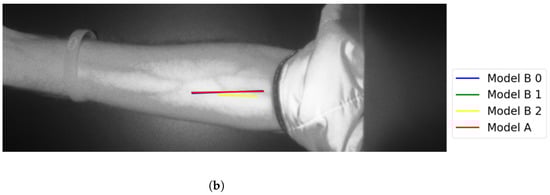
Figure 16.
Similar vein selection results for Image 22: (a) original image; (b) models’ output.
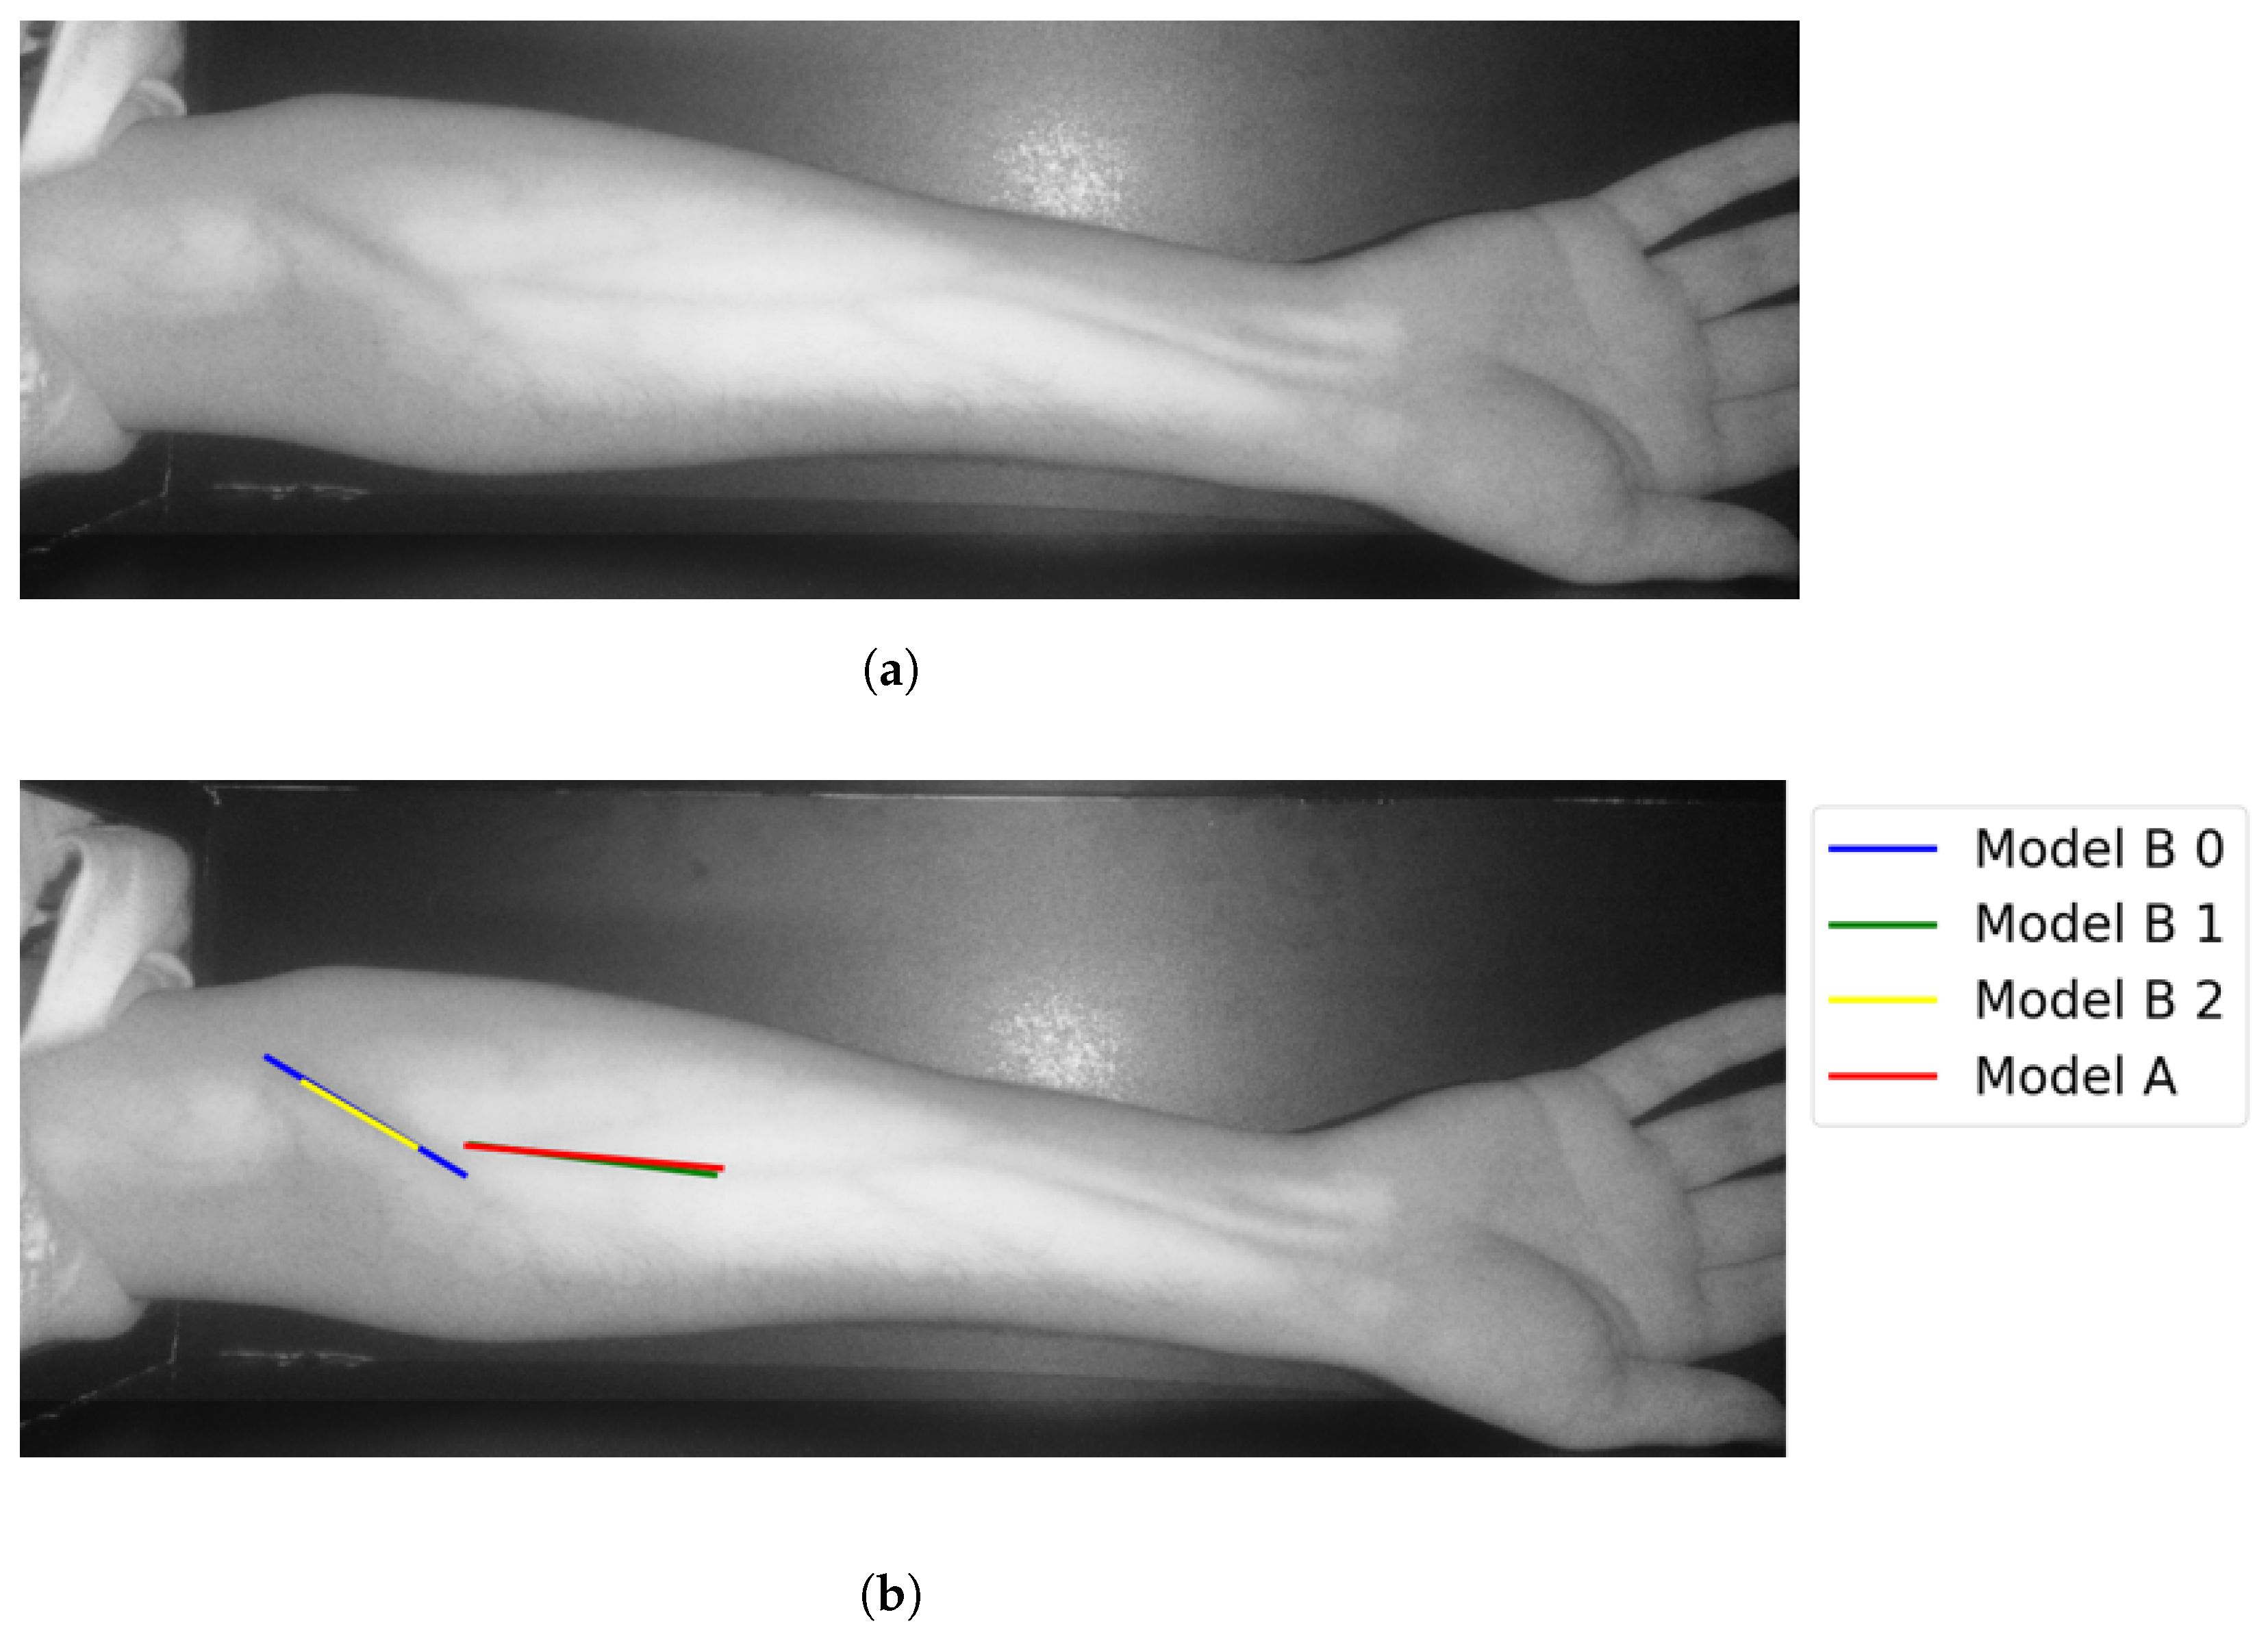
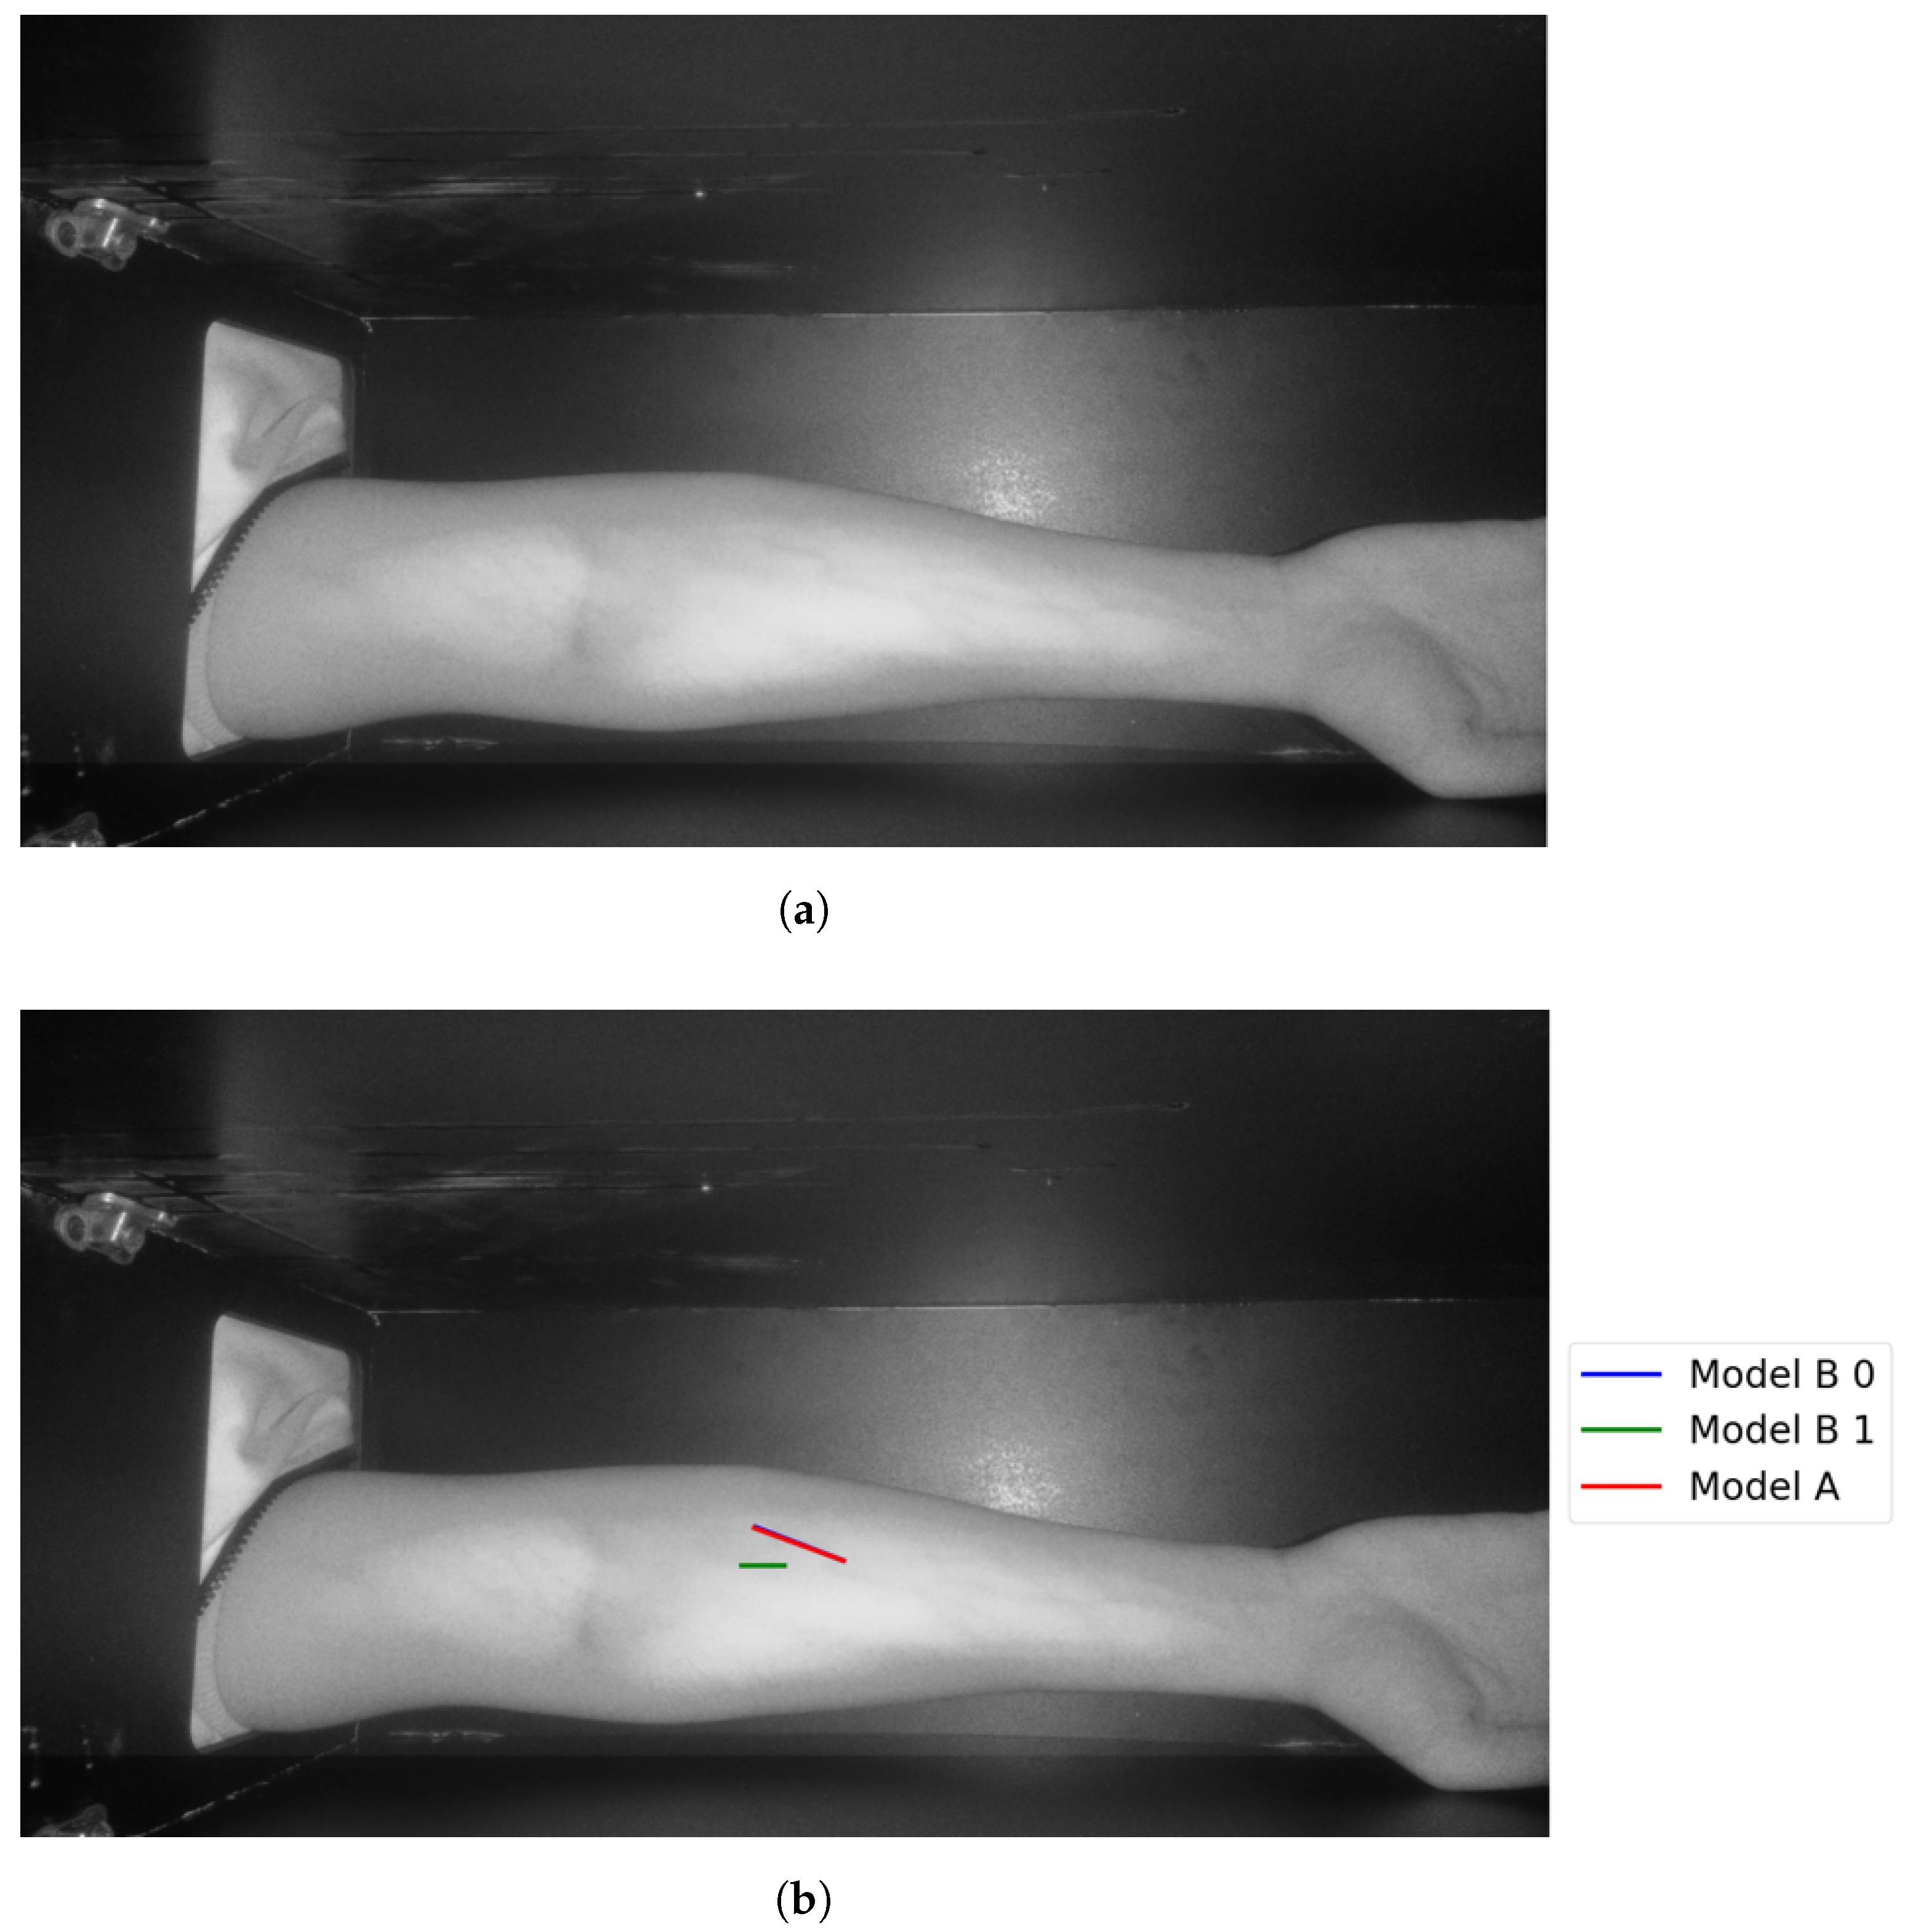
In Group C, Model and Model B extract different vein selections, and both results are accepted for the vein injection. This group has about 8.7% among all test cases. Parts of these results are depicted in Figure 17 and Figure 18. Groups D and E refer to images when one of the models (A or B) succeeds in retrieving the correct vein while the other model fails. Group D relates to the success of Model A to detect the correct vein while Group E corresponds to the correct vein selection from deploying Model B only. Both models have about 34.8% of test cases. Figure 19 and Figure 20 represent results related to Group D, while Figure 21 shows an example of Group E’s results. The amounts of cases related to Groups D and E are 30.43% and 4.35%, respectively. Considering Group D’s results in more detail, it is important to note that in all the case tests where Model A successfully extracts the correct vein for injection, Model B has several selections. Although one of these vein selections is similar to the corresponding one identified by Model A, it is not suggested during the vein extraction module. This is because of the unconformity for theine validation condition that occurs when deploying Model B. When there is noine coincident among theines extracted from deploying Model B, no vein is detected for the vein injection.
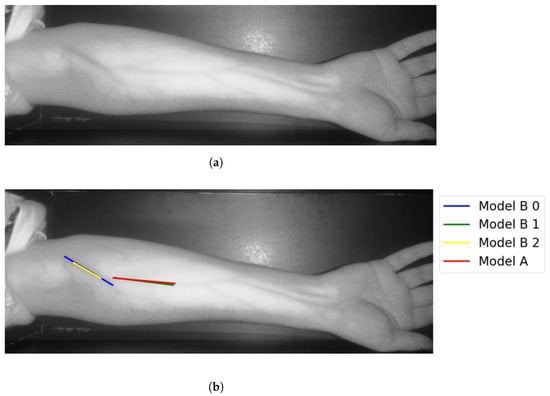
Figure 17.
Multiple correct vein selections for Image 1: (a) original image; (b) models’ output.
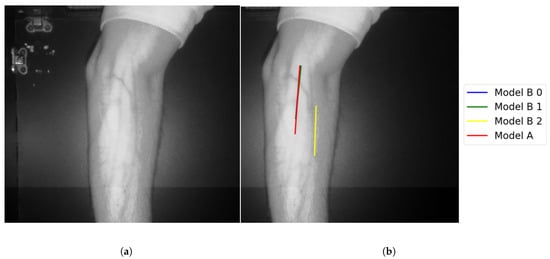
Figure 18.
Multiple correct vein selections for Image 15: (a) original image; (b) models’ output.
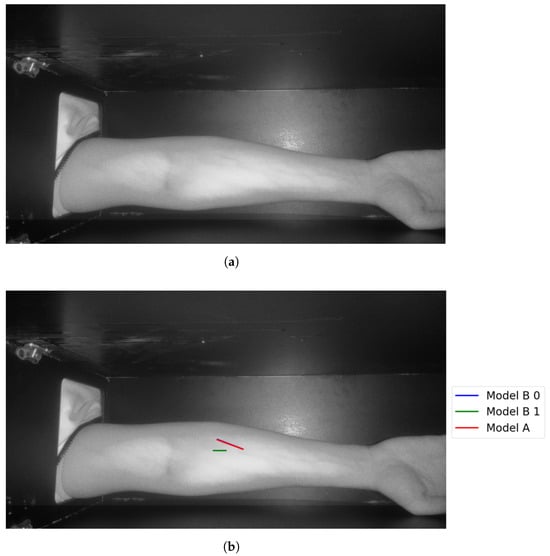
Figure 19.
Model A correctly identifies vein selection for Image 6: (a) original image; (b) models’ output.
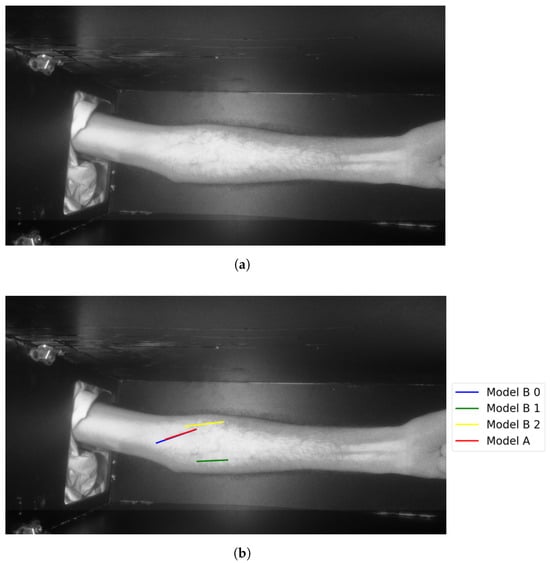
Figure 20.
Model A correctly identifies vein selection for Image 9: (a) original image; (b) models’ output.

Figure 21.
Model B correctly identifies vein selection for Image 3: (a) original image; (b) models’ output.
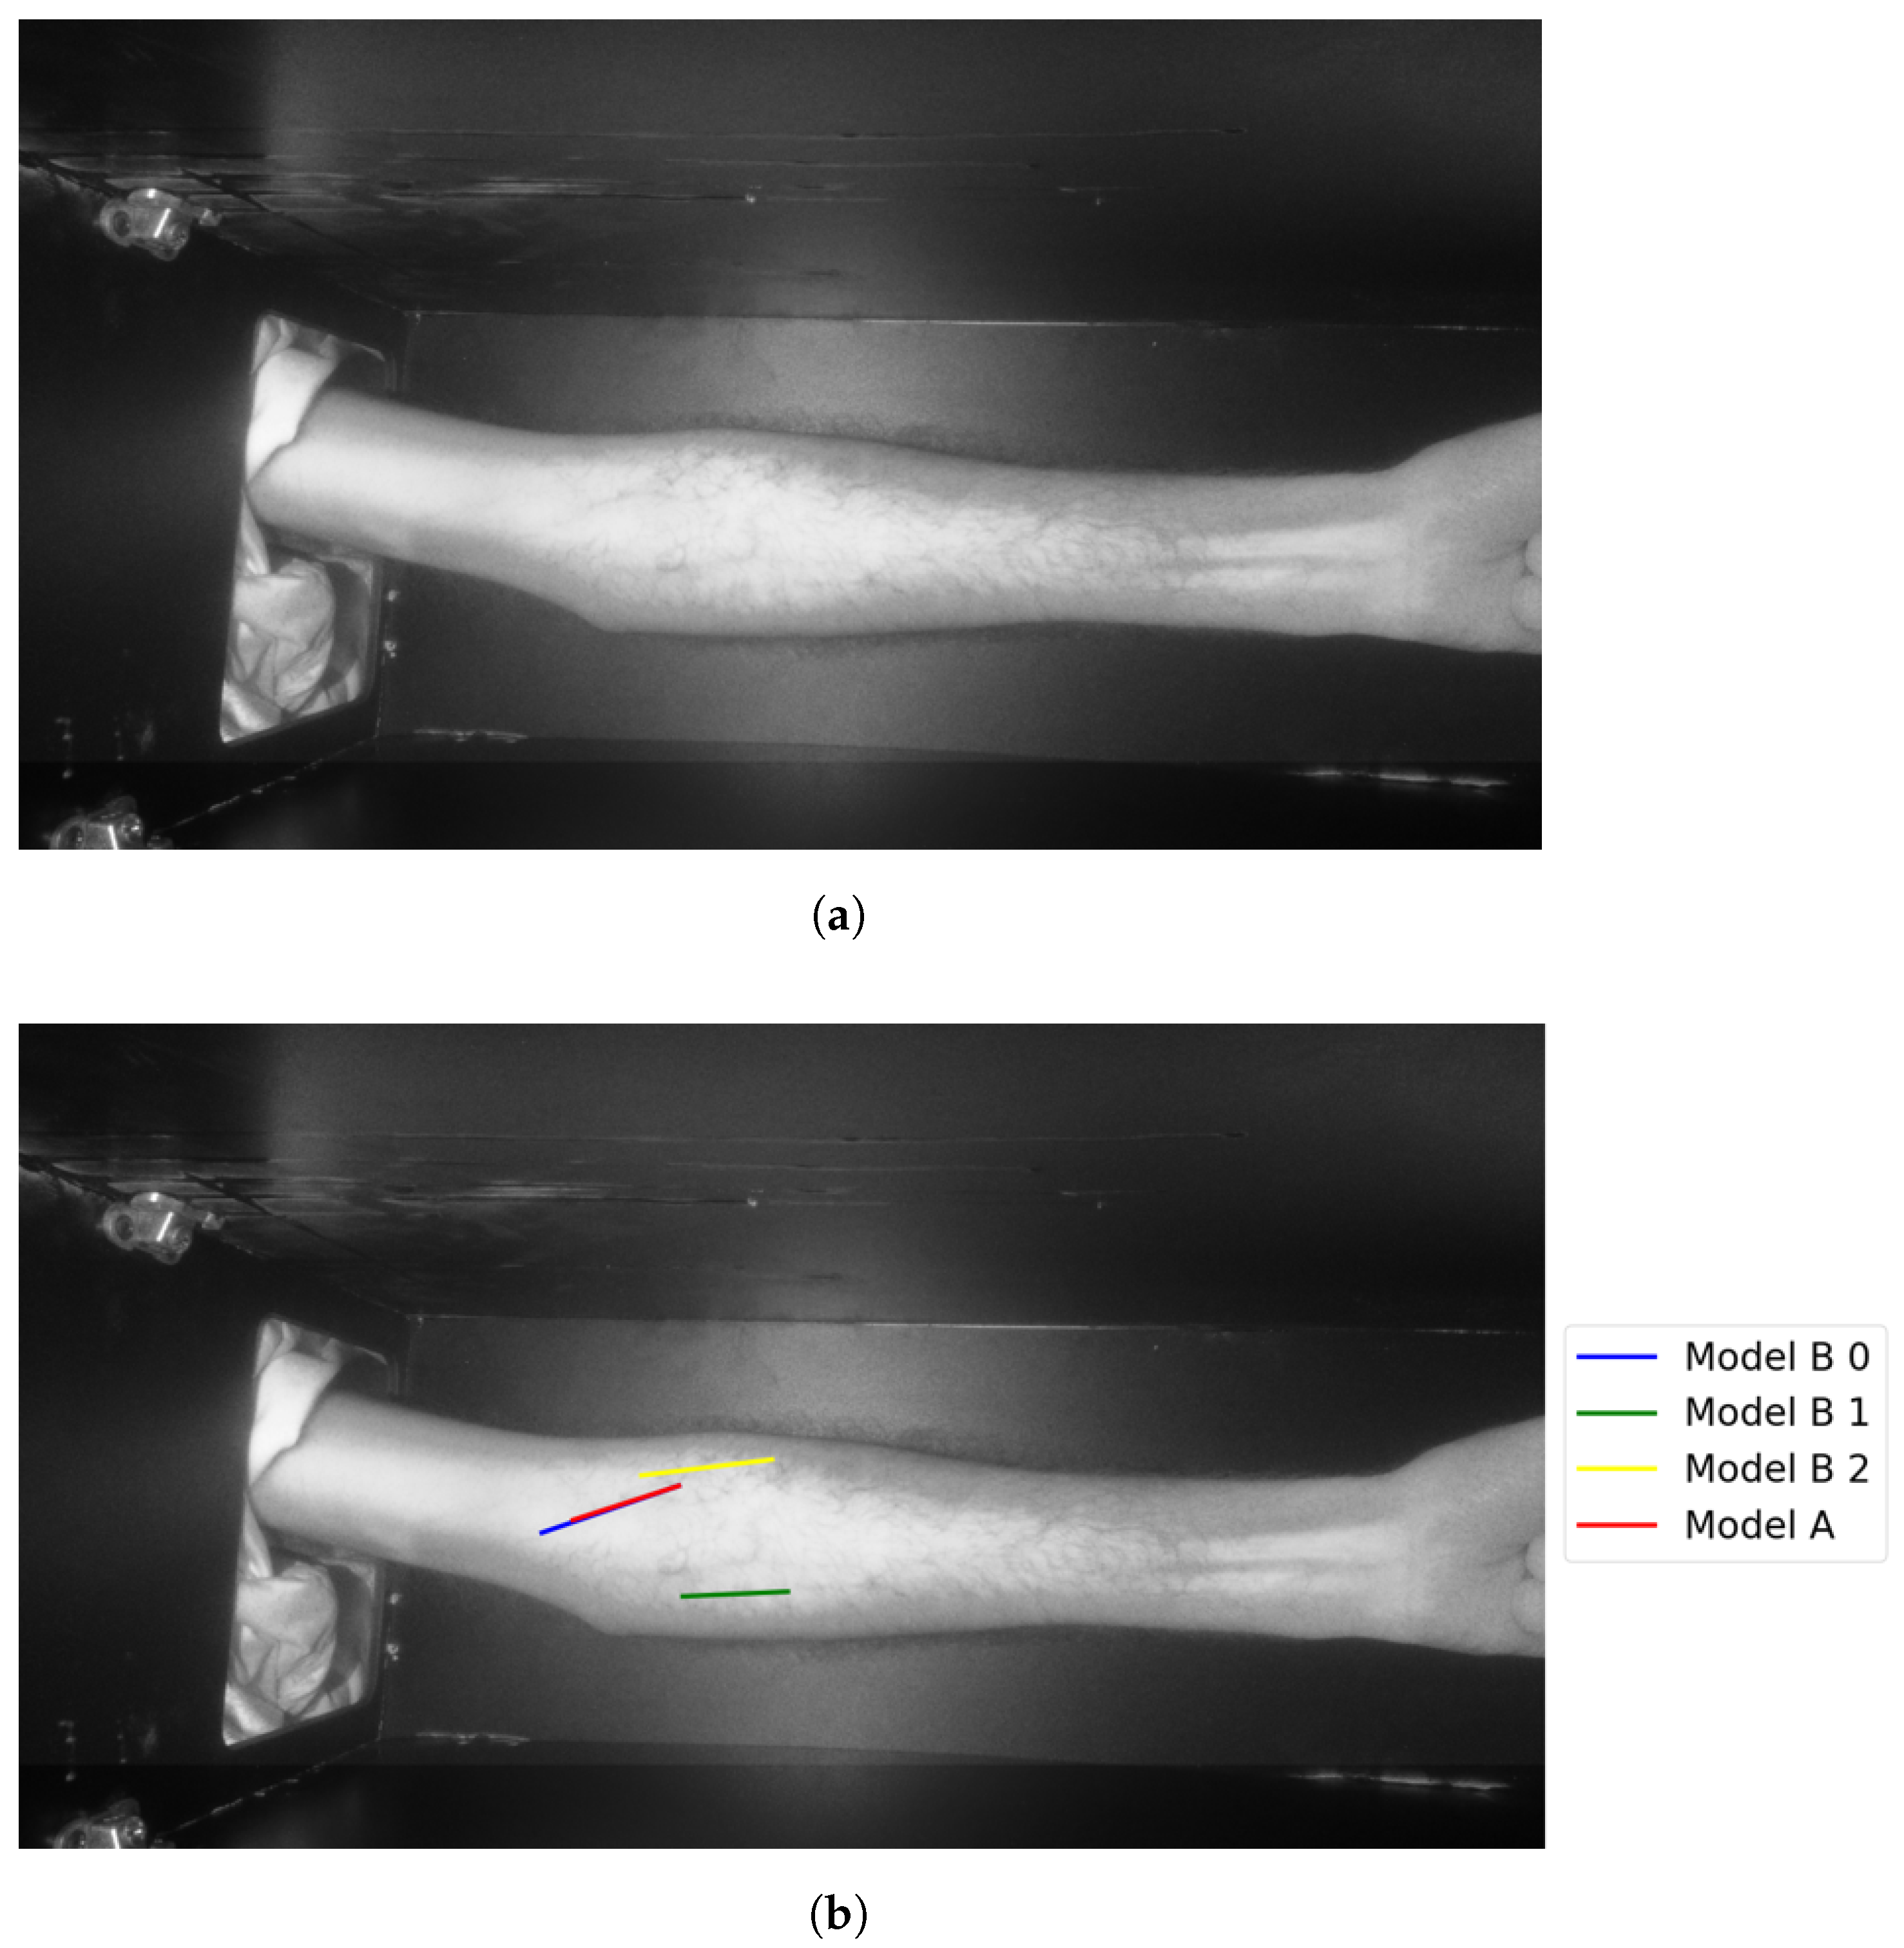
Theast category (Group F) represents test results that indicate false vein selection from both models. This group has about 8.7%, corresponds to two test images. One of the two images is shown in Figure 22. Although Model B suggested twoines, as shown in Figure 22, bothines represented false vein selection. For the second image, Model A did not provide accurate vein selection, while Model B highlights two veins. Although these selections corresponds two accurate veins’ocations, they are not coincident. Therefore Model B failed in outputting the correct vein.
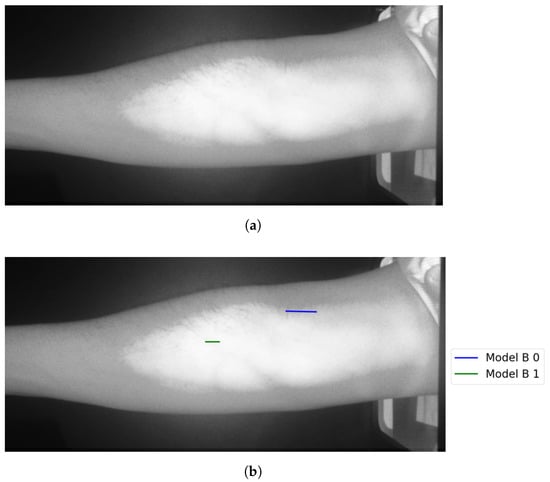
Figure 22.
False detection for vein selection using Model B for Image 18: (a) original image; (b) models’ output.
Considering the number of participants who were involved in the testing phase, there are about 13% and 87% for the distribution among females and males, respectively. According to the female testing results, there are about 66.7% of all female testing cases that are correctly identifying veins through both models for vein selection. For male testing cases, the success accuracy rate is about 55% from the entire male test cases.
Theast step is to retrieve the entry point for the needle (see Figure 23 for more details).

Figure 23.
Showingocalized points of the vein: (a) original image; (b) retrieved points.
The results for vein extraction accuracy would be summarized as follows, considering the proposed module using Model A, it identified the correct vein by 87% from the entire 23 testing cases. Model B’s accuracy when detecting the correct vein is 61%. For theater model, it is important to refer to theine coincident checking step that is performed to confirm the vein selection choice. The veins are correctly highlighted for twenty-one images using the proposed vein selection models among twenty-three images (two images have false vein selections).
The vein extraction module has been evaluated for both complexity and memory consumption. These requirements are essential to provide a fast module for vein extraction that should guide the microcontroller during the injection process. The time needed to deploy the proposed vein extraction is about 1.1 to 1.6 s to process a single image using Model A. The time increased when executing Model B as it takes 3.8 to 4.7 s when deploying the Hough transform for downsampled images with twoevels, respectively. On average, the time needed to process the acquired image is 1.4 s when deploying Model A. The average time is 2.8 s when deploying Model when the image is downsampled by oneevel. The memory consumption is 194 to 198 MB when running the vein extraction module using Model A, while it is 270 to 280 MB when deploying Model B in the vein selection stage.
4. Discussion
The proposed vein extraction module represents an integration among several image processing tools to extract the correct vein from the acquired images. The first stage applies the necessary steps to focus only on the area that contains veins by extracting the region of interest (ROI). Next, image enhancement is a convenient step to enhance the veins’ sharpness through deploying CLAHE. Furthermore, this stage tackles removing several types of noises. The benefit of combining both adaptive thresholding with morphological operations results in extracting potential areas that contain veins.
Selecting the best candidate vein for injection is the most critical stage as it identifies the vein using two approaches. The first approach, Model A, selects the vein, ocated within theargest perimeter contour. So, all contours are extracted first where the Hough transform is applied to the one with theargest perimeter. Therefore, Model A quickly finds theongestine and marks it as a selected vein, as shown in Figure 9a. This is aligned with searching for a visible vein that normally has aarge thickness compared to the other edges found in the acquired image. Although this approach tends to select a robust vein quickly, it does not provide a way to validate that selection.
Vein selection using Model B implies deploying a different approach to find a robust vein for the acquired image. It applies the Hough transform on the entire image using its different spatial resolutions. It proposes finding the vein that survives in the image’sower spatial resolutions. That would highlight a robust vein that corresponds to theocation of two or more coincidentines as shown in Figure 10a, Figure 11a and Figure 12a. The greenines highlighted in Figure 10a and Figure 12a show similar vein selection that is different from theine extracted in Figure 11a. The Hough transform is applied to the entire image to provide an opportunity to identify aine that was not visible before when applying the transform on the acquired image with different resolution scales. Additionally, from Figure 10a, Figure 11a and Figure 12a, it is clear that the number of edges decreases when reducing the image’s resolution, thus eliminating the irrelevant edges from the vein selection process. Although this model provides a way to validate vein selection, it requires more complexity than Model A. The former model runs the Hough transform three times at most when deploying it on 100%, 25%, and 6.25% of the original image size.
The results presented in the previous section provide a set of observations related to the accuracy of the vein extraction module. These observations are:
- Identifying veins using both Model A and Model B: Vein selection was marked successfully for 56.5% of all test cases, using both models proposed in the vein selection stage.
- Images with no vein selection: The proposed module did not identify the veins for about 8.7% of test cases. It could identify the veins in these cases when changingighting source intensity in such a way that makes the veins appear more visible.
- Identifying veins using single model Model A, or Model B: The former model achieves higher accuracy in selecting the veins compared to Model B. Since the former model has theongestine without applying any validation, it outputs directly theongestine detected from theargest perimeter contour. Model B achievesess accuracy performance, 61%. It omits the vein selection when there are noines coincident. The test images where its veins were successfully selected by using Model A are already identified by deploying Model B. In these images, Model B is providing ateast two vein selections. However, these selections do not provideines coincidentally. This explains theow accuracy when deploying Model B in the vein selection stage.
- Running time: The proposed vein extraction module using Model A offers a quick solution for finding the vein, in comparison to Model B. This has a relationship to the amount of image processed by the Hough transform. Model A processes a region that is a subset of the entire image, while Model B applies the Hough transform at most three times using 100%, 25%, and 6.3% from images’ size. From the results section, the vein extraction module using Model B takes twice the execution time when compared to the corresponding time taken by applying Model A. Although the proposed vein extraction takes a few seconds to find the suggested vein for injection, it does not target real-time applications. This is due to the robotic device, which will be strapped around the patient’s arm.
- Gender effect: The ratio among male and female participants is 6.7:1. It cannot obtain a clear statement for the given test images since the majority of images belong to male participants.
- Parameters: The proposed vein extraction module is sensitive to a set of parameters. They are:
- –
- Skin condition: it could be plain or not (covered by hair). Skin covered by hair increases the difficulty of detecting veins as it decreases the veins’ visibility. Test cases have about 47.8% of all test images where their skin is covered by hair. Both Models A and B for vein selection successfully detected the veins (about 63.6% from all images covered by hair)
- –
- Light intensity: Changing the LED source intensity has a direct effect on the veins’ visibility.
- –
- ROI: Defining a wrong region of interest for the acquired image could increase the difficulty of identifying the correct veins.
- To guarantee the safety and system acceptance to the user, an operator (such as a medical expert) should be present to validate each phase of the process
- There are several parameters (such as contractimit, tile size for CLAHE, etc.) that have used their typical settings to derive the remarks from the proposed vein extraction module. An optimization process will be planned to find the suitable range for these modules’ parameters.
- As there is no ground truth for the collected dataset, conducting an objective evaluation would be doubtful. Therefore, a subjective evaluation is planned to evaluate the performance of the vein extraction module.
Table 1 shows the results clustered in five groups, each group’s weight compared to the total number of cases and definition. In Table 2, the data about each case in this study are presented. In Table 3, the results are grouped according to genders.

Table 1.
Groups’ results and definitions.
Table 2.
Test cases used in this study.
Table 3.
Resultsby gender.
5. Conclusions and Future Work
The research contribution is mainly the methodology of applying various image processing and computer vision techniques to extract a suitable vein for injection. Based on a popular CLAHE filter with the cooperation of a set of morphological operations in conjunction with Hough transform, a suitable vein is highlighted for injection.
This research has achieved a promising accuracy rate of 91.3%, with a rapid processing time of 1.4 s on a readily available platformike the Raspberry Pi 4 Model B. These findings suggest the potential for these models to be integrated into practical-world applications, assisting medical professionals in achieving successful first-attempt IV cannulations. Further research is warranted to evaluate the models in clinical settings and explore their adaptability to different body regions beyond the forearm. For future work, a mapping methodology will be applied to map the cameraocation on the subject’s arm, and a robotic arm will be built to make use of the vein extraction and selection modules proposed. It will make use of theocalized vein trajectories in order to perform autonomous injection. Additionally, we plan to conduct similar experiments using aarge volume dataset that considers a balanced patient’s race, age, and gender composition.
Author Contributions
Conceptualization, R.S. and M.H.; Methodology, H.S., S.M., O.S., E.K. and O.A.; Software, H.S., S.M., O.S., E.K. and O.A.; Validation, E.K. and O.A.; Formal analysis, S.M. and O.A.; Investigation, H.S., O.S., E.K. and O.A.; Resources, O.S. and O.A.; Data curation, S.M. and O.A.; Writing—original draft, H.S., O.S. and E.K.; Writing—review & editing, H.S., O.S. and E.K.; Visualization, S.M., O.S. and O.A.; Supervision, O.S.; Project administration, H.S. and O.S.; Funding acquisition, O.S. All authors have read and agreed to the published version of the manuscript.
Funding
This work was supported by the Information Technology Industry Development Agency (ITIDA)-Egypt, Information Technology Academia Collaboration (ITAC) program of collaborative funded projects under the category of Preliminary Research Projects (PRP), Grant PRP2022.R33.18.
Institutional Review Board Statement
Not applicable.
Informed Consent Statement
Not applicable.
Data Availability Statement
The data presented in this study are available on request.
Acknowledgments
The authors wouldike to thank the Management, Arab Academy for Science, Technology and Maritime Transport, Alamein, Egypt, for providing the support to carry out research work. This work was carried out at the Research and Innovation Center, Arab Academy for Science, Technology and Maritime Transport, Alamein, Egypt.
Conflicts of Interest
The authors declare no conflicts of interest.
References
- Tuncay, S.; Sarman, A.; Budak, Y. SuperKid makes it easier: Effect of an intervention prepared with cognitive behavioral technique on reducing fear and pain of children during intravenous insertion. J. Pediatr. Nurs. 2023, 73, e164–e171. [Google Scholar] [CrossRef] [PubMed]
- Puolitaival, A.; Savola, M.; Tuomainen, P.; Asseburg, C.; Lundström, T.; Soini, E. Advantages in Management and Remote Monitoring of Intravenous Therapy: Exploratory Survey and Economic Evaluation of Gravity-Based Infusions in Finland. Adv. Ther. 2022, 39, 2096–2108. [Google Scholar] [CrossRef]
- Francisco, M.D.; Chen, W.F.; Pan, C.T.; Lin, M.C.; Wen, Z.H.; Liao, C.F.; Shiue, Y.L. Competitive real-time near infrared (NIR) vein finder imaging device to improve peripheral subcutaneous vein selection in venipuncture for clinicalaboratory testing. Micromachines 2021, 12, 373. [Google Scholar] [CrossRef] [PubMed]
- Khaled, A.; Shalash, O.; Ismaeil, O. Multiple Objects Detection and Localization using Data Fusion. In Proceedings of the 2023 2nd International Conference on Automation, Robotics and Computer Engineering (ICARCE), Wuhan, China, 14–16 December 2023; pp. 1–6. [Google Scholar]
- Ahuja, D.; Gupta, N.; Gupta, A. Difficult peripheral intravenous access: Need for someight. Med J. Dr. DY Patil Univ. 2020, 13, 422–423. [Google Scholar]
- Koskinopoulou, M.; Cheng, Z.; Acemoglu, A.; Caldwell, D.G.; Mattos, L.S. Robotic Devices for Assisted and Autonomous Intravenous Access. IEEE Trans. Med Robot. Bionics 2023, 5, 170–179. [Google Scholar] [CrossRef]
- Sweeny, A.; Archer-Jones, A.; Watkins, S.; Johnson, L.; Gunter, A.; Rickard, C. The experience of patients at high risk of difficult peripheral intravenous cannulation: An Australian prospective observational study. Australas. Emerg. Care 2022, 25, 140–146. [Google Scholar] [CrossRef] [PubMed]
- Khatab, E.; Onsy, A.; Abouelfarag, A. Evaluation of 3D vulnerable objects’ detection using a multi-sensors system for autonomous vehicles. Sensors 2022, 22, 1663. [Google Scholar] [CrossRef] [PubMed]
- Rauch, D.; Dowd, D.; Eldridge, D.; Mace, S.; Schears, G.; Yen, K. Peripheral difficult venous access in children. Clin. Pediatr. 2009, 48, 895–901. [Google Scholar] [CrossRef] [PubMed]
- Pruthi, P.; Arora, P.; Mittal, M.; Nair, A.; Sultana, W. Venipuncture induced complex regional pain syndrome presenting as inflammatory arthritis. Case Rep. Med. 2016, 2016. [Google Scholar] [CrossRef]
- Shalash, O.; Rowe, P. Computer-assisted robotic system for autonomous unicompartmental knee arthroplasty. Alex. Eng. J. 2023, 70, 441–451. [Google Scholar] [CrossRef]
- Das, R.; Piciucco, E.; Maiorana, E.; Campisi, P. Convolutional neural network for finger-vein-based biometric identification. IEEE Trans. Inf. Forensics Secur. 2018, 14, 360–373. [Google Scholar] [CrossRef]
- Gaber, I.M.; Shalash, O.; Hamad, M.S. Optimized Inter-Turn Short Circuit Fault Diagnosis for Induction Motors using Neural Networks with LeLeRU. In Proceedings of the 2023 IEEE Conference on Power Electronics and Renewable Energy (CPERE), Luxor, Egypt, 19–21 February 2023; pp. 1–5. [Google Scholar]
- Zhao, J.; Zhong, D.; Zhou, S. NIR-I-to-NIR-II fluorescent nanomaterials for biomedical imaging and cancer therapy. J. Mater. Chem. B 2018, 6, 349–365. [Google Scholar] [CrossRef] [PubMed]
- Kim, D.; Kim, Y.; Yoon, S.; Lee, D. Preliminary study for designing a novel vein-visualizing device. Sensors 2017, 17, 304. [Google Scholar] [CrossRef] [PubMed]
- Mela, C.A.; Lemmer, D.P.; Bao, F.S.; Papay, F.; Hicks, T.; Liu, Y. Real-time dual-modal vein imaging system. Int. J. Comput. Assist. Radiol. Surg. 2019, 14, 203–213. [Google Scholar] [CrossRef] [PubMed]
- Said, H.; Moniri, M.; Chibelushi, C.C. Prediction architecture based on block matching statistics for mixed spatial-resolution multi-view video coding. EURASIP J. Image Video Process. 2017, 2017, 15. [Google Scholar] [CrossRef]
- Abouelfarag, A.; Elshenawy, M.A.; Khattab, E.A. Accelerating Sobel Edge Detection Using Compressor Cells Over FPGAs. In Smart Technology Applications in Business Environments; IGI Global: Hershey, PA, USA, 2017; pp. 1–21. [Google Scholar]
- Khatab, E.; Onsy, A.; Varley, M.; Abouelfarag, A. A Lightweight Network for Real-Time Rain Streaks and Rain Accumulation Removal from Single Images Captured by AVs. Appl. Sci. 2022, 13, 219. [Google Scholar] [CrossRef]
- Liu, Y.; Chen, K.; Liu, C.; Qin, Z.; Luo, Z.; Wang, J. Structured knowledge distillation for semantic segmentation. In Proceedings of the IEEE/CVF Conference on Computer Vision and Pattern Recognition, Long Beach, CA, USA, 17–24 June 2019; pp. 2604–2613. [Google Scholar]
- Yang, C.; Zhou, H.; An, Z.; Jiang, X.; Xu, Y.; Zhang, Q. Cross-image relational knowledge distillation for semantic segmentation. In Proceedings of the IEEE/CVF Conference on Computer Vision and Pattern Recognition, New Orleans, LA, USA, 18–24 June 2022; pp. 12319–12328. [Google Scholar]
- Zhang, Y.; Xiang, T.; Hospedales, T.M.; Lu, H. Deep mutualearning. In Proceedings of the IEEE Conference on Computer Vision and Pattern Recognition, Salt Lake City, UT, USA, 18–23 June 2018; pp. 4320–4328. [Google Scholar]
- Yang, C.; An, Z.; Cai, L.; Xu, Y. Mutual contrastiveearning for visual representationearning. In Proceedings of the AAAI Conference on Artificial Intelligence, Virtual, 22 March 2022; Volume 36, pp. 3045–3053. [Google Scholar]
- Reza, A.M. Realization of the contrastimited adaptive histogram equalization (CLAHE) for real-time image enhancement. J. VLSI Signal Process. Syst. Signal Image Video Technol. 2004, 38, 35–44. [Google Scholar] [CrossRef]
- Ahmed, K.I.; Habaebi, M.H.; Islam, M.R.; Zainal, N.A.B. Enhanced vision based vein detection system. In Proceedings of the 2017 IEEE 4th International Conference on Smart Instrumentation, Measurement and Application (ICSIMA), Putrajaya, Malaysia, 28–30 November 2017; pp. 1–6. [Google Scholar]
- Ayoub, Y.; Serhal, S.; Farhat, B.; Ali, A.; Amatoury, J.; Nasser, H.; Abou Ali, M. Diagnostic superficial vein scanner. In Proceedings of the 2018 International Conference on Computer and Applications (ICCA), Beirut, Lebanon, 25–26 August 2018; pp. 321–325. [Google Scholar]
- Bandara, A.; Kulathilake, K.; Giragama, P. Super-efficient spatially adaptive contrast enhancement algorithm for superficial vein imaging. In Proceedings of the 2017 IEEE International Conference on Industrial and Information Systems (ICIIS), Peradeniya, Sri Lanka, 15–16 December 2017; pp. 1–6. [Google Scholar]
- Ganesan, T.; Rajendran, A.J.; Vellaiyan, P. An efficient finger vein image enhancement and pattern extraction using CLAHE and repeatedine tracking algorithm. In Intelligent Computing, Information and Control Systems: ICICCS 2019; Springer: Berlin/Heidelberg, Germany, 2020; pp. 690–700. [Google Scholar]
- Yasser, M.; Shalash, O.; Ismail, O. Optimized Decentralized Swarm Communication Algorithms for Efficient Task Allocation and Power Consumption in Swarm Robotics. Robotics 2024, 13, 66. [Google Scholar] [CrossRef]
- Lu, Y.; Yoon, S.; Park, D.S. Finger vein recognition based on matching score-level fusion of gabor features. J. Korean Inst. Commun. Inf. Sci. 2013, 38, 174–182. [Google Scholar] [CrossRef]
- Miao, Y.; Song, D.; Shi, W.; Yang, H.; Li, Y.; Jiang, Z.; He, W.; Gu, W. Application of the CLAHE algorithm based on optimized bilinear interpolation in near infrared vein image enhancement. In Proceedings of the 2nd International Conference on Computer Science and Application Engineering, Hohhot, China, 22–24 October 2018; pp. 1–6. [Google Scholar]
- Saxena, P.; Mishra, R.; Gupta, K.; Gupta, R.; Mishra, R. Aow-cost and portable subcutaneous vein detection system using a combination of segmentation methods. In Proceedings of the Sixth International Congress on Information and Communication Technology: ICICT 2021, London, UK, 11 March 2021; Springer: Berlin/Heidelberg, Germany, 2022; Volume 4, pp. 869–878. [Google Scholar]
- Elsayed, H.; Tawfik, N.S.; Shalash, O.; Ismail, O. Enhancing Human Emotion Classification in Human-Robot Interaction. In Proceedings of the 2024 International Conference on Machine Intelligence and Smart Innovation (ICMISI), Kerdasa, Egypt, 12–14 May 2024; pp. 1–6. [Google Scholar]
- Yakno, M.; Mohamad-Saleh, J.; Ibrahim, M.Z. Dorsal hand vein image enhancement using fusion of CLAHE and fuzzy adaptive gamma. Sensors 2021, 21, 6445. [Google Scholar] [CrossRef]
- Yakno, M.; Saleh, J.M.; Rosdi, B.A. Low contrast hand vein image enhancement. In Proceedings of the 2011 IEEE International Conference on Signal and Image Processing Applications (ICSIPA), Kuala Lumpur, Malaysia, 16–18 November 2011; pp. 390–392. [Google Scholar]
- Yildiz, M.Z.; Boyraz, Ö.F. Development of aow-cost microcomputer based vein imaging system. Infrared Phys. Technol. 2019, 98, 27–35. [Google Scholar] [CrossRef]
- Bachir, W.; Abo Dargham, F. Feasibility of 830 nmaser imaging for veinocalization in dark skin tissue-mimicking phantoms. Phys. Eng. Sci. Med. 2022, 45, 135–142. [Google Scholar] [CrossRef] [PubMed]
- Saeed, A.; Chaudhry, M.R.; Khan, M.U.A.; Saeed, M.A.; Ghfar, A.A.; Yasir, M.N.; Ajmal, H.M.S. Simplifying vein detection for intravenous procedures: A comparative assessment through near-infrared imaging system. Int. J. Imaging Syst. Technol. 2024, 34, e23068. [Google Scholar] [CrossRef]
- Salcedo, E.; Peñaloza, P. Edge AI-Based Vein Detector for Efficient Venipuncture in the Antecubital Fossa. In Proceedings of the Mexican International Conference on Artificial Intelligence, Yucatán, Mexico, 13–18 November 2023; Springer: Berlin/Heidelberg, Germany, 2023; pp. 297–314. [Google Scholar]
- Issa, R.; Badr, M.M.; Shalash, O.; Othman, A.A.; Hamdan, E.; Hamad, M.S.; Abdel-Khalik, A.S.; Ahmed, S.; Imam, S.M. A Data-Driven Digital Twin of Electric Vehicle Li-Ion Battery State-of-Charge Estimation Enabled by Driving Behavior Application Programming Interfaces. Batteries 2023, 9, 521. [Google Scholar] [CrossRef]
- OSRAM LED ENGIN LuxiGen. Available online: https://ams-osram.com/products/leds/led-modules/osram-led-engin-luxigen-lz1-10r602 (accessed on 20 June 2024).


Disclaimer/Publisher’s Note: The statements, opinions and data contained in all publications are solely those of the individual author(s) and contributor(s) and not of MDPI and/or the editor(s). MDPI and/or the editor(s) disclaim responsibility for any injury to people or property resulting from any ideas, methods, instructions or products referred to in the content. |
© 2024 by the authors. Licensee MDPI, Basel, Switzerland. This article is an open access article distributed under the terms and conditions of the Creative Commons Attribution (CC BY) license (https://creativecommons.org/licenses/by/4.0/).