Article

Improving Highway Emergency Repair Safety: Design and Evaluation of Interactive Roadblocks Based on Eye Tracking

1
School of Design and Arts, Beijing Institute of Technology, Beijing 102488, China
2
School of Mechanical Engineering, Nanjing Institute of Technology, Nanjing 211167, China
*
Author to whom correspondence should be addressed.
Appl. Sci. 2024, 14(16), 7120; https://doi.org/10.3390/app14167120
Submission received: 10 July 2024 / Revised: 11 August 2024 / Accepted: 12 August 2024 / Published: 14 August 2024

Abstract

:
As the number of traffic accident casualties continues to rise globally, this study aims to enhance traffic safety during highway emergency repairs. Based on the fundamentals of human vision, this study designed a novel interactive barricade design, R-barricade, which aims to improve the visibility and warning effect of the barricade, as well as to enhance the interaction with the operator in order to reduce the risk of accidents. We established a comprehensive visual criteria framework, combined with eye-tracking technology, to systematically evaluate the R-barricade. The evaluation results show that the design effectively improves the driver’s attention to the barricade and effectively extends the gaze time, significantly improves the reaction time, and effectively improves the safety of the barricade. This study provides new perspectives for evaluating and improving traffic safety measures during highway emergency repairs and contributes scientific support to the advancement of interactive transport systems and road safety management.

1. Introduction

With the rising number of traffic injuries and fatalities globally, traffic safety has become a public health challenge that needs to be urgently addressed [1]. According to the World Health Organization (WHO), traffic crashes often result in casualties and economic losses, with wide-ranging and far-reaching consequences for society [2,3]. Traffic accidents are the leading cause of death among people aged 5–29 years, and this situation is particularly serious in low- and middle-income countries [4]. The consequences of these accidents are not only the direct loss of life but also the economic burden, long-term disability, and emotional trauma for survivors and their families [5]. Today, the increase in vehicles has led to traffic and congestion on motorways [6]. This results in any refurbishment of roads or maintenance being carried out during the day, all leading to delays and congestion on the motorways [7,8]. Accidents caused by night-time traffic accidents are more common, more serious, and more frequent than those caused by construction equipment [9].
The increase in traffic has led to frequent congestion on motorways, forcing many repairs to be carried out during the day, which often results in traffic delays. Night-time work is more prone to traffic accidents, which are often more serious and more difficult to prevent, due to poor visibility and reduced driver alertness [10,11,12]. Against this background, it becomes particularly critical to ensure the safety of motorway maintenance and repair areas in order to avoid accidents that could lead to major traffic disruption and danger [13]. However, existing barricade systems do not perform well at night or in adverse weather conditions, and they suffer from significant shortcomings in terms of visibility, warning effect, and interaction with drivers, all of which significantly increase the risk of accidents [14,15,16]. Therefore, improving the performance of these roadblocks, especially in terms of enhancing their visibility and interaction, has become a pressing issue.
Recently, researchers have worked to enhance the design of traffic control devices with the aim of communicating safety messages more effectively and attracting the attention of road users [17,18]. Researchers have explored a variety of approaches, including the use of highly visible materials, reflective signs, and LED lights to enhance the conspicuousness of road signs [19,20]. In addition, the application of color psychology has also proved to be crucial in the field of traffic safety, with studies finding that specific colors, such as red and yellow, elicit a rapid response and signal urgency [21,22]. The development of Intelligent Transportation Systems (ITSs) provides new opportunities to enhance traffic safety. An ITS optimizes traffic flow and safety management by integrating advanced sensors, communication technologies, and data analytics [23,24]. Despite these advances, there is still a noticeable gap in the design and evaluation of interactive barriers during emergency motorway repairs, particularly research that combines the principles of human visual perception with eye-tracking technology. Eye-tracking technology, as an emerging tool, provides new perspectives for traffic safety research. This non-invasive technology enables researchers to accurately analyze the visual behavior of drivers and pedestrians to gain insight into how they perceive and respond to various traffic stimuli [25,26]. By quantitatively analyzing the extent to which road signs, signals, and other traffic control devices attract attention and the amount of time users spend processing information, eye-tracking research can play an important role in optimizing the design of these devices [27,28].
This study aims to fill this gap by designing a novel interactive barricade, R-barricade, and evaluating it in combination with eye-tracking technology to improve traffic safety during highway emergency repairs. The design of the R-barricade is based on the principles of human visual perception [29] and aims to enhance the visibility of the barricade and the warning effect while improving the interaction with operators. We have established a set of visual evaluation criteria frameworks, combined with eye-tracking technology, to scientifically evaluate the design of the R-barricade and accurately measure the driver’s visual movement and attention distribution in the actual driving environment. This study not only provides new perspectives on traffic safety measures during highway emergency repairs but also provides a scientific basis and practical guidance for the development of future interactive transport systems and improvements in road safety management. By implementing these improvements, we can expect progress in reducing traffic accidents and enhancing public safety.

2. Material and Methods

2.1. Design Selection and Philosophy

2.1.1. Analysis of User Needs

The process of designing the R-barricade began with an in-depth analysis of user requirements to ensure that the design solution could fully meet the functional requirements of highway construction areas. An interactive hardware design based on the fundamentals of human vision can enhance warning and visibility for the barricade system to ensure the safety of highway construction roads, which not only provides effective warnings in various environmental conditions but also maintains high visibility at night or in bad weather. Based on the fundamentals of human vision, the following key design elements were considered:
  • Color: Human vision has different sensitivities to different colors [30]. Red, yellow, and orange have higher brightness, which can attract attention and convey warning messages. Therefore, these colors are adopted as the main visual cue colors in the design of barricades;
  • Contrast: High contrast makes targets more visible and improves visibility [31]. In barricade design, contrast is increased by combining dark and light-colored elements, for example, using black and yellow stripes on a barrier wall;
  • Brightness: Brightness can affect human visibility and distance perception of objects [32]. In barricade design, the intervention of interactive components can improve the ability to prevent physical danger to workers and address the mobility of barricades, as well as improve visibility at night or in low-light conditions;
  • Direction: Human vision is very sensitive to direction and shape. In roadblock design, by using arrows or other shapes to indicate the direction of a vehicle, drivers can be given a clearer picture of the road, thus reducing the risk of accidental collisions.
During the user requirements analysis phase, we identified the core requirements for a barricade system in a motorway construction area, including high visibility at night and in adverse weather conditions, clear warning messages, and interactivity with operators.

2.1.2. Technical Design Analysis

  • Dimension Requirements: The dimensions of the barricade should be within the range of 2000 mm × 500 mm × 300 mm, ensuring effective coverage and operability within the construction area of the roadway.
  • Mechanical Requirements: The barricade must be stable under high wind conditions, with a wind resistance capability of up to 200 N/m2. Additionally, it must be capable of withstanding vehicle collisions, with a minimum impact resistance of 5000 N.
  • Energy Requirements: To ensure high visibility at night and in low-light conditions, the barricade design incorporates a solar power system. The photovoltaic panel has an output power of 20 W, and the high-brightness LED lights have a minimum light output intensity of 500 lumens.

2.1.3. Analysis of Related Products

On the basis of the user needs analysis and in order to clarify the characteristics that the products should have, we selected nine representative products of the same type in the existing market for in-depth analysis. In selecting the nine products of the same type for evaluation, we first took into account the mainstream types circulating in the market, including traditional and modern designs, in order to ensure the wide applicability and universality of the evaluation results. Secondly, special attention was paid to the functionality of the products in the selection process by assessing their warning effect, visibility, and performance under variable environmental conditions [16,33], thus ensuring that the selected products are comparable in terms of functionality. At the same time, we focused on the harmonization of the products with the urban environment, selecting products with varying performances in terms of environmental integration in order to explore how the design affects the harmony of the barriers with their surroundings [34]. Finally, regarding safety, we selected products with different safety performances in actual use based on historical safety data to analyze the association between design features and safety [35]. As shown in Table 1, by conducting detailed functional, environmental harmony, and safety assessments of these products, we aim to reveal their performance in real-world applications and identify potential shortcomings in accident prevention.
The problems of the current barricade design in practical application and its shortcomings in accident prevention are mainly reflected in the following aspects:
  • Insufficient visibility: Many traditional roadblocks have insufficient visibility at night or in bad weather conditions, making it difficult for drivers to detect the roadblock in time and increasing the risk of accidents [36,37];
  • Limited warning effect: Some roadblocks, though equipped with basic warning functions, lack sufficient visual impact to attract drivers’ attention within a short period of time, especially when traveling at high speed, which may result in safety accidents [38,39];
  • Poor Interaction: Existing roadblocks often lack effective interaction with the driver, failing to provide real-time information or warnings about road conditions, making it difficult for drivers to react quickly in emergency situations [7];
  • Weak environmental adaptability: the design of barricades often does not fully take into account different environmental factors, such as urban landscape, road types, and climatic conditions, resulting in difficulties in coordinating with the surrounding environment in certain scenarios, which affects their warning effect [40];
  • Lack of intelligence: With the development of interactive transport systems, traditional barriers lack the ability to integrate advanced technologies, such as sensors, communication modules, and adaptive control systems, limiting their potential in accident prevention [41,42].
By analyzing the existing roadblock products in the market, we found their shortcomings in warning effect, interactivity, environmental adaptability, and intelligence, and these findings provide the direction of improvement for our design. Through these improvements, the effectiveness of roadblocks in accident prevention can be significantly improved, providing road users with a safer driving environment.

2.2. Design Objectives

Based on the user needs analysis and related product analysis and combining the TRIZ tools [43] and the Kano model [44], we were able to comprehensively define the product scope and characteristics of the highway robber barricade, ensuring that the design meets the user’s needs whilst identifying the key points of contention in the design of the barricade, which is also innovative and competitive in the marketplace. The application of this methodology provides clear guidance for barricade design and helps us to develop an efficient barricade system that meets basic safety requirements while providing additional value. Based on the principles of human vision, we propose the following design objectives:
  • Enhanced visibility: R-barricade is designed with a high-contrast color scheme and reflective materials, features that improve visibility at night and in adverse weather conditions, thereby reducing the risk of accidents [39];
  • Enhanced warning effect: The integrated high-intensity LED warning light and dynamic signaling system are designed to attract drivers’ attention. This warning system has been proven to be effective in communicating roadside emergency repair information and improving driver reaction time [45];
  • Interactive design: The interactive elements developed, such as touch-screen signage and voice-prompting features, are designed to provide real-time information and enhance communication with operators. The design emphasizes the importance of interactivity in improving work zone safety [46];
  • Environmental integration: Ensure that the design of barricades is aesthetically compatible with the urban environment, use environmentally friendly materials, and consider the ease of storage and transport of barricades when they are not in use;
  • User-friendliness: The design concept of the R-barricade emphasizes the importance of easy deployment, adjustment, and removal in order to reduce the physical demands on the operator and to ensure the stability of the barricade. These features are based on ergonomic principles to improve operational efficiency and reduce the risk of strain injuries [47];
  • Data-driven optimization: Iterative optimization of the barricade design using data collected by eye-tracking technology to ensure that it minimizes visual distractions and improves driver response efficiency in real-world use [48].
By achieving these design objectives, the R-barricade aims to provide a safe, efficient, and visually pleasing solution for motorway recovery operations, thereby reducing the risk of accidents and improving the overall safety of road users.

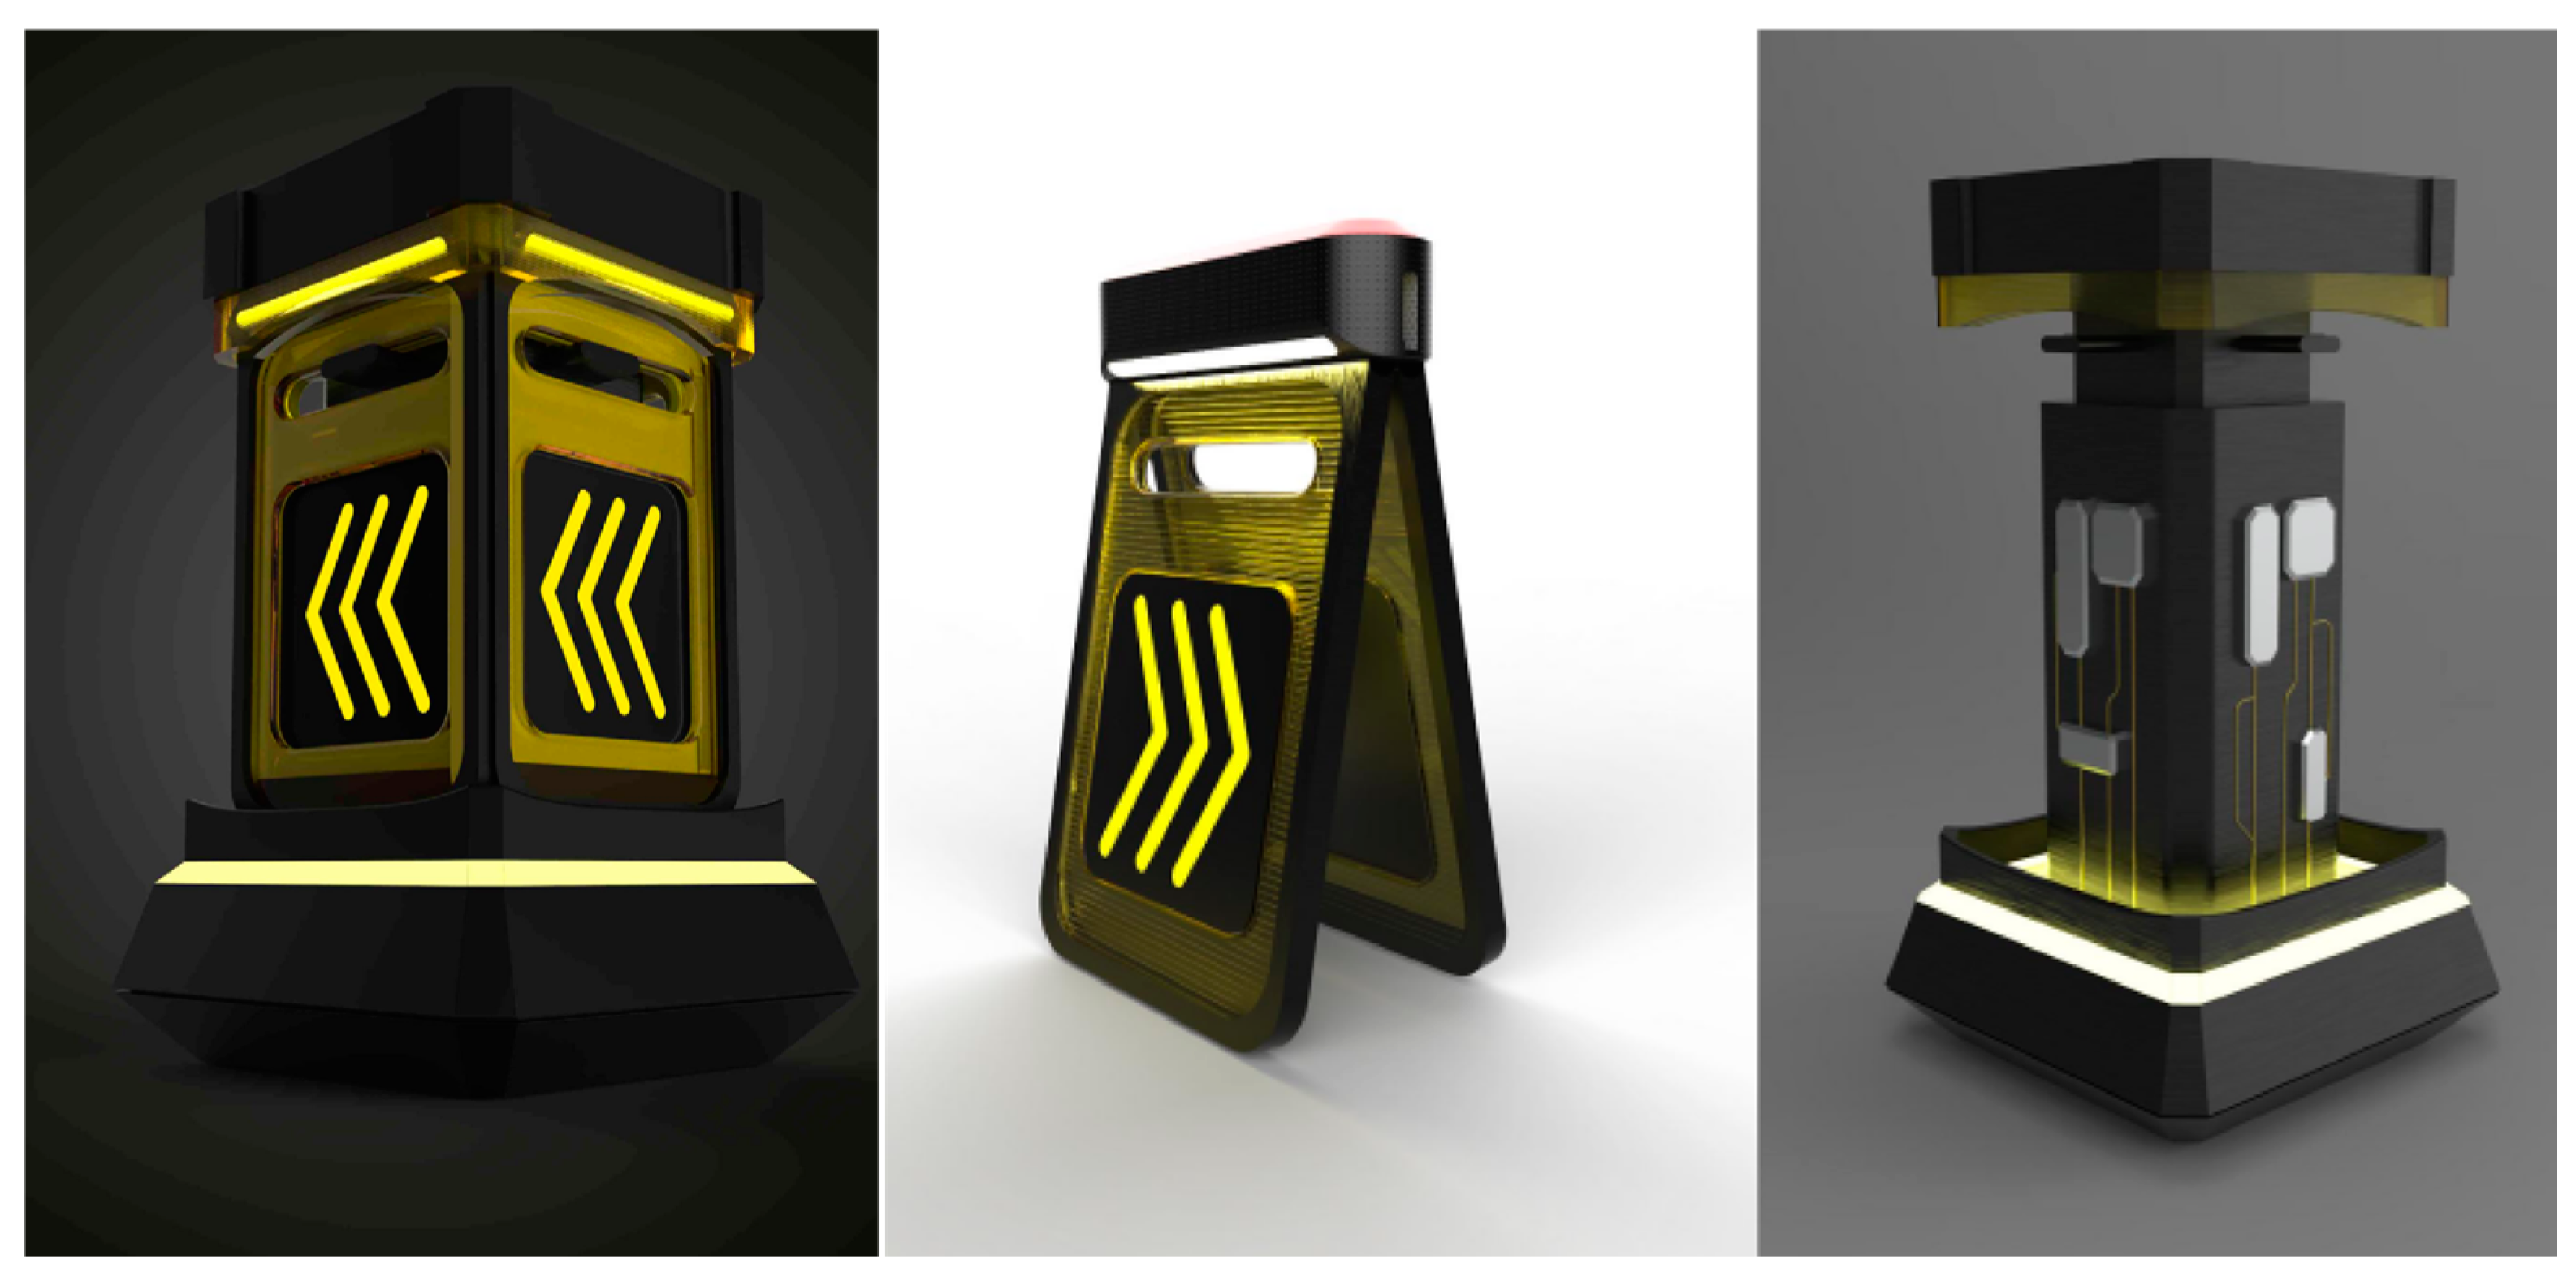
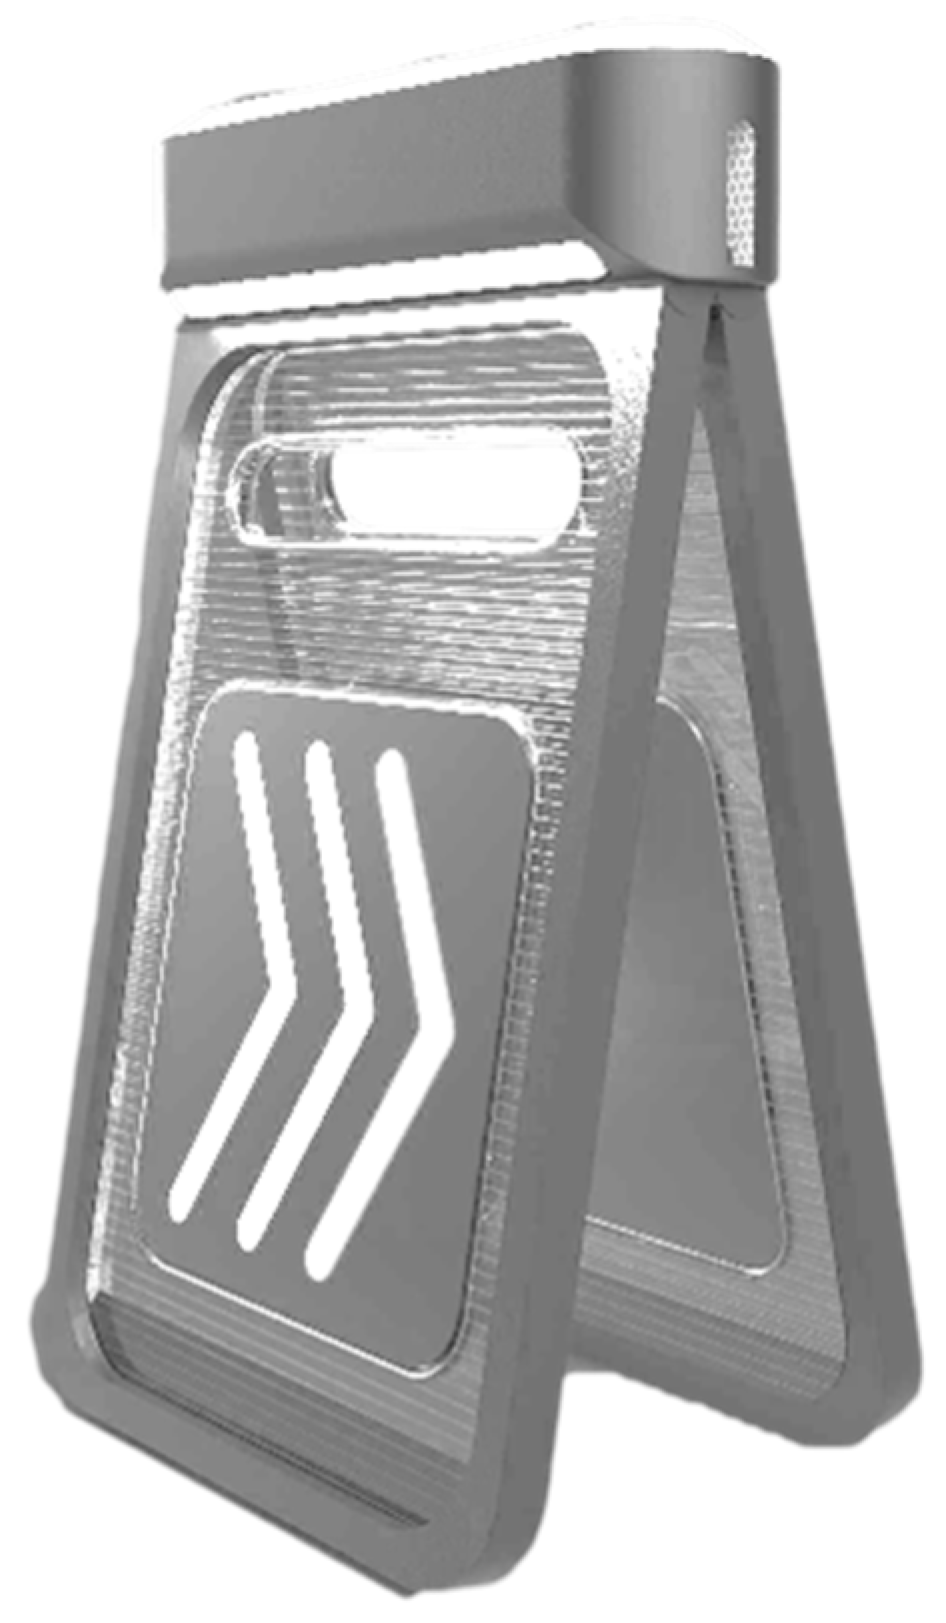
2.3. Preliminary Design

According to the above research results, we carried out a preliminary program design, as shown in Figure 1. The overall appearance of the product chooses hard lines, abandoning cumbersome details, paying more attention to the integration of the environment and the conveyance of warning messages, and the modeling is simple and intuitive.
The color is the same as the road marking, which enhances the visibility at night. Material selection of existing barricades more often used plastic as the main material shown in Figure 2. The work zone barricades meet impact safety standards to improve safety and minimize the risk to the traveling public in the work zone as well as on motorways and roads [49]. The separate structure of the barricade presents an upper interaction device and a lower support structure, which are embedded by a pivot between the two parts of the structure, as shown in Figure 1. The upper structure of the barricade is installed with relevant, interactive hardware and software, and the interaction between the barricade and the workers is realized through the interactive hardware and software interaction technology to contact the workers. The application of high-brightness LED lights on the top not only increases the visibility of the road surface but can also be combined with interactive hardware and software according to the direction of the vehicle to light up the corresponding direction of the red light [50], used to prompt the workers to avoid. The projection function of the upper part of the barricade can form a light safety line projection on the ground and play a warning role. The interactive barricade adopts magnetic charging mode, which is easy to move after combining with the charging pile and is convenient for high-speed workers to use.

2.4. Visual Studies

2.4.1. Visual Evaluation and Safety

Visual evaluation is key in this study to measure the effectiveness of a barricade design in communicating safety messages. We define the evaluation criteria in terms of two dimensions: visual contrast and visual attractiveness:
  • Contrast: At the heart of enhancing the visual identity of barricades, contrast reinforces the visibility of barricades in a variety of environmental conditions through purity and scale [51]. Purity focuses on the design’s colorfulness and simplicity of form to clearly communicate the barricade’s presence and importance. Proportion refers to the proportion of visual inertia to total vision, the ratio of size, quantity, and color between elements within a product [52]. It ensures that the size, shape, and color distribution of the barricade draws the attention of drivers and pedestrians without distracting them from the road conditions.
  • Attractiveness: In the context of safety evaluation, visual attractiveness refers to the ability of a barricade design to attract and maintain the visual attention of motorists and pedestrians, thereby guiding them to take safe action. This includes uniqueness of design, innovation, and compatibility with the environment, aiming to create a barricade that meets safety requirements while eliciting a positive visual response.

2.4.2. Visual Evaluation Metrics and Eye Tracking

Visual metrics can be measured by physiological measurements combined with qualitative analyses. Therefore, in this experiment, we chose the “eye tracking” technique, which can track and record eye movements. We measured people’s eye movements when evaluating the product design and then established a relationship with the above visual evaluation indexes. This technique enables us to accurately measure and analyze the visual movement and attention distribution of drivers and pedestrians:
  • Purity: a measure of the number of elements in a design and correlates with visual complexity. Eye tracking data show that the number of gaze points (N) is directly proportional to the number of design elements. In this case, a smaller number of elements implies higher purity, thus measuring whether the barricade design is clearly expressed and important. The formula for purity (P) is expressed as:
P = 1/N,
  • Proportion: Describes the relative size and distribution between visual elements that affect visual attractiveness. According to the principle of visual inertia, the eye tends to be attracted to elements that are well-proportioned. Proportion (R) can be quantified by the variance (σ2) of gaze point duration. Proportion (R) can be quantified by the following formula:
R = 1/σ2,
  • Contrast: A combination of purity and proportion that reflects the visual prominence of the design. A combination of purity and proportion that reflects the visual saliency of the design. According to the theory proposed by Eli Peli in 1990, the greater the variance, the more incongruous the proportionality of the visual elements. Contrast (C) can be calculated by the product of the number of gaze points and the variance [53]:
C = N × σ2,
Visual contrast should account for half of the total observation time when visual value is optimal. The ratio of visual contrast to total observation time (C/T) shows a correlation with visual value in a quadratic function. The correlation between visual value and visual contrast can be described by a quadratic function when C/T < 0.5 or C/T > 0.5 [54].
Through these quantitative visual indicators and formulas, we are able to objectively assess and compare the visual impact of different roadblock designs and optimize the design accordingly to enhance traffic safety.

2.5. Materials

2.5.1. Eye Movement Equipment and Functions

In this experiment, we used Tobii Pro Glasses 2 (Tobii Electronic Technology Co., Ltd., Suzhou, China) [48], as shown in Figure 3, an advanced wearable eye-tracking device that is lightweight, similar to normal glasses, and weighs only 45 g, ensuring participant comfort. The device connects via an HDMI cable to a recording device with an inbuilt SD memory card and is designed to provide a high degree of flexibility and portability, facilitating the recording of images and sounds as seen by the experimenter. The Tobii Pro Glasses 2 are characterized by their non-invasive measurement method, which greatly expands the range of applications of the experiment and provides great operability for eye movement studies in real-world environments. The Tobii Pro Glasses 2 are equipped with an advanced infrared (IR) sensor and a high-resolution camera; the device is capable of accurately capturing a participant’s pupil position and corneal reflexes at a sampling rate of 250 Hz to determine the focal point of vision. In addition, Tobii Pro Glasses 2 supports wireless connectivity and features an efficient power management system to ensure stable operation over long periods of time.
Before the experiment started, we calibrated the device using the Tobii Pro Glasses Controller software (version 1.114/Windows 64-bit) to ensure the accuracy of eye tracking. After calibration, the wearer could move freely, and the device was connected wirelessly to achieve the real-time observation function to simulate the eye movement state in the real experimental environment. During the experiment, the eye-tracker tracked eye movements, captured gaze, eye hopping, and other metrics in the temporal and spatial dimensions at a specified sampling rate, and recorded these data points in a video stimulus. Data analyses were performed on a Lenovo Legion Y9000P IAH7H PC (Lenovo Co., Ltd., Beijing, China), which is equipped with powerful processing power to efficiently run the Tobii Pro Lab software and process large amounts of eye-tracking data. For eye movement data analysis, we used the visualization tools in the software to process the wearer’s focus into hotspots and trajectory maps on a static base map. The research team can choose the format and type of data to be exported as needed, including key metrics such as gaze time, gaze count, average gaze time, gaze duration, eye hopping distance, number of visits, pupil diameter, etc., which are important parameters reflecting the wearer’s eye movement behavior.

2.5.2. Sample Selection and Processing

In this paper, 10 scenarios were selected as experimental stimulus materials, including 9 ordinary scenarios and 1 excellent scenario. First of all, image processing is carried out in order to avoid the influence of color and material on the experimental results; the grey-level images are uniformly processed with Photoshop software to ensure that the pictures are representative and meet the pixel requirements of the device, and to exclude the pictures that may produce disturbing factors, such as strong reflections and incomplete compositions. Finally, it was made into a bitmap image with a resolution of 640 × 480, as shown in Figure 4.

2.6. Experimental Design and Test Methods

2.6.1. Purpose of the Experiment

This study aimed to quantitatively assess the effects of the visual design of motorway robber barriers on the attention of drivers and pedestrians. We used eye-tracking technology to capture the visual behavioral patterns of participants as they assessed different barricade designs. By analyzing these data, we aim to establish associations between visual metrics and design elements and to assess the effectiveness of each design option in attracting and maintaining the attention of drivers and pedestrians based on these visual metrics. Ultimately, we will select the design solution with the best performance in terms of visual attractiveness and safety based on the experimental results and provide proven design recommendations for practical road safety management.

2.6.2. Selection of Experimental Subjects

The eye-tracking experiment was conducted with a total of 14 subjects, including 9 females and 5 males, all of whom had visual acuity of 1.0 or higher in the naked eye or corrected visual acuity. Due to the cognitive bias of the test subjects or procedural errors, 4 invalid data were excluded, and finally, the valid data of 10 test subjects were retained, which were 7 females and 3 males.

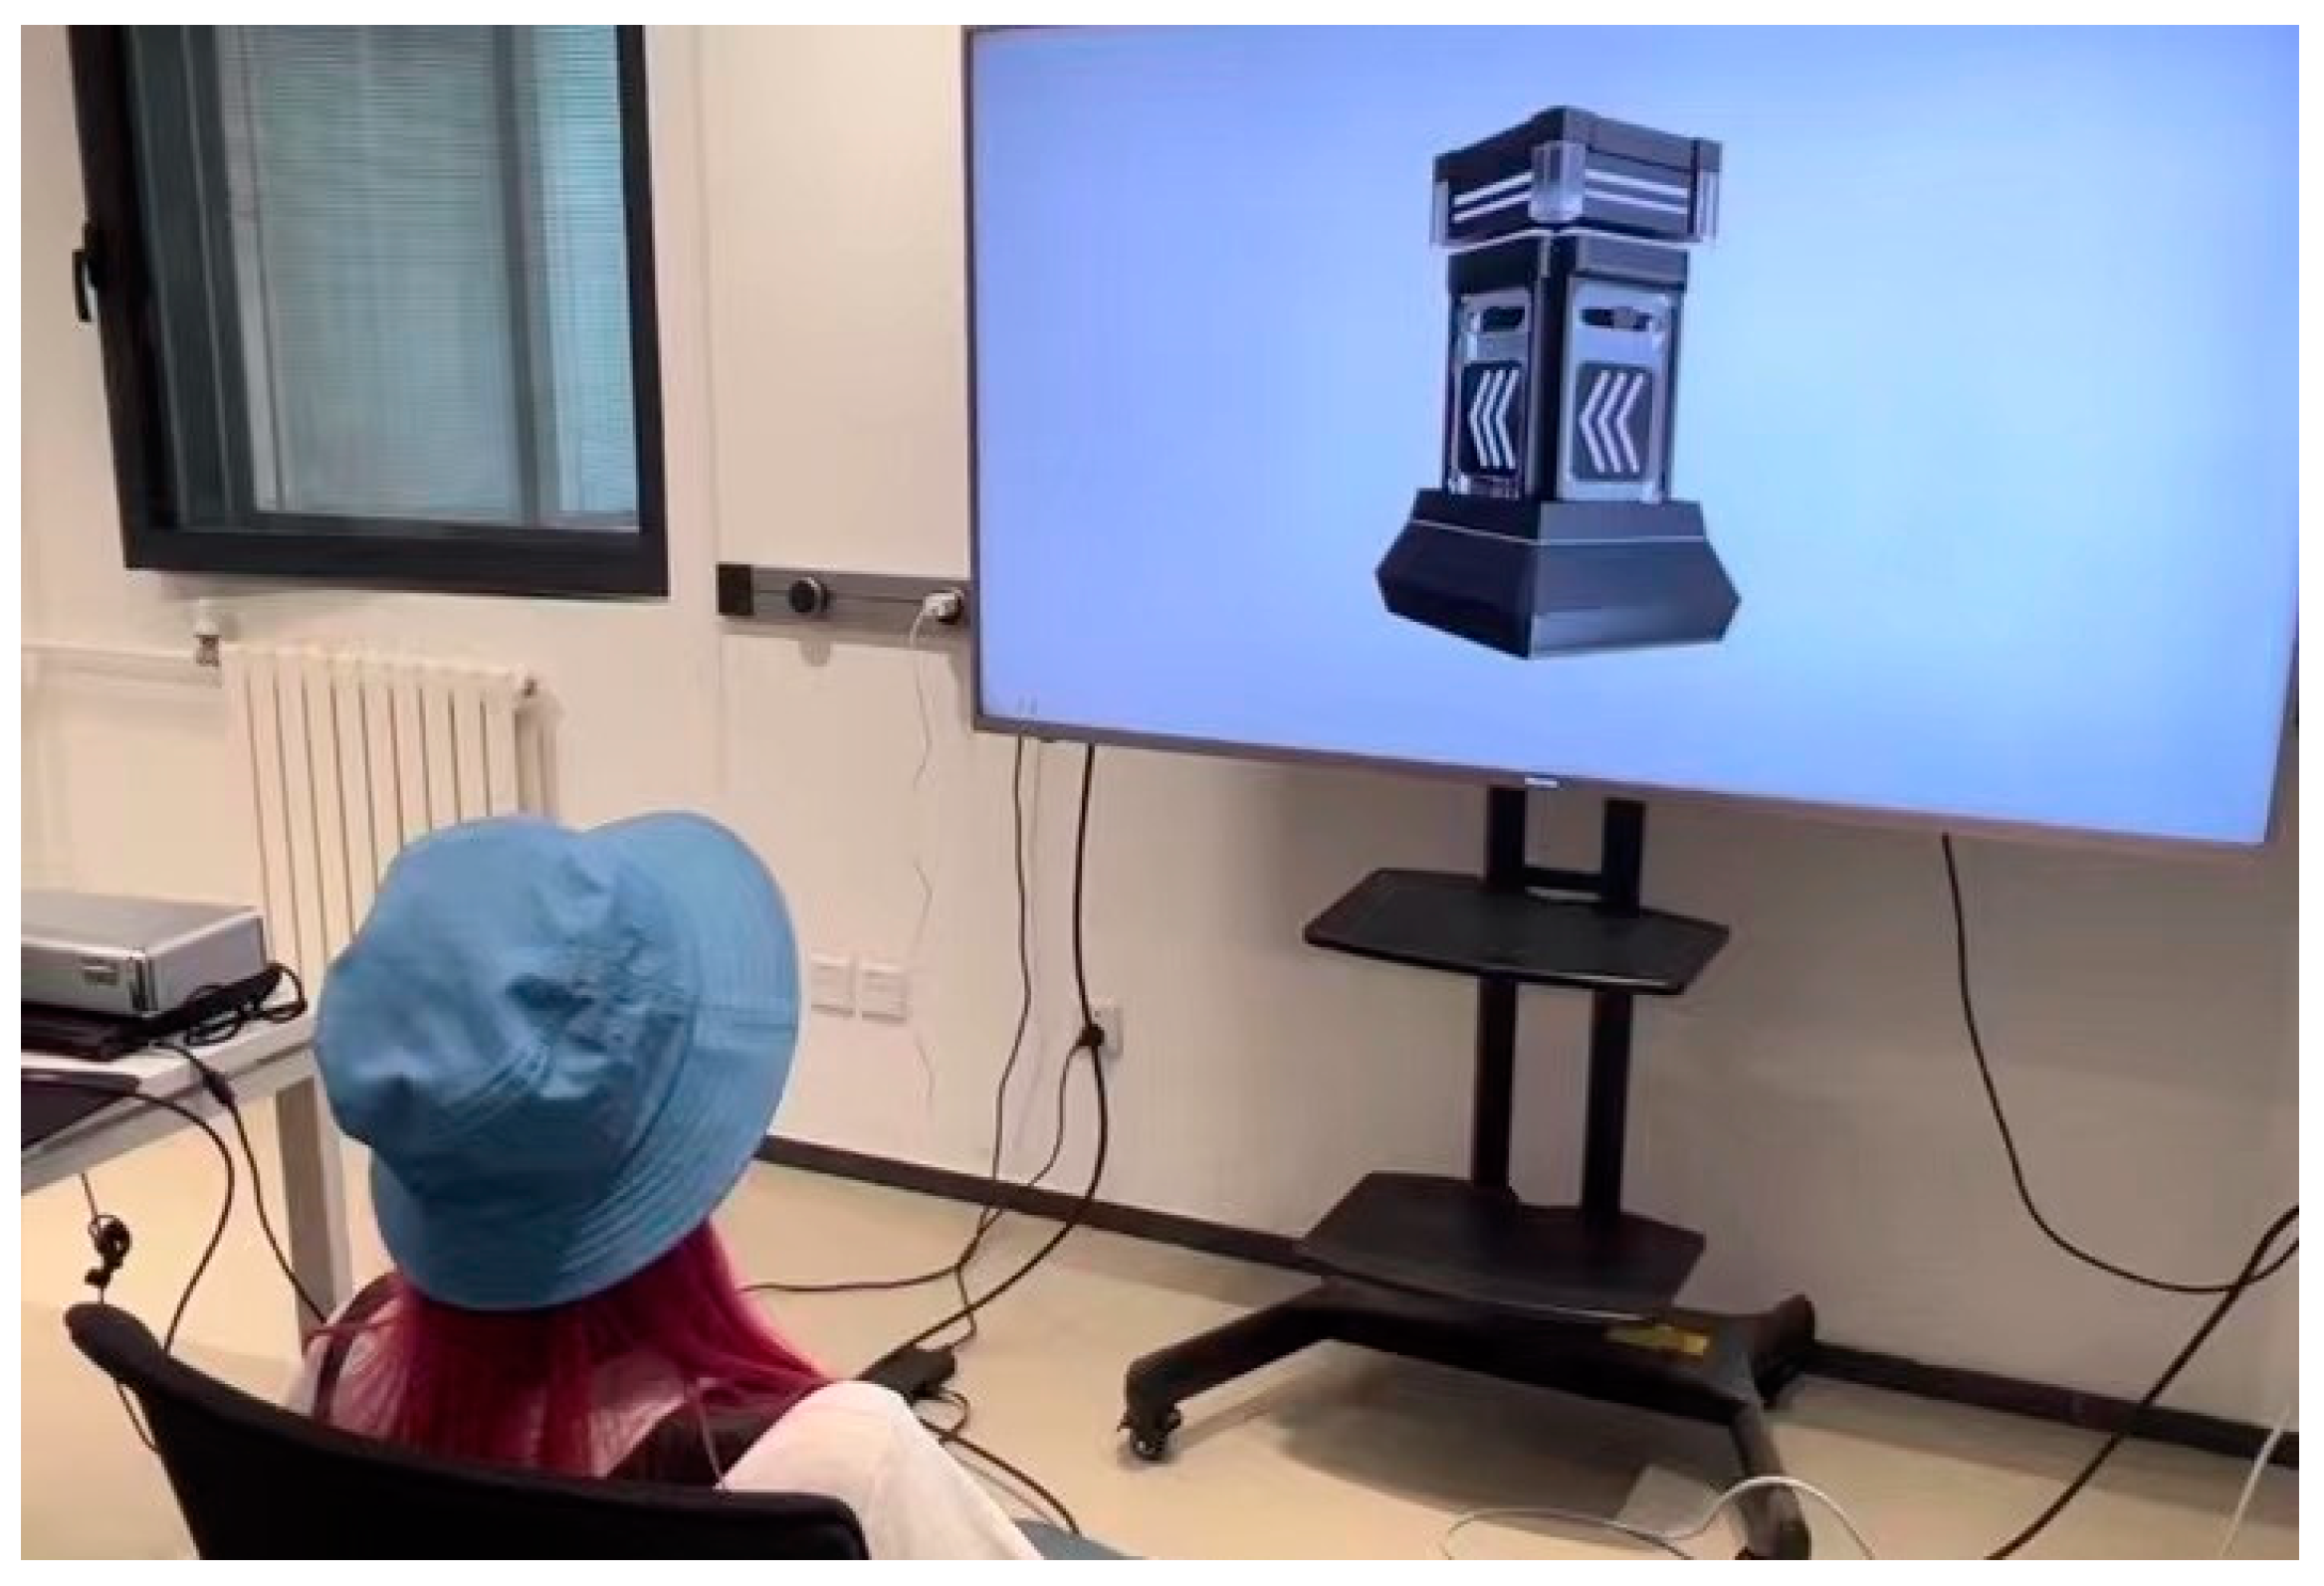
2.6.3. Designing the Experimental Process

The experiment consisted of one set of 10 pictures. (1) Subjects entered the laboratory, and the chief experimenter explained the instructions, which were as follows: The task of this experiment requires you to assume that you are a driver on a motorway and to observe each picture of a traffic separation product. (2) Subjects were instructed to sit at a distance of 1 m from the display screen, with their heads fixed in a fixed position. (3) One by one, the subjects were calibrated for each group of pictures. Subjects were calibrated one by one for each group. (4) The experiment was conducted with a duration of 7 s for each picture. If it appeared that the subject had finished viewing a single picture before the end of the screening time, he or she could advance to the next picture by pressing the designated key. Each individual experiment took approximately 7 min.

2.6.4. Experimental Procedure and Data Collection

The recording device is assembled and connected, and the operator creates a new project using the “Tobii Glasses Controller” software. Attach the headgear to the subject’s head, replacing the nosepiece if necessary, and gently attach the recording device to the subject’s belt or clothing while another person holds the calibration card 0.75 m to 1.25 m away from the subject and calibrates it by having the subject’s line of sight centered on the calibration point. After successful calibration, click the button to start recording.
Before the experiment begins, the observation time for each picture needs to be determined. If the time is too short, participants will not be able to fully observe the detailed design; if it is too long, the difference in the observed data for each picture will be too small. Therefore, it was essential to conduct a preliminary experiment. Ten participants were invited to observe similar pictures in the preliminary experiment, and an observation time of 7 s per picture was determined. A formal experiment was conducted next. Pictures were imported into Tobii Studio, and each picture was observed and played in a certain order for 7 s. The position of the participants was adjusted so that the distance between the eyes and the screen was maintained at about 64 cm. The current participant’s eye movement habitus was then recorded through a 9-point calibration. Participants were then asked to view all the pictures on the screen, and the process was recorded, as shown in Figure 5.
After all subjects had finished the test, the SD memory card was removed from the recording device and inserted into the computer. Open the “Tobii Glasses Analysis” software, create a new project, specify the location where the database will be stored, locate and select the data file (*.ttgp), and start importing and analyzing the data.

3. Results

3.1. Eye Tracking Experimental Data

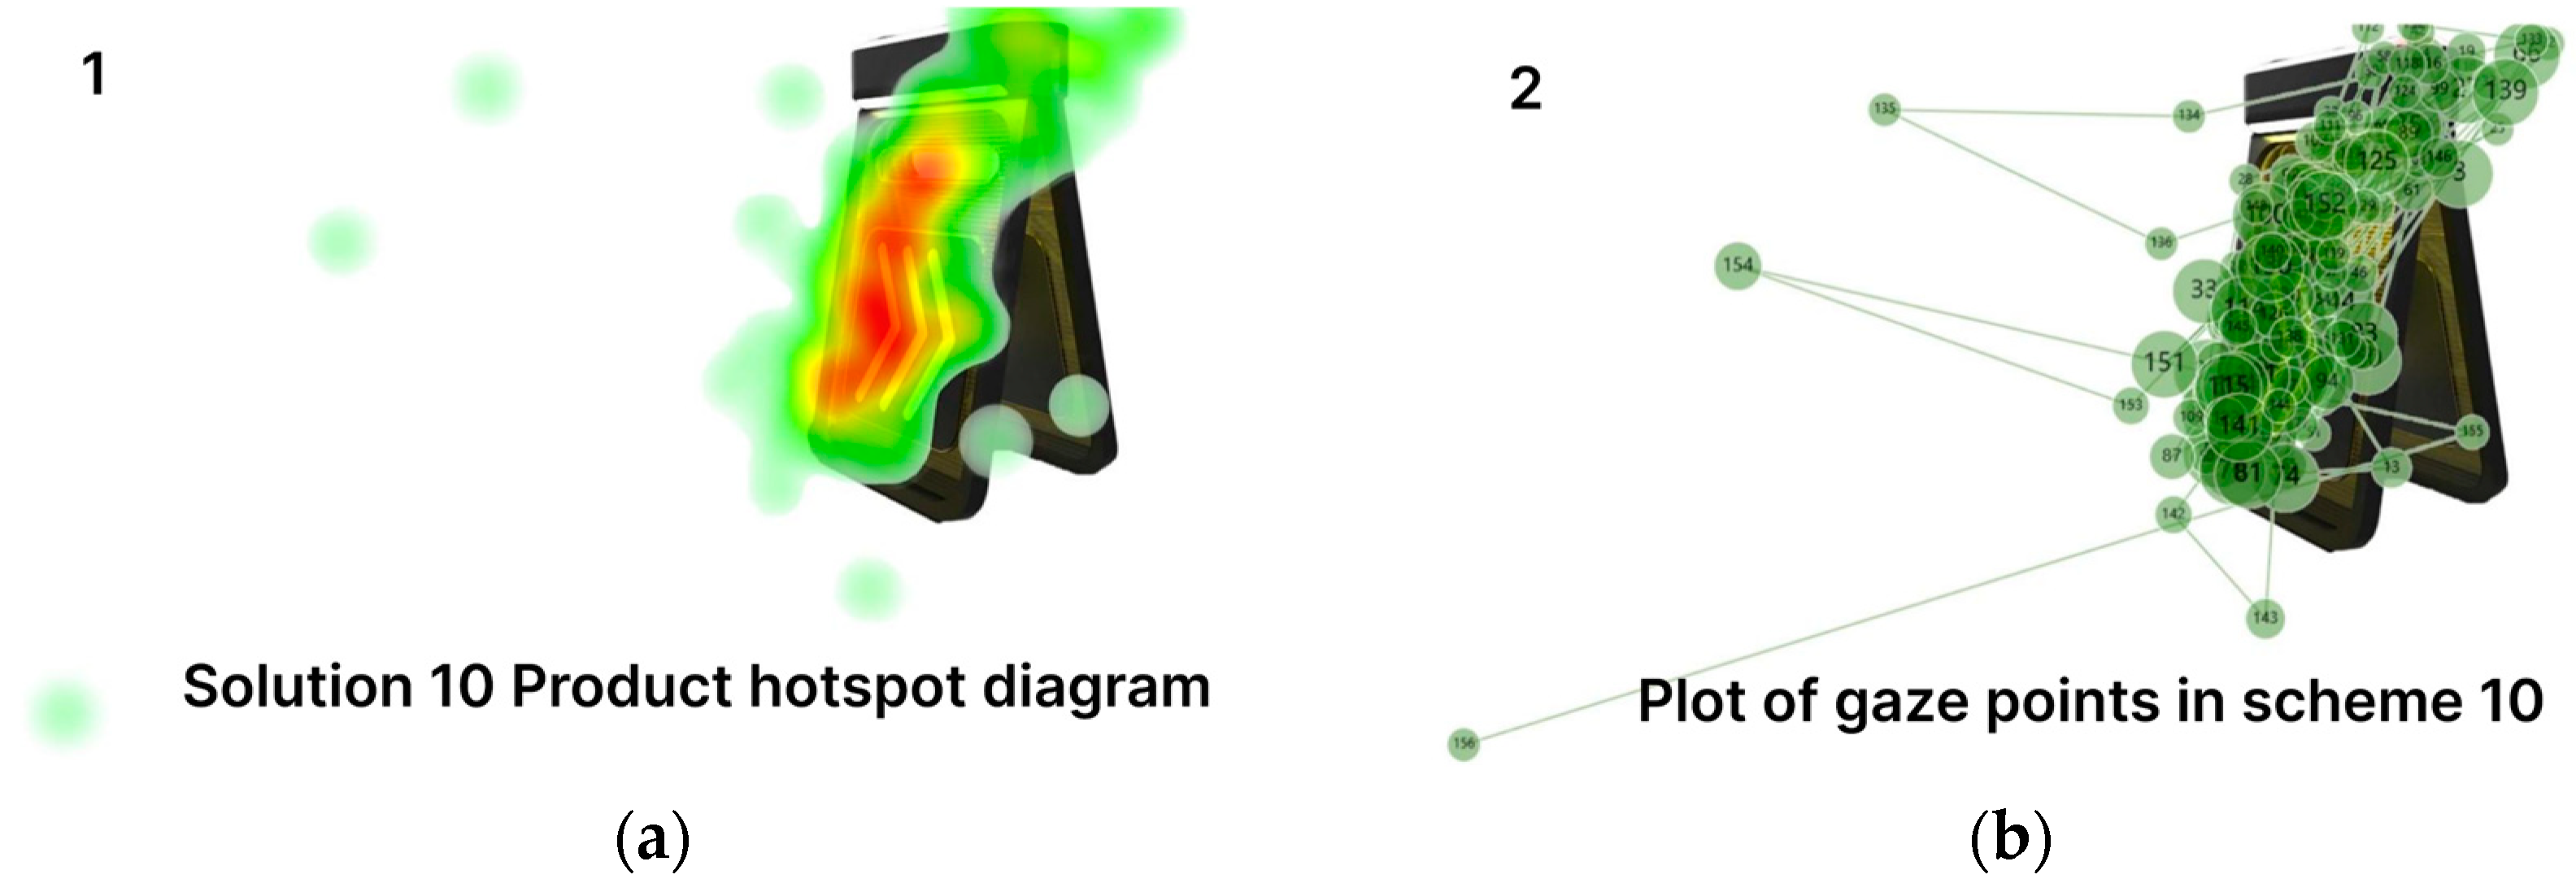
3.1.1. Analysis of Eye Tracking Experimental Data

The experimental records of each subject were evaluated. If the collection rate of eye movements was 80% low, they were retested. The collection rates of some of the records are shown in Figure 6. The number of gaze points, the variance of the duration of each gaze point, the total gaze time, and the coordinates of all gaze points in each record were derived. For ease of processing, all the above data are treated in Table 2 and Table 3.
The outputs of data visualization include a hotspot map and an eye-track map. The hotspot map uses different colors to present the experimenter’s attention area or to show the visual dwell time of the experimenter in a certain area, which can better understand the general pattern of their behavior. The gaze duration of the subjects in the hotspot map indicates that the red color has the longest time, the yellow color is the second longest time, the green color is the shortest time, and the absence of a color-covered area indicates that the experimenter has not paid attention to the area. The number of gaze points (a gaze point can only be regarded as a single gaze if it lasts for more than 100 ms) and the duration of gaze reflects the importance and interest in the part of the area under test.

3.1.2. Results of Eye Tracking Experimental Data

In this study, the results of the data we collected through eye-tracking technology reveal the effects of different barricade designs on drivers’ visual attention. The data results show that the R-barricade design excels in several key metrics as follows:
  • Number of points of interest: The R-barricade design elicits more points of interest from the driver, which suggests that the driver’s attention is more focused on the roadblock, thus helping to recognize it earlier and take appropriate avoidance measures;
  • Gaze duration: drivers’ longer average gaze duration at the R-barricade reflects more in-depth cognitive processing of the roadblock, which contributes to an increased awareness of the importance of the roadblock and alertness to potential hazards;
  • Gaze time variance: The R-barricade’s smaller gaze time variance means that the driver’s visual attention to the roadblock is more stable, reducing the potential for delayed reactions due to distraction;
  • Visual Search Efficiency: The new design of the roadblock has improved visual search efficiency, allowing drivers to locate the roadblock in the visual scene more quickly, which is especially important in emergency situations;
  • Purity and proportionality: eye-tracking data shows that the R-barricade’s design effectively directs the driver’s attention allocation, enabling them to quickly notice and react to roadblocks when necessary.
In summary, the results of the optimized data show that the design improvement of the R-barricade has practical application value in improving the warning effect of the barricade and reducing the risk of accidents, which provides effective support for traffic safety during highway emergency repair.

3.2. Design Optimization Results

Based on the initial design proposal, we have fully optimized the R-barricade design by incorporating the results of eye-tracking experiments, principles of human vision, and safety product design principles. Experimental data showed that high-contrast colors and dynamic signaling systems significantly improved driver attention, which guided us to further strengthen these elements in the design. The optimized design, shown in Figure 7, consists of a mobile charging station and an interactive barricade. This design not only enhances the mobility and deployment efficiency of the barricade but also ensures the continuous operation of the interactive features through an integrated charging system.
Moreover, the optimized R-barricade includes several innovations in its interactive aspects, as follows:
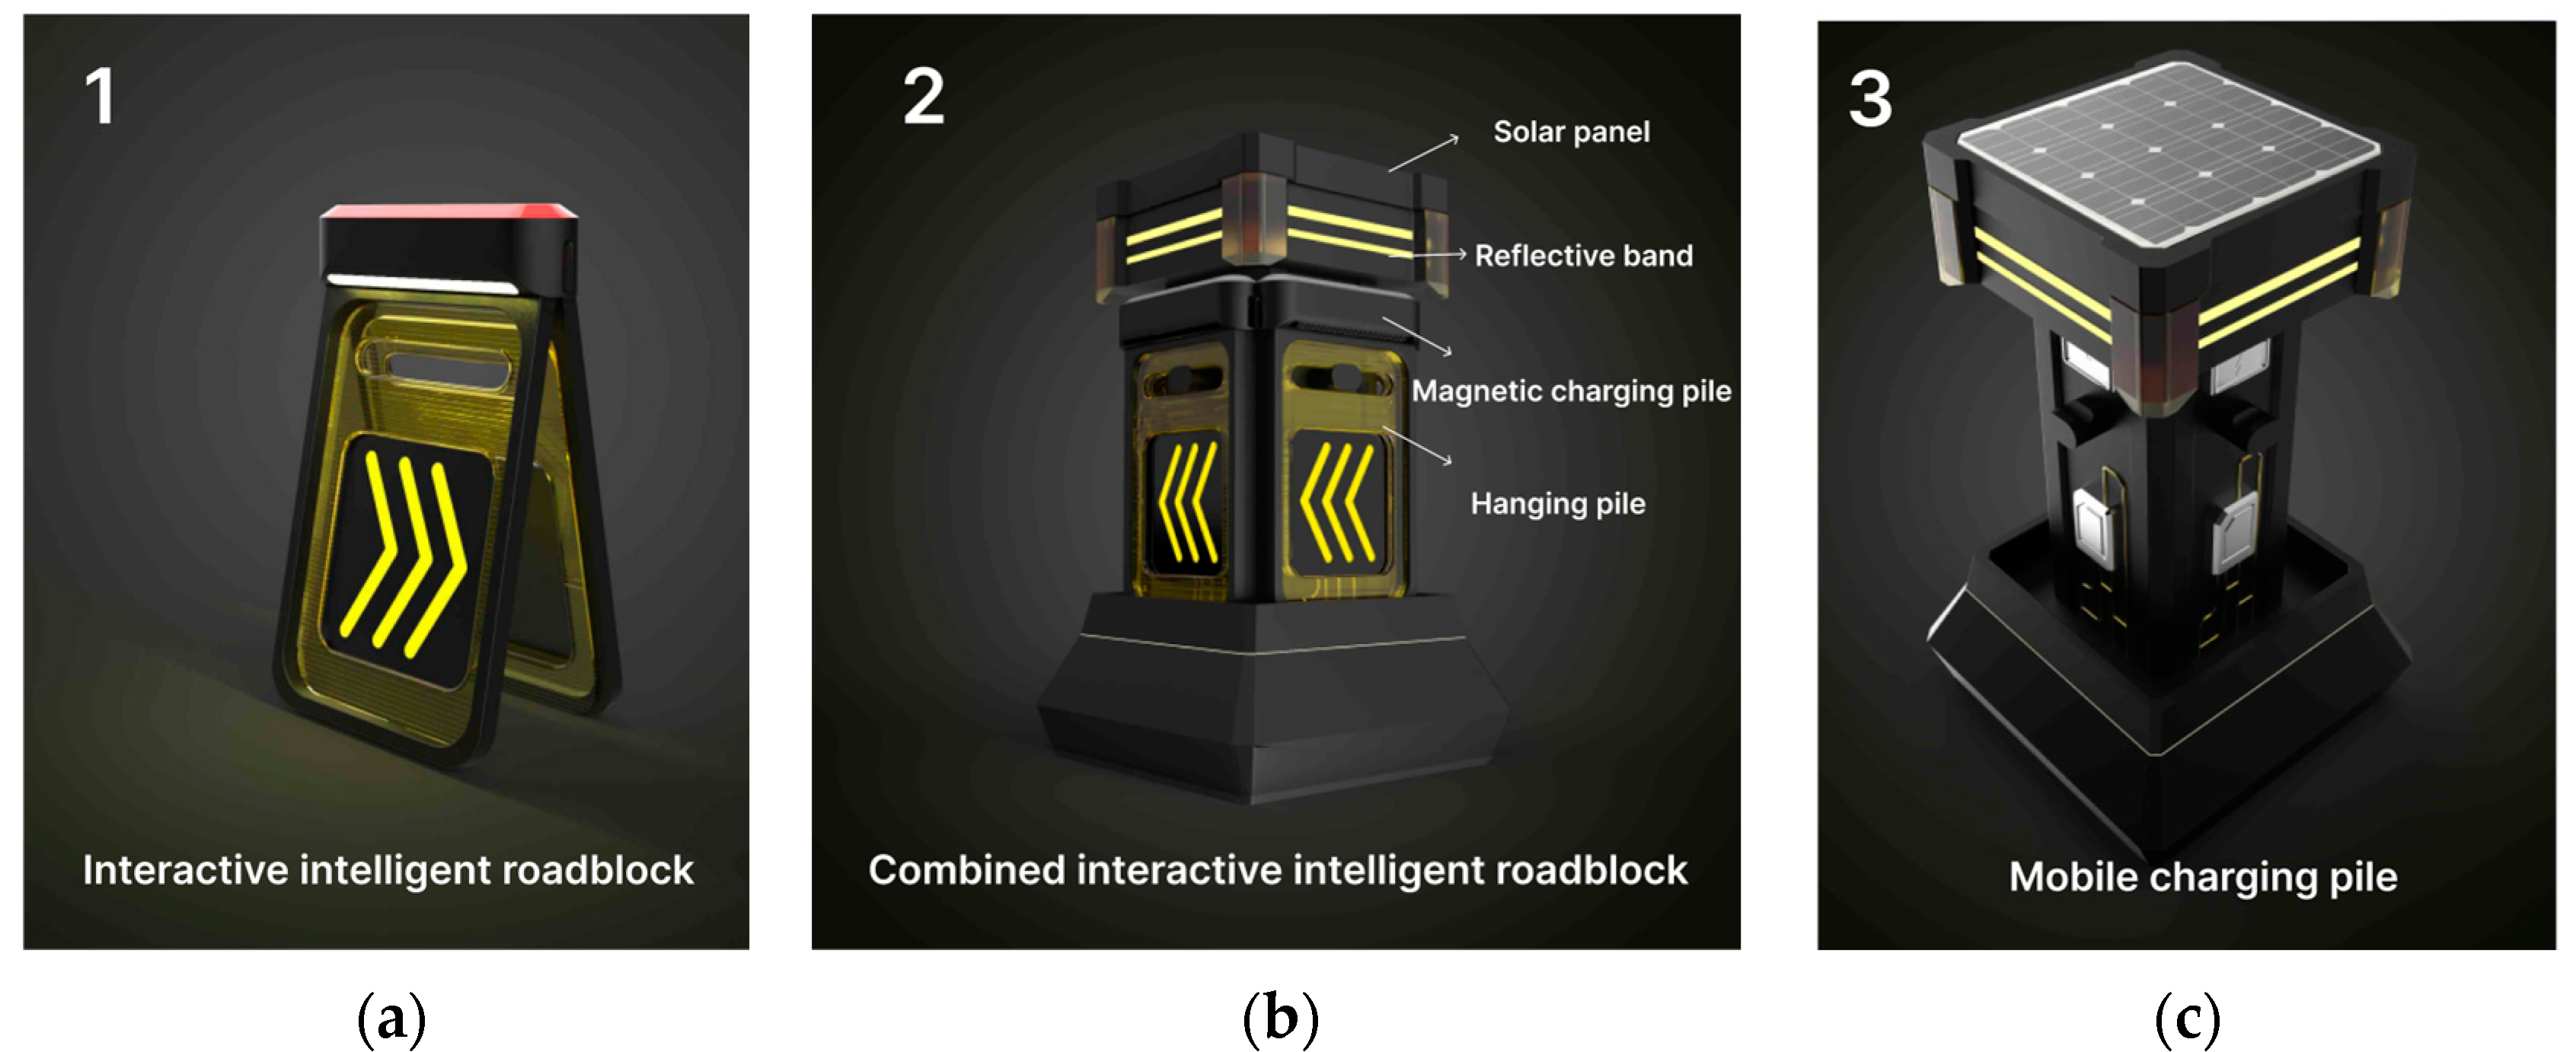
  • Intelligent sensing and dynamic feedback system: In the optimized design, the R-barricade is equipped with a network of intelligent sensors that can monitor environmental conditions in real time (such as light, temperature, and wind speed) and automatically adjust the brightness, color, and frequency of the warning signals. For example, when light is insufficient, or visibility is low, the LED lights will automatically increase in brightness to ensure visibility at night or during adverse weather conditions. The sensors can also detect the speed and direction of approaching vehicles and trigger dynamic signals through rapidly flashing LED lights and an audible alarm system to alert drivers of the barricade and prompt them to take appropriate actions;
  • Application of eye-tracking technology: We extensively applied eye-tracking technology not only to evaluate the design effectiveness of the barricade but also to optimize the interaction features. Eye-tracking data helped us identify and improve the key visual elements of the barricade, ensuring that it quickly captures the driver’s attention as they approach. This data-driven optimization significantly enhances the warning effect of the barricade and improves driver reaction times;
  • Remote monitoring and management: The R-barricade is equipped with a wireless communication module that allows real-time connectivity with the traffic management center. Through the remote monitoring system, management personnel can instantly monitor the status of the barricade, receive abnormal alerts, and adjust the settings of the barricade as necessary. This remote management function not only increases operational efficiency but also ensures a rapid response in emergency situations;
  • Self-sustaining energy and eco-friendly design: To achieve self-sustaining energy, the optimized design integrates a solar power system. The photovoltaic panels supply power to all interactive components, ensuring the barricade operates under any conditions. Additionally, eco-friendly polyvinyl chloride (PVC) material was selected [55], which has high rigidity, tensile strength, and elasticity, providing protection to vehicles and workers in high-speed impacts and reducing the risk of secondary injuries. Compared to traditional materials, this design significantly improves the stability and durability of the barricade;
  • Airbag system: The optimized design also incorporates an airbag system within the top interactive module, which can be deployed immediately upon impact detection. This innovative design effectively protects the components inside the interactive module and prevents injury to vehicles and construction workers, a feature lacking in traditional barricades.
Based on the eye-tracking data mentioned earlier, the high-contrast colors and dynamic signaling systems significantly enhanced driver attention. In the latest optimization, we further increased the color contrast, which is expected to more effectively guide and focus drivers’ attention, thereby helping them to recognize the roadblock more quickly. As shown in Figure 8, the figure illustrates a simulated application scenario, reflecting the anticipated use scenario of our designed R-barricade in highway construction.

3.3. Environmental Impact and Accident Analysis

3.3.1. Accident Analysis

We conducted a theoretical analysis to evaluate the performance of the R-barricade in the event of a traffic accident. The specific aspects of the analysis include the following:
  • Impact Protection: We analyzed the design parameters and material strength to assess the barricade’s ability to protect construction zones during a collision. Through calculations and material property analysis, we determined that the R-barricade can effectively absorb collision energy, reducing potential harm to drivers and pedestrians. Specifically, when a vehicle collides with the barricade at a speed of 50 km/h, the material of the barricade is designed to deform and absorb energy, thereby reducing the impact force on passengers inside the vehicle while simultaneously protecting workers within the construction zone;
  • Material Strength: Material analysis was conducted to study the durability and impact resistance of the materials used, ensuring that they provide sufficient strength and stability during real-world accidents. The selected materials exhibit high toughness and impact resistance, maintaining structural integrity during vehicle collisions and preventing secondary injuries;
  • Comparison with Safety Standards: We compared the performance of the R-barricade under different collision scenarios with relevant international and national traffic safety standards. This includes an evaluation of the deformation, stability, and secondary injury risks to vehicles after a collision. For example, theoretical calculations based on the European Standard EN 1317 indicate that after impact [56], the deformation and stability of the R-barricade remain within safe limits, ensuring that it does not pose further risks to subsequent vehicles.

3.3.2. Environmental Impact

We also conducted a comprehensive assessment of the potential environmental impact of the R-barricade by implementing a full life cycle assessment (LCA) to measure its impact at every stage, from material procurement, manufacturing, and use to final disposal. The key areas of focus include the following:
  • Environmental Friendliness of Materials: We selected sustainable materials that meet safety standards and have high recycling value;
  • Long-term Impact on the Ecosystem: This includes the potential effects of light pollution and disturbances to wildlife during prolonged use;
  • Preventive Measures: In the product design, we incorporated preventive measures to reduce these risks, such as optimizing material usage, reducing waste during production, and designing an efficient recycling system.

4. Discussion

4.1. Significance of Results

The experimental results of this study show that the R-barricade interactive barricade has significant advantages in enhancing traffic safety during highway emergency repairs. The application of eye-tracking technology allows us to accurately measure drivers’ attention and reaction time to the barricade, and the R-barricade’s design outperforms traditional barricades in these key metrics [57,58]. Its high contrast color scheme, interaction features, and environmentally adaptive design combine to improve the visibility and warning effect of the barricade, reducing the risk of accidents.
In a comparison of existing technologies, we found that the R-barricade excelled in several aspects. For example, Babić et al. [59] investigated the visibility problems of conventional barricades at night or in bad weather conditions, whereas the R-barricade significantly improved visibility through its high-contrast color scheme. According to Stevens et al. [60] assessment, the high contrast color scheme had a significant effect on driver attention, which is consistent with our design choice. In addition, Torbaghan et al. [61,62,63] analyzed the interactive features and user experience in existing road safety systems, and our R-barricade improves significantly on these aspects, providing a more intuitive and interactive user experience. In addition, according to Soylu and Soylu [64], drivers have a slow reaction time to traditional traffic signs, etc., which is effectively reduced by the interaction features of the R-barricade.

4.2. Research Limitations

This study validates the effectiveness of the R-barricade interactive barricade design in improving driver attention and reaction time through eye-tracking experiments in a laboratory setting. However, there are still some limitations that need to be addressed. We recognize that these limitations may affect the generalizability and applicability of the research results, and we plan to take specific measures to address these issues.
Limitations of the current sample size: The eye-tracking experiment in this study involved a small sample size, including 14 participants. Due to cognitive biases or procedural errors, the final valid data were obtained from only 10 participants. Although these data provide initial insights, the limited sample size may not fully represent a broader driver population, particularly those of different ages, genders, and driving experiences.
Differences between laboratory conditions and real-world environments: The study demonstrated the effectiveness of the R-barricade design in improving driver attention and reaction time through eye-tracking experiments conducted in a laboratory setting. However, we acknowledge that while the laboratory conditions provided the necessary controls to ensure experimental accuracy, they cannot fully replicate the complexity of a real motorway construction site. The current research lacks field testing, primarily due to the challenges of gaining access to motorway construction sites, as well as the high cost and potential safety risks of field testing.

4.3. Future Improvements

To enhance the generalizability and reliability of the research results, future studies will expand the sample size to include a more diverse group of participants. This will involve participants of different age groups, genders, and driving experiences to ensure that the experimental results are more widely applicable. By recruiting participants from various backgrounds, such as professional drivers, young drivers, and elderly drivers, we aim to gain a more comprehensive understanding of how different groups respond to the R-barricade, thereby further optimizing the design.
Given the limitations of the laboratory environment, future research should conduct large-scale field tests in real motorway environments. These tests will provide critical data to evaluate the performance and reliability of the barricade under actual conditions and help further optimize the design. In addition, field tests will provide valuable information on the interaction between the barricade and driver behavior, which is crucial for ultimately determining the practicality and safety of the R-barricade. By implementing these field tests, we expect to fully assess the performance of the R-barricade and provide a more solid scientific basis for traffic safety measures during highway emergency repairs.
We will also explore collaborations with industry partners to reduce costs and improve the feasibility of field tests.

5. Conclusions

In this study, we designed and evaluated the R-barricade interactive barricade, which aims to enhance traffic safety during highway emergency repairs. By applying eye-tracking technology, we quantified drivers’ visual responses to different barricade designs and innovatively combined visual evaluation metrics with eye-movement data to provide a new assessment method for the safety and aesthetic value of barricades. The research objectives we set, including improving the visibility, warning effect, interactivity, environmental integration, and user-friendliness of roadblocks, were all achieved in the experiments; these objectives have often not been fully met in previous studies. The experimental results show that the R-barricade outperforms conventional barricades in all these aspects, especially its high contrast color scheme and interaction features, which significantly improve drivers’ attention to the barricade and effectively reduce the risk of accidents.
Despite the positive results of this study under laboratory conditions, we recognize that its limitation is the lack of field testing on real motorway construction sites. Future research should include extensive field testing of the R-barricade in a real motorway environment to further validate its performance and reliability. In addition, cost-benefit analysis and the feasibility of large-scale deployment are also priorities for future research. The design and evaluation methodology of the R-barricade provides an effective reference for the innovation of highway robber barricades, which is of great practical importance for the improvement of urban traffic safety management in the future. We expect that through continuous research and optimization, the R-barricade will provide a safer and more efficient solution for highway repair operations, thus improving road traffic safety.

Author Contributions

Conceptualization, X.Z. (Xiaohan Zhu) and X.Z. (Xuandong Zhao); methodology, X.Z. (Xiaohan Zhu) and X.Z. (Xuandong Zhao); formal analysis, X.Z. (Xiaohan Zhu); design, X.Z. (Xiaohan Zhu) and X.Z. (Xuandong Zhao); resources, X.Z. (Xiaohan Zhu); data curation, X.Z. (Xiaohan Zhu); writing—original draft preparation, X.Z. (Xiaohan Zhu); writing—review and editing, X.Z. (Xiaohan Zhu); visualization, X.D. and X.Z. (Xiaohan Zhu); supervision, B.S. and J.Y.; project administration, B.S.; funding acquisition, J.Y. and B.S. All authors have read and agreed to the published version of the manuscript.

Funding

This research received no external funding.

Institutional Review Board Statement

This study was approved by the ethics committee of the Beijing Institute of Technology (approval no. BIT-EC-H-2024144, 22 April 2024). We certify that the study was performed in accordance with the 1964 Declaration of Helsinki and later amendments. All participants provided informed consent, which was verbal, prior to participating in the study. The anonymity and confidentiality of participants are guaranteed, and participation is entirely voluntary.

Informed Consent Statement

Informed consent was obtained from all subjects involved in this study.

Data Availability Statement

The original contributions presented in the study are included in the article, further inquiries can be directed to the corresponding author.

Acknowledgments

We would like to express our sincere thanks to the teachers who let us take part in their teaching and subsequently engaged in interviews with us.

Conflicts of Interest

The authors declare no conflicts of interest.

References

  1. Mohammed, A.A.; Ambak, K.; Mosa, A.M.; Syamsunur, D. A Review of Traffic Accidents and Related Practices Worldwide. Open Transp. J. 2019, 13, 65–83. [Google Scholar] [CrossRef]
  2. Ji, X.; Shao, C.; Wang, B. Stochastic Dynamic Traffic Assignment Model under Emergent Incidents. Procedia Eng. 2016, 137, 620–629. [Google Scholar] [CrossRef]
  3. Naqvi, N.K.; Quddus, M.; Enoch, M. Modelling the Effects of Fuel Price Changes on Road Traffic Collisions in the European Union Using Panel Data. Accid. Anal. Prev. 2023, 191, 107196. [Google Scholar] [CrossRef] [PubMed]
  4. Hazen, A.; Ehiri, J.E. Road Traffic Injuries: Hidden Epidemic in Less Developed Countries. J. Natl. Med. Assoc. 2006, 98, 73. [Google Scholar]
  5. Masilkova, M. Health and Social Consequences of Road Traffic Accidents. Kontakt 2017, 19, e43–e47. [Google Scholar] [CrossRef]
  6. Zhu, Q.; Liu, Y.; Liu, M.; Zhang, S.; Chen, G.; Meng, H. Intelligent Planning and Research on Urban Traffic Congestion. Future Internet 2021, 13, 284. [Google Scholar] [CrossRef]
  7. Jumari, M.Z.I.; Hassan, S.; Nadir, M.A.M.; Yusof, N.M.; Ikhsan, M.S.; Azman, M.A.M.N.; Sarif, M.A.F.M.; Rashid, M.A.R.A.; Aziz, N.N.A.N.; Yusof, M.S.; et al. The Signal Warning Detector (SWAD) for Sustainable Working Environment at Highways. Int. J. Integr. Eng. 2022, 14, 157–163. [Google Scholar] [CrossRef]
  8. Rupasinghe, B.; Wallace, M.; Gange, G.; Senthooran, I. Road Pavement Upgrade Scheduling Accounting for Minimizing Congestion. Sci. Rep. 2023, 13, 15386. [Google Scholar] [CrossRef]
  9. Huang, Y.; Tang, Y. Investigating the Impact Factors of Night Construction for Urban Road Projects. Front. Bus. Econ. Manag. 2022, 6, 159–164. [Google Scholar] [CrossRef]
  10. Ahmad, S.; Shafie, S.; Ab Kadir, M.Z.A. Power Feasibility of a Low Power Consumption Solar Tracker. Procedia Environ. Sci. 2013, 17, 494–502. [Google Scholar] [CrossRef]
  11. Alphonsus, E.R.; Abdullah, M.O. A Review on the Applications of Programmable Logic Controllers (PLCs). Renew. Sustain. Energy Rev. 2016, 60, 1185–1205. [Google Scholar] [CrossRef]
  12. Zhang, K.; Hassan, M. Crash Severity Analysis of Nighttime and Daytime Highway Work Zone Crashes. PLoS ONE 2019, 14, e0221128. [Google Scholar] [CrossRef] [PubMed]
  13. Pal, R.; Sinha, K.C. Analysis of Crash Rates at Interstate Work Zones in Indiana. Transp. Res. Rec. J. Transp. Res. Board 1996, 1529, 45–53. [Google Scholar] [CrossRef]
  14. Debnath, A.K.; Blackman, R.; Haworth, N. Common Hazards and Their Mitigating Measures in Work Zones: A Qualitative Study of Worker Perceptions. Saf. Sci. 2015, 72, 293–301. [Google Scholar] [CrossRef]
  15. Dobrovolny, C.S.; Arrington, D.R.; Bligh, R.P.; Kuhn, D.L. MASH Evaluation of TxDOT High-Mounting-Height Temporary Work Zone Sign Support System; No. FHWA/TX-16/9-1002-15-8; Texas A&M Transportation Institute: Bryan, TX, USA, 2017. [Google Scholar]
  16. Dobrovolny, C.S.; Arrington, D.R.; Bligh, R.P.; Menges, W.L. Development and MASH Full-Scale Crash Testing of a High-Mounting-Height Temporary Single Sign Support with Aluminum Sign; No. FHWA/TX-13/9-1002-12-5; Texas Department of Transportation, Research and Technology Implementation Office: Austin, TX, USA, 2013. [Google Scholar]
  17. Dedeji, J.A.; Hassan, M.M.; Abejide, S.O. Effectiveness of Communication Tools in Road Transportation: Nigerian Perspective. In Proceedings of the International Conference on Traffic and Transportation Engineering, Belgrade, Serbia, 24–25 November 2016. [Google Scholar]
  18. Steele, D.; Zabecki, J.L.M.; Zimmerman, L. Improving the Effectiveness of Nighttime Temporary Traffic Control Warning Devices, Volume 2: Evaluation of Nighttime Mobile Warning Lights; ICT-13-032 UILU-ENG-2013-2033; Illinois Department of Transportation: Springfield, IL, USA, 2013; Available online: https://www.ideals.illinois.edu/items/45997 (accessed on 5 August 2024).
  19. Fylan, F.; King, M.; Brough, D.; Black, A.A.; King, N.; Bentley, L.A.; Wood, J.M. Increasing Conspicuity on Night-Time Roads: Perspectives from Cyclists and Runners. Transp. Res. Part F Traffic Psychol. Behav. 2020, 68, 161–170. [Google Scholar] [CrossRef]
  20. Wood, J.M. Improving the Conspicuity and Safety of Pedestrians and Cyclists on Night-Time Roads. Clin. Exp. Optom. 2023, 106, 227–237. [Google Scholar] [CrossRef]
  21. Yu, C.-E.; Xie, S.Y.; Wen, J. Coloring the Destination: The Role of Colour Psychology on Instagram. Tour. Manag. 2020, 80, 104110. [Google Scholar] [CrossRef]
  22. Faltaous, S.; Baumann, M.; Schneegass, S.; Chuang, L.L. Design Guidelines for Reliability Communication in Autonomous Vehicles. In Proceedings of the 10th International Conference on Automotive User Interfaces and Interactive Vehicular Applications, Toronto, ON, Canada, 23–25 September 2018. [Google Scholar]
  23. Liu, Y.; Zhang, Q.; Lv, Z. Real-Time Intelligent Automatic Transportation Safety Based on Big Data Management. IEEE Trans. Intell. Transp. Syst. 2021, 23, 9702–9711. [Google Scholar] [CrossRef]
  24. Naveed, Q.N.; Alqahtani, H.; Khan, R.U.; Almakdi, S.; Alshehri, M.; Abdul Rasheed, M.A. An Intelligent Traffic Surveillance System Using Integrated Wireless Sensor Network and Improved Phase Timing Optimization. Sensors 2022, 22, 3333. [Google Scholar] [CrossRef]
  25. Selimis, V. Eye-Tracking Technology in Vehicles: Application and Design. Master’s Dissertation, City University London, London, UK, 2015. [Google Scholar]
  26. Michelaraki, E.; Katrakazas, C.; Kaiser, S.; Brijs, T.; Yannis, G. Real-Time Monitoring of Driver Distraction: State-of-the-Art and Future Insights. Accid. Anal. Prev. 2023, 192, 107241. [Google Scholar] [CrossRef]
  27. Babić, D.; Tremski, Š.; Babić, D. Investigation of Traffic Signs Understanding-Eye Tracking Case Study. Teh. Vjesn. 2019, 26, 29–35. [Google Scholar]
  28. Yuen, N.H.; Tam, F.; Churchill, N.W.; Schweizer, T.A.; Graham, S.J. Driving with Distraction: Measuring Brain Activity and Oculomotor Behaviour Using fMRI and Eye-Tracking. Front. Hum. Neurosci. 2021, 15, 659040. [Google Scholar] [CrossRef]
  29. Shen, T.; Han, Y.; Han, B.; Gao, X. Driver Eye Movement Behaviour Recognition Based on a Two-Channel Model of Human Visual Cortex. J. Intell. Syst. 2022, 17, 41–49. [Google Scholar]
  30. Fleishman, L.J.; Wadman, C.S.; Maximov, K.J. The Interacting Effects of Total Light Intensity and Chromatic Contrast on Visual Signal Visibility in an Anolis Lizard. Anim. Behav. 2020, 167, 263–273. [Google Scholar] [CrossRef]
  31. Lewandowska, A.; Olejnik-Krugly, A.; Jankowski, J.; Dziśko, M. Subjective and Objective User Behavior Disparity: Towards Balanced Visual Design and Color Adjustment. Sensors 2021, 21, 8502. [Google Scholar] [CrossRef]
  32. Ramamurthy, M.; Lakshminarayanan, V. Human Vision and Perception. In Handbook of Advanced Lighting Technology; Springer: Cham, Switzerland, 2015; pp. 1–23. [Google Scholar]
  33. Jin, Z.; Gambatese, J. Temporary Construction Signage: Driver Preferences for Work Zone Safety. In Proceedings of the Construction Research Congress 2018, New Orleans, LA, USA, 2–4 April 2018. [Google Scholar]
  34. Freeman, C.; Nel, E. Planning for the Caring City; Taylor & Francis: Abingdon, UK, 2024. [Google Scholar]
  35. Pedestrian Safety: A Road Safety Manual for Decision-Makers and Practitioners; World Health Organization: Geneva, Switzerland, 2023.
  36. Zhang, Y.; Carballo, A.; Yang, H.; Takeda, K. Perception and Sensing for Autonomous Vehicles under Adverse Weather Conditions: A Survey. ISPRS J. Photogramm. Remote Sens. 2023, 196, 146–177. [Google Scholar] [CrossRef]
  37. Craig, C.M.; Morris, N.L.; Libby, D.A.; Davis, B. Work Zone Intrusion Report Interface Design; Minnesota Department of Transportation: St Paul, MN, USA, 2018. [Google Scholar]
  38. Sumit, K.; Brijs, K.; Ross, V.; Wets, G.; Ruiter, R.A. A Focus Group Study to Explore Risky Ridership Among Young Motorcyclists in Manipal, India. Safety 2022, 8, 40. [Google Scholar] [CrossRef]
  39. Bhagavathula, R.; Gibbons, R.B. Effect of Work Zone Lighting on Drivers’ Visual Performance and Perceptions of Glare. Transp. Res. Rec. 2017, 2617, 44–51. [Google Scholar] [CrossRef]
  40. Tekeş, B.; Solmazer, G.; Alkan, H.N. The Relationship Between Traffic Sign Comprehension and Risky Traffic Behaviors. Nesne Psikol. Derg. 2021, 9, 755–769. [Google Scholar]
  41. Venthuruthiyil, S.P.; Thapa, D.; Mishra, S. Towards Smart Work Zones: Creating Safe and Efficient Work Zones in the Technology Era. J. Saf. Res. 2023, 87, 345–366. [Google Scholar] [CrossRef]
  42. Damaševičius, R.; Bacanin, N.; Misra, S. From Sensors to Safety: Internet of Emergency Services (IoES) for Emergency Response and Disaster Management. J. Sens. Actuator Netw. 2023, 12, 41. [Google Scholar] [CrossRef]
  43. Boavida, R.; Navas, H.; Godina, R.; Carvalho, H.; Hasegawa, H. A Combined Use of TRIZ Methodology and Eco-Compass Tool as a Sustainable Innovation Model. Appl. Sci. 2020, 10, 3535. [Google Scholar] [CrossRef]
  44. Tontini, G. Integrating the Kano Model and QFD for Designing New Products. Total Qual. Manag. 2007, 18, 599–612. [Google Scholar] [CrossRef]
  45. Payre, W.; Diels, C. I Want to Brake Free: The Effect of Connected Vehicle Features on Driver Behaviour, Usability and Acceptance. Appl. Ergon. 2020, 82, 102932. [Google Scholar] [CrossRef] [PubMed]
  46. Yigitcanlar, T.; Downie, A.T.; Mathews, S.; Fatima, S.; MacPherson, J.; Behara, K.N.; Paz, A. Digital Technologies of Transportation-Related Communication: Review and the State-of-the-Art. Transp. Res. Interdiscip. Perspect. 2024, 23, 100987. [Google Scholar] [CrossRef]
  47. Chintada, A.; V, U. Improvement of Productivity by Implementing Occupational Ergonomics. J. Ind. Prod. Eng. 2022, 39, 59–72. [Google Scholar] [CrossRef]
  48. Bitkina, O.V.; Park, J.; Kim, H.K. The Ability of Eye-Tracking Metrics to Classify and Predict the Perceived Driving Workload. Int. J. Ind. Ergon. 2021, 86, 103193. [Google Scholar] [CrossRef]
  49. Lechtenberg, K.; Faller, R.; Rasmussen, J.; Asadollahi Pajouh, M. Safety Performance Evaluation of a Non-Proprietary Type III Barricade for Use in Work Zones. In International Road Federation World Meeting & Exhibition; Springer International Publisher: Cham, Switzerland, 2021. [Google Scholar]
  50. Bullough, J.D.; Snyder, J.D.; Skinner, N.P.; Rea, M.S. Development and Evaluation of a Prototype Barricade Lighting System. Int. J. Traffic Transp. Eng. 2012, 2, 154–165. [Google Scholar]
  51. Liu, P.; Wang, K.; Yang, K.; Chen, H.; Zhao, A.; Xue, Y.; Zhou, L. An Aesthetic Measurement Approach for Evaluating Product Appearance Design. Math. Probl. Eng. 2020, 2020, 1791450. [Google Scholar] [CrossRef]
  52. Hu, H.; Liu, Y.; Lu, W.F.; Guo, X. A Quantitative Aesthetic Measurement Method for Product Appearance Design. Adv. Eng. Inform. 2022, 53, 101644. [Google Scholar] [CrossRef]
  53. Peli, E.; Larimer, J.; Martínez-Uriegas, E. Vision Modes for Target Detection Recognition. J. Soc. Inf. Disp. 1996, 4, 145–146. [Google Scholar] [CrossRef]
  54. Khalighy, S.; Green, G.; Scheepers, C.; Whittet, C. Measuring Aesthetic in Design. In Proceedings of the DESIGN 2014 13th International Design Conference, Windhoek, Namibia, 6–10 October 2014. [Google Scholar]
  55. Turner, A.; Filella, M. Polyvinyl Chloride in Consumer and Environmental Plastics, with a Particular Focus on Metal-Based Additives. Environ. Sci. Process. Impacts 2021, 23, 1376–1384. [Google Scholar] [CrossRef] [PubMed]
  56. Müller, F.M. EN 1317 and CE Marking Versus National Regulations. In Proceedings of the Roadside Safety Design and Devices, Milan, Italy, 17 June 2012; p. 28. [Google Scholar]
  57. Cheewapattananuwong, W.; Chaloeywares, P. The Innovation of Natural Rubber Applied with Concrete Road Barriers in Thailand. Adv. Sci. Technol. 2020, 103, 55–61. [Google Scholar]
  58. Saha, P.; Kobryn, A. Application of Rolling Slowdown versus Roadblock on High Profile Roadways: A Case Study. In Proceedings of the International Conference on Transportation and Development 2021, Virtual, 8–10 June 2021. [Google Scholar]
  59. Babić, D.; Babić, D.; Fiolic, M.; Ferko, M. Road Markings and Signs in Road Safety. Encyclopedia 2022, 2, 1738–1752. [Google Scholar] [CrossRef]
  60. Stevens, A.; Quimby, A.; Board, A.; Kersloot, T.; Burns, P. Design Guidelines for Safety of In-Vehicle Information Systems; TRL Limited: Wokingham, UK, 2002. [Google Scholar]
  61. Torbaghan, M.E.; Sasidharan, M.; Reardon, L.; Muchanga-Hvelplund, L.C. Understanding the Potential of Emerging Digital Technologies for Improving Road Safety. Accid. Anal. Prev. 2022, 166, 106543. [Google Scholar] [CrossRef]
  62. Nnaji, C.; Gambatese, J.; Lee, H.W.; Zhang, F. Improving Construction Work Zone Safety Using Technology: A Systematic Review of Applicable Technologies. J. Traffic Transp. Eng. (Engl. Ed.) 2020, 7, 61–75. [Google Scholar] [CrossRef]
  63. Szymoniak, S.; Depta, F.; Karbowiak, B.; Kubanek, M. Trustworthy Artificial Intelligence Methods for Users’ Physical and Environmental Security: A Comprehensive Review. Appl. Sci. 2023, 13, 12068. [Google Scholar] [CrossRef]
  64. Soylu, E.; Soylu, T. A Performance Comparison of YOLOv8 Models for Traffic Sign Detection in the Robotaxi-Full Scale Autonomous Vehicle Competition. Multimed. Tools Appl. 2024, 83, 25005–25035. [Google Scholar] [CrossRef]
Figure 1. Preliminary design drawing. The pictures detail the structure of the original design of the R-barricade; it is composed of a roadblock folding plate, isolation strip, safety line projection, charging interface, and magnetic interface (the picture is drawn by the author).
Applsci 14 07120 g001
Figure 2. Preliminary project material rendering. It shows that the R-barricade is composed of a mobile charging pile and an interactive roadblock as a combined interactive roadblock (the picture is drawn by the author).
Applsci 14 07120 g002
Figure 3. Tobi Pro Glasses 2 Wearable eye tracking device. The image shows the Tobi Pro Glasses 2 Wearable eye-tracking device, which consists of glasses, HDMI cable, and an inbuilt SD memory card.
Applsci 14 07120 g003
Figure 4. The processed images that the subject sees. The gray-level image is evenly processed by Photoshop software, and finally, it becomes a bitmap image with a resolution of 640 × 480.
Applsci 14 07120 g004
Figure 5. Experimental process record. Participants are wearing Tobii Pro Glasses 2 and looking at a grayscale image of a roadblock on the display.
Applsci 14 07120 g005
Figure 6. The collection rates of some of the records. They should be listed as (a) Solution 10 Product hotspot map, red represents the longest gaze, followed by yellow, the shortest is green; (b) Plot of gaze points in scheme 10. The number and length of gaze reflect the importance and interest of the part of the area being tested.
Applsci 14 07120 g006
Figure 7. Interactive roadblock design. They should be listed as (a) the interactive roadblock features a collapsible vertical structure and embedded fulcrum design; (b) the combined interactive roadblock consists of a solar panel, reflective band, magnetic charging pile, and hanging pile; (c) mobile charging pile.
Applsci 14 07120 g007
Figure 8. This diagram demonstrates the deployment scenario of the R-barricade in urban road construction (the picture is drawn by the author).
Applsci 14 07120 g008
Table 1. Analysis of the existing barricade designs, summarizing the advantages and disadvantages of existing roadblocks (the graphics are from https://www.baidu.com (accessed on 10 October 2023)).
Roadblock NameAdvantagesDisadvantagesRoadblock Picture
Conical roadblockHave a warning effectLacks aesthetic integration with the urban environmentApplsci 14 07120 i001
A folding barricadeEasy to carry and store, can be quickly reconfiguredLimited interactivity and warning functions
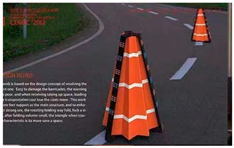
Applsci 14 07120 i002
Mobile barrierCan be quickly moved and redeployedInsufficient visibility at night without additional lightingApplsci 14 07120 i003
Solar roadblockPowered by solar panels, often equipped with LED lightsMay be less visible in poor lighting conditions if the solar panel is obscured
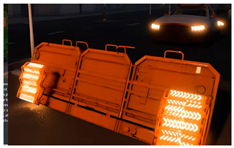
Applsci 14 07120 i004
Automatic inflatable barricadesRapid deployment and easy portability due to inflatable designAesthetics may be limited and may require maintenance to ensure proper inflation and deflation
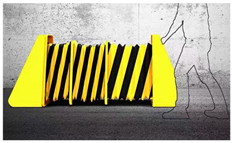
Applsci 14 07120 i005
Guardrail barrierCan be temporarily set up around emergency repair areasSimilar to guardrails, may not provide sufficient visual warnings
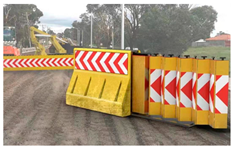
Applsci 14 07120 i006
Sound–light warning barrierEquipped with an audible alarm device to alert driversMay not be effective if drivers have their windows up or are otherwise unable to hear the alarm
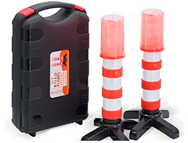
Applsci 14 07120 i007
Eco-friendly material barrierMade of recycled or biodegradable materialsMay not be as durable or visible as other materials
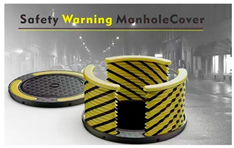
Applsci 14 07120 i008
Modular roadblockCan be quickly assembled and disassembled as neededMay require more time for setup and takedown compared to other types of barricades
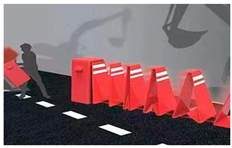
Applsci 14 07120 i009
Table 2. Purity, proportion, contrast, C/T calculation case.
Planned Number12
Gaze Points170188
Variance of gaze point duration0.220.31
Average duration of gaze points (s)6.516.78
Purity (%)1/(170/10/1) × 100% = 5.88%1/(188/10/1) × 100% = 5.32%
Ratio (s)1/0.22 = 4.551/0.31 = 3.23
Contrast (s)170 × 0.22/10 = 3.74188 × 0.31/10 = 5.83
C/T3.74/6.51 = 0.575.83/6.78 = 0.86
Table 3. Integration of purity, ratio, contrast, and C/T data for selected products.
Planned NumberAverage Duration of Gaze Point T (s)Gaze PointsPurity (%)Variance (Statistics)Proportion (%)Contrast (s)C/T
16.511705.88%0.224.553.740.57
26.781885.32%0.313.235.830.86
36.621436.99%0.273.703.860.58
46.711845.43%0.254.004.600.69
56.641785.62%0.234.354.090.62
66.431695.92%0.293.454.900.76
76.491825.49%0.323.135.820.90
86.552234.48%0.33.336.691.02
96.851995.03%0.283.575.570.81
106.891566.41%0.224.553.430.50
Disclaimer/Publisher’s Note: The statements, opinions and data contained in all publications are solely those of the individual author(s) and contributor(s) and not of MDPI and/or the editor(s). MDPI and/or the editor(s) disclaim responsibility for any injury to people or property resulting from any ideas, methods, instructions or products referred to in the content.

