
Field Evaluation and Application of Intelligent Quality Control Systems


Abstract
:1. Introduction
2. Materials and Methods
2.1. Plate Load Test (PLT)
2.2. Field Density Test (FDT)
2.3. Dynamic Cone Penetrometer Test (DCPT)
2.4. Light Falling Weight Deflectometer (LFWD)
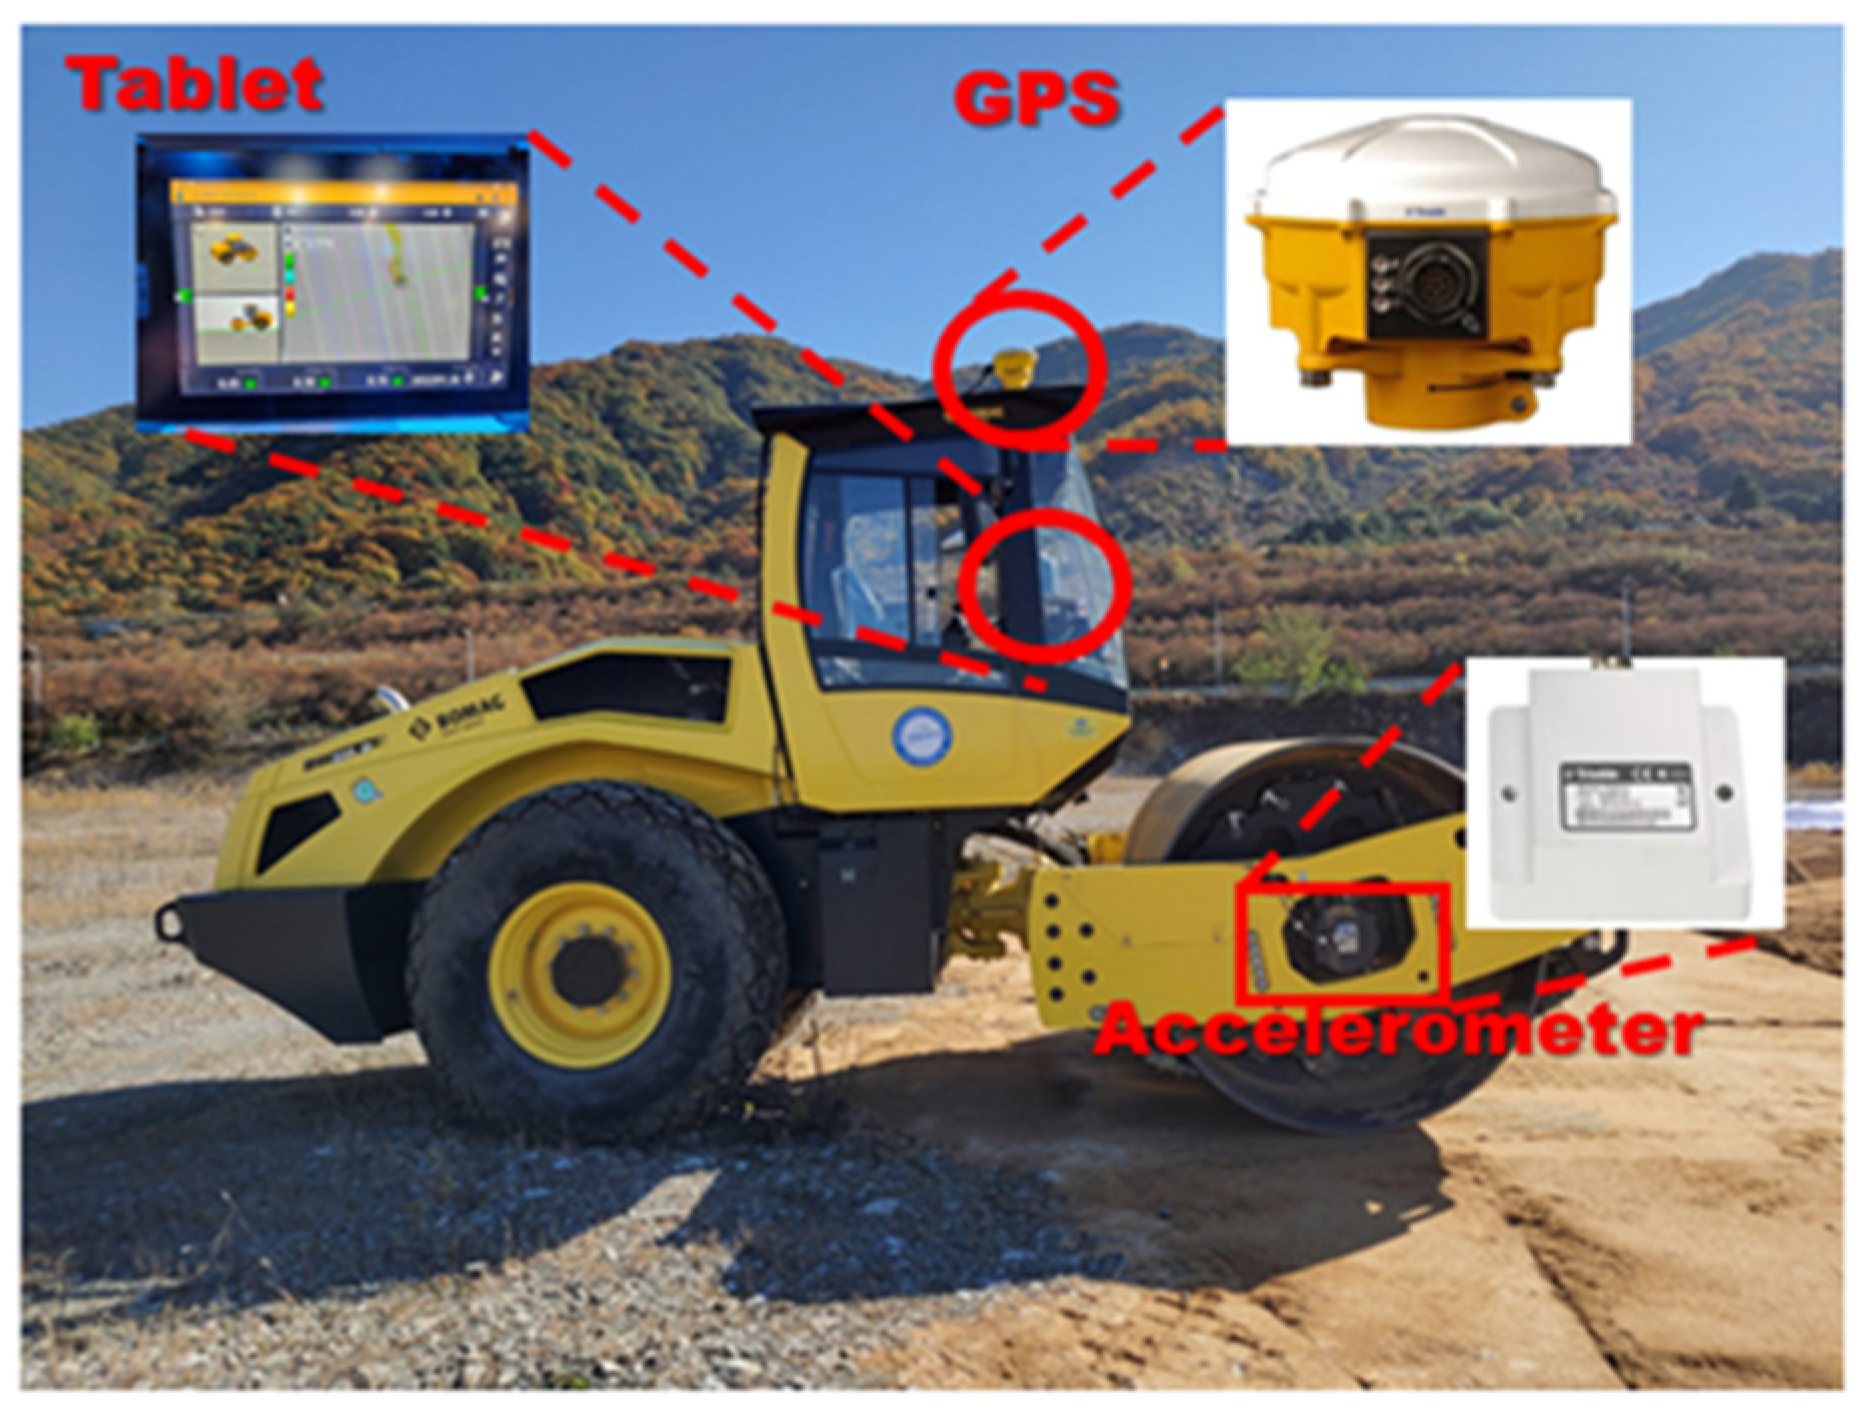
2.5. Intelligent QC System
3. Results
3.1. Test Site Construction
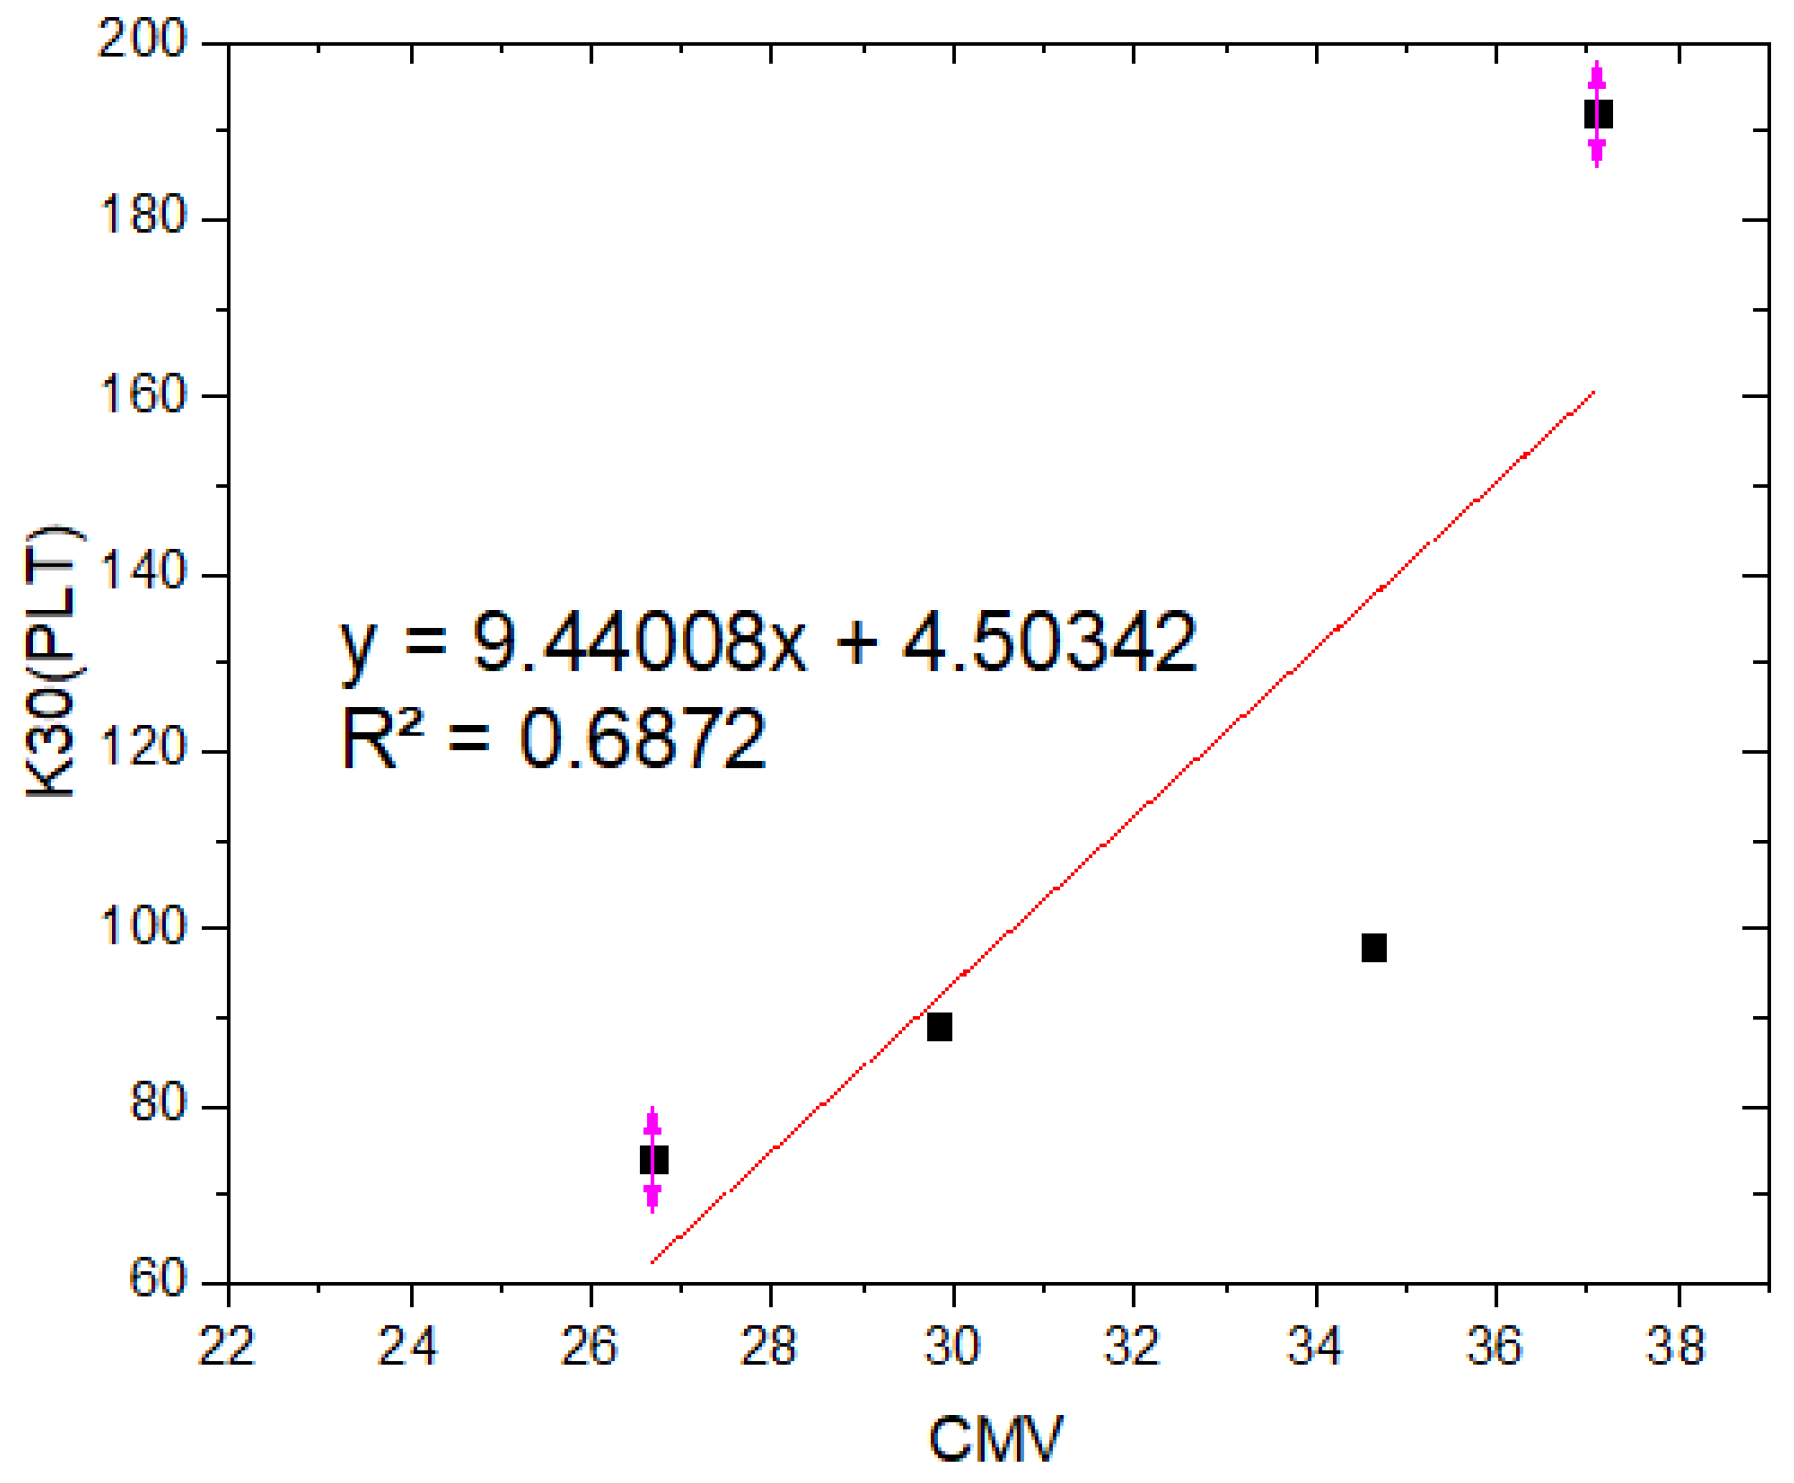
3.2. PLT
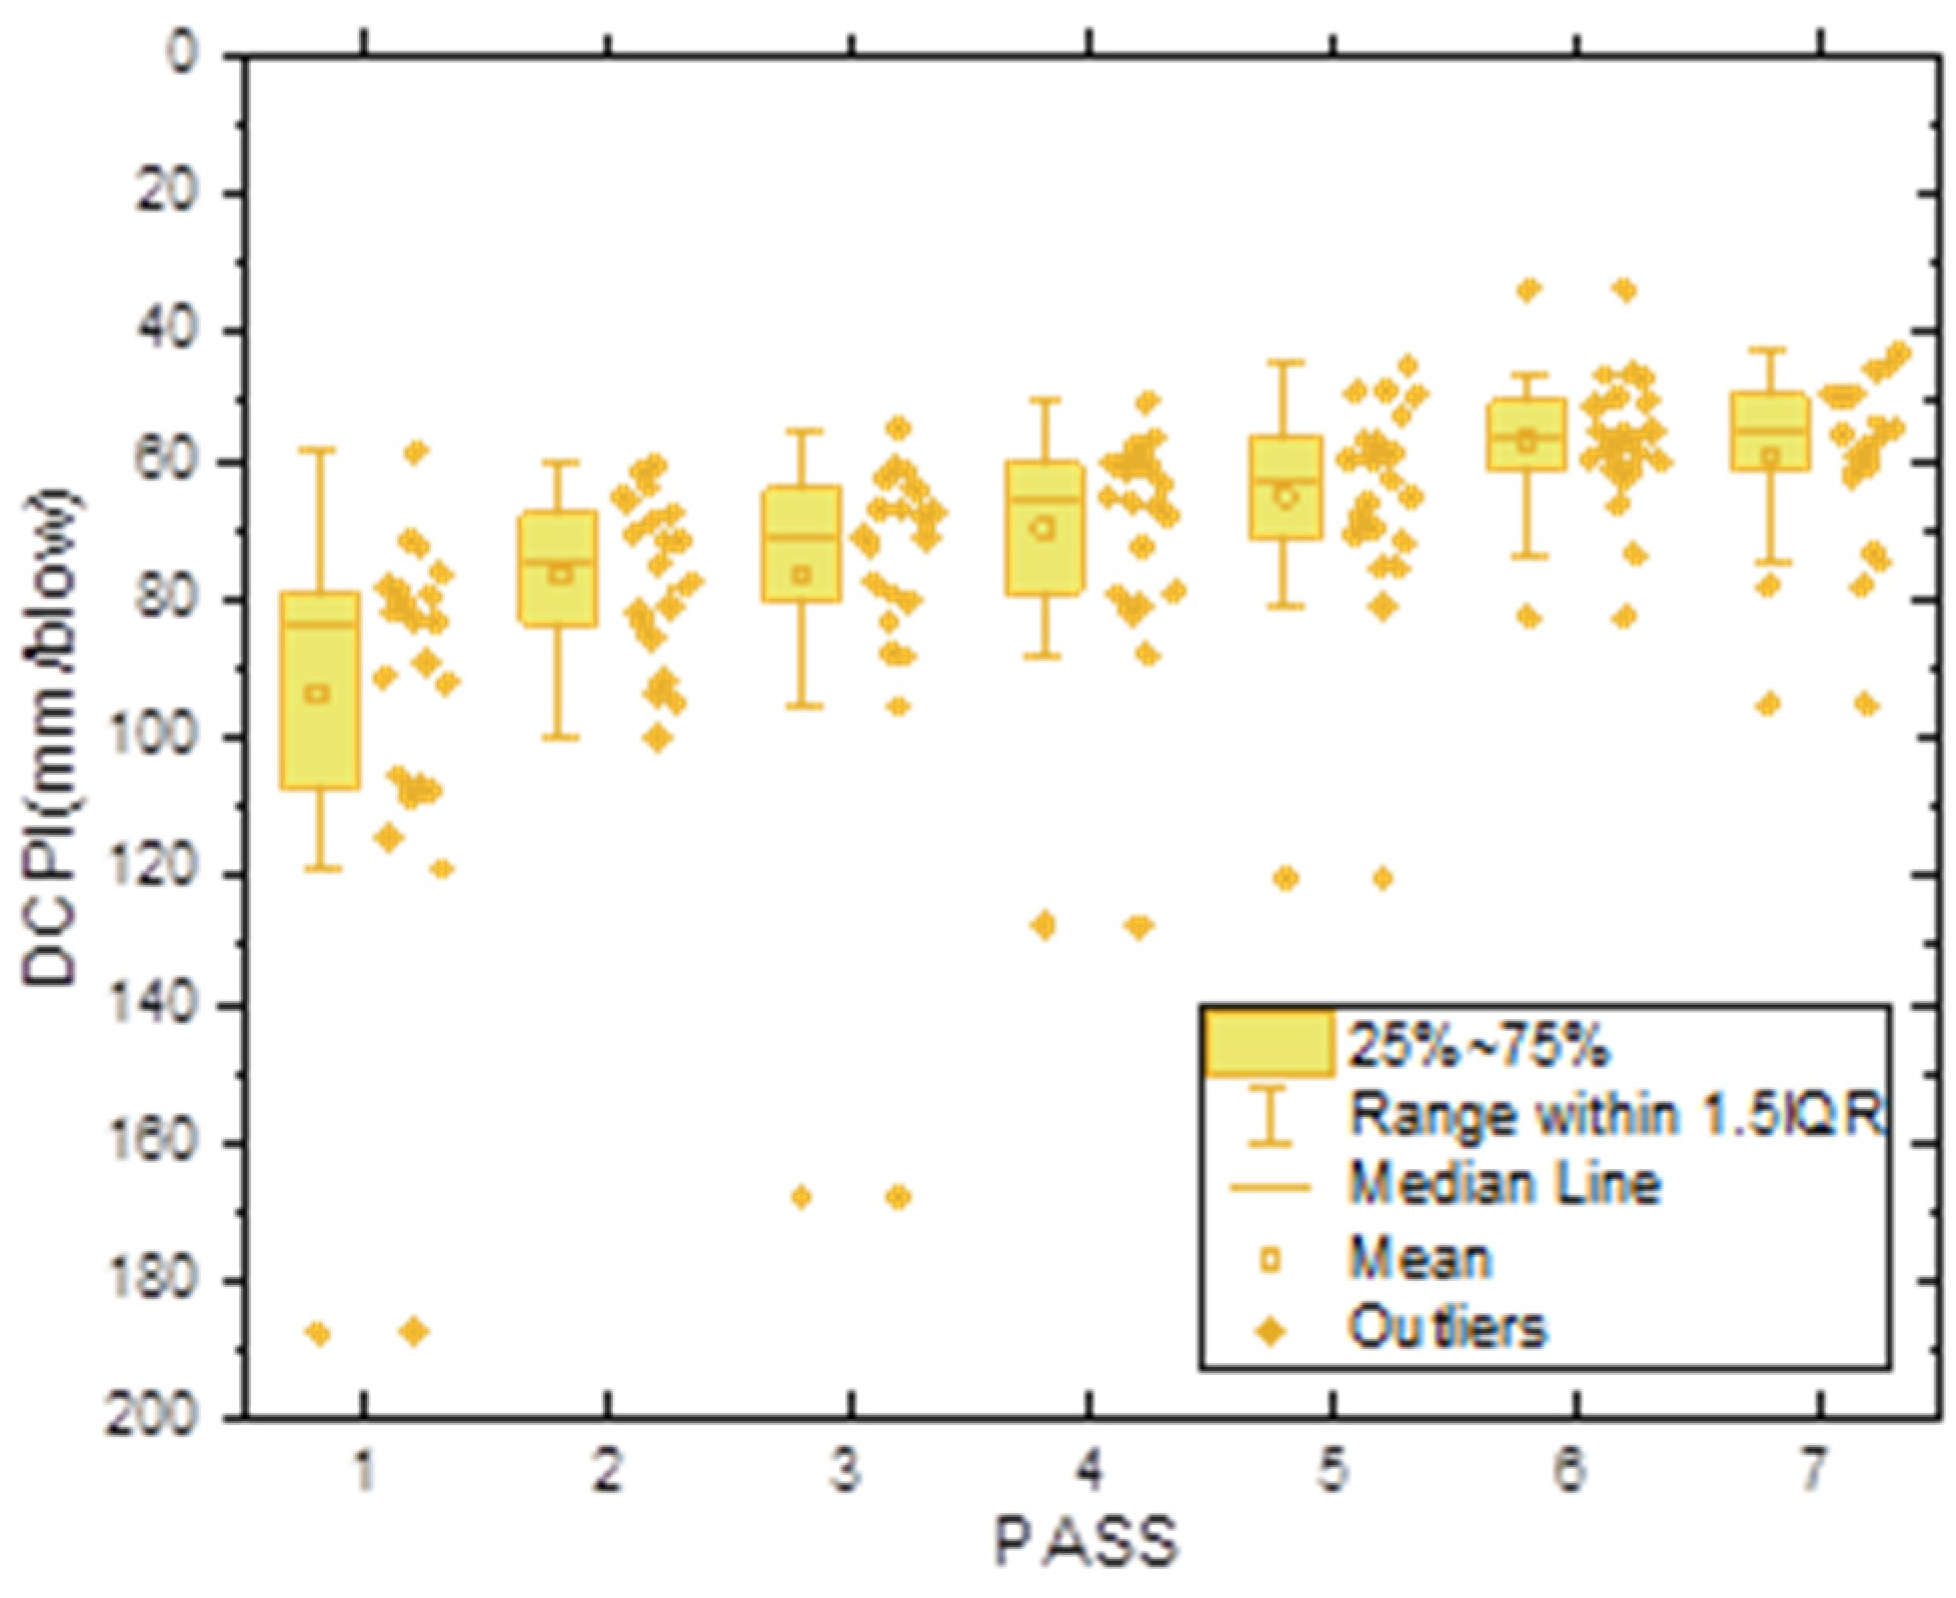
3.3. DCPT
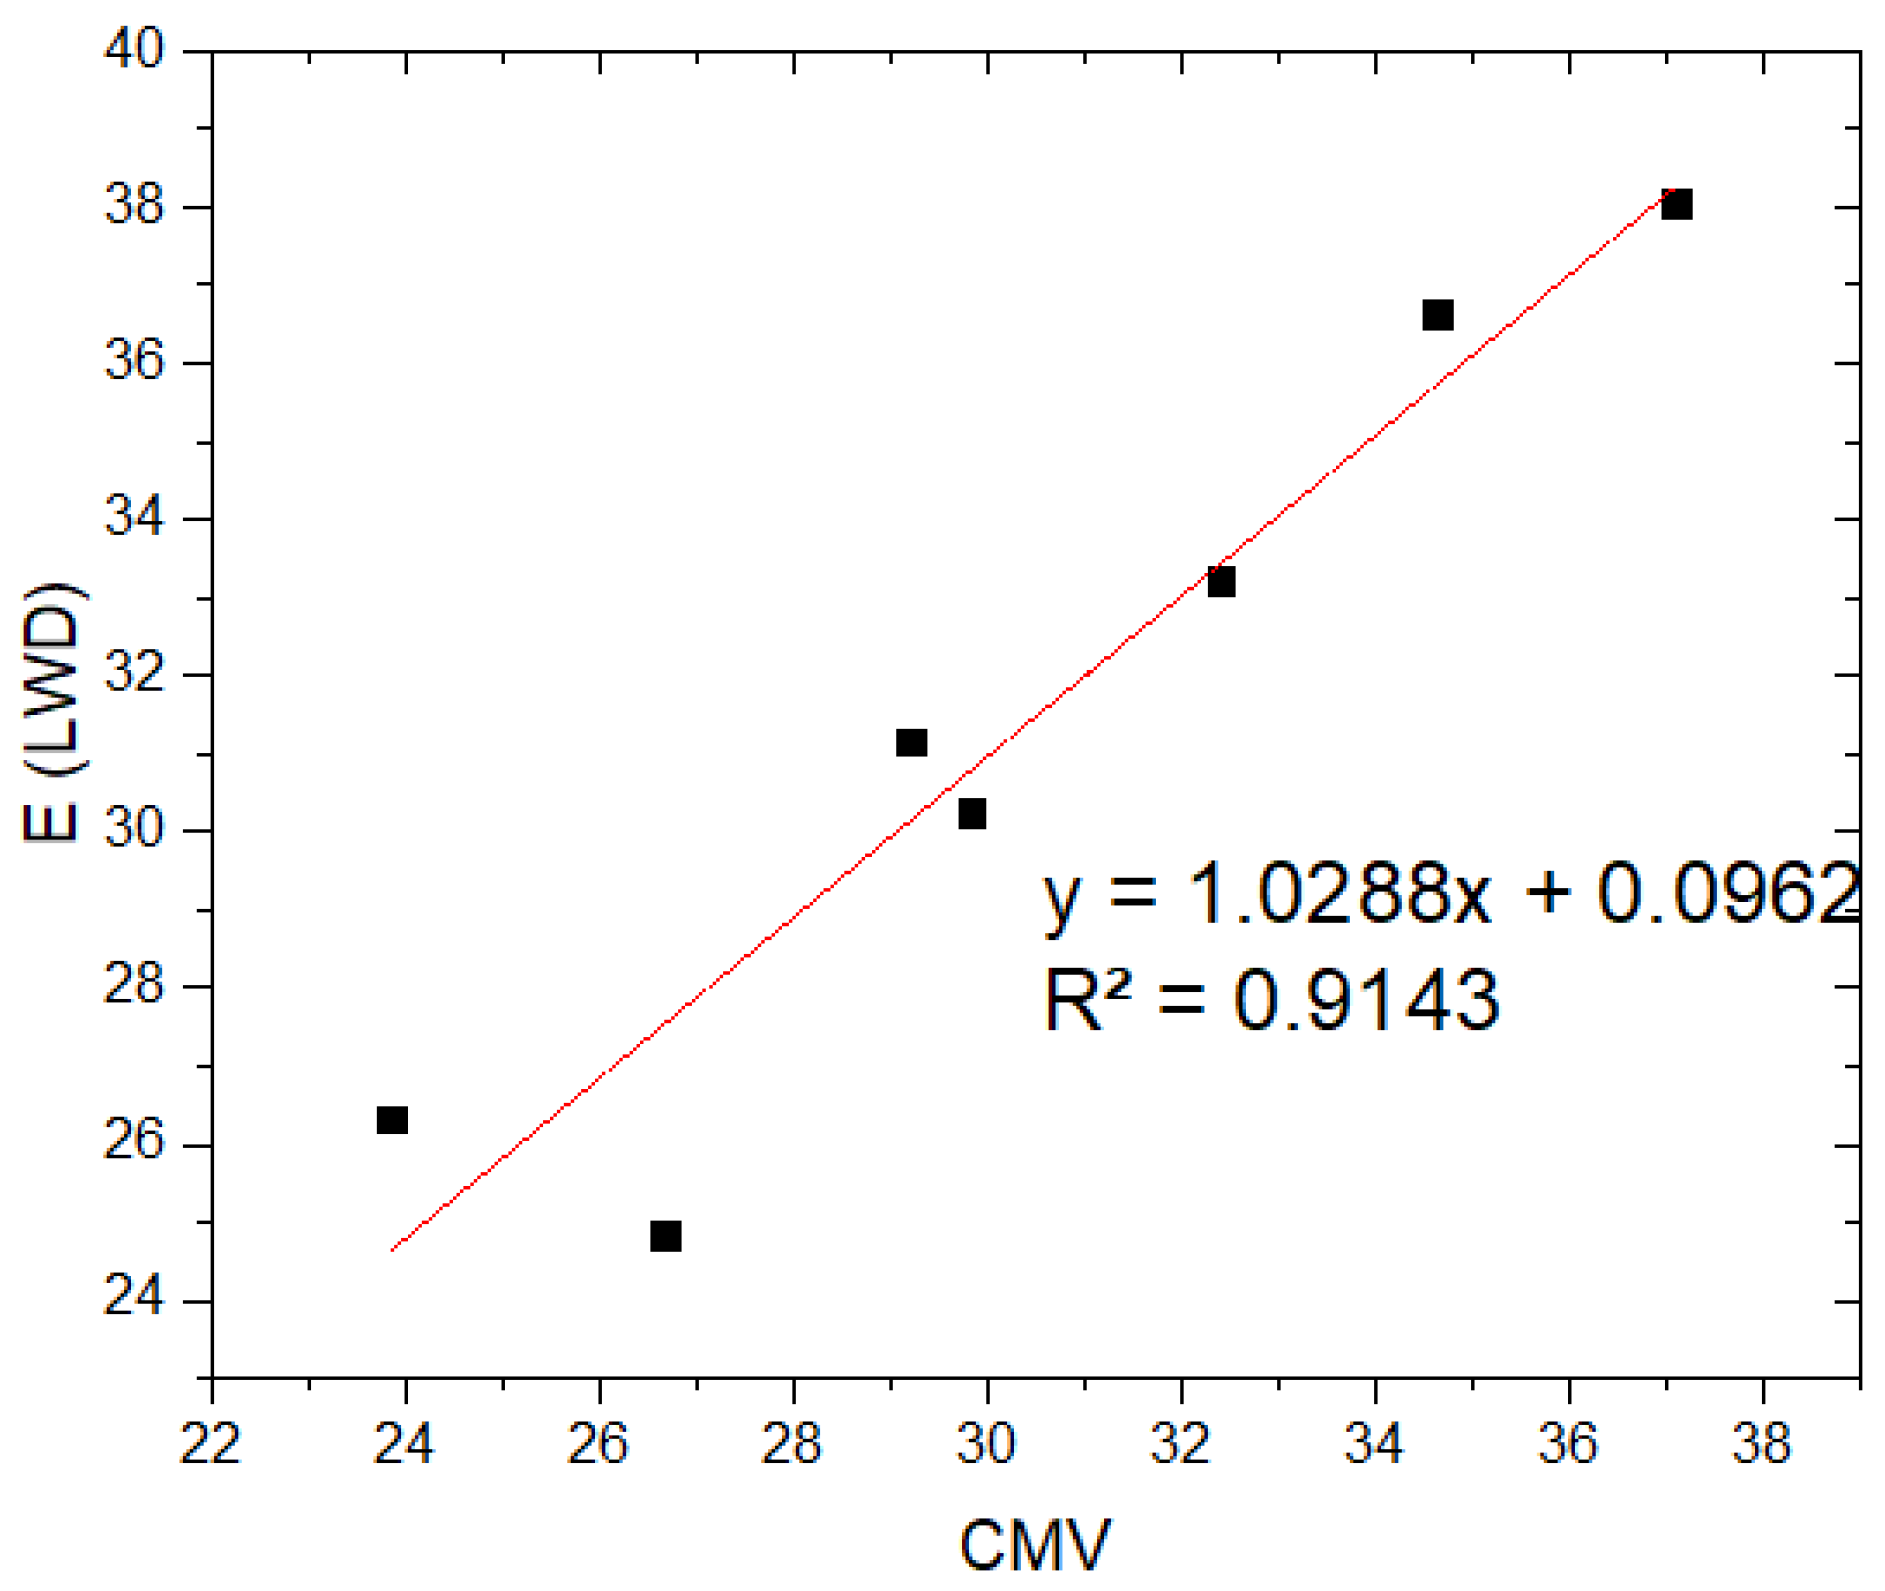
3.4. LFWD
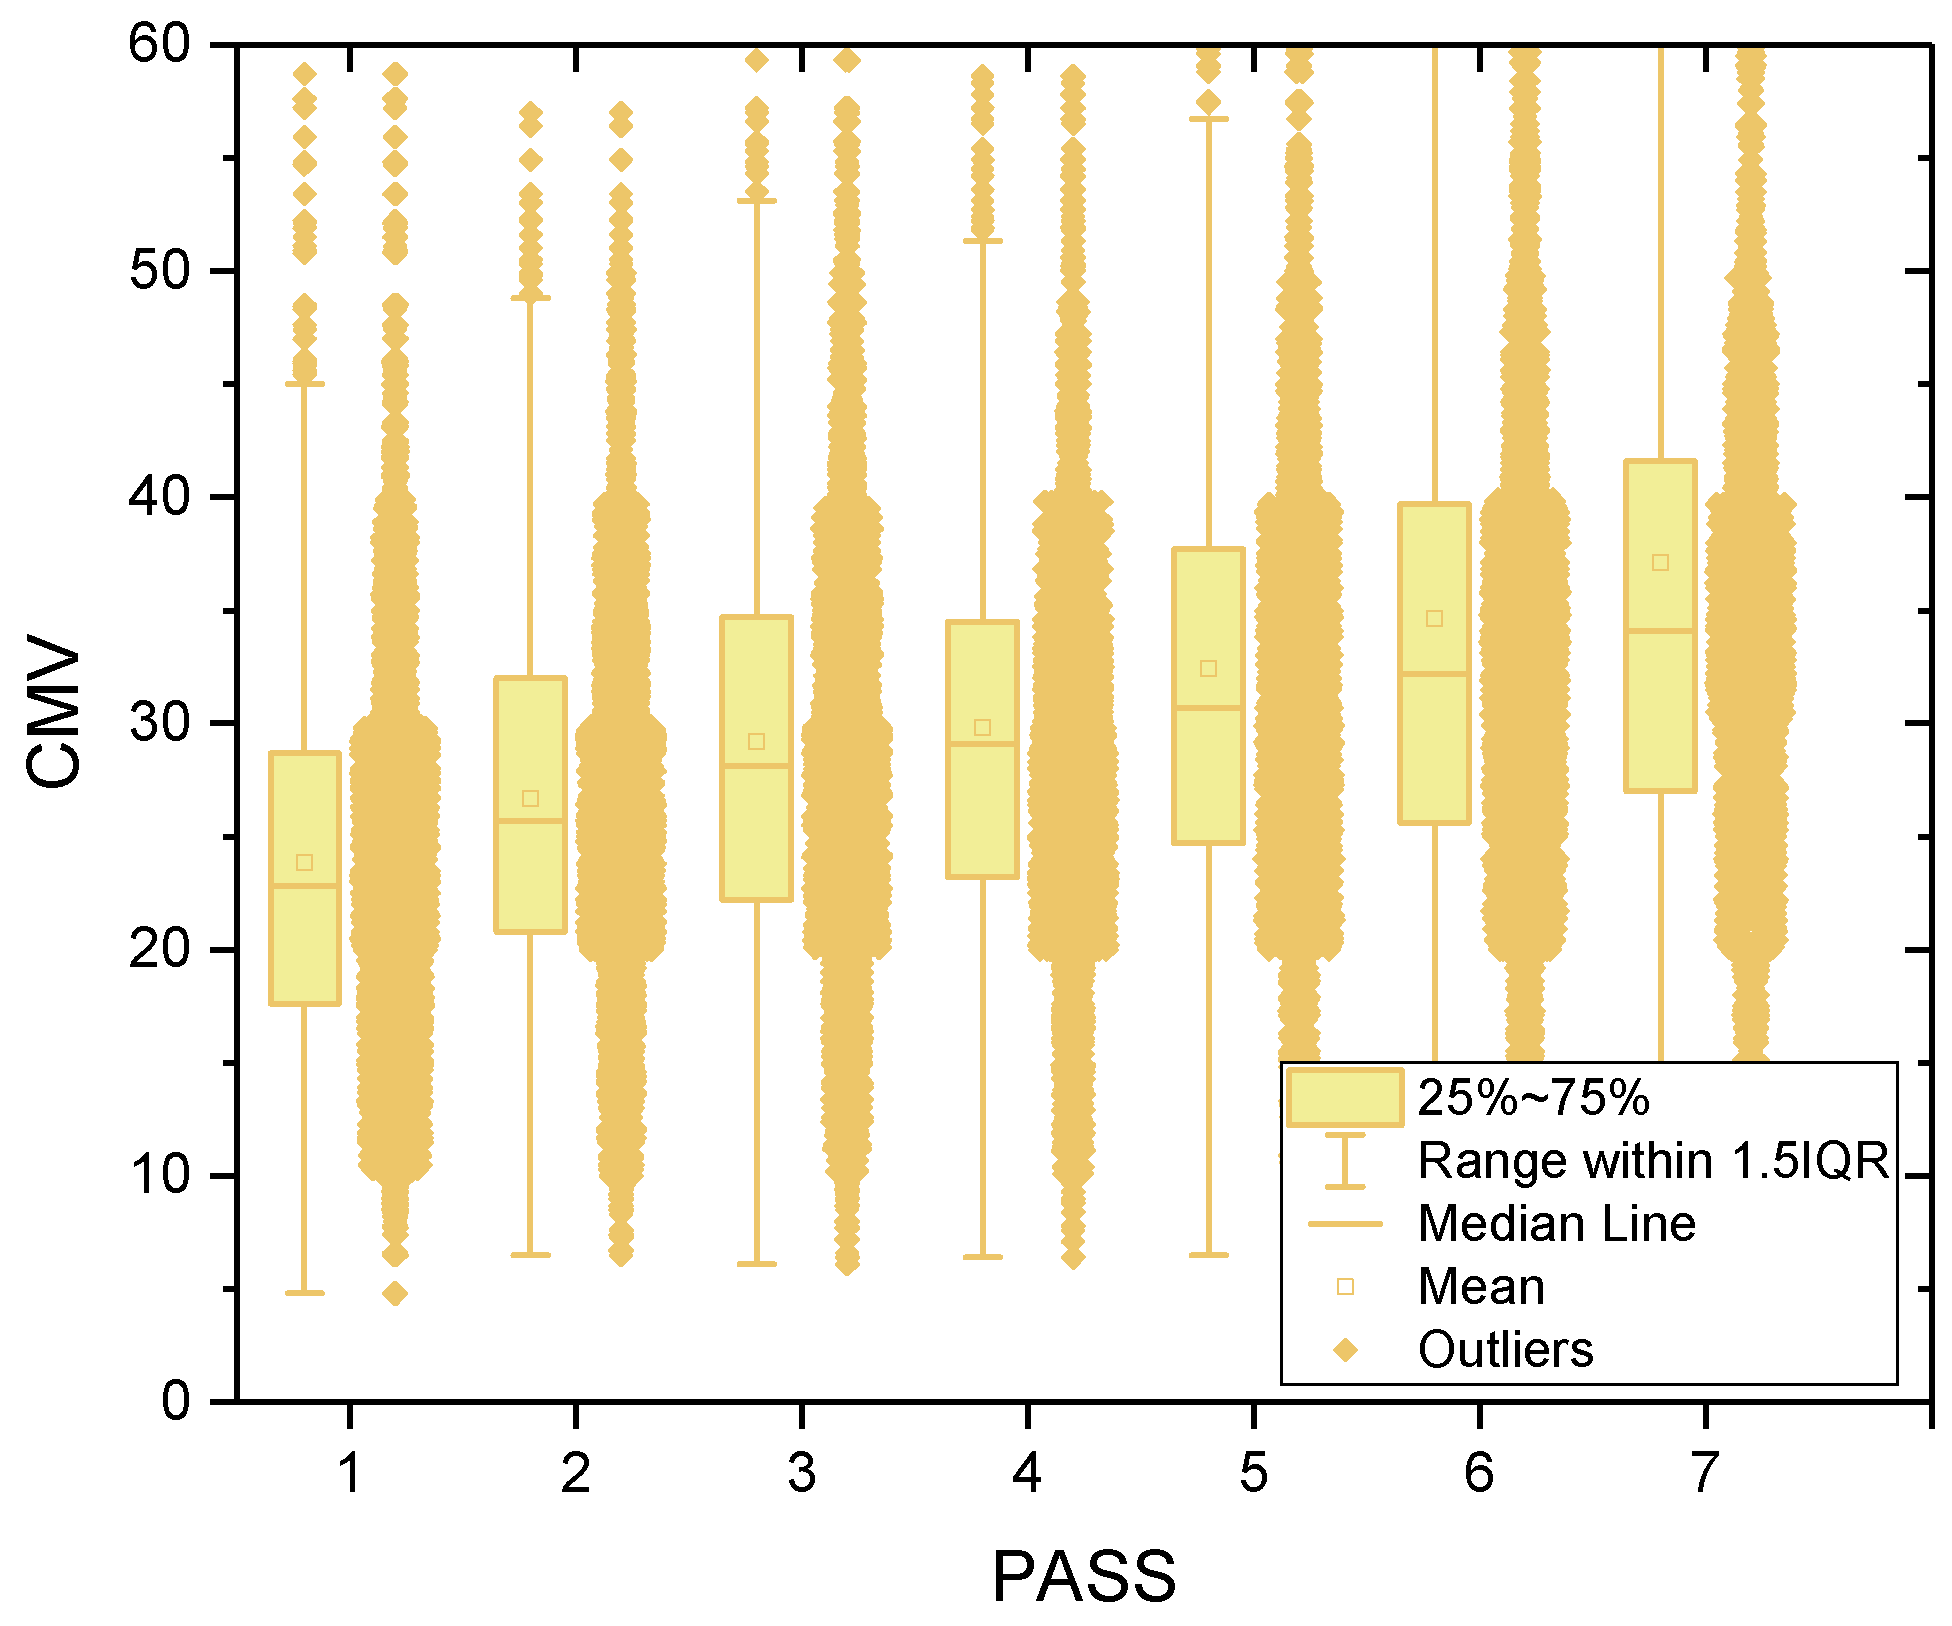
3.5. CMV
3.6. Analysis
4. Methods for Field Application of Intelligent QC System
5. Conclusions
Author Contributions
Funding
Institutional Review Board Statement
Informed Consent Statement
Data Availability Statement
Conflicts of Interest
References
- Cai, H.; Kuczek, T.; Dunston, P.S.; Li, S. Correlating Intelligent Compaction Data to In Situ Soil Compaction Quality Measurements. J. Constr. Eng. Manag. 2017, 143, 04017038. [Google Scholar] [CrossRef]
- Xu, Q.; Chang, G.K. Adaptive quality control and acceptance of pavement material density for intelligent road construction. Autom. Constr. 2016, 62, 78–88. [Google Scholar]
- Mooney, M.A.; Rinehart, R.V.; White, D.J. Intelligent Compaction: Continuous and Real-Time Compaction Control. Transp. Res. Record 2010, 2154, 124–134. [Google Scholar]
- Nazarian, S.; Yuan, D.; Tandon, V. Improving Quality Control of Pavement Subgrade Using Intelligent Compaction. J. Constr. Eng Manag. 2015, 141, 04015032. [Google Scholar]
- Sandstrom, A.; Pettersson, C. Intelligent systems for QA/QC in soil compaction. In Proceedings of the Annual Transportation Research Board Meeting, Transportation Research Board, Washington, DC, USA, 11–15 January 2004; CD-ROM. pp. 1–17. [Google Scholar]
- Anderegg, R.; Kaufmann, K. Intelligent Compaction with Vibratory Rollers. Transp. Res. Rec. 2004, 1868, 124–134. [Google Scholar] [CrossRef]
- Chang, G.; Gallivan, V. Accelerated Implementation of Intelligent Compaction Technology for Embankment Subgrade Soils, Aggregate Base, and Asphalt Pavement Materials; FHWAIF-12-002; Federal Highway Administration: Washington, DC, USA, 2011. [Google Scholar]
- White, D.J.; Thompson, M.J.; Vennapusa, P.; Siekmeier, J. Implementing intelligent compaction specification on Minnesota TH-64: Synopsis of measurement values, data management and geostatistical analysis. Transp. Res. Rec. 2008, 1, 1–9. [Google Scholar] [CrossRef]
- Cacciola, D.V.; Meehan, C.L.; Khosravi, M. An evaluation of specification methodologies for use with continuous compaction control equipment. In Geo-Congress 2013: Stability and Performance of Slopes and Embankments III; ASCE: Reston, VA, USA, 2013; pp. 413–416. [Google Scholar]
- White, D.J.; Vennapusa, P.K.R.; Gieselman, H.H. Field assessment and specification review for roller integrated compaction monitoring technologies. Adv. Civ. Eng. 2011, 15, 783836. [Google Scholar] [CrossRef]
- Park, K.B.; Kim, J.H. Application of the New Degree of Compaction Evaluation Method. J. Korean Geotech. Soc. 2012, 28, 5–14. (In Korean) [Google Scholar]
- BS EN 16907-5; Earthworks Part 5: Quality Control. BSI: London, UK, 2018. Available online: https://knowledge.bsigroup.com/products/earthworks-quality-control/standard (accessed on 12 August 2024).
- KCS 10 70 20; Intelligent Compaction Control System. Korean Standards Association: Seoul, Republic of Korea, 2023. (In Korean)
- ASTM D1195; Standard Test Method for Repetitive Static Plate Load Tests of Soils and Flexible Pavement Components. ASTM International: West Conshohocken, PA, USA, 2021.
- ASTM D1196–93; Standard Test Method for Nonrepetitive Static Plate Load Tests on Soils and Flexible Pavement Components. ASTM International: West Conshohocken, PA, USA, 1997.
- ASTM D1556; Standard Test Method for Density and Unit Weight of Soil in Place by Sand-Cone Method. ASTM International: West Conshohocken, PA, USA, 2024.
- ASTM D6951-03; Standard Test Method for Use of the Dynamic Cone Penetrometer in Shallow Pavement Applications. ASTM International: West Conshohocken, PA, USA, 2003.
- ASTM E2583-07; Standard Test Method for Measuring Deflections with a Light Weight Deflectometer (LWD). ASTM International: West Conshohocken, PA, USA, 2007.
- Shahid, M.A.; Thom, N.H.; Fleming, P.R. In-situ assessment of road foundations. Highw. Transp. 1997, 44, 15–17. [Google Scholar]
- Fleming, P.R.; Frost, M.W.; Rogers, C.A. A comparison of devices for measuring stiffness in-situ. In Unbound Aggregates in Road Construction: Proceedings of the Fifth International Symposium on Unbound Aggregates in Roads, UNBAR 5, Nottingham, UK, 21–23 June 2000; Dawson, A.R., Ed.; Taylor & Francis: Abingdon, UK, 2008; pp. 193–200. [Google Scholar]
- Livneh, M.; Goldberg, Y. Quality Assessment during Road Formation and Foundation Construction Use of Falling-Weight Deflectometer and Light Drop Weight. Transp. Res. Record 2001, 1755, 69–77. [Google Scholar] [CrossRef]
- Nazzal, M.; Abu-Farsakh, M.; Alshibli, K.; Mohammad, L. Evaluating the Potential Use of a Portable LFWD for Characterizing Pavement Layers and Subgrades. In Geotechnical Engineering for Transportation Projects: Proceedings of Geo-Trans 2004, Los Angeles, CA, USA, 27–31 July 2004; ASCE: Reston, VA, USA, 2004; pp. 915–924. [Google Scholar]
- Mooney, M.; Adam, D. Vibratory roller integrated measurement of earthwork compaction: An overview. In Proceedings of the 7th FMGM 2007: Field Measurements in Geomechanics, Boston, MA, USA, 24–27 September 2007; pp. 1–12. [Google Scholar]
- White, D.J.; Thompson, M.; Vennapusa, P.K.R. Evaluation of Intelligent Compaction for Pavement Construction. In Proceedings of the Transportation Research Board Annual Meeting, Washington, DC, USA, 11–15 January 2009. Paper #09-2034. [Google Scholar]
- Forssblad, L. Compaction meter on vibrating rollers for improved compaction control. In Proceedings of the International Conference on Compaction, Paris, France, 22–24 April 1980; Volume 2, pp. 541–546. [Google Scholar]
- Thurner, H.; Sandstrom, A. A New Device for Instant Compaction Control. In Proceedings of the International Conference on Compaction, Paris, France, 22–24 April 1980; Association Amicale de Ingenieus: Paris, France, 1980; Volume II, pp. 611–614. [Google Scholar]
- Mooney, M.A.; Rinegart, R.V.; Facas, N.W.; Musimbi, O.M.; White, D.J.; Vennapusa, P.K.R. Intelligent Soil Compaction Systems; Transportation Research Board of the National Academies: Washington, DC, USA, 2010. [Google Scholar]
- KS F 2312; Test Method for Soil Compaction Using a Rammer. Korean Standards Association: Seoul, Republic of Korea, 2001. (In Korean)


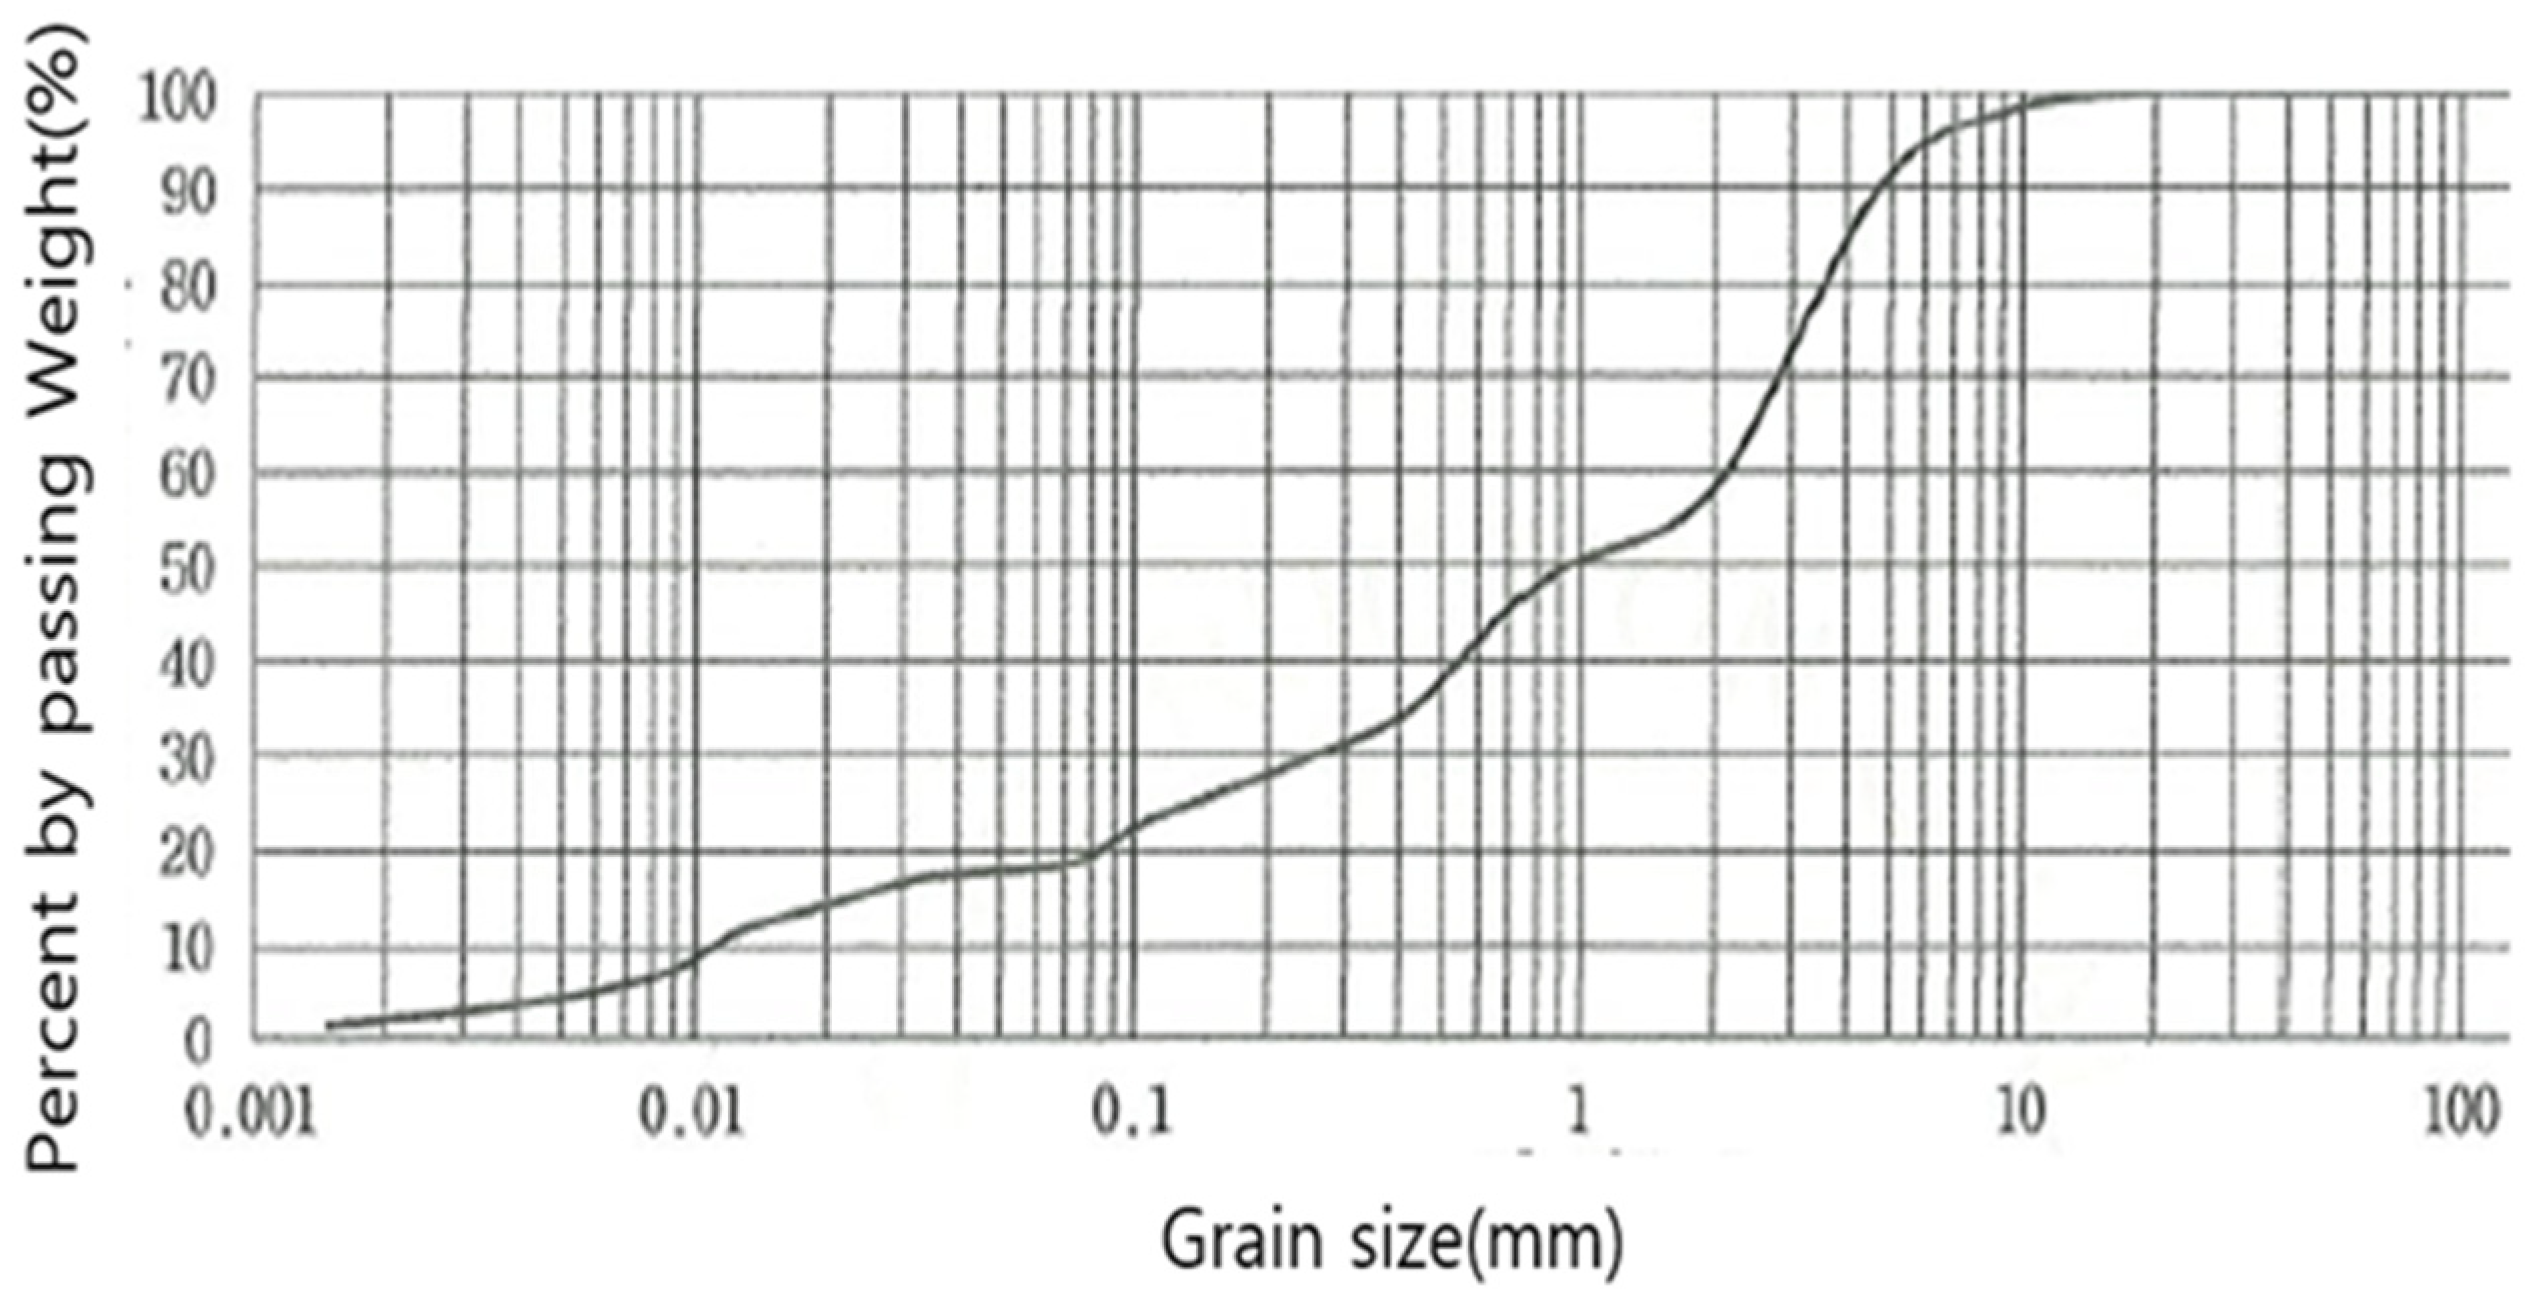
| USCS | PI | Gs | Gravel (%) | Sand (%) | Silt (%) | Clay (%) | γdmax (t/m3) | ωopt (%) |
|---|---|---|---|---|---|---|---|---|
| SP-SM | N.P | 2.65 | 9.8 | 71.4 | 13.4 | 4.5 | 1.93 | 9.9 |
| Average Settlement | Load Strength (kN/m2) | Bearing Capacity Factor (K30) | Number of Compactions (Round Trips) |
|---|---|---|---|
| 2.5 mm standard for AP pavement (subgrade) | 185 | 74 | 2 |
| 223 | 89 | 4 | |
| 245 | 98 | 6 | |
| 480 | 192 | 7 |
| Correlation | |||||
|---|---|---|---|---|---|
| CMV | DPI | E | PLT | ||
| CMV | Pearson correlation | 1 | −0.977 ** | 0.956 ** | 0.829 |
| Significance probability (two-tailed) | 0.000 | 0.001 | 0.171 | ||
| N | 7 | 7 | 7 | 4 | |
| DPI | Pearson correlation | −0.977 ** | 1 | −0.895 ** | −0.749 |
| Significance probability (two-tailed) | 0.000 | 0.006 | 0.251 | ||
| N | 7 | 7 | 7 | 4 | |
| E | Pearson correlation | 0.956 ** | −0.895** | 1 | 0.746 |
| Significance probability (two-tailed) | 0.001 | 0.006 | 0.254 | ||
| N | 7 | 7 | 7 | 4 | |
| PLT | Pearson correlation | 0.829 | −0.749 | 0.746 | 1 |
| Significance probability (two-tailed) | 0.171 | 0.251 | 0.254 | ||
| N | 4 | 4 | 4 | 4 | |
| Stage | Number of Compactions | IC Value | PLT | Quality Check |
|---|---|---|---|---|
| Current | - | - | Performed | Number of Compactions + PLT (Random Location) |
| Stage 1 | Automatically Recorded | Selectively Recorded | Performed | Number of Compactions + PLT (Random Location) |
| Stage 2 | Automatically Recorded | Automatically Recorded | Performed | Number of Compactions + PLT (Location with Lowest IC Value) |
| Stage 3 | Automatically Recorded | Automatically Recorded | Performed | Number of Compactions + PLT |
| Stage 4 | Automatically Recorded | Automatically Recorded | Performed | IC Value |
Disclaimer/Publisher’s Note: The statements, opinions and data contained in all publications are solely those of the individual author(s) and contributor(s) and not of MDPI and/or the editor(s). MDPI and/or the editor(s) disclaim responsibility for any injury to people or property resulting from any ideas, methods, instructions or products referred to in the content. |
© 2024 by the authors. Licensee MDPI, Basel, Switzerland. This article is an open access article distributed under the terms and conditions of the Creative Commons Attribution (CC BY) license (https://creativecommons.org/licenses/by/4.0/).
Share and Cite
Kim, J.-Y.; Cho, J.-w.; Lee, S.-Y. Field Evaluation and Application of Intelligent Quality Control Systems. Appl. Sci. 2024, 14, 7142. https://doi.org/10.3390/app14167142
Kim J-Y, Cho J-w, Lee S-Y. Field Evaluation and Application of Intelligent Quality Control Systems. Applied Sciences. 2024; 14(16):7142. https://doi.org/10.3390/app14167142
Chicago/Turabian StyleKim, Jin-Young, Jin-woo Cho, and Sung-Yeol Lee. 2024. "Field Evaluation and Application of Intelligent Quality Control Systems" Applied Sciences 14, no. 16: 7142. https://doi.org/10.3390/app14167142
APA StyleKim, J.-Y., Cho, J.-w., & Lee, S.-Y. (2024). Field Evaluation and Application of Intelligent Quality Control Systems. Applied Sciences, 14(16), 7142. https://doi.org/10.3390/app14167142