Article

An Investigation into the Effects of Primary School Building Forms on Campus Wind Environment and Classroom Ventilation Performance

1
School of Architecture and Urban Planning, Qingdao University of Technology, No.11 Fushun Road, Qingdao 266033, China
2
Department of Architecture and Built Environment, Nottingham University Ningbo China, 199 East Taikang Road, Ningbo 315100, China
*
Author to whom correspondence should be addressed.
Appl. Sci. 2024, 14(16), 7174; https://doi.org/10.3390/app14167174
Submission received: 11 July 2024 / Revised: 12 August 2024 / Accepted: 12 August 2024 / Published: 15 August 2024
(This article belongs to the Special Issue Advances in Fluid Dynamics and Building Ventilation)

Abstract

:
This study examines how different primary school campus layouts impact the wind environment and classroom ventilation in Xi’an, using simulations for winter and summer conditions. It evaluates four typical floorplans to find the best for outdoor wind quality and classroom ventilation. During winter, the outdoor wind speed at a height of 1.5 m remains below 5 m/s, adhering to the Green Building Evaluation Standard (GB/T50378-2019). Notably, Scenario 1 achieves higher wind speeds due to the canyon effect between buildings, facilitating effective air renewal. The wind speed amplification factors in all scenarios are within the permissible limit of 2, while Scenario 1 demonstrates superior outdoor wind performance. Wind pressure differences on building surfaces remain within the 5 Pa limit, with Scenario 3 exhibiting the lowest difference of 0.74 Pa, contributing to energy-efficient heating. In summer, Scenario 1 uniquely avoids vortex areas and windless zones, ensuring efficient airflow across the campus. Its open floor planning prevents the formation of stagnant air zones, in contrast to Scenarios 2, 3, and 4, which create enclosed or semi-enclosed spaces promoting vortex formation and windless areas. These findings underscore the benefits of Scenario 1’s design in optimizing both winter and summer wind environments for energy efficiency and occupant comfort. This study recommends including adequately sized spaces in zigzag, branched, or enclosed floor plans to provide airflow and prevent high wind speeds. These results are crucial for shaping upcoming architectural plans to improve the environmental quality of school grounds, leading to improved health and comfort for students and teachers.

1. Introduction

In the early 20th century, the Chinese government introduced the idea of “green campuses” for educational buildings. This concept focuses on meeting usage needs while emphasizing the significance of creating indoor and outdoor environments that use less energy and offer a better quality of life for teachers and students [1]. In 2013 and 2019, the Chinese government implemented and revised the “Green Campus Evaluation Standard” (GB/T51356-2019) [2], signaling a new stage in the advancement of green campuses in China. The green campus idea emphasizes the need to create pleasant outside wind environments and ensure proper indoor ventilation in buildings [3,4,5]. Recent studies indicate that the interior and outdoor wind environments on campus have a substantial effect on students’ well-being, physical health, and academic performance [6,7]. Extremely low wind speeds can impede air circulation, leading to a decline in interior air quality. Inadequate interior air quality can result in “sick building syndrome” [8]. Thus, optimizing the indoor and outdoor wind environments by architectural design can boost ventilation effectiveness and notably enhance indoor air quality [9].
The outdoor wind environment and indoor ventilation performance of buildings are closely related to the layout of teaching buildings on campus and their architectural forms [10,11]. Several studies have investigated the relationship between outdoor wind conditions and building ventilation performance by focusing on architectural design. Blocken et al. [12] performed a quantitative study on how architectural layout, building spacing, and building height influence wind speed on a campus. They discovered that building spacing and height directly impact the campus’s wind environment when the layout remains the same. Awol et al. [13] discovered that varying building orientations and densities result in distinct wind environment features around buildings. Yang et al. [5] analyzed the wind conditions on a university campus and the airflow efficiency of individual buildings based on various length-to-width ratios. They identified the optimal wind direction for outdoor airflow and the most effective building shape for ventilation. Hunter et al. [14] discovered that disrupted airflow creates vortices behind buildings, impacting the distribution of wind pressure on the building surface. Kubota et al. [15] researched how campus building density affects the campus wind environment. They discovered that the campus building density and average wind speed on campus were negatively related, meaning that as building density increased, wind speed decreased. Mittal et al. [16] discovered that selecting an appropriate building orientation can enhance the wind conditions on campus. The research has shown that the layout, density, and orientation of buildings on campus have a notable influence on campus wind conditions.
Simultaneously, additional research has investigated how the layout of campus buildings affects interior ventilation efficiency. Driss et al. [17] and Ghaffarianhoseini et al. [18] studied how different campus building layouts affect interior natural ventilation effectiveness. They discovered that enclosed spaces can improve the capacity for natural ventilation in buildings. Passe and Battaglia [19] argue that the building shape is the primary factor in achieving efficient natural ventilation. Smith [20] contends that boosting indoor air quality can be achieved by optimizing the building form to improve interior airflow velocity and encourage the renewal of indoor air. Xie et al. [21] suggest that the enclosed arrangement of campus buildings can decrease the need for heating during winter and enhance opportunities for natural ventilation in summer. Conversely, the alignment layout of campus buildings tends to increase winter heating demand and reduce the natural ventilation potential of buildings in the summer.
Similar investigations have been undertaken in China as well. Wang et al. [22] discovered that in big campus areas, enclosed layouts are recommended, but at large teaching building scales, zigzag building plans are preferable. Gan et al. [23] found that the symmetrical layout of campus buildings efficiently obstructs the northwest wind in cold parts of China, consequently decreasing the wind velocity within the campus during winter. However, during summer, this symmetrical layout is not ideal for promoting effective natural ventilation indoors in colder areas. In Hong Kong, Niu et al. [24] discovered that increased campus building density correlates with decreased wind speed on the site, impacting the inside ventilation of buildings and reducing thermal comfort. Xu et al. [25] and Liu et al. [26] suggest that in an enclosed plan for campus buildings, openings should face the direction of the summer wind to allow the summer breeze to flow into the enclosed space, improving the air exchange rate within.
Primary school buildings in China display specific layouts and architectural designs. The design of primary school buildings follows the national standard “Code for Design of Primary and Secondary Schools” (GB50099-2011) [27], leading to similarities in building orientation, height, number of stories, and classroom size within the same climatic zone [28,29]. In cold regions, primary school buildings typically orient towards the south, are limited to four floors, and can hold a maximum of 45 children per classroom. These guidelines enhance consistency in the layout and design of primary school buildings. Presently, numerous studies categorize the arrangement of campus buildings in China as enclosed (the left one in Figure 1), row-by-row (the middle one in Figure 1), and branching (the right one in Figure 1) [30,31,32]. This trait is most noticeable in elementary school campuses. The red circle in Figure 1 indicates the educational part of the campus buildings. Regardless of the plan adopted, the prototype of the teaching buildings remains consistent.
When it comes to the internal layout of buildings, the teaching buildings in primary schools generally adopt an exterior corridor design (Figure 2), with the corridor located on the north side and the classrooms on the south side [33]. This architectural floor design is currently being used as a pattern by numerous researchers in China for their research [34,35,36]. This is mainly because the “Code for Design of Primary and Secondary Schools” (GB50099-2011) requires that classrooms must be able to receive direct sunlight [27]. Consequently, examining the architectural floor plans and campus layouts of primary school buildings will yield more broadly applicable research findings for the design of primary school buildings.
China assesses the wind environment on campus and classroom ventilation based on the “Green Campus Evaluation Standard” (GB/T51356-2019) [2] and the “Green Building Evaluation Standard” (GB/T50378-2019) [37]. Both criteria mandate that during winter, the wind speed at a height of 1.5 m above the ground in pedestrian areas on campus must not exceed 5 m/s, and should not surpass 2 m/s in activity areas. Furthermore, the wind pressure difference between the windward and leeward surfaces of buildings, excluding the first row facing the wind, should not surpass 5 Pa. During summer, the regulations require that there are no windless spots (wind speed 0.2 m/s) in activity areas on campus, and over 50% of the building’s external windows should have an indoor–outdoor wind pressure differential exceeding 0.5 Pa.
The “Design Code for Primary and Secondary Schools” (GB50099-2011) [27] assesses the internal ventilation of buildings based on the air exchange rate. The air exchange rate in primary school classrooms must be at least 2.5 times each hour. Furthermore, indoor air velocity and air age are alternative indications that can be utilized as assessment criteria for classroom ventilation [38]. Air age is the duration it takes for fresh air to enter a building and reach a designated point indoors. Air age and air exchange rate are interchangeable. Typically, lower indoor air age and a higher air exchange rate lead to improved indoor air quality. Indoor air velocity, in addition to air age, is another factor used to assess indoor wind conditions. The indoor wind speed must be kept constant. A high interior wind speed can make people uncomfortable, while a low wind speed can reduce the air exchange rate and lower indoor air quality. Indoor occupants will experience comfort when the indoor air velocity ranges from 0.25 to 0.5 m/s, as indicated by current studies [39]. Air speeds of 0.5 to 1 m/s are regarded as acceptable. However, when the wind speed exceeds 1 m/s, people are likely to feel a noticeable blowing feeling, which may cause discomfort [40]. Moreover, as indoor temperatures rise, people tend to prefer higher indoor air speeds [41,42,43]. Once the temperature is beyond a specific threshold, increasing the interior air velocity will not enhance occupant comfort.
Early research predominantly focused on outdoor wind environments without linking them to indoor ventilation, neglecting their interconnectedness. Recent studies have shifted to examining the impact of outdoor wind conditions on indoor ventilation in educational buildings, particularly universities. However, these studies tend to be case-specific, failing to generalize their findings to a broader range of building types. While acknowledging the importance of architectural layouts, building forms, and orientations in shaping campus wind environments and indoor ventilation, existing research primarily revolves around universities, overlooking primary school campuses. The studies, which often utilize software simulations, confirm the feasibility of analyzing these interactions but leave a gap in our understanding of primary school settings. Consequently, this paper centers its attention on primary school campuses, examining the influence of various building layouts and floor plans on the campus’s wind environment and classroom ventilation. Through a comprehensive analysis of existing primary school building layouts and the pertinent design specifications for their floorplans in China, four typical floor plans have been distilled and utilized to assess the effects of different building layouts and floorplans on outdoor wind conditions and indoor ventilation performance. The goal is to offer recommendations for future primary school architectural design and campus planning.

2. Research Methods

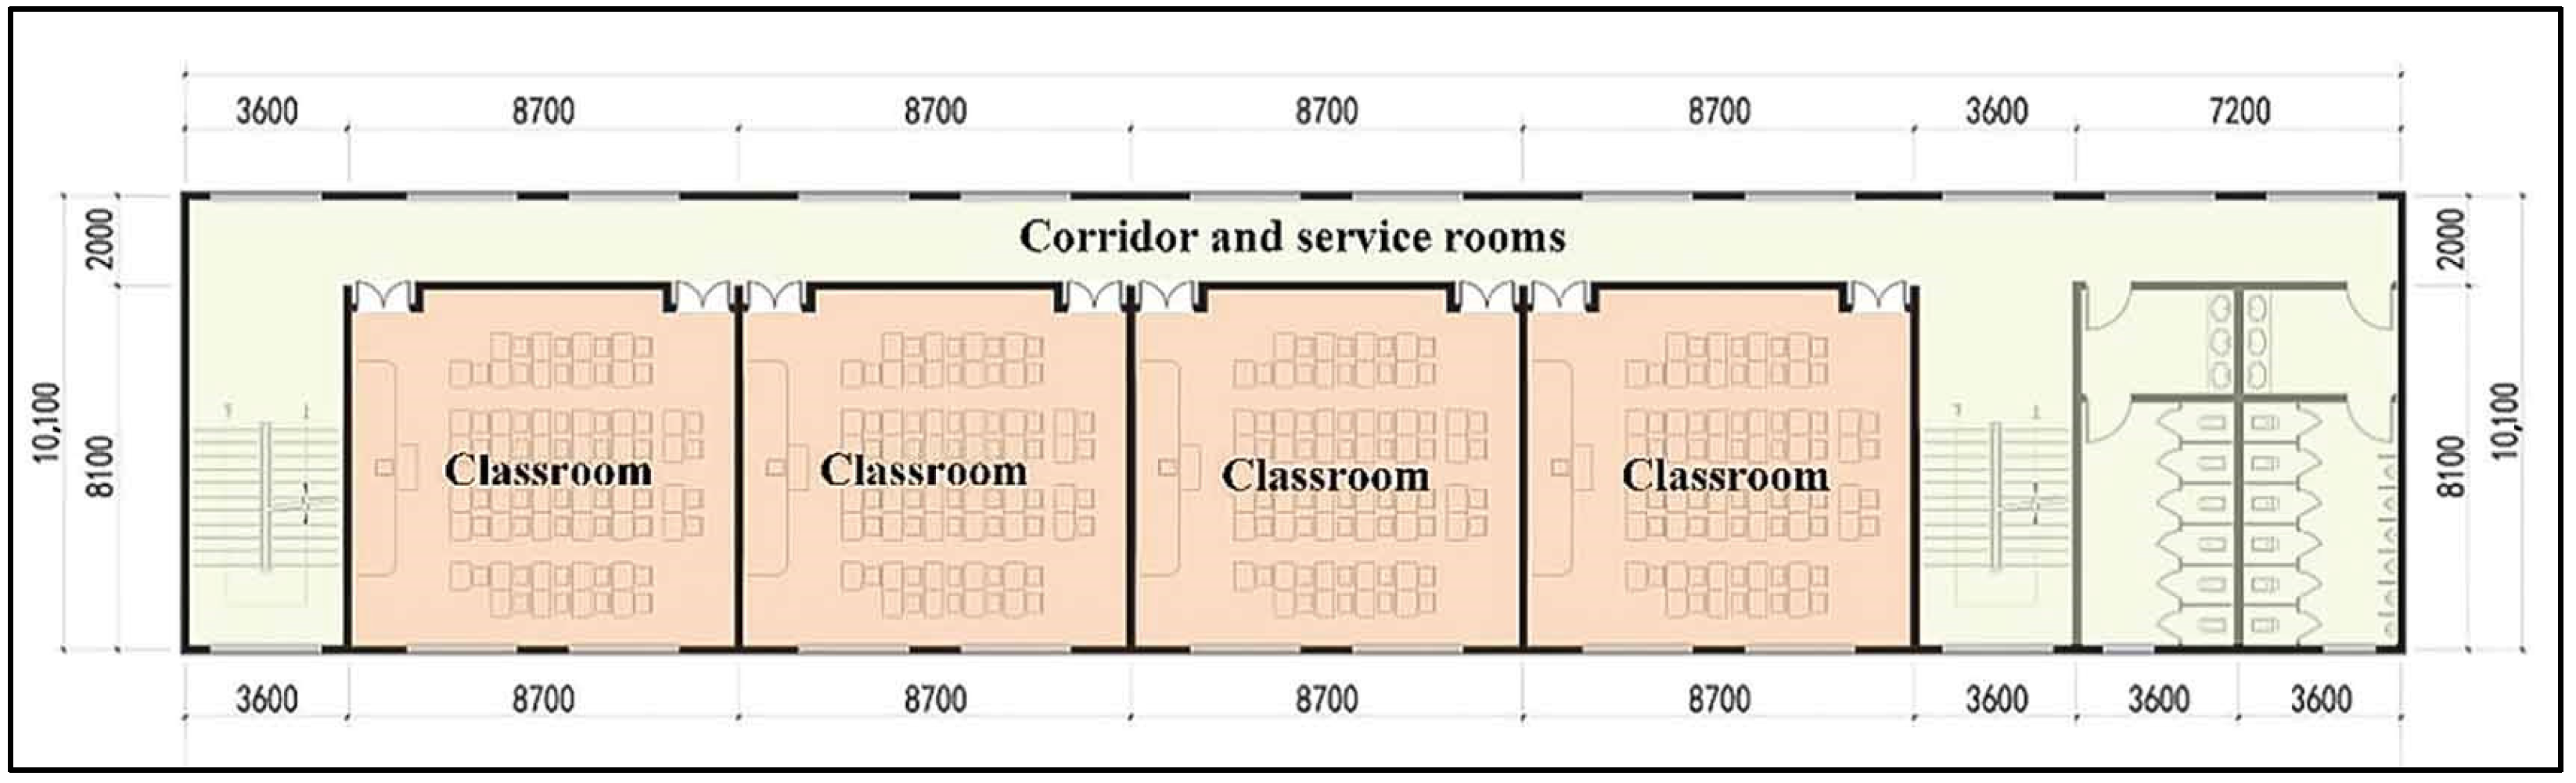
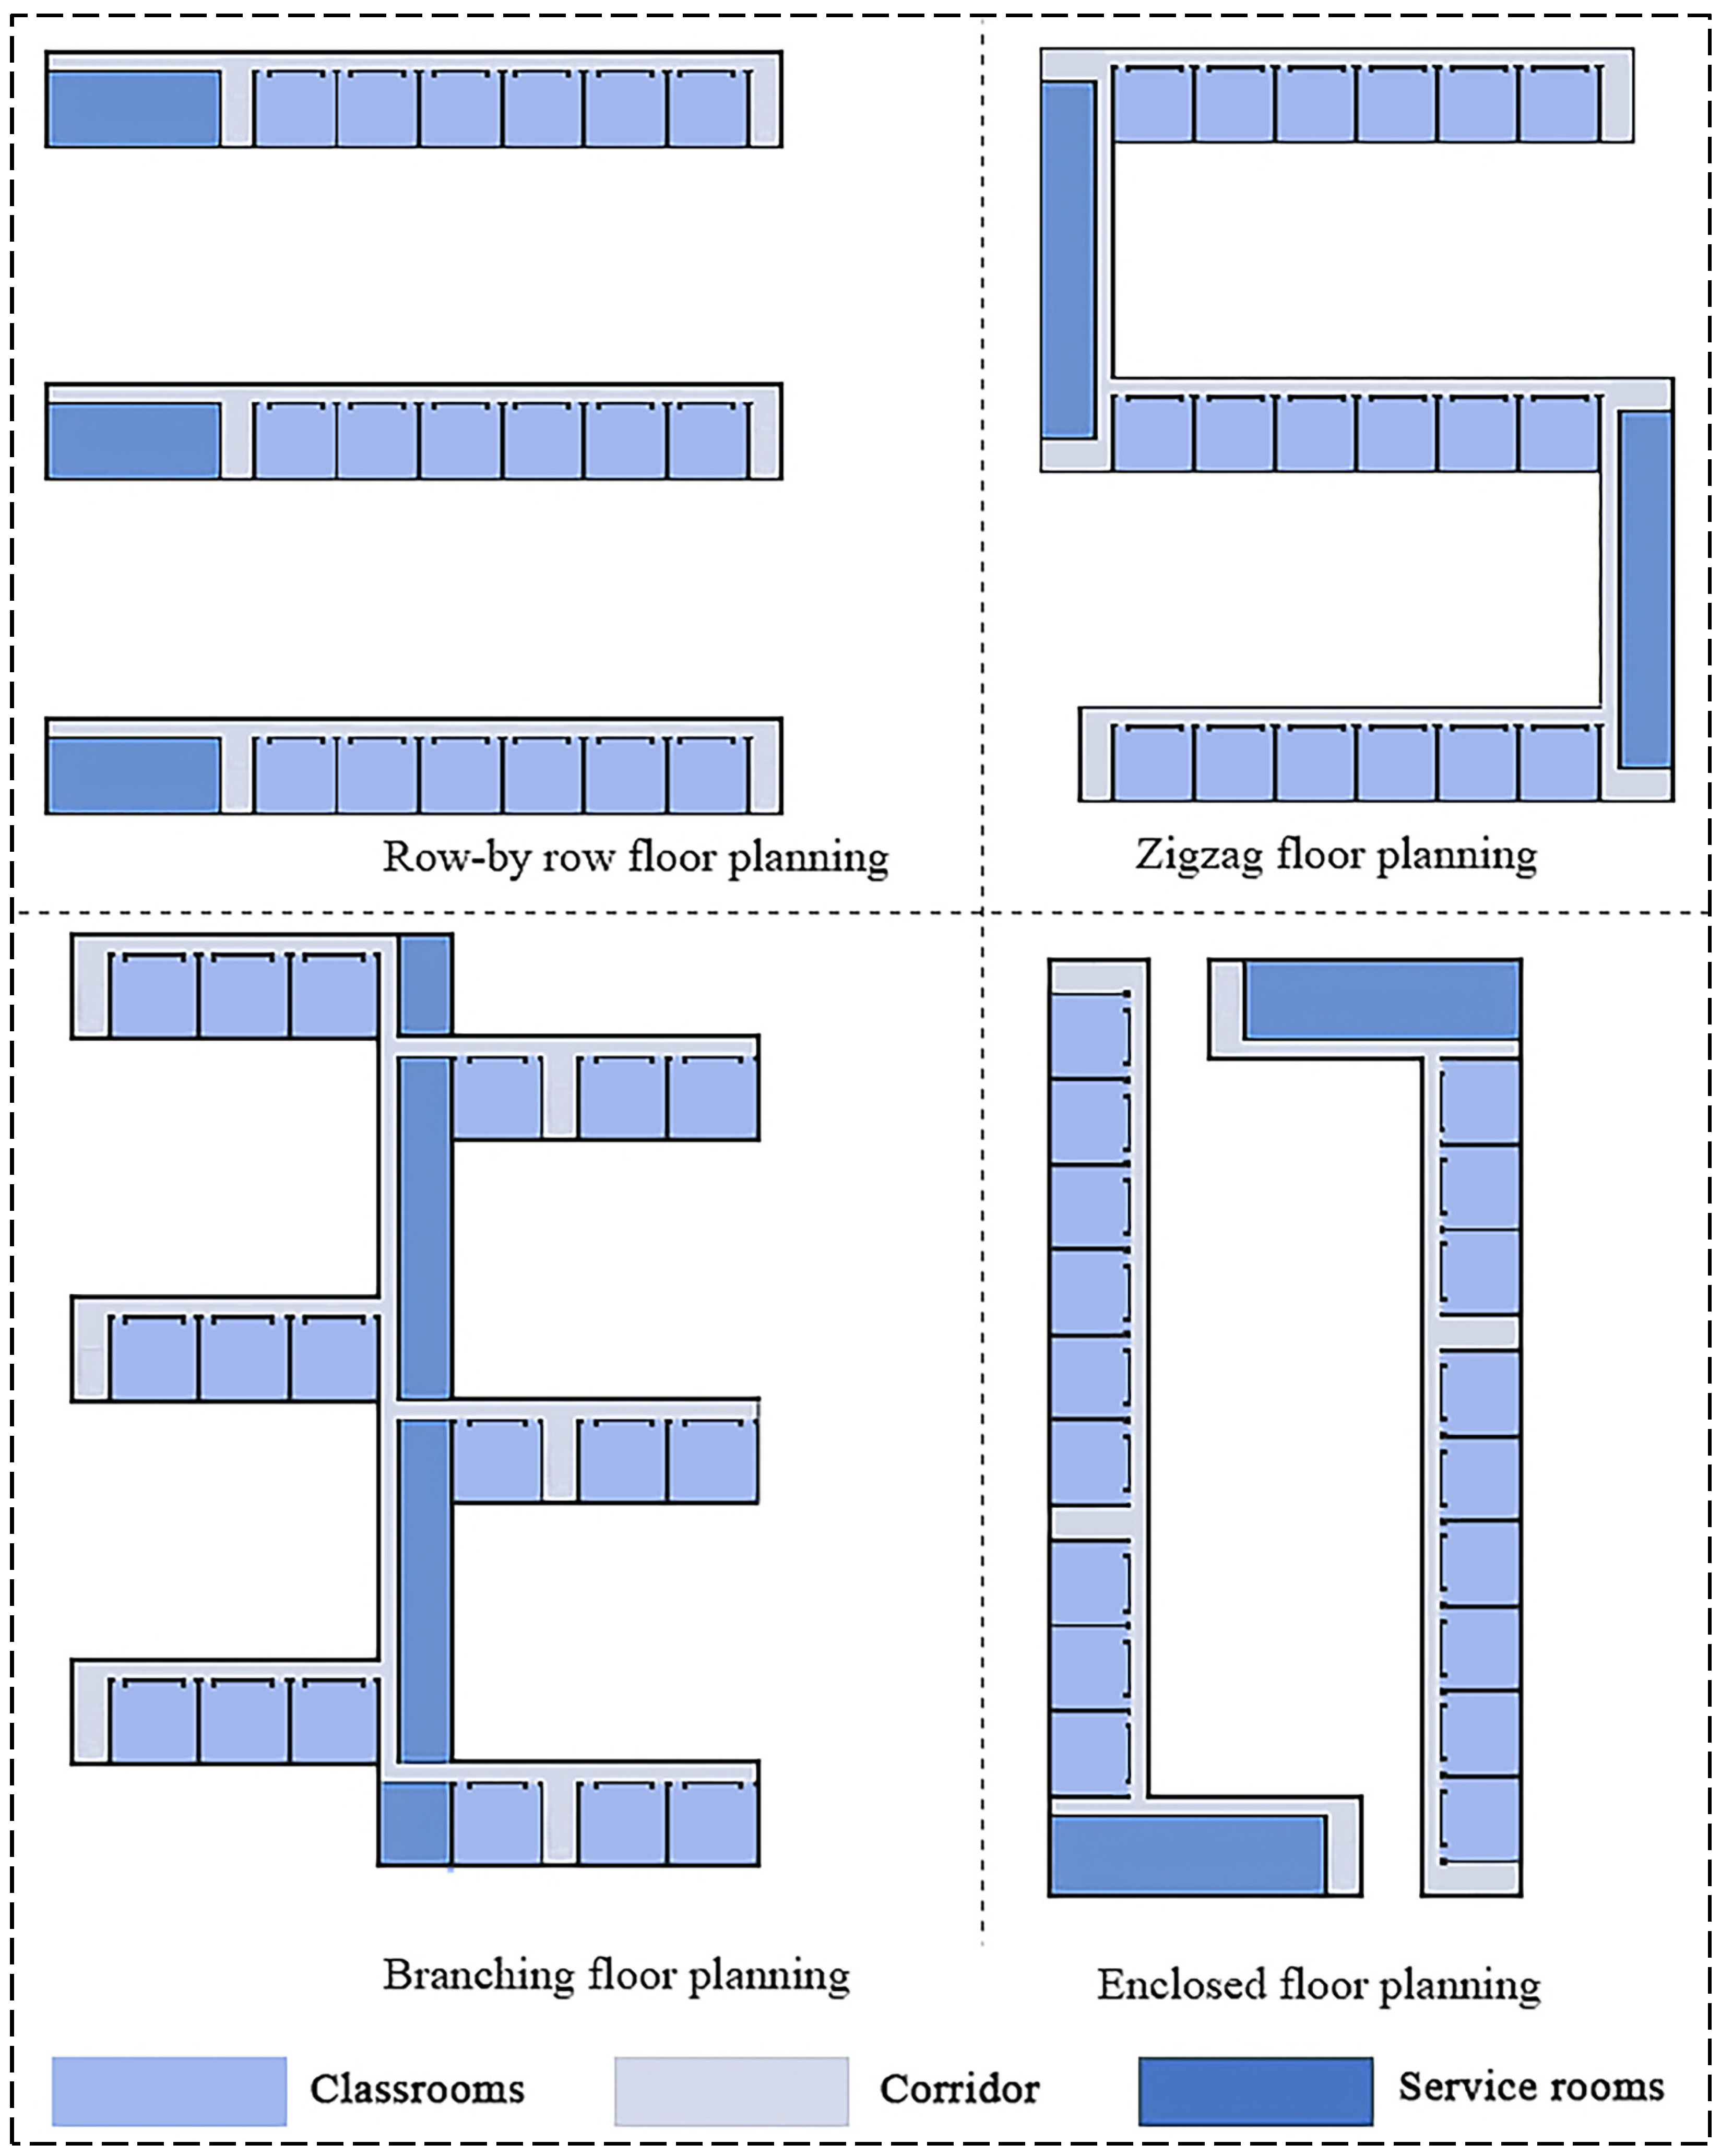
2.1. Typical Models of School Buildings

Primary school educational buildings, regardless of their shape, share significant characteristics in their floor plans, as discussed previously. This article conducted a survey on the floor planning of existing primary schools in Xi’an and used concentrated measurements to extract a model prototype representing a variety of primary school buildings. The methods are as follows:
(1)
Using Statistical Package for the Social Sciences (SPSS) 29.0.1.0 analysis, survey data and the mean, median, and mode values of each group of data are obtained.
(2)
The mean, median, and mode values of each data set are compared to determine their relative magnitudes. When the mean, median, and mode are equal, the data distribution is normal, and the mean represents the typical value for that dataset. When the mean is greater than the median and the median is greater than the mode, or when the mean is less than the median and the median is less than the mode, the data distribution is skewed. In this case, the median or mode is considered the representative value. A tiny discrepancy between the median and mode has a minimal effect on the calculation outcome, allowing the average of the two to be considered the typical value. If there is a notable difference between the two, the skewed distribution of the data in that group is transformed into a normal distribution, and the average is then considered the typical value. When the order of magnitude of these three values differs or there are multiple mode values, a normality and skewness test is conducted on the data in that group before establishing the typical value.
(3)
SPSS commonly uses the Shapiro–Wilk (S–W) and Kolmogorov–Smirnov (K–S) tests to assess normality. The Shapiro–Wilk test is appropriate for sample sizes below 5000 and the Kolmogorov–Smirnov test is acceptable for sample sizes over 5000. If the p-value is less than 0.05, the data in that group are deemed to not adhere to a normal distribution; otherwise, they do. If the mean, median, and mode are not equal, and the p-value is more than 0.05, the data in that group can be said to follow a normal distribution.
In the surveyed area, there are a total of 202 primary school buildings. The Cronbach’s alpha coefficient was utilized to verify the consistency and reliability of the data. Specifically, the confidence level was set at 95%, the confidence interval at 10%, and the total population at 202. The results indicated that the sample size for the survey should be 65. Therefore, a data survey was conducted on 65 randomly selected primary school buildings, covering metrics such as shape coefficient (determined based on the length and width) and window-to-wall ratio in various orientations. Subsequently, through SPSS calculations, the mean (M), median (Md), and mode (Mo) values of these data were obtained and are shown in Table 1.
The table clearly shows that the five sets of data collected from the surveyed buildings display distinct patterns. The shape coefficient follows the order Md > M > Mo. The south-facing window-to-wall ratio follows M > Md = Mo. The west-facing window-to-wall ratio follows Mo > M > Md. The north-facing window-to-wall ratio follows M > Md > Mo. The east-facing window-to-wall ratio follows Mo > Md > M. Based on the aforementioned calculation methods, it can be observed that the south-facing window-to-wall ratio data set exhibits a skewed distribution, indicating that the median or mode should be selected as the typical value for this group. Similarly, the north-facing and east-facing window-to-wall ratio data sets also exhibit skewed distributions, suggesting the median or mode as the appropriate typical values. However, due to the significant difference between the median and mode values in these two data sets, it is necessary to plot the corresponding distribution curves, conduct a normality analysis, and then determine the final typical values. For the shape coefficient and west-facing window-to-wall ratio data sets, normal and skewed tests should be performed before deciding on their typical data values. Figure 3 illustrates a histogram of normal distribution analysis, using the shape coefficient as an example. It can be observed that the shape coefficient exhibits the highest statistical frequency within the range of 0.20 to 0.30. Furthermore, the curve is essentially symmetric, indicating a normal distribution. Through these steps, the relevant parameters of the plan form of the typical model can be extracted (Table 2). This model is used for case studies in Section 2.2.

2.2. Case Study

The research case for this study is a newly constructed school in Xi’an. The school has 54 classes and is situated on a land area of 16,800 square meters, meeting a plot ratio limit of 0.8. Four distinct floor plan layouts were created based on the standard models of educational buildings outlined in Section 2.1: Scenario 1—Row-by-row floor planning, Scenario 2—Zigzag floor planning, Scenario 3—Branching floor planning, and Scenario 4—Enclosed floor planning (Figure 4). The sports grounds are on the west side of the campus, and the teaching buildings are on the east side. Each of the four scenarios has three-story buildings with a floor height of 3.9 m, holding 54 classes each and utilizing a north-facing corridor design (Figure 5). Individual classrooms are identical in terms of their length, width, and area, and they all face southward to guarantee that they receive sufficient sunlight. The exterior windows of classrooms are created according to the specifications outlined in the “Design Code for Primary and Secondary Schools” (GB50099-2011) [27], with dimensions of 2.5 m in width, 2 m in height, and a sill height of 0.9 m. According to the “Green Campus Evaluation Standard” (GB/T51356-2019) [2], the opening area of exterior windows should be 30% of the total window area. The economic and technical indicators of the four layout plans are similar, as shown in Table 3, and all fulfill the project design requirements.

2.3. CFD Simulations

This study utilized the software VENT 2024 to model the performance of four scenarios regarding outdoor wind conditions and internal ventilation throughout winter and summer. VENT passed the software evaluation of the Ministry of Housing and Urban-Rural Development of China in 2017, and many studies have proved its accuracy [44]. Furthermore, VENT can utilize the “Special Meteorological Dataset for Thermal Environment Analysis of Chinese Buildings” to extract the prevailing wind directions and average wind speeds for the winter and summer seasons at the project location. When presenting the analysis results, VENT is capable of directly comparing them with relevant evaluation standards in China, thereby directly yielding analytical conclusions and enhancing work efficiency.
The predominant wind directions for Xi’an throughout the year and for individual months are presented in Table 4 below. The annual predominant wind direction in Xi’an is northeasterly, characterized by a relatively high frequency of winds blowing from this direction. Additionally, the northeasterly wind also dominates as the most frequent wind direction in each season. Notably, the annual average calm wind frequency is 35%. The city experiences an annual average wind speed of 1.8 m/s, whereas the average wind speed of the predominant northeasterly direction is 2.5 m/s. Therefore, 2.5 m/s and ENE were chosen for the CFD simulations.
The “Green Campus Evaluation Standard” (GB/T51356-2019) [2] recommends setting the dimensions of the simulation domain for the incoming wind direction and wake direction at 4 and 6 times the height of the model, respectively. The lateral boundary dimension should be set at 2 times the height of the model. The height of the computational domain is typically three times the height of the model. The simulation area should encompass buildings located within a 500 m radius to accurately represent their influence on the chosen teaching buildings.
VENT automatically divides the model into grids. The software offers three types of grids, including regular grids, ground grids, and boundary layer grids. Regular grids refer to grids other than those near the ground and buildings, which do not require special densification. The area close to the building is called the near field, while the area far away from the building is called the far field. In the near field, the ground grid needs to be densified, corresponding to a larger subdivision level, whereas in the far field, the ground grid is relatively sparse, with a smaller subdivision level. The boundary layer grid is the grid that is significantly close to the surfaces of the ground and buildings. Because of the inherent viscosity of air, it experiences resistance from the ground or building surfaces. The airflow velocity near the ground or building walls is almost zero, and the velocity increases with the distance from the ground or building surfaces. This results in a gradient distribution of flow velocity within a certain thickness of an air layer near the ground, eventually reaching the mainstream velocity. This layer of air is commonly referred to as the boundary layer or attached layer. In computational fluid dynamics analysis, to capture the airflow characteristics within the boundary layer or attached layer and improve analysis accuracy, it is advisable to layer the grids in this region, forming boundary layer grids.
Furthermore, VENT provides three distinct levels of simulation accuracy, specifically Level 1 through Level 3, each of which corresponds to varying mesh densities. Typically, Level 1 serves as an initial assessment of the simulation, encompassing aspects such as computational time and result accuracy. Conversely, Level 2 and Level 3 offer increased simulation precision, albeit at the cost of longer computational durations. Following preliminary evaluations, this study selected Level 3 as the preferred simulation accuracy level, with the corresponding mesh specifications outlined in Table 5. It is imperative to underscore that all three accuracy levels offered by VENT are capable of achieving result convergence, thereby ensuring that the simulation outcomes remain independent of the specific mesh utilized.
The solution model settings and boundary conditions are consistent for both winter and summer simulations. The standard k-ε model is selected as the solution model. The inlet boundary conditions are defined by the prevailing wind direction and mean wind velocity for winter and summer (ENE and 2.5 m/s). The outlet boundary condition is defined as a free outflow. The side and top boundaries are designated as slip walls to model outdoor airflow realistically without being influenced by wall friction. The ground boundary is established as a non-slip wall, signifying that airflow is affected by ground friction (with a ground roughness index of 0.28).

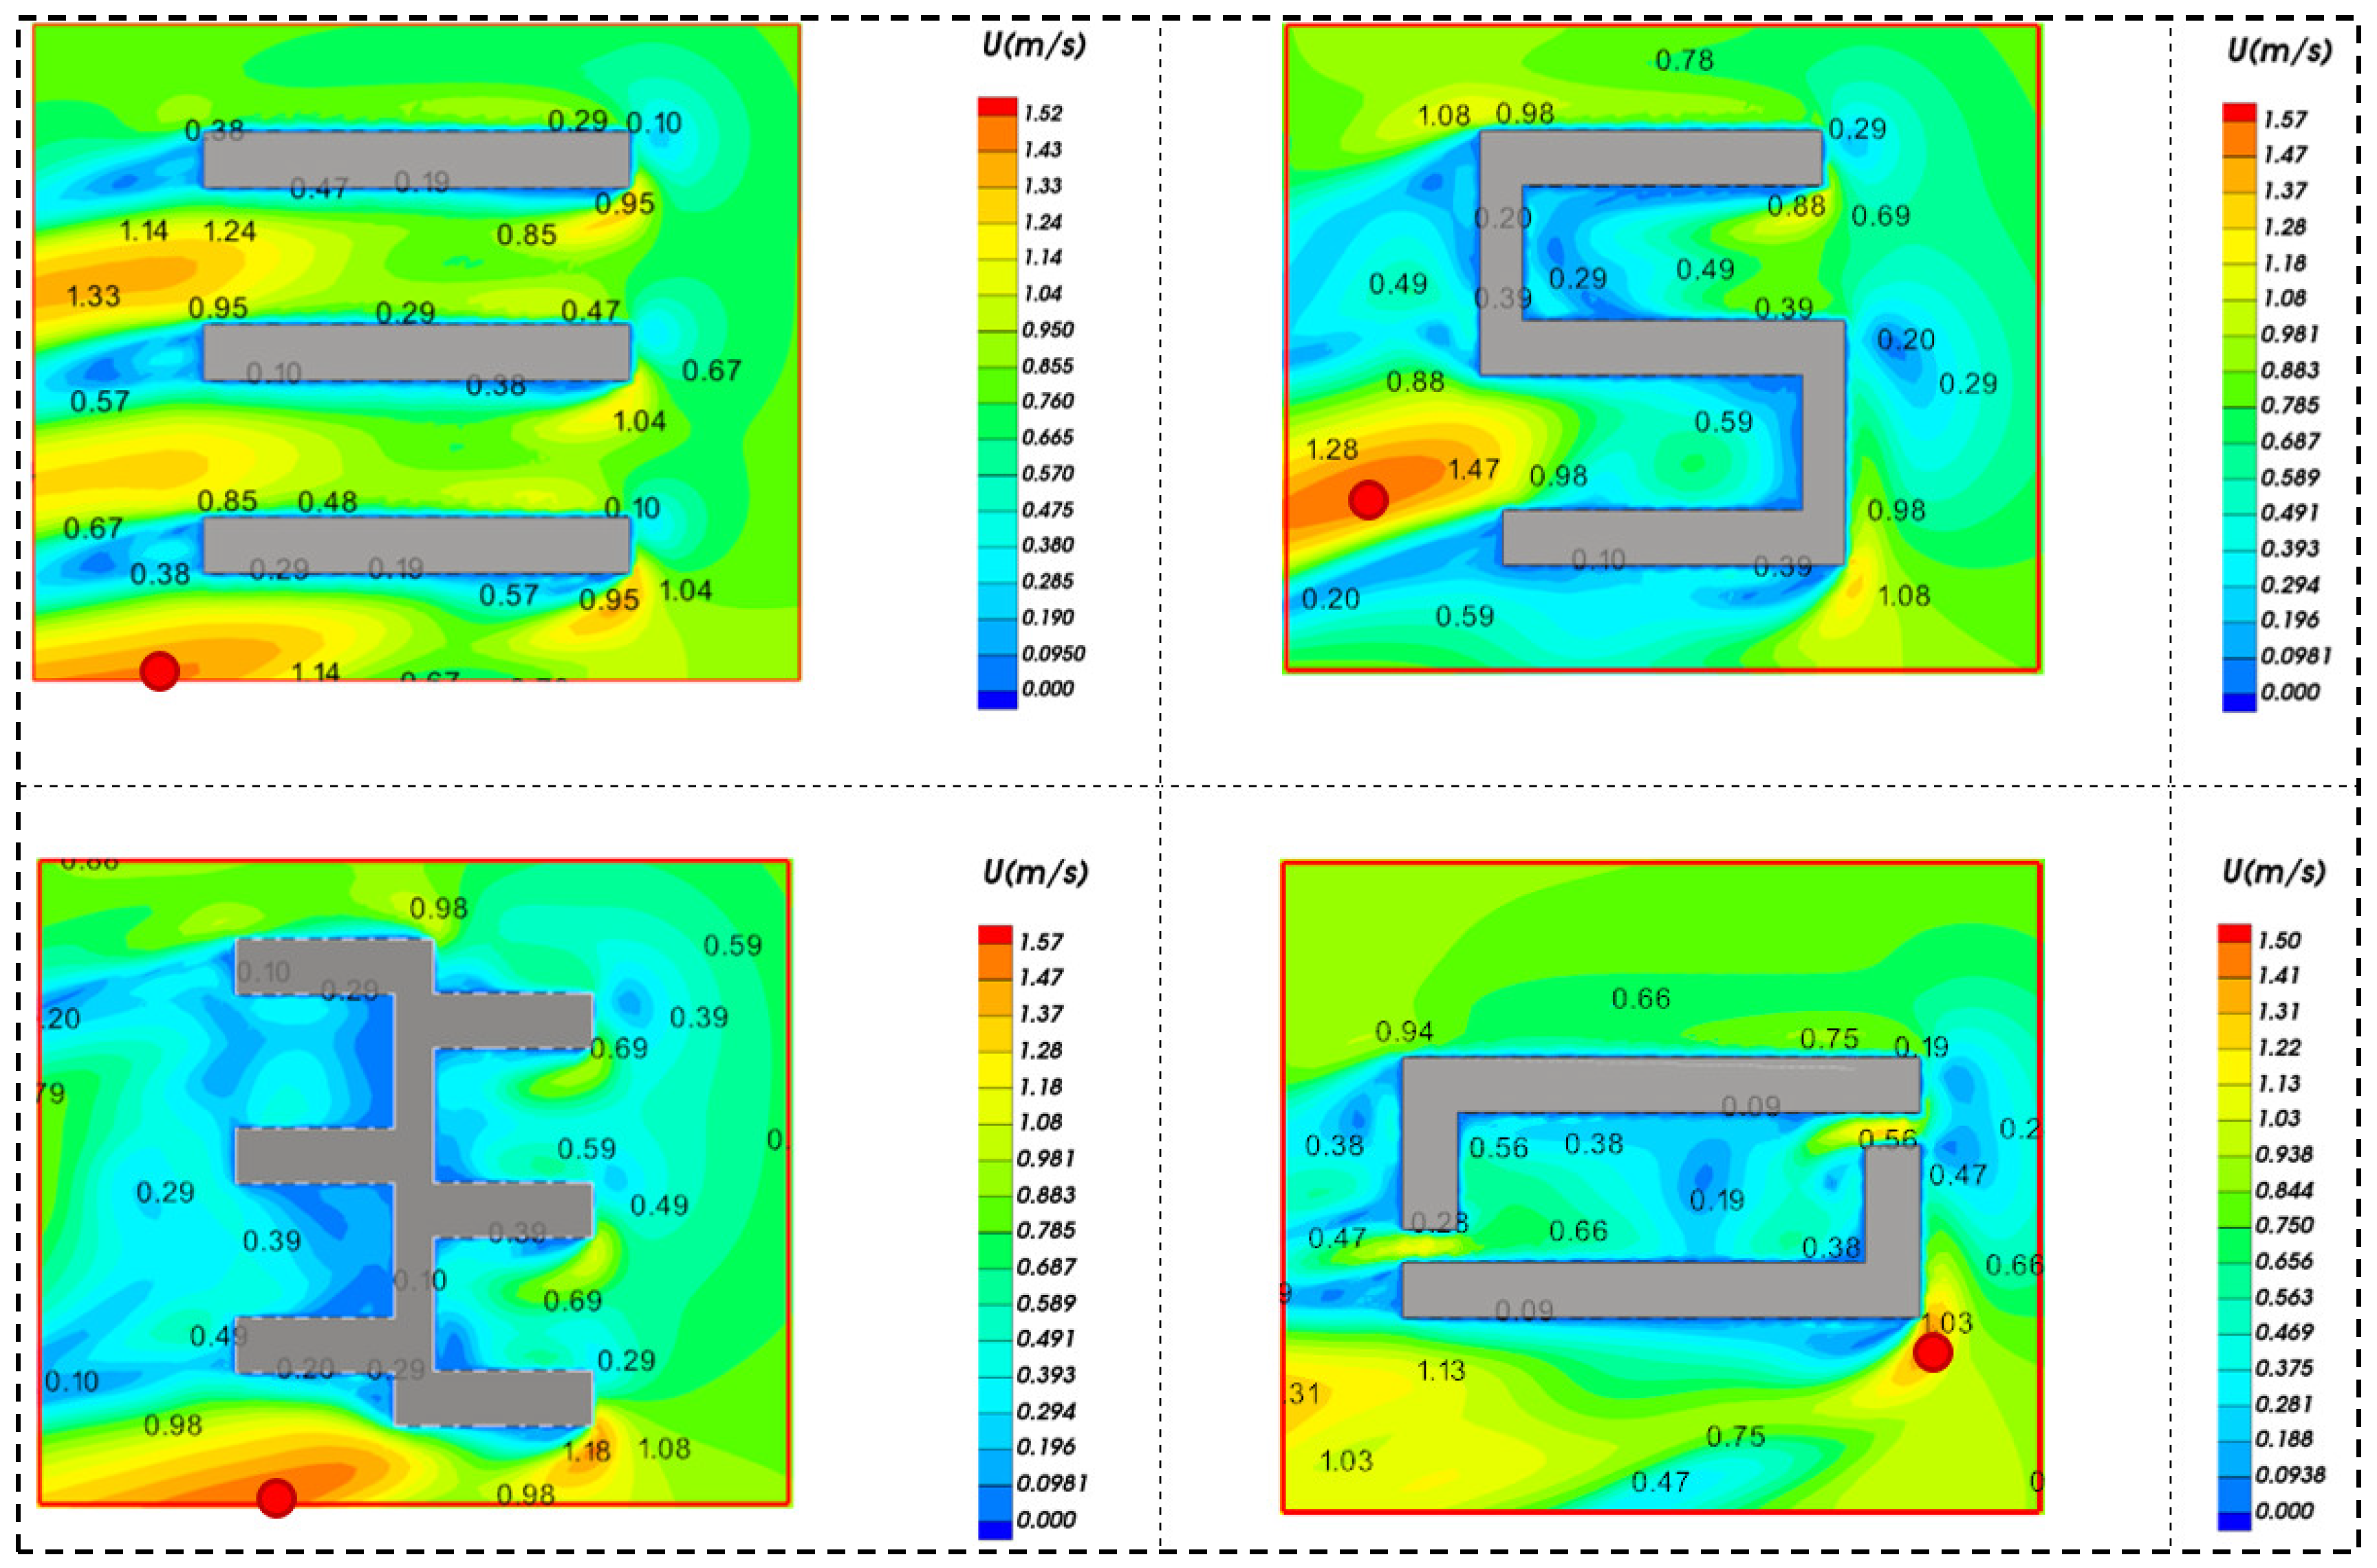
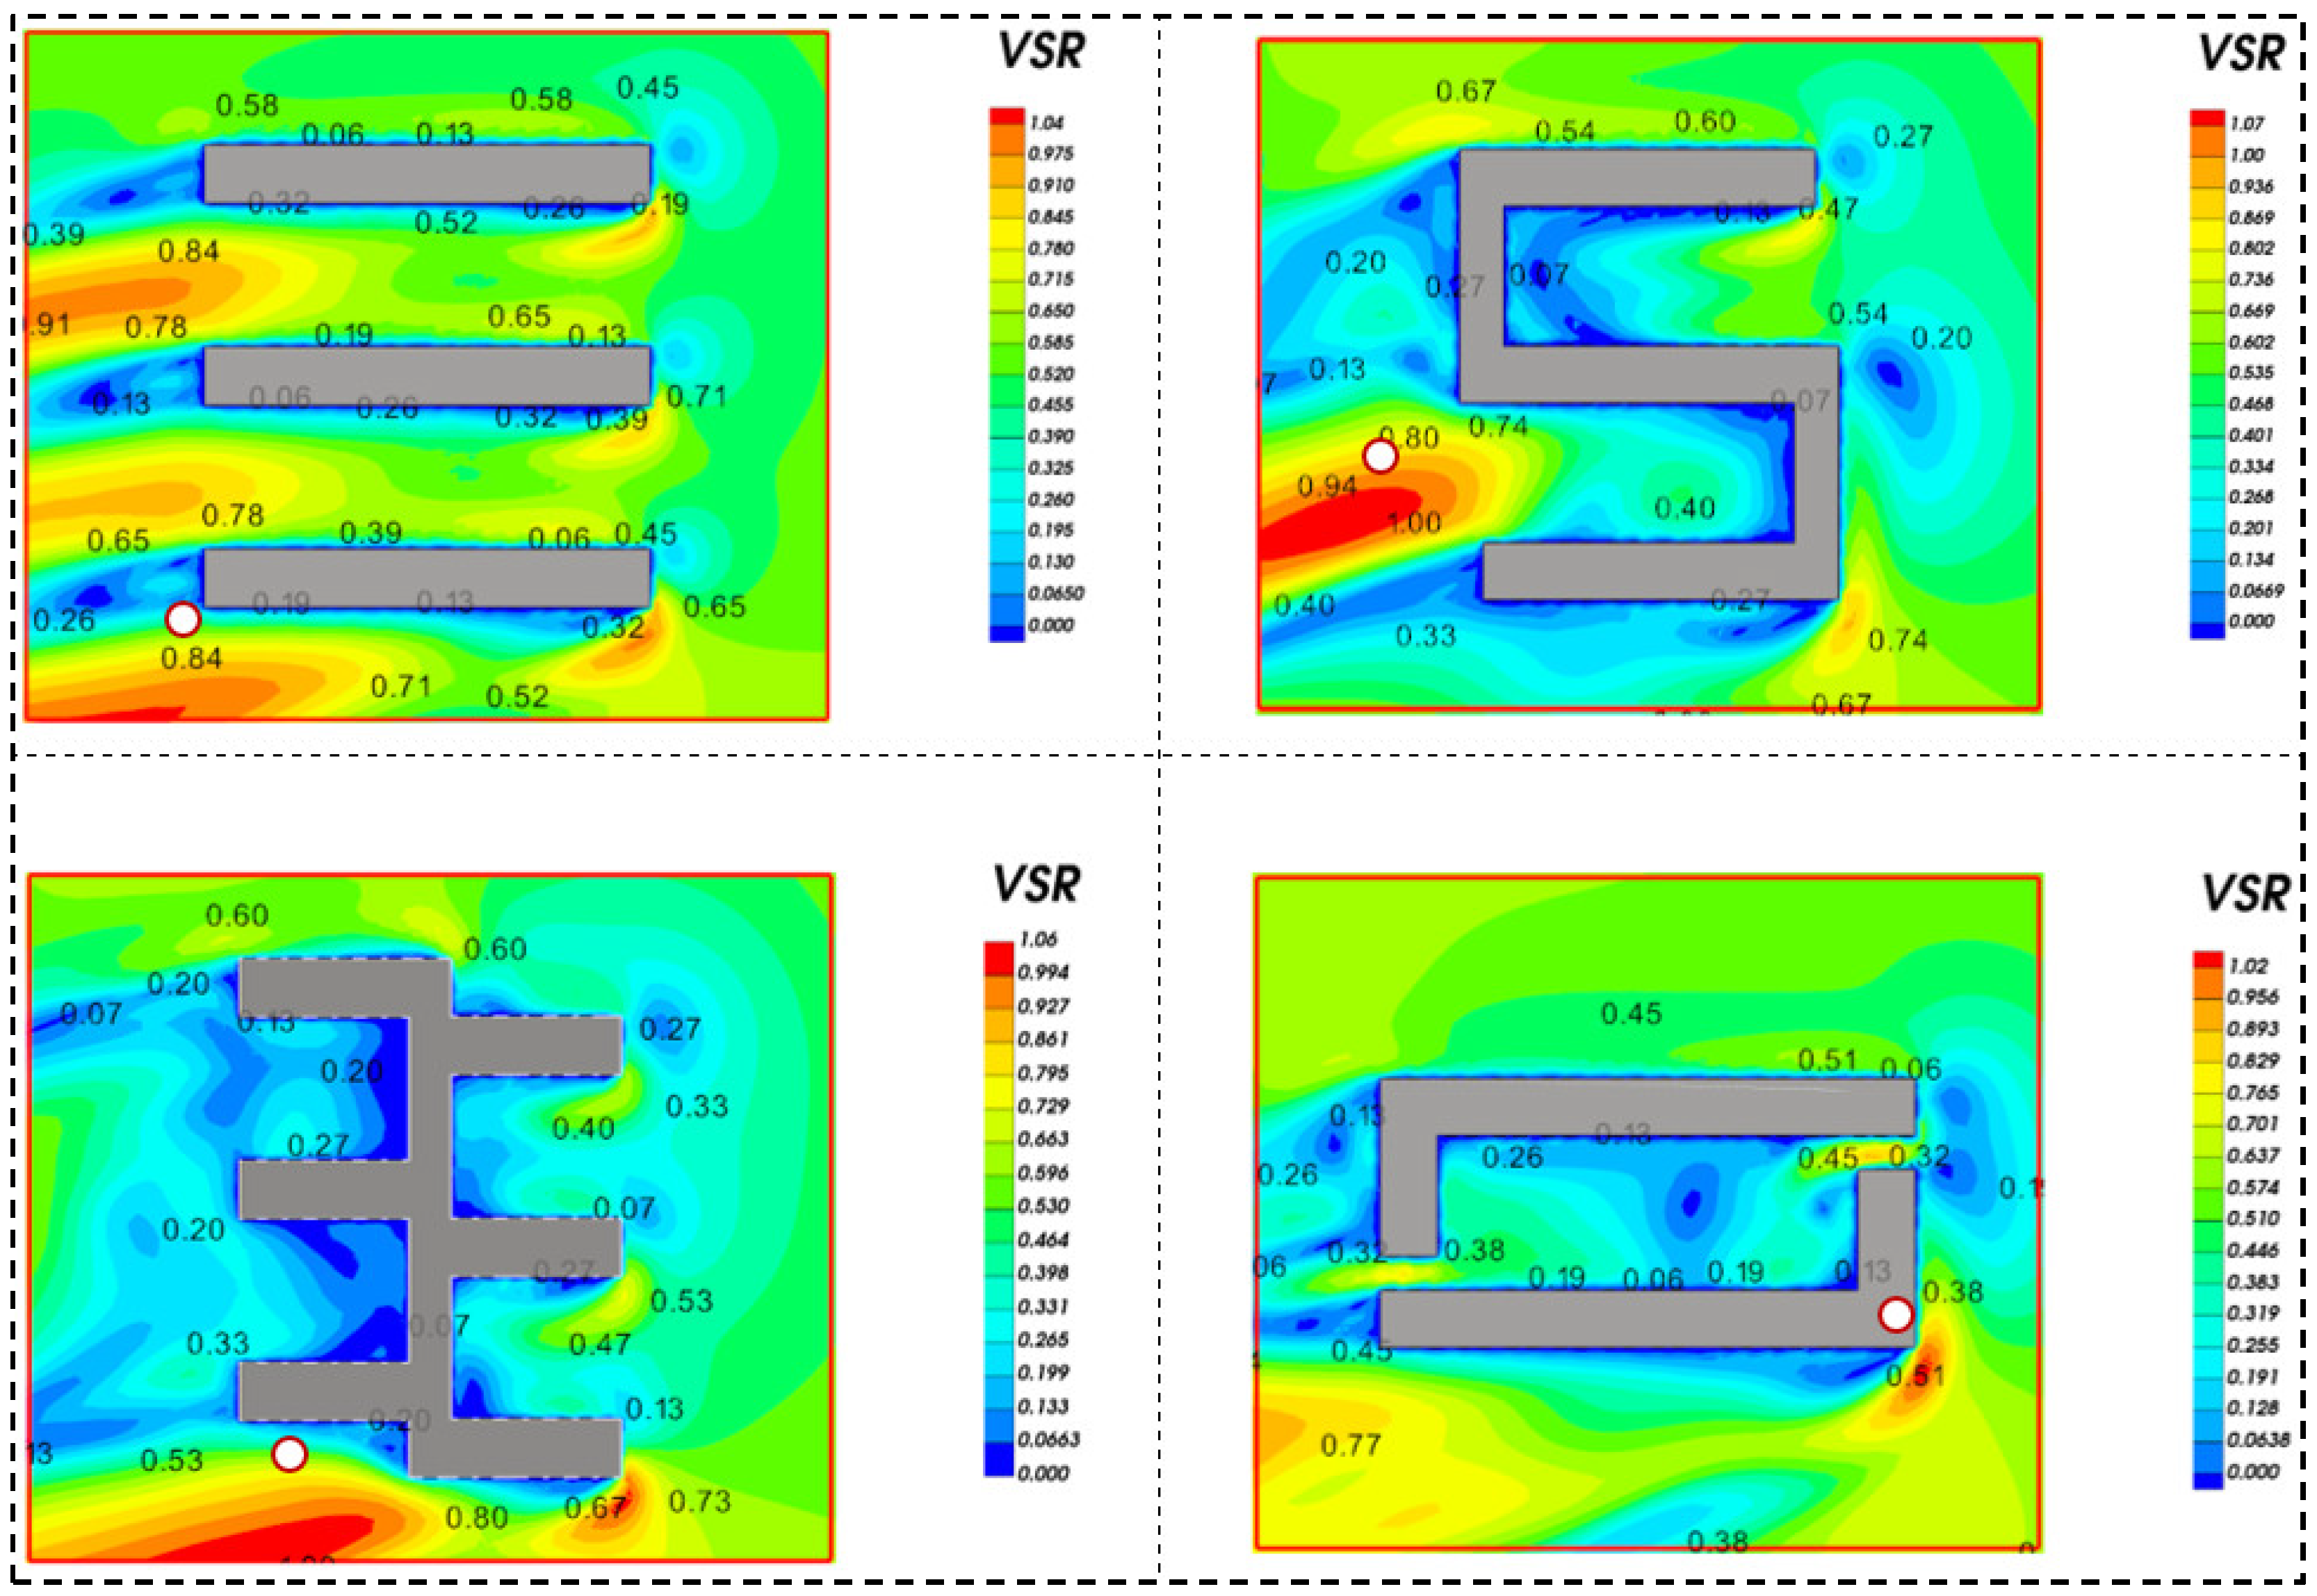
3. Simulation Results and Analysis

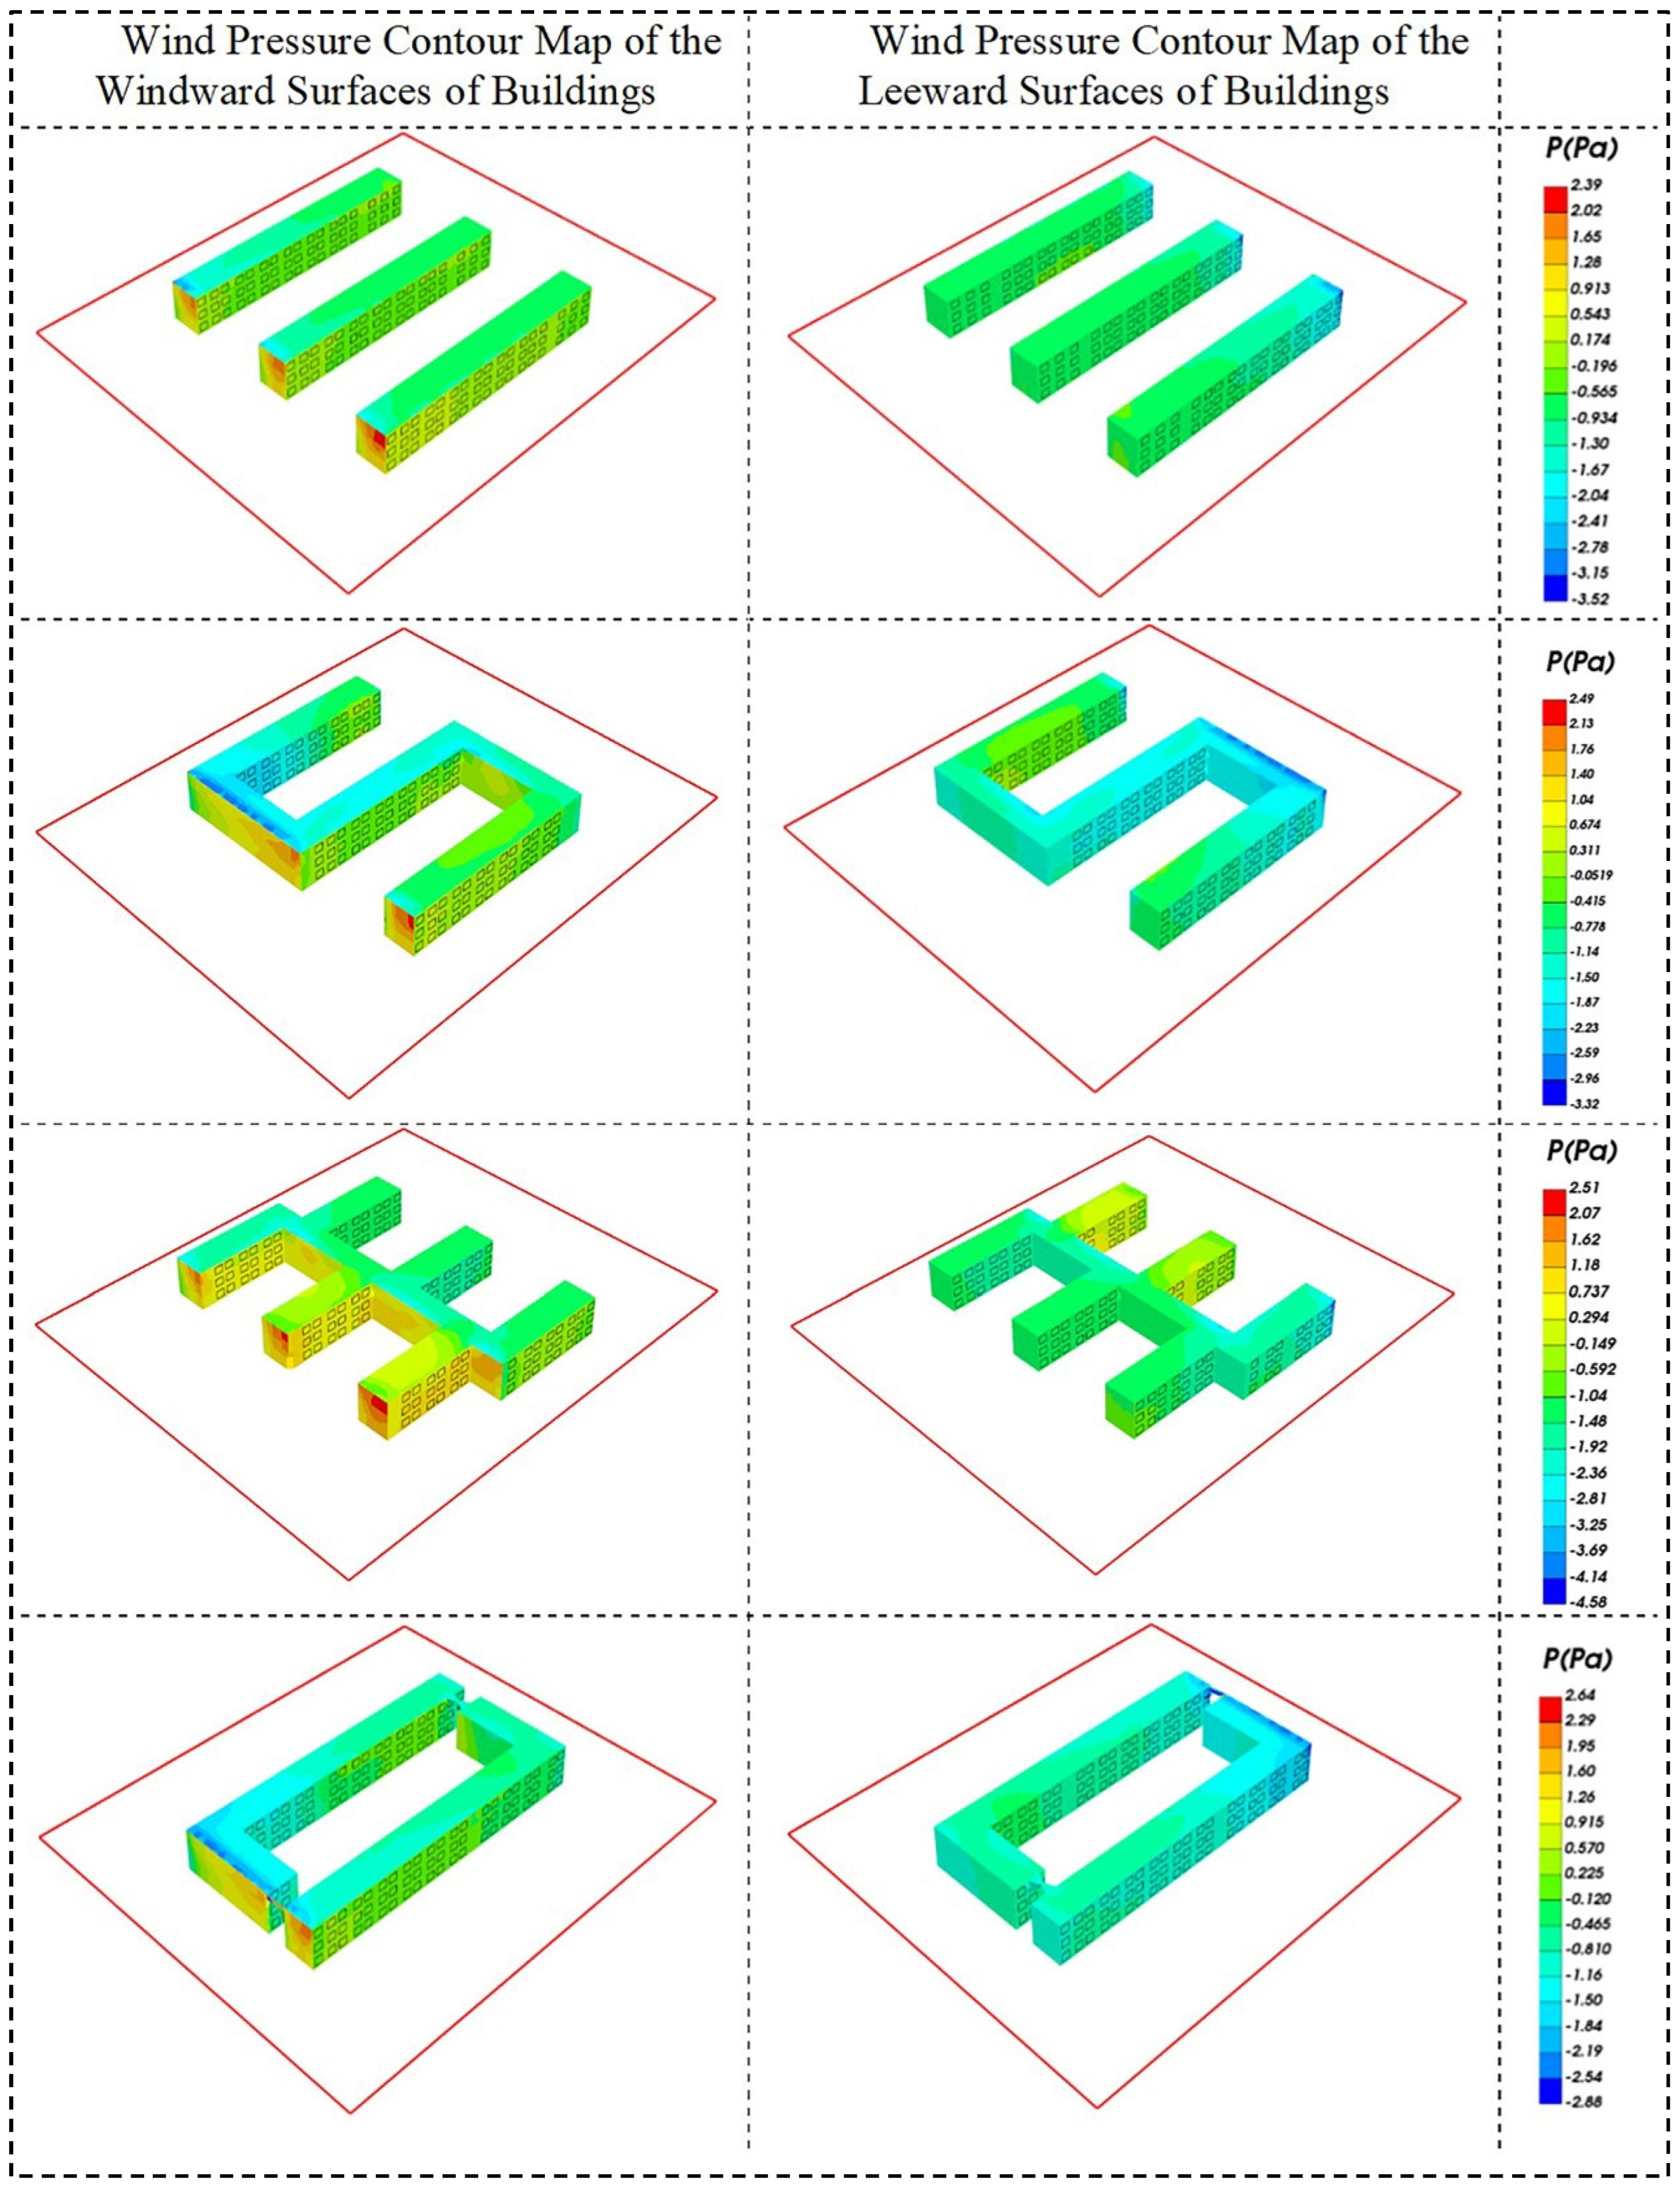
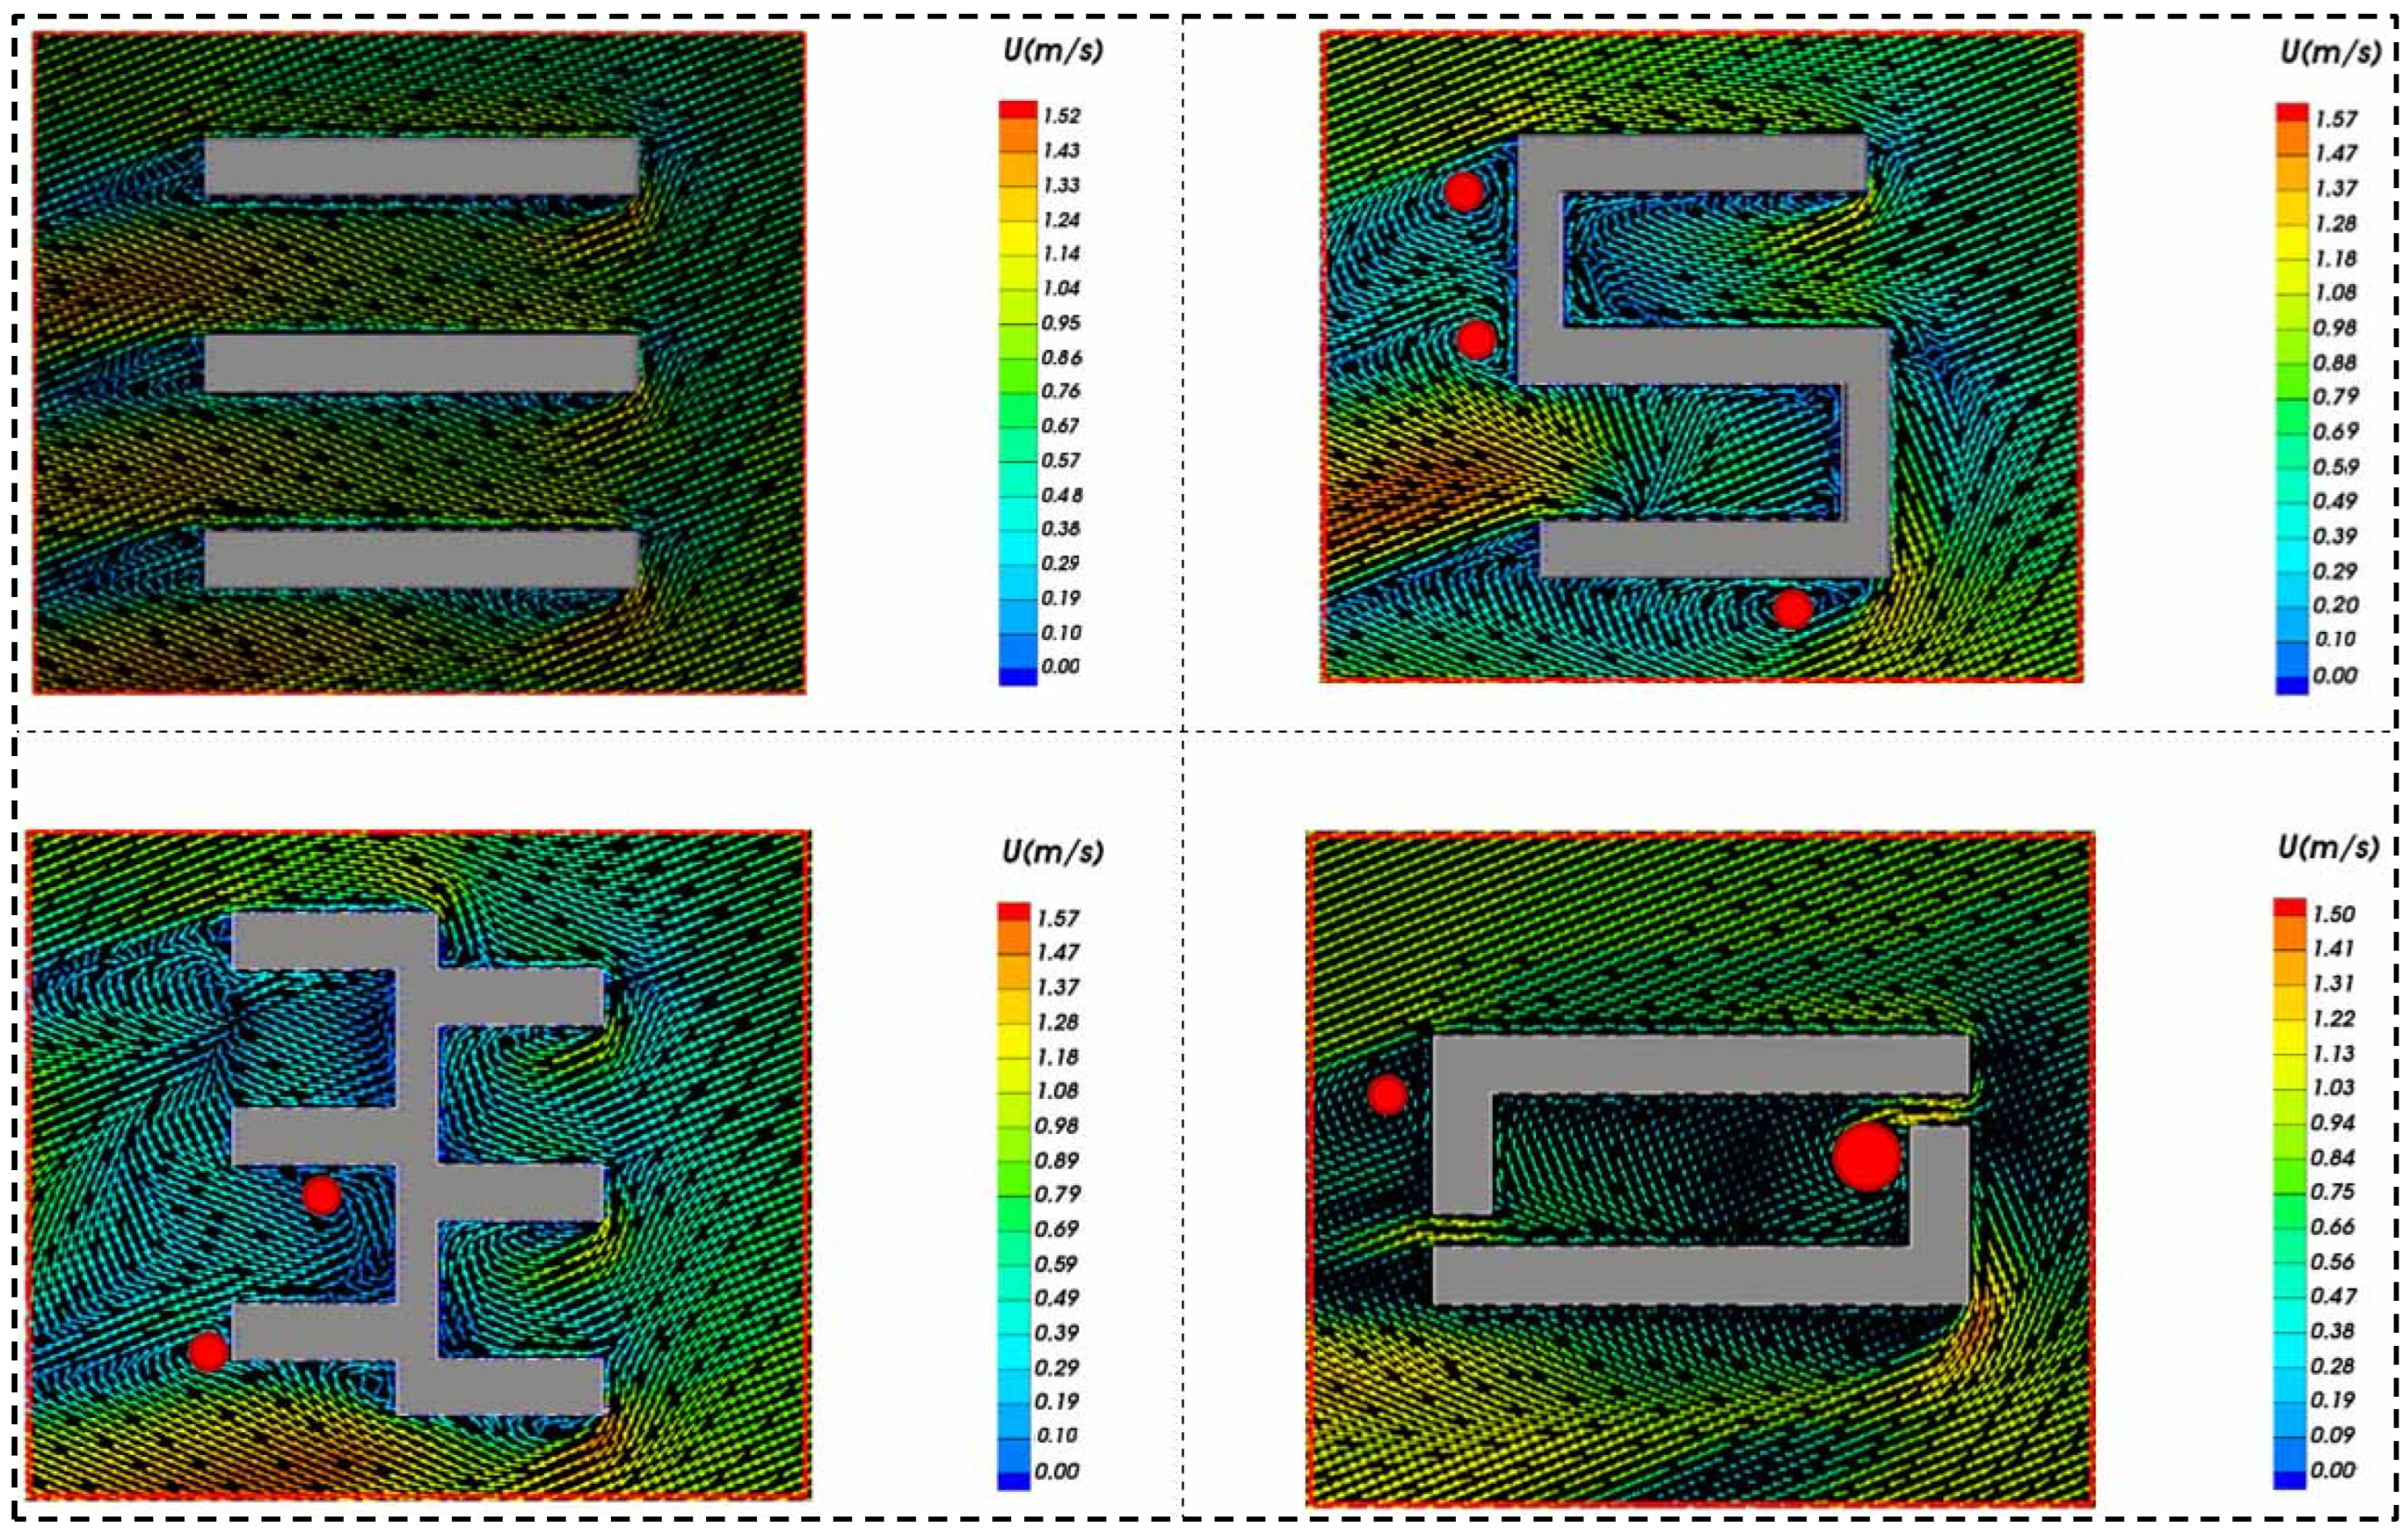
3.1. External Simulation Results for Winter

The main assessment criteria for the outdoor wind conditions in winter are the wind speed at the location and the surface wind pressure difference on the exterior walls of buildings. Figure 6 illustrates the horizontal wind speed at a height of 1.5 m outdoors for four different scenarios during winter. A red dot indicates the peak outdoor wind speed, while the black figures denote the wind speed at a height of 1.5 m. The Figure shows that the highest outdoor wind speed in the four scenarios varies from 1.5 m/s to 1.57 m/s, all falling below the 5 m/s limit set in the “Green Building Evaluation Standard” (GB/T50378-2019) [37]. The main reason for this is the obstruction and slowing down caused by the crowded buildings in the city center. Row-by-row floor planning and modest building spacing in Scenario 1 generate a “canyon effect” between buildings, resulting in higher wind speeds. The wind speed, while comfortable, helps to remove unclean air from the area and improve the rate of outdoor air renewal. Scenarios 2, 3, and 4 have buildings that hinder outside wind flow, leading to decreased wind speed. The wind speed is comfortable overall but not suitable for outdoor air circulation.
Figure 7 depicts the contour map of wind speed amplification factor distribution at a height of 1.5 m outdoors for four scenarios in winter. The maximum outdoor wind speed amplification factor is marked with a white dot. It can be observed that, in winter, the outdoor maximum wind speed amplification factors of the four scenarios are similar, ranging from 1.02 to 1.07, and all meet the requirement of the “Green Building Evaluation Standard” (GB/T50378-2019) [37], which stipulates that the wind speed amplification factor should be less than 2. Among the four scenarios, as Scenarios 2, 3, and 4 form enclosed or semi-enclosed areas, the wind speed amplification factor in the regions close to the buildings in these three scenarios is relatively small at approximately 0.2. This is consistent with the wind speed performance. The wind speed amplification factor in other regions close to the buildings does not show significant differences, with most values ranging from 0.4 to 0.5. Therefore, from the perspective of outdoor wind speed and wind speed amplification factor performance, Scenario 1, which employs row-by-row floor planning, can achieve better outdoor wind environment performance in winter.
Figure 8 shows the wind pressure distribution on the windward and leeward sides of the buildings in the four scenarios in winter. The windward side has higher positive wind pressure compared to the leeward side. Scenario 1 has the lowest maximum positive wind pressure of 2.39 Pa, while Scenario 4 has the highest maximum positive wind pressure at 2.64 Pa. Scenario 2 and Scenario 3 both show maximum positive wind pressures of 2.51 Pa and 2.49 Pa, respectively. Only the outside walls on the windward side of the building are subjected to positive wind pressures, while all other surfaces confront negative wind pressures. The lowest negative wind pressures for each of the four scenarios are located on the roof surfaces, close to the outer walls that are facing the windward side, with values of −3.52 Pa, −4.58 Pa, −3.32 Pa, and −2.88 Pa accordingly.
Scenarios 2 and 3 both have semi-enclosed spaces. The outside walls of semi-enclosed spaces experience positive pressure while facing the windward direction and negative pressure when facing the leeward direction. Scenario 4, with a fully enclosed enclosure, demonstrates negative pressure on all interior surfaces. Scenario 1, lacking an enclosed compartment, shows negative or near-negative pressure on most surfaces, except for the external walls facing the windward direction.
Under winter conditions, to prevent excessive wind pressure differences on building surfaces from causing cold air infiltration and indoor heat loss, the “Green Building Evaluation Standard” (GB/T50378-2019) [37] stipulates that the wind pressure difference between the windward and leeward surfaces of a building should not exceed 5 Pa. By extracting the average wind pressure values on the exterior surfaces of the teaching buildings in the four scenarios, the average wind pressure differences between the windward and leeward surfaces are calculated and presented in Table 6 below. Scenario 2 exhibits the highest wind pressure difference of 1.71 Pa, whereas Scenario 3 shows the lowest wind pressure difference of 0.74 Pa. The wind pressure differences between Scenarios 1 and 3 are 0.84 Pa and 0.74 Pa, respectively. The wind pressure differences in all four scenarios meet the standards of the “Green Building Evaluation Standard” (GB/T50378-2019) [37].
A larger wind pressure differential often leads to better indoor ventilation efficiency when opening facade windows. However, in winter, when external temperatures drop significantly, it is crucial to have a steady internal temperature. Therefore, a decreased wind pressure differential helps to prevent the entry of cold air into the internal space while windows are open, which significantly decreases the amount of energy used for heating the building. During winter, Scenarios 1 and 3 have specific benefits in maintaining indoor thermal comfort and decreasing the building’s heating energy usage.

3.2. External Simulation Results for Summer

The Evaluation Standard for Green Building in China (GB/T50378-2019) [37] specifies that the evaluation criteria for the outdoor wind environment in summer involve the size of the vortex area and the windless zone, along with the wind pressure difference between the interior and exterior surfaces of the building’s external windows. Figure 9 shows wind speed vector diagrams at a height of 1.5 m above the ground for four scenarios, with vortex locations indicated by red dots. Scenario 1 is the only one that does not display vortex areas, while the other three do. Scenario 1’s row-by-row floor planning does not create a solid blocking surface, which enables the wind to move freely over the entire site, preventing the development of vortex zones. However, other scenarios create enclosed and semi-enclosed regions that obstruct airflow. In Scenario 4, the enclosed courtyard creates a restricted space, leading to stagnant airflow within the courtyard and the formation of a larger vortex area. In Scenarios 2 and 3, the vortex zones are mostly focused on the leeward side, known as the low-pressure vortex region.
Figure 10 illustrates a distribution cloud map displaying outdoor windless zones, with green spots indicating locations with no wind. Windless zones are mainly found on the leeward side of buildings and in semi-enclosed or enclosed areas. Scenario 1, shown in Figure 11, has a windless zone size that is notably smaller, making up 5.13% of the total campus area. Scenario 4 features a windless zone area that is significantly larger than Scenario 1’s, reaching 5.52%. Scenarios 2 and 3 feature greater areas with no wind, making up 9.60% and 8.32%, respectively. Scenario 1 is the most desirable based on the proportion of windless zone area.
Figure 12 displays the average wind pressure difference between the inner and outer surfaces of the building’s external windows. The Evaluation Standard for Green Building in China (GB/T50378-2019) requires that over 50% of a building’s external windows must exhibit a wind pressure differential of over 0.5 Pa between the inner and outer surfaces in summer. Scenario 2’s compliance ratio for external windows is 48.29%, falling short of the threshold. Nevertheless, the other three scenarios were all above the 50% criterion. Scenario 3 excels with a compliance ratio of 75.83% for its exterior windows. Scenario 1 has a compliance ratio of 50%, whereas Scenario 4 has a compliance level of 55.56%. Thus, adopting Scenario 3 for the project could result in improved indoor air quality in the summer.

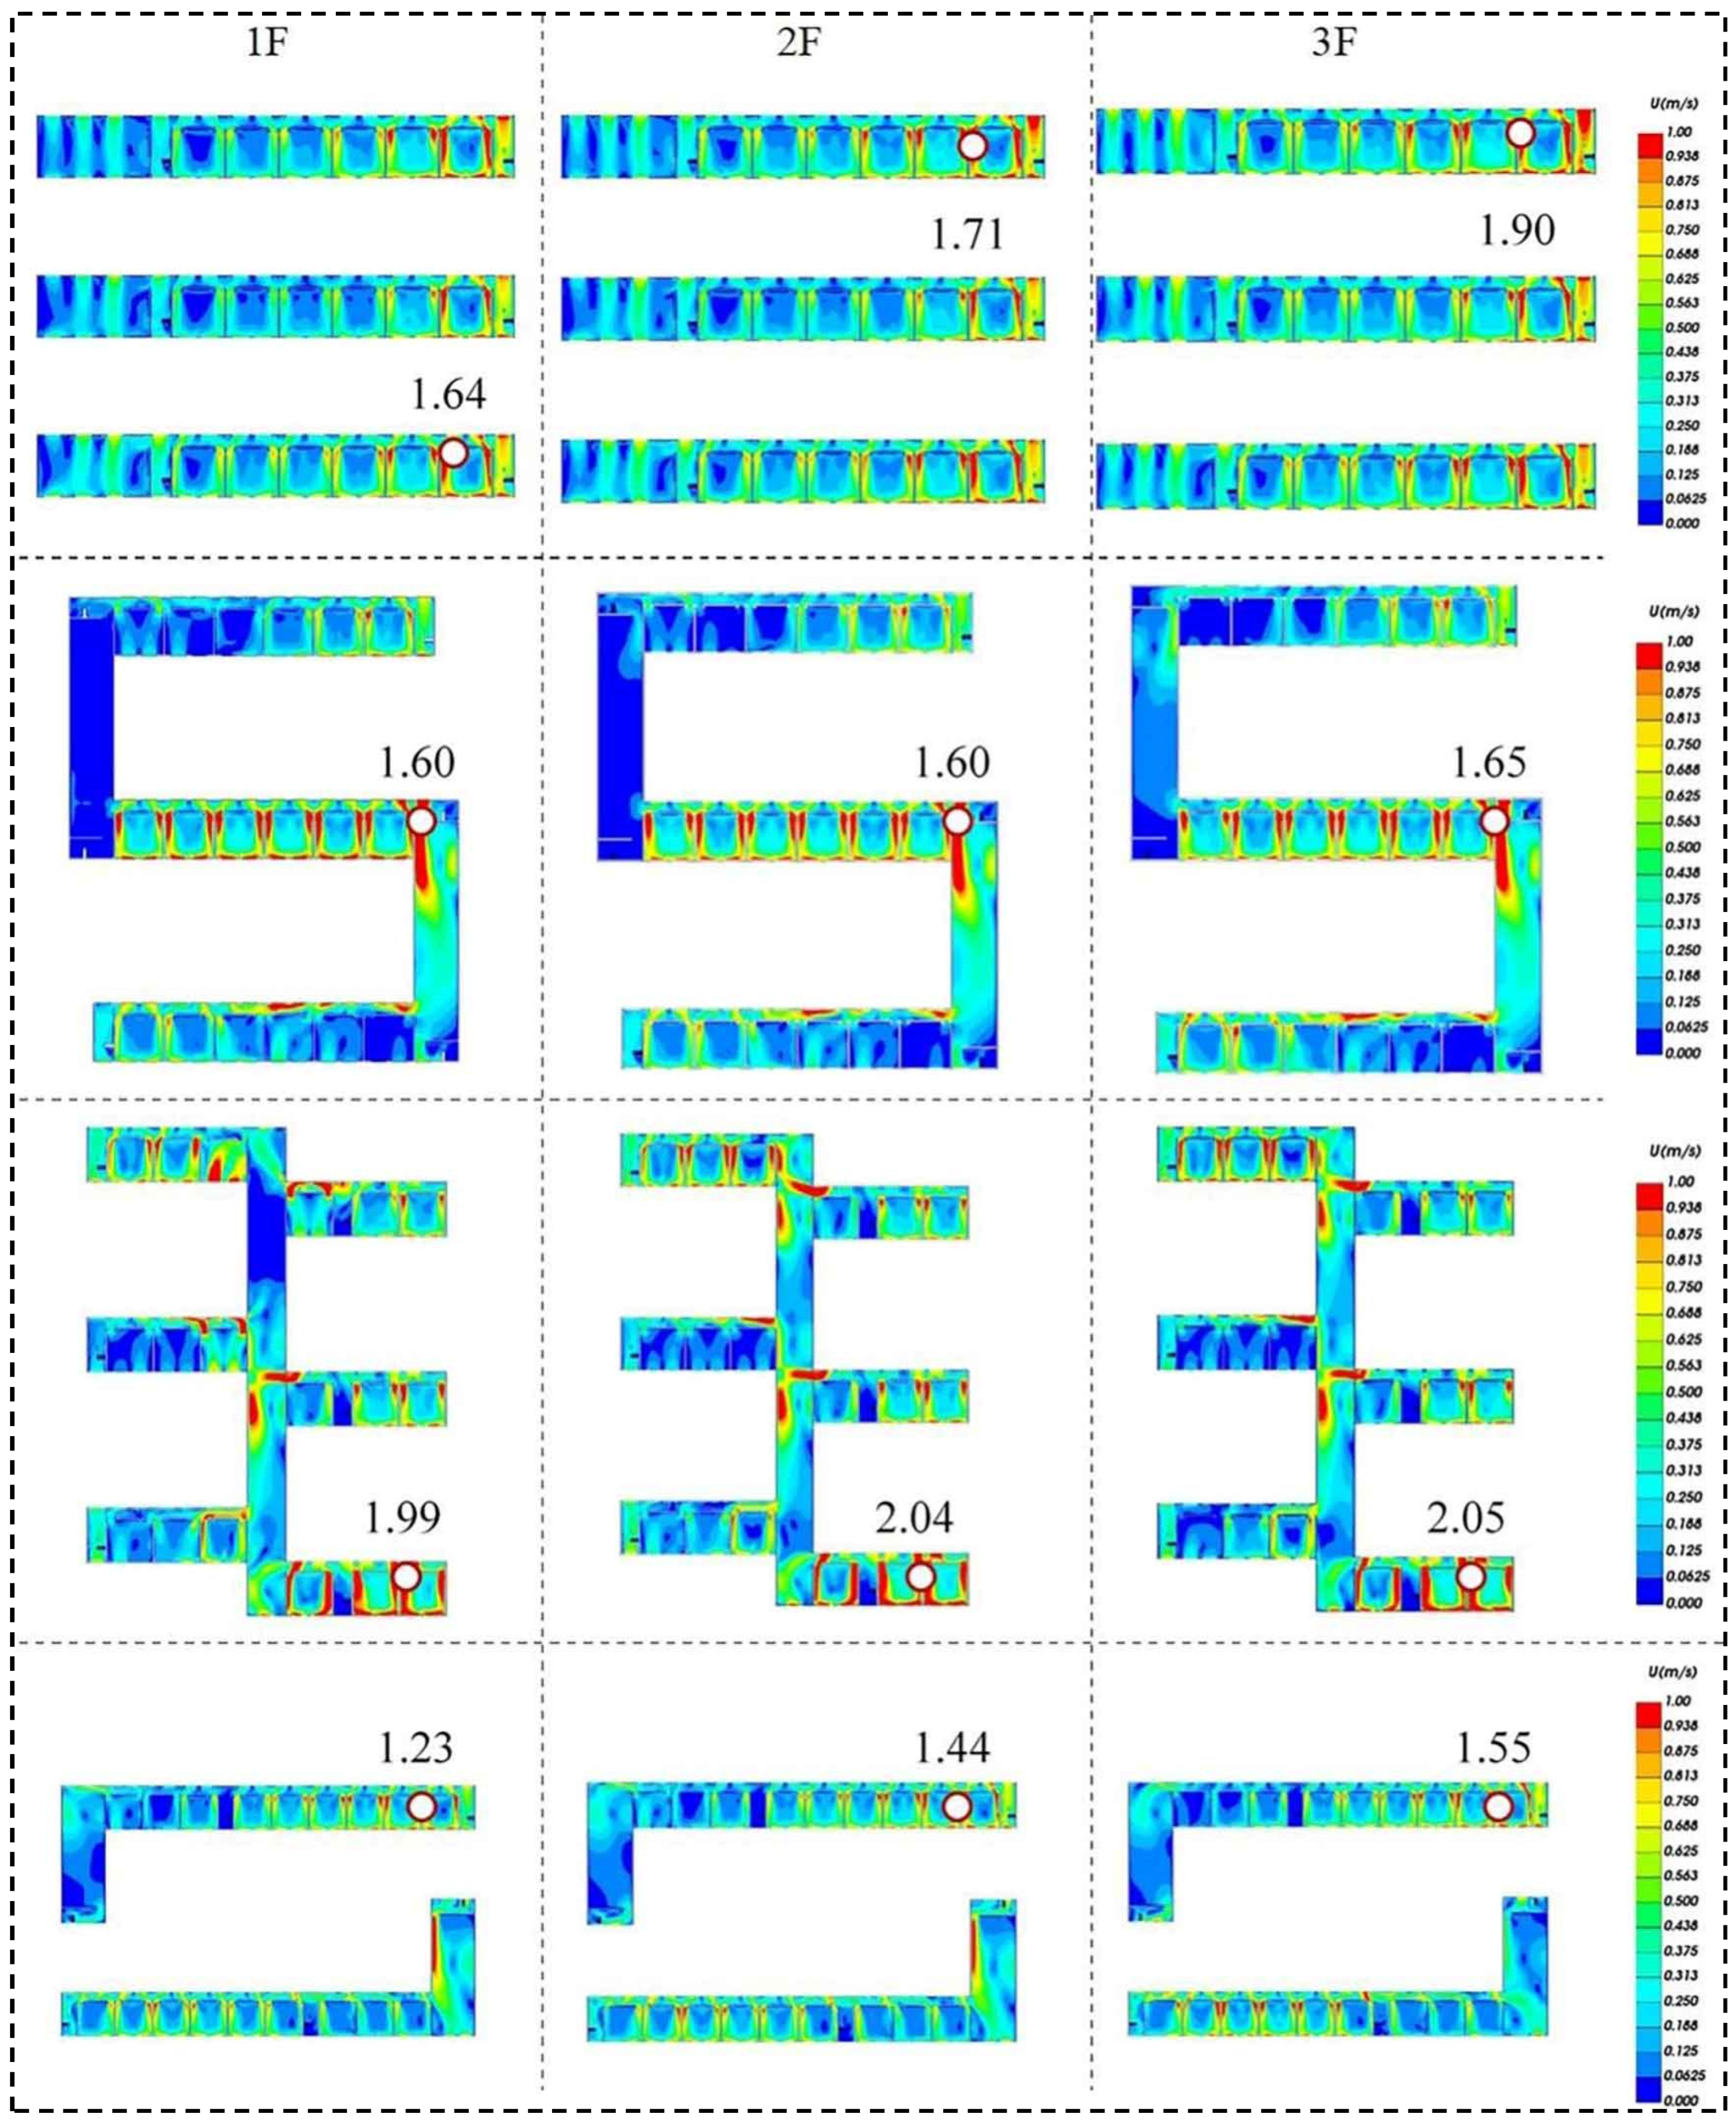
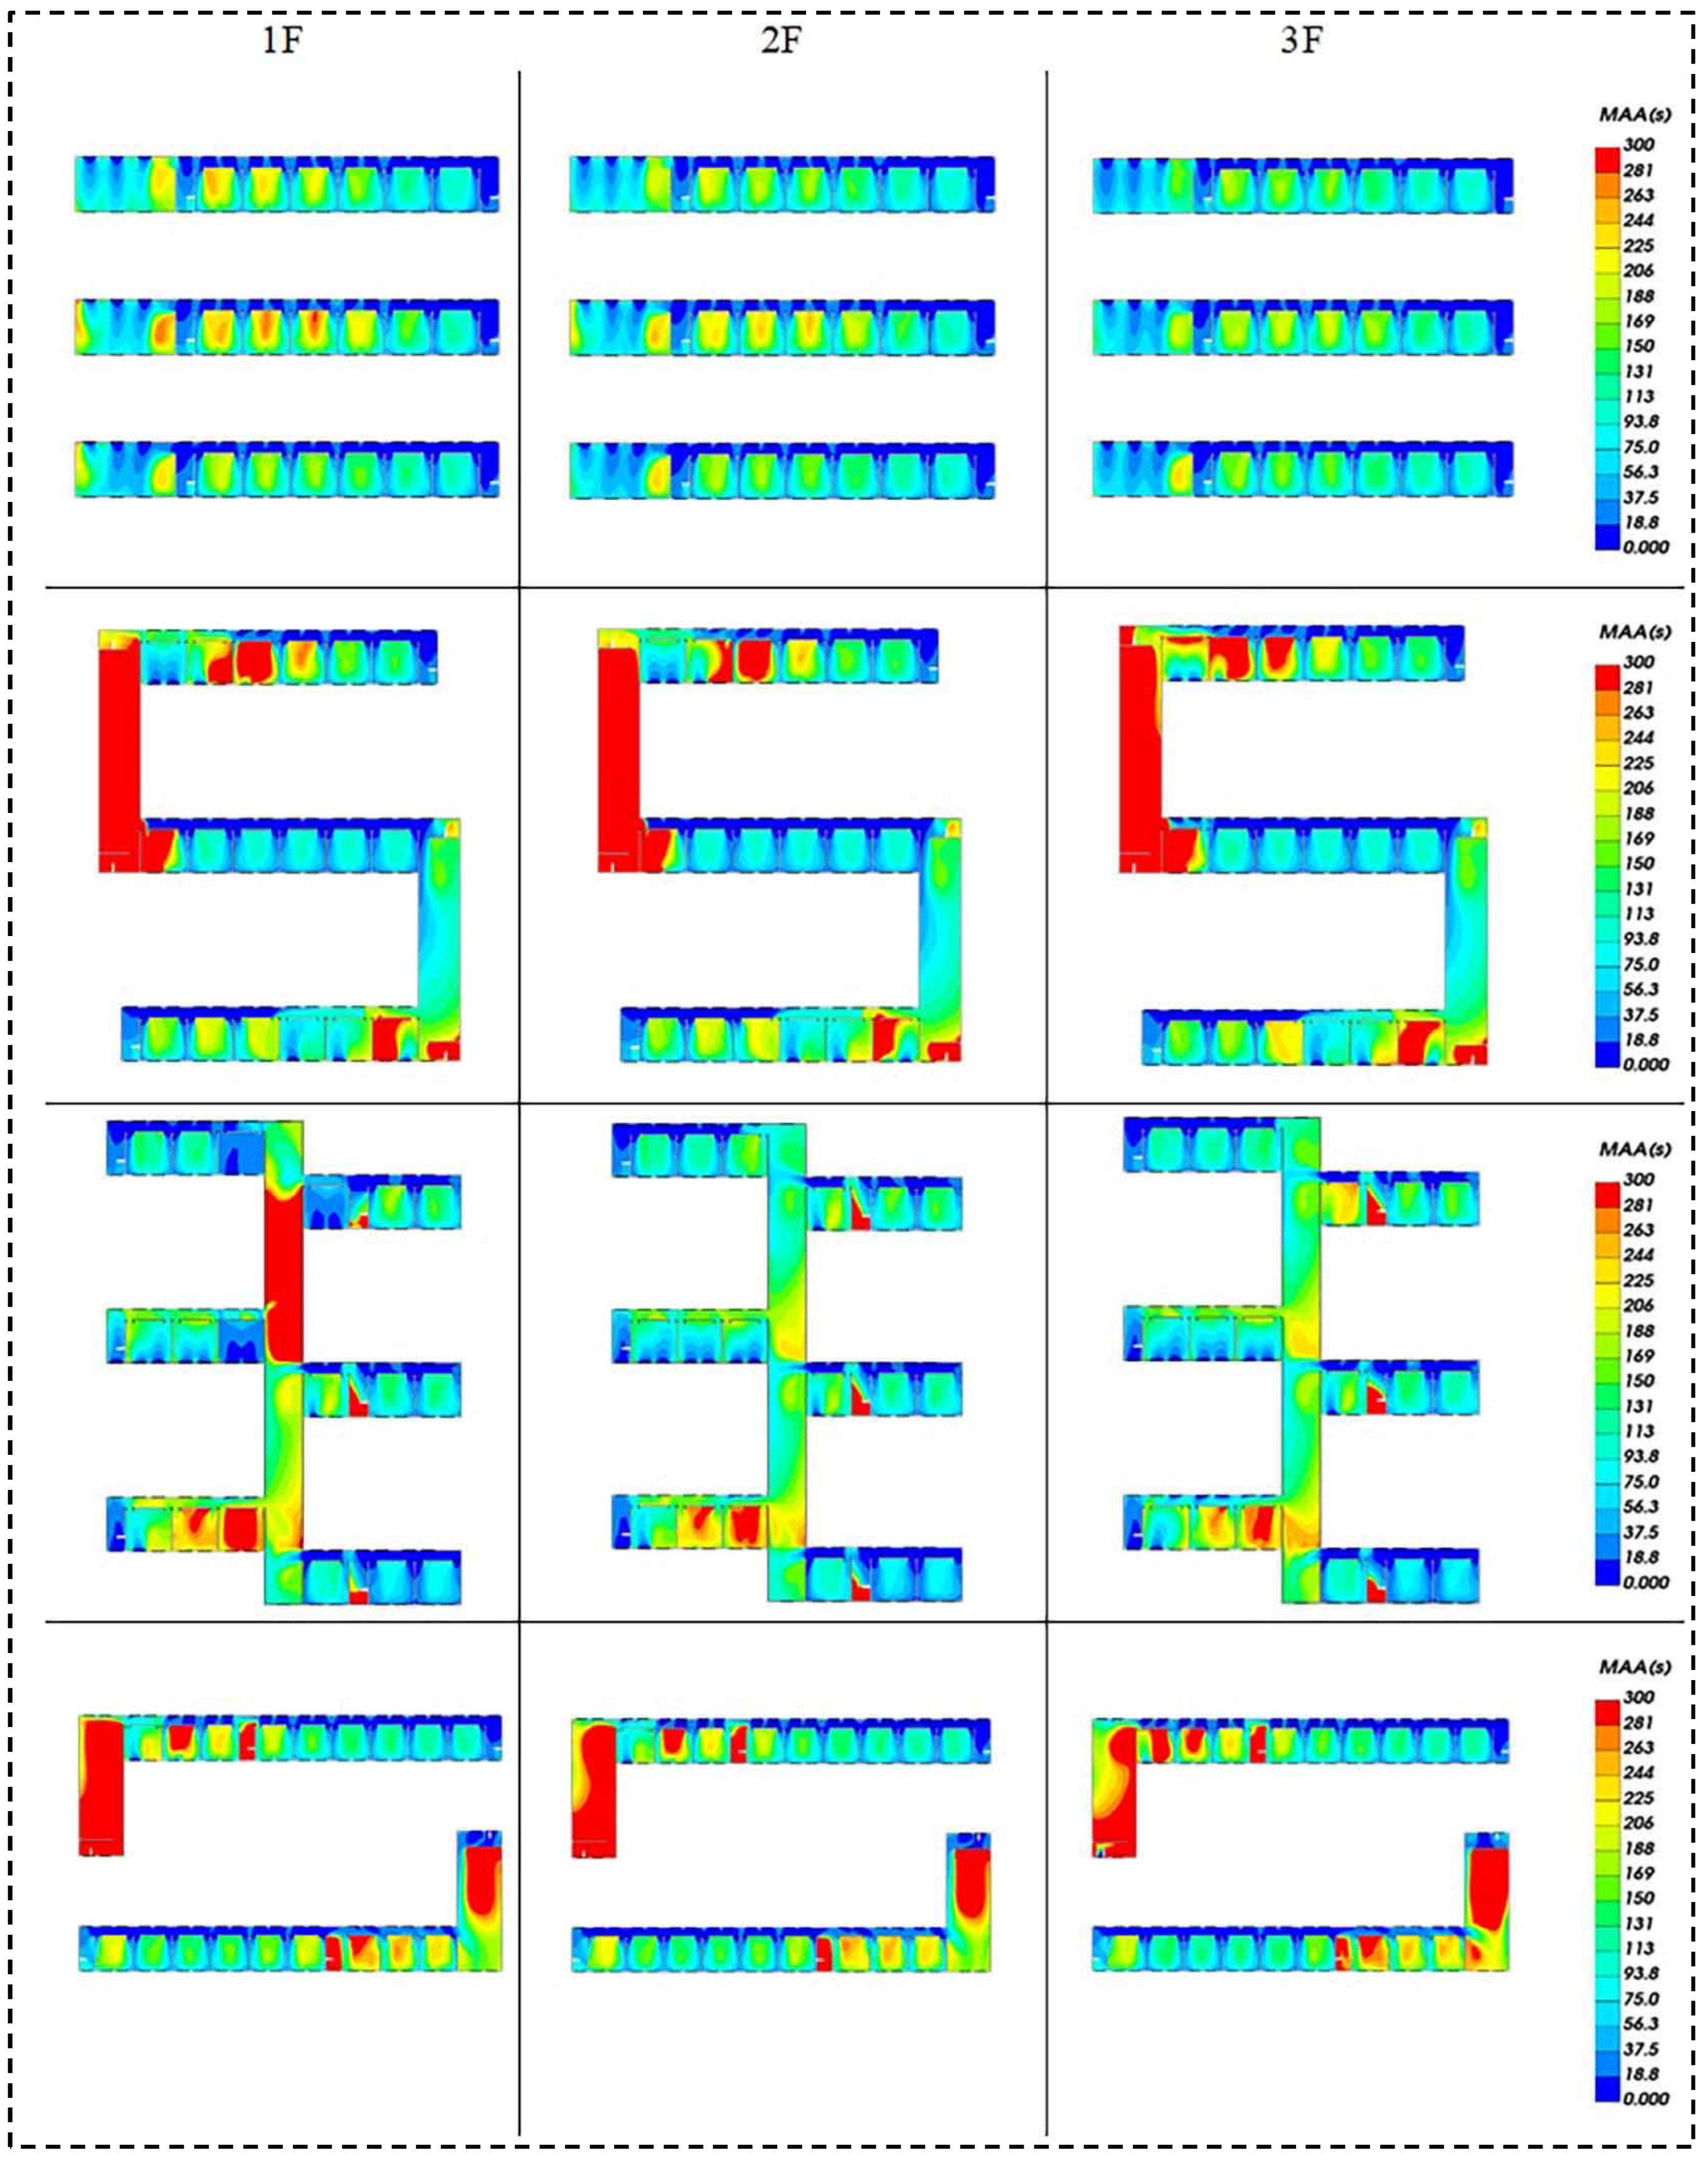
3.3. Internal Simulation Results

Regardless of winter or summer, ventilation is necessary to ensure the freshness of indoor air. Therefore, the evaluation indicators for indoor air quality generally include air exchange rate and air age. Meanwhile, as indoor wind speed has a significant impact on people’s activities, indoor airflow velocity is also one of the evaluation indicators in ensuring the freshness of indoor air. Based on the existing research results in Section 1, this study adopts 0.2–1 m/s as the indoor wind speed comfort evaluation index. The case project is located in Xi’an, where the dominant wind direction and wind speed are consistent in winter and summer, so there is no need to distinguish between winter and summer when evaluating indoor air quality.
Figure 13 shows the indoor wind speed contour plots of each floor of the teaching buildings for the four scenarios, with the maximum wind speed regions marked by white dots. In order to facilitate comparisons among the four scenarios, the legends in Figure 13 were kept the same. In the corridor areas, the red portions with wind speeds greater than 1 m/s are mainly concentrated near the outer windows and doors facing the windward direction. The maximum wind speed in classrooms generally occurs near the classroom door and near the outer windows. In these areas, when the windows or doors are opened, the wind rushes in instantaneously. Coupled with the relatively small opening area, this creates a certain canyon wind effect, resulting in faster wind speeds. Subsequently, the wind speed gradually decreases, and in some areas, it gradually drops to a still-air state (wind speed less than 0.2 m/s). As the number of floors increases, the maximum indoor wind speed in the four scenarios also increases. After extracting the area proportions of each region, the results are shown in Figure 14. It can be seen that in Scenarios 2 and 3, the areas with wind speeds less than 0.2 m/s are larger, accounting for 18.30% and 10.25% of the total indoor area, respectively. In these areas, the airflow velocity is too slow, leading to poor indoor air quality due to the inability to update the indoor air in time. The areas with wind speeds less than 0.2 m/s in Scenarios 1 and 4 are significantly smaller than in Scenarios 2 and 3, accounting for 3.48% and 4.25%, respectively. Simultaneously, the proportion of areas with wind speeds greater than 1 m/s in Scenarios 1 and 4 is also lower than in Scenarios 2 and 3, accounting for 2.30% and 1.36% respectively. In summary, scenarios 1 and 4 provide better indoor wind environments in terms of indoor wind speed performance.
Figure 15 displays the age distribution of air on each floor for the four scenarios. Typically, there is a direct relationship between air age and indoor airflow velocity, indicating that slower indoor airflow results in a higher air age, while faster flow leads to a lower air age. The indoor air quality conditions depicted in Figure 15 closely align with those in Figure 13. Scenarios 2 and 3 have a higher proportion of regions with slower internal airflow velocity, resulting in relatively higher air ages. The region with an air residence time ranging from 200 to 300 s is notably larger compared to Scenario 1. Although there is no significant difference in the proportion of stagnant areas between Scenario 4 and Scenario 1 (4.25% vs. 3.48%), the proportion of areas with an air age between 200–300 s in Scenario 4 is significantly higher than in Scenario 1. Therefore, Scenario 1 performs the best when evaluated from the perspective of air age.
Figure 16 illustrates the air exchange rates in classrooms for the four scenarios. Scenarios 1 and 4, which showed superior indoor wind speed and air age performance, also exhibit higher indoor air exchange rates. Scenarios 2 and 3 have lower air exchange rates compared to Scenarios 1 and 4.

4. Discussion

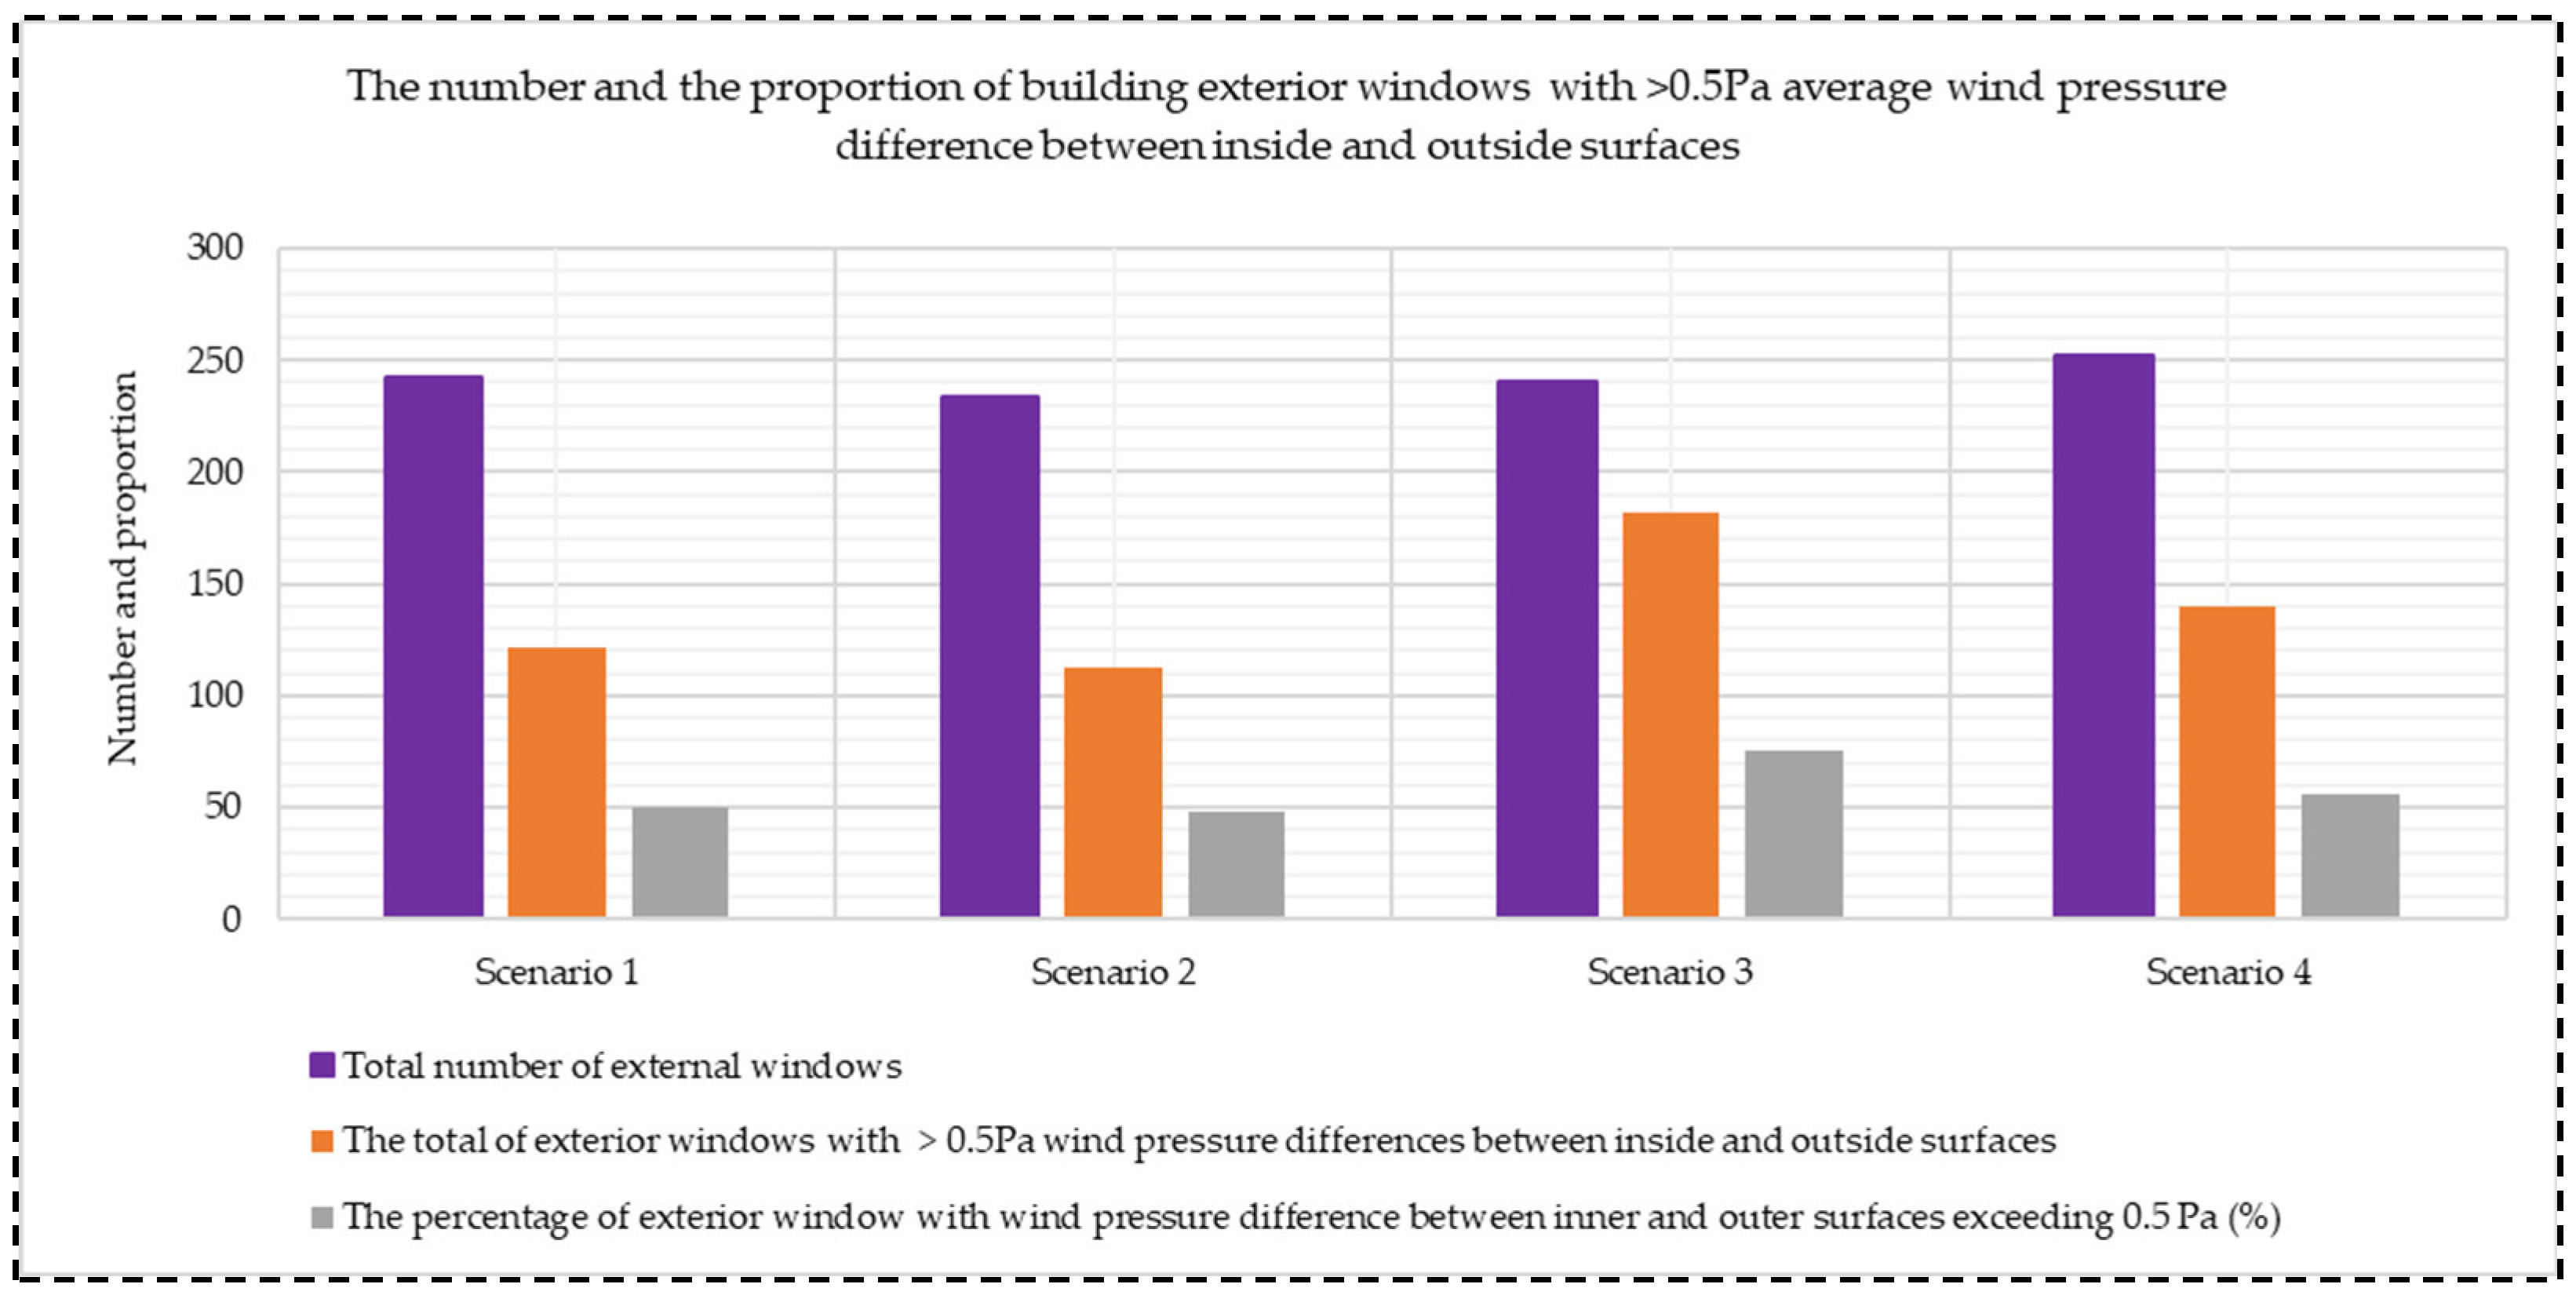
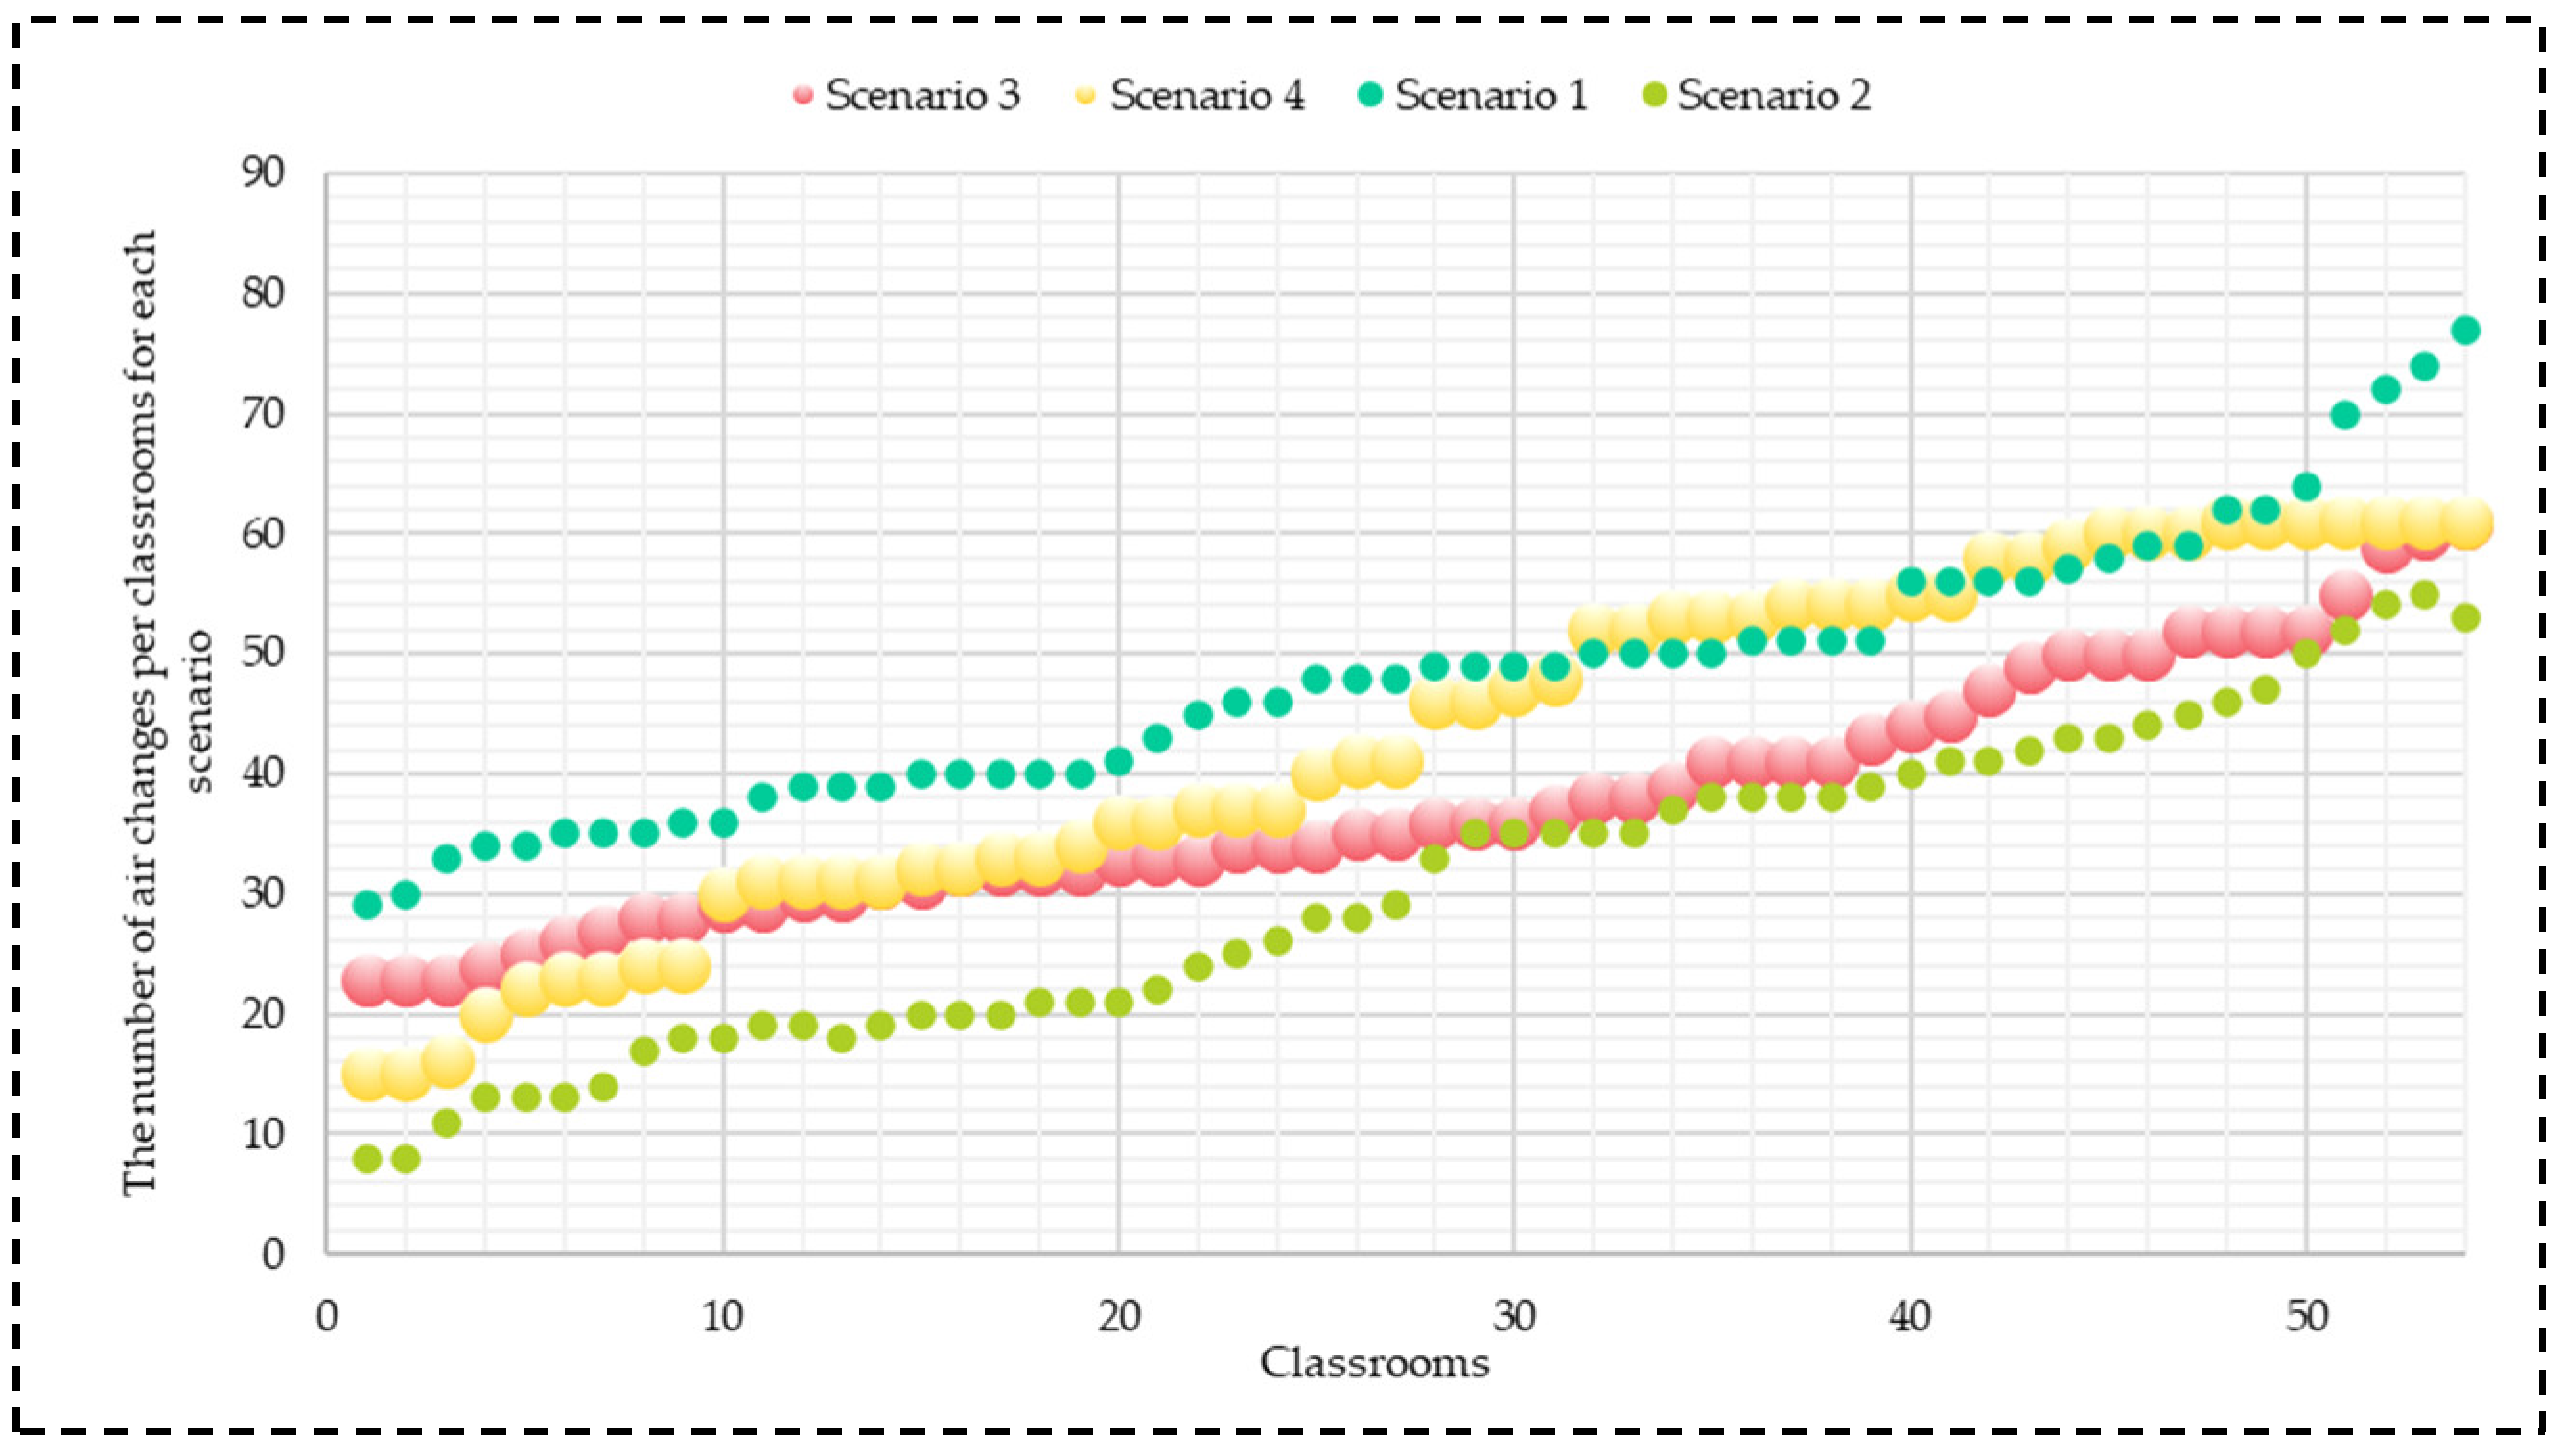
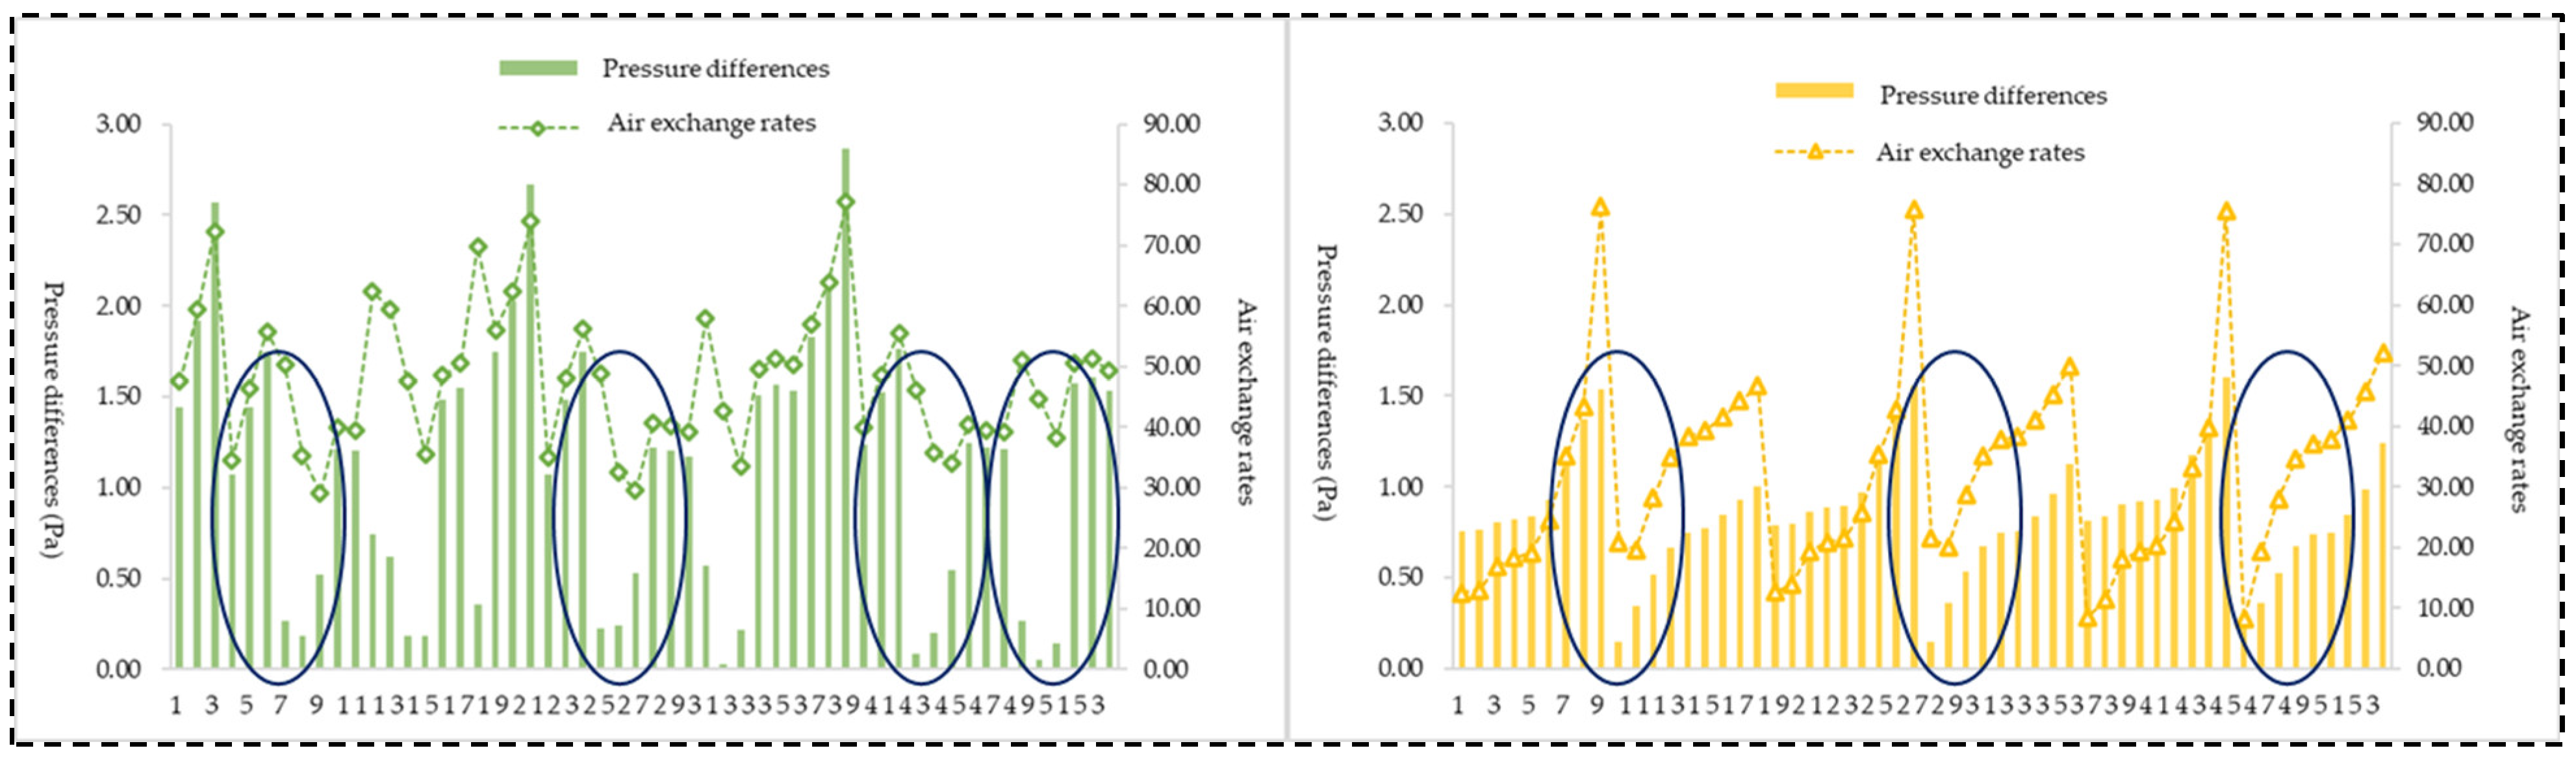
4.1. The Correlation between Indoor Air Exchange Rate and Wind Pressure Differential across Exterior Building Windows

Figure 17 and Figure 18 display the correlation between the wind pressure differential across window surfaces and the indoor air exchange rate for 54 classrooms in different scenarios. Row-by-row flow planning in Scenario 1 shows a notable positive link between the wind pressure difference at the windows and the interior air exchange rate. As the wind pressure differential increases, the interior air exchange rate likewise increases dramatically, showing a constant correlation between the two variables. The lack of wind blockage in Scenario 1’s floor planning enables the outdoor wind field to directly impact the indoor air exchange rate.
However, the positive correlation between the wind pressure difference and the air exchange rate is not as strong in Scenarios 2 and 4 as it is in Scenario 1. In some local variations, there is a certain degree of non-correlation. For example, in Scenario 2 (as indicated by the circled area in Figure 17), the air exchange rate of classrooms 13–19 actually decreases when the wind pressure difference at the exterior windows increases. In Scenarios 3 and 4, the changes in wind pressure difference and air exchange rate are generally consistent. However, there are instances where the air exchange rate increases significantly even when the wind pressure difference increases marginally, indicating non-correlation (as indicated by the circled area in Figure 18).
Scenario 3 exhibits a similar trend to Scenario 4, with basic consistency between the wind pressure difference and the air exchange rate. However, in some classrooms, the indoor air exchange rate increases even when the wind pressure difference between the interior and exterior surfaces of the windows is relatively small.
Therefore, only Scenario 1 maintains a strong positive correlation between the wind pressure difference of windows and the classroom air exchange rate. In contrast, the other three scenarios exhibit non-positively correlated phenomena. This is primarily attributed to the complexity of the building forms. The forms of Scenarios 2, 3, and 4 create enclosed and semi-enclosed spaces, where outdoor winds entering these spaces can create vortices or stagnant regions. This results in a smaller wind pressure difference between different facades of the building, leading to a decrease in air exchange rate even when the wind pressure difference on the external windows of classrooms exceeds 0.5 Pa.

4.2. Comprehensive Evaluation of Four Scenarios

Based on the simulation results in Section 3, the four scenarios were ranked on a scale of 1 to 4 for their performance in terms of winter, summer, and indoor wind environment evaluation indicators. A lower score signifies superior performance in external wind conditions and indoor ventilation effectiveness. Figure 19 presents the sorting results using distinct colors to facilitate readers’ comprehension. Scenario 1 outperformed the others, achieving a total score of 14. This is mainly because of the implementation of row-by-row floor planning, which enables wind to flow across the entire site, leading to outstanding performance in metrics such as outside wind speed, wind speed amplification factor, vortex areas, and windless regions. Therefore, interior wind environment indicators that have a positive correlation with these factors, such as air exchange rate and indoor wind speed, also showed good performance.
Scenario 2 performed the worst, mainly due to the adoption of zigzag floor planning. The building form significantly obstructs the wind, creating semi-enclosed spaces on both the windward and leeward sides. This prevents the wind from continuing to flow after entering these enclosed and semi-enclosed spaces. Therefore, Scenario 2 performed poorly in terms of outdoor wind speed, wind pressure difference between the windward and leeward façades of the building, and indoor wind speed.
Scenario 3 is similar to Scenario 2 but has a floor design with branching that divides the largely enclosed spaces in Scenario 2 into multiple smaller partially enclosed spaces. Therefore, when facing obstacles, the wind is more likely to sustain its flow. Scenario 3 shows a somewhat better performance than Scenario 2.
Scenario 4 utilizes enclosed floor planning; however, there are holes on the east and west sides to facilitate airflow in and out of the enclosed area. This guarantees that air circulation is maintained within the enclosed area. Scenario 4 outperformed Scenarios 2 and 3 in evaluating inside and outdoor wind conditions. This also offers guidance for enhancing Scenarios 2 and 3 by creating openings in the building structure to let the wind flow across the area, maintaining wind speed at a comfortable level and promoting airflow.

5. Conclusions

We have analyzed the primary school campus layouts in Xi’an and identified four common architectural floor plan forms based on existing design specifications and theories. Simulations were performed to examine the performance of four common campus layout forms in winter, summer, and indoor wind environments. This led to the discovery of the best layout scenario. The main findings of this study are as follows:
(1)
Regardless of the scenario adopted, in the downtown area, due to the dense surrounding buildings, there is a certain degree of wind obstruction and a deceleration effect on the prevailing wind, ensuring that the outdoor wind speed in winter can meet comfort requirements.
(2)
The adoption of row-by-row floor planning results in the best performance in both indoor and outdoor wind environments. This is primarily because, under the condition of the average outdoor wind speed being within the comfort range, row-by-row floor planning allows the wind to easily traverse the entire site, effectively improving indicators such as outdoor wind speed, wind speed amplification factor, vortex areas, and still wind areas. At the same time, it also facilitates indoor air exchange rates and wind speed.
(3)
The scenario with zigzag floor planning performed the worst, primarily because the building form significantly obstructs the wind, preventing it from continuing to flow after entering the building. This negatively impacts indicators such as outdoor wind speed, wind pressure difference between the windward and leeward façades of the building, and indoor wind speed. Branching floor planning is similar to zigzag floor planning, but it breaks down the larger semi-enclosed spaces in zigzag floor planning, increasing the likelihood of the wind continuing to flow. Therefore, its performance is better.
(4)
When adopting enclosed floor planning, it is necessary to leave gaps on the windward and leeward sides to ensure airflow within the enclosed space. However, due to the funneling effect within the gaps, the wind speed may increase. Therefore, the gaps should be as large as possible.
In conclusion, in the design of primary school campuses, it is crucial to adopt row-by-row floor planning to the greatest extent possible, enabling wind to traverse the entire site. When implementing zigzag floor planning, branching floor planning, or enclosed floor planning, it is necessary to create gaps on the windward and leeward sides to ensure airflow while avoiding excessively small gaps that could lead to excessive wind speeds within the gaps.
This study identified four representative floor plan types and assessed their impact on the wind environment and classroom ventilation. The findings underscore the potential of these four types to provide universal guidance for the design of primary school building layouts and floor plans, offering valuable recommendations for future campus planning and construction. This study also has some limitations. For instance, only four typical models were selected for analysis, excluding more complex architectural floor plan forms for campus buildings. Additionally, only the dominant wind directions in winter and summer were chosen as the study conditions, leaving wind environment performance under other wind directions and speeds as an area worthy of further exploration in future work. Future research should further address the limitations of current studies by enhancing model diversity and incorporating a diverse range of wind directions and speed conditions. This approach will contribute to the in-depth advancement of research in the field of campus building wind environments.

Author Contributions

Data curation, T.H.; Formal analysis, M.L.; Funding acquisition, Z.P.; Investigation, M.L.; Methodology, Z.P.; Project administration, Z.P.; Resources, M.L.; Validation, M.J. and M.L.; Visualization, N.J.; Writing—original draft, Z.P.; Writing—review & editing, Z.P. and X.H. All authors have read and agreed to the published version of the manuscript.

Funding

This research was funded by the Natural Science Foundation of Shandong Province, grant number ZR2022QE280.

Institutional Review Board Statement

Not applicable.

Informed Consent Statement

Not applicable.

Data Availability Statement

The raw data supporting the conclusions of this article will be made available by the authors on request.

Conflicts of Interest

The authors declare no conflicts of interest.

References

  1. Tan, X.; Zhang, Y.; Shao, H. Healthy China 2030, a breakthrough for improving health. Glob. Health Promotion 2019, 26, 96–99. [Google Scholar] [CrossRef] [PubMed]
  2. GB/T 51356-2019; Green Campus Evaluation Standard. China Construction Industry Press: Beijing, China, 2019.
  3. Li, Y. Green Building Design: Wind Environment of Building; Tongji University Press: Shanghai, China, 2014. [Google Scholar]
  4. Qian, F.; Yang, L. Green campus environmental design based on sustainable theory. J. Clean Energy Technol. 2018, 6, 159–164. [Google Scholar] [CrossRef]
  5. Yang, L.; Liu, X.; Qian, F.; Niu, S. Research on the wind environment and air quality of parallel courtyards in a university campus. Sustain. Cities Soc. 2020, 56, 102019. [Google Scholar] [CrossRef]
  6. Sadrizadeh, S.; Yao, R.; Yuan, F.; Awbi, H.; Bahnfleth, W.; Bi, Y.; Li, B. Indoor air quality and health in schools: A critical review for developing the roadmap for the future school environment. J. Build. Eng. 2022, 57, 104908. [Google Scholar] [CrossRef]
  7. Wu, Y.; Wu, S.; Qiu, X.; Wang, S.; Yao, S.; Li, W.; Guo, Y. Integrated evaluation method of the health-related physical environment in urbanizing areas: A case study from a university campus in China. Front. Public Health 2022, 10, 801023. [Google Scholar] [CrossRef]
  8. Nag, P.K.; Nag, P.K. Sick building syndrome and other building-related illnesses. Off. Build. Health Saf. Environ. 2019, 53–103. [Google Scholar]
  9. Liu, S.; Pan, W.; Cao, Q.; Long, Z.; Jiang, Y.; Chen, Q. CFD simulations of natural cross ventilation through an apartment with modified hourly wind information from a meteorological station. Energy Build. 2019, 195, 16–25. [Google Scholar] [CrossRef]
  10. He, Y.; Schnabel, M.A.; Mei, Y. A novel methodology for architectural wind environment study by integrating CFD simulation, multiple parametric tools and evaluation criteria. Build. Simul. 2020, 13, 609–625. [Google Scholar] [CrossRef]
  11. Hong, B.; Lin, B. Numerical studies of the outdoor wind environment and thermal comfort at pedestrian level in housing blocks with different building layout patterns and trees arrangement. Renew. Energy 2015, 73, 18–27. [Google Scholar] [CrossRef]
  12. Blocken, B.; Carmeliet, J.; Stathopoulos, T. CFD evaluation of wind speed conditions in passages between parallel buildings—Effect of wall-function roughness modifications for the atmospheric boundary layer flow. J. Wind Eng. Ind. Aerodyn. 2007, 95, 941–962. [Google Scholar] [CrossRef]
  13. Awol, A.; Bitsuamlak, G.T.; Tariku, F. Numerical estimation of the external convective heat transfer coefficient for buildings in an urban-like setting. Build. Environ. 2020, 169, 106557. [Google Scholar] [CrossRef]
  14. Hunter, L.J.; Johnson, G.T.; Watson, I.D. An investigation of three-dimensional characteristics of flow regimes within the urban canyon. Atmos. Environ. Part B Urban Atmos. 1992, 26, 425–432. [Google Scholar] [CrossRef]
  15. Kubota, T.; Miura, M.; Tominaga, Y.; Mochida, A. Wind tunnel tests on the relationship between building density and pedestrian-level wind velocity: Development of guidelines for realizing acceptable wind environment in residential neighborhoods. Build. Environ. 2008, 43, 1699–1708. [Google Scholar] [CrossRef]
  16. Mittal, H.; Sharma, A.; Gairola, A. Numerical simulation of pedestrian level wind flow around buildings: Effect of corner modification and orientation. J. Build. Eng. 2019, 22, 314–326. [Google Scholar] [CrossRef]
  17. Driss, S.; Driss, Z.; Kammoun, I.K. Numerical simulation and wind tunnel experiments on wind-induced natural ventilation in isolated building with patio. Energy 2015, 90, 917–925. [Google Scholar] [CrossRef]
  18. Ghaffarianhoseini, A.; Berardi, U.; Ghaffarianhoseini, A. Thermal performance characteristics of unshaded courtyards in hot and humid climates. Build. Environ. 2015, 87, 154–168. [Google Scholar] [CrossRef]
  19. Passe, U.; Battaglia, F. Designing Spaces for Natural Ventilation: An Architect’s Guide; Routledge: London, UK, 2015. [Google Scholar]
  20. Smith, P.F. Architecture in a Climate of Change, 1st ed.; Routledge: London, UK, 2001. [Google Scholar]
  21. Xie, X.; Sahin, O.; Luo, Z.; Yao, R. Impact of neighborhood-scale climate characteristics on building heating demand and night ventilation cooling potential. Renew. Energy 2020, 150, 943–956. [Google Scholar] [CrossRef]
  22. Wang, Z.; Gao, Y.; Meng, Q.; Zhao, L.; Jin, L. Research on the Relationship between Building Complex Layout and Natural Ventilation. Build. Sci. 2007, 23, 24–27+75. [Google Scholar]
  23. Gan, T.; Ying, X.; Shen, J. Design of Primary School Campus Layout Form Based on Wind Environment Optimization. Archit. Cult. 2019, 4, 110–111. [Google Scholar]
  24. Niu, J.; Liu, J.; Lee, T.C.; Lin, Z.J.; Mak, C.; Tse, K.T.; Kwok, K.C. A new method to assess spatial variations of outdoor thermal comfort: Onsite monitoring results and implications for precinct planning. Build. Environ. 2015, 91, 263–270. [Google Scholar] [CrossRef]
  25. Xu, X.; Wu, Y.; Wang, W.; Hong, T.; Xu, N. Performance-driven optimization of urban open space configuration in the cold-winter and hot-summer region of China. Build. Simul. 2019, 12, 411–424. [Google Scholar] [CrossRef]
  26. Liu, K.; Xu, X.; Zhang, R.; Kong, L.; Wang, W.; Deng, W. Impact of urban form on building energy consumption and solar energy potential: A case study of residential blocks in Jianhu, China. Energy Build. 2023, 280, 112727. [Google Scholar] [CrossRef]
  27. GB 50099-2011; Code for Design of Primary and Secondary Schools. China Construction Industry Press: Beijing, China, 2011.
  28. Peng, Z.; Deng, W.; Tenorio, R. An integrated low-energy ventilation system to improve indoor environment performance of school buildings in the cold climate zone of China. Build. Environ. 2020, 182, 107153. [Google Scholar] [CrossRef]
  29. Peng, Z.; Cheng, Y.; Jiang, M.; Shu, S.; Geng, X. Potential combination strategies to establish a low-energy ventilation system for school buildings in the cold climate zone of China—A demand-oriented review. J. Build. Eng. 2023, 76, 107065. [Google Scholar] [CrossRef]
  30. Sun, H. Discussion on the application of natural ventilation technology in primary and secondary school architectural design. China’s New Technol. Prod. 2011, 2, 270. [Google Scholar]
  31. Gong, C.; Wang, X. Research on the Impact of Architectural Layout on the Wind Environment of Residential Communities. Build. Sci. 2014, 30, 6–12. [Google Scholar]
  32. Wang, D.; Zhang, J.; Ji, X.; Tian, G.; Liu, W. Optimization design of a university’s planning scheme based on PHOENICS simulation. Jiangsu Archit. 2016, 003, 9–11. [Google Scholar]
  33. Xu, Y.; Zhang, G.; Yan, C.; Wang, G.; Jiang, Y.; Zhao, K. A two-stage multi-objective optimization method for envelope and energy generation systems of primary and secondary school teaching buildings in China. Build. Environ. 2021, 204, 108142. [Google Scholar] [CrossRef]
  34. Wang, H.; Chen, S.; Tang, J. Numerical simulation and analysis of wind environment in group buildings. Mech. Pract. 2006, 28, 14–18. [Google Scholar]
  35. Yuan, J.; Yuan, J.; Miao, Y. The impact of multi-story building layout on wind environment in mountainous conditions. J. Shenyang Jianzhu Univ. (Nat. Sci. Ed.) 2021, 37, 330–337. [Google Scholar]
  36. Liang, T.; He, R.; Chen, K.; Tian, G. Research on the Effect of Campus Green Space Layout on Microclimate. J. Henan Agric. Univ. 2017, 51, 414–420. [Google Scholar]
  37. GB/T 50378-2019; Green Building Evaluation Standard. China Construction Industry Press: Beijing, China, 2019.
  38. Son, S.; Jang, C.M. Air ventilation performance of school classrooms with respect to the installation positions of return duct. Sustainability 2021, 13, 6188. [Google Scholar] [CrossRef]
  39. Gong, N.; Tham, K.W.; Melikov, A.K.; Wyon, D.P.; Sekhar, S.C.; Cheong, K.W. The acceptable air velocity ranges for local air movement in the tropics. HVAC&r Res. 2006, 12, 1065–1076. [Google Scholar]
  40. Khedari, J.; Yamtraipat, N.; Pratintong, N.; Hirunlabh, J. Thailand ventilation comfort chart. Energy Build. 2000, 32, 245–249. [Google Scholar] [CrossRef]
  41. Rohles, F.H. The effects of air movement and temperature on the thermal sensations of sedentary man. ASHRAE Trans. 1974, 80, 101–119. [Google Scholar]
  42. Cândido, C.; De Dear, R.J.; Lamberts, R.; Bittencourt, L. Air movement acceptability limits and thermal comfort in Brazil’s hot humid climate zone. Build. Environ. 2010, 45, 222–229. [Google Scholar] [CrossRef]
  43. Huang, L.; Ouyang, Q.; Zhu, Y.; Jiang, L. A study about the demand for air movement in warm environment. Build. Environ. 2013, 61, 27–33. [Google Scholar] [CrossRef]
  44. Chen, G. LVJIANSWARE: Be a pioneer in building simulation technology. China Constr. Informatiz. 2018, 19, 64–65. [Google Scholar]
  45. Xi’an Statistics Bureau. Xi’an Statistical Yearbook 2023; Xi’an Statistics Bureau: Xi’an, China, 2023. [Google Scholar]
Figure 1. The building distribution patterns of a primary school campus.
Applsci 14 07174 g001
Figure 2. Floor planning of school buildings.
Applsci 14 07174 g002
Figure 3. Normality test for Shape factor.
Applsci 14 07174 g003
Figure 4. Scenarios for floor planning layout.
Applsci 14 07174 g004
Figure 5. Floor plans for each scenario.
Applsci 14 07174 g005
Figure 6. Wind Speed Contour Map at 1.5 m Height Outdoors in Winter.
Applsci 14 07174 g006
Figure 7. Wind Speed Amplification Factor Contour Map at 1.5 m Height in Winter.
Applsci 14 07174 g007
Figure 8. Comparison of Wind Pressure on Windward and Leeward Surfaces of the Four Scenarios Under Winter Operating Conditions.
Applsci 14 07174 g008
Figure 9. Wind Speed Vector Map at a height of 1.5 Meters, Horizontal Plane.
Applsci 14 07174 g009
Figure 10. Distribution Map of Wind-Free Zone Distribution at a height of 1.5 m.
Applsci 14 07174 g010
Figure 11. The proportion of the wind-free zone area to the total campus land area.
Applsci 14 07174 g011
Figure 12. The number and the proportion of the building’s exterior windows with an average wind pressure difference >0.5 Pa between the inside and outside surfaces.
Applsci 14 07174 g012
Figure 13. Wind speed distributions inside school buildings.
Applsci 14 07174 g013
Figure 14. Proportions of areas with wind speed not meeting the comfort criteria.
Applsci 14 07174 g014
Figure 15. Indoor Air Age Distribution.
Applsci 14 07174 g015
Figure 16. The number of air changes per classroom for each scenario.
Applsci 14 07174 g016
Figure 17. The correlation between the indoor air change rate and the wind pressure differential across the building’s exterior windows in Scenarios 1 and 2.
Applsci 14 07174 g017
Figure 18. The correlation between the indoor air change rate and the wind pressure differential across the building’s exterior windows in Scenarios 3 and 4.
Applsci 14 07174 g018
Figure 19. Comprehensive evaluation of the four scenarios.
Applsci 14 07174 g019
Table 1. Statistical Analysis of shape coefficient and Window-to-Wall Ratio in investigated school buildings.
Shape
Coefficient
Window-to-Wall Ratios
SouthernWesternNorthernEastern
Mean0.260.320.250.330.22
Median0.270.320.240.300.23
Mode0.220.320.280.240.28
Table 2. Parameters of the typical model.
Typical Values3D Model
Length of the typical model56Applsci 14 07174 i001
Width of the typical model13
Height of the typical model14.4
Building shape coefficient0.25
Window-to-wall ratiosSouthern0.32
Western0.26
Eastern0.26
Northern0.27
Table 3. Design requirements for the selected school.
Scenario 1Scenario 2Scenario 3Scenario 4
IndicatorsRow-by-row floor planningZigzag
floor planning
Branching floor planningEnclosed
floor planning
Land area16,800 m2
Total floor area7230 m27244 m27526 m27255 m2
Floor area ratio0.430.430.450.43
Building density0.140.140.150.14
Building surface area in windward direction2860.92 m22813.40 m22987.28 m22757.24 m2
Number of external windows242234240252
Ratio of window areas divided by floor areas of classrooms0.70.70.70.7
Table 4. Wind Directions and frequencies in Xi’an throughout the year and in individual months [45].
Prevailing Wind DirectionFrequencyFrequency of Northeast-Biased WindsAverage Wind Speed
JanuaryENE11%22%2.5 m/s
JulyENE17%30%2.5 m/s
AnnuallyENE14%26%1.8 m/s
Table 5. Mesh used for simulations.
Type of GridsSize of Meshes
Regular gridsArc Precision (m)0.24
Initial grid (m)8.0
The smallest subdivision level1
The largest subdivision level2
Ground gridsThe subdivision levels in the far field1
The subdivision levels in the near field2
Boundary layer gridsThe number of boundary layers that are close to the ground surfaces2
The number of boundary layers that are close to the surfaces of buildings0
Number of cells: 2,377,463
Table 6. Wind Pressure Difference between Windward and Leeward Surfaces in Winter.
ScenariosAverage Windward Window Pressure (Pa)Average Leeward Window Pressure (Pa)The Difference in Average Wind Pressure between the Windward and Leeward Sides of the Window (Pa)
1−0.02−0.860.84
2−0.05−1.761.71
3−0.43−1.170.74
4−0.33−1.391.06
Disclaimer/Publisher’s Note: The statements, opinions and data contained in all publications are solely those of the individual author(s) and contributor(s) and not of MDPI and/or the editor(s). MDPI and/or the editor(s) disclaim responsibility for any injury to people or property resulting from any ideas, methods, instructions or products referred to in the content.

