
Concept of Early Prediction and Identification of Truck Vehicle Failures Supported by In-Vehicle Telematics Platform Based on Abnormality Detection Algorithm

Abstract
:1. Introduction
- During the preparation phase:
- A fleet suitable for transporting AILs;
- Proper transport means equipped with axle load monitoring systems, speed control systems for the route, and systems for checking their condition [4].
- During the organizational phase:
- Taking into account the terrain shape (road geometry) for the transport route, as increased complexity can cause driver fatigue, increase the likelihood of the load’s center of gravity shifting, etc.;
- Choosing the appropriate route and timing for transport, considering specific road infrastructure elements, including potential emergency parking spots, refueling stops, possible detour routes, etc.;
- Preparing the load for transport, considering how it reacts to adverse weather conditions during the transport;
- Securing AILs to minimize the risk of it falling or the Semi-Tractor-Trailer (STT) tipping;
- Developing an incident management plan (policies, procedures, recommendations), including contingency plans for incidents such as breakdowns, fuel/oil spills, accidents, etc.
- During transport operations:
- Ensuring adherence to the transport schedule;
- Identifying emerging threats to ensure the safety of all road users;
- Using necessary devices (e.g., securing, communication) during the transport of AILs.

| LGV/HGV | Tractor Truck with One Low-Bed Trailer | Tractor Truck with Two Low-Bed Trailers |
|---|---|---|
 |  |  |
| Requires equipping with markings and warning lights. | Requires a Transport Execution Plan for any transport route. | Requires a Transport Execution Plan. The selected route must cover the minimum distance. |
| Vehicle characteristics: Axle load—normative Width up to 3.2 m Length up to 15 m Height up to 4.3 m | Vehicle characteristics: Speed: v ≤ 65 km/h—highways v ≤ 56 km/h—4-lane roads v ≤ 48 km/h—2-lane roads Load characteristics: Width ≤ 3.2 m Length ≤ 18.75 m Height ≤ 4.5 m Mass ≤ 60 t axle load: ≤15 t | Vehicle characteristics: Speed: v ≤ 5 km/h (remote control), v ≤ 25 km/h (manual control) Load characteristics: Width 3.2–6.5 m Length ≥ 18.75 m Height ≥ 4.5 m AIL mass ≤ 5000 t axle load: ≤15 t data 1 |
- STT rollover. Oversized loads must be properly balanced and secured, as loading them leads to a sudden increase in the weight of the STT and a shift in the center of gravity. This can result in the instability of the STT, increasing the risk of crushing, cracking, or other damage to the transported load due to the tipping or rollover of the STT [9,10].
- Tire blowouts. Loading an STT with a super-heavy load can cause excessive strain, stretching, and blowouts of tires during AIL transport [11].
- Failure to break in time. Large trucks require more time to stop. When loaded, the mass of the STT increases further, extending this time even more. When a driver relies solely on their intuition, an STT with an emergency braking system can lead to collisions.
- Jackknife accidents occur when the trailer moves at a different speed than the tractor. It results in the STT folding in a manner similar to a jackknife, with the trailer skewed at a 90-degree angle to the tractor. This can lead to rollovers or collisions with vehicles moving next to the STT (Figure 1).
2. Basic Propositions and Research Objectives
- Identifying defects, manufacturing faults, and procedural breaches (e.g., load securing);
- Detecting anomalies (both isolated and continuous) to prevent vehicle component failures;
- Recognizing signs of cyberattacks on the diagnostic system within the CPS (Cyber Physical System) block;
- Predicting catastrophic events in each STT component;
- Detecting critical steering errors impacting the work schedule.
3. Related Work/Literature Studies
- Early days. Initially, road freight transport utilized basic monitoring systems to measure engine parameters such as RPM, fuel consumption, and exhaust gas temperature.
- Second half of the 20th century. Advances in technology led to the introduction of more sophisticated monitoring systems with sensors for braking, tire pressure, and exhaust emissions.
- Early 21st century. The integration of electronic control units (ECUs) in trucks enabled more extensive monitoring through On-Board Diagnostic (OBD) systems. These systems utilize internal Fault Detection and Diagnosis (FDD) networks to monitor operational parameters and On-Board Computers (OBCs) to collect, record, process, and transmit data to drivers while controlling the operation of all components and detecting possible anomalies.
- Current developments. The rapid increase in monitored components has led to longer wiring and more connectors, which has impacted the reliability of monitoring systems. To address this issue, Controller Area Network (CAN) buses have been introduced. These include the serial Local Interconnect Network (LIN) and the ring-based Media Oriented System Transport (MOST), both facilitating bidirectional communication.
- Supporting the daily activities of drivers through periodic monitoring of vehicle technical conditions, including:
- Supporting managers in decision-making regarding planning and adjusting transport and maintenance operations in response to client requirements or incidents on transport routes that cause unplanned stops. Managers who have current information are better equipped to avoid planning mistakes, accelerate report preparation, and provide detailed geographical insights [25,26].
- Enabling departments within the Transport & Logistics (T&L) sector to continuously monitor transport operations, streamline technical inspection scheduling, and assess maintenance downtime. Early identification of vehicle reliability issues facilitates timely preventive maintenance and repairs, preventing vehicles from becoming inoperative [20,27,28].
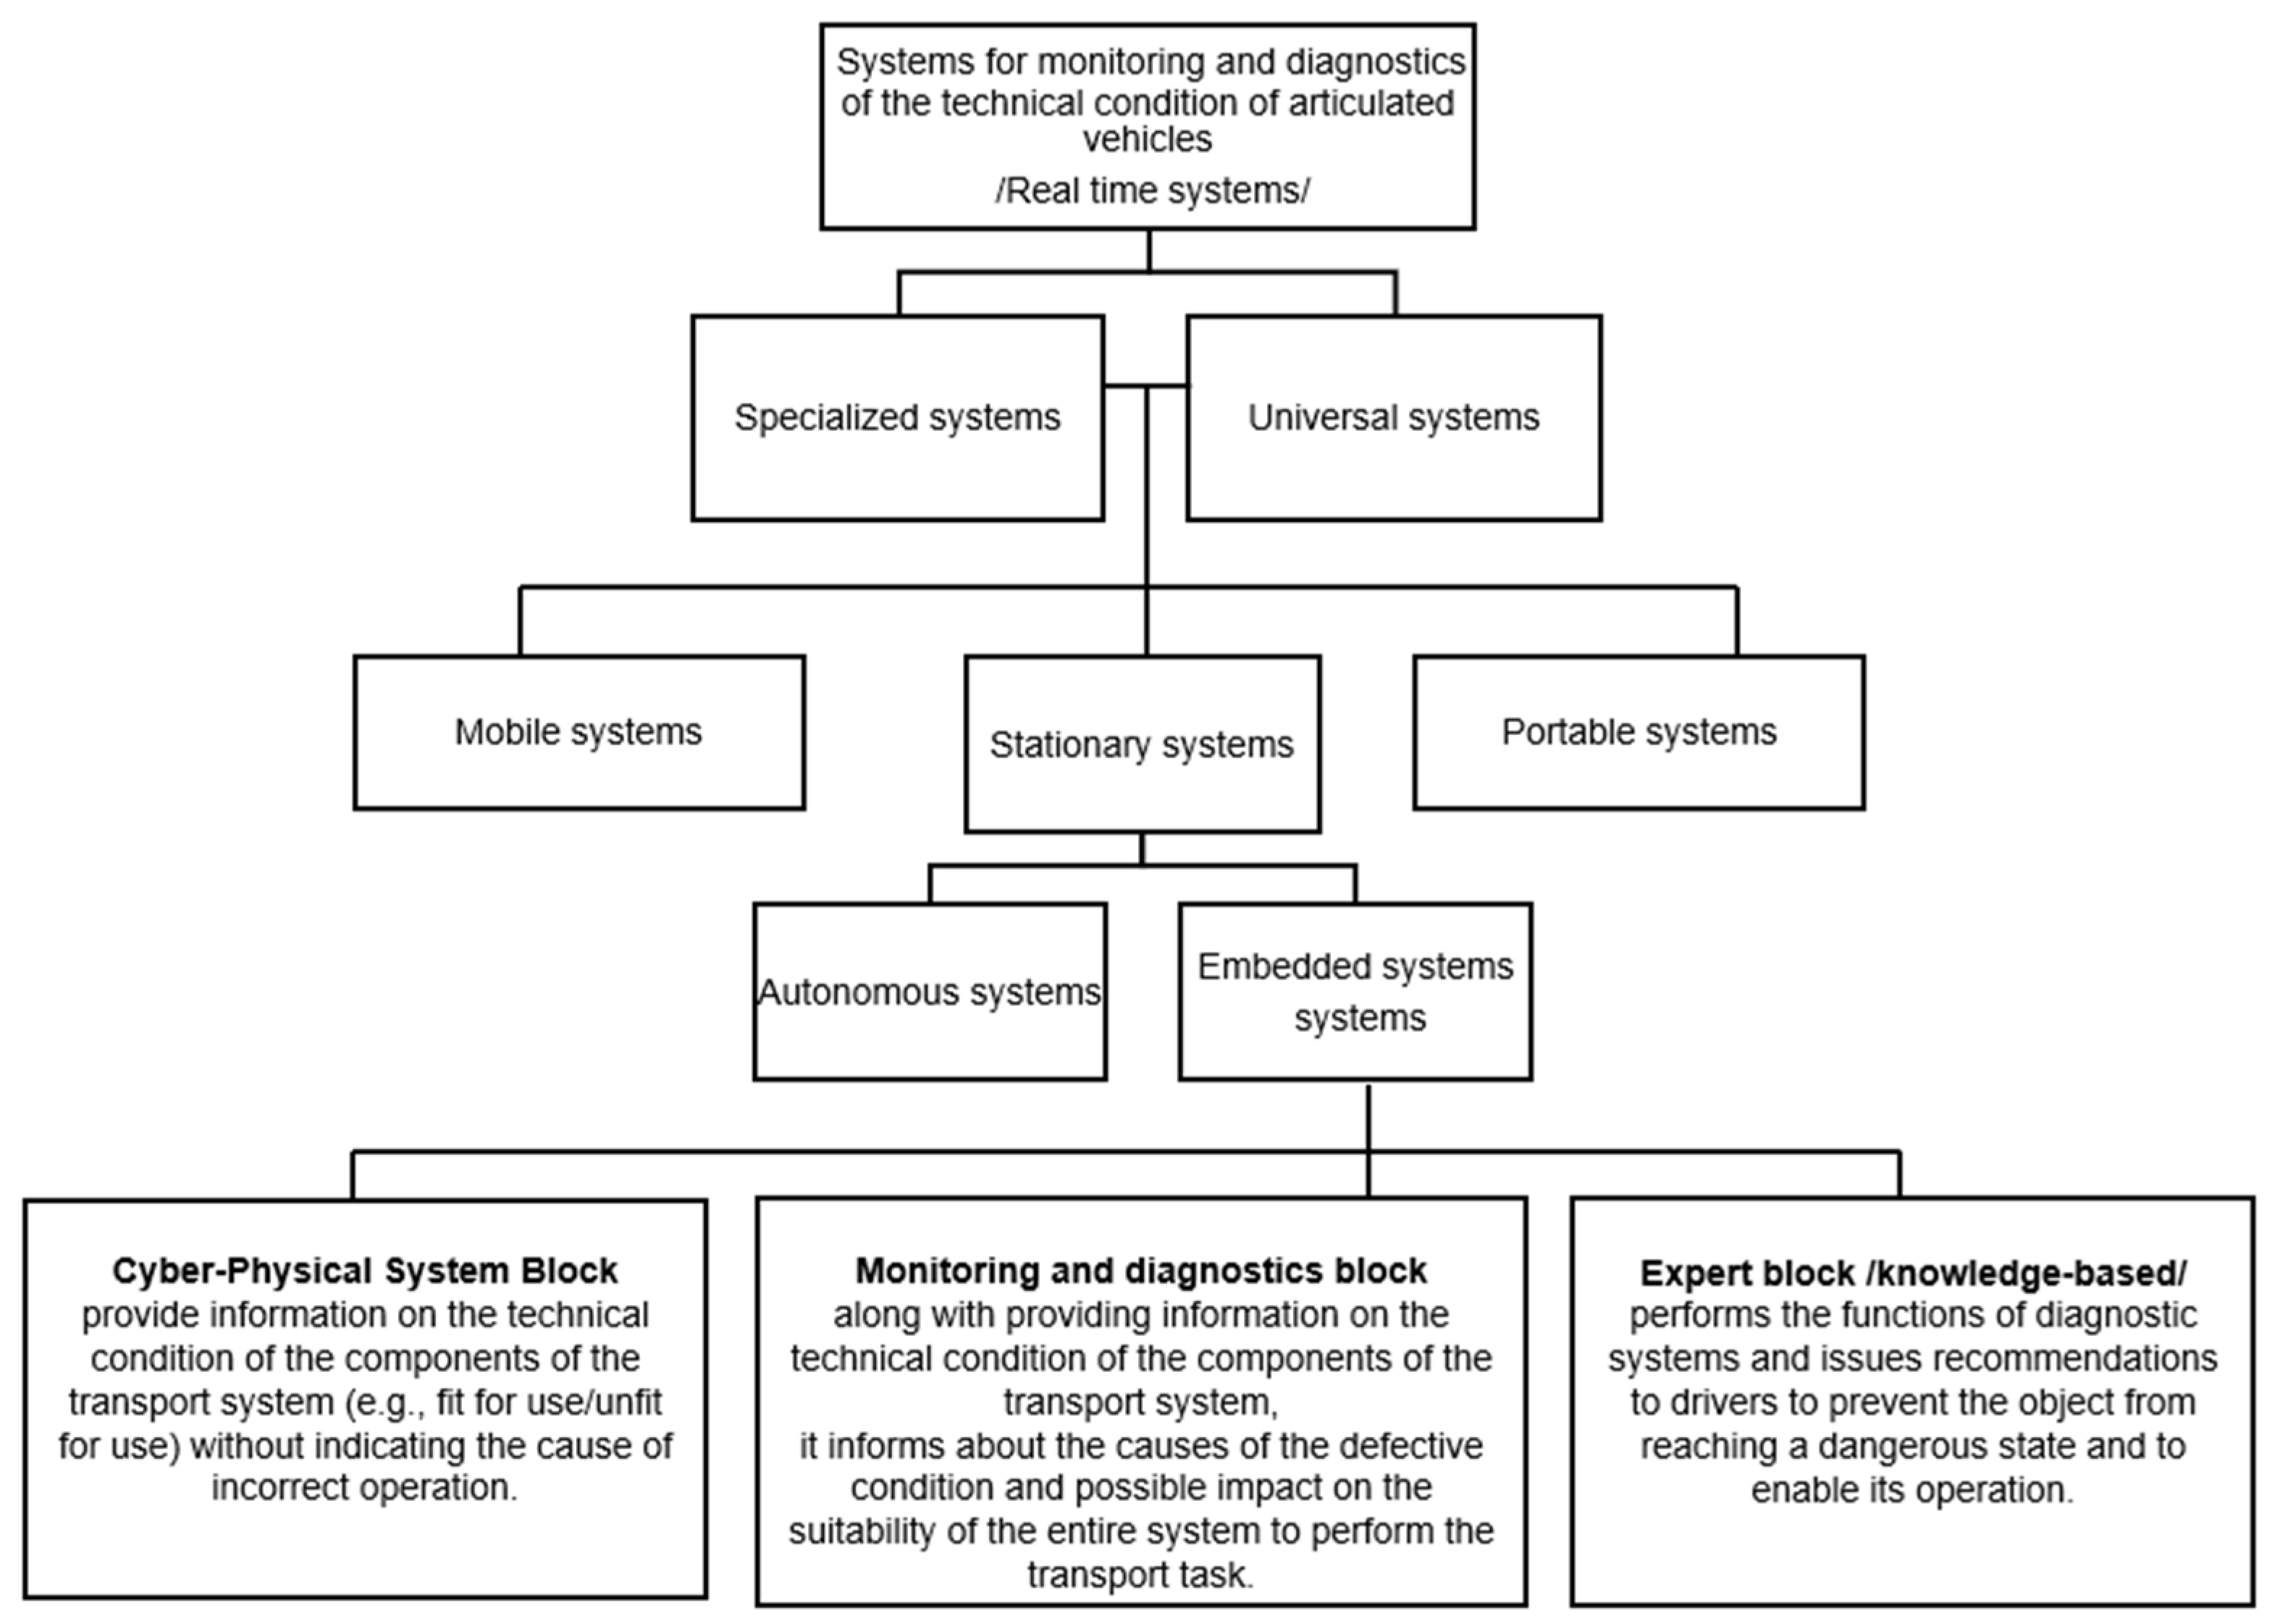
- The diagnostic systems discussed in the publications studied align with the classification presented in Figure 4.
- Recent publications primarily address the modeling of fault dynamics, evaluating their characteristics, and the decision-making processes of drivers [25,48,49]. Key areas of focus include:
- Machine Learning, which is the leading approach utilized in contemporary in-vehicle telematics devices for trucks;
- The fault identification techniques used can be grouped as follows:
- Techniques for identifying operating parameters based on modeling changes in their values and verifying the results. They help in identifying faults based on established patterns and anticipated responses, focusing on detecting faults by recognizing multiplicative effects.
- Techniques for clustering individual subsystems and components of the transport vehicle include adapting a network of monitoring sensors to identify faults. By analyzing sensor data, deviations from normal behavior can be flagged as potential faults. These techniques are particularly suited for identifying individual faults [50].
- Adaptive fault detection techniques are based on a combination of the above two techniques.
- Techniques based on predictive algorithms that analyze statistical data include learning to identify relationships between different operational parameters. They aid in predicting fault progression and are oriented toward detecting faults by identifying additive effects [51].
| Results of the Benchmarking Study | |||
|---|---|---|---|
| Diagnostic Methods Used | Proposals for Solving the Problems Identified | ||
| Process Issues | Technical Issues | ||
| 1 | The methods used relate to the task of monitoring a narrow group of operating parameters for only one type of vehicle, specifically trucks | Diagnostic systems have limited areas to monitor and focus generally on the engine, emissions, or fuel consumption | Proposal 1: Refers to the use of diagnostic systems that are oriented towards both the monitoring of tractor-trailer systems and of the AIL being transported |
| 2 | The methods used increasingly have problems with data transmission between the ECUs (Electronic Control Unit) sensors and the vehicle drivers, which reduces the effectiveness of these methods | Low reliability of the system, where a fault in even one of the ECU sensors can lead to an incorrect diagnosis of the state of fitness of the truck as a whole | Proposal 2: Assumed high reliability by means of a function for the timely performance testing of ECUs with the application of a self-leaning function for the storage of information on previous faults of ECU sensors |
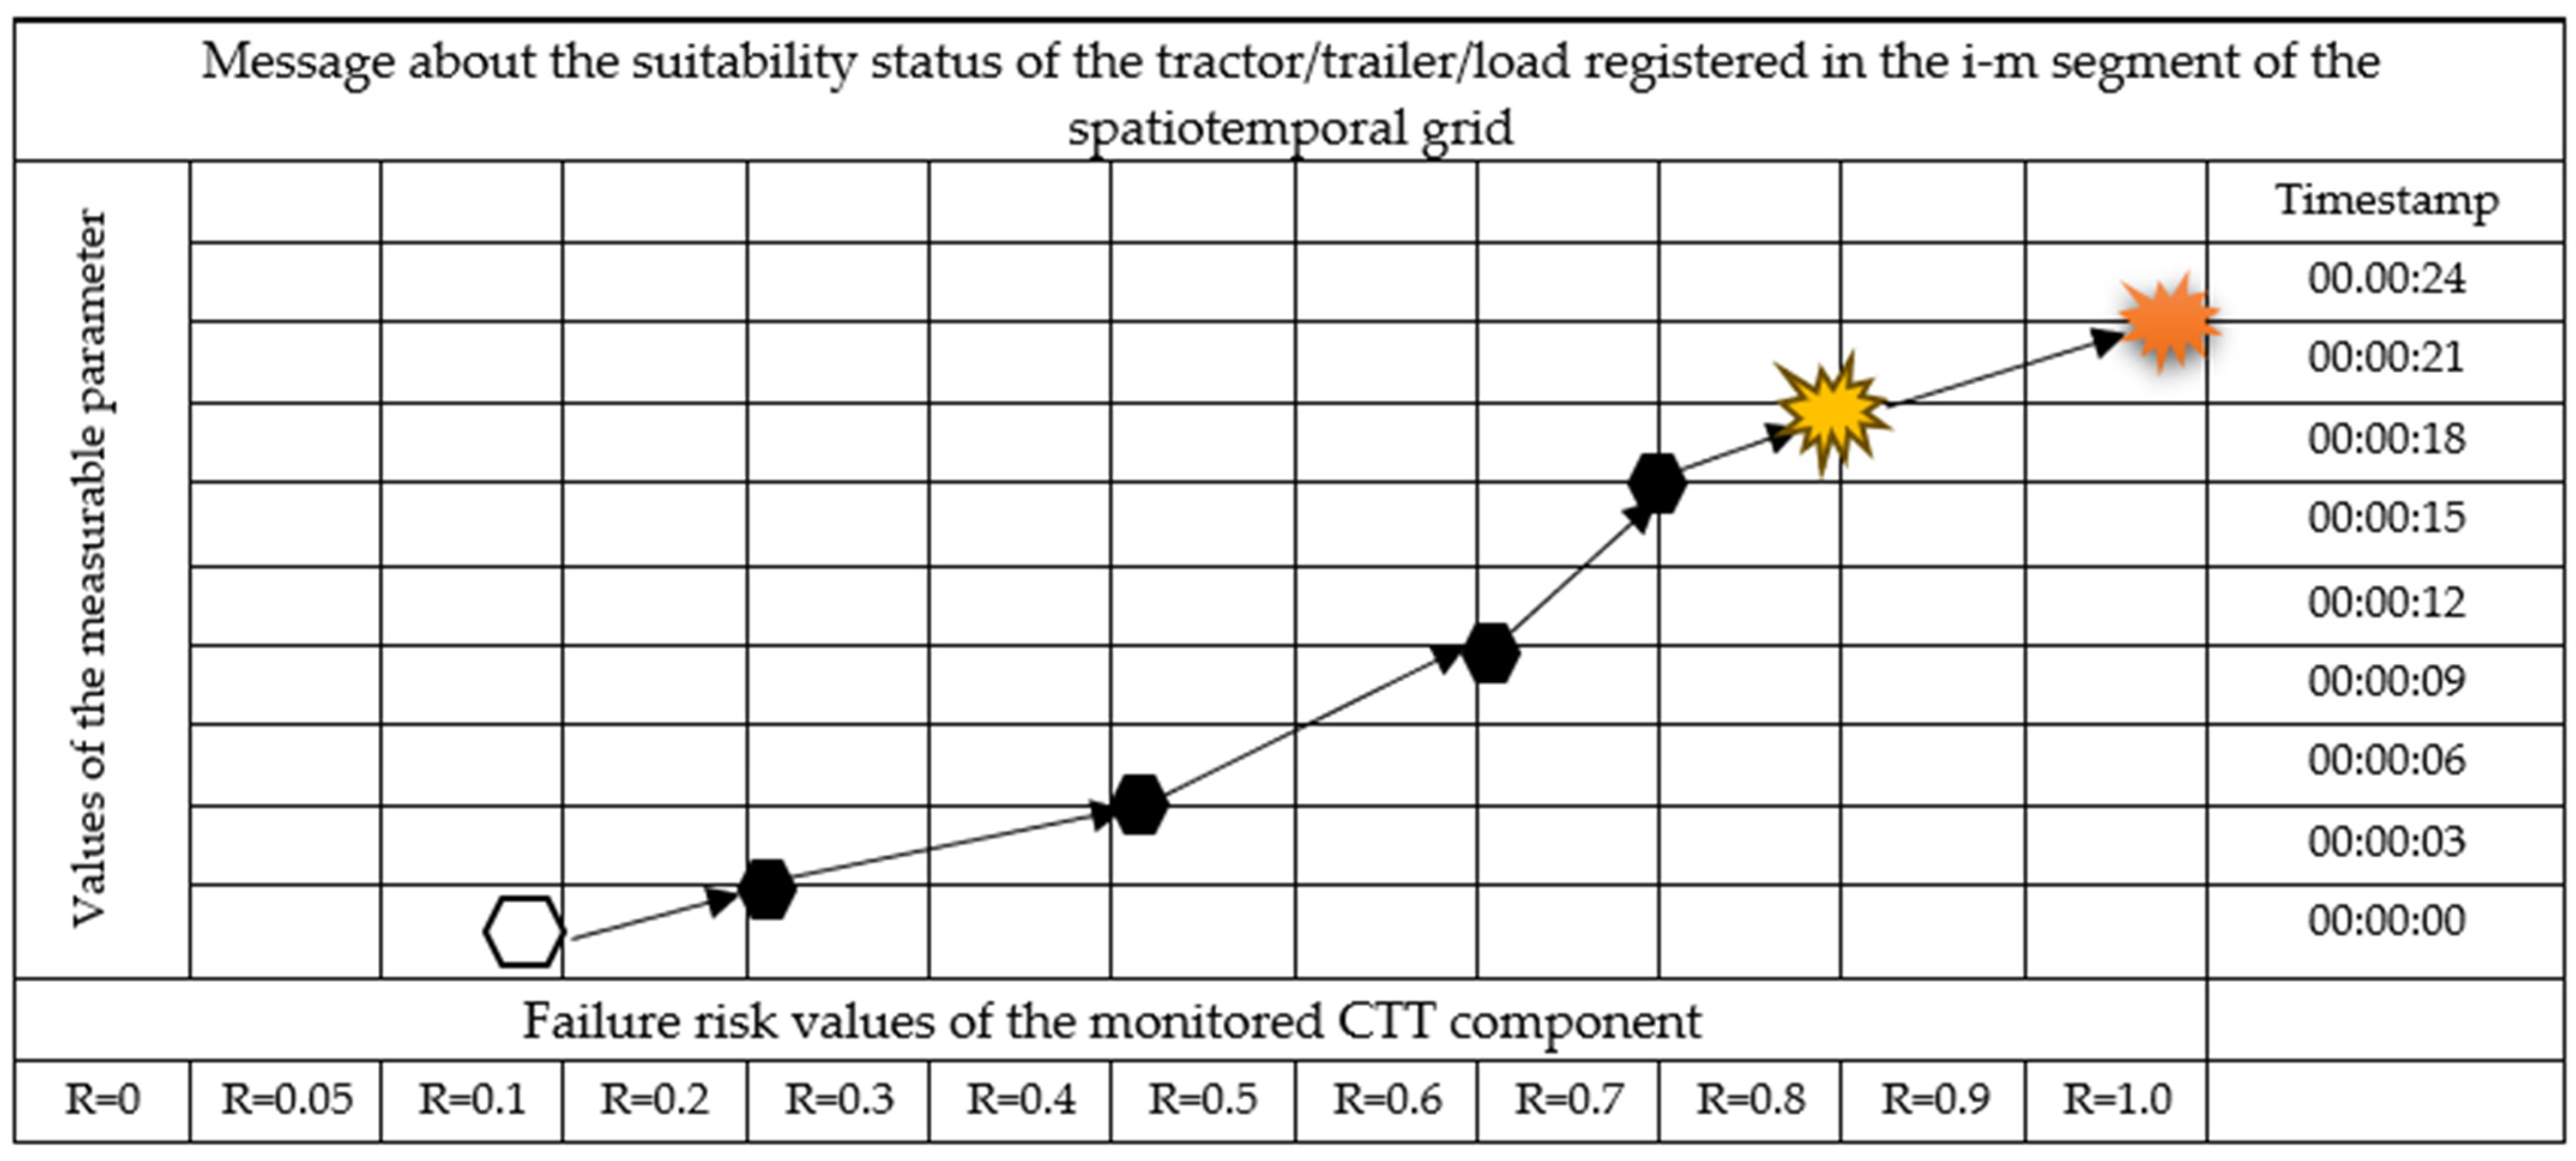
| 3 | On-board communication networks are easily overwhelmed by incoming messages, making it difficult to transfer them in real time. | On-board communication networks are sensitive to electromagnetic interference, which poses a risk to the functioning of the navigation system or other safety services | Proposal 3: Concern messages to drivers, communicated in graphic form (an example is shown in Figure 5) |
| 4 | Lack of comprehensive diagnostics makes it difficult to identify unconventional faults, especially in the complex CTT structure | They only display error codes, which can be identified with the help of reader instructions or the specialized literature | Proposal 4: Assumed feasibility of extending the system with further segments and subsystems |
| 5 | No possibility of even short-term forecasting of possible faults | Different modes of identifiers of the measurable parameters are used by accessing data from the ECU via CAN (Controller Area Networks), which does not provide protection against tampering | Proposal 5: The system includes functions not only for the short-term prediction of faults with the accuracy of the failed component but also for the prediction of medium-term possible problems in the course of the transport operation |
| 6 | The production of increasingly complex vehicles increases the likelihood of early unknown faults not on the fault code list of the SAE J2012 standard [53] | Existing measurement and diagnostic systems use the 5-character error codes specified in the “Diagnostic Trouble Code Definitions SAE J2012” [53] standard, which can make them difficult to read | Proposal 6: Messages on the suitability status of each monitored CTT component must be communicated in a graphical format structured on a time scale |
| Complex diagnostics is time-consuming, especially in the case of atypical or hidden faults, which increases the likelihood of unscheduled downtime for the HGV | Integrated proposal: The system should ensure that information on the state of serviceability of each STT component is collected and communicated to the driver, as well as information on actual and predicted failures in graphic form | ||
4. Fundamentals of the Developed Concept
4.1. Concept of Distributed Condition Monitoring System Architecture
- Gathering and displaying on a 3D monitor real-time information about the condition of each component of the STT. This function should adhere to the APOP (All-Parts-in-One Platform) principle.
- Visualizing existing and potential faults based on risk levels. This includes identifying dangerous symptoms and comparing them to nominal values. This function is grounded in the ABFDA (Anomaly-Based Fault Detection Approach).
- Informing the driver about the likelihood of imminent failures. This should be carried out using the KMA (Knowledge Mining Approach), which aids drivers in decision-making processes.
- Provide a comprehensive overview of the STT condition on-line, with the capability to drill down from subsystems to separate components of the vehicle, trailer, or cargo, while considering the vehicle’s operational regime. The EF&AD should carry out the following tasks:
- Mechanical fault detection. In the network of sensors, converters, and controllers. Detecting physical degradation or damage to parts or components.
- Total functional failure detection. Identifying unacceptable deviations in process parameters from normal values, like engine failure to start [54].
- Partial functional failure detection. Identifying acceptable deviations in process parameters, such as reduced engine performance, vibrations from components, sudden accelerations or braking, and oil leaks. Symptoms could include diminished braking efficiency or increased fuel consumption.
- Electrical failure detection—typically involving the battery, alternator, connectors, fuses, and relays. Possible causes include alternator bearing failure, blocked starter solenoid, damaged insulation, or corroded connections.
- Developing and providing visual prompts to assist drivers in managing the abnormal vehicle effectively.
- Exhibit the following characteristics:
- Openness to interoperability by exchanging information with the sensor network and responding to signals received regardless of the vehicle’s configuration.
- Adaptability to various scenarios, including those influenced by initial conditions and random factors. Therefore, assessing the current state of the STT should be based on both the analysis of the distribution of operational parameter values for occasional threats and the analysis of anomalous value sets for surprising threats.
- Functional activity capable of self-organization (e.g., optimizing sensor network efficiency by promptly addressing faults), self-regulation (e.g., adjusting information provided to the driver in response to abrupt changes in the parameters of operating processes), and self-improvement (e.g., continuously enhancing performance).
- Synergy is achieved through supporting the interoperability of sensor networks that provide condition information, controllers that regulate component functions, and CPU microprocessors. This interoperability improves the system’s overall effectiveness.
4.2. Structure of the Early Fault and Anomaly Detection System as a Cyber-Physical System
- Knowledge Fusion for the Deep Multi-Learning Module. This module extracts valuable explicit information recorded by sensors. In AIL transport, it is also crucial to detect hidden information by evaluating the likelihood of operational disturbances from rare faults (e.g., issues in the exhaust system) and the consequent multiplicative effects (e.g., decreased engine performance). It analyzes areas of anomalous parameter values and integrates data from various sensors to predict potential faults.
- Preventive recommendation module. It is useful in cases with a high likelihood of faults, providing recommendations to the driver:
- Routine—for occasional situations, it suggests actions such as changing driving modes or reducing speed to prevent fault propagation in vehicles—PFPV.
- Non-routine—for surprising scenarios, like a steering system failure, it might suggest actions such as attempting to restart the engine, unlocking the steering by turning the ignition key, and engaging the brakes simultaneously.
- Collecting data on the values of the operating parameters of individual vehicle systems;
- Performing a detailed analysis of the collected data and its clustering;
- Detecting anomalies and predicting potential short-term changes.
- is the -th time point;
- is the abnormal value of the monitored parameter at time ;
- is the threshold value of the monitored parameter.
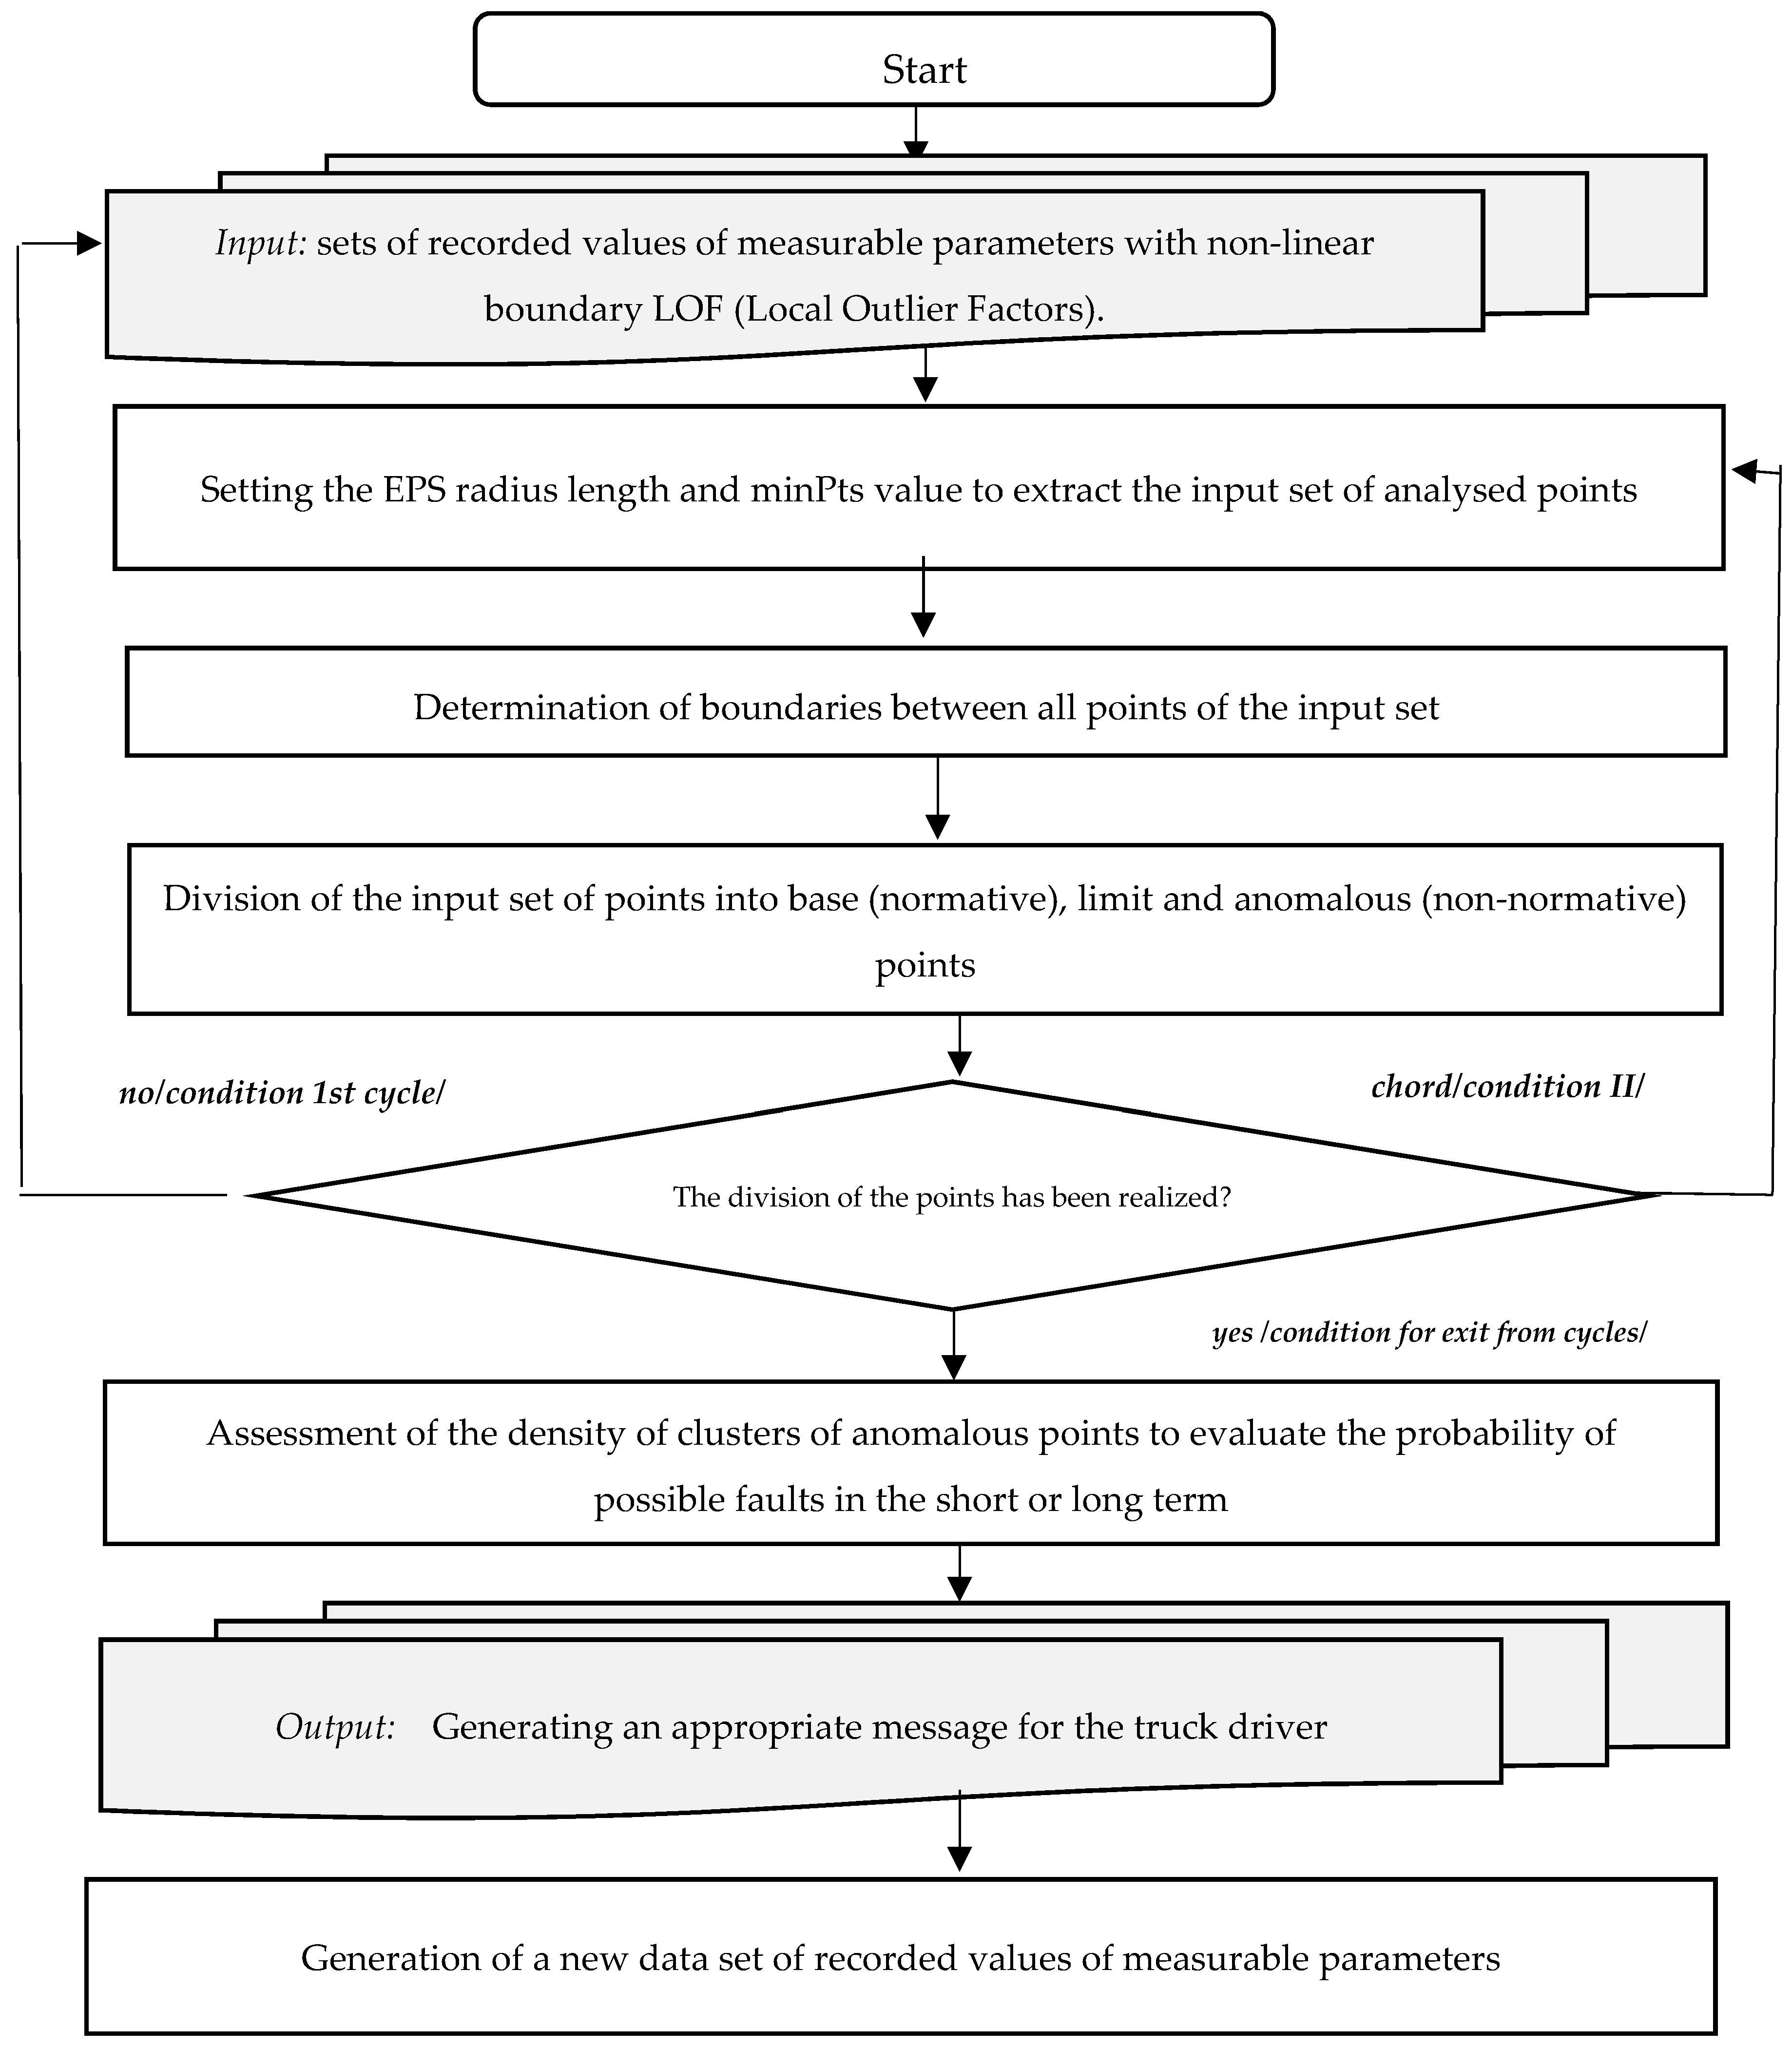
4.3. An Anomaly Detection Based on the DBSCAN Algorithm
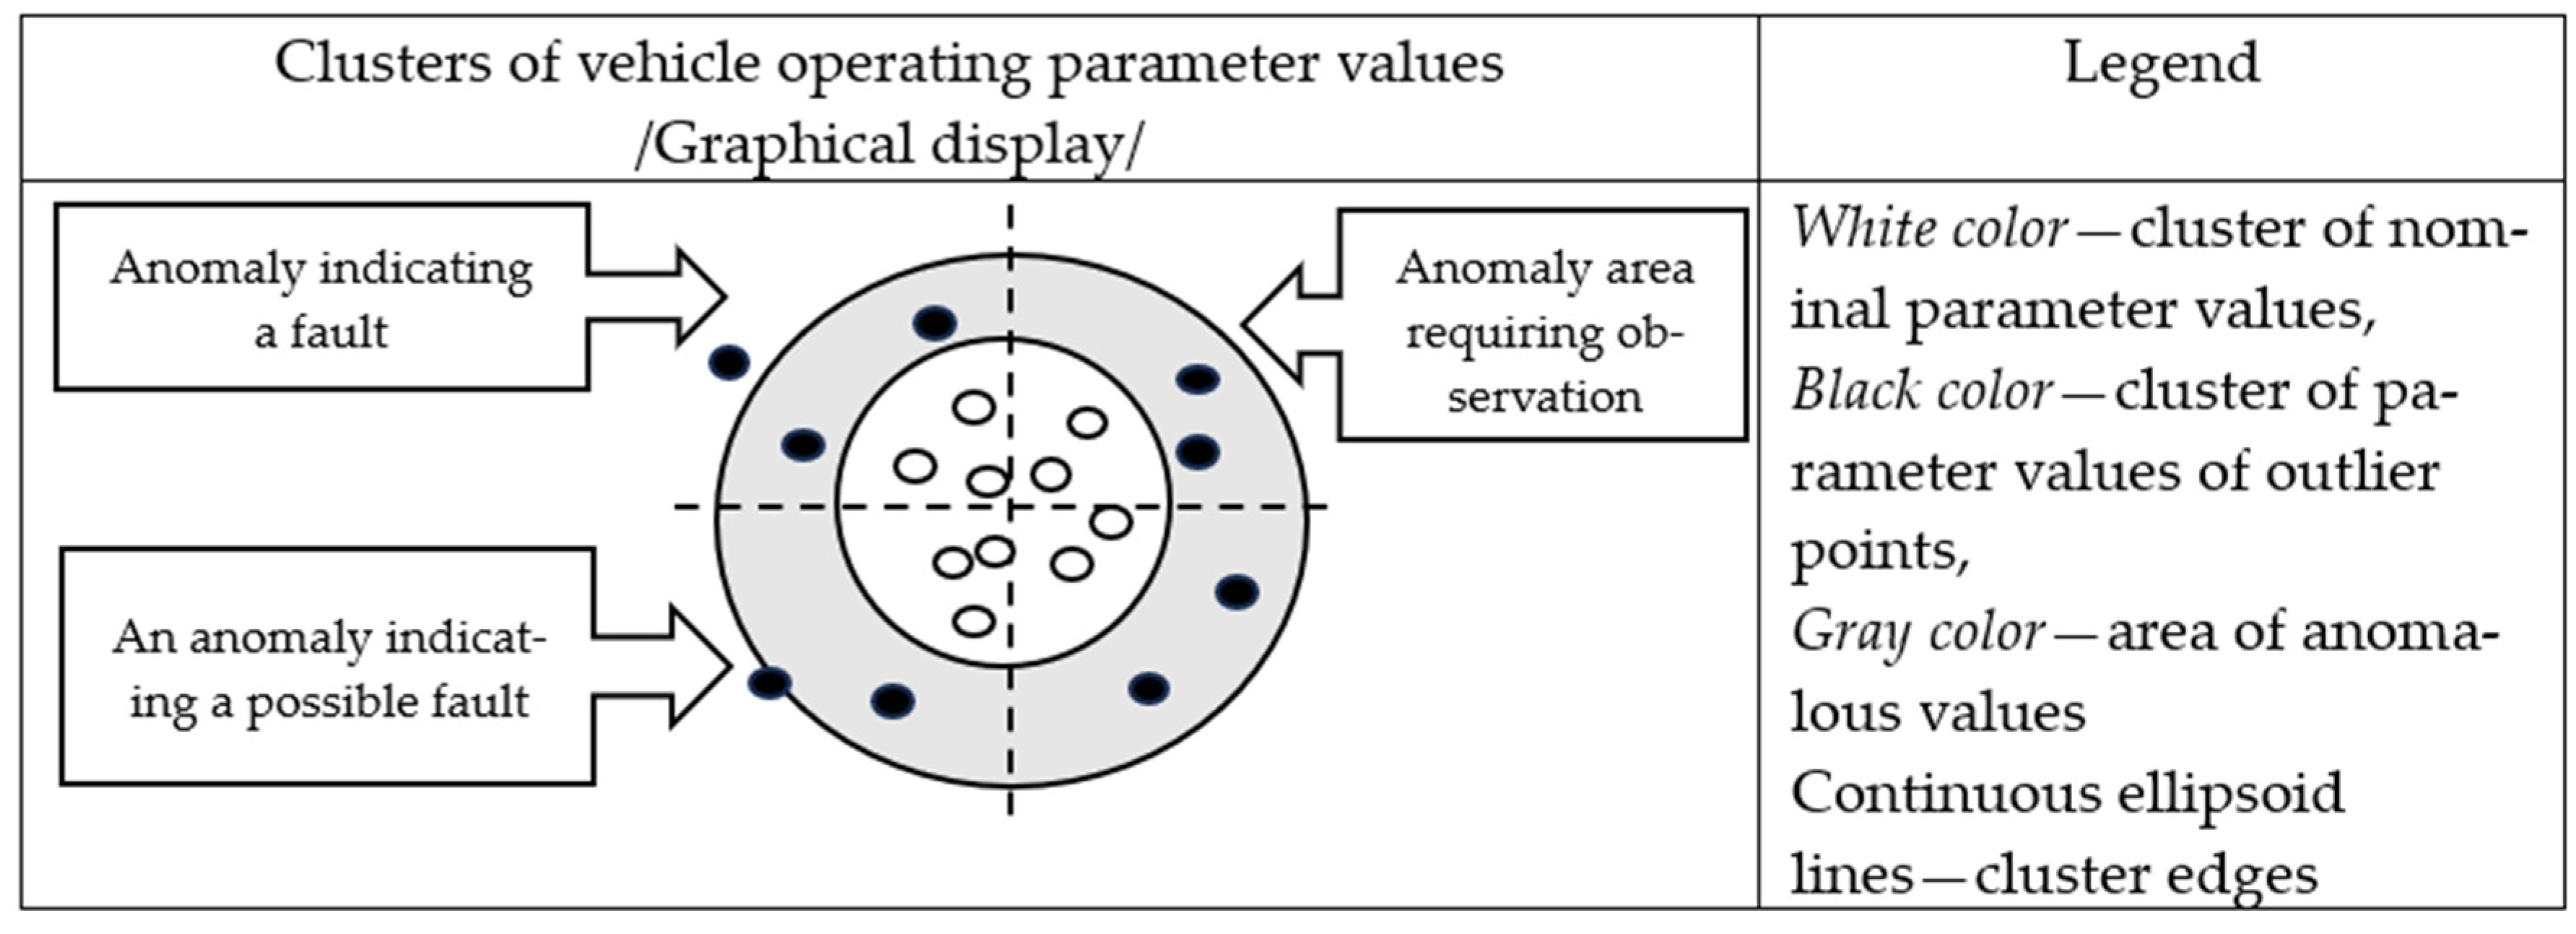
- Baseline corresponds to normative values of measurable parameters. Located at a threshold distance from the main reference point.
- Borderline. Located at threshold distances between neighboring baseline points and assessed by the Local Outlier Factors (LOFs) indicator.
- Outliers correspond to above-normal values of measurable parameters. Located at an off-threshold distance from the main benchmark point.
- i.
- EPS—defines the neighborhood radius around the x-point under study. It is called its ε—neighborhood.
- ii.
- MinPts—defines the minimum number of neighbors within the “EPS” radius.
- It is oriented to detect three-dimensional clusters of measurable parameter values of any shape;
- It is adapted to detect both baseline and anomalous points;
- It does not require the assumption of patterned shapes of the sought clusters into the algorithm;
- It has an above-average speed for detecting points with anomalous values;
- During the analysis of clustering results, the shapes of the examined clusters are not distorted;
- If necessary, there is a possibility to take into account exceeding the measurable values of parameters, i.e., to extract, i.e., “anomalous points”, which, in our case, are the points of interest because they indicate non-normative values of measurable parameters of both individual CTT systems and their structural elements.
4.4. Substantive Fundamentals for Future Research
- Isolated—describing short-term, atypical parameter values that appear sporadically during the operating process. They are evaluated using the LOF indicator, which computes the local density deviation of the tested point with respect to its neighbors. This may be a symptom of a fault that will develop in the short term.
- Continuous—describing constant changes in the values of operating process parameters due to their disturbance. For instance, a decrease in the injector opening pressure can influence the dynamics of temperature and pressure changes in both the working gas in the cylinder and the exhaust gases. Changes are evaluated within the LSL (Lower Specification Limit) and USL (Upper Specification Limit) using the process capability index .
5. Conclusions
- Detecting sequences of changes and measuring operational parameters of the new states of efficiency of the monitored STT systems with an indication of the risk of their failure in the time dimension;
- Planning of drivers’ actions to prevent unscheduled interruptions of transport services;
- Creation of a knowledge base that will be taken into account in the trajectory of the next planning of transport works, as well as in the improvement of used measuring-diagnostic equipment and software;
- Support T&L companies in managing their fleet of oversize vehicles (e.g., in evaluating the effectiveness of their transport work schedules, planning their maintenance, as well as the appropriate ordering of spare parts for their repair).
- I.
- Reducing the risk of tractor-trailer as well as semi-trailer adaptation to haulage, which is a key factor for the competitiveness of T&L companies. This area refers to supporting the physical reliability of these means of transportation. It does not cover more complex aspects, such as the risk of unfitness of the “tractor-trailer + like semi-trailer” combination as a whole.
- II.
- The overall readiness of the set “tractor-semi-trailer + like semi-trailer” to transport capacity on different transport routes and in different weather conditions, both within city limits and in suburban areas.
- III.
- Specific readiness of the set “tractor-semi-trailer + like semi-trailer” to transport AIL with the geometric parameters and weights established in the transport contracts, with appropriately limited speed.
Author Contributions
Funding
Institutional Review Board Statement
Informed Consent Statement
Data Availability Statement
Conflicts of Interest
References
- Löfgren, S.; Nilsson, K.; Johansson, C.M. Considering landscape in strategic transport planning. Transp. Res. Part D Transp. Environ. 2018, 65, 396–408. [Google Scholar] [CrossRef]
- Turbaningsih, O. The study of project cargo logistics operation: A general overview. J. Shipp. Trade 2022, 7, 24. [Google Scholar] [CrossRef]
- Xu, C.; Chen, J.; Li, J. A modern survey method for determining extraordinary loads based on multi-source online data. Adv. Struct. Eng. 2023, 26, 2123–2134. [Google Scholar] [CrossRef]
- Road Traffic Act 1988, UK Public General Acts1988 c. 52 Part II General Regulation of Construction. Section 44. Available online: https://www.legislation.gov.uk/ukpga/1988/52/section/44 (accessed on 30 June 2024).
- Association of Chief Police Officer of England. Guidance on the Movement of Abnormal Indivisible Loads; Association of Chief Police Officer of England: London, UK, 2013; Volume 7, p. 37.
- Federal Motor Carrier Safety Administration: Analysis Division. Large Truck and Bus Crash Facts 2020. FMCSA-RRA-22-005. September 2022. Available online: https://www.fmcsa.dot.gov/safety/data-and-statistics/large-truck-and-bus-crash-facts-2020 (accessed on 6 March 2023).
- Kopestinsky, A. Disturbing Truck Accident Statistics (2023 Edition). Available online: https://policyadvice.net/insurance/insights/truck-accident-statistics/ (accessed on 30 June 2024).
- Redmann, J. Unsecured Cargo and Accidents with Commercial Trucks—Who Is Liable? 2022. Available online: https://www.redmannlaw.com/truck-accidents/unsecured-cargo-truck-liability/ (accessed on 30 June 2024).
- Høye, A. Vehicle registration year, age, and weight—Untangling the effects on crash risk. Accid. Anal. Prev. 2019, 123, 1–11. [Google Scholar] [CrossRef]
- Xin, T.; Xu, J.; Gao, C.; Sun, Z. Research on the speed thresholds of trucks in a sharp turn based on dynamic rollover risk levels. PLoS ONE 2021, 16, e0256301. [Google Scholar] [CrossRef]
- Jagelcak, J.; Kiktová, M.; Francák, M. The Analysis of Maneuverability of Semi-trailer Vehicle Combination. Transp. Res. Procedia 2020, 44, 176–181. [Google Scholar] [CrossRef]
- Zhao, Z. Analysis of heavy vehicle rollover and stability. Comput. Model. New Technol. 2014, 18, 157–161. [Google Scholar]
- Remya, Y.K.; Anitha, J.; Subaida, E.A. Rollover Stability Analysis of Trucks-Effect of Curve Geometry and Operating Speed. In International Conference on Transportation Infrastructure; Agarwal, A., Velmurugan, S., Maurya, A.K., Eds.; 2. TIPCE 2022. Lecture Notes in Civil Engineering; Springer: Singapore, 2023; Volume 347. [Google Scholar] [CrossRef]
- García-Arca, J.; Prado-Prado, J.C.; Fernández-González, A.J. Integrating KPIs for improving efficiency in road transport. Int. J. Phys. Distrib. Logist. Manag. 2018, 48, 931–951. [Google Scholar] [CrossRef]
- Taylor, N.B.; Hardman, E.J.; Weekley, J.; Bourne, N. Estimating the impact of abnormal loads on network performance. IET Intell. Transp. Syst. 2009, 3, 111–123. [Google Scholar] [CrossRef]
- EC. The Future of Road Transport Implications of Automated, Connected, Low-Carbon and Shared Mobility; Executive Summary, EUR 29748 EN; Publications Office of the European Union: Luxembourg, 2019. [Google Scholar] [CrossRef]
- Eurostat: Freight Transport Statistics—Modal Split. Available online: https://ec.europa.eu/eurostat/statistics-explained/index.php?title=Freight_transport_statistics_-_modal_split (accessed on 30 June 2024).
- Eurostat: Road Freight Transport by Type of Goods. Available online: https://ec.europa.eu/eurostat/statistics-explained/index.php?title=Road_freight_transport_by_type_of_goods#Road_freight_transport_by_type_of_goods_.28NST_2007_classification.29 (accessed on 30 June 2024).
- Abid, A.; Khan, M.T.; Iqbal, J. A review on fault detection and diagnosis techniques: Basics and beyond. Artif. Intell. Rev. 2021, 54, 3639–3664. [Google Scholar] [CrossRef]
- Zhang, X.; Wang, X.; Bao, Y.; Zhu, X. Safety assessment of trucks based on GPS and in-vehicle monitoring data. Accid. Anal. Prev. 2022, 168, 106619. [Google Scholar] [CrossRef] [PubMed]
- Boylan, J.; Meyer, D.; Chen, W. A Systematic Review of the Use of In-Vehicle Telematics in Monitoring Driving Behaviors. Accid. Anal. Prev. 2023, 32. [Google Scholar] [CrossRef]
- Guillen, M.; Pérez-Marín, A.; Alcañiz, M. Risk Reference Charts for Speeding Based on Telematics Information; IREA Working Papers 2020/03; University of Barcelona, Research Institute of Applied Economics: Barcelona, Spain, 2020. [Google Scholar] [CrossRef]
- Winlaw, M.; Steiner, S.; MacKay, J.; Hilal, A. Using telematics data to find risky driver behaviour. Accid. Anal. Prev. 2019, 131, 131–136. [Google Scholar] [CrossRef] [PubMed]
- Mase, J.M.; Majid, S.; Mesgarpour, M.; Torres, M.T.; Figueredo, G.P.; Chapman, P. Evaluating the impact of Heavy Goods Vehicle driver monitoring and coaching to reduce risky behaviour. Accid. Anal. Prev. 2020, 146, 105754. [Google Scholar] [CrossRef]
- Choudhary, V.; Shunko, M.; Netessine, S. Does Immediate Feedback Make You Not Try as Hard? A Study on Automotive Telematics. Manuf. Serv. Oper. Manag. 2021, 23, 835–853. [Google Scholar] [CrossRef]
- Minni, R. A Cost Efficient Real Time Vehicle Tracking System. Int. J. Comput. Appl. 2013, 81, 29–35. [Google Scholar] [CrossRef]
- Šipoš, M.; Klaić, Z.; Nyarko, K.E.; Fekete, K. A method for determining the location and type of fault in transmission network using neural networks and power quality monitors. Eksploat. I Niezawodn. Maint. Reliab. 2024, 26, 187166. [Google Scholar] [CrossRef]
- Hulbert, S.; Mollan, C.; Pandey, V. Fault Diagnosis and Prediction in Automotive Systems with Real-Time Data Using Machine Learning; SAE Technical Paper; SAE Technical: Warrendale, PA, USA, 2022. [Google Scholar] [CrossRef]
- Goel, A. Fleet Telematics: Real-Time Management and Planning of Commercial Vehicle Operations; Springer: Berlin/Heidelberg, Germany, 2008. [Google Scholar]
- Bujak, A.; Orzeł, A.; Miler, R. Telematics of Supply Chains—Areas Opportunities, Challenges. Commun. Comput. Inf. Sci. 2014, 471, 185–195. [Google Scholar] [CrossRef]
- Posada, F.; Bandivadekar, A. Global overview of on-board diagnostic (OBD) systems for heavy-duty vehicles. Int. Counc. Clean Transp. 2015, 25, 2–5. Available online: https://theicct.org/sites/default/files/publications/ICCT_Overview_OBD-HDVs_20150209.pdf (accessed on 30 June 2024).
- Lebold, M.; McClintic, K.; Campbell, R.; Byington, C.; Maynard, K. Review of vibration analysis methods for gearbox diagnostics and prognostics. In Proceedings of the 54th Meeting of the Society for Machinery Failure Prevention Technology, Virginia Beach, VA, USA, 1–4 May 2000; pp. 623–634. [Google Scholar]
- Tom, J.A.; Gandhi, O.P.; Deshmukh, S.G. Fault diagnosis of automobile systems using fault tree based on digraph modeling. Int. J. Syst. Assur. Eng. Manag. 2018, 9, 494–508. [Google Scholar] [CrossRef]
- Henriques, L.; Farinha, T.; Mendes, M. Fault Detection and Prediction for a Wood Chip Screw Conveyor. Eksploat. I Niezawodn. Maint. Reliab. 2024, 26, 189323. [Google Scholar] [CrossRef]
- Oszczypała, M.; Ziółkowski, J.; Małachowski, J. Semi-Markov approach for reliability modelling of light utility vehicles. Eksploat. I Niezawodn. Maint. Reliab. 2023, 25, 161859. [Google Scholar] [CrossRef]
- Kozłowski, E.; Borucka, A.; Oleszczuk, P.; Jałowiec, T. Evaluation of the maintenance system readiness using the semi-Markov model taking into account hidden factors. Eksploat. I Niezawodn. Maint. Reliab. 2023, 25, 172857. [Google Scholar] [CrossRef]
- Murawski, J.; Szczepański, E.; Jacyna-Gołda, I.; Izdebski, M.; Jankowska-Karpa, D. Intelligent mobility: A model for assessing the safety of children traveling to school on a school bus with the use of intelligent bus stops. Eksploat. I Niezawodn. Maint. Reliab. 2022, 24, 695–706. [Google Scholar] [CrossRef]
- Desai, M.; Phadke, A. Internet of Things based vehicle monitoring system. In Proceedings of the Fourteenth International Conference on Wireless and Optical Communications Networks (WOCN), Mumbai, India, 24–26 February 2017; pp. 1–3. [Google Scholar] [CrossRef]
- Priyadharshini, G.; Ferni Ukrit, M. An empirical evaluation of importance-based feature selection methods for the driver identification task using OBD Data. Int. J. Syst. Assur. Eng. Manag. 2022, 1–12. [Google Scholar] [CrossRef]
- Menon, P.; Edwards, C. Robust Fault Estimation Using Relative Information in Linear Multi-Agent Networks. IEEE Trans. Autom. Control. 2014, 59, 477–482. [Google Scholar] [CrossRef]
- Han, T.; Liu, C.; Wu, L.; Sarkar, S.; Jiang, D. An adaptive spatiotemporal feature learning approach for fault diagnosis in complex systems. Mech. Syst. Signal Process. 2019, 117, 170–187. [Google Scholar] [CrossRef]
- Wang, H.; Li, S.; Song, L.; Cui, L.; Wang, P. An Enhanced Intelligent Diagnosis Method Based on Multi-Sensor Image Fusion via Improved Deep Learning Network. IEEE Trans. Instrum. Meas. 2020, 69, 2648–2657. [Google Scholar] [CrossRef]
- Cho, I.; Moon, I.; Kim, D.; Park, T.; Lee, D.; Lee, J. Experimental Investigation on OBD Signal and PN Emission Characteristics by Damaged-DPF Types of 2.0 L Diesel Vehicle. Appl. Sci. 2022, 12, 7853. [Google Scholar] [CrossRef]
- Chen, Z.; Xu, J.; Peng, T.; Yang, C. Graph Convolutional Network-Based Method for Fault Diagnosis Using a Hybrid of Measurement and Prior Knowledge. IEEE Trans. Cybern. 2022, 52, 9157–9169. [Google Scholar] [CrossRef] [PubMed]
- Sun, R.; Ouyang, D.; Tian, X.; Zhang, L. An efficient power set mapping space blocking algorithm for sensor selection in uncertain systems with quantified diagnosability requirements. Appl. Intell. 2022, 53, 2879–2896. [Google Scholar] [CrossRef]
- Yan, Y.; Zhou, J.; Yin, Y.; Nie, H.; Wei, X.; Liang, T. Reliability Estimation of Retraction Mechanism Kinematic Accuracy under Small Sample. Eksploat. I Niezawodn. Maint. Reliab. 2024, 26, 174777. [Google Scholar] [CrossRef]
- Cai, B.; Huang, L.; Xie, M. Bayesian Networks in Fault Diagnosis. IEEE Trans. Ind. Inform. 2017, 13, 2227–2240. [Google Scholar] [CrossRef]
- Geng, K.; Dong, G.; Yin, G.; Hu, J. Deep Dual-Modal Traffic Objects Instance Segmentation Method Using Camera and LIDAR Data for Autonomous Driving. Remote Sens. 2020, 12, 3274. [Google Scholar] [CrossRef]
- Zhang, Y.X.; Zhou, Z.; He, X.; Adhikary, A.R.; Dutta, B. Data-driven Knowledge Fusion for Deep Multi-instance Learning. arXiv 2023, arXiv:2304.11905v1. [Google Scholar] [CrossRef] [PubMed]
- Patange, A.; Soman, R.N.; Pardeshi, S.; Kuntoglu, M.; Ostachowicz, W. Milling cutter fault diagnosis using unsupervised learning on small data: A robust and autonomous framework. Eksploat. I Niezawodn. Maint. Reliab. 2024, 26, 178274. [Google Scholar] [CrossRef]
- Ding, S.X. Fault Identification Schemes. In Model-Based Fault Diagnosis Techniques; Advances in Industrial Control; Springer: London, UK, 2013. [Google Scholar] [CrossRef]
- Zhang, Q.; Yang, L.; Duan, J.; Qin, J.; Zhou, Y. Research on integrated scheduling of equipment predictive maintenance and production decision based on physical modeling approach. Eksploat. I Niezawodn. Maint. Reliab. 2024, 26, 175409. [Google Scholar] [CrossRef]
- SAE J2012; Diagnostic Trouble Code Definitions. SAE International: Warrendale, PA, USA, 2012. Available online: https://www.sae.org/standards/content/j2012_201612/ (accessed on 30 June 2024).
- Chen, W.; Hu, J.; Yu, X.; Chen, D.; Du, J. Robust Fault Detection for Nonlinear Discrete Systems with Data Drift and Randomly Occurring Faults under Weighted Try-Once-Discard Protocol. Circuits Syst. Signal Process. 2020, 39, 111–137. [Google Scholar] [CrossRef]
- Cao, X.; Shi, X.; Zhao, J.; Duan, Y.; Yang, X. Dynamic grouping maintenance optimization by considering the probabilistic remaining useful life prediction of multiple equipment. Eksploat. I Niezawodn. Maint. Reliab. 2024, 26, 187793. [Google Scholar] [CrossRef]
- Huang, M.; Yu, W.; Yang, F. Analysis of remaining useful life of slope based on nonlinear wiener process. Eksploat. I Niezawodn. Maint. Reliab. 2024, 26, 187160. [Google Scholar] [CrossRef]
- Mouzakitis, A. Classification of Fault Diagnosis Methods for Control Systems. Meas. Control. 2013, 46, 303–308. [Google Scholar] [CrossRef]
- Shin, S.; Smith, A.; Qin, S.; Zavala, V. On the Convergence of the Dynamic Inner PCA Algorithm. In Proceedings of the Foundations of Process Analytics and Machine Learning, Raleigh, NC, USA, 6–9 August 2019. [Google Scholar] [CrossRef]
- Wang, W.-T.; Wu, Y.-L.; Tang, C.-Y.; Hor, M.-K. Adaptive density-based spatial clustering of applications with noise (DBSCAN) according to data. In Proceedings of the 2015 International Conference on Machine Learning and Cybernetics (ICMLC), Guangzhou, China, 12–15 July 2015; pp. 445–451. [Google Scholar] [CrossRef]
- Schubert, E.; Sander, J.; Ester, M.; Kriegel, H.P.; Xu, X. DBSCAN revisited, revisited: Why and how you should (still) use DBSCAN. ACM Trans. Database Syst. (TODS) 2017, 42, 1–21. [Google Scholar] [CrossRef]
- Li, G.; Jung, J. Deep learning for anomaly detection in multivariate time series: Approaches, applications, and challenges. Inf. Fusion 2023, 91, 93–102. [Google Scholar] [CrossRef]
- Zvirko, O.I.; Nykyforchyn, H.M.; Tsyrulnyk, O.T.; Voloshyn, V.A.; Venhrynyuk, O.I. In-Service Degradation of Structural Steels under Cyclic Loading. Mater. Sci. 2022, 58, 222–2281. [Google Scholar] [CrossRef]
- Zhang, L.; Jiang, B.; Zhang, P.; Yan, H.; Xu, X.; Liu, R.; Tang, J.; Ren, C. Methods for fatigue-life estimation: A review of the current status and future trends. Nanotechnol. Precis. Eng. 2023, 6, 025001. [Google Scholar] [CrossRef]
- Li, Y.; Karimi, H.R.; Zhong, M.; Ding, S.X.; Liu, S. Fault Detection for Linear Discrete Time-Varying Systems with Multiplicative Noise: The Finite-Horizon Case. IEEE Trans. Circuits Syst. I Regul. Pap. 2018, 65, 3492–3505. [Google Scholar] [CrossRef]


| Vehicle Configuration | 2018 | 2019 | 2020 | |||
|---|---|---|---|---|---|---|
| Number | Percent | Number | Percent | Number | Percent | |
| Single-Unit, 2 Axles | 1.179 | 24.0% | 1.172 | 23.3% | 1.219 | 25.2% |
| Single-Unit, 3+ Axles | 499 | 10.2% | 517 | 10.3% | 458 | 9.5% |
| Truck/Trailer(s) | 237 | 4.8% | 276 | 5.5% | 247 | 5.1% |
| Tractor/Semi-trailer | 2.700 | 55.0% | 2.767 | 55.0% | 2.566 | 53.0% |
| Tractor/Double | 131 | 2.7% | 124 | 2.5% | 123 | 2.5% |
| Tractor/Triple | 7 | 0.1% | 5 | 0.1% | 2 | 0.05% |
| First Harmful Event /Vehicle-Related Factors/ | 2018 | 2019 | 2020 | |||
|---|---|---|---|---|---|---|
| Number | Percent | Number | Percent | Number | Percent | |
| Collision with Vehicle | 3.257 | 73.0% | 3.290 | 73.1% | 3.183 | 71.6% |
| Overturn (Rollover) | 187 | 4.2% | 165 | 3.7% | 160 | 3.6% |
| Jackknife | 9 | 0.2% | 12 | 0.3% | 12 | 0.3% |
| Cargo Equipment Loss or Shift | 2 | 0.03% | 10 | 0.2% | 6 | 0.1% |
| Second Harmful Event /Vehicle-Related Factors/ | 2018 | 2019 | 2020 | |||
|---|---|---|---|---|---|---|
| Number | Percent | Number | Percent | Number | Percent | |
| Tire blowouts or damage | 68 | 1.4% | 60 | 1.2% | 43 | 0.9% |
| Brake System | 46 | 0.9% | 55 | 1.1% | 37 | 0.8% |
| Turn indicators as well as marker, parking, and warning lights | 6 | 0.1% | 4 | 0.1% | 8 | 0.2% |
| Power Train | 10 | 0.2% | 8 | 0.2% | 4 | 0.1% |
| Headlights | 5 | 0.1% | 6 | 0.1% | 3 | 0.1% |
| No Details | 3 | 0.1% | 7 | 0.1% | 7 | 0.1% |
| EU Road Freight Transport between 2018 and 2022 (Million Tons) | |||||
|---|---|---|---|---|---|
| Transport of unidentified goods, including AILs | 2018 | 2019 | 2020 | 2021 | 2022 |
| 155.0 | 165.9 | 158.7 | 164.4 | 188 | |
| Types of Anomalies | Characteristics of Anomalies in Selected Operating Parameters of Monitored Vehicle Components | Features of Operating Parameter Anomalies |
|---|---|---|
| Bias | Constant deviation of measured values. Measurements indicate a shift by a constant value from nominal values. | They occur sporadically in ROF (Randomly Occurring Fault) mode. They do not follow any rules and are typically caused by wear, corrosion, or aging. |
| Drift | Gradual deviations in measured values. Measurements indicate a shift over time. | |
| Freezing | Lack of response of measurement results to changes in the dynamics of monitored parameters. | |
| Noise | Random fluctuations in measurement results unrelated to changes in the dynamics of monitored parameters. |
| Types of Anomalies | Characteristics of Anomalies in Selected Operating Parameters of Monitored Vehicle Components | Features of Operating Parameter Anomalies |
|---|---|---|
| Steady uptrend/downtrend | Gradual changes in anomalous values of operating parameters without abrupt changes. | These occur as RONs (Randomly Occurring Nonlinearities) due to disturbances in the operating processes. |
| Unsteady uptrend/downtrend | Regular (sinusoidal) or abrupt changes in anomalous values of operating parameters. |
Disclaimer/Publisher’s Note: The statements, opinions and data contained in all publications are solely those of the individual author(s) and contributor(s) and not of MDPI and/or the editor(s). MDPI and/or the editor(s) disclaim responsibility for any injury to people or property resulting from any ideas, methods, instructions or products referred to in the content. |
© 2024 by the authors. Licensee MDPI, Basel, Switzerland. This article is an open access article distributed under the terms and conditions of the Creative Commons Attribution (CC BY) license (https://creativecommons.org/licenses/by/4.0/).
Share and Cite
Semenov, I.; Świderski, A.; Borucka, A.; Guzanek, P. Concept of Early Prediction and Identification of Truck Vehicle Failures Supported by In-Vehicle Telematics Platform Based on Abnormality Detection Algorithm. Appl. Sci. 2024, 14, 7191. https://doi.org/10.3390/app14167191
Semenov I, Świderski A, Borucka A, Guzanek P. Concept of Early Prediction and Identification of Truck Vehicle Failures Supported by In-Vehicle Telematics Platform Based on Abnormality Detection Algorithm. Applied Sciences. 2024; 14(16):7191. https://doi.org/10.3390/app14167191
Chicago/Turabian StyleSemenov, Iouri, Andrzej Świderski, Anna Borucka, and Patrycja Guzanek. 2024. "Concept of Early Prediction and Identification of Truck Vehicle Failures Supported by In-Vehicle Telematics Platform Based on Abnormality Detection Algorithm" Applied Sciences 14, no. 16: 7191. https://doi.org/10.3390/app14167191